MATERIAL TESTING LABORATORY III Semester (MEL37) · MATERIAL TESTING LABORATORY III Semester...
58
MATERIAL TESTING LABORATORY III Semester (MEL37) DAYANANDA SAGAR COLLEGE OF ENGINEERING Accredited by National Assessment & Accreditation Council (NAAC) with ’A’ Grade (An Autonomous Institution affiliated to Visvesvaraya Technological University, Belagavi & ISO 9001:2008 Certified) MECHANICAL ENGINEERING DEPARTMENT SHAVIGE MALLESWARA HILLS, KUMARASWAMY LAYOUT BENGALURU-560078 Name of the Student : Semester /Section : USN : Batch :
Transcript of MATERIAL TESTING LABORATORY III Semester (MEL37) · MATERIAL TESTING LABORATORY III Semester...

MATERIAL TESTING LABORATORY
III Semester (MEL37)
DAYANANDA SAGAR COLLEGE OF ENGINEERING
Accredited by National Assessment & Accreditation Council (NAAC) with ’A’ Grade (An Autonomous Institution affiliated to Visvesvaraya Technological University, Belagavi
& ISO 9001:2008 Certified)
MECHANICAL ENGINEERING DEPARTMENT SHAVIGE MALLESWARA HILLS, KUMARASWAMY LAYOUT
BENGALURU-560078
Name of the Student : Semester /Section : USN : Batch :

MATERIAL TESTING LABORATORY: 2016
Mechanical Dept., Dayananda Sagar College of Engineering Bengaluru Page 2
(Backside of cover page)
Vision of the Institute
To impart quality technical education with a focus on Research and Innovation emphasising on Development of Sustainable and Inclusive Technology for the benefit of society.
Mission of the Institute
To provide an environment that enhances creativity and Innovation in pursuit of Excellence.
To nurture teamwork in order to transform individuals as responsible leaders and entrepreneurs.
To train the students to the changing technical scenario and make them to understand the importance of Sustainable and Inclusive technologies.

MATERIAL TESTING LABORATORY: 2016
Mechanical Dept., Dayananda Sagar College of Engineering Bengaluru Page 3
MATERIAL TESTING LABORATORY
III Semester (MEL37)
DAYANANDA SAGAR COLLEGE OF ENGINEERING (An Autonomous Institution affiliated to Visvesvaraya Technological University, Belagavi)
MECHANICAL ENGINEERING DEPARTMENT SHAVIGE MALLESWARA HILLS
KUMARASWAMY LAYOUT BENGALURU-560078
Name of the Student : Semester /Section : USN : Batch :

MATERIAL TESTING LABORATORY: 2016
Mechanical Dept., Dayananda Sagar College of Engineering Bengaluru Page 4
DAYANANDA SAGAR COLLEGE OF ENGINEERING (An Autonomous Institution affiliated to Visvesvaraya Technological University, Belagavi)
DEPARTMENT OF MECHANICAL ENGINEERING, BENGALURU-560078
VISION OF THE DEPARTMENT
To prepare world class Mechanical Engineers having technical competency and managerial skills driven by human values and ignite the young minds capable of addressing ever-changing global issues by research and innovation.
MISSION OF THE DEPARTMENT
To provide a platform that imparts scientific knowledge and technical skills.
To train students to demonstrate their technical and managerial skills.
To engage students in professional activities through research, higher
education and lifelong learning.
PROGRAMME EDUCATIONAL OBJECTIVES [PEOs]
PEO1 - Graduates shall exhibit the knowledge and competency for careers in
and related to Mechanical Engineering.
PEO2 – Graduates shall exhibit the necessary skills to lead and manage
professional teams.
PEO3 - Graduates shall demonstrate their Engineering Profession by
addressing Scientific and Social challenges.
PEO4 - Graduates shall engage in Professional and Intellectual
Development through Higher Education, Research and Lifelong learning in
Engineering or related fields.
PROGRAMME SPECIFIC OUTCOMES [PSOs]
PSO1 - Will be able to apply the engineering knowledge to design, analyse
and interpret Mechanical Engineering Problems.
PSO2 - Will be able to identify and resolve the issues related to social,
economics, managerial and environmental areas.

MATERIAL TESTING LABORATORY: 2016
Mechanical Dept., Dayananda Sagar College of Engineering Bengaluru Page 5
DAYANANDA SAGAR COLLEGE OF ENGINEERING (An Autonomous Institution affiliated to Visvesvaraya Technological University, Belagavi)
DEPARTMENT OF MECHANICAL ENGINEERING, BENGALURU-560078
MATERIAL TESTING LABORATORY (SYLLABUS)
III SEMESTER B. E ( ME)
Sub. Code: MEL37 CIE Marks : 50
Hrs/Week : 03 Exam Hrs : 3
Total Hrs: 03 SEE Marks : 50
COURSE LEARNING OBJECTIVES
Students are expected to
1 To Determine the mechanical properties of different material specimen
2 To give the basic knowledge about the methods to enhance the properties of the material
from heat treatment process.
3 To gain the basic knowledge about wear characteristics of ferrous, nonferrous and
composite materials.
4 To gain the practical knowledge about Non-destructive testing
PART – A
1. Preparation of specimen for Metallographic examination of different engineering
materials. Identification of microstructures of plain carbon steel, tool steel, gray C.I, SG iron,
Brass, Bronze & composites.
2. Heat treatment: Annealing, normalizing, hardening and tempering of steel. Hardness
studies of heat-treated samples.
3. To study the wear characteristics of ferrous, non-ferrous and composite materials for
different parameters.
4. Non-destructive test experiments like,
(a). Ultrasonic flaw detection
(b). Magnetic crack detection
(c). Dye penetration testing. To study the defects of Cast and Welded Specimens

MATERIAL TESTING LABORATORY: 2016
Mechanical Dept., Dayananda Sagar College of Engineering Bengaluru Page 6
PART – B
1. Tensile, shear and compression tests of metallic and non-metallic specimens using
Universal Testing Machine
2. Torsion Test
3. Bending Test on metallic and non-metallic specimens.
4. Izod and Charpy Tests on M.S, C.I Specimen.
5. Brinell, Rockwell and Vickers’s Hardness test.
6. Fatigue Test.
COURSE OUTCOME: 1 Demonstrate the knowledge and skills to conduct and analyzing the results w.r.t.
Hardness testing, Tensile testing, Shear, Compression, Bending test, Fracture testing,
Fatigue testing and Impact testing.
2 Acquire the basic knowledge about the methods to enhance the properties of the material
from heat treatment process.
3 Analyze the wear characteristics of ferrous, non-ferrous and composite materials for
different parameters.
4 Apply the knowledge of Non-destructive testing in industrial sectors

MATERIAL TESTING LABORATORY: 2016
Mechanical Dept., Dayananda Sagar College of Engineering Bengaluru Page 7
DAYANANDA SAGAR COLLEGE OF ENGINEERING (An Autonomous Institution affiliated to Visvesvaraya Technological University, Belagavi)
DEPARTMENT OF MECHANICAL ENGINEERING
MATERIAL TESTING LABORATORY (MEL37) I - CYCLE
1. Izod Test 2. Brinell Hardness Test 3. Shear Test 4. Bending Test
II – CYCLE
5. Charpy Test 6. Rockwell Hardness Test 7. Torsion Test 8. Compression Test
III – CYCLE
9. Heat Treatment 10. Tensile Test
IV – CYCLE
11. Wear Test 12. Micro Structure
MATERIAL TESTING LABORATORY: 2016
Mechanical Dept., Dayananda Sagar College of Engineering Bengaluru Page 8
DAYANANDA SAGAR COLLEGE OF ENGINEERING DEPARTMENT OF MECHANICAL ENGINEERING
BENGALURU – 560078
Experiment No:________ Date:____________
Title of the Experiment
Experiment No: __________ Date: ____________
DO’s
1. Students must always wear uniform and shoes before entering the lab.
2. Proper code of conduct and ethics must be followed in the lab.
3. Windows and doors to be kept open for proper ventilation and air circulation.
4. Note down the specifications of the experimental setup before performing
the experiment.
5. Check for the electrical connections and inform if any discrepancy found to
the attention of lecturer/lab instructor.
6. Perform the experiment under the supervision/guidance of a lecturer/lab
instructor only.
7. After the observations are noted down switch off the electrical connections.
8. In case of fire use fire extinguisher/throw the sand provided in the lab.
9. In case of any physical injuries or emergencies use first aid box provided.
10. Any unsafe conditions prevailing in the lab can be brought to the notice of
the lab in charge
DONT’s
1. Do not operate any experimental setup to its maximum value.
2. Do not touch/ handle the experimental setups/Test Rigs without their prior
knowledge,
3. Never overcrowd the experimental setup/Test Rig, Leave sufficient space for the
person to operate the equipment’s.
4. Never rest your hands on the equipment or on the display board, because it has
fragile measurement devices like thermometers, manometers, etc.
MATERIAL TESTING LABORATORY: 2016
Mechanical Dept., Dayananda Sagar College of Engineering Bengaluru Page 9
CONTENTS
Sl. No. Experiment Page No.
1. ROCKWELL HARDNESS TEST 10
2. VICKERS HARDNESS TEST 13
3. IMPACT TEST 16
4. TENSILE TEST 21
5. COMPRESSION TEST 26
6. SHEAR STRENGTH TEST 29
7. HEAT TREATMENT 32
8. WEAR TEST 35
9. MICROSTRUCTURE 39
10. BRINELL HARDNESS TEST 43
11. TORSION TEST 46
12. FATIGUE TEST 49
13. BENDING TEST 53
14. ULTRASONIC TEST 56
15. MAGNETIC PARTICLE TEST 58

MATERIAL TESTING LABORATORY: 2016
Mechanical Dept., Dayananda Sagar College of Engineering Bengaluru Page 10
Experiment No. 1
ROCKWELL HARDNESS TEST
Aim: To determine the Rockwell hardness for hard materials such as hardened steel
& moderately hard materials such as brass.
Theory:
Hardness is a material characteristic which can be defined as resistance to deformation
(penetration, wear, compression etc.)
In Rockwell hardness test, a standard load (based on type of material) is applied through a
standard indentor (cone or ball) for a specified duration, on the material & depth of impression /
indentation is directly measured and read as hardness number on a dial gauge.
Rockwell Hardness Tester.
Equipments:
1. Rockwell hardness tester.
2. Cone diamond indentor (1200 included angle) ‘C’ scale.
3. Ball indentor (1/16” dia. Hardened steel ball ) for ‘B’ scale.
4. Hardness testing specimen.
5. Standard hardness test block. ( for B& C scales).

MATERIAL TESTING LABORATORY: 2016
Mechanical Dept., Dayananda Sagar College of Engineering Bengaluru Page 11
Procedure:
1. Place the semi polished specimen on the platform.
2. Insert the diamond cone indentor for C scales and 1/16” steel ball for B scale inside the
sleeve and tighten the screw. Check that there is no movement of indentor.
3. Set the required load (150Kg for C scale and 100Kg for B scale) by turning the knob
provided by the side of the machine.
4. Bring the specimen into contact with the indentor by rotating the elevating screw by
rotating the star handle. By further elevating the specimen, the minor load of 10Kg is
applied such that pointer indicates ‘x’ on the smaller graduated arc scale and the longer
pointer indicates on the outer C scale and 30 on the inner B scale.
5. Now turn the lever away from the observer slowly. The longer pointer moves away and
when it comes to rest, wait 8 to 10 sec for the entire application of major load.
6. Now turn the lever slowly to the observer i.e. to the original position. Now the entire load
is being lifted off from the specimen.
7. Now the longer pointer moves back and when it comes to a rest position, note the reading
on the outer black dial(C scale) and on the inner red dial(B scale)
8. The reading on the dial indicates directly hardness number (RHN) which is
dimensionless.
9. A minimum of 3 trial readings are taken at separate location on the surface of the specimen.
The average value of these 3 readings gives the true Rockwell hardenings number which
is reported as HRC and HRB for Rockwell in C scale and Rockwell in B scale respectively
10. The results are tabulated as follows
Table of Results:
Sl. No. Material Type of
Indentor
Std. Load in Kg Hardness HRC / HRB Average
Major Minor T1 T2 T3
1
2
3

MATERIAL TESTING LABORATORY: 2016
Mechanical Dept., Dayananda Sagar College of Engineering Bengaluru Page 12
Precautions:
1. The condition of the test surface, because of very small impression normally produced,
must necessarily be smoother & free from surface imperfections such as scale, rust etc., It
should be preferably polished with emery cloth before placing on the machine.
2. Since the penetration of indentor is a very small (< 0.05 mm) the thickness of specimen
should be at least 10 X thickness of penetration.
3. Standardization of Rockwell machines is secured by use of standard test blocks. Test
blocks calibrated initially are frequently used to check any deviation from normal readings.
Practical importance:
Because of its simplicity, accuracy & extremes versatility, the Rockwell hardness test is
more widely used than any other hardness test. It permits measurement of wide range of hardness
(soft, medium & hard).
Standards:
1. Rockwell hardness test (scales A, B & C) methods : IS:1586-1988
Viva Questions:
1. What is Hardness?
2. What is the significance of minor load in Rockwell method of hardness testing
3. What are the advantages and limitations of Rockwell method of hardness
testing
4. Where are Rockwell hardness test and Brinell hard test employed
5. Which method hardness is employed to check hardness of thin strips
MATERIAL TESTING LABORATORY: 2016
Mechanical Dept., Dayananda Sagar College of Engineering Bengaluru Page 13
Experiment No. 2
VICKERS HARDNESS TEST
Aim: To determine the Vickers hardness of hard materials such as hardened steel
and moderately hard materials such as brass, copper and aluminium.
Theory:
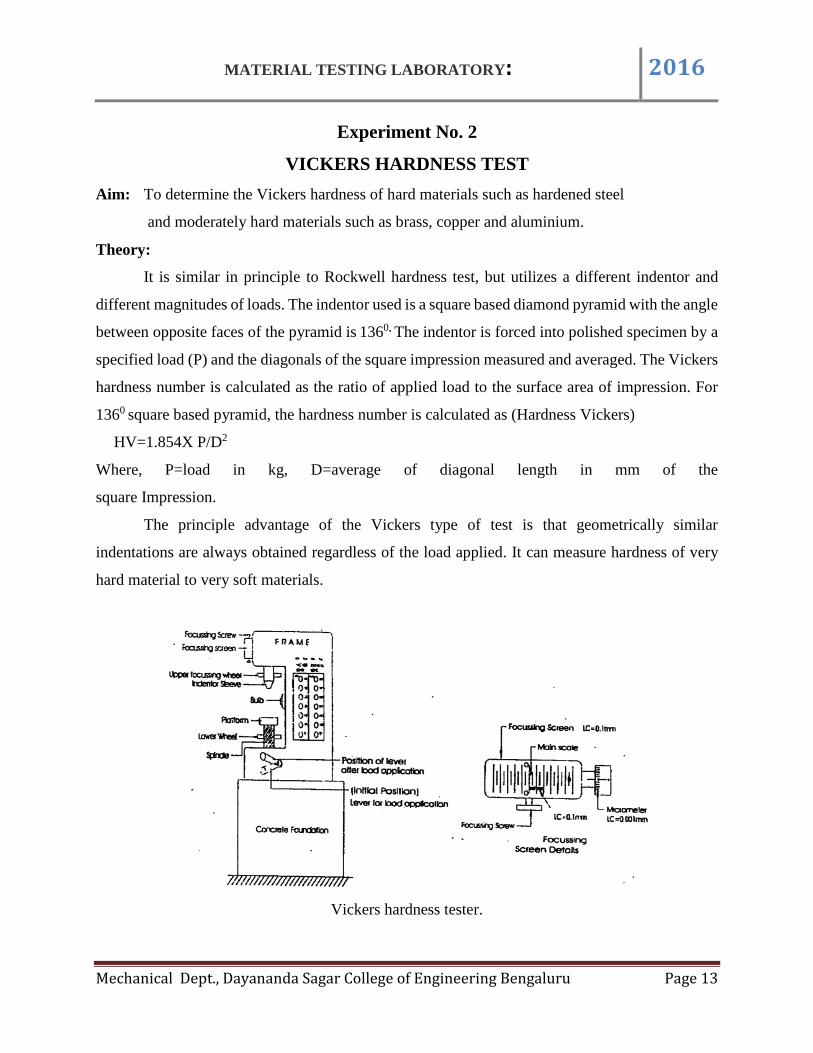
It is similar in principle to Rockwell hardness test, but utilizes a different indentor and
different magnitudes of loads. The indentor used is a square based diamond pyramid with the angle
between opposite faces of the pyramid is 1360. The indentor is forced into polished specimen by a
specified load (P) and the diagonals of the square impression measured and averaged. The Vickers
hardness number is calculated as the ratio of applied load to the surface area of impression. For
1360 square based pyramid, the hardness number is calculated as (Hardness Vickers)
HV=1.854X P/D2
Where, P=load in kg, D=average of diagonal length in mm of the
square Impression.
The principle advantage of the Vickers type of test is that geometrically similar
indentations are always obtained regardless of the load applied. It can measure hardness of very
hard material to very soft materials.
Vickers hardness tester.
MATERIAL TESTING LABORATORY: 2016
Mechanical Dept., Dayananda Sagar College of Engineering Bengaluru Page 14
Equipment:
1. Vickers hardness tester.
2. Square based diamond pyramid indentor.
3. Hardness testing specimen.
4. Standard Vickers hardness test blocks.
Procedure:
1. Place the polished specimen on the platform of the machine. Switch on the bulb.
2. Fix the pyramid indentor inside the sleeve.
3. Turn the inner wheel till the indentor sleeve makes contact with the specimen.
Turn the upper wheel slowly till the surface of the specimen is reflected
clearly on the focusing screen.
4. Now, apply the load (30kg for steel &5kg for aluminum) on the specimen by pressing the
respective push button corresponding to Vickers load.
5. Now, push the button provided at the base of the machine, so that the indentor is brought
into contact with the specimen & the required load is being applied on the specimen. When
the load is being applied, the hand lever automatically raises to an upward position. When
it comes to this position, completely, wait for 8-10 seconds (std. time) for complete
application of load.
6. Then depress the lever by pressing the lever down-words, so that the load is lifted off the
specimen & the indentor comes to the original position.
7. The square based pyramidal impression is measured as follows. First bring through ‘O’ of
the main scale to ‘0’ of vernier by operating the micrometer screw. Bring one edge of
square base impression into coincidence to main scale division by operating the focusing
screen screw. Count the No. of MSD from the coincided edge to the division near the un-
coincided edge. This gives main scale reading MSR. Now, turn the micrometer till the right
edge coincides with next forward main scale division. Now count the vernier scale division
from 0 of main scale to 0 of vernier scale. Record the number of division on micrometer
scale which is ahead &above 0 index mark. Hence diagonal width d1=MSR + VSR +
Micrometer reading. Similarly diagonal d2 is also measured & average of (d1+d2 ) is taken
in mm.
MATERIAL TESTING LABORATORY: 2016
Mechanical Dept., Dayananda Sagar College of Engineering Bengaluru Page 15
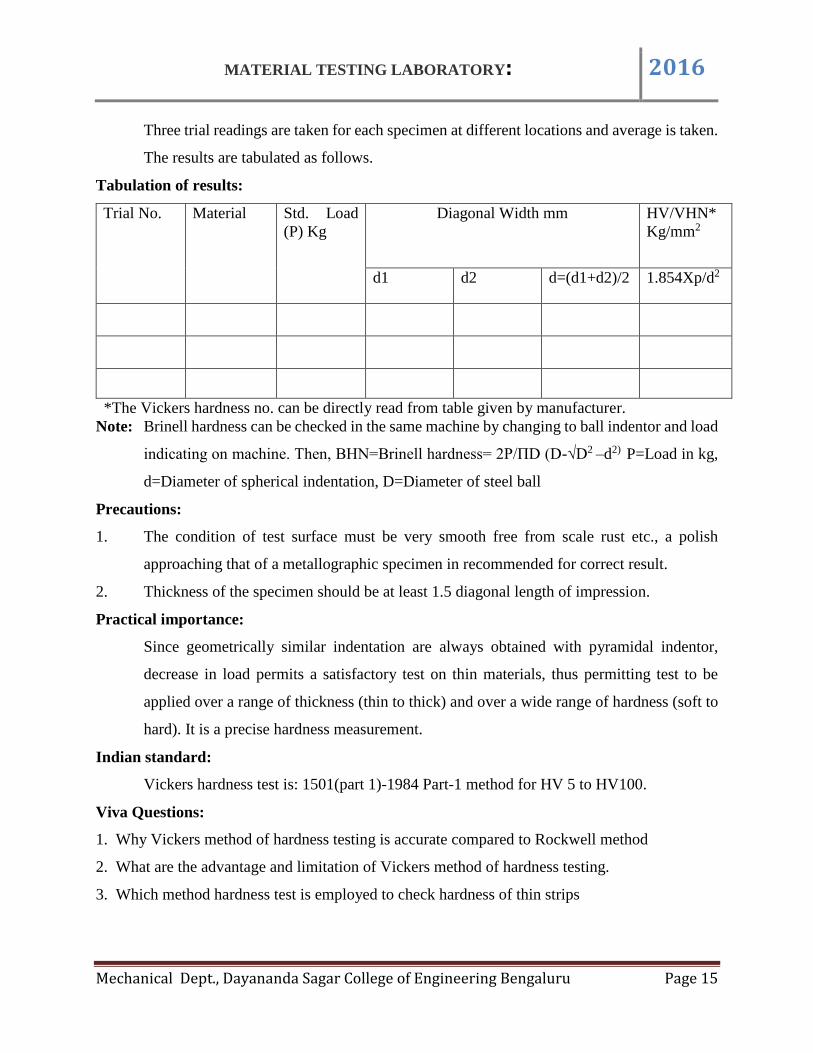
Three trial readings are taken for each specimen at different locations and average is taken.
The results are tabulated as follows.
Tabulation of results:
Trial No. Material Std. Load
(P) Kg
Diagonal Width mm HV/VHN*
Kg/mm2
d1 d2 d=(d1+d2)/2 1.854Xp/d2
*The Vickers hardness no. can be directly read from table given by manufacturer.
Note: Brinell hardness can be checked in the same machine by changing to ball indentor and load
indicating on machine. Then, BHN=Brinell hardness= 2P/ПD (D-√D2 –d2) P=Load in kg,
d=Diameter of spherical indentation, D=Diameter of steel ball
Precautions:
1. The condition of test surface must be very smooth free from scale rust etc., a polish
approaching that of a metallographic specimen in recommended for correct result.
2. Thickness of the specimen should be at least 1.5 diagonal length of impression.
Practical importance:
Since geometrically similar indentation are always obtained with pyramidal indentor,
decrease in load permits a satisfactory test on thin materials, thus permitting test to be
applied over a range of thickness (thin to thick) and over a wide range of hardness (soft to
hard). It is a precise hardness measurement.
Indian standard:
Vickers hardness test is: 1501(part 1)-1984 Part-1 method for HV 5 to HV100.
Viva Questions:
1. Why Vickers method of hardness testing is accurate compared to Rockwell method
2. What are the advantage and limitation of Vickers method of hardness testing.
3. Which method hardness test is employed to check hardness of thin strips
MATERIAL TESTING LABORATORY: 2016
Mechanical Dept., Dayananda Sagar College of Engineering Bengaluru Page 16
Experiment No. 3
IMPACT TEST
Aim: To determine the impact energy and specific impact factor for ductile materials such as
mild steel by conducting (i) Charpy Impact test and(ii) Izod impact test.
Theory:
Impact test is done to determine the behavior of ductile material such as mild
steel, aluminium, copper etc., when subjected to high rates of sudden loading, it measures the
energy absorbed in breaking the specimen by a single blow or impact. Notched bar impact test
uses a test specimen having a notch is supported as a beam and subjected to impact from a moving
mass having sufficient kinetic energy to break the specimen. The energy absorbed by the specimen
is measured by the loss in kinetic energy of moving mass.
Charpy Impact Test:
Specimen with U notch supported at both ends as a single beam is broken by a falling
pendulum striking the face opposite to and immediately behind the notch. The energy absorbed by
specimen is determined by subsequent rise of pendulum as a measure of impact strength or notch
toughness and expressed as Joules J(N/mm2 ).
Izod Impact Test:
Specimen with V notch is fixed at one end which acts like a cantilever and broken by a
falling pendulum strikeing the face having the V notch . The energy absorbed is determined by the
rise of pendulum as a measure of impact
strength and expressed as Joules.
MATERIAL TESTING LABORATORY: 2016
Mechanical Dept., Dayananda Sagar College of Engineering Bengaluru Page 17
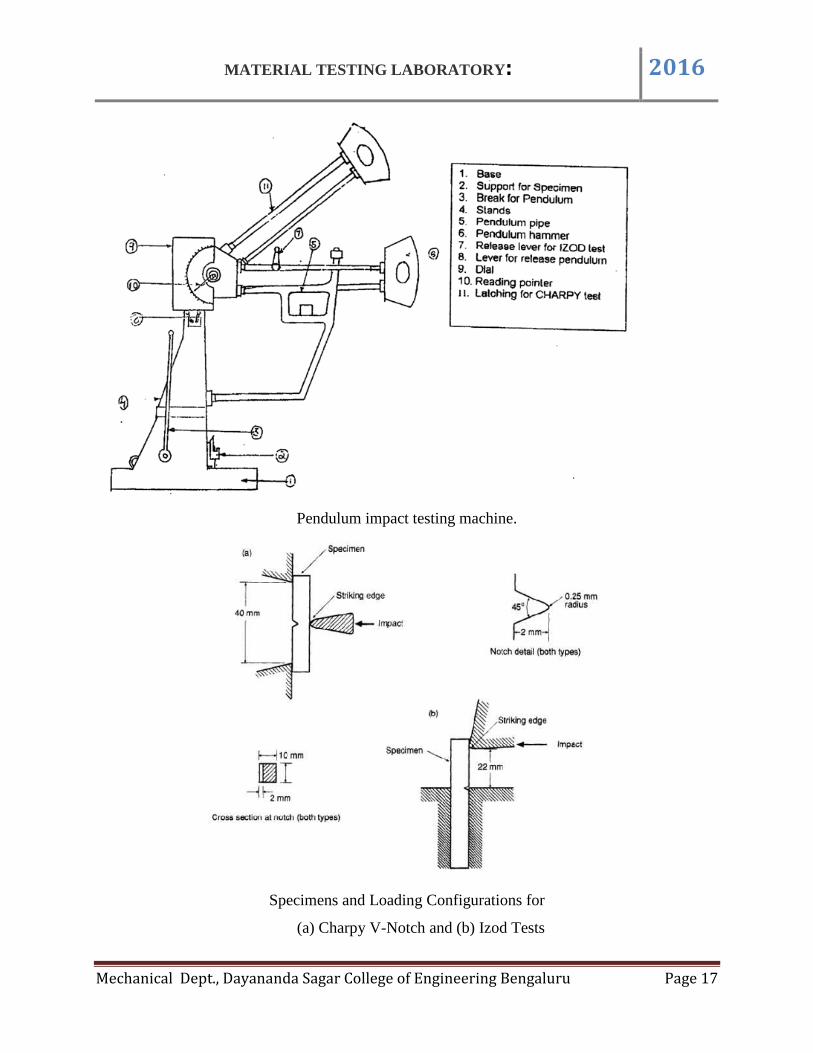
Pendulum impact testing machine.
Specimens and Loading Configurations for
(a) Charpy V-Notch and (b) Izod Tests
MATERIAL TESTING LABORATORY: 2016
Mechanical Dept., Dayananda Sagar College of Engineering Bengaluru Page 18
Equipment:
1. Charpy /Izod impact testing machine.
2. Charpy impact testing specimen with U Groove.
3. Izod impact test specimen with V groove.
4. Vernier scale.
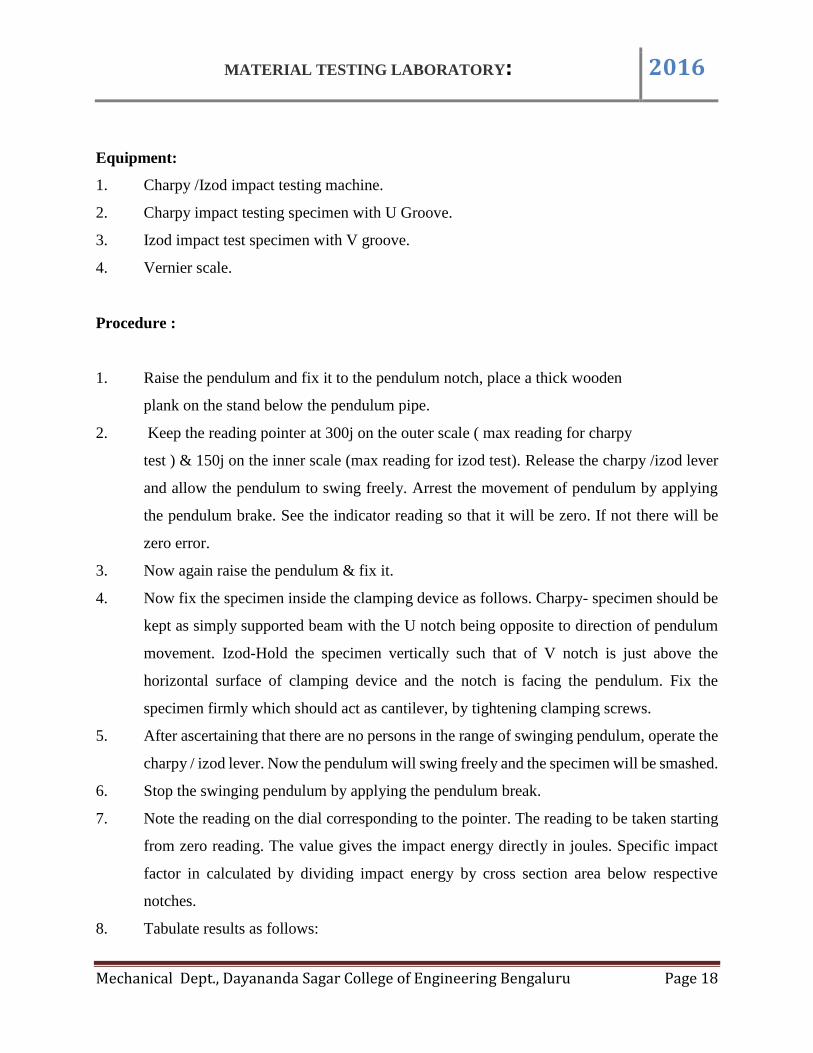
Procedure :
1. Raise the pendulum and fix it to the pendulum notch, place a thick wooden
plank on the stand below the pendulum pipe.
2. Keep the reading pointer at 300j on the outer scale ( max reading for charpy
test ) & 150j on the inner scale (max reading for izod test). Release the charpy /izod lever
and allow the pendulum to swing freely. Arrest the movement of pendulum by applying
the pendulum brake. See the indicator reading so that it will be zero. If not there will be
zero error.
3. Now again raise the pendulum & fix it.
4. Now fix the specimen inside the clamping device as follows. Charpy- specimen should be
kept as simply supported beam with the U notch being opposite to direction of pendulum
movement. Izod-Hold the specimen vertically such that of V notch is just above the
horizontal surface of clamping device and the notch is facing the pendulum. Fix the
specimen firmly which should act as cantilever, by tightening clamping screws.
5. After ascertaining that there are no persons in the range of swinging pendulum, operate the
charpy / izod lever. Now the pendulum will swing freely and the specimen will be smashed.
6. Stop the swinging pendulum by applying the pendulum break.
7. Note the reading on the dial corresponding to the pointer. The reading to be taken starting
from zero reading. The value gives the impact energy directly in joules. Specific impact
factor in calculated by dividing impact energy by cross section area below respective
notches.
8. Tabulate results as follows:

MATERIAL TESTING LABORATORY: 2016
Mechanical Dept., Dayananda Sagar College of Engineering Bengaluru Page 19
Table: Measurement of impact energy & specific impact factor.
Charpy impact Test
Sl.
No.
Material Breadth
(b)mm
Depth
Below the
notch
(d)mm
Cross
Section
Area below
the notch
b*d mm2
(A)
Impact
Energy (I)
Joules
Specific
Impact
Factor =
I/A J/mm2
1 2 3
Izod Impact Test
Sl.
No.
Material Breadth
(b)mm
Depth
Below the
notch
(d)mm
Cross
Section
Area below
the notch
b*d mm2
Impact
Energy (I)
Joules
Specific
Impact
Factor =
I/A J/mm2
1 2 3
Precautions:
The notch shall be carefully prepared so that no grooves appear at the base of the notch.
Practical importance:
Notched bar impact tests are used to determine tendency of a material to behave in a brittle
manner. The results obtained help in selecting materials which are resistant to brittle fracture by
means of transition temperature curves (variation of impact strength v/s temperature).
Indian Standards:
1. Impact test- Izod method IS:1598-1977
2. Impact test- charpy (U-notch ) IS:1499-1977)

MATERIAL TESTING LABORATORY: 2016
Mechanical Dept., Dayananda Sagar College of Engineering Bengaluru Page 20
Viva questions:
1. What is ductile to brittle transition and how it is checked
2. For impact test, why are notched specimen used
3. Discuss the significance of impact tests compared to static tests
4. What is meant by notch sensitivity
5. What are the differences between charpy and izod test
6. In what units are results of impact test usually given
7. What physical property of material is determined by means of impact test
8. Explain impact fracture in case of ductile material
MATERIAL TESTING LABORATORY: 2016
Mechanical Dept., Dayananda Sagar College of Engineering Bengaluru Page 21
Experiment No.4
TENSILE TEST
Aim: To conduct tensile test in ductile material and to determine the following;
i) Ultimate tensile stress (UTS)
ii) Yield stress (YS)
iii) Breaking stress
iv) % Elongation
v) Youngs modulus (E)
vi) % Reduction in area.
Theory:
The tensile test is widely used to provide basic design information on the strength of
materials and as acceptance test for specification of materials. In the tensile test, a tensile specimen
as per agreed standard is subjected to continually increasing uni-axial tensile force while
simultaneous observations are made of the constructed from the load, elongation measurement.
The following parameters are found from stress-strain curves.
i)Elastic limit: The limiting load beyond which the material no longer behaves elastically
(recovery of original dimensions when load is removed).
ii) Ultimate tensile stress: maximum load divided by the original cross sectional area of specimen.
iii) Yield stress: Stress required producing a small specified permanent deformation (0.2 %
permanent strain).
iv) % Elongation: It is measured of ductility of material. It is obtained by measuring the difference
in length before fracture & after fracture & dividing by the original length.
v) Modulus of elasticity: It is a measure of stiffness of material. The greater the modulus the
smaller the elastic strain from the given application of stress. The slope of the initial position of
stress-strain curve is the modulus of elasticity or youngs modulus.

MATERIAL TESTING LABORATORY: 2016
Mechanical Dept., Dayananda Sagar College of Engineering Bengaluru Page 22
Equipment required:
i) Universal testing machine.
ii) Tensile test specimens.
iii) Extensometer dial gauge.
iv) Steel scale, slide calipers & micrometer.
v) Support blocks.
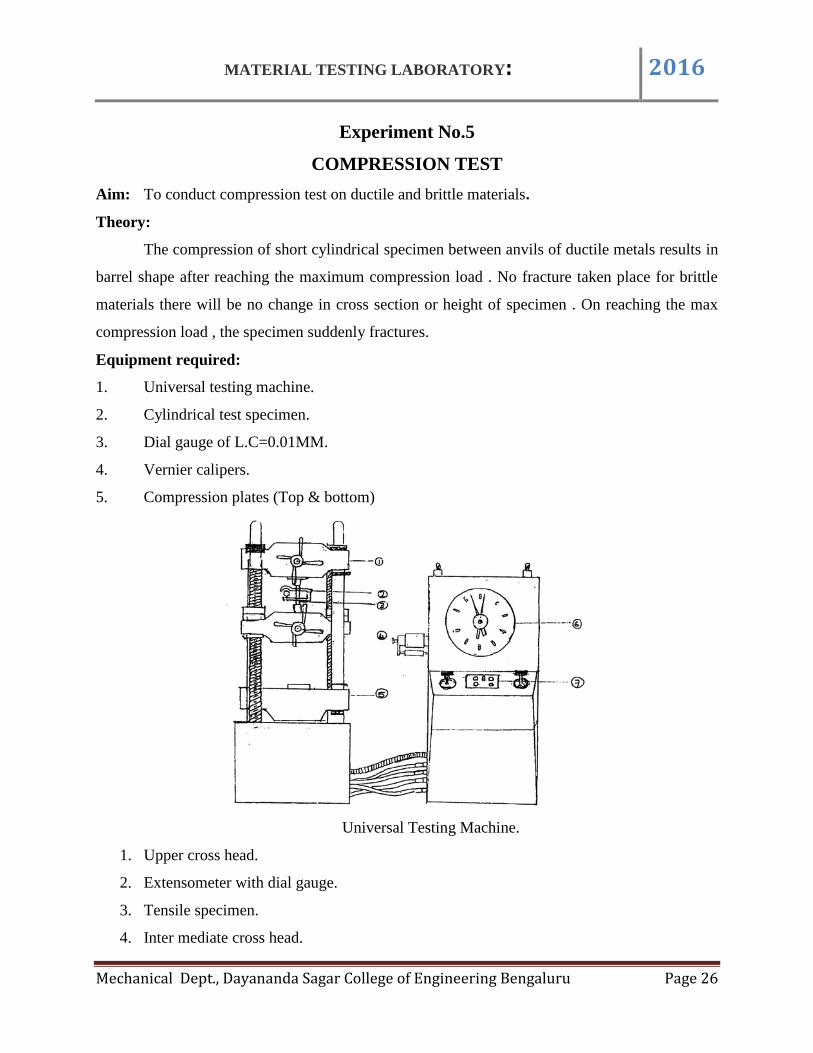
Universal Testing Machine.
1. Upper cross head.
2. Extensometer with dial gauge.
3. Tensile specimen.
4. Inter mediate cross head.
5. Bottom cross head.
6. Load dial gauge.
7. Speed control valves.
MATERIAL TESTING LABORATORY: 2016
Mechanical Dept., Dayananda Sagar College of Engineering Bengaluru Page 23
Procedure:
1. Measure the initial diameter(d1)and mark the initial gauge length(I1)on the
specimen.
2. Fix the upper end of the specimen inside the shackles of the upper cross head and bring the
shackle of the intermediate cross head into contact with bottom of the specimen and the
bottom end is fixed inside the shackle.
3. Mount the extensometer dial gauge (L.C=0.01mm) on the lower cross head bring the
indicator of external dial gauge , elongation scale and load dial gauge to zero reading .
4. Start the machine and for every 400 kg increase, note the elongation (count the number of
division on dial gauge X L.C).
5. When the load crosses the elastic point or yield point (this could be observed by the rapid
movement of indicator of the extensometer dial gauge )note the reading on the elongation
scale . Continue loading decreases the area of specimen and fails at particular load . Note
the breaking load and elongation .
6. Remove the fractured specimen and measure the final gauge lengths(I2)and final
diameter(d2)and observe the fracture.
7. Plot a graph of load V/s elongation . The results are tabulated as given below.
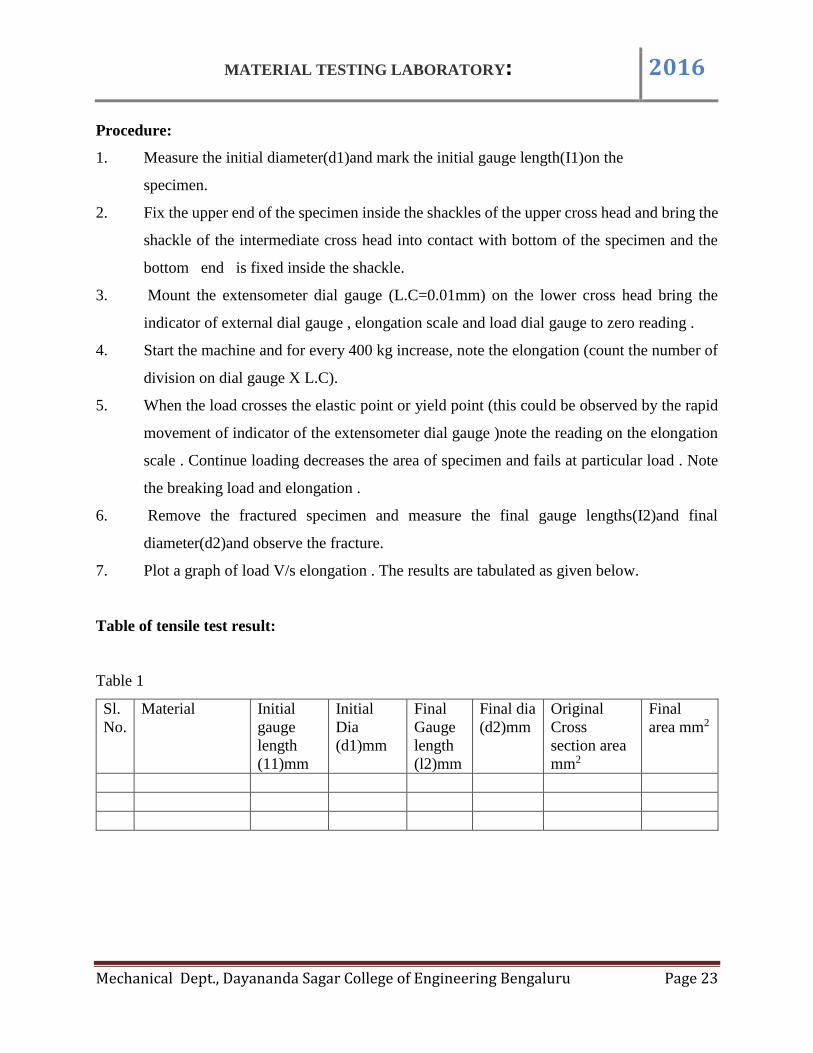
Table of tensile test result:
Table 1
Sl.
No.
Material Initial
gauge
length
(11)mm
Initial
Dia
(d1)mm
Final
Gauge
length
(l2)mm
Final dia
(d2)mm
Original
Cross
section area
mm2
Final
area mm2

MATERIAL TESTING LABORATORY: 2016
Mechanical Dept., Dayananda Sagar College of Engineering Bengaluru Page 24
Table 2
Sl.
No.
Load in N Elongation
No. of
divisions’n’
of dial
gauge
Actual
reading
n* l.c
mm(σl)
Stress =
Load /
Original
area of cross
section
N/mm2
Strain
σl / l1
(t)
Youngs
modulus
E=Stress /
Strain N/MM2
Precautions:
1. The rate of loading should be uniform to get correct valve of various parameters.
2. The machine (UTM)Should be calibrated if deviations are found out.
Calculation:
Initial diameter of specimen = d1 mm
Final diameter of specimen = d2 mm
Initial gauge length = L1 mm
Final gauge length = L2 mm
Initial area of specimen(A1) = Пd12 /4 mm2
Final area of specimen (A2) = Пd22/4 mm2
(L2-L1)
%Elongation = -------- x 100
L1
A1-A2
%Reduction in area = --------- x 100
A1
Yield stress = Yield load /original area of cross section, N/mm2
Ultimate tensile stress = maximum load /original area of cross section
(UTS) N/mm2
Breaking stress = Breaking load /Original area of cross
or failure stress section, N/mm2
MATERIAL TESTING LABORATORY: 2016
Mechanical Dept., Dayananda Sagar College of Engineering Bengaluru Page 25
Practical Importance:
The basic data on mechanical properties of a ductile metal are from a tension test, in which
a suitably designed specimen is subjected to increasing axial load until it fractures. The general
behavior of materials under load can be classified as ductile or brittle depending on whether or not
the material exhibits the ability to undergo plastic deformation. Yielding occurs when elastic limit
has been exceeded and produces permanent change of shape which may prevent the part for
functioning properly and longer. In ductile metal under static loading condition, yielding rarely
results in fracture because the metal strain hardens as it deforms.
Indian Standards:
1. Mechanical testing of metal-IS: 1608-1975 tensile testing
Viva Questions:
1. What is the significance of tensile testing?
2. Which property in a tension test is an indication of stiffness of material?
3. Define the term: Elastic limit, Yield point, Resistance and Toughness
4. What is breaking stress? How it is different from maximum stress
5. What is the difference between proportionality limit and elastic limit?
6. What is the correlation between tensile strength and hardness?
7. What factors should be considered in selecting gauge length
8. State Hooke’s law is this applicable to all material
MATERIAL TESTING LABORATORY: 2016
Mechanical Dept., Dayananda Sagar College of Engineering Bengaluru Page 26
Experiment No.5
COMPRESSION TEST
Aim: To conduct compression test on ductile and brittle materials.
Theory:
The compression of short cylindrical specimen between anvils of ductile metals results in
barrel shape after reaching the maximum compression load . No fracture taken place for brittle
materials there will be no change in cross section or height of specimen . On reaching the max
compression load , the specimen suddenly fractures.
Equipment required:
1. Universal testing machine.
2. Cylindrical test specimen.
3. Dial gauge of L.C=0.01MM.
4. Vernier calipers.
5. Compression plates (Top & bottom)
Universal Testing Machine.
1. Upper cross head.
2. Extensometer with dial gauge.
3. Tensile specimen.
4. Inter mediate cross head.
MATERIAL TESTING LABORATORY: 2016
Mechanical Dept., Dayananda Sagar College of Engineering Bengaluru Page 27
5. Bottom cross head.
6. Load dial gauge.
7. Speed control valves.
Procedure:
1. Fix the lower and upper compression plate above the bottom cross head and below the
intermediate cross head.
2. Measure the initial diameter (d1) and height of specimen (h1)
3. Place the compression specimen at the center of bottom plate and bring the top of specimen
in contact with the top plate by moving the intermediate cross head downwards
4. Mount the compression dial gauge on the lower cross head bring the indicator to zero.
Bring the indicator of load dial gauge also to zero
5. Load the specimen in intervals of 400 kg for MS and 200 kg for brittle material like cast
iron and record the compression dial gauge reading(No. of division on dial gauge XLC).
6. The experiment is continued till the specimen attains a barrel shape on reaching max load
for ductile metals or fracture for brittle materials. Measure the final Dia d2 and final height
h2 for ductile metals. The readings are tabulated as follows.
Plot a graph of stress v/s strain. Calculate Young’s Modulus in compression (for ductile materials
and failure compressive stress for brittle materials).
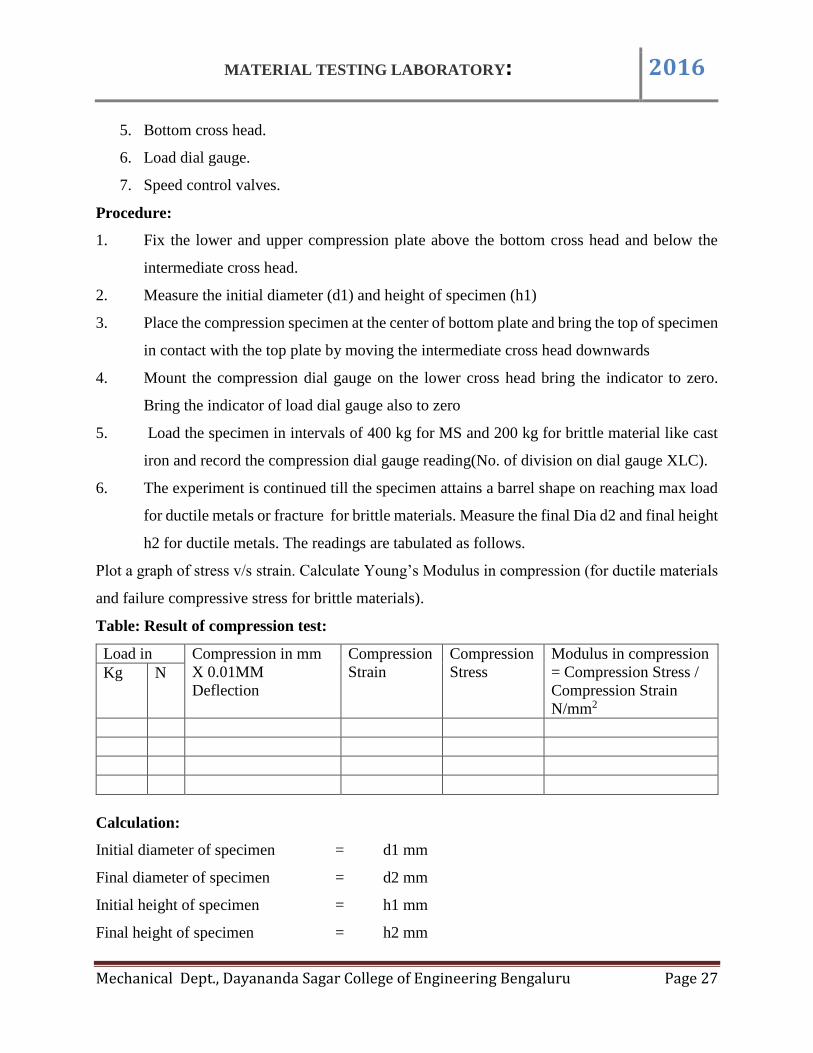
Table: Result of compression test:
Load in Compression in mm
X 0.01MM
Deflection
Compression
Strain
Compression
Stress
Modulus in compression
= Compression Stress /
Compression Strain
N/mm2
Kg N
Calculation:
Initial diameter of specimen = d1 mm
Final diameter of specimen = d2 mm
Initial height of specimen = h1 mm
Final height of specimen = h2 mm

MATERIAL TESTING LABORATORY: 2016
Mechanical Dept., Dayananda Sagar College of Engineering Bengaluru Page 28
пd12 mm2
Initial area of specimen (A1) = --------
4
пd22 mm2
Final area of specimen (A2) = -------
4
A2- A1
% increase in area = ---------- x 100
A1
h1- h2
% decrease in height = --------
h1
Compression stress = load up-to elastic point / A1
Compression strain = σh/h1
σ h = h1-h2
Young’s modulus in compression = compressive stress / compressive strain
N/mm2 (slope of load v/s compression graph).
Max compressive stress = Max compression load /
(for ductile materials) Original area of cross section = N/mm2
Max compressive stress = Failure load / A1=N/mm2
at failure (for brittle material)
Viva questions:
1. Draw the compression Vs strain of brittle material & ductile material and indicate the
differences.
2. List some uses of the compression test
3. What are some of the materials used for compression load on machinery and justify the use of
same
4. Explain compression fracture of mild steel and cast iron
5. Why is that compression test is difficult to perform compare to tension test
6. Resistance to compression load is important in which application

MATERIAL TESTING LABORATORY: 2016
Mechanical Dept., Dayananda Sagar College of Engineering Bengaluru Page 29
Experiment No. 6
SHEAR STRENGTH TEST
Aim: To determine ultimate shear strength in single & double shear for ductile material.
Theory:
Shear stress is caused by a force which acts parallel to an area of cross section and tends to
produce sliding of one portion part another portion. If the force in resisted by failure through a
single area then the material is said to be in single shear. If two areas resists the fracture, then the
material is said to be in double shear.
In single shear the shear strength = failure load / area of cross section of
specimen
failure load
In double shear, shear strength = ----------------------
2 X area of cross section
Where d= dia of specimen, P= failure load
Equipment required:
1. UTM
2. Shear shackles for single and double shear
3. Vernier / Micrometer
4. Shear specimen of MS, Brass & Aluminium.
MATERIAL TESTING LABORATORY: 2016
Mechanical Dept., Dayananda Sagar College of Engineering Bengaluru Page 30
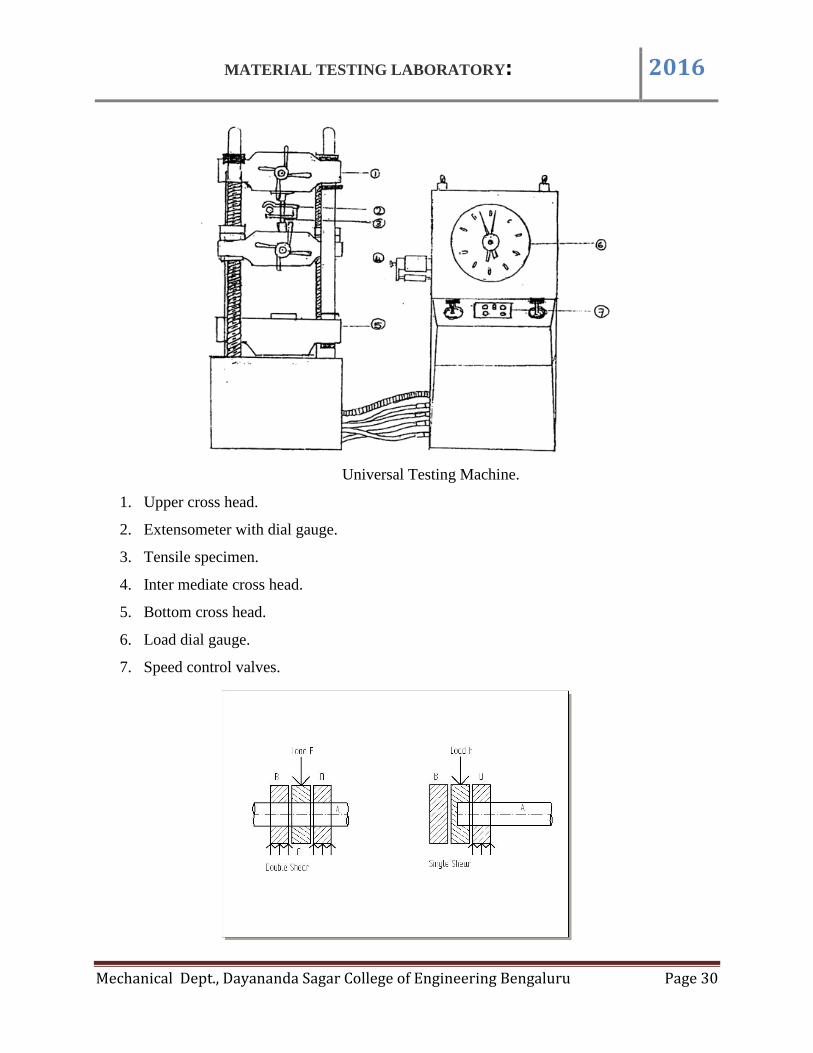
Universal Testing Machine.
1. Upper cross head.
2. Extensometer with dial gauge.
3. Tensile specimen.
4. Inter mediate cross head.
5. Bottom cross head.
6. Load dial gauge.
7. Speed control valves.
MATERIAL TESTING LABORATORY: 2016
Mechanical Dept., Dayananda Sagar College of Engineering Bengaluru Page 31
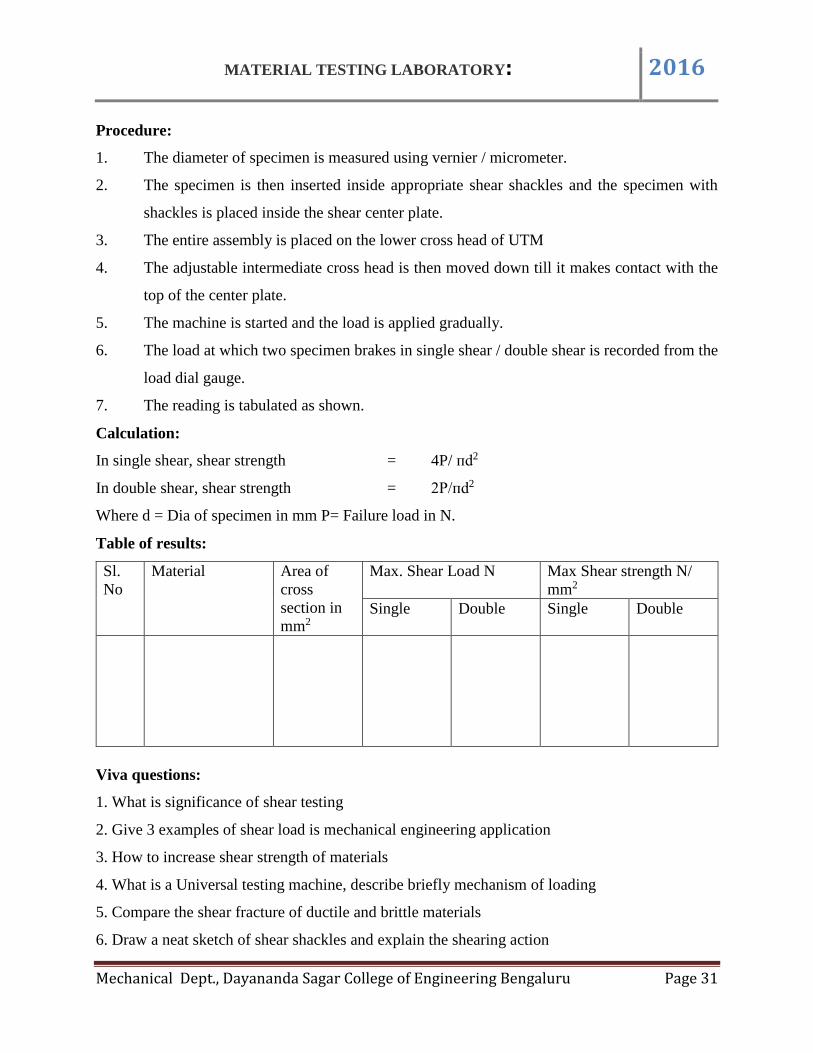
Procedure:
1. The diameter of specimen is measured using vernier / micrometer.
2. The specimen is then inserted inside appropriate shear shackles and the specimen with
shackles is placed inside the shear center plate.
3. The entire assembly is placed on the lower cross head of UTM
4. The adjustable intermediate cross head is then moved down till it makes contact with the
top of the center plate.
5. The machine is started and the load is applied gradually.
6. The load at which two specimen brakes in single shear / double shear is recorded from the
load dial gauge.
7. The reading is tabulated as shown.
Calculation:
In single shear, shear strength = 4P/ пd2
In double shear, shear strength = 2P/пd2
Where d = Dia of specimen in mm P= Failure load in N.
Table of results:
Sl.
No
Material Area of
cross
section in
mm2
Max. Shear Load N Max Shear strength N/
mm2
Single Double Single Double
Viva questions:
1. What is significance of shear testing
2. Give 3 examples of shear load is mechanical engineering application
3. How to increase shear strength of materials
4. What is a Universal testing machine, describe briefly mechanism of loading
5. Compare the shear fracture of ductile and brittle materials
6. Draw a neat sketch of shear shackles and explain the shearing action
MATERIAL TESTING LABORATORY: 2016
Mechanical Dept., Dayananda Sagar College of Engineering Bengaluru Page 32
Experiment No. 7
HEAT TREATMENT
Aim: To find the effect of heat treatment (annealing, normalizing & hardening & tempering of
medium carbon & alloy steel) by measurement of hardness.
Theory:
Heat treatment of steel is a process of heating and cooling in the solid state to achieve
desired mechanical properties. This involves heating the steel to a specific temperature, soaking it
for a certain period & then cooling it at a suitable rate. The different types of heat treatment process
in this experiment covered are process annealing to soften the steel by heating below critical temp.
(650-7000C) & air cooling; hardening for increasing hardness & mechanical properties by heating
above upper critical temp (830-8600C) and quenching in oil/ water.
Equipment required:
1. Muffle furnace with on-off controller & temp. indicator- temp upto 10000C
2. Oil quenching tub, water quenching tub & fan.
3. Tongs, safely gloves & goggles
4. Rockwell hardness tester.
Procedure:
1. Measure the Rockwell hardness of steel specimen as follows:
1.1 Place the semipolished specimen on the platform.
1.2 Insert the diamond cone indentor for C scale & 1/16 “steel ball for B scale inside
the sleeve & tighten the screw. Check that there is no movement of indentor.
1.3 Set the required load (150kg for C scale & 100kg for B scale) by turning the knob
provided by the side of the machine.
1.4 Bring the specimen into contact with indentor by rotating the elevating screw by
rotating the star handle. By further elevating the specimen, the minor load of 10kg is
applied such that pointer indicates ‘σ’ on the smaller graduated arc scale & the longer
pointer indicates on the outer C scale & ‘B 30’ on the inner ‘B’ scale.
1.5 Now turn the lever away from the observer slowly. The longer pointer moves away
& when it comes to rest, wait 8 to 10 seconds for the entire application of major load.
MATERIAL TESTING LABORATORY: 2016
Mechanical Dept., Dayananda Sagar College of Engineering Bengaluru Page 33
1.6 Now turn the lever slowly to-words the observer i.e., to the original position. Now
the entire load is being off from the specimen.
1.7 Now the longer pointer moves back and when it comes to a rest position, note the
reading on the outer black dial ( C scale) & on the inner red dial (B scale).
1.8 The reading on the 3 trial readings are taken at separate locations on the surface of
the specimen. The average value of these three readings gives the true Rockwell hardness
number which is reported as HRC & HRB for Rockwell in C scale & Rockwell in B scale
respectively.
1.10 The results are tabulated as follows:
Sl.
No.
Material Type of
Indentor
Std. Load in Kg Hardness HRC/HRB Average
Major Minor T1 T2 T3
1
2
3
2. Keep the cylindrical specimen of EN8/ EN24 in the muffle furnace using tongs & wearing
safety gloves & goggles. Set the temp for respective heat treatment processes as below.
Annealing- 650-7000C
Normalizing – 830-8600C
Hardening- 830-8600C
3. Heat the specimen at the rate of approx. 1000C -15000C/ hr. till it reaches the temp set for
respective heat treatment process.
4. Sock for 15-20 minutes at this temp.
5. Cool the specimen as follows.
Process Annealing- Furnace cooling up to 2000C & then remove using tongs & gloves.
Normalising – Remove specimen using tongs gloves & cool in still air by using a fan up
to room temp.
Hardening – Remove specimen using tongs & gloves & quench in a tib of water for EN8
and a tub of oil for EN 24 steel.
6. After attaining room temp., clean the specimen using emery cloth & remove rough surface
with emery belt driven by a motor.
MATERIAL TESTING LABORATORY: 2016
Mechanical Dept., Dayananda Sagar College of Engineering Bengaluru Page 34
7. Measure the Rockwell hardness. The difference in hardness before & after heat treatment
indicates the effect of heat treatment.
Record the results as below.
Observation:
Sl.
No.
Material Temp 0
C
Cooling /
Quenching
Medium
Hardness RHN Remarks
Before
heat
treatment
After heat
treatment
Viva question:
1. Compare the Normalizing & Annealing process indicating advantages & disadvantages
2. Explain why alloy steels are oil quenched instead of water quenching
3. Explain with suitable diagram why mild steel cannot be hardened by conventional quenching
4. What is the significance of tempering
5. What is the principle of working of muffle furnace
6. What is on – off temp. controller
7. What is the difference between hardenability and hardness
8. What is the difference between process annealing and full annealing
9. What age hardening
10. Can fully hardened steel be dangerous? Why?
MATERIAL TESTING LABORATORY: 2016
Mechanical Dept., Dayananda Sagar College of Engineering Bengaluru Page 35
Experiment No. 8
WEAR TEST
Aim: To study the wear resistance property of materials-steel, brass and aluminum using pin-on
disc wear testing machine.
Theory:
Wear is the progressive loss of substance from the operating surface. The usual
classification of types of wear is abrasive wear ; most examples in practice are a combination of
two or more of these.
“Abrasive wear”– abrasion is virtually a cutting action which may result from loose, hard
particles sliding between two mating surfaces. It can also arise when one pair of rubbing surfaces
is itself rough. The loose particles may be dirt from the environment or wear debris.
Adhesive wear:
If a tangential force is applied between two sliding blocks, shearing can take place either
at the original interface or along a path below or above it, causing adhesive wear. Adhesive wear
arises when junctions weld together, becomes broken by relative motion and wear particle result .
In the case of a steel shaft rotating in a broken bearing , it is not uncommon to find traces of broken
film on the shaft thus indicating adhesive wear.
Fretting wear:
When a small relative slipping motion takes between two surfaces the result is an amount
of fine wear debris and this wear is designated as fretting wear.
Fatigue wear:
Wear due to dynamic loading is called fatigue wear. Balls and rollers are subject to very
high alternating stresses and when these are above the endurance limit, small cracks will result
followed by pitting and spalling.
Erosive wear: Wear due to impact of particles is called erosive wear. A popular example is sand
blasting.

MATERIAL TESTING LABORATORY: 2016
Mechanical Dept., Dayananda Sagar College of Engineering Bengaluru Page 36
There are several testing materials for measure of wear. The simplest is pin on disc machine
in which a loaded pin is pressed on to rotating disc. The amount of wear after a given amount of
rubbing is measured either by loss of weight of specimen or dimensional changes.
Equipment:
1. Pin on disc machine.
2. Electronic weighing machine.
3. Ultrasonic cleaning device.
4. Brass /Aluminum specimen.
5. Hardened disc.
Setup of pin on disc wear testing machine.
Procedure:
1. Clean the surface of disc and the specimen (brass, aluminum)
2. Weigh the specimen accurately by using electronic weighing machine (W1)
3. Fix the specimen (pin) on the horizontal arm and measure the track radius by a scale. The
specimen should be in contact with disc.
4. Switch on the motor and note the speed of the (rpm)on the indicator.
5. Load the specimen and note the force.

MATERIAL TESTING LABORATORY: 2016
Mechanical Dept., Dayananda Sagar College of Engineering Bengaluru Page 37
6. Run the motor for a specified time interval(say 15min). Switch off the motor.
7. Clean the specimen and weigh the same Note down the final weight (W2).
8. Calculate the total sliding distance for the specified running time.
9. Repeat the experiment for different rpm, load and material.
10. Wear rate is calculated by using the following.
Tabulate the result as follows.
Material Frictional
Force in
(N )
Load
in
(gm)
Speed
N
rpm
Time of
running
t
(min)
Sliding
Distance
2 πrNt
Weight (g)
Wear
rate
m3/m
W1 W2 W1-W2
Wear rate = Volume of material removed / Sliding distance. m3/m
Volume of material removed, V = (W1-W2)/Density m3
Sliding distance = 2 πrNt
Where
r = track radius, mm.
N = Speed, rpm.
t = test time, sec.
Plot graph of (i) Wear rate V/s Sliding distance (ii) Wear rate V/s RPM
MATERIAL TESTING LABORATORY: 2016
Mechanical Dept., Dayananda Sagar College of Engineering Bengaluru Page 38
Practical Importance:
The primary object of most wear studies is to reduce wear . Wear may result whenever
there is relative sliding. The rate at which material is removed will depend on working conditions.
E.g. Loading, lubrication and environment.
Wear studies are of immense use in study of:
1) Wear in reciprocating engine.
2) Wear in sleeve bearing, ball bearing and roller bearings
3) Wear in cam and tappet wear.
4) Wear of tires.
5) Wear of gears of machinery.
6) Wear of cutting tools etc.,
Surface treatment like plating, nitriding , carburizing and hardening and etc., are given to
reduce wear , wear may also be reduced by good design and proper selection of materials.
Viva Questions:
1. Define Wear
2. What are the difference between (a) adhesive wear
(b) abrasive wear
(c) erosive wear
3. How wear of material and alloys can be minimized
4. How wear tests help in combating wear
MATERIAL TESTING LABORATORY: 2016
Mechanical Dept., Dayananda Sagar College of Engineering Bengaluru Page 39
Experiment No. 9
MICROSTRUCTURE
Aim: To study the microstructure of given specimen (steel, cast iron, brass) by using
metallurgical microscope.
Theory:
Metallography is essentially the study of structural characteristic of metals or alloys. It
deals with the microscopic examination of a prepared metal specimen employing magnifications
from 100 X to as high as 2000 X. By studying the microstructure of metals & alloys, its grain size,
shape & distribution of secondary phases & non metallic inclusion can be seen, all of which
profoundly influence the mechanical properties.
The first step in finding the microstructure of metal or alloy consists of preparation of
specimen as detailed below.
1. Selection of specimen:
Selection must be homogeneous in composition & characteristic of the material, it should
be of size convenient to handle ( say 10 dia X 10 mm ). It is cut from the metal / alloy with hacksaw
or water cooled slitting wheel
2. Grinding:
It is necessary to obtain a flat specimen. This is done by using a specifically designed motor
driven emery belt. The specimen should be kept cool by frequent dipping grinding operation.
3. Fine grinding:
Fine grinding is carried on water proof emery papers of progressively finer grades (220,
320, 400& 600) that are attached on a plane glass plate. The specimen is drawn back & forth along
with entire length of paper so that scratches produced are roughly at right angles, to those produced
by the preliminary grinding operation. Having removed the primary grinding marks, the specimen
is washed thoroughly. Grinding is continued on 320, 400 & 600 papers by turning the specimen
900 until the previous scratch marks are removed. Thoroughly wash the specimen in water.
4. Fine scratches are removed by polished using a rotary polishing machine. The specimen is
polished by rubbing on a soft, moist velvet cloth mounted on a flat rotating disc with polishing

MATERIAL TESTING LABORATORY: 2016
Mechanical Dept., Dayananda Sagar College of Engineering Bengaluru Page 40
paste (alumina). During polishing, constant feed of water to the rotating pad is a must. After
polishing (by obtaining a scratch free/ mirror finish) the specimen is washed thoroughly in water.
5. Etching:
Grain boundaries can be easily revealed revealed by using etching reagents which
selectively corrode the polished surface.
Etching reagents used are 3% Nital( 3cc Nitric acid and 97 cc Ethanol) for material such as iron
and steel and Etching time is 30 sec.
(50 cc Ammonium hydroxide, 20-50cc hydrogen , hydrogen peroxide, 50 cc water) for brass and
bronze.
The specimen is immersed/ swabbed with above etchants for a short duration (10-30 sec)
until the polished surface becomes slightly dull/ discoloured . It is thoroughly washed with water,
alcohol and dried. Now the specimen is ready for microstructure determination.
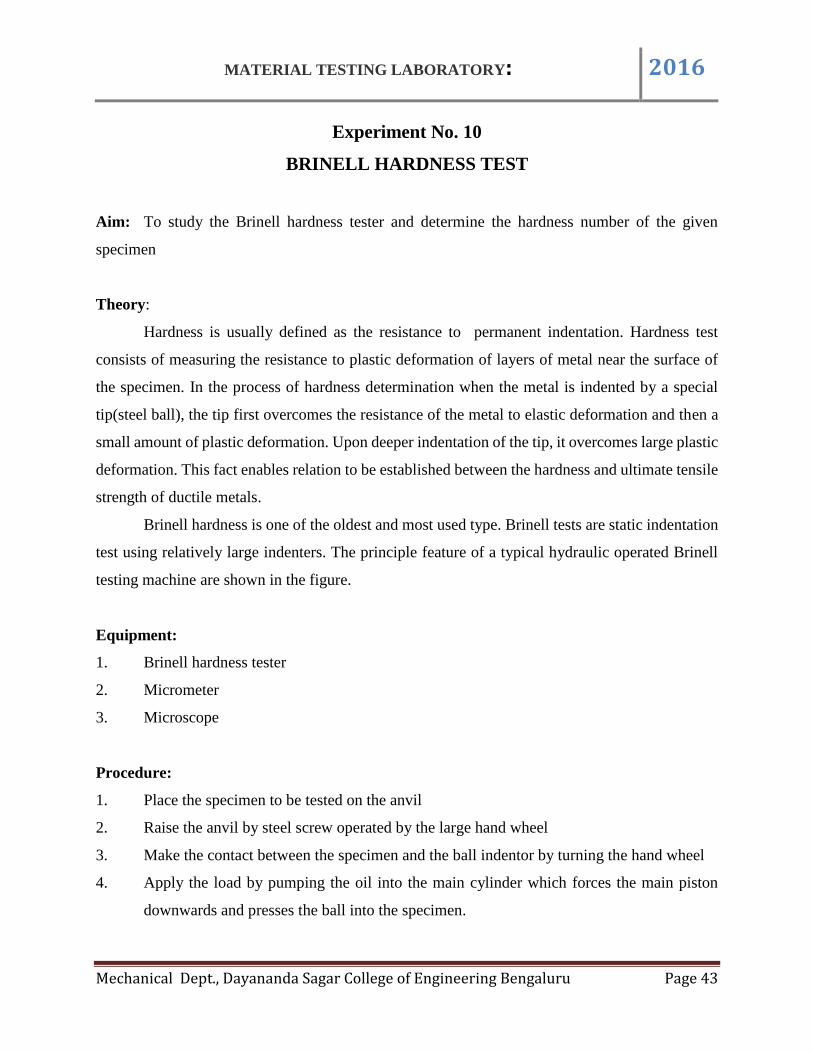
Equipment:
1. Metallurgical microscope ( magnification at least up to 500X)
2. Polishing and grinding machine.
3. Specimens.
Procedure:
1. Prepare the specimen.
2. Mount the specimen on the table of metallurgical microscope. Record the objective
magnification and eye piece magnification and determine total magnification.
3. Focus the surface of polished and etched specimen using coarse adjustment and then fine
adjustment.
4. Observe the microstructure and record it.
5. Compare the microstructure with the standard (show in fig (11) COSMIC 103/COSMIC 109/
COSMIC112)
Description for Microstructure:
Microstructure – cosmic 102, 108, 112
MATERIAL TESTING LABORATORY: 2016
Mechanical Dept., Dayananda Sagar College of Engineering Bengaluru Page 41
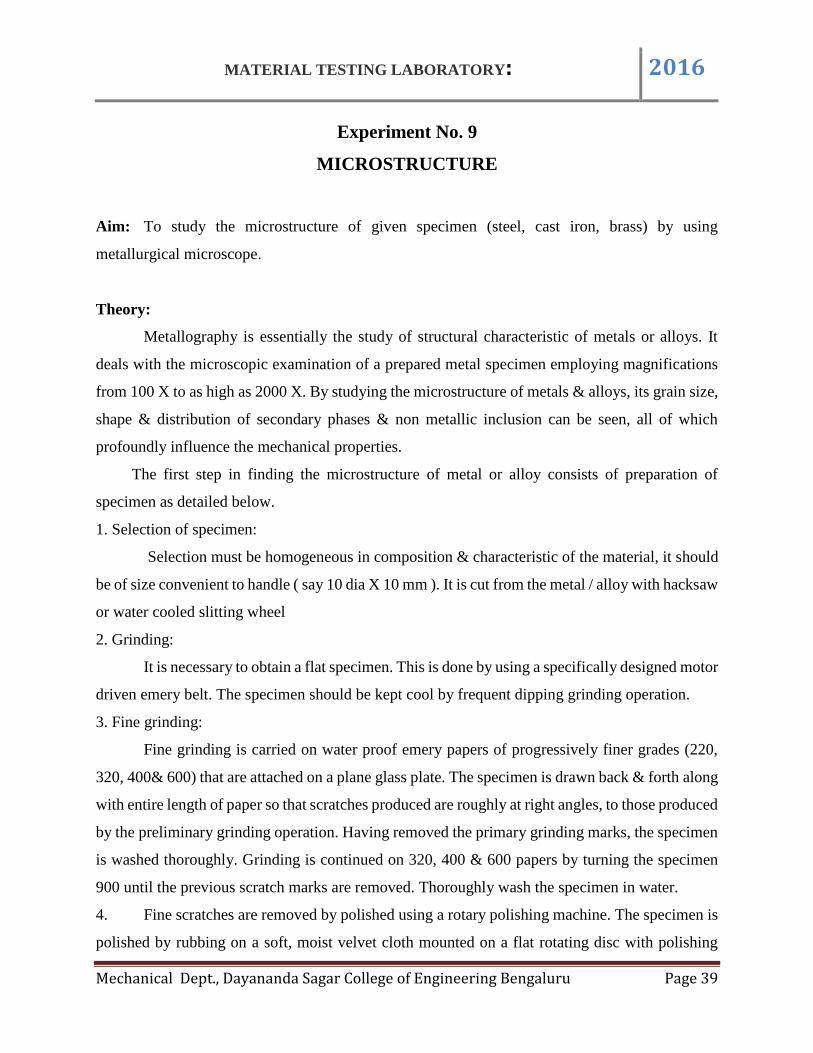
Cosmic 102-Midium Carbon Steel
The microstructure in this sample consists of pearlite (grey) with a network of grain boundary
ferrite (white) with some platelets within the grains.
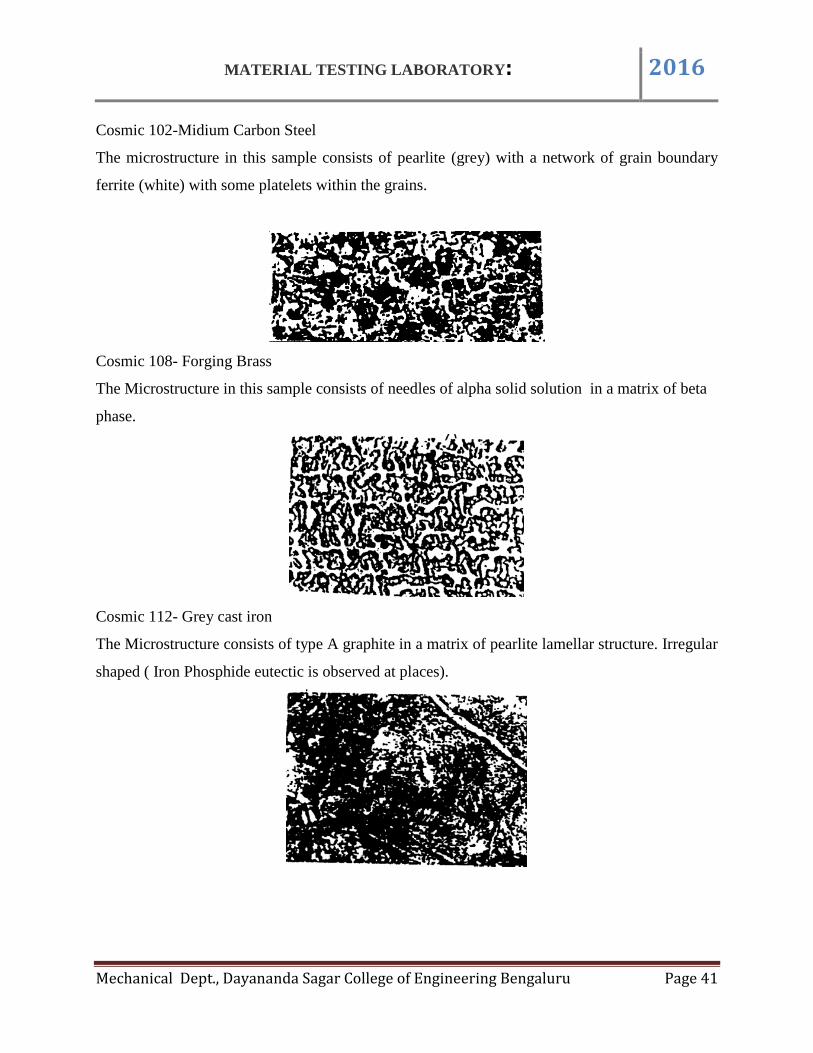
Cosmic 108- Forging Brass
The Microstructure in this sample consists of needles of alpha solid solution in a matrix of beta
phase.
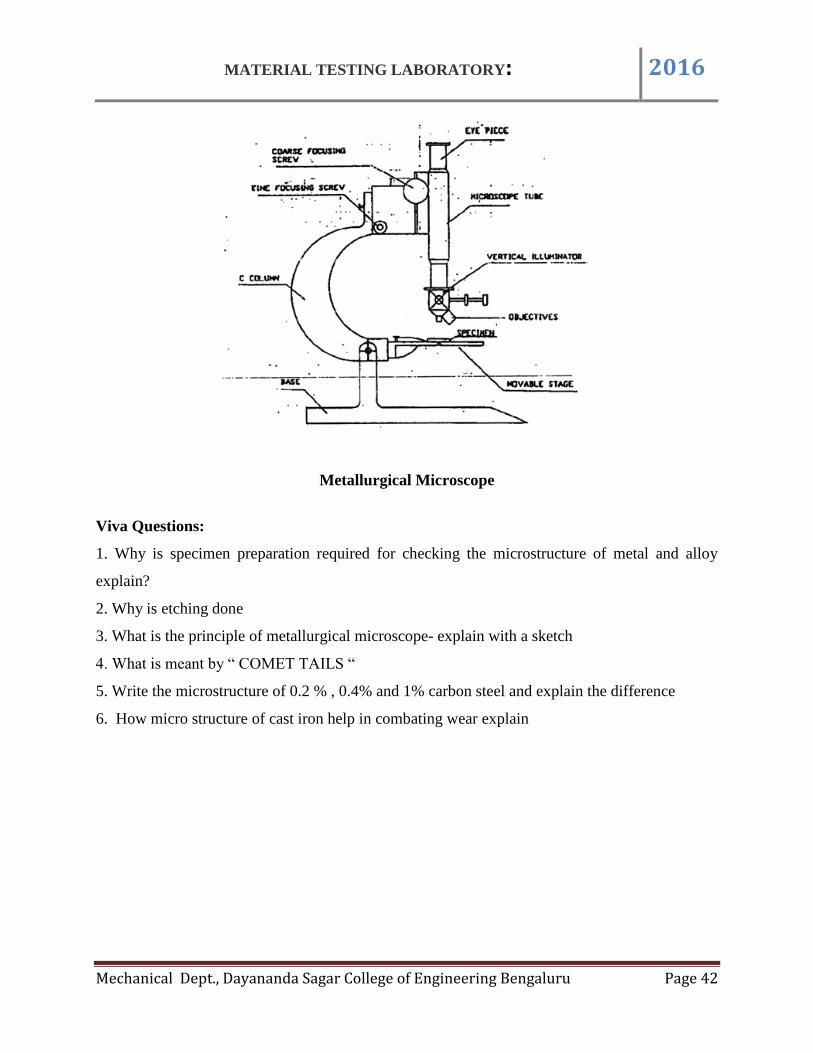
Cosmic 112- Grey cast iron
The Microstructure consists of type A graphite in a matrix of pearlite lamellar structure. Irregular
shaped ( Iron Phosphide eutectic is observed at places).
MATERIAL TESTING LABORATORY: 2016
Mechanical Dept., Dayananda Sagar College of Engineering Bengaluru Page 42
Metallurgical Microscope
Viva Questions:
1. Why is specimen preparation required for checking the microstructure of metal and alloy
explain?
2. Why is etching done
3. What is the principle of metallurgical microscope- explain with a sketch
4. What is meant by “ COMET TAILS “
5. Write the microstructure of 0.2 % , 0.4% and 1% carbon steel and explain the difference
6. How micro structure of cast iron help in combating wear explain
MATERIAL TESTING LABORATORY: 2016
Mechanical Dept., Dayananda Sagar College of Engineering Bengaluru Page 43
Experiment No. 10
BRINELL HARDNESS TEST
Aim: To study the Brinell hardness tester and determine the hardness number of the given
specimen
Theory:
Hardness is usually defined as the resistance to permanent indentation. Hardness test
consists of measuring the resistance to plastic deformation of layers of metal near the surface of
the specimen. In the process of hardness determination when the metal is indented by a special
tip(steel ball), the tip first overcomes the resistance of the metal to elastic deformation and then a
small amount of plastic deformation. Upon deeper indentation of the tip, it overcomes large plastic
deformation. This fact enables relation to be established between the hardness and ultimate tensile
strength of ductile metals.
Brinell hardness is one of the oldest and most used type. Brinell tests are static indentation
test using relatively large indenters. The principle feature of a typical hydraulic operated Brinell
testing machine are shown in the figure.
Equipment:
1. Brinell hardness tester
2. Micrometer
3. Microscope
Procedure:
1. Place the specimen to be tested on the anvil
2. Raise the anvil by steel screw operated by the large hand wheel
3. Make the contact between the specimen and the ball indentor by turning the hand wheel
4. Apply the load by pumping the oil into the main cylinder which forces the main piston
downwards and presses the ball into the specimen.
MATERIAL TESTING LABORATORY: 2016
Mechanical Dept., Dayananda Sagar College of Engineering Bengaluru Page 44
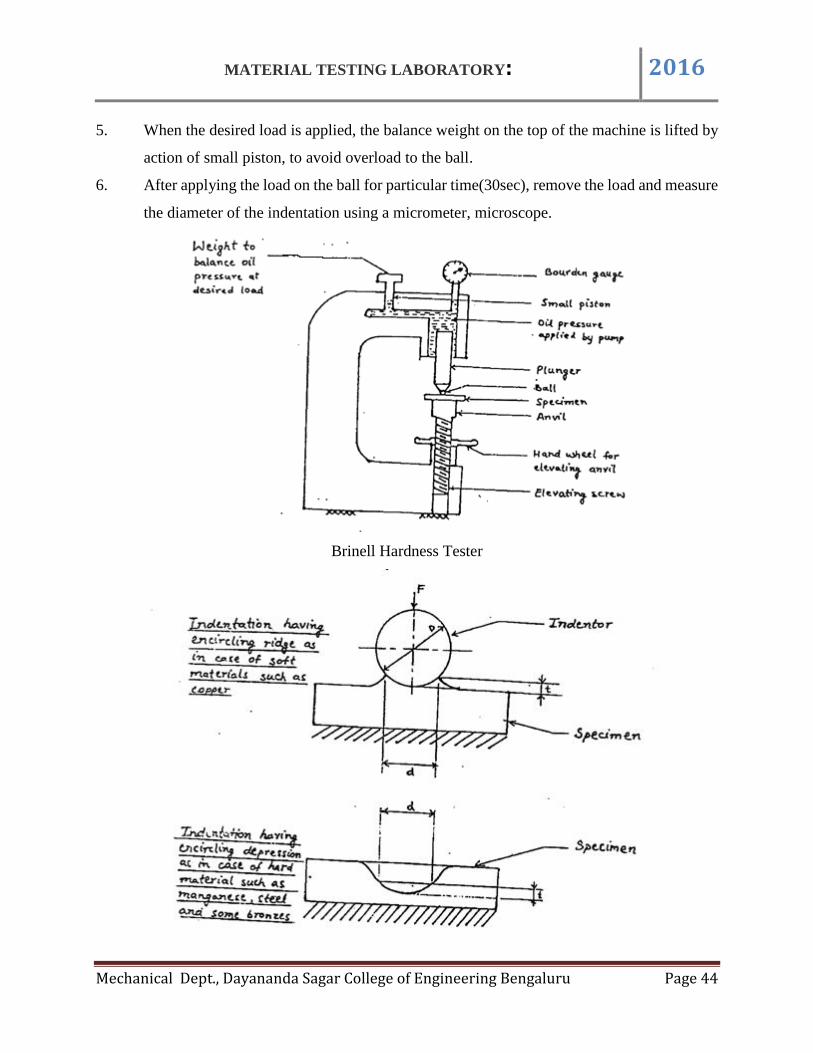
5. When the desired load is applied, the balance weight on the top of the machine is lifted by
action of small piston, to avoid overload to the ball.
6. After applying the load on the ball for particular time(30sec), remove the load and measure
the diameter of the indentation using a micrometer, microscope.
Brinell Hardness Tester

MATERIAL TESTING LABORATORY: 2016
Mechanical Dept., Dayananda Sagar College of Engineering Bengaluru Page 45
The hardness number is defined as the ratio of load in kg to the surface area of the indentation in
mm2
.∙. Brinell hardness
= 2F = F .
πD (D-√D2-d2) πdt
Where, F= load in kgf, D is the diameter of the ball in mm, d is the diameter of the impression in
mm and t is the depth of indentation in mm.
Tabulation:
Sl.
No.
Material Load F
kgf
Time of
application
of load sec
Diameter of
indentation
mm
HB =
. 2F .
πD (D -√D2-d2)
kgf /mm2
MATERIAL TESTING LABORATORY: 2016
Mechanical Dept., Dayananda Sagar College of Engineering Bengaluru Page 46
Experiment No. 11
TORSION TEST
Aim: To determine the behavior of Mild steel when subjected to Torsion & obtain the following
torsional properties: (1) Modulus of rigidity (2) Elastic shear strength
Theory:
A method of finding the shear properties of a material is by the use of torsion test. Torsional
shear stress on circular cross section varies from zero at the axis of twist to a maximum at the
extreme fibres. Within elastic range, the general equation is
T = Gθ = τ
J l r
Where, T is the torsional moment in N-mm
Jp is the polar moment of inertia in mm4 (= πd4 )
32
G is the modulus of rigidity inN/mm2
θ is the angular distortion in radians
l is the gauge length in mm
τ is the shear stress in N/mm2
From the above equation, for the solid rod,
Torque T= τ πd3/16
Equipment:
i) Torsion testing machine
ii) Micrometer
iii) Scale

MATERIAL TESTING LABORATORY: 2016
Mechanical Dept., Dayananda Sagar College of Engineering Bengaluru Page 47
Specimens: Torsion testing specimen is generally circular in cross-section, either solid or
hollow. For solid rod, the length of the specimen is recommended to be 10 times the diameter. The
ends are such that they can be securely gripped without developing stresses, sufficiently localized
to cause failure in the grips. In order to obtain an approximately uniform stress and strain
distribution along the cross-section, this test is usually performed on a thin tubular specimen.
Torsion fracture is the shear fracture and is quite distinct from tension or compression
fracture, there is no localized reduction of area or elongation. When a ductile material is subjected
to a twisting moment, the fracture is plane and perpendicular to the axis. One end of the specimen
usually makes several complete revolutions relative to the other before fracture takes place.
Procedure:
1. Measure the diameter d of the specimen at several sections micrometer to get mean value.
2. Measure the gauge length 1.
3. Adjust the torsion machine to read zero and then insert the specimen into two chucks.
4. Apply the load at load at slow speed(15rpm).
5. Note down the reading of wattmeter and simultaneously calculate torque T and angle of
twist θ until failure occurs.
Tabulations:
Sl.
No.
Length of
Specimen
1mm
Diameter
of
Specimen
d/mm
Wattmeter
Reading
PW
Torque
T= 60p
2πN
No. of
revolutions
on counter n
No. of
divisions
on
circular
scale
(CSD)
θ= {n+ (csd)}2π 100

MATERIAL TESTING LABORATORY: 2016
Mechanical Dept., Dayananda Sagar College of Engineering Bengaluru Page 48
Torsion Testing Macine.
Broken Piece.
MATERIAL TESTING LABORATORY: 2016
Mechanical Dept., Dayananda Sagar College of Engineering Bengaluru Page 49
Experiment No. 12
FATIGUE TEST
Aim: To study the fatigue testing machine and to determine the fatigue limit and fatigue strength.
Equipment: Fatigue testing machine and micrometer caliper.
Theory:
Failure due to repeatedly applied load is known as fatigue. The physical effect of a repeated
load on a material is different from that of a static load, failure always being brittle fracture
regardless of whether the material is brittle or ductile. Mostly fatigue occur at stress well below
the static elastic strength of the material. If the applied load changes from any magnitude in one
direction to the same magnitude in the opposite direction, the loading is termed completely
reversed, whereas if the load changes from one magnitude to another (the direction does not
necessarily change), the load is said to be a fluctuating load. Fatigue testing machine is shown in
figure.
A specimen of circular cross-section is held at its ends in special holders and loaded
through 2 bearings equidistant from the center of the span. Equal loads on these bearings are
applied by means of weights that produce a uniform bending moment in the specimen between the
loaded bearings. The specimen is rotated by a motor. Since the upper fibers in tension, it is apparent
that a complete cycle of reversed stress in all fibres of the beam is produced during each revolution.
A revolution counter is used to find the numberof cycles the specimen is repeatediy subjected to
the load. For simply supported beam, maximum bending moment is at the centre. Bending moment
M=FL/4 and bending stress S=M/z
Where L is the length of the specimen and z is the sectional modulus. In rotating cantilever
beam type, the specimen is rotated while a gravity load is applied to the free end by means of a
bearing. For cantilever specimen the maximum bending moment is at the fixed end.
M=FL and S=M/z

MATERIAL TESTING LABORATORY: 2016
Mechanical Dept., Dayananda Sagar College of Engineering Bengaluru Page 50
The testing technique is subjected to a series of identical specimens to loads of different
magnitude and note the number of cycles of stress ( or load) N necessary to fracture the specimen.
The data are plotted on a graph sheet, the stress S being plotted on y-axis and the number of cycles
N on X-axis.
This is known as stress-cycle (S-N) diagram and the fatigue limit can be determined from
the diagram fatigue limit or endurance limit is the stress below which a material can be stressed
cyclically an indefinitely large number of times without failure. The fatigue strength is the stress
at which a metal fails by fatigue after a certain number of cycles. Fig. shows the S-N diagram for
MS.
Specimens:
All specimen should be taken from the same rod, each specimen should receive same kind
of amchining and heat treatment. The specimens for tests of the metal have no sharp stress raisers.
The surface of the specimen is polished.
Fracture Appearance:
Under repeated loading, a small crack forms in a region of high localized stress, and very
high stress concentration accompanies the crack. As the load fluctuates, the crack opens and
insufficient cross section left to carry the load and the member ruptures, the failure being fatigue
failure. Therefore fractured surface shows two sufraces of distinctly different appearance. 1. A
smooth surface where the crack has spread slowly, and the walls of the crack are polished by
repeated opening and closing. This surface usually shows characteristic beach or clam
shellmarkings. 2. A crystalline or fibrous surface wherer sudden failure occurred.
Procedure:
Measure the diameter d and the length L of the specimen. Securely fasten the specimen in the
chucks of the testing machine. Set the maximum load. Set the counter to zero, the start the machine.
Note the number of cycles N the specimen experiences before fracture. Repeat the above test on
the other specimens with gradually reduced loads. Draw the S-N diagram and obtain the endurance
limit.
Observations and Tabulation:
MATERIAL TESTING LABORATORY: 2016
Mechanical Dept., Dayananda Sagar College of Engineering Bengaluru Page 51
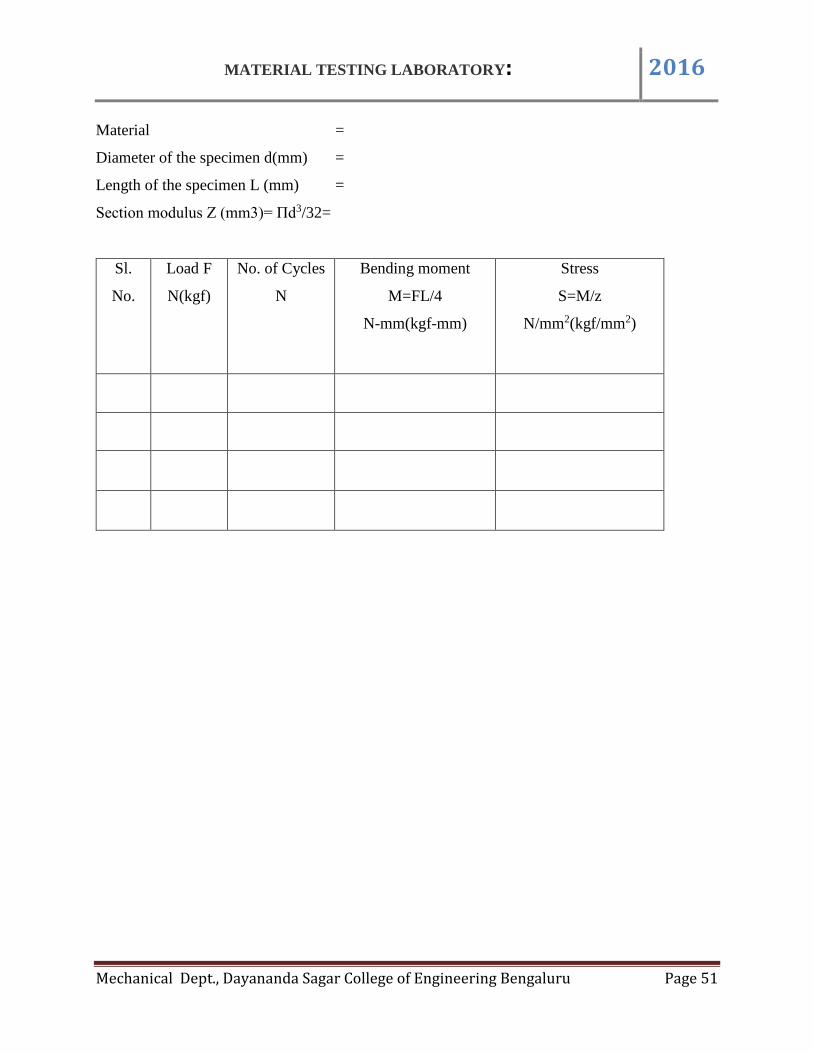
Material =
Diameter of the specimen d(mm) =
Length of the specimen L (mm) =
Section modulus Z (mm3)= Пd3/32=
Sl.
No.
Load F
N(kgf)
No. of Cycles
N
Bending moment
M=FL/4
N-mm(kgf-mm)
Stress
S=M/z
N/mm2(kgf/mm2)

MATERIAL TESTING LABORATORY: 2016
Mechanical Dept., Dayananda Sagar College of Engineering Bengaluru Page 52
Fatigue Testing Machine.
MATERIAL TESTING LABORATORY: 2016
Mechanical Dept., Dayananda Sagar College of Engineering Bengaluru Page 53
Experiment No.13
BENDING TEST
AIM: To conduct the bending test on mild steel and thereby to obtain:
i) Modulus of elasticity
ii) Maximum bending stress
APPARATUS: Scale, UTM, dial gauge and specimen.
THEORY:
If forces act on a piece of material in such a way that they tend to induce compressive
stresses over one part of a cross section of the piece and tensile stresses over the remaining part,
the piece is said to be in bending. The common illustration of bending action is a beam acted on
by a transverse loads; bending can also be caused by moments or couples such as from eccentric
loads parallel to longitudinal axis of a piece.
In structures and machine, bending my be accompanied by direct stress, transverse shear
or torsional shear. For convenience, however, bending stresses may be considered separately and
in tests to determine the behavior of materials in bending, attention is usually confined to beams.
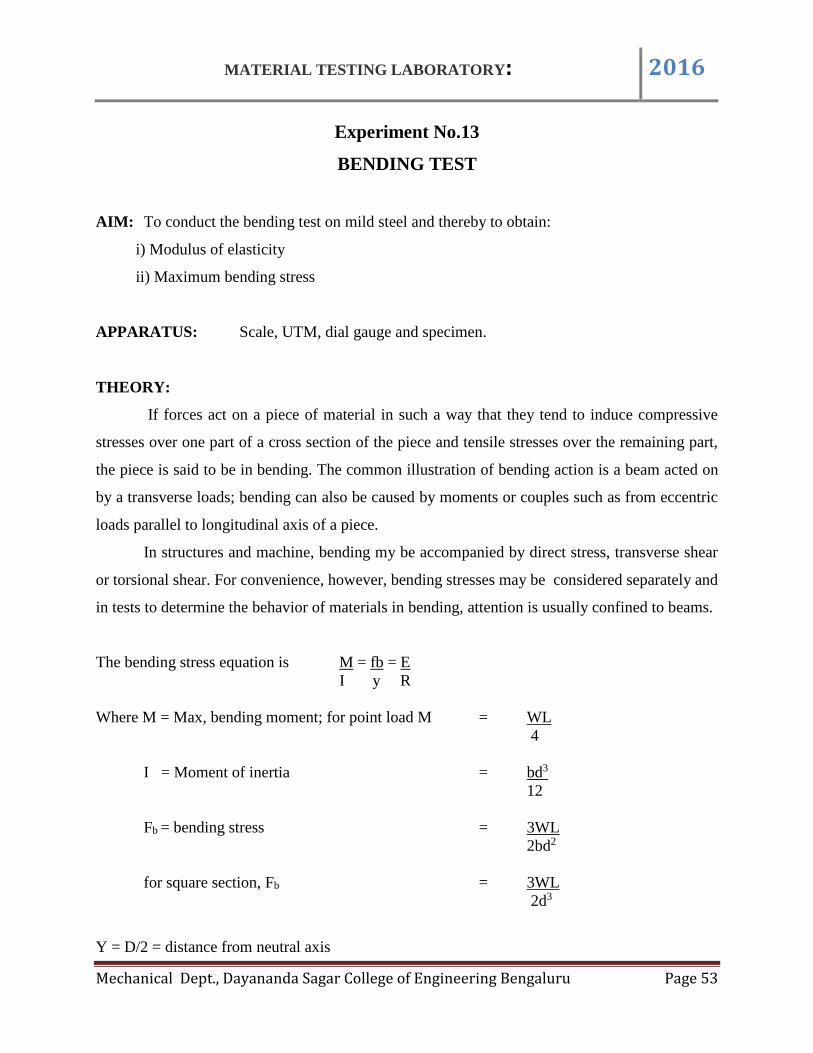
The bending stress equation is M = fb = E
I y R
Where M = Max, bending moment; for point load M = WL
4
I = Moment of inertia = bd3
12
Fb = bending stress = 3WL
2bd2
for square section, Fb = 3WL
2d3
Y = D/2 = distance from neutral axis
MATERIAL TESTING LABORATORY: 2016
Mechanical Dept., Dayananda Sagar College of Engineering Bengaluru Page 54
E = modulus of elasticity
R = radius of curvature
The modulus of elasticity is calculated as follows:
The maximum deflection for a point load acting at the center of the beam is given by
δ=WL3 or E = WL3 (w/ δ is obtained from graph of load Vs deflection)
48EI 48 δI
Procedure:
1. The length, breadth and depth of the specimen were measured.
2. The specimen was placed on the UTM platform n simply supported position
3. The top platform of UTM was brought down such that the load was applied at the centre
of the specimen.
4. Before the application of the load the dial gauge was fixed to measure the deflection.
5. The load was applied in increment of 200Kg and the deflection in the dial gauge was noted
until the specimen fails.
6. The graph of load Vs deflection is plotted, and w/ δ was obtained from the initial linear
portion of the curve
Observaiton & Tabulation
Breadth of specimen, b = …………………..mm
depth of specimen, d = …………………..mm
Length of specimen, L = …………………..mm
Calculations:
Maximum bending stress, fb = 3WmaxL N/mm2
2bd2
Moment of Inertia, I = bd3 mm4
12
Modulus of elasticity E = WL3
48δf
From graph of load Vs deflection, W/δ is found out.
MATERIAL TESTING LABORATORY: 2016
Mechanical Dept., Dayananda Sagar College of Engineering Bengaluru Page 55
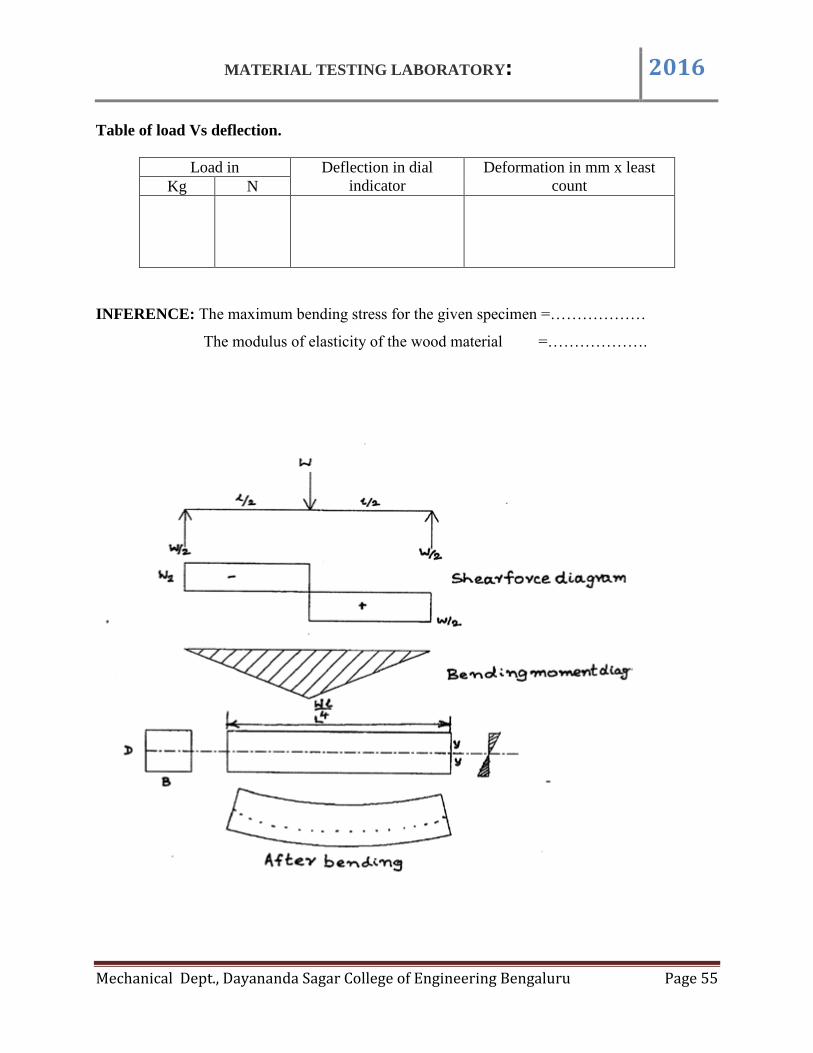
Table of load Vs deflection.
Load in Deflection in dial
indicator
Deformation in mm x least
count Kg N
INFERENCE: The maximum bending stress for the given specimen =………………
The modulus of elasticity of the wood material =……………….

MATERIAL TESTING LABORATORY: 2016
Mechanical Dept., Dayananda Sagar College of Engineering Bengaluru Page 56
Experiment No. 14
ULTRASONIC TEST
Aim: To study the ultrasonic flow detector and to determine the location of the interior crack or
cavity in the given specimen.
Apparatus: Ultrasonic flow detector
Theory:
Ultrasonic flaw detector is a device, which is used to detect internal discontinuities in the
material by nondestructive means. It makes use of phenomenon of back reflection(echo) of waves
by surfaces. When ultrasonic waves are made to pass through the test material, portion of the
material, portion of the sound is immediately reflected form the surface at which they enter as a
very large echo. Part of the sound will continue on into the test material, until it is partially reflected
from the back surface as a sound echo. If there is a discontinuity in the material, a portion of sound
will be reflected from the discontinuity and will return to the receiver as a separate echo between
the echoes received from the front and back surface. The signals received are shown on the cathode
ray tube, which also as a time base connected to it, so that the position of the signal on the screen
gives an indication of the distance between the crystal generator and the surface from which the
echo originates.
Sound waves oscillation with a frequency greater than 20000 cps are inaudible and are
known as ultrasound. High frequency sound is produced by a piezoelectric crystal, which is
electrically pulsed and then, vibrates at its own natural frequency. In order to transmit the sound
waves from the crystal to the metal, it is necessary to provide an liquid couplant. This is
accomplished by using a film of oil between the crystal and the test piece. After the crystal has
given off its short burst of sound waves, it stops vibrating and listens for the returning echoes, i.e.,
one crystal probe is used to send and received the sound. This cycle of transmitting and then
receiving is repeated at an adjustable rate of from 100 to 1000 time per second.
Returning echoes on the CRT causes short vertical spikes called pips. These are spaced
along the baseline according to their time of receipt. Since the sound travels the material at a
MATERIAL TESTING LABORATORY: 2016
Mechanical Dept., Dayananda Sagar College of Engineering Bengaluru Page 57
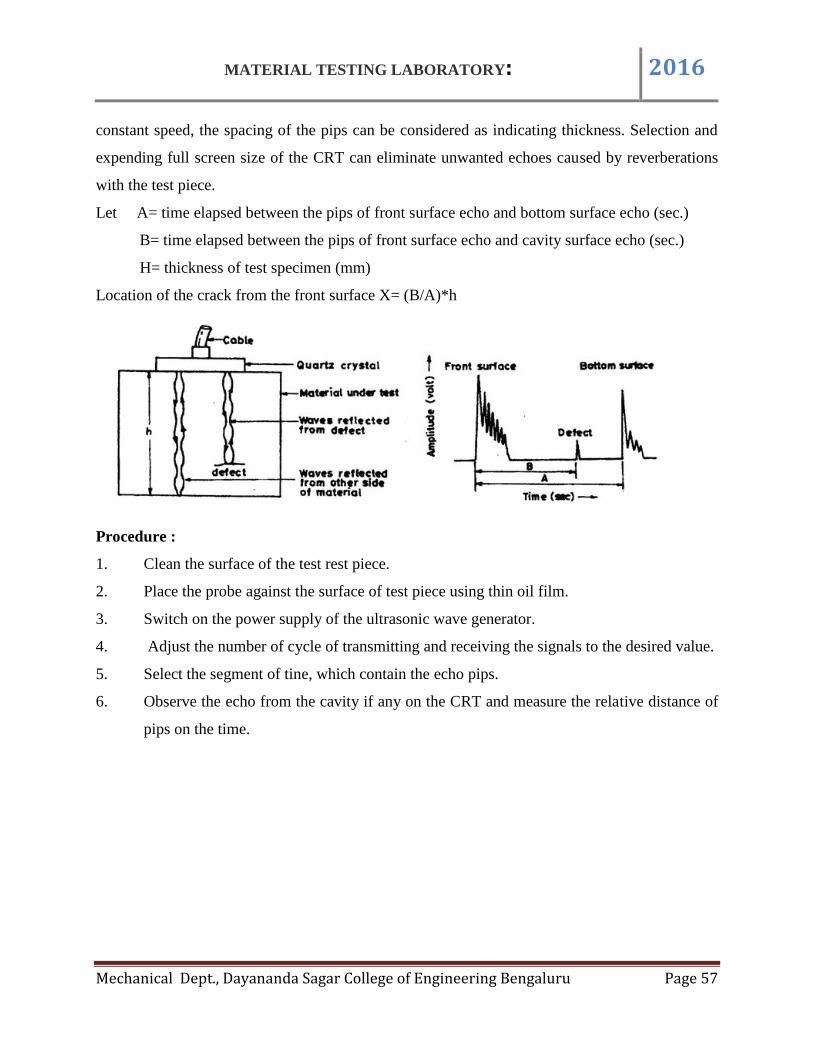
constant speed, the spacing of the pips can be considered as indicating thickness. Selection and
expending full screen size of the CRT can eliminate unwanted echoes caused by reverberations
with the test piece.
Let A= time elapsed between the pips of front surface echo and bottom surface echo (sec.)
B= time elapsed between the pips of front surface echo and cavity surface echo (sec.)
H= thickness of test specimen (mm)
Location of the crack from the front surface X= (B/A)*h
Procedure :
1. Clean the surface of the test rest piece.
2. Place the probe against the surface of test piece using thin oil film.
3. Switch on the power supply of the ultrasonic wave generator.
4. Adjust the number of cycle of transmitting and receiving the signals to the desired value.
5. Select the segment of tine, which contain the echo pips.
6. Observe the echo from the cavity if any on the CRT and measure the relative distance of
pips on the time.
MATERIAL TESTING LABORATORY: 2016
Mechanical Dept., Dayananda Sagar College of Engineering Bengaluru Page 58
Experiment No.15
MAGNETIC PARTICLE TEST
Aim: To detect the surface or subsurface crack of the given ferromagnetic material.
Apparatus: Magnetic field generator, and ferromagnetic powder.
Theory:
The magnetic particle method of inspection is a procedure used to determine the presence
of the defects at or near the surface of the ferromagnetic objects. This method consists of placing
fine ferromagnetic particle on the surface. The particle can be applied either dry or in a liquid
carrier such ass water or kerosene. When the part is magnetized with a magnetic field, a
discontinuity (defects) on the surface causes the particle to gather visibly around it. Thus, the
defects become a magnet due to the principle of flux leakage where magnetic field lines are
interrupted by the defect and collect the ferromagnetic particles. The collected particles generally
take the shape and size of the defects. Sub surface defects can also be detected by this method,
provided they are not deep. The ferromagnetic particles may be colored with pigments for better
visibility on the metal surfaces. The magnetic fields can be generated either with direct current or
alternating current, using yokes, bars, and coils. the equipment may be portable or stationary.
Procedure:
1. Clean the surface of the test specimen to remove scales, oils and grease.
2. Apply a thin layer of ferromagnetic particle over the surface to be tested.
3. Magnetize the test piece.
4. Observe the shape and size of the magnetic particles collected, which is the shape and size
of the defect.