MATERIAL PROPERTIES OF CRUSHABLE CONCRETE FOR USE IN ...
78
The Pennsylvania State University The Graduate School Department of Civil and Environmental Engineering MATERIAL PROPERTIES OF CRUSHABLE CONCRETE FOR USE IN VEHICLE ANTI-RAM BARRIERS A Thesis in Civil Engineering by Keith Edward Doyle 2015 Keith Edward Doyle Submitted in Partial Fulfillment of the Requirements for the Degree of Master of Science May 2015
Transcript of MATERIAL PROPERTIES OF CRUSHABLE CONCRETE FOR USE IN ...

The Pennsylvania State University
The Graduate School
Department of Civil and Environmental Engineering
MATERIAL PROPERTIES OF CRUSHABLE CONCRETE FOR
USE IN VEHICLE ANTI-RAM BARRIERS
A Thesis in
Civil Engineering
by
Keith Edward Doyle
2015 Keith Edward Doyle
Submitted in Partial Fulfillment
of the Requirements
for the Degree of
Master of Science
May 2015

The thesis of Keith Doyle was reviewed and approved* by the following:
Tong Qiu
Assistant Professor of Civil and Environmental Engineering
Thesis Co-Adviser
Aleksandra Radlińska
Assistant Professor of Civil and Environmental Engineering
Thesis Co-Adviser
Gordon Warn Associate Professor of Civil Engineering
Zoltan Rado
Research Associate
Vehicle Systems & Safety Director, Crash Safety Research Laboratory
Peggy Johnson
Professor of Civil and Environmental Engineering
Head of the Department of Civil and Environmental Engineering
*Signatures are on file in the Graduate School

iii
ABSTRACT
The objectives of this research are to create a crushable concrete material that
maximizes energy absorption and to characterize that material so that it can be modeled
in full-scale crash test simulations. These objectives were fulfilled by performing a series
of tests to determine the materials’ stress-strain behavior, strength and deformability in
particular, under unconfined and confined conditions.
In this study, multiple crushable concrete mixture designs containing partial and
full replacement of aggregate by expanded polystyrene spheres were tested in unconfined
and confined compression tests. Unconfined testing showed high ductility of polystyrene
concrete, but the samples ultimately failed in shear. This shows that unconfined
condition is not an efficient way to incorporate a crushable concrete element into a
barrier. As such, it is recommended that crushable concrete is designed with adequate
confinement (e.g., encapsulated element), to maximize energy dissipation in vehicle anti-
ram barriers.
Confined compression testing showed a much better comparison of the energy
absorption characteristics of different mixtures. Changes in the water-to-cement ratio
(w/c) and strain rate of loading were shown to have minimal effect at the levels that were
tested. Increasing the amount of polystyrene replacement of aggregate, however, caused
an increase in deformability but a decrease in strength. This tradeoff will define the
process for determining a mixture design that optimizes energy dissipation for
application-specific barrier design.

iv
TABLE OF CONTENTS
List of Figures .............................................................................................................. v
List of Tables ............................................................................................................... viii
Acknowledgements ...................................................................................................... ix
Chapter 1 Objectives and Organization ....................................................................... 1
1.1 Introduction ..................................................................................................... 1 1.2 Research Objectives ........................................................................................ 2 1.3 Outline ............................................................................................................ 2
Chapter 2 Description of Crushable Materials ............................................................. 3
2.1 Introduction to Cellular Solids........................................................................ 3 2.2 Mechanical Behavior of Foams ...................................................................... 5 2.3 Foams as Energy Absorbing Materials ........................................................... 10 2.4 Polystyrene Concrete ...................................................................................... 14
Chapter 3 Testing Procedures ...................................................................................... 23
3.1 Mixing Procedure ........................................................................................... 23 3.2 Uniaxial Compression Testing ....................................................................... 24 3.3 Confined Compression Testing ...................................................................... 25 3.4 Crushable Concrete Mix Designs ................................................................... 27
Chapter 4 Experimental Results and Discussion ......................................................... 34
4.1 Series I Testing ............................................................................................... 34 4.2 Series II Testing .............................................................................................. 38 4.3 Series III Testing ............................................................................................. 51 4.4 Mixture Design Guidance for Barriers ........................................................... 58
Chapter 5 Conclusions and Future Research ............................................................... 61
5.1 Conclusions..................................................................................................... 61 5.2 Future Research .............................................................................................. 64
References .................................................................................................................... 66
v
LIST OF FIGURES
Figure 2-1. Typical makeup of a cellular solid consisting of a solid matrix
material that surrounds the cellular material ........................................................ 4
Figure 2-2. Images of cellular solids: (a) a hexagonal honeycomb structure
(Nakamoto et al. 2009); (b) an open-celled aluminum foam (Montanini 2005) .. 5
Figure 2-3. Idealized compression for a foam characterized by three phases:
linear-elastic phase, crushing phase, and densification phase .............................. 8
Figure 2-4. Strain energy density (𝑈0) of a foam calculated from 0% strain to
densification strain (𝜀𝐷) ........................................................................................ 11
Figure 2-5. Tangent line method for determining densification strain (Paul and
Ramamurty 2000) ................................................................................................. 12
Figure 2-6. Three hypothetical foams to dissipate energy (𝑊). Only foam B is
able to absorb this energy without transmitting the stress required to damage
the protected structure (𝜎𝐷). Adapted from (Gibson and Ashby 1997) ............... 13
Figure 2-7. Compressive strength of samples with and without silica fume (Chen
& Liu 2004) .......................................................................................................... 15
Figure 2-8. Effect of steel fibers on shrinkage (Chen & Liu 2004) ............................. 16
Figure 2-9. Contact forces for 80 mm thick polystyrene concrete slabs with 40%,
50%, and 60% polystyrene volume fractions respectively (Bischoff et al.
1990) ..................................................................................................................... 19
Figure 2-10. Triaxial results: (a) foamed concrete; (b) polystyrene concrete
(Santagata et al. 2010) .......................................................................................... 21
Figure 2-11. Impact test results: (a) foamed concrete; (b) polystyrene concrete
(Santagata et al. 2010) .......................................................................................... 22
Figure 3-1. Testing setup for unconfined compression tests ....................................... 24
Figure 3-2. Testing setup for confined compression tests ........................................... 26
Figure 3-3. Polystyrene concrete sample showing that a polystyrene volume
fraction of 40% is sufficient to produce a closed-cell foam ................................. 28
Figure 3-4. Expanded polystyrene spheres .................................................................. 28
Figure 3-5. Stalite lightweight aggregate ..................................................................... 32

vi
Figure 4-1. 7 day unconfined stress-strain curves: (a) 2” x 2” control mixture
cubes; (b) 4” x 8” polystyrene mixture cylinders ................................................. 35
Figure 4-2. 28 day unconfined stress-strain curves: (a) control mixture cylinders;
(b) polystyrene mixture cylinders ......................................................................... 36
Figure 4-3. Polystyrene mixture sample failing in shear ............................................. 37
Figure 4-4. Cross-section after unconfined compression test ...................................... 38
Figure 4-5. Stress strain curves for 7 day confined compression tests at 1x strain
rate for different mixtures: (a) HAE-w/c=0.5; (b) LAE-w/c=0.5; (c) HAE-
w/c=0.4; and (d) LAE-w/c=0.4 ............................................................................. 39
Figure 4-6. Stress strain curves for 7 day confined compression tests at 10x strain
rate for different mixtures: (a) HAE-w/c=0.5; (b) LAE-w/c=0.5; (c) HAE-
w/c=0.4; and (d) LAE-w/c=0.4 ............................................................................. 40
Figure 4-7. Stress strain curves for 14 day confined compression tests at 1x strain
rate for different mixtures: (a) HAE-w/c=0.5; (b) LAE-w/c=0.5; (c) HAE-
w/c=0.4; and (d) LAE-w/c=0.4 ............................................................................. 41
Figure 4-8. Stress strain curves for 14 day confined compression tests at 10x
strain rate for different mixtures: (a) HAE-w/c=0.5; (b) LAE-w/c=0.5; (c)
HAE-w/c=0.4; and (d) LAE-w/c=0.4 ................................................................... 42
Figure 4-9. Stress strain curves for 28 day confined compression tests at 1x strain
rate for different mixtures: (a) HAE-w/c=0.5; (b) LAE-w/c=0.5; (c) HAE-
w/c=0.4; and (d) LAE-w/c=0.4 ............................................................................. 43
Figure 4-10. Stress strain curves for 28 day confined compression tests at 10x
strain rate for different mixtures: (a) HAE-w/c=0.5; (b) LAE-w/c=0.5; (c)
HAE-w/c=0.4; and (d) LAE-w/c=0.4 ................................................................... 44
Figure 4-11. Example of unloading and reloading behavior of polystyrene
concrete ................................................................................................................. 45
Figure 4-12. Example of linear-elastic phase behavior ............................................... 46
Figure 4-13. Comparison between crushed and uncrushed polystyrene samples ........ 47
Figure 4-14. Cross-section after confined compression test ........................................ 48
Figure 4-15. Average strain energy density for Series II confined 1x strain rate
tests ....................................................................................................................... 49

vii
Figure 4-16. Average strain energy density for Series II confined 10x strain rate
tests ....................................................................................................................... 49
Figure 4-17. Stress strain curves for 3 day confined compression tests at 10x
strain rate for 50% lightweight aggregate-50% polystyrene mixture ................... 52
Figure 4-18. Stress strain curves for 7 day confined compression tests at 10x
strain rate for 50% lightweight aggregate-50% polystyrene mixture ................... 53
Figure 4-19. Stress strain curves for 28 day confined compression tests at 10x
strain rate for 50% lightweight aggregate-50% polystyrene mixture ................... 54
Figure 4-20. Average strain energy density for Series III 10x strain rate tests ........... 55
Figure 4-21. Stress strain curves for 28 day unconfined compression tests at 10x
strain rate 50% lightweight aggregate-50% polystyrene mixture ......................... 56
Figure 4-22. Stress strain curves for 28 day confined compression tests at 10x
strain rate for 100% lightweight aggregate mixture ............................................. 57
Figure 4-23. Crushable concrete element protecting a vehicle anti-ram barrier .......... 58

viii
LIST OF TABLES
Table 2-1. Mix design details for mixtures with and without silica fume and steel
fibers (Chen and Liu 2004) ................................................................................... 15
Table 2-2. Mix design details for mixtures with varying amounts of silica fume
(Babu and Babu 2003) .......................................................................................... 18
Table 2-3. Mix proportions by weight for mixtures ranging from 40% to 60%
polystyrene (Bischoff et al. 1990) ........................................................................ 19
Table 2-4. Mix design details for foamed and polystyrene mixtures (Santagata,
Bassani, and Sacchi 2010) .................................................................................... 20
Table 3-1. Relative strain rates for confined compression tests .................................. 26
Table 3-2. Series I mix design details (per ft3 of concrete) ......................................... 29
Table 3-3. Series II mix design details (per ft3 of concrete) ........................................ 30
Table 3-4. Series III mix design details (per ft3 of concrete) ....................................... 33
Table 4-1. Summary of 7 day Series I testing .............................................................. 35
Table 4-2. Summary of 28 day Series I testing ............................................................ 36

ix
ACKNOWLEDGEMENTS
I would like express my gratitude to my advisors, Dr. Tong Qiu and Dr.
Aleksandra Radlińska for their unwavering support, guidance, patience, and friendship.
The positive atmosphere they have provided me during my career at Penn State has
allowed me to grow tremendously as a student, as an engineer, and, most importantly, as
a person. I would also like to thank my thesis committee members, Dr. Zoltan Rado and
Dr. Gordon Warn, for additional help and support on this project. Next, I would like to
give special thanks to Mr. Dan Fura, whose help in the lab was vital to the success of this
project. I must also acknowledge the financial support provided by the U.S. Department
of State.
I would also like to thank my research colleagues at Penn State. This research
project was a collaborative effort and I would not have been able to complete it without
the help of my fellow students, including Eddie O’Hare, Lynsey Reese, Sam Hoskins,
Tae Kwang Yoo, Jared Wright, Hamed Maraghechi, Alireza Farzampour, Ryan
Rudalavage, Jeffrey Gooch, and countless others.
Finally, I would like to thank my friends, family, and especially my parents, who I
could never thank enough. Their unconditional love and support has helped me more
than words can ever express.

1
Chapter 1
Objectives and Organization
1.1 Introduction
In recent years, terrorist attacks and security measures to stop or mitigate the
damage they cause have been widely discussed and researched. With raised national
security awareness due to these terroristic threats, more focus has been placed on safety
systems that can prevent the loss of life and structural damage as a result of impact and
blast loading. One of the primary areas of research on this topic has been perimeter
security systems. These systems rely on protective barriers to guard buildings and
structures from potential vehicular attacks. The primary goal of these blockades is to
stop a vehicle from ramming through the barrier and towards the building.
In order to accomplish this goal, a large amount of kinetic energy from the vehicle
must be absorbed by the barrier system. Typically, this energy is absorbed through
deformation and/or displacement of the barrier and the soil. Due to increased
requirements to minimize the barrier size, it has become more difficult to design a barrier
capable of stopping an attack vehicle. One additional method for dissipating some of a
vehicle’s high kinetic energy is to incorporate crushable concrete in the barrier design.
This material will deform during the impact, dissipating some of the vehicle’s energy and
reducing the load transmitted to the other parts of the barrier. A crushable concrete that

2
is capable of dissipating large amounts of energy could potentially reduce the size and
cost of a barrier without any loss of performance in stopping moving objects.
1.2 Research Objectives
The primary objectives of this research are to design a crushable concrete material
that maximizes the amount of energy dissipation and to characterize that material so that
its behavior can be accurately modeled. These objectives were reached by a series of
experimental tests performed on different crushable concrete mixtures.
1.3 Outline
This thesis is presented in five chapters. Chapter 1 includes background
information and research objectives. Chapter 2 presents a literature review of the
current state of research in crushable materials. Chapter 3 describes the testing
procedures performed in this study. Chapter 4 presents and analyzes the results of these
experiments and how they apply to energy dissipation in anti-ram barriers. Chapter 5
summarizes the findings of this study and provides suggestions for future research.
3
Chapter 2
Description of Crushable Materials
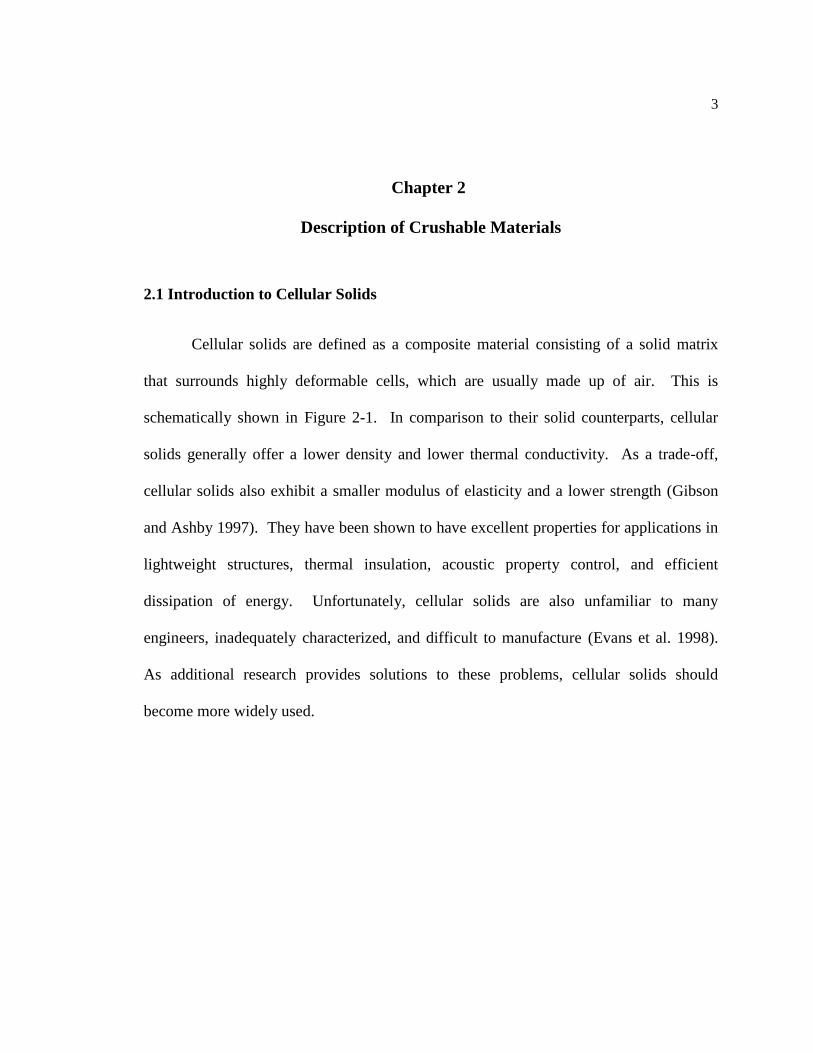
2.1 Introduction to Cellular Solids
Cellular solids are defined as a composite material consisting of a solid matrix
that surrounds highly deformable cells, which are usually made up of air. This is
schematically shown in Figure 2-1. In comparison to their solid counterparts, cellular
solids generally offer a lower density and lower thermal conductivity. As a trade-off,
cellular solids also exhibit a smaller modulus of elasticity and a lower strength (Gibson
and Ashby 1997). They have been shown to have excellent properties for applications in
lightweight structures, thermal insulation, acoustic property control, and efficient
dissipation of energy. Unfortunately, cellular solids are also unfamiliar to many
engineers, inadequately characterized, and difficult to manufacture (Evans et al. 1998).
As additional research provides solutions to these problems, cellular solids should
become more widely used.

4
Figure 2-1. Typical makeup of a cellular solid consisting of a solid matrix material
that surrounds the cellular material
Cellular solids can be classified geometrically based on the structure of their cells.
This geometric classification is determined by the number of dimensions required to
define the shape of a cell. Two-dimensional cellular solids are typically known as
honeycomb structures. While they can range in shape from triangles to shapes with many
sides, most practical honeycomb cells are hexagonal. Honeycomb structures are easier to
analyze (Ashby and Mehl Medalist 1983) and are utilized in many different applications,
ranging from packaging box walls (Wang et al. 2013) to heat sinks in LED lights (Ma et
al. 2010).
Honeycomb’s three-dimensional counterparts are called foams, and they have an
even wider array of uses (Gibson and Ashby 1997). For example, because of their low
density and damage resistance, foams are the primary material used in buoyancy devices,
such as lifejackets. With their low thermal conductivity and noise damping properties,
foams are also well suited for sound and thermal insulation in the walls of buildings.
Matrix Material
Cellular Material
5
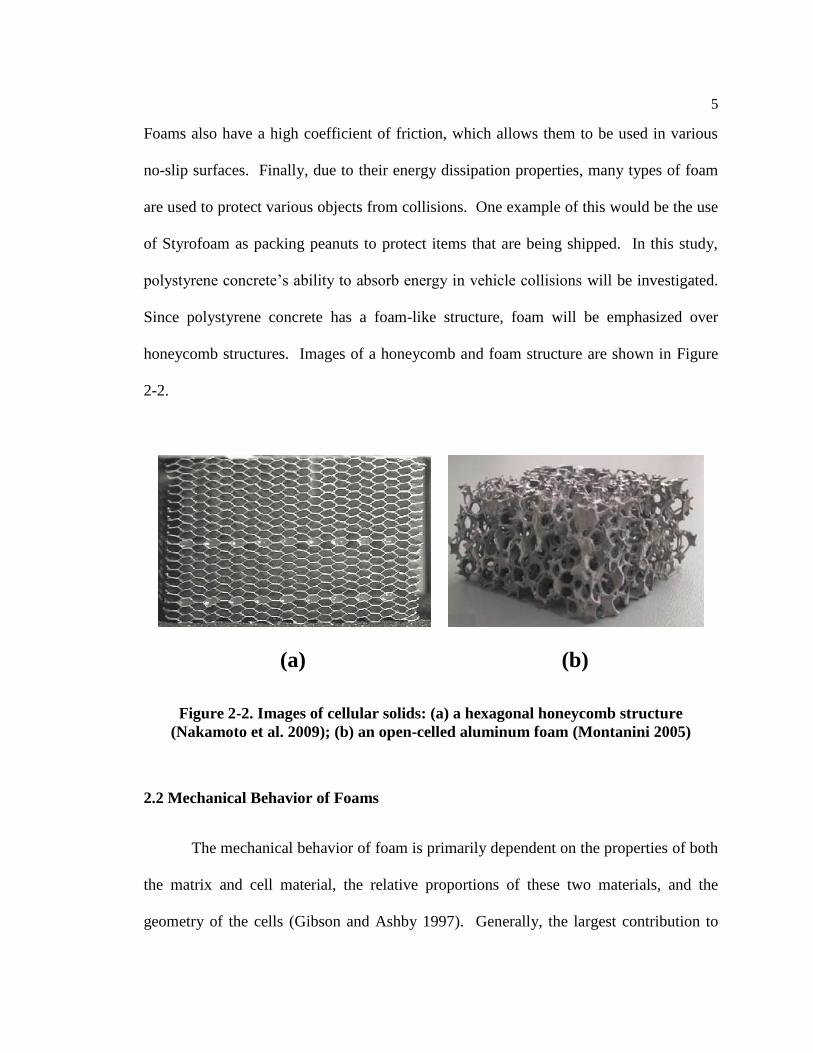
Foams also have a high coefficient of friction, which allows them to be used in various
no-slip surfaces. Finally, due to their energy dissipation properties, many types of foam
are used to protect various objects from collisions. One example of this would be the use
of Styrofoam as packing peanuts to protect items that are being shipped. In this study,
polystyrene concrete’s ability to absorb energy in vehicle collisions will be investigated.
Since polystyrene concrete has a foam-like structure, foam will be emphasized over
honeycomb structures. Images of a honeycomb and foam structure are shown in Figure
2-2.
Figure 2-2. Images of cellular solids: (a) a hexagonal honeycomb structure
(Nakamoto et al. 2009); (b) an open-celled aluminum foam (Montanini 2005)
2.2 Mechanical Behavior of Foams
The mechanical behavior of foam is primarily dependent on the properties of both
the matrix and cell material, the relative proportions of these two materials, and the
geometry of the cells (Gibson and Ashby 1997). Generally, the largest contribution to
(a) (b)

6
mechanical behavior comes from the characteristics of the component materials. For this
reason, the solid material typically provides a baseline set of properties that its
corresponding foam is compared to. For example, the properties of aluminum foam will
typically be compared to the properties of solid aluminum.
The next largest factor in determining the mechanical properties of a foam comes
from the relative proportions of the matrix and cell materials. This can be quantified
using two different parameters. The first parameter is relative density, which is defined
as the total density of the foam divided by the density of matrix material only. The
second parameter is cellular volume fraction, which is defined as the volume of the cells
divided by the total volume. Since this study will be dealing with composite materials
with multiple solid components (each with their own density), cellular volume fraction
will be used for simplicity. Assuming that the cellular material is weaker than the matrix
material, as cellular volume fraction is increased, the strength of the foam will be
diminished but its deformation potential will be enhanced (Gibson and Ashby 1997).
Finally, the third factor that will affect the mechanical behavior of a foam is the
geometry of the microstructure. There are many ways that microstructure could impact
behavior (Kraynik et al. 1991, Reinelt, and Princen 1991; Cowin 1985; Torquato 1991).
The shape of a cell can vary from a shape with few faces (such as a triangular prism) to a
shape with 20 (icosahedron) or more faces, to irregular or rounded shapes. They can also
consist of a variety of different shapes. The cells may be relatively small or large or even
a mix of both. Cells may also be packed neatly together or randomly distributed
throughout the matrix depending on their shape. These geometrical considerations can
have complex ramifications for the mechanical behavior of the foam. For example, if
7
cells are oriented in a particular direction, the foam may behave anisotropically (Gibson
and Ashby 1997).
Another important geometric property for cellular solids is cell connectedness.
The term open-celled indicates that the cells are connected, while closed-celled indicates
that each cell is isolated from the other cells. This distinction has obvious effects on
permeability through the material if the cell material is not solid, but will also affect its
stress-strain characteristics (Gibson and Ashby 1997). It is also important to consider
that many cellular solids will not be entirely open or closed celled, but instead a hybrid
with intermediate degree of cell connectedness.
Foams typically behave differently under compressive and tensile loading. For
the purposes of this study, the focus will be on foam’s behavior under a compressive
load. This process is shown in Figure 2-3. Generally, if a foam is loaded to a sufficiently
high strain, it will exhibit three different phases of behavior: a linear-elastic phase, a
crushing phase, and a densification phase (Gibson and Ashby 1997). First, at low strains,
the material will deform in a linear-elastic manner (assuming that the matrix material
itself is linear-elastic) (Warren and Kraynik 1987; Abd El-Sayed et al. 1979; Finnie and
Patel 1970). This is known as the linear-elastic phase. An increase in cellular volume
fraction will cause an increase in elastic modulus during the linear-elastic phase.
Eventually, the material will reach a stress high enough to cause the cell walls to
collapse. At this point, the material enters the crushing phase. During this phase, the
material is loaded to higher strains but the stress remains relatively constant. This stress
value is known as the material’s plateau stress (𝜎𝑃𝐿) and is also shown in Figure 2-3. As
the cellular volume fraction increases, the material’s plateau stress will decrease. The

8
behavior of the crushing phase is primarily a function of the type of cell wall failure that
occurs. The potential failure modes of the cell walls are non-linear elastic buckling,
plastic yielding, and brittle fracture. These failure modes are typically associated with a
specific type of material. For instance, elastic buckling is the general failure mode for
elastomer foams (Christensen 1986; Barma et al. 1978). Plastic yielding typically occurs
when the foam matrix is composed of a metal, such as aluminum or zinc (Thornton and
Magee 1975a, b). Ceramic foams, such as glass or cement-based foams, normally exhibit
a brittle fracture failure mode (Rusch 1970; Morgan et al. 1981; Maiti et al. 1984).
Figure 2-3. Idealized compression for a foam characterized by three phases: linear-
elastic phase, crushing phase, and densification phase
Str
ess
Strain
Linear-Elastic Phase
Crushing Phase
Densification Phase

9
Finally, after most of the cells have been fully crushed, the material will begin to
behave more like a solid and less like a foam. When the material reaches its densification
strain (𝜀𝐷), also shown in Figure 2-3, the cellular volume approaches zero and the
material enters the densification phase. At this point, the stress will begin to increase
much more rapidly with smaller increases in strain. An increase in cellular volume
fraction will cause an increase in the densification strain of the foam.
The strain rate of loading could also have an impact on a foam’s mechanical
behavior. In general, the faster the load is applied to the foam, the higher the foam’s
initial peak strength will be. This is primarily due to three main mechanisms. First,
micro-inertial effects on the cell wall will suppress its tendency to buckle (Klintworth
1989). In other words, there will not be enough time for the cell wall to deflect
horizontally, which is necessary for buckling to occur. Second, local densification will
occur in the regions near where the load is being applied. This denser area will be
capable of carrying a much higher load than the less dense, uncompacted areas of the
foam (Reid and Bell 1984). Finally, since crushing will tend to occur closer to the area of
loading, the local strain rate near the loading area will be much higher than the global,
nominal strain rate. This will further amplify the first two strain rate effects in the area of
loading.
A second phenomenon, local densification, creates another effect that may occur
if the loading rate is relatively high. If the internal cell walls are damaged from an initial
loading impulse, the cell geometry may change drastically from its initial condition
(Shim et al. 1990). These damaged cells may therefore show a decrease in load carrying

10
capacity as the foam is loaded to higher strain values. This strain-softening behavior may
reduce the plateau stress at higher strains in the crushing region of the stress-strain curve.
2.3 Foams as Energy Absorbing Materials
In general, the goal of an energy absorbing material is to reduce the peak load
exerted on the protected structure by stretching the amount of time it takes for the load to
be applied (i.e. a smaller load for a longer period of time). Since the peak force
transmitted to the structure is limited to the amount of load that the energy absorbing
material is resisting, the material should have a plateau stress that correlates with the
failure load of the protected structure (Bischoff et al. 1990). It ideally should also have a
high deformation potential so that the reduced load is transmitted to the structure for a
long period of time before the material reaches its densification phase.
A quantitative method for comparing energy dissipation potential is the material’s
strain energy density (Gibson and Ashby 1997). Strain energy density is defined as the
amount of energy dissipated by the material per unit volume. It is calculated by taking
the area under the stress strain curve. In this study, this integral will be evaluated from
0% strain to the material’s densification strain. As previously mentioned, after the
material has reached its densification strain the stress in the material will begin to
increase drastically. This increased stress will then be transmitted through to the
protected structure. Strain energy density 𝑈𝑜 at the densification strain is shown in
Figure 2-4 and can be calculated by equation 1:

11
𝑈𝑜 = ∫ 𝜎𝑑𝜀𝜀𝐷
0 (1)
where: 𝑈𝑜 = Strain Energy Density [psi]
𝜎 = Stress [psi]
𝜀 = Strain [%]
Figure 2-4. Strain energy density (𝑼𝒐) of a foam calculated from 0% strain to
densification strain (𝜺𝑫)
The definition of the densification strain assumes that the material will behave in
an ideal manner. In real-world scenarios, the boundary between the crushing phase and
the densification phase is not abrupt, but is instead a smooth transition. This makes it
difficult to pinpoint the strain at which all of the cells have been crushed. To overcome
Str
ess
Strain
12
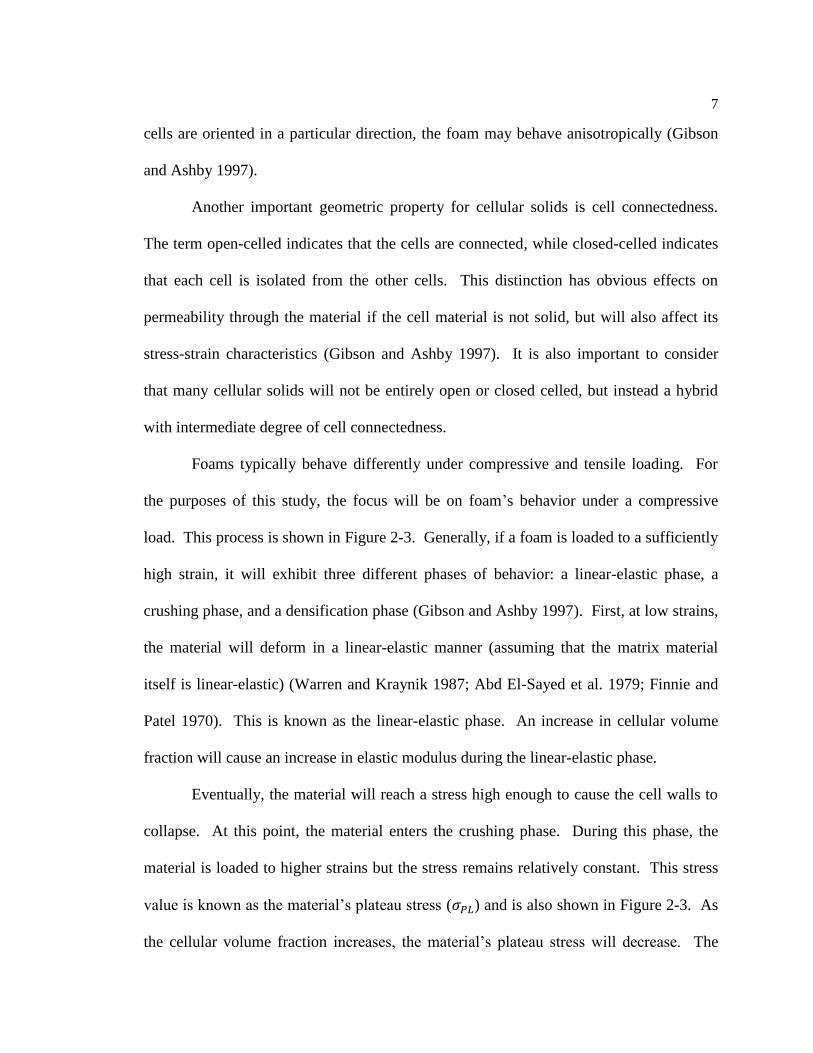
this issue, the tangent line method can be used to estimate the densification strain (Paul
and Ramamurty 2000). This graphical method defines the densification strain as the
intersection between the tangent line of the crushing phase and the tangent line of the
densification phase in the stress-strain curve, as shown in Figure 2-5.
Figure 2-5. Tangent line method for determining densification strain (Paul and
Ramamurty 2000)
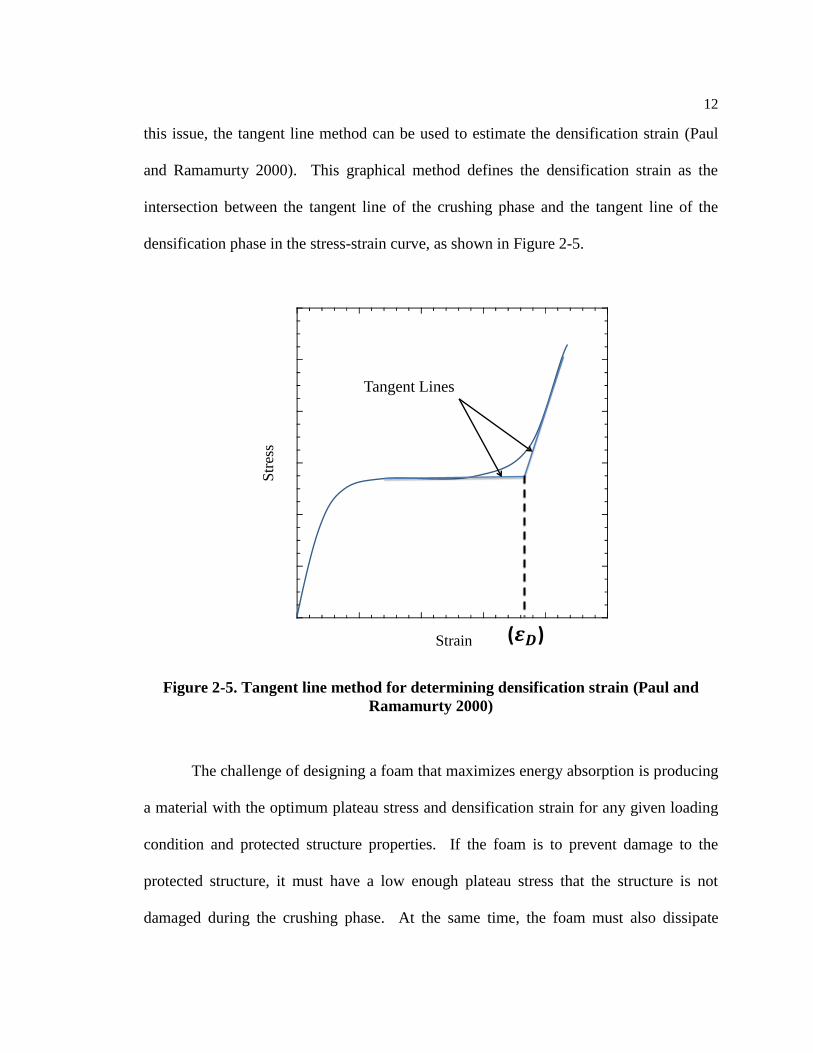
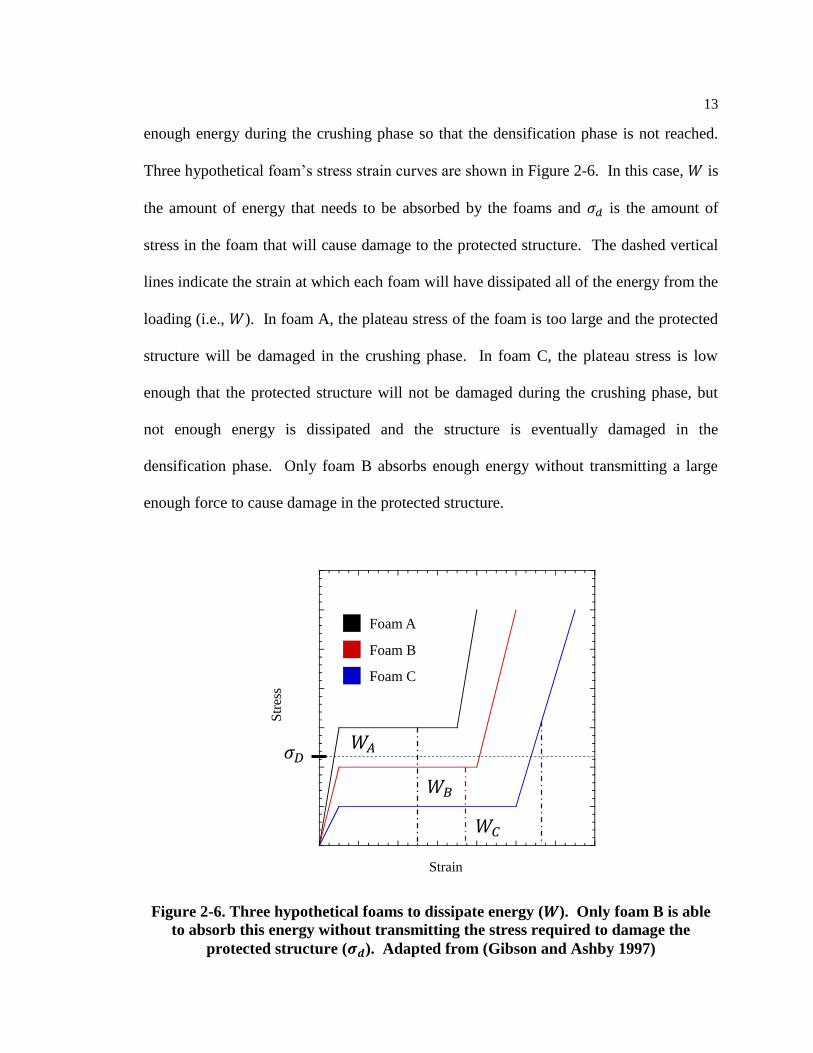
The challenge of designing a foam that maximizes energy absorption is producing
a material with the optimum plateau stress and densification strain for any given loading
condition and protected structure properties. If the foam is to prevent damage to the
protected structure, it must have a low enough plateau stress that the structure is not
damaged during the crushing phase. At the same time, the foam must also dissipate
Strain
Str
ess
Tangent Lines
( )
13
enough energy during the crushing phase so that the densification phase is not reached.
Three hypothetical foam’s stress strain curves are shown in Figure 2-6. In this case, 𝑊 is
the amount of energy that needs to be absorbed by the foams and 𝜎𝑑 is the amount of
stress in the foam that will cause damage to the protected structure. The dashed vertical
lines indicate the strain at which each foam will have dissipated all of the energy from the
loading (i.e., 𝑊). In foam A, the plateau stress of the foam is too large and the protected
structure will be damaged in the crushing phase. In foam C, the plateau stress is low
enough that the protected structure will not be damaged during the crushing phase, but
not enough energy is dissipated and the structure is eventually damaged in the
densification phase. Only foam B absorbs enough energy without transmitting a large
enough force to cause damage in the protected structure.
Figure 2-6. Three hypothetical foams to dissipate energy (𝑾). Only foam B is able
to absorb this energy without transmitting the stress required to damage the
protected structure (𝝈𝒅). Adapted from (Gibson and Ashby 1997)
Str
ess
Strain
Foam A
Foam B
Foam C

14
2.4 Polystyrene Concrete
For this study, multiple crushable concrete mix designs were tested where
expanded polystyrene was used as the primary cell material. Polystyrene is a synthetic
polymer made from the monomer styrene (“Polystyrene and Styrene Copolymers” 2014).
Over one billion kilograms of polystyrene are produced each year, making it one of the
most widely used plastics in the world. Like most foams, expanded polystyrene is a very
good thermal insulator, has a weak crushing strength, and has a low density (Baxter and
Jones 1972) (“Insulfoam Material Safety Data Sheet” 2005). Polystyrene is also very
inexpensive to produce. These properties make it an excellent cellular material in energy
absorbing crushable concrete.
There are also disadvantages to using polystyrene in crushable concrete that must
also be considered (Chen and Liu 2004). First, polystyrene is an extremely lightweight,
hydrophobic material. This creates problems with segregation because polystyrene will
have a tendency to float in the mix. This tendency is exacerbated if the concrete is
compacted using vibration techniques. Its hydrophobic nature also causes a reduction in
interfacial bond strength between the polystyrene aggregate and the cement matrix. The
addition of silica fume has shown a mild ability to increase the compressive strength of
polystyrene concrete (See Figure 2-7). It has been suggested in the aforementioned study
that this increase in strength is caused by the increased dispersion of polystyrene spheres
and increased bond strength between the polystyrene and the cement matrix as a result of
silica fume. The mix design details for this study are shown in Table 2-1.

15
Table 2-1. Mix design details for mixtures with and without silica fume and steel
fibers (Chen and Liu 2004)
Mix Cement Silica
Fume
Water Gravel Sand Polystyrene
(kg/m3)
Volume of Steel
Fiber
Superplasticizer
Number (kg/m3) (%) (kg/m3) (kg/m3) (kg/m3) Type A Type B Polystyrene
(%)
(kg/m3) (mL/kg of
cement)
1 472 -- 175 1133 620 -- -- -- -- 4
2 472 -- 175 710 392 1.75 0.74 25 -- 4.2
3 472 -- 175 710 392 1.75 0.74 25 70 4.2
4 472 -- 175 455 255 2.8 2.21 40 -- 4.5
5 472 -- 175 455 255 2.8 2.21 40 70 4.5
6 472 -- 175 201 118 3.85 3.03 55 -- 5.1
7 472 -- 175 201 118 3.85 3.03 55 70 5.1
8 425 10 175 1133 620 -- -- -- -- 4
9 425 10 175 710 392 1.75 0.74 25 -- 4.2
10 425 10 175 710 392 1.75 0.74 25 70 4.2
11 425 10 175 455 255 2.8 2.21 40 -- 4.5
12 425 10 175 455 255 2.8 2.21 40 70 4.5
13 425 10 175 201 118 3.85 3.03 55 -- 5.1
14 425 10 175 201 118 3.85 3.03 55 70 5.1
Figure 2-7. Compressive strength of samples with and without silica fume (Chen &
Liu 2004)
Shrinkage is another potential issue with working with polystyrene concrete.
Since the polystyrene aggregate has virtually no compressive strength, it offers little
resistance to the cement matrix’s tendency to shrink. Chen and Liu have shown that

16
shrinkage values can be as high as double the shrinkage for normal concrete with a
similar mix design (around 1100 and 600 microstrains respectively) (See Figure 2-8).
The addition of steel microfibers, however, can bring shrinkage in polystyrene concrete
back to normal concrete levels.
Figure 2-8. Effect of steel fibers on shrinkage (Chen & Liu 2004)
Perry et al. also made recommendations concerning polystyrene concrete (Perry et
al. 1991). First, they recommended that the polystyrene volume fraction should be less
than the loose bulk density of the polystyrene divided by the true density of the
polystyrene. In other words, the polystyrene aggregate should not be packed more
densely in the concrete mix than it is in a loose state. This ensures that each sphere is

17
adequately covered in cement paste and that the concrete is primarily close-celled, which
allows the concrete to behave more predictably.
In general, polystyrene concrete that is loaded to high strains behaves similarly to
other cellular foams (Santagata et al. 2010). First, the material exhibits a linear-elastic
phase that is similar to normal concrete. As the crushable concrete reaches its relatively
low plateau stress, the concrete begins to enter its crushing phase, where it continues
deforming at a relatively constant stress. The cells (either made of polystyrene cells or
air voids) begin to progressively collapse. During this progressive collapse, energy is
dissipated from two mechanisms: brittle fracture of the cement matrix and plastic
deformation of the polystyrene cells (Marco et al. 2012). Finally, as the last of the cells
finish collapsing, there is no more room for continued collapse. At this point, the
crushable concrete has reached its densification phase. In this phase, the concrete
behaves in a much stiffer manner and the load will increase rapidly (and linearly) with
increasing strain.
Failure mechanisms of the cell walls were also examined using finite element
analysis (Zhen, Bing, and Ning 2013). This analysis showed that cell walls typically fail
in shear in a brittle manner. It was found that latex additive and fiber reinforcement in
the cement matrix acted similarly to stirrup reinforcement in beams. These additions
increased shear resistance in the cell walls which allowed the material to resist a higher
plateau stress during the crushing phase.
A number of tests were also performed with several different polystyrene concrete
mix designs with silica fume (Babu and Babu 2003). The mix designs for these tests are
shown in Table 2-2. First, compressive strength tests were performed and showed that
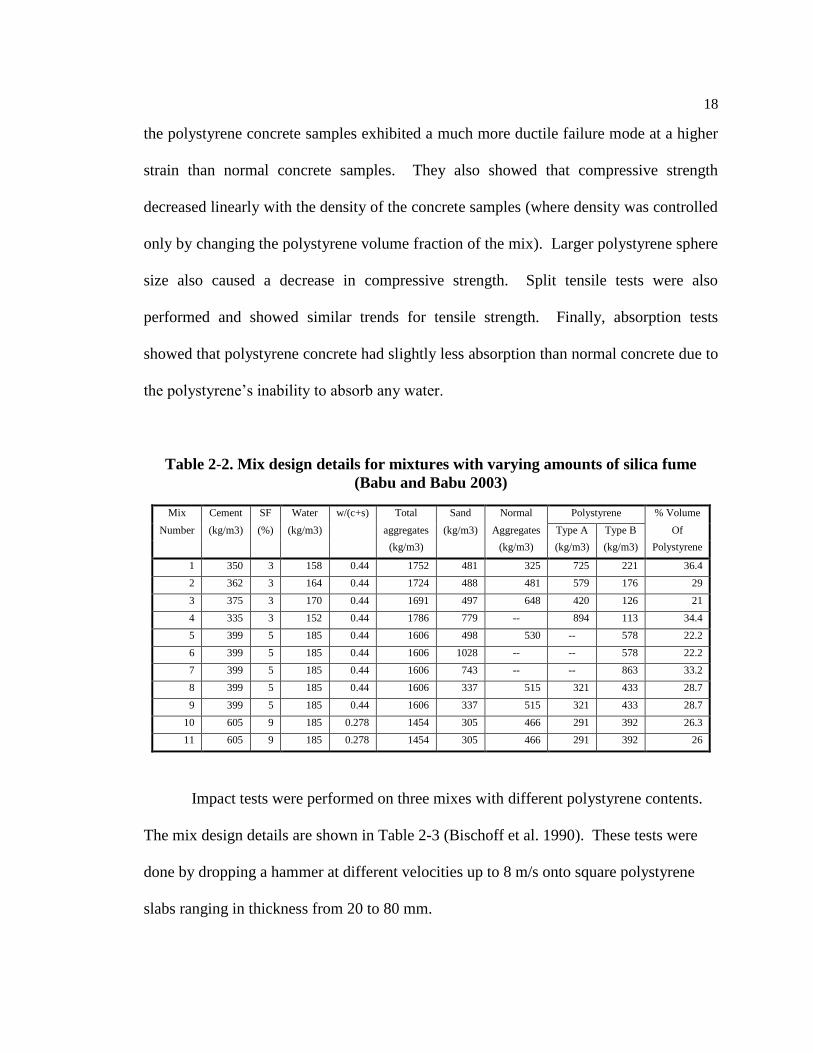
18
the polystyrene concrete samples exhibited a much more ductile failure mode at a higher
strain than normal concrete samples. They also showed that compressive strength
decreased linearly with the density of the concrete samples (where density was controlled
only by changing the polystyrene volume fraction of the mix). Larger polystyrene sphere
size also caused a decrease in compressive strength. Split tensile tests were also
performed and showed similar trends for tensile strength. Finally, absorption tests
showed that polystyrene concrete had slightly less absorption than normal concrete due to
the polystyrene’s inability to absorb any water.
Table 2-2. Mix design details for mixtures with varying amounts of silica fume
(Babu and Babu 2003)
Mix Cement SF Water w/(c+s) Total Sand Normal Polystyrene % Volume
Number (kg/m3) (%) (kg/m3) aggregates (kg/m3) Aggregates Type A Type B Of
(kg/m3) (kg/m3) (kg/m3) (kg/m3) Polystyrene
1 350 3 158 0.44 1752 481 325 725 221 36.4
2 362 3 164 0.44 1724 488 481 579 176 29
3 375 3 170 0.44 1691 497 648 420 126 21
4 335 3 152 0.44 1786 779 -- 894 113 34.4
5 399 5 185 0.44 1606 498 530 -- 578 22.2
6 399 5 185 0.44 1606 1028 -- -- 578 22.2
7 399 5 185 0.44 1606 743 -- -- 863 33.2
8 399 5 185 0.44 1606 337 515 321 433 28.7
9 399 5 185 0.44 1606 337 515 321 433 28.7
10 605 9 185 0.278 1454 305 466 291 392 26.3
11 605 9 185 0.278 1454 305 466 291 392 26
Impact tests were performed on three mixes with different polystyrene contents.
The mix design details are shown in Table 2-3 (Bischoff et al. 1990). These tests were
done by dropping a hammer at different velocities up to 8 m/s onto square polystyrene
slabs ranging in thickness from 20 to 80 mm.

19
Table 2-3. Mix proportions by weight for mixtures ranging from 40% to 60%
polystyrene (Bischoff et al. 1990)
P-40 P-50 P-60
Ordinary Portland cement 1.000 1.000 1.000
Polystyrene balls 0.015 0.023 0.034
Fine Sand (<1.2 mm dia.) 1.000 1.000 1.000
Total Water 0.350 0.350 0.350
Superplasticizer (%) -- 0.5-0.6 .7-1.2
Superplasticizer
(ml/kg of cement)
--
4.2-5.1
5.7-9.9
Polystyrene Content
by volume (%)
40 50 60
In these tests, as the polystyrene volume fraction in the mix design increased, the
hammer penetration depth and load time increased (See Figure 2-9). This caused a
reduction in peak force transmitted through the polystyrene concrete for the high
polystyrene volume fraction samples. This is an important trade-off that must be
considered for the barrier applications, as the amount of allowable deformation will be
limited in the barrier design by allowable vehicle penetration standards and overall size
of the barrier. Since the tested slab thicknesses were sufficient enough to prevent the
concrete from entering into the densification phase, the thickness of the slab had no effect
on the transmitted force for any of the samples.
Figure 2-9. Contact forces for 80 mm thick polystyrene concrete slabs with 40%,
50%, and 60% polystyrene volume fractions respectively (Bischoff et al. 1990)

20
Foamed concrete has also shown the potential to dissipate energy from impact
collisions. In foamed concrete, large air voids are created by mixing a foaming additive
into the cement slurry during mixing. After the concrete has set, the foam disappears and
air cells are left in the cement structure (Mindess et al. 2003). Like air entrained voids,
the air cells created by foaming additive are closed-celled. Like polystyrene concrete,
foamed concrete has a relatively low compressive strength (normally between 50 to 1000
psi) and density (normally between 20 to 80 lb/ft3).
A study was performed comparing foamed and polystyrene concrete’s ability to
absorb energy (Santagata et al. 2010). The mix designs for these tests are shown in Table
2-4.
Table 2-4. Mix design details for foamed and polystyrene mixtures (Santagata,
Bassani, and Sacchi 2010)
Component Foamed Mix Polystyrene Mix
Cement (Type II) 1.80 kg (3.97 lb.) 6 kg (13.22 lb.)
Lime filler 15 kg (33.04 lb.) 3 kg (6.61 lb.)
Sand 38.52 kg (84.85 lb.) --
Expanded Polystyrene -- 25 L (6.61 gal.)
Water 6.18 L (1.63 gal.) 4.5 L (1.19 gal.)
Foaming additive 51.27 g (1.81 oz.) --
Plasticizer -- 49.05 g (1.73 oz.)
First, a triaxial test was performed on both samples. Under sufficient confinement
(100 kPa or greater), the foamed concrete performed similarly to polystyrene concrete
(Figure 2-10). The foamed concrete showed a smaller peak compressive strength
compared to the similar polystyrene concrete. This is most likely due to the foamed
concrete containing air voids that are larger than the polystyrene spheres. Both materials,

21
however, showed good potential to continue to carry load at relatively high strains
(around 8%).
Figure 2-10. Triaxial results: (a) foamed concrete; (b) polystyrene concrete
(Santagata et al. 2010)
Impact tests were also performed in an unconfined setting. Under these
conditions, the polystyrene concrete dissipated much more energy than the foamed
concrete (Figure 2-11). This was due to large chunks of the foamed concrete being
projected sideways during the impact. This mass loss greatly reduced the strain energy
density of the foamed concrete compared to the polystyrene concrete. Foamed concrete
may perform better under a confined condition that would suppress the mass loss due to
projection of some of the concrete.
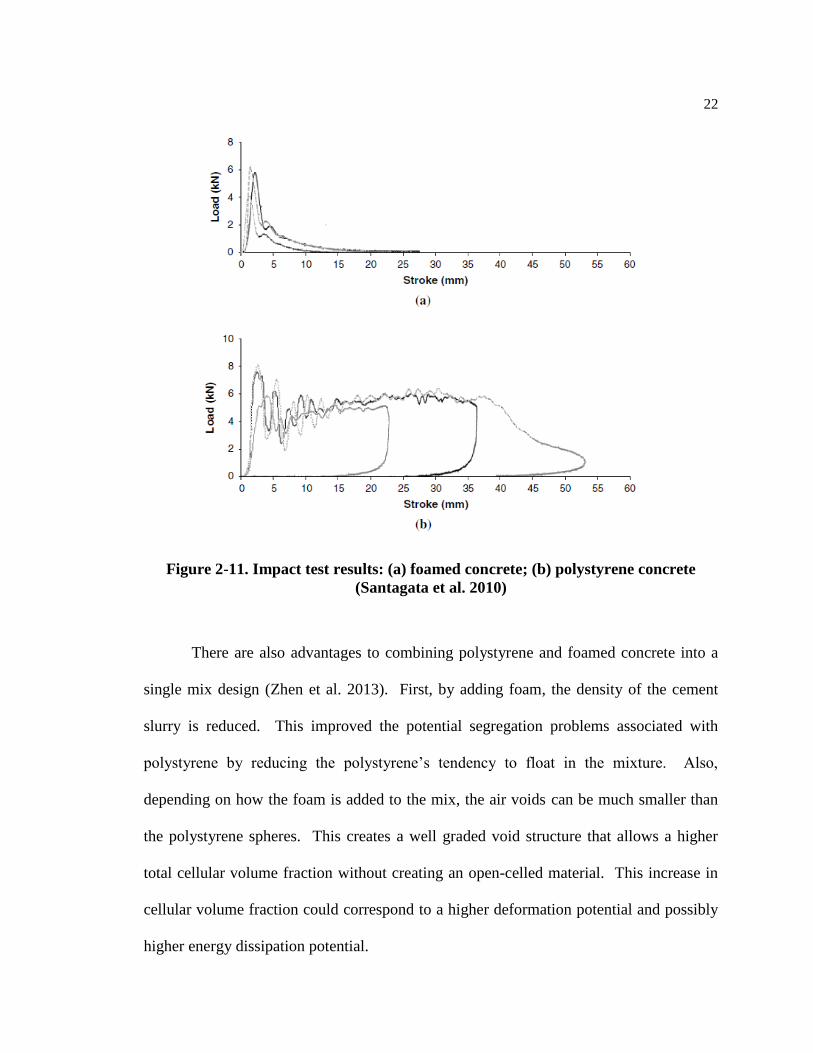
22
Figure 2-11. Impact test results: (a) foamed concrete; (b) polystyrene concrete
(Santagata et al. 2010)
There are also advantages to combining polystyrene and foamed concrete into a
single mix design (Zhen et al. 2013). First, by adding foam, the density of the cement
slurry is reduced. This improved the potential segregation problems associated with
polystyrene by reducing the polystyrene’s tendency to float in the mixture. Also,
depending on how the foam is added to the mix, the air voids can be much smaller than
the polystyrene spheres. This creates a well graded void structure that allows a higher
total cellular volume fraction without creating an open-celled material. This increase in
cellular volume fraction could correspond to a higher deformation potential and possibly
higher energy dissipation potential.

23
Chapter 3
Testing Procedures
3.1 Mixing Procedure
For this study, all concrete mixing was done in accordance with the ASTM C192
standard for making and curing concrete test specimens in the laboratory
(ASTM:C192/C192M-13 2013) with a few noted exceptions to accommodate mixing
with expanded polystyrene. First, the materials were placed in the mixing bowl and hand
mixed for approximately one minute. This was done to cover the polystyrene spheres in
cement paste so that they were not ejected from the bowl when the automatic mixer was
turned on. Then, as prescribed by ASTM, a paddle style mixer was used to mix the
concrete for three minutes, followed by a two minute break, and then three additional
minutes of mixing.
Plastic, watertight molds with a 4” diameter and 8” height were used to form the
test samples. Form oil was applied to the inside of each mold, so that the samples could
be demolded without damaging the concrete. Casting was done in two layers and the
concrete was consolidated by tamping each layer 25 times with a 3/8” tamping rod. The
sides of the mold were then lightly tapped 10 times to remove any additional large air
voids. Vibration methods were not used because of their tendency to cause the
polystyrene to rise to the top of the cylinder.
The cast samples were covered with plastic sheets and then placed in a humidity
controlled curing chamber with a constant temperature of 23°C and a relative humidity

24
greater than 98%. After 24 to 48 hours, the samples were demolded. This was done by
drilling a small hole in the bottom of the mold and pushing the concrete out with a
compressed air gun. The samples were then placed back in the curing chamber until their
test day.
3.2 Uniaxial Compression Testing
Uniaxial compression tests were performed to determine the stress-strain behavior
of polystyrene concrete in an unconfined setting. Each test was conducted in accordance
with the ASTM C39 standard for compressive strength for cylindrical concrete specimens
(ASTM:C39/C39M-12a 2012) with some modifications. A picture of the testing setup is
shown in Figure 3-1.
Figure 3-1. Testing setup for unconfined compression tests
25
During each test, the sample was placed between two parallel plates. The bottom
plate was held still, while the top plate moved downward at a constant displacement rate
to load the cylinder. Because the post peak-stress behavior was important to obtain, the
samples were loaded at a constant strain rate instead of the ASTM C39 standard constant
stress rate. Plastic sheets were placed on the top and bottom of the samples to minimize
friction. The force and displacement values were automatically recorded at a rate of 5
Hz. These values were then converted to stress and strain values.
3.3 Confined Compression Testing
Confined compression tests were also performed to determine the stress-strain
behavior of polystyrene concrete in a confined setting. The confined tests were
performed by placing the cylinders in a steel tube with a 4 1/16” inner diameter and ½”
wall thickness. This tube provided the stiff confinement needed to prevent shear failure
and maximize polystyrene cell crushing during the test. Oil lubricant was first applied to
the interior walls of the steel tube to reduce side friction. Then, the sample was loaded
into the steel tube. After that, a piston was placed on top of the sample to apply the load.
A two-dimensional cross section of the testing setup is shown in Figure 3-2.

26
Figure 3-2. Testing setup for confined compression tests
Tests were performed at different strain rates to determine the strain rate effects
on energy dissipation. For simplicity, the strain rates here are referred to using multiples
of the smaller strain rate (10x refers to 10 times faster than the 1x strain rate). The
maximum strain rate is limited by the capabilities of the loading machine for this study.
A faster strain rate is required to fully explore the behavior of crushable concrete under
the dynamic conditions that it will experience under vehicle loading in anti-ram barriers.
The relative strain rates and their actual strain rate counterparts are shown in Table 3-1.
Table 3-1. Relative strain rates for confined compression tests
Relative
Strain Rate
Actual Strain
Rate (in./in./s)
1x 3.48 X 10-4
10x 3.48 X 10-3
27
3.4 Crushable Concrete Mix Designs
The testing in this study was conducted in three series. Series I was a preliminary
round of tests conducted to compare the compressive strength properties of polystyrene
concrete to a control concrete with gravel aggregate. Series II aimed at determining the
effects of air entrainment, water-to-cement (w/c) ratio, strain rate of loading, and
confinement on the mechanical behavior of polystyrene concrete. Series III determined
the effect of reducing the cellular volume fraction through replacing some of the
polystyrene spheres with lightweight aggregate.
As previously mentioned, the polystyrene concrete’s properties will be much
more consistent and predictable if the cement paste fully covers each polystyrene sphere
creating a closed-cell foam. This can only be achieved if the polystyrene’s volume
fraction in the concrete mix design is less than the polystyrene’s bulk density percentage
when it is in a loose state. For the initial tests (Series I and II), a polystyrene volume
fraction of 40% was used. This value is well below the minimum bulk density of 52%
for uniform spheres that are loosely packed and ensured that the polystyrene concrete
behaved as a closed-cell foam. Photographs taken of samples that were cut open are
shown in Figure 3-3 and demonstrate that the samples are closed-cell foams.

28
Figure 3-3. Polystyrene concrete sample showing that a polystyrene volume fraction
of 40% is sufficient to produce a closed-cell foam
In Series I, unconfined compression tests were performed on a concrete mixture
with w/c=0.6 and 40% of polystyrene by volume. The polystyrene spheres were 5 mm in
diameter on average and had a unit weight of approximately 2.6 lb./ft3. A photograph of
the polystyrene spheres is shown in Figure 3-4.
Figure 3-4. Expanded polystyrene spheres
29
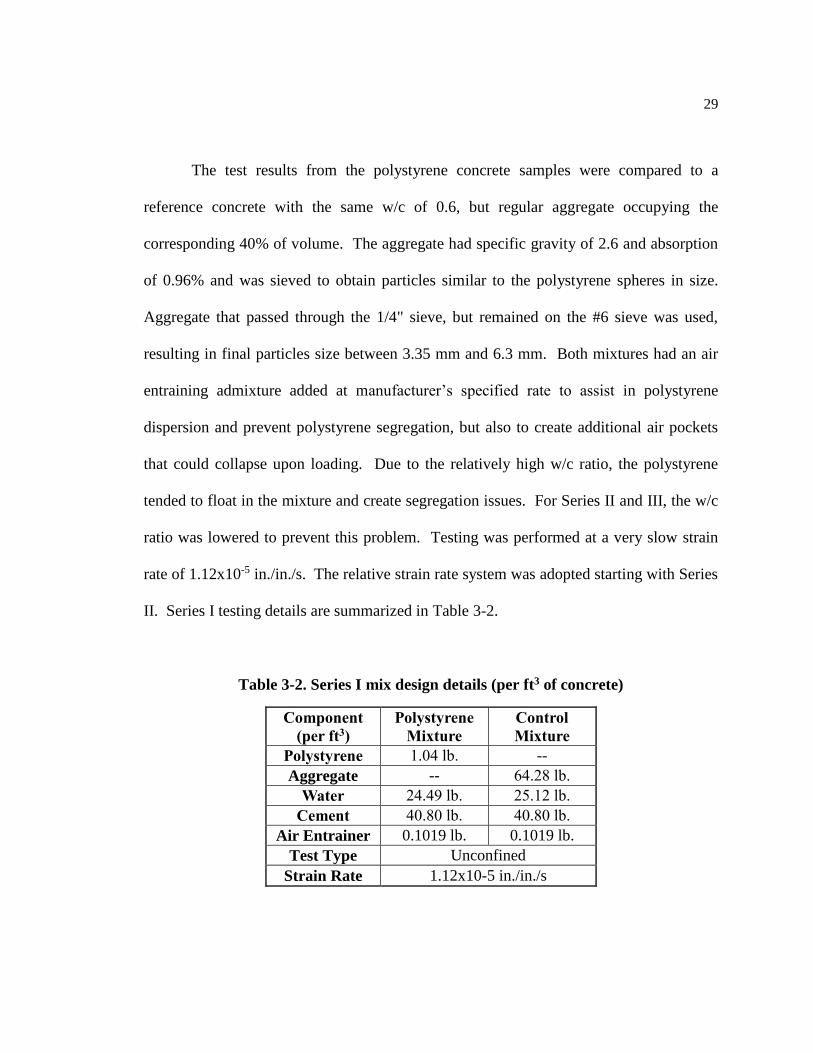
The test results from the polystyrene concrete samples were compared to a
reference concrete with the same w/c of 0.6, but regular aggregate occupying the
corresponding 40% of volume. The aggregate had specific gravity of 2.6 and absorption
of 0.96% and was sieved to obtain particles similar to the polystyrene spheres in size.
Aggregate that passed through the 1/4" sieve, but remained on the #6 sieve was used,
resulting in final particles size between 3.35 mm and 6.3 mm. Both mixtures had an air
entraining admixture added at manufacturer’s specified rate to assist in polystyrene
dispersion and prevent polystyrene segregation, but also to create additional air pockets
that could collapse upon loading. Due to the relatively high w/c ratio, the polystyrene
tended to float in the mixture and create segregation issues. For Series II and III, the w/c
ratio was lowered to prevent this problem. Testing was performed at a very slow strain
rate of 1.12x10⁻⁵ in./in./s. The relative strain rate system was adopted starting with Series
II. Series I testing details are summarized in Table 3-2.
Table 3-2. Series I mix design details (per ft3 of concrete)
Component
(per ft3)
Polystyrene
Mixture
Control
Mixture
Polystyrene 1.04 lb. --
Aggregate -- 64.28 lb.
Water 24.49 lb. 25.12 lb.
Cement 40.80 lb. 40.80 lb.
Air Entrainer 0.1019 lb. 0.1019 lb.
Test Type Unconfined
Strain Rate 1.12x10⁻⁵ in./in./s
30
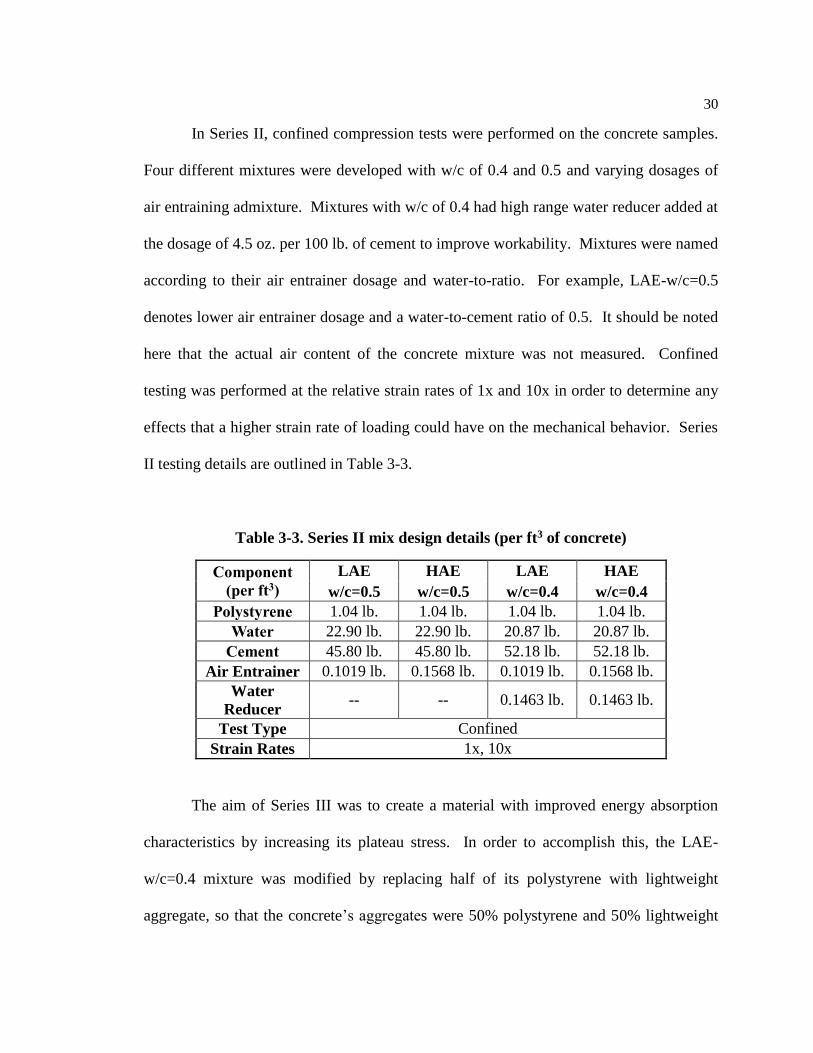
In Series II, confined compression tests were performed on the concrete samples.
Four different mixtures were developed with w/c of 0.4 and 0.5 and varying dosages of
air entraining admixture. Mixtures with w/c of 0.4 had high range water reducer added at
the dosage of 4.5 oz. per 100 lb. of cement to improve workability. Mixtures were named
according to their air entrainer dosage and water-to-ratio. For example, LAE-w/c=0.5
denotes lower air entrainer dosage and a water-to-cement ratio of 0.5. It should be noted
here that the actual air content of the concrete mixture was not measured. Confined
testing was performed at the relative strain rates of 1x and 10x in order to determine any
effects that a higher strain rate of loading could have on the mechanical behavior. Series
II testing details are outlined in Table 3-3.
Table 3-3. Series II mix design details (per ft3 of concrete)
Component
(per ft3)
LAE HAE LAE HAE
w/c=0.5 w/c=0.5 w/c=0.4 w/c=0.4
Polystyrene 1.04 lb. 1.04 lb. 1.04 lb. 1.04 lb.
Water 22.90 lb. 22.90 lb. 20.87 lb. 20.87 lb.
Cement 45.80 lb. 45.80 lb. 52.18 lb. 52.18 lb.
Air Entrainer 0.1019 lb. 0.1568 lb. 0.1019 lb. 0.1568 lb.
Water
Reducer -- -- 0.1463 lb. 0.1463 lb.
Test Type Confined
Strain Rates 1x, 10x
The aim of Series III was to create a material with improved energy absorption
characteristics by increasing its plateau stress. In order to accomplish this, the LAE-
w/c=0.4 mixture was modified by replacing half of its polystyrene with lightweight
aggregate, so that the concrete’s aggregates were 50% polystyrene and 50% lightweight

31
aggregate. This new mix design was known as the 50% lightweight aggregate-50%
polystyrene mixture. The combined aggregate content remained at 40% by volume. The
lightweight aggregate that was used was Stalite, which has a saturated surface dry (SSD)
absorption of 6% and an SSD specific gravity of 1.50 (“STALITE Lightweight
Aggregate Physical Characteristics for Structural Applications,”). A photograph of the
Stalite lightweight aggregate is shown in Figure 3-5. Due to the relative
incompressibility of the lightweight aggregate, the cellular volume fraction of the 50%
lightweight aggregate-50% polystyrene mixture was effectively reduced to 20%.
The lightweight aggregate was soaked in buckets of water for 48 hours before
mixing and then brought to SSD condition using paper towels to partially dry the
aggregate. By mixing with SSD lightweight aggregate, the concrete benefitted from the
advantages of internal curing (Castro et al. 2011; Klieger 1957). These benefits are due
to the absorbed water being released from the lightweight aggregate into the cement
skeleton after setting has completed. This additional water creates optimal curing
conditions deep inside the concrete sample where it is normally difficult to ensure that the
concrete has access to enough water to cure efficiently.

32
Figure 3-5. Stalite lightweight aggregate
Due to time constraints, Series III was done on an accelerated time frame. The
initial round of tests was done three days after mixing. For this reason, type III cement
and accelerating admixture were used in this mix design in order to hasten the curing
process in the concrete. In addition, polypropylene fibers were also added to this mixture
to increase the cell wall strength. Finally, the w/c ratio was set at 0.4 and the low air
entrainer dosage from Series II was used. The details for the Series III mix designs are
shown in Table 3-4.
For comparison, a second normal concrete mixture was also designed and tested
in Series III with total lightweight aggregate replacement of polystyrene. Due to lack of
deformability, only unconfined compression tests were performed on these samples.

33
Table 3-4. Series III mix design details (per ft3 of concrete)
Component
(per ft3)
50% Polystyrene-50% LWA
Mixture
100% LWA Control
Mixture
Polystyrene 0.52 lb. --
Lightweight Aggregate 18.72 lb. 37.44 lb.
Water 20.87 lb. 20.87 lb.
Cement 52.18 lb. 52.18 lb.
AE admixture 0.1019 lb. 0.1019 lb.
Water Reducer 0.1463 lb. 0.1463 lb.
Accelerating Admixture 0.6013 lb. 0.6013 lb.
Polypropylene Fiber 0.0556 lb. 0.0556 lb.
Test Type Confined and Unconfined Unconfined Only
Strain Rate 10x

34
Chapter 4
Experimental Results and Discussion
4.1 Series I Testing
During Series I testing, the goal was to determine the difference in behavior
between a normal aggregate (control) concrete and a crushable concrete that incorporated
expanded polystyrene spheres as a total aggregate replacement. A control mix design and
a polystyrene mix design were formulated and tested to achieve this goal. The mix
design details are given in Chapter 3. Uniaxial compression tests were performed on
these mixtures at 7 and 28 days after mixing.
For the 7 day tests, a machine with a loading limit of 11 kips was used to load the
samples and record the force-displacement data. This was sufficient to load the 4” x 8”
polystyrene mixture cylinders to failure, but insufficient for the 4” x 8” control mixture
cylinders. Therefore, 2” x 2” control mixture cubes were also prepared and tested. Two
out of three of the control mixture cubes were able to be loaded to failure using the 11 kip
machine (sample Con-2 was too strong to be loaded to failure without potentially
damaging the machine). The 4” x 8” control mixture cylinders and sample Con-2 were
tested using a compressive strength machine, but since the machine is incapable of
recording force-displacement data, only the peak compressive strength was determined.
The seven day tests are summarized in Table 4-1. The stress-strain curves for the 7 day
tests are shown in Figure 4-1.

35
Table 4-1. Summary of 7 day Series I testing
Mixture
Sample
Number Sample Shape Peak Compressive
Stress (psi) Data Collected
Polystyrene Poly-1 4”x 8” Cylinder 226 Stress-Strain, Peak Stress
Polystyrene Poly-2 4”x 8” Cylinder 148 Stress-Strain, Peak Stress
Polystyrene Poly-3 4”x 8” Cylinder 132 Stress-Strain, Peak Stress
Control Con-1 2”x 2” Cube 1928 Stress-Strain, Peak Stress
Control Con-2 2”x 2” Cube 2525 Stress-Strain, Peak Stress
Control Con-3 2”x 2” Cube 2503 Stress-Strain, Peak Stress
Control Con-4 4”x 8” Cylinder 2747 Peak Stress Only
Control Con-5 4”x 8” Cylinder 2597 Peak Stress Only
Control Con-6 4”x 8” Cylinder 2287 Peak Stress Only
Figure 4-1. 7 day unconfined stress-strain curves: (a) 2” x 2” control mixture cubes;
(b) 4” x 8” polystyrene mixture cylinders
For the 28 day tests, a machine with a 220 kip loading limit was used for the
control samples. This eliminated the need to use 2” x 2” cubes, so 4” x 8” cylinders were
used exclusively. Details for the 28 day tests are shown in Table 4-2. The machine was
(a) (b)
0
500
1000
1500
2000
2500
3000
3500
0% 1% 2% 3% 4% 5%
7 Day Unconfined
(Control Samples)
Con-1Con-2Con-3
Str
ess
(psi
)
Strain
0
50
100
150
200
250
0% 2% 4% 6% 8% 10%
7 Day Unconfined
(Polystyrene Samples)
Poly-1Poly-2Poly-3
Str
ess
(psi
)
Strain
36
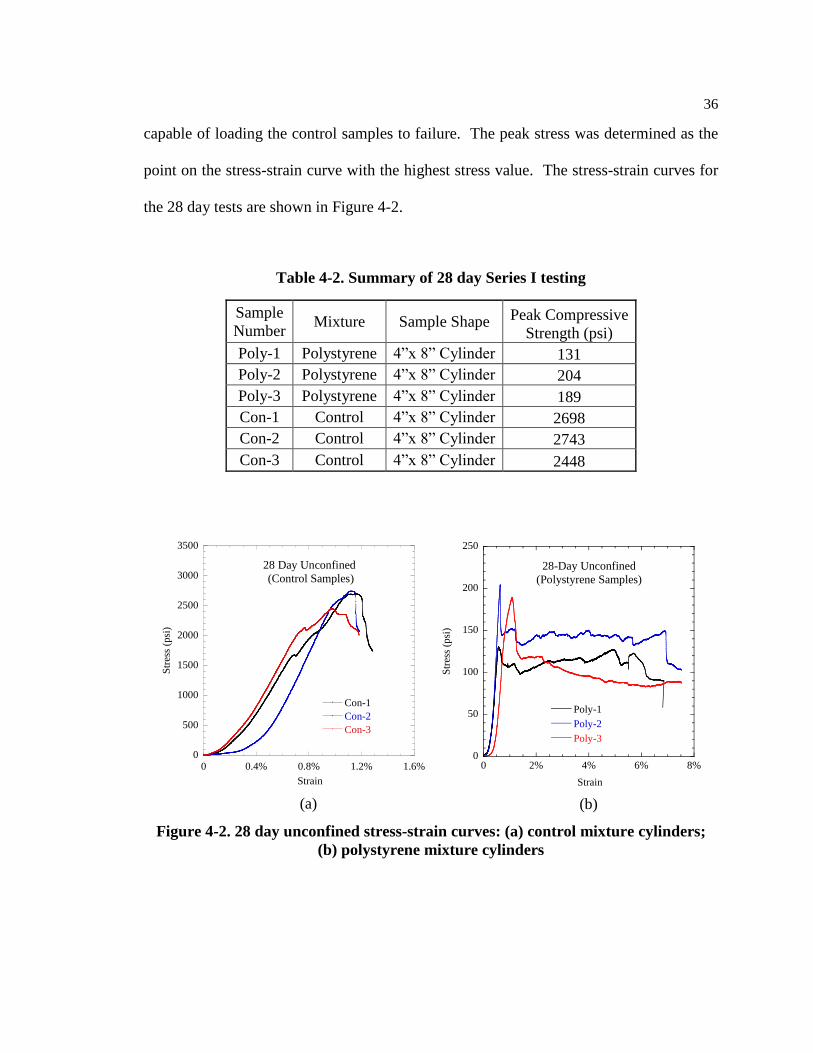
capable of loading the control samples to failure. The peak stress was determined as the
point on the stress-strain curve with the highest stress value. The stress-strain curves for
the 28 day tests are shown in Figure 4-2.
Table 4-2. Summary of 28 day Series I testing
Sample
Number Mixture Sample Shape Peak Compressive
Strength (psi)
Poly-1 Polystyrene 4”x 8” Cylinder 131
Poly-2 Polystyrene 4”x 8” Cylinder 204
Poly-3 Polystyrene 4”x 8” Cylinder 189
Con-1 Control 4”x 8” Cylinder 2698
Con-2 Control 4”x 8” Cylinder 2743
Con-3 Control 4”x 8” Cylinder 2448
Figure 4-2. 28 day unconfined stress-strain curves: (a) control mixture cylinders;
(b) polystyrene mixture cylinders
(a) (b)
0
500
1000
1500
2000
2500
3000
3500
0 0.4% 0.8% 1.2% 1.6%
28 Day Unconfined
(Control Samples)
Con-1
Con-2
Con-3
Str
ess
(psi
)
Strain
0
50
100
150
200
250
0 2% 4% 6% 8%
28-Day Unconfined
(Polystyrene Samples)
Poly-1
Poly-2
Poly-3
Str
ess
(psi
)
Strain

37
As expected, the control samples reached their peak compressive stress at a
relatively low strain and then experienced a brittle shear failure. After reaching the peak
load, the load carrying capacity of the sample dropped quickly. By contrast, the
polystyrene samples had a much lower peak compressive strength. However, after
reaching their peak stress, the samples were able to resist a significant percentage of their
peak strength at strains as high as 7% in the 28 day tests, before experiencing a sharp
reduction in load carrying capability. Eventually, the polystyrene cylinders failed in
shear, as shown in Figure 4-3.
Figure 4-3. Polystyrene mixture sample failing in shear
After completion of the compressive strength tests, the samples were cut open
with a wet saw and examined. Figure 4-4 shows a photograph of a cross-section of a
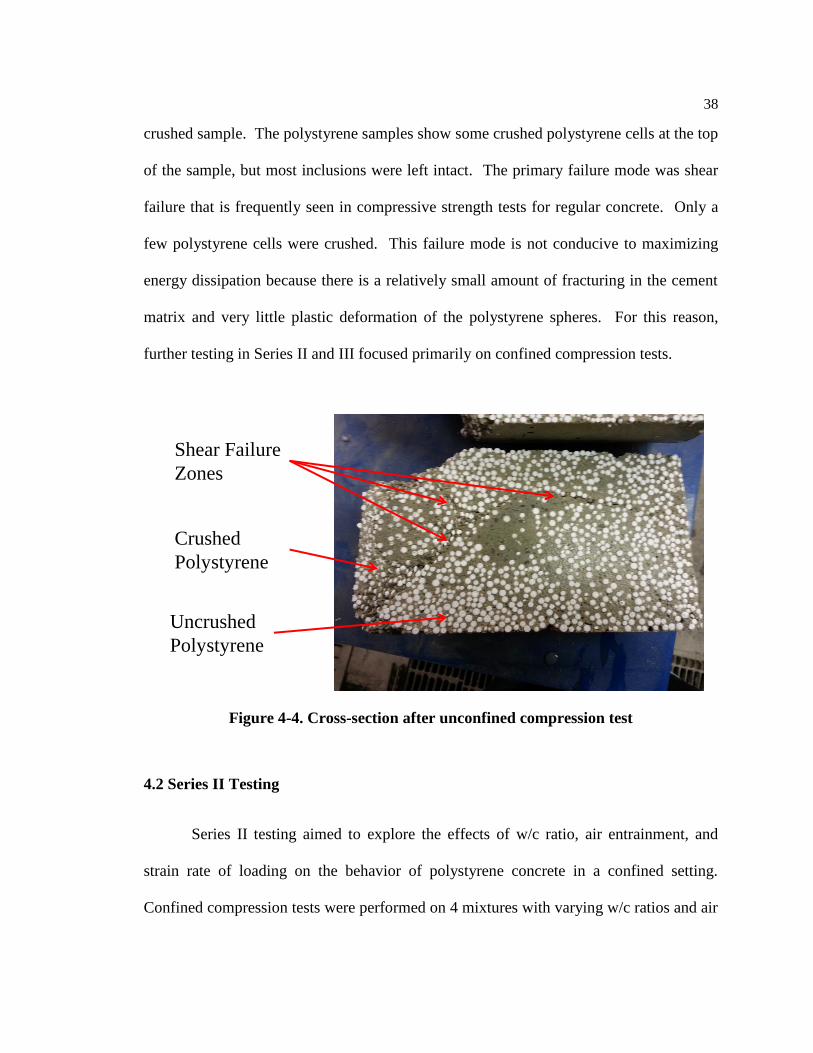
38
crushed sample. The polystyrene samples show some crushed polystyrene cells at the top
of the sample, but most inclusions were left intact. The primary failure mode was shear
failure that is frequently seen in compressive strength tests for regular concrete. Only a
few polystyrene cells were crushed. This failure mode is not conducive to maximizing
energy dissipation because there is a relatively small amount of fracturing in the cement
matrix and very little plastic deformation of the polystyrene spheres. For this reason,
further testing in Series II and III focused primarily on confined compression tests.
Figure 4-4. Cross-section after unconfined compression test
4.2 Series II Testing
Series II testing aimed to explore the effects of w/c ratio, air entrainment, and
strain rate of loading on the behavior of polystyrene concrete in a confined setting.
Confined compression tests were performed on 4 mixtures with varying w/c ratios and air
Shear Failure
Zones
Crushed
Polystyrene
Uncrushed
Polystyrene

39
entrainer dosages at 7, 14, and 28 days after mixing. The test procedure and mix design
details for these tests are given in Chapter 3.
During the 7 day confined compression tests, the stress-strain curves for both
strain rates were recorded and are shown in Figure 4-5 for the 1x strain rate tests and
Figure 4-6 for the 10x strain rate tests.
Figure 4-5. Stress strain curves for 7 day confined compression tests at 1x strain
rate for different mixtures: (a) HAE-w/c=0.5; (b) LAE-w/c=0.5; (c) HAE-w/c=0.4;
and (d) LAE-w/c=0.4
(a) (b)
(c) (d)
0
4000
8000
12000
16000
0% 10% 20% 30% 40% 50% 60% 70%
7 Day Confined
1x Strain Rate
HAE-w/c=0.5 Samples
Sample 1Sample 2Sample 3Sample 4
Str
ess
(psi
)
Strain
0
4000
8000
12000
16000
0% 10% 20% 30% 40% 50% 60% 70%
7 Day Confined
1x Strain Rate
LAE-w/c=0.5 Samples
Sample 1Sample 2Sample 3Sample 4
Str
ess
(psi
)
Strain
0
4000
8000
12000
16000
0% 10% 20% 30% 40% 50% 60%
7 Day Confined
1x Strain Rate
HAE-w/c=0.4 Samples
Sample 1Sample 2
Str
ess
(psi
)
Strain
0
4000
8000
12000
16000
0% 10% 20% 30% 40% 50% 60% 70%
7 Day Confined
1x Strain Rate
LAE-w/c=0.4 Samples
Sample 1Sample 2
Str
ess
(psi
)
Strain
40
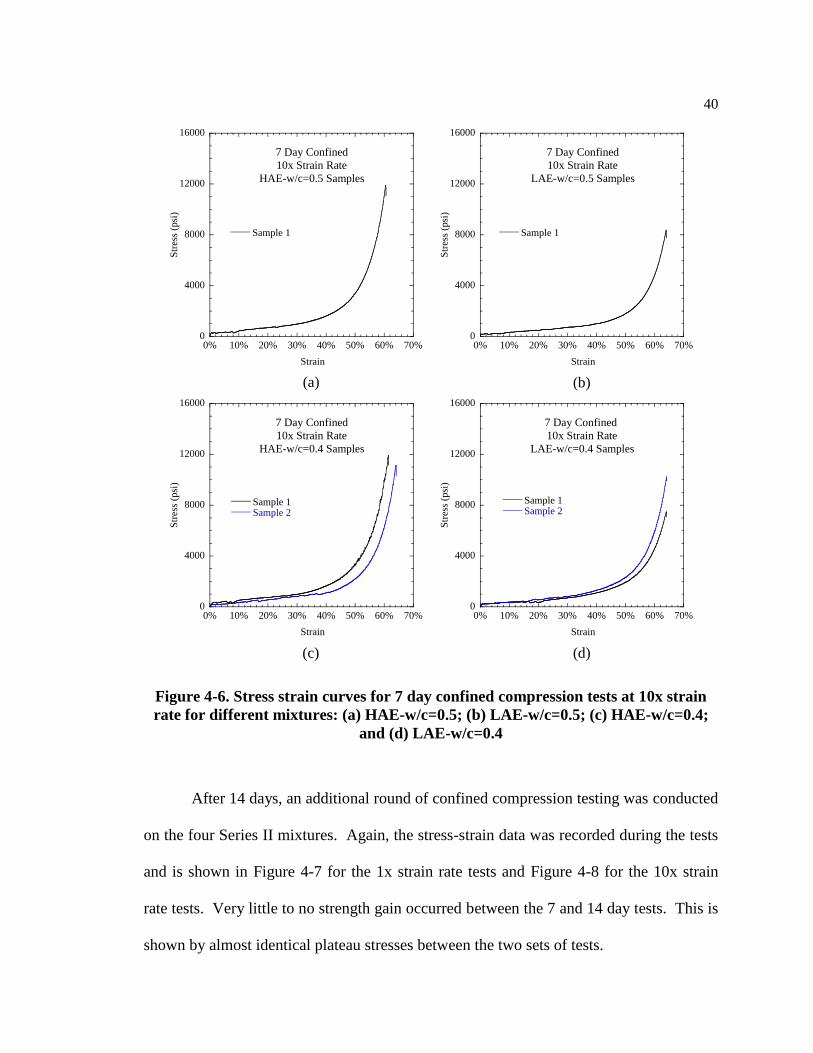
Figure 4-6. Stress strain curves for 7 day confined compression tests at 10x strain
rate for different mixtures: (a) HAE-w/c=0.5; (b) LAE-w/c=0.5; (c) HAE-w/c=0.4;
and (d) LAE-w/c=0.4
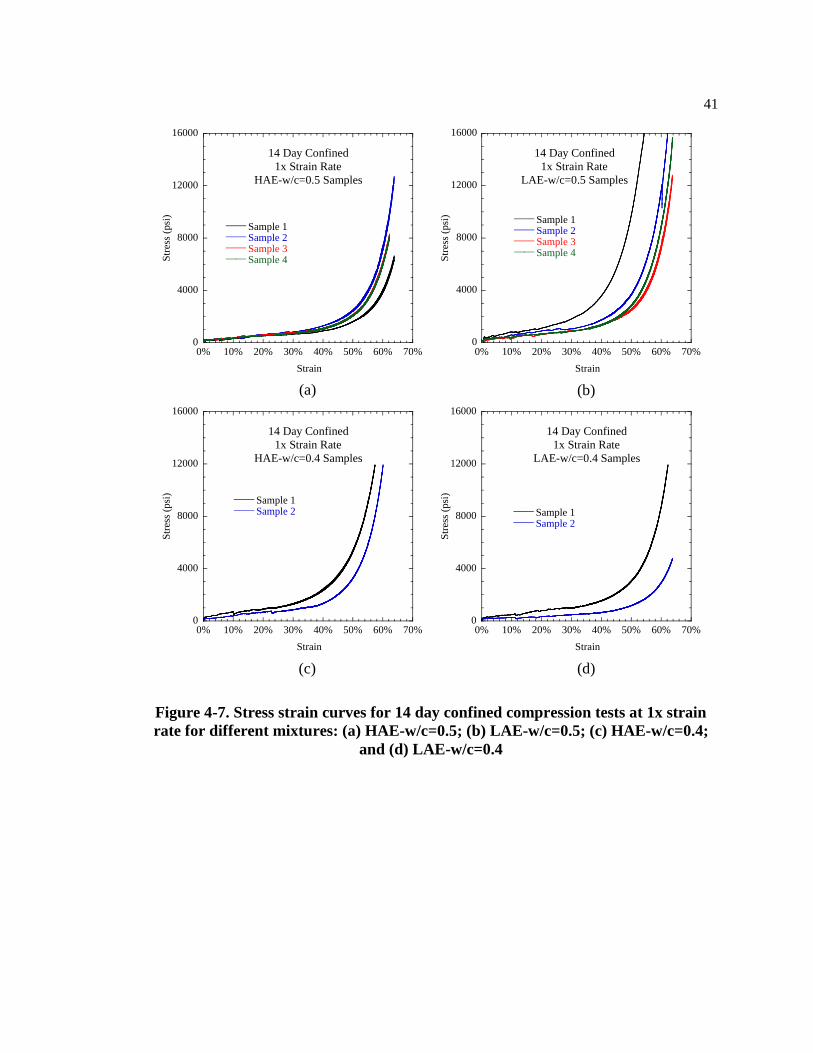
After 14 days, an additional round of confined compression testing was conducted
on the four Series II mixtures. Again, the stress-strain data was recorded during the tests
and is shown in Figure 4-7 for the 1x strain rate tests and Figure 4-8 for the 10x strain
rate tests. Very little to no strength gain occurred between the 7 and 14 day tests. This is
shown by almost identical plateau stresses between the two sets of tests.
(a) (b)
(c) (d)
0
4000
8000
12000
16000
0% 10% 20% 30% 40% 50% 60% 70%
7 Day Confined
10x Strain Rate
HAE-w/c=0.5 Samples
Sample 1
Str
ess
(psi
)
Strain
0
4000
8000
12000
16000
0% 10% 20% 30% 40% 50% 60% 70%
7 Day Confined
10x Strain Rate
LAE-w/c=0.5 Samples
Sample 1
Str
ess
(psi
)
Strain
0
4000
8000
12000
16000
0% 10% 20% 30% 40% 50% 60% 70%
7 Day Confined
10x Strain Rate
HAE-w/c=0.4 Samples
Sample 1Sample 2
Str
ess
(psi
)
Strain
0
4000
8000
12000
16000
0% 10% 20% 30% 40% 50% 60% 70%
7 Day Confined
10x Strain Rate
LAE-w/c=0.4 Samples
Sample 1Sample 2
Str
ess
(psi
)
Strain
41
Figure 4-7. Stress strain curves for 14 day confined compression tests at 1x strain
rate for different mixtures: (a) HAE-w/c=0.5; (b) LAE-w/c=0.5; (c) HAE-w/c=0.4;
and (d) LAE-w/c=0.4
(a) (b)
(c) (d)
0
4000
8000
12000
16000
0% 10% 20% 30% 40% 50% 60% 70%
14 Day Confined
1x Strain Rate
HAE-w/c=0.5 Samples
Sample 1Sample 2Sample 3Sample 4S
tres
s (p
si)
Strain
0
4000
8000
12000
16000
0% 10% 20% 30% 40% 50% 60% 70%
14 Day Confined
1x Strain Rate
LAE-w/c=0.5 Samples
Sample 1Sample 2Sample 3Sample 4
Strain
Str
ess
(psi
)
0
4000
8000
12000
16000
0% 10% 20% 30% 40% 50% 60% 70%
14 Day Confined
1x Strain Rate
HAE-w/c=0.4 Samples
Sample 1Sample 2
Str
ess
(psi
)
Strain
0
4000
8000
12000
16000
0% 10% 20% 30% 40% 50% 60% 70%
14 Day Confined
1x Strain Rate
LAE-w/c=0.4 Samples
Sample 1Sample 2
Strain
Str
ess
(psi
)
42
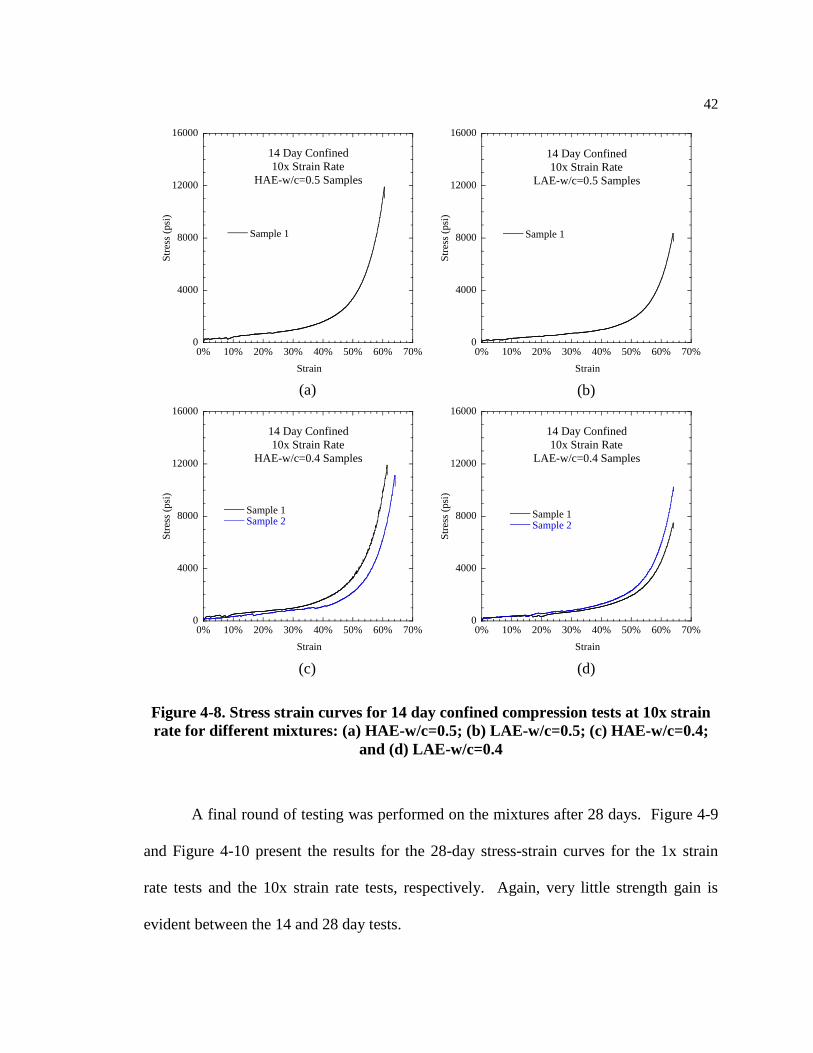
Figure 4-8. Stress strain curves for 14 day confined compression tests at 10x strain
rate for different mixtures: (a) HAE-w/c=0.5; (b) LAE-w/c=0.5; (c) HAE-w/c=0.4;
and (d) LAE-w/c=0.4
A final round of testing was performed on the mixtures after 28 days. Figure 4-9
and Figure 4-10 present the results for the 28-day stress-strain curves for the 1x strain
rate tests and the 10x strain rate tests, respectively. Again, very little strength gain is
evident between the 14 and 28 day tests.
(a) (b)
(c) (d)
0
4000
8000
12000
16000
0% 10% 20% 30% 40% 50% 60% 70%
14 Day Confined
10x Strain Rate
HAE-w/c=0.5 Samples
Sample 1
Str
ess
(psi
)
Strain
0
4000
8000
12000
16000
0% 10% 20% 30% 40% 50% 60% 70%
14 Day Confined
10x Strain Rate
LAE-w/c=0.5 Samples
Sample 1
Strain
Str
ess
(psi
)
0
4000
8000
12000
16000
0% 10% 20% 30% 40% 50% 60% 70%
14 Day Confined
10x Strain Rate
HAE-w/c=0.4 Samples
Sample 1Sample 2
Str
ess
(psi
)
Strain
0
4000
8000
12000
16000
0% 10% 20% 30% 40% 50% 60% 70%
14 Day Confined
10x Strain Rate
LAE-w/c=0.4 Samples
Sample 1Sample 2
Str
ess
(psi
)
Strain

43
Figure 4-9. Stress strain curves for 28 day confined compression tests at 1x strain
rate for different mixtures: (a) HAE-w/c=0.5; (b) LAE-w/c=0.5; (c) HAE-w/c=0.4;
and (d) LAE-w/c=0.4
(a) (b)
(c) (d)
0
4000
8000
12000
16000
0 10% 20% 30% 40% 50% 60% 70%
28 Day Confined
1x Strain Rate
HAE-w/c=0.5 Samples
Sample 1Sample 2Sample 3Sample 4
Str
ess
(psi
)
Strain
0
4000
8000
12000
16000
0 10% 20% 30% 40% 50% 60% 70%
28 Day Confined
1x Strain Rate
LAE-w/c=0.5 Samples
Sample 1Sample 2Sample 3Sample 4
Str
ess
(psi
)
Strain
0
4000
8000
12000
16000
0 10% 20% 30% 40% 50% 60% 70%
28 Day Confined
1x Strain Rate
HAE-w/c=0.4 Samples
Sample 1Sample 2
Str
ess
(psi
)
Strain
0
4000
8000
12000
16000
0 10% 20% 30% 40% 50% 60% 70%
28 Day Confined
1x Strain Rate
LAE-w/c=0.4 Samples
Sample 1Sample 2
Str
ess
(psi
)
Strain

44
Figure 4-10. Stress strain curves for 28 day confined compression tests at 10x strain
rate for different mixtures: (a) HAE-w/c=0.5; (b) LAE-w/c=0.5; (c) HAE-w/c=0.4;
and (d) LAE-w/c=0.4
Unloading and reloading of the sample was done one time after every inch of the
deformation for the 1x strain rate, high w/c ratio samples only. A zoomed in portion of
the stress-strain curve that displays the unloading and reloading behavior is shown in
Figure 4-11. This figure shows the characteristic unload/reload loop that is typical for
normal concrete (Sakai and Kawashima 2006). Very little elastic recovery occurred for
(a) (b)
(c) (d)
0
4000
8000
12000
16000
0 10% 20% 30% 40% 50% 60% 70%
28 Day Confined
10x Strain Rate
HAE-w/c=0.5 Samples
Sample 1
Str
ess
(psi
)
Strain
0
4000
8000
12000
16000
0 10% 20% 30% 40% 50% 60% 70%
28 Day Confined
10x Strain Rate
LAE-w/c=0.5 Sample
Sample 1
Str
ess
(psi
)
Strain
0
4000
8000
12000
16000
0 10% 20% 30% 40% 50% 60% 70%
28 Day Confined
10x Strain Rate
(HAE-w/c=0.4 Sample)
Sample 1Sample 2
Str
ess
(psi
)
Strain
0
4000
8000
12000
16000
0 10% 20% 30% 40% 50% 60% 70%
28 Day Confined
10x Strain Rate
LAE-w/c=0.4 Sample
Sample 1Sample 2
Str
ess
(psi
)
Strain

45
any of the unloading and reloading cycles. This demonstrates that the energy absorbed
by the polystyrene concrete is almost entirely dissipated and only a very small amount is
stored.
0
2000
4000
6000
8000
48% 49% 50% 51% 52%
Unload-Reload Example
Str
ess
(psi
)
Strain
Figure 4-11. Example of unloading and reloading behavior of polystyrene concrete
All of the mix designs in Series II showed similar qualitative stress-strain
behavior. Initially, the material behaved linear-elastically until the material reached its
plateau stress of approximately 300 psi on average (at slightly less than 1% strain). This
linear-elastic behavior at low strain levels is shown in Figure 4-12. In some samples, a
slight drop-off in stress was observed after its initial peak. This is most likely due to the
inner diameter of the steel tube being 1/16” larger than the diameter of the sample. Due
to this small gap between the sample and the confining tube, there is no confinement until
the sample has expanded horizontally so that it is in contact with the steel.

46
At this point, the concrete exited it linear-elastic phase and entered its crushing
phase, where the material began to deform plastically and the polystyrene cells collapsed.
This occurred between the strains of about 1% and 54%. Minor strain hardening occurred
during this phase, but the plateau stress remained relatively constant until it reached its
densification strain. Eventually, as the material continued to densify, all of the cells
collapsed. During its densification phase, the material started rapidly resisting more load
at strains higher than about 54%. At the conclusion of the test, the sample consisted of a
solid cylinder that was a fraction of its initial height. A comparison of a sample before
and after confined crushing is shown in Figure 4-13.
Figure 4-12. Example of linear-elastic phase behavior
0
100
200
300
400
500
600
0 0.01 0.02
Linear-Elastic Phase Example
Str
ess
(psi
)
Strain

47
Figure 4-13. Comparison between crushed and uncrushed polystyrene samples
After the testing in confined setting, the samples were cut open with a wet saw
and examined. Figure 4-14 shows a cross-section of a crushed sample after testing. This
time, the samples showed no signs of shear failure and all of the polystyrene cells were
completely collapsed to the point where they were barely visible by naked eye.
Confinement proved to be an efficient way of preventing shear failure and maximizing
cell crushing. Vehicle barriers, therefore, should be design in such a way that the
crushable concrete element is confined in order to maximize energy absorption.

48
Figure 4-14. Cross-section after confined compression test
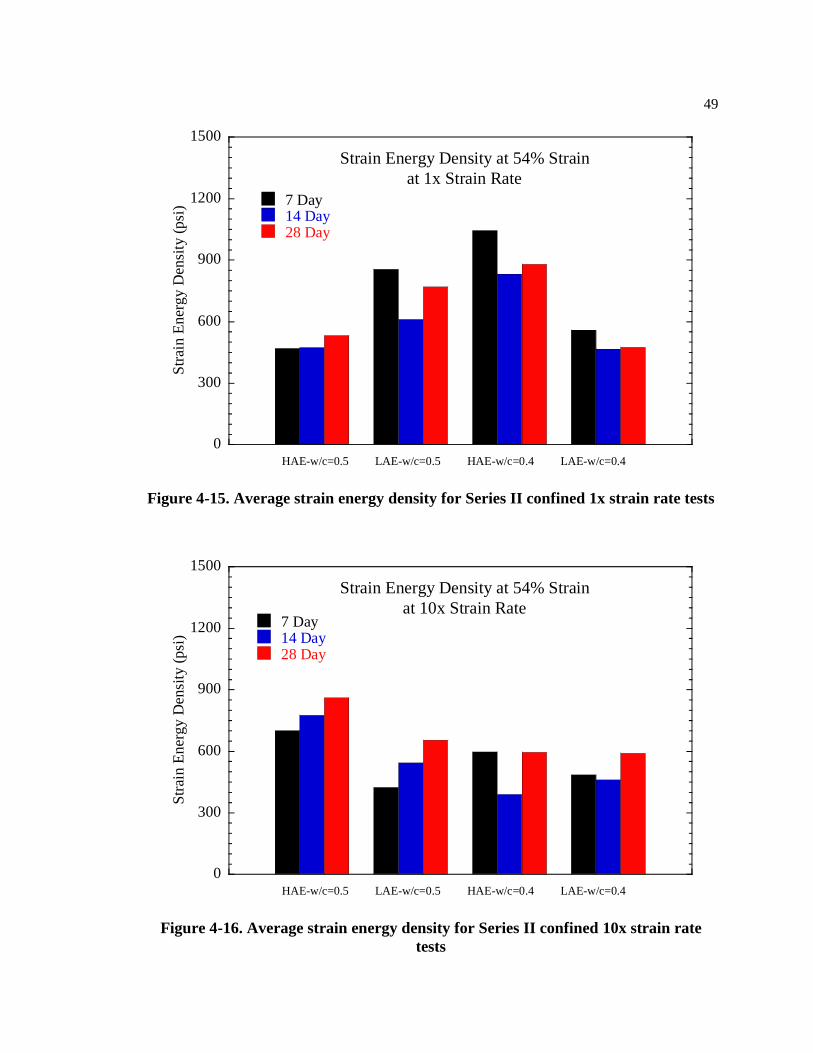
In order to quantitatively compare the energy dissipation potential of each
mixture, the strain energy densities were calculated. Using the tangent line method (Paul
and Ramamurty 2000) outlined in Chapter 2, the average densification strain was
determined to be equal to 𝜀𝐷 = 54% for the Series II mixtures. Figure 4-15 and Figure
4-16 shows the average strain energy densities calculated from 𝜀 = 0 to 𝜀 = 𝜀𝐷 for the
1x strain rate tests and the 10x strain rate tests, respectively.
Crushed
Polystyrene
Spheres
49
Figure 4-15. Average strain energy density for Series II confined 1x strain rate tests
Figure 4-16. Average strain energy density for Series II confined 10x strain rate
tests
0
300
600
900
1200
1500
Strain Energy Density at 54% Strain
at 1x Strain Rate
7 Day14 Day28 Day
Str
ain E
ner
gy
Den
sity
(psi
)
HAE-w/c=0.5 LAE-w/c=0.5 HAE-w/c=0.4 LAE-w/c=0.4
0
300
600
900
1200
1500
Strain Energy Density at 54% Strain
at 10x Strain Rate7 Day14 Day28 Day
HAE-w/c=0.5 LAE-w/c=0.5 HAE-w/c=0.4 LAE-w/c=0.4
Str
ain E
ner
gy
Den
sity
(psi
)
50
The test results show that for the mixtures with a w/c=0.5, the low air entraining
admixture dosage mix (LAE-w/c=0.5) was generally able to dissipate more energy than
the high air entraining admixture dosage mix (HAE-w/c=0.5) because it was able to resist
more load throughout the test. For the w/c=0.4 mixes, however, the opposite occurred.
The high air entraining admixture dosage mix (HAE-w/c=0.4) generally had a higher
strain energy density than the low air entraining admixture dosage mix (LAE-w/c=0.4).
Further work is needed to investigate the potential role of air entrainment on energy
absorption of crushable polystyrene concrete.
On average, the w/c=0.4 samples had a slightly higher strain energy density,
though the difference was not as high or consistent as initially expected. It should also be
noted that little strength gain occurred between the 7 day and 28 day tests. Since both of
these factors had little effect on the concrete’s strength and energy dissipation potential, it
seems clear that a factor that is unrelated to cement matrix strength (such as distribution
of polystyrene spheres) is important in determining polystyrene concrete’ behavior.
More research is necessary to explore this phenomena.
The strain rates used in this study were also shown to have little to no effect on
the energy absorption of the concrete. For two of the mixtures (LAE-w/c=0.5 and HAE-
w/c=0.4) the 1x strain rate tests yielded more energy dissipation. For the HAE-w/c=0.5,
however, the 10x strain rate tests produced a higher strain energy density. The last
mixture, LAE-w/c=0.4, had about the same strain energy densities for both the 1x and
10x tests. This study was also limited to a maximum strain rate of 3.48 X 10⁻³ (10x strain
rate) due to limitations of the machine used to apply the load. Additional work must be
51
performed to investigate polystyrene concrete behavior at much higher strain rates that
are typical in vehicle collisions with barriers.
In general, the Series II testing shows that polystyrene concrete has good potential
to dissipate energy in vehicle barrier systems. The material has a low strength, which
minimizes the force that will be transmitted through to the protected structure. It also has
a high deformation potential, with the mix designs from this test reaching a densification
strain of around 54%. Finally, very little strain hardening occurs and the plateau stress
remained relatively constant during the crushing phase. This is important in maximizing
energy dissipation at low strains and minimizing the force applied through to the barrier
as the polystyrene concrete approaches its densification strain.
4.3 Series III Testing
In Series III, the goal was to create a mixture with a higher strain energy density.
This was accomplished by replacing some of the polystyrene spheres with stronger
lightweight aggregate. Polypropylene fibers were also added to increase the strength of
the cell walls. Full mix design details for this mixture can be found in Chapter 3. Due to
time constraints for determining the behavior of this mixture, confined compression
testing was performed 3, 7, and 28 days after mixing. Unconfined compression testing
was also performed after 28 days. Because the difference between the 1x and 10x strain
rate of loading was negligible in Series II, all testing in Series III was performed at the
10x strain rate.
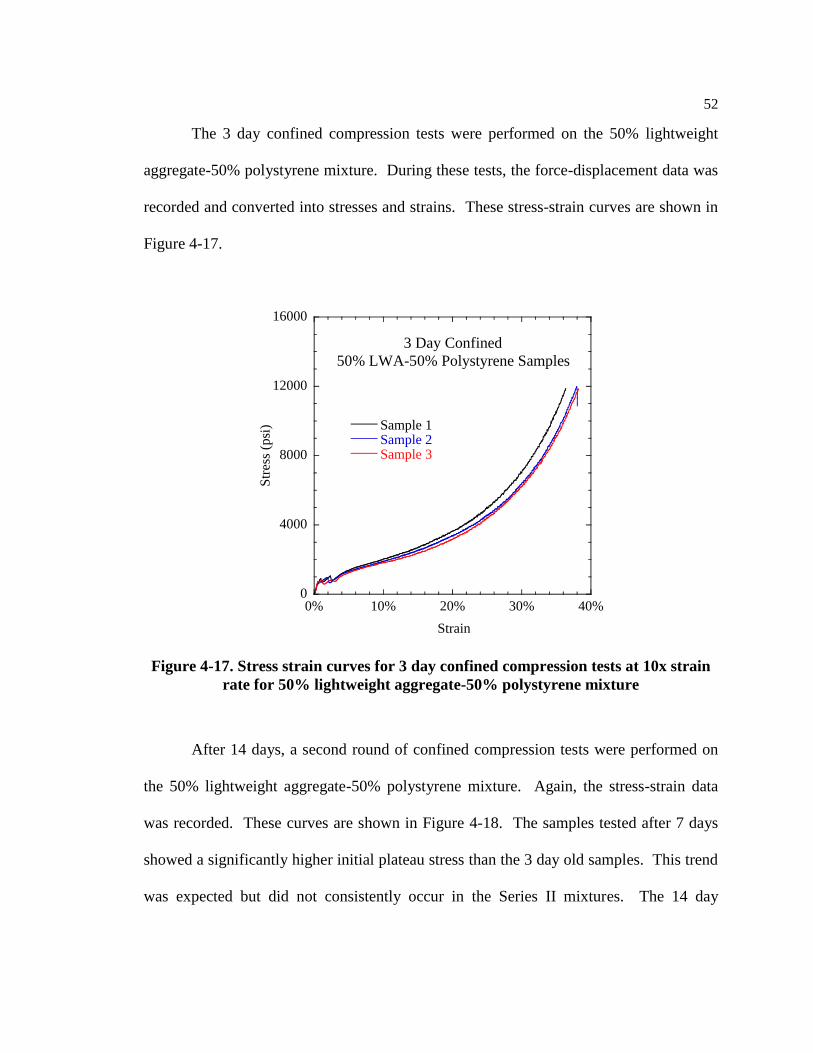
52
The 3 day confined compression tests were performed on the 50% lightweight
aggregate-50% polystyrene mixture. During these tests, the force-displacement data was
recorded and converted into stresses and strains. These stress-strain curves are shown in
Figure 4-17.
0
4000
8000
12000
16000
0% 10% 20% 30% 40%
3 Day Confined
50% LWA-50% Polystyrene Samples
Sample 1Sample 2Sample 3
Str
ess
(psi
)
Strain
Figure 4-17. Stress strain curves for 3 day confined compression tests at 10x strain
rate for 50% lightweight aggregate-50% polystyrene mixture
After 14 days, a second round of confined compression tests were performed on
the 50% lightweight aggregate-50% polystyrene mixture. Again, the stress-strain data
was recorded. These curves are shown in Figure 4-18. The samples tested after 7 days
showed a significantly higher initial plateau stress than the 3 day old samples. This trend
was expected but did not consistently occur in the Series II mixtures. The 14 day
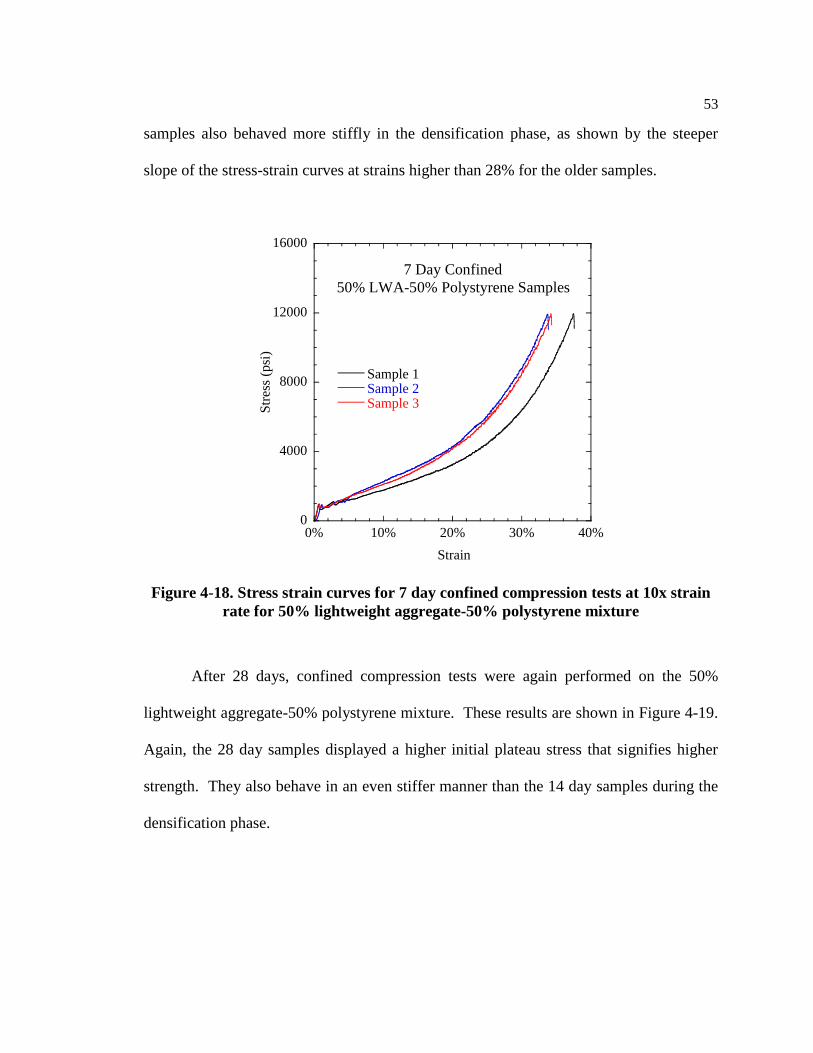
53
samples also behaved more stiffly in the densification phase, as shown by the steeper
slope of the stress-strain curves at strains higher than 28% for the older samples.
0
4000
8000
12000
16000
0% 10% 20% 30% 40%
7 Day Confined
50% LWA-50% Polystyrene Samples
Sample 1Sample 2Sample 3S
tres
s (p
si)
Strain
Figure 4-18. Stress strain curves for 7 day confined compression tests at 10x strain
rate for 50% lightweight aggregate-50% polystyrene mixture
After 28 days, confined compression tests were again performed on the 50%
lightweight aggregate-50% polystyrene mixture. These results are shown in Figure 4-19.
Again, the 28 day samples displayed a higher initial plateau stress that signifies higher
strength. They also behave in an even stiffer manner than the 14 day samples during the
densification phase.
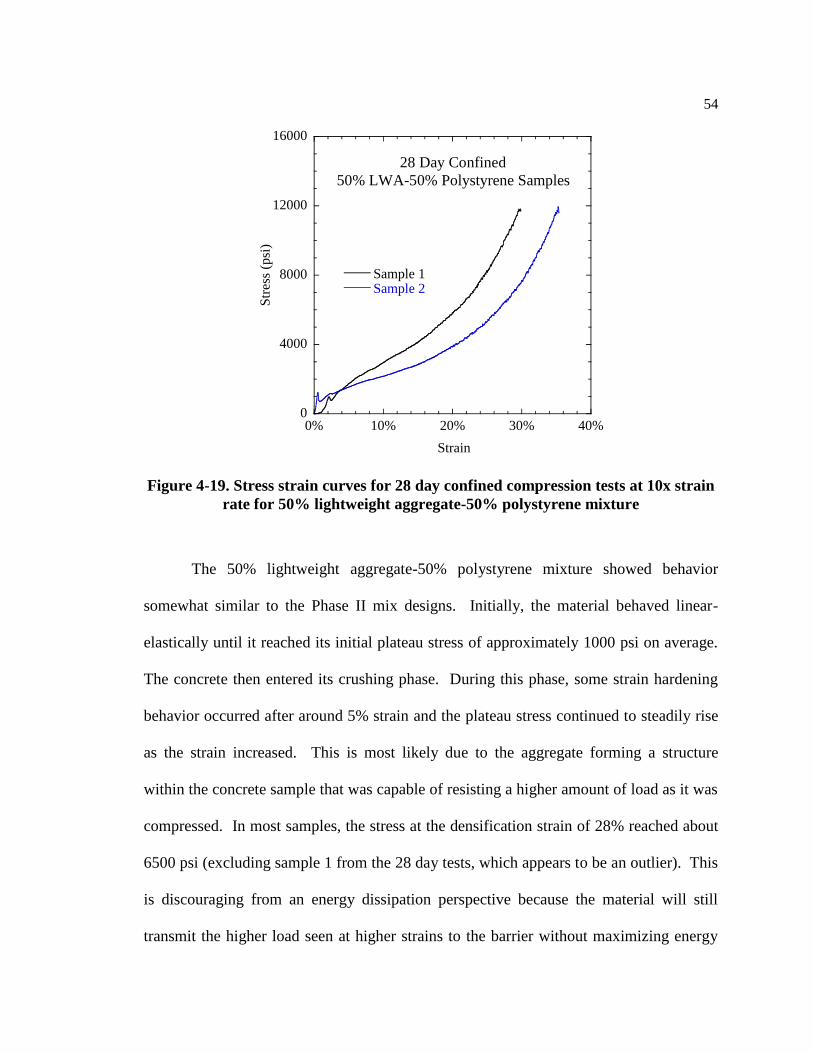
54
0
4000
8000
12000
16000
0% 10% 20% 30% 40%
28 Day Confined
50% LWA-50% Polystyrene Samples
Sample 1Sample 2
Strain
Str
ess
(psi
)
Figure 4-19. Stress strain curves for 28 day confined compression tests at 10x strain
rate for 50% lightweight aggregate-50% polystyrene mixture
The 50% lightweight aggregate-50% polystyrene mixture showed behavior
somewhat similar to the Phase II mix designs. Initially, the material behaved linear-
elastically until it reached its initial plateau stress of approximately 1000 psi on average.
The concrete then entered its crushing phase. During this phase, some strain hardening
behavior occurred after around 5% strain and the plateau stress continued to steadily rise
as the strain increased. This is most likely due to the aggregate forming a structure
within the concrete sample that was capable of resisting a higher amount of load as it was
compressed. In most samples, the stress at the densification strain of 28% reached about
6500 psi (excluding sample 1 from the 28 day tests, which appears to be an outlier). This
is discouraging from an energy dissipation perspective because the material will still
transmit the higher load seen at higher strains to the barrier without maximizing energy

55
dissipation at smaller strains. Eventually, the material reaches its densification strain,
which was determined to be 28% by the tangent line method (Paul and Ramamurty
2000), and begins to behave much more stiffly.
Strain energy density was also calculated for all samples up to the average
densification strain. These results are shown in Figure 4-20. The samples were able to
dissipate more energy at later test days. This is an expected trend but one that was not
very pronounced in the Series II testing. The 50% lightweight aggregate-50%
polystyrene mixture consistently had a higher strain energy density than the Series II
mixtures. This was due to the 50% lightweight aggregate-50% polystyrene mixture’s
higher plateau stress even though the Series II mixtures had a much higher densification
strain. This higher energy dissipation potential comes with a price however, as the 50%
lightweight aggregate-50% polystyrene mixture will transmit a higher force to a vehicle
barrier in a real world situation due to its higher plateau stress.
Figure 4-20. Average strain energy density for Series III 10x strain rate tests
0
300
600
900
1200
1500
Strain Energy Density at 28% Strain
50% LWA-50% Polystyrene Samples
3 Day7 Day28 Day
Str
ain E
ner
gy D
ensi
ty (
psi
)

56
Unconfined compression tests were also performed after 28 days on the 50%
lightweight aggregate-50% polystyrene samples and the 100% lightweight aggregate
mixture so that a compressive strength comparison could be made. These results are
shown in Figure 4-21 and Figure 4-22.
0
300
600
900
1200
0% 2% 4% 6% 8% 10%
28 Day Unconfined
50% LWA-50% Polystyrene Samples
Sample 1Sample 2
Str
ess
(psi
)
Strain
Figure 4-21. Stress strain curves for 28 day unconfined compression tests at 10x
strain rate 50% lightweight aggregate-50% polystyrene mixture
The 50% lightweight aggregate-50% polystyrene mixture samples reached a peak
stress of 871 psi on average. This value is slightly lower than the initial peak stresses in
the confined tests, which is expected due to the lack of confinement. The 100%
lightweight aggregate mixture samples had an average peak strength of 2434 psi. The
50% lightweight aggregate-50% polystyrene samples displayed a more ductile failure
mode, as they were able to resist a large percent of their peak stress at around 4% strain.
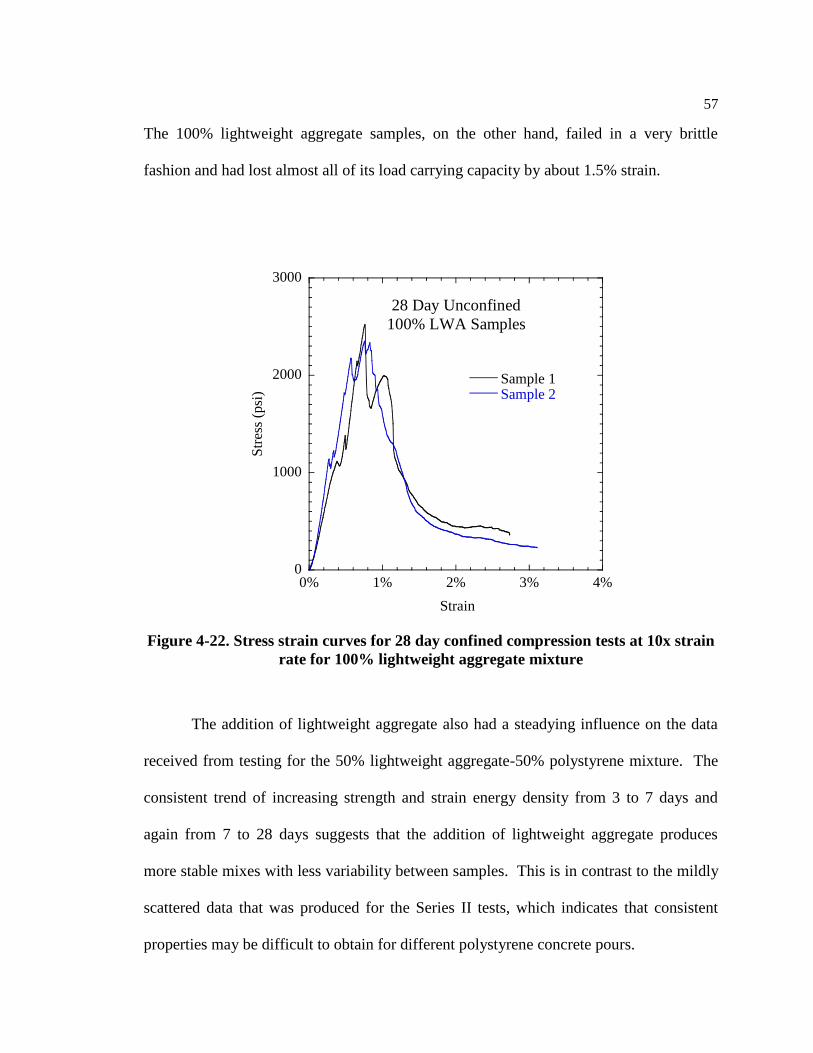
57
The 100% lightweight aggregate samples, on the other hand, failed in a very brittle
fashion and had lost almost all of its load carrying capacity by about 1.5% strain.
0
1000
2000
3000
0% 1% 2% 3% 4%
28 Day Unconfined
100% LWA Samples
Sample 1Sample 2
Strain
Str
ess
(psi
)
Figure 4-22. Stress strain curves for 28 day confined compression tests at 10x strain
rate for 100% lightweight aggregate mixture
The addition of lightweight aggregate also had a steadying influence on the data
received from testing for the 50% lightweight aggregate-50% polystyrene mixture. The
consistent trend of increasing strength and strain energy density from 3 to 7 days and
again from 7 to 28 days suggests that the addition of lightweight aggregate produces
more stable mixes with less variability between samples. This is in contrast to the mildly
scattered data that was produced for the Series II tests, which indicates that consistent
properties may be difficult to obtain for different polystyrene concrete pours.

58
4.4 Mixture Design Guidance for Barriers
In order to effectively protect the vehicle barrier, two conditions must be met.
First, the crushable concrete element should transmit a low enough force to the barrier
during the crushing phase so that it does not damage the barrier. Second, the crushable
concrete must dissipate the vehicle’s energy before the material reaches its densification
strain, where the transmitted force will begin to increase dramatically. If the barrier
design details, crushable concrete element size, and amount of kinetic energy that must
be absorbed are known, then the crushable concrete mixture can be designed with the
optimum plateau stress and densification strain so that the required energy is dissipated
without transmitting the failure force to the barrier. Figure 4-23 shows a hypothetical
barrier design with a crushable concrete element.
Figure 4-23. Crushable concrete element protecting a vehicle anti-ram barrier

59
For the above barrier configuration, the two conditions can be met if the
relationships described in equations 2 and 3 are satisfied.
𝜎𝑃𝐿𝐴 < 𝐹𝑓𝑎𝑖𝑙 (2)
(𝜎𝑃𝐿𝐴) ∗ (𝜀𝐷𝐿) > 𝑊 (3)
where: 𝑊 = Kinetic energy from vehicle
𝐹𝑓𝑎𝑖𝑙 = Failure force of the barrier
𝐴 = Area of the crushable concrete element
𝐿 = Length of the crushable concrete element
𝜎𝑃𝐿 = Plateau stress of the crushable concrete
𝜀𝐷 = Densification strain of the crushable concrete
Equation 2 ensures that the barrier will not experience failure during the crushing
phase and equation 3 ensures that the vehicle’s kinetic energy will be absorbed before the
material reaches its densification strain. Using these equations, a crushable concrete
mixture can be designed with the correct proportions of polystyrene and lightweight
aggregate so that the mixture has the optimum plateau stress and densification strain. For
example, if a barrier requires a crushable concrete mixture with a plateau stress of around
300 psi and a densification strain of around 50%, then the 100% polystyrene mixture will

60
be sufficient to protect the barrier. If a higher plateau stress is required, then more
lightweight aggregate should be added to the mixture.
This is a very simple method for roughly determining the appropriate mixture for
a basic barrier design, and it does have a few limitations. First, this method assumes that
the barrier is very stiff. If the barrier deflects during the vehicle impact, the analysis will
be more complicated. Second, some of the vehicle’s kinetic energy will be dissipated
through the crushing of the front end of the vehicle during the impact. The equations
above will therefore overestimate the amount of energy that must be dissipated by the
crushable concrete element. Finally, the above analysis assumes that the dynamic
properties of the polystyrene concrete will be the same as the quasi-static properties that
were determined in this study. Further dynamic testing on crushable concrete should be
performed to determine the true dynamic properties of polystyrene concrete. Due to
these limitations, this method is not suitable to create a final barrier design. However, it
is an excellent tool to determine an initial mixture design that can then be tested using
finite element simulations and then full scale vehicle crash tests.

61
Chapter 5
Conclusions and Future Research
5.1 Conclusions
The tests performed in this study have shown that polystyrene concrete has good
potential to be used as an energy absorbing material in vehicle anti-ram barriers. The
effects of curing time, confinement, air entrainment, strain rate of loading, w/c ratio,
unloading and reloading, and cellular volume fraction were explored. The following
conclusions can be made:
Polystyrene concrete exhibits a much lower peak compressive stress than a
comparable normal aggregate concrete. In the unconfined uniaxial compression
tests (Series I), the polystyrene concrete and normal concrete’s average peak
compressive stress was 174 psi and 2629 psi, respectively, after 28 days of curing.
However, polystyrene concrete also has a much more ductile failure mode than
normal concrete. In the unconfined compression tests (Series I), it was able to
resist a large portion of its peak load at around 7% strain, compared to only about
1.2% for the control samples.
For the mixtures tested in this study, when the polystyrene concrete is loaded in
an unconfined setting, very few cells are crushed and the sample fails primarily in
shear. Adequate confinement has been shown to eliminate shear failure and
maximize cell crushing. Therefore, polystyrene concrete should be confined
when used in vehicle barrier designs.
62
When unloaded and reloaded, the elastic strain rebound was very small for the
polystyrene concrete samples. This indicates that most of the energy that was
absorbed by deformation was dissipated rather than stored in the material.
Cure time and w/c ratio had a very minimal effect on the strength and energy
dissipation characteristics of the mixtures with 100% polystyrene aggregate (i.e.
no lightweight or normal aggregate). This could be due to factors not related to
cement matrix strength (such as polystyrene cell distribution) playing a larger role
in the strength of the concrete as a whole. More research is necessary to confirm
this hypothesis.
Variation in air entrainer dosage also exhibited little to no effect on the energy
absorbing capabilities of polystyrene concrete. For mixtures with higher w/c
ratios, the low air entrainer dosage samples dissipated more energy. For mixtures
with lower w/c ratios, the opposite occurred and the high air entrainer dosage
samples dissipated more energy. It should be noted that the actual air content of
the samples were not measured directly in this study. More testing could further
map out the effects of air entrainment on polystyrene concrete.
The strain rate of loading had unclear effects on the behavior of the polystyrene
concrete. One of the mixtures showed an increase in energy absorption when
loaded at a faster rate, two of the mixtures showed a decrease when loaded at a
faster rate, and the last mixture stayed about the same for both rates. Due to
equipment limitations, this study could only perform tests at a maximum strain
rate of 3.48 X 10⁻³ (10x strain rate). Further research should explore polystyrene

63
concrete’s behavior at strain rates closer to strain rates typically exerted on
vehicle barriers.
The mixtures with 100% polystyrene aggregate showed only a small amount of
strain hardening during the crushing phase. This is beneficial to maximizing
energy dissipation and reducing the peak load transferred to the vehicle barrier.
By replacing half of the polystyrene spheres with sufficiently incompressible
lightweight aggregate (50% lightweight aggregate-50% polystyrene mix design),
the cellular volume fraction was effectively cut in half. This produced a much
stronger material with a higher plateau stress. However, the 50% lightweight
aggregate-50% polystyrene mix design also had a much lower deformation
potential.
Curing time did have a significant and consistent effect on the strength and energy
dissipation properties of the 50% lightweight aggregate-50% polystyrene mix
design, as shown by the increase in strain energy density for the 3, 7, and 28 day
tests. This is in contrast of the 100% polystyrene aggregate mix designs and
indicates that the strength of the cement matrix plays a more significant role in the
concrete system’s behavior when there is some lightweight aggregate present.
One negative aspect of adding lightweight aggregate to the crushable concrete
system is that it increased the amount of strain hardening that occurred in the
crushing phase. This causes the concrete to be a less efficient energy absorbing
material because at lower strains, the material will only be dissipating energy that
is proportional to the relatively low initial plateau stress. However, as the
material approaches its densification strain, the significant increase in plateau

64
stress causes a corresponding increase in force transmitted to the barrier. It
should be noted that the lightweight aggregate that was used was intended for
structural use and therefore was relatively strong. If a weaker lightweight
aggregate is used, the strain hardening of the concrete may be less pronounced.
Overall, the 50% lightweight aggregate-50% polystyrene mixture samples did
dissipate a higher amount of energy than the 100% polystyrene aggregate mixture
samples. This occurred due to the 50% lightweight aggregate-50% polystyrene
mixture’s higher plateau stress and in spite of its lower densification strain.
The proportioning of lightweight aggregate and polystyrene in a crushable
concrete mixture can be optimized to dissipate the maximum amount of energy in
a barrier system. The magnitude of loading, area and length of the crushable
concrete element, and amount of force the barrier can withstand without incurring
failure will be the deciding factors when determining the correct mixture design
that should be used.
5.2 Future Research
This study showed the potential that polystyrene concrete has in dissipating
energy in vehicle barrier systems. Additional research could be performed to further
understand the effects of very high strain rates (such as those that occur in vehicle
loading scenarios) and to create a material with a higher strain energy density.
This study effectively mapped out the behavior of polystyrene concrete under
quasi-static loading conditions. In vehicle barriers, however, the polystyrene concrete

65
will be loaded much more quickly. Additional testing should be performed on
polystyrene concrete to determine the effects of dynamic loading have on its energy
dissipation characteristics.
A second path of research could explore creating a crushable concrete mixture
with a higher plateau stress and a densification strain. The 100% polystyrene mixtures
that were tested in Series II had a very high densification strain, but its energy dissipation
potential was limited by its low plateau stress. For the 50% lightweight aggregate-50%
polystyrene mix design, the deformability was sacrificed in order to increase the plateau
stress. A mixture design that could combine a high strength and deformability could
maximize energy dissipation while minimizing the size of the crushable concrete
element.
The key to producing this strong and deformable behavior is to increase the
concrete’s strength without reducing its cellular volume fraction. This can possibly be
accomplished by increasing the strength of the cement skeleton and cell walls. The
addition of steel fiber reinforcement and silica fume into the crushable concrete system
may significantly improve the energy dissipation potential of polystyrene concrete for
these reasons.
A second conceivable method for increasing strength without sacrificing
deformation potential is to adjust the cells’ properties. Using a material such as hollow
glass beads or creating smaller cells (i.e. smaller polystyrene spheres) may increase the
stability and strength of each cell and therefore the entire concrete system. More research
must be performed to define the effect that these changes could have on the concrete’s
behavior.

66
References
Abd El-Sayed, F. K., R. Jones, and I. W. Burgess. 1979. “A Theoretical Approach to the
Deformation of Honeycomb Based Composite Materials.” Composites 10 (4): 209–
14.
Ashby, M. F., and R. F. Mehl Medalist. 1983. “The Mechanical Properties of Cellular
Solids.” Metallurgical Transactions 14 (9): 1755–69.
ASTM:C192/C192M-13. 2013. “Standard Practice for Making and Curing Concrete Test
Specimens in the Laboratory.” ASTM International, 1–8. doi:10.1520/C0192.
ASTM:C39/C39M-12a. 2012. “Standard Test Method for Compressive Strength of
Cylindrical Concrete Specimens.” ASTM International, 1–7. doi:10.1520/C0039.
Babu, K.G., and D.S. Babu. 2003. “Behavior of Lightweight Expanded Polystyrene
Concrete Containing Silica Fume.” Cement and Concrete Research, 755–62.
Barma, P., M. B. Rhodes, and R. Salover. 1978. “Mechanical Properties of Particulate-
Filled Polyurethane Foams.” Journal of Applied Physics 49 (10): 4985–91.
Baxter, S., and T. T. Jones. 1972. “The Physical Properties of Foamed Plastics and Their
Dependence on Structure.” Plastics and Polymers, no. April: 69–76.
Bischoff, P.H., Yamura, K., Perry, S.H. 1990. “Polystyrene Aggregate Concrete
Subjected to Hard Impact.” In Proceedings - Institution of Civil Engineers. Part 2.
Research and Theory, 225–39.
Castro, Javier, Lucas Keiser, Michael Golias, and Jason Weiss. 2011. “Absorption and
Desorption Properties of Fine Lightweight Aggregate for Application to Internally
Cured Concrete Mixtures.” Cement and Concrete Composites 33 (10). Elsevier Ltd:
1001–8. doi:10.1016/j.cemconcomp.2011.07.006.
Chen, B., and J. Liu. 2004. “Properties of Lightweight Expanded Polystyrene Concrete
Reinforced with Steel Fiber.” Cement and Concrete Research, 1259–63.
Christensen, R. M. 1986. “Mechanics of Low Density Materials.” Journal of Mech. Phys.
Solids 34: 563–78.
Cowin, S. C. 1985. “The Relationship Between the Elasticity Tensor and the Fabric
Tensor.” Mechanical Materials 4: 137–47.

67
Evans, Anthony G, John W Hutchinson, and Michael F Ashby. 1998. “Cellular Metals.”
Current Opinion in Solid State and Materials Science 3: 288–303.
doi:10.1016/S1359-0286(98)80105-8.
Finnie, I., and M. R. Patel. 1970. “Structural Features and Mechanical Properties of Rigid
Cellular Plastics.” Journal of Materials 5: 909–32.
Gibson, Lorna J., and Michael F. Ashby. 1997. Cellular Solids: Structure and Properties.
Second Edi. Cambridge: Cambridge University Press.
“Insulfoam Material Safety Data Sheet.” 2005. Premier Industries, Inc.
Klieger, P. 1957. “Early High Strength Concrete for Prestressing.” Proceedings: World
Conference on Prestressed Concrete.
Klintworth, J. W. 1989. “Dynamic Crushing of Cellular Solids.” Cambridge University.
Kraynik, A. M., D. A. Reinelt, and H. M. Princen. 1991. “The Nonlinear Elastic Behavior
of Polydisperse Hexagonal Foams and Concentrated Emulsions.” Journal of
Rheology 35: 1235–53.
Ma, H. K., B. R. Chen, H. W. Lan, and C. Y. Chao. 2010. “Study of an LED Device with
a Honeycomb Heat Sink.” Annual IEEE Semiconductor Thermal Measurement and
Management Symposium, 289–98. doi:10.1109/STHERM.2010.5444277.
Maiti, S. K., M. F. Ashby, and L. J. Gibson. 1984. “Fracture Toughness of Brittle
Cellular Solids.” Scripta Metallurgica 18: 213–17.
Marco, Fulvio Bassani, Sacchi Emanuele, and Canonico. 2012. “Performance Prediction
for Innovative Crushable Material Used in Aircraft Arrestor Beds.” Journal of
Materials in Civil Engineering 24 (June): 725–34. doi:10.1061/(ASCE)MT.1943-
5533.0000425.
Mindess, S., J.F. Young, and D. Darwin. 2003. Concrete. 2nd Editio. Upper Saddle
Ridge, N.J.: Pearson Educational Inc.
Montanini, Roberto. 2005. “Measurement of Strain Rate Sensitivity of Aluminium Foams
for Energy Dissipation.” International Journal of Mechanical Sciences 47: 26–42.
doi:10.1016/j.ijmecsci.2004.12.007.
Morgan, J. S., J. L. Wood, and R. C. Bradt. 1981. “Cell Size Effects on the Strength of
Foamed Glass.” Materials Science and Engineering 47 (1): 37–42.
Nakamoto, Hiroaki, Tadaharu Adachi, and Wakako Araki. 2009. “In-Plane Impact
Behavior of Honeycomb Structures Filled with Linearly Arranged Inclusions.”
68
International Journal of Impact Engineering 36 (8). Elsevier Ltd: 1019–26.
doi:10.1016/j.ijimpeng.2009.01.004.
Paul, a, and U Ramamurty. 2000. “Strain Rate Sensitivity of a Closed-Cell Aluminum
Foam.” Materials Science and Engineering: A 281: 1–7. doi:10.1016/S0921-
5093(99)00750-9.
Perry, S.H., P.H. Bischoff, and K. Yamura. 1991. “Mix Details and Material Behavior of
Polystyrene Aggregate Concrete.” Magazine of Concrete Research, 71–76.
“Polystyrene and Styrene Copolymers.” 2014. Ullmann’s Encyclopedia of Industrial
Chemistry. Wiley.
Reid, S. R., and W. W. Bell. 1984. Mechanical Properties of Materials at High Rates of
Strain. Edited by J. Harding. London: Institute of Physics.
Rusch, K. C. 1970. “Load-Compression Behavior of Brittle Foams.” Journal of Applied
Polymer Science 14 (5): 1263–76.
Sakai, Junichi, and Kazuhiko Kawashima. 2006. “Unloading and Reloading Stress–Strain
Model for Confined Concrete.” Journal of Structural Engineering 132 (1): 112–22.
doi:10.1061/(ASCE)0733-9445(2006)132:1(112).
Santagata, Ezio, Marco Bassani, and Emanuele Sacchi. 2010. “Performance of New
Materials for Aircraft Arrestor Beds.” Transportation Research Record: Journal of
the Transportation Research Board 2177 (2177): 124–31. doi:10.3141/2177-15.
Shim, V. P. W., B. Y. Tay, and W. J. Stronge. 1990. “Dynamic Crushing of Strain-
Softening Cellular Structures—A One-Dimensional Analysis.” Journal of
Engineering Materials and Technology 112 (4): 398–405.
“STALITE Lightweight Aggregate Physical Characteristics for Structural Applications.”
n.d., 500.
Thornton, P. H., and C. L. Magee. 1975a. “The Deformation of Aluminum Foams.”
Metallurgical Transactions 6A: 1253–63.
Thornton, P. H., and C. L. Magee. 1975b. “Deformation Characteristics of Zinc Foam.”
Metallurgical Transactions1 6A: 1801–7.
Torquato, S. 1991. “Random Heterogeneous Media: Microstructure and Improved
Bounds of Effective Properties.” Applied Mechanics Review 44: 37–76.
Wang, D.-M., J. Wang, and Q.-H. Liao. 2013. “Investigation of Mechanical Property for
Paper Honeycomb Sandwich Composite under Different Temperature and Relative

69
Humidity.” Journal of Reinforced Plastics and Composites 32: 987–97.
doi:10.1177/0731684413475912.
Warren, W. E., and A. M. Kraynik. 1987. “Foam Mechanics: The Linear Elastic
Response of Two-Dimensional Spatially Periodic Cellular Materials.” Mechanics of
Materials 6 (1): 27–37.
Zhen, W. U., C. Bing, and L. Ning. 2013. “Fabrication and Compressive Properties of
Expanded Polystyrene Foamed Concrete.” Journal of Shanghai Jiaotong University,
61–69.