Material-efficiency Ecodesign Report and Module to the ...
28
Material-efficiency Ecodesign Report and Module to the Methodology for the Ecodesign of Energy-related Products (MEErP) PART 2 – ENHANCING MEERP FOR ECODESIGN Final report to the European Commission – DG Enterprise and Industry 5 December 2013 Ref. Ares(2013)3766523 - 19/12/2013
Transcript of Material-efficiency Ecodesign Report and Module to the ...

Material-efficiency Ecodesign Report and Module to the Methodology for the Ecodesign of Energy-related Products (MEErP)
PART 2 – ENHANCING MEERP FOR ECODESIGN
Final report to the European Commission – DG Enterprise and Industry 5 December 2013
Ref. Ares(2013)3766523 - 19/12/2013

Part 2: Enhancing MEErP for Ecodesign
2 | Material-efficiency Ecodesign Report and Module to the Methodology for the Ecodesign of Energy-related Products (MEErP)
Document information
CLIENT European Commission – DG Enterprise and Industry
REPORT TITLE Part 2 – Enhancing MEErP for Ecodesign – Final report
PROJECT NAME Material-efficiency Ecodesign Report and Module to the Methodology for the Ecodesign of Energy-related Products (MEErP)
PROJECT TEAM BIO Intelligence Service and Fraunhofer IZM
DATE 5 December 2013 AUTHORS Mr. Shailendra Mudgal, BIO Intelligence Service
Mr. Benoît Tinetti, BIO Intelligence Service Mr. Alvaro de Prado Trigo, BIO Intelligence Service Mr. Thibault Faninger, BIO Intelligence Service Ms. Marina Proske, Fraunhofer IZM Mr. Karsten Schischke, Fraunhofer IZM
KEY CONTACTS Mr. Shailendra Mudgal [email protected]
or Benoît Tinetti [email protected]
DISCLAIMER This document has been prepared for the European Commission. However, it reflects the views only of the authors, and the Commission cannot be held responsible for any use which may be made of the information contained therein. The project team does not accept any liability for any direct or indirect damage resulting from the use of this report or its content.
Please cite this publication as:
BIO Intelligence Service (2013), Material-efficiency Ecodesign Report and Module to the Methodology for the Ecodesign of Energy-related Products (MEErP), Part 2 – Enhancing MEErP for Ecodesign. Prepared for: European Commission – DG Enterprise and Industry
Photo credit: cover @ Per Ola Wiberg
©BIO Intelligence Service 2013

Material-efficiency Ecodesign Report and Module to the Methodology for the Ecodesign of Energy-related Products (MEErP)
| 3
Table of Contents
INTRODUCTION 5
1.1 Recyclability benefit rate (RBR) 6
1.1.1 Definition 6
1.1.2 Guidance: How to use the Recyclability Benefit Rate in the EcoReport Tool 7
1.1.3 Guidance: How to understand and interpret the results 9
1.1.4 Implementation of Recyclability Benefit Rate in the EcoReport Tool 12
1.2 Recycled content 17
1.2.1 Definition 17
1.2.2 Guidance: How to use “Recycled Content” in the EcoReport tool 17
1.2.3 Guidance: How to understand and interpret the results 18
1.2.4 Implementation of Recycled Content in the EcoReport Tool 18
1.3 Lifetime 22
1.3.1 Definition 22
1.3.2 Guidance: How to use Lifetime in the EcoReport tool 22
1.3.3 Guidance: How to understand and interpret the results 22
1.3.4 Implementation of Lifetime in the EcoReport tool 24
1.4 CRM (Critical Raw Materials) 24
1.4.1 Definition 24
1.4.2 Guidance: How to calculate the CRM index 24
1.4.3 Guidance: How to interpret the CRM index 25
1.4.4 Implementation of the CRM indicator in the EcoReport tool 26

Part 2: Enhancing MEErP for Ecodesign
4 | Material-efficiency Ecodesign Report and Module to the Methodology for the Ecodesign of Energy-related Products (MEErP)
List of acronyms
AD Acidification
CO2 Carbon dioxide
CRM Critical raw materials
D Environmental impact of disposal
EP Eutrophication
EoL End-of-life
GWP Global warming potential
Hg Mercury
HMa Heavy metals (emission to air)
HMw Heavy metals (emissions to water)
k Downcycling index
L Litres
m Mass
MJ Mega joule
Ni Nickel
PAH Polycyclic aromatic hydrocarbons
PM Particulate matter
PO4 Phosphate
POP Persistent organic pollutants
R Environmental impact of recycling
RBR Recyclability benefit rate
RCR Recycling rate
SO2 Sulphur dioxide
V Environmental impact of the production of primary (virgin) material
VOC Volatile organic compounds

Material efficiency in the MEErP
Material-efficiency Ecodesign Report and Module to the Methodology for the Ecodesign of Energy-related Products (MEErP)
| 5
Introduction
This report is part of the project “Material-efficiency Ecodesign Report and Module to the
Methodology for the Ecodesign of Energy-related Products (MEErP)” commissioned by DG
Entreprise and Industry of the European Commission.
This project is structured in two phases: In Part 11, the aspect of material efficiency for ecodesign
was analysed and suitable parameters to assess material efficiency were evaluated. Based on this
analysis, four aspects were identified which are suitable and practicable for the MEErP and the
EcoReport tool. Part 2 of the project consists in a revision and update of the MEErP, including its
EcoReport tool, to include material efficiency criteria. The present report is a result of Part 2 of
the project, together with two additional documents:
EcoReport tool including material efficiency parameters2; and
Report of tests of the EcoReport tool3.
The present document is a guide for practitioners to analyse material efficiency in ErP by using
the EcoReport 2013.
1 BIO Intelligence Service (2013) Material-efficiency Ecodesign Report and Module to the Methodology for the
Ecodesign of Energy-related Products (MEErP) Part 1: Material Efficiency For Ecodesign
2 EcoReport 2013 - IZM for European Commission
3 BIO Intelligence Service (2013) Material-efficiency Ecodesign Report and Module to the Methodology for the
Ecodesign of Energy-related Products (MEErP) Part 2 – Test Reports TV and Washing Machine
Part 2: Enhancing MEErP for Ecodesign
6 | Material-efficiency Ecodesign Report and Module to the Methodology for the Ecodesign of Energy-related Products (MEErP)
Assessing material efficiency in the MEErP In the following sections, the changes in the
EcoReport tool 2013 are described in detail and guidance for the user on how to apply the new
features is given for the following aspects:
Recyclability benefit rate;
Recycled content;
Lifetime (results per year of use); and
Critical Raw Materials (CRM).
The “recyclability benefit rate” was added as new feature to assess the potential additional
benefit of recyclable plastic parts in the product (see section 1.1).
The aspect “recycled content” refers to additional data sets which were added to the tool, so that
products with recycled material as input material can now be modelled with the EcoReport tool
(see section 1.2).
The aspect “lifetime” as such is not new in the EcoReport tool, but the results are presented in an
additional4 way, so that products with different lifetimes can be easily compared (see section
1.3).
The aspects of “critical raw materials” was already addressed in MEErP 2011 with the CRM index,
but not yet applied in any preparatory study at the time of writing. This guidance document
describes again how the CRM index should be used (see section 1.4) and the Test report 3 gives
an example of an analysis with the CRM index.
The general approach of the MEErP 2011 and the way products are analysed in the EcoReport
tool 2011 was not changed. The background calculations and the included data sets (except the
data sets described in this guidance document) were maintained.
Throughout this guidance document, the term “user” refers not to the user of the product but to
the user of the MEErP and EcoReport tool when assessing the environmental impacts of a
product (group). The reference to the existing EcoReport tool refers to the version EcoReport
tool 2011. The changes described in this document refer to the EcoReport tool 2013.
1.1 Recyclability benefit rate (RBR)
1.1.1 Definition
The recyclability benefit rate can be defined as the “potential output” for future recycling. The
ability of a material/product to be recycled (i.e. reprocessed at the end-of-life for the original or a
different purpose) influences its impacts, avoiding the treatment and disposal of waste, and the
extraction and processing of new raw materials. However, it has to be kept in mind that the
recyclability is a property of the material, rather than a description of the treatment given to the
4 The new presentation of results is additional; all results presented in the EcoReport tool 2011 are still available.

Material efficiency in the MEErP
Material-efficiency Ecodesign Report and Module to the Methodology for the Ecodesign of Energy-related Products (MEErP)
| 7
waste generated at the end-of-life. This means that recyclability only provides information on
the ability of a waste product to be recycled based on actual practices, not of its real destination
as waste.5
The recyclability benefit rate shows the potential benefits of a recyclable product and was
developed by DG JRC6. Within the EcoReport tool 2013, the recyclability benefit rate (RBR) is
calculated only for bulk and technical plastics. For other materials, the RBR could not be applied
for various reasons:
For ferro and non-ferro metals, the benefits of recycling combined with a very
high (and not changeable) recycling rate are already included in the values for
manufacturing of the materials. It is therefore not useful to display an additional
recyclability benefit.
For various materials, downcycling rates are not known. Especially for
components made from different materials (as the material category
“electronics”), the concept of downcycling cannot be directly applied. The RBR is
therefore not included for these material categories in the EcoReport. However,
an extra sheet “input RBR” is added to the EcoReport tool where downcycling
rates can be added or changed by the user. Thereby, when more information is
available in the future or specific assumptions are made for certain product
groups, they can be easily applied in the EcoReport tool.
1.1.2 Guidance: How to use the Recyclability Benefit Rate in the
EcoReport Tool
The recyclability benefit rate (RBR) is calculated only for bulk and technical plastics and is
intended to compare different end-of-life scenarios under different design options.
The RBR is implemented according to formula 11 in DG JRC report6 (for details see section 1.1.4)
and is calculated individually for each material and impact category. Therefore, the following
inputs are required from the user:
Recyclable plastic parts
The user has to define which plastic parts of the product are recyclable (e.g. because of easy
separability of the housing). Therefore the use should mark those plastic parts which are
recyclable with “yes” in sheet “Inputs”, column G. All plastics parts marked as “yes” are then
automatically included when calculating the RBR.
5 Ardente F., Wolf M-A., Mathieux F., F. Pennington F. (2011) Review of resource efficiency and end-of-life
requirements. European Commission. Joint Research Centre. Institute for Environment and Sustainability. Deliverable
1 of the project “Integration of resource efficiency and waste management criteria in the implementing measures
under the Ecodesign Directive” 1.
6 Ardente F., Mathieux F. (2012) DG JRC Technical Reports: Integration of resource efficiency and waste management
criteria in European product policies – Second phase; Report n° 3. Available at:
http://lct.jrc.ec.europa.eu/assessment/projects.

Part 2: Enhancing MEErP for Ecodesign
8 | Material-efficiency Ecodesign Report and Module to the Methodology for the Ecodesign of Energy-related Products (MEErP)
Downcycling index k
The downcycling index k for plastics is calculated using prices for primary and secondary material
(as proposed by DG JRC). Also, different physical properties of primary and secondary material
could be used to calculate the downcycling index. A higher downcycling index k means a higher
quality of the recycled material. Thereby, k ≤ 1. The specific values per material can be found (and
edited) in sheet “Input RBR” in column C. Default values for the downcycling index k are
implemented in the EcoReport tool and presented in Table 1. These can be changed by the user
of the EcoReport tool when specific data is available. Thereby, the user can also address
characteristics of the analysed product, e.g.:
Plastics in the product are colour-coated: downcycling index is assumed to be low
as colour coating is hindering for recycling.
Only one type of plastic is used in the product, the plastic is not coloured or
coated: downcycling index is higher as such a product is easier to recycle.
Recycling rate for recyclable parts RCR
The recycling rate RCR for the recyclable parts can be adjusted not only per material categories
bulk and technical plastics but individually per plastic type.
It can be assumed for the RBR that an improved design for recyclability will lead to higher
recycling rates. Therefore, the recycling rates should be determined by the user (sheet “Input
RBR”, column D).
The recycling rate RCR and the downcycling index k might also depend on the analysed product
group, e.g.:
Cell phones: the plastic chassis is rather small and exists in many different colours
or with metal coating. Thus, recyclers might not consider this component
valuable as the downcycling index would be high and therefore the recycling rate
might be low even when easily separable.
White goods: plastic parts are big and more or less all in the same colour.
Therefore, the downcycling index is comparably low, the plastic parts are more
valuable for the recycler and therefore the recycling rate might be higher.
The consultant can derive suitable recycling rates from national statistics, but better in direct
contact with recyclers specifically for the analysed product groups. In some cases, even the
manufacturers of the products might have this information from recyclers as they are responsible
for the end-of-life treatment according to WEEE.
Impact of recycling R
Default values for the impact of recycling R are implemented in the EcoReport tool. Fields
marked in blue in the EcoReport tool are average values, not specific for this material. The values
can be found and edited (for each plastic individually) in sheet “Input RBR” (fields E5 to S24).
The user of the EcoReport tool is requested to insert more accurate values when available and of
importance for the analysed product (group).
Material efficiency in the MEErP
Material-efficiency Ecodesign Report and Module to the Methodology for the Ecodesign of Energy-related Products (MEErP)
| 9
Results
The result is presented as additional result per impact in sheet “Results” in column N named
“RBR” in the EcoReport tool. The results of the recyclability benefit rate per material are
displayed in sheet “Data RBR”.
1.1.3 Guidance: How to understand and interpret the results
As new parameter, the recyclability benefit rate (RBR) is included in the EcoReport tool. The
recyclability benefit rate shows the potential credit through recycling of plastics. Thereby, the
user decides which plastic parts/components are recyclable.
In the EcoReport tool, the recyclability benefit rate addresses only plastics. However, for other
material categories, a general recycling is already assumed in the tool. An exception is the
modelling of metals. The recyclability benefit rate is not applied for metals. This however does
not mean that the recycling of metals would not be beneficial from environmental perspective,
but for all metal parts, it is already assumed that the material consists of a mix of primary and
secondary plastic. Therefore, no additional recyclability benefit is displayed.
For the base-case, the recyclability benefit rate is not very high as this should demonstrate the
technical average. To assess potential improvement options, including changes of materials and
e.g. design for disassembly, the recyclability benefit rate should be used to identify the effects of
a potential recycling.
When interpreting the results, the user has to asses qualitatively and evaluate if such a
recyclability benefit could be achieved due to a different product design or if this would require
changes in the recycling processes (and whether this is likely to happen). Thereby, the following
questions should be addressed by the user:
Can the product be disassembled (in an acceptable time/with acceptable effort)?
How are products generally treated during recycling (shredding, manual
disassembly, max. time for disassembly)? Are there specific requirements which
influence recycling from other legislation (e.g. batteries have to be separated)?
Are certain parts separable (e.g. composite materials)?
Are plastics coloured/coated?
How many different plastics are used within the product?
Are labels stuck on plastic parts?
Is the product easily separable (no glue connections, not too many screws, are
screws/click connectors visible, sandwich connections of different materials)?
Are there materials in the product, or within one component, which hinder
material recycling (e.g. copper/steel, copper/aluminium)? Is this a problem for the
analysed product? For instance:
The analysed product is normally shredded, incompatible materials
would end-up in the same material flow negative for recyclability

Part 2: Enhancing MEErP for Ecodesign
10 | Material-efficiency Ecodesign Report and Module to the Methodology for the Ecodesign of Energy-related Products (MEErP)
The analysed product is mostly manually disassembled,
incompatible materials are in different components positive for
recyclability
What are typical recycling routines for the analysed product group?
What are the main recyclable fractions in the product?
Which fractions are normally recycled?
Which fractions have the highest material value?
Which fractions are interesting from resource perspective (e.g.
Critical Raw Materials)?
Are certain valuable fractions not recycled? Why not?
Based on a detailed analysis of the typical recycling routines for the product group, the user has
to decide for which materials and at which rates a recycling treatment can realistically be
assumed.
The recyclability benefit rate can show theoretical improvements. The value is presented as
negative value to show the benefit (equivalent to the existing recycling values). The benefit
stems from the substitution of virgin material as well as avoided disposal. Based on his expertise,
the user has to evaluate if these are realistic improvement options regarding the whole life cycle
of the product or if changes in the design regarding recyclability (e.g. design for disassembly) are
worth the effort, as the recycling may not actually take place due to various reasons, such as:
Too much manual work
Too less valuable substances
Too many different product designs which are difficult for automated
disassembly
No disassembly at all
If recyclability seems to be an important question for the analysed product group, the user has to
decide whether more data on the recycling effort of certain materials has to be obtained, if
downcycling indices should be adjusted and what a suitable recycling rate for the individual
plastics would be.
In the new version of the EcoReport tool recycling is calculated as part of the general EoL
treatment of the product. The credit is given by the assumption that the recycled
parts/components substitute primary material (taking into account downcycling and impact of
the recycling process itself).
The user therefore has to enter an assumed recycling rate:
Recycling rate in general: As described in the MEErP 20117, the user should enter
a recycling rate for the different material categories. This recycling rate will be
7 Methodology for Ecodesign of Energy-related Products MEErP 2011 – Methodology Report, Part 2: Environmental
policies & data

Material efficiency in the MEErP
Material-efficiency Ecodesign Report and Module to the Methodology for the Ecodesign of Energy-related Products (MEErP)
| 11
used to calculate the normal end-of-life treatment of the product with disposal
and recycling.
In addition, for the recyclability benefit rate, the user should indicate a (higher)
recycling rate for the specifically recyclable parts. In case the user does not adjust
the default values, the recycling rate for recyclable parts will be calculated as
“best” recycling with the general recycling rate (i.e. multiplying by factor 1.1).
However, if high recyclability is assumed due to e.g. special take-back programs
of a company or similar, the recycling rate can be a lot higher than for the base-
case.
In addition, the recycling rate for the recyclability benefit rate can be adjusted not only per
material category plastics, but individually for each type of plastic.
Description of the general assessment of recycling in EcoReport 20118
The existing end-of-life module in the EcoReport tool differentiates between disposal and
recycling. Recycling thereby combines reuse, material recycling and energy recovery. For reuse,
material recycling and energy recovery, it is assumed that a percentage of the material is
recycled. The individual percentage can be adjusted by the user (sheet “Inputs”, fields in column
K to U, line 318 to 321) per material category (plastics, electronics, misc.), but not for the
individual materials (e.g. PVC, ABS, etc.). The recycling rate for metals cannot be changed,
because for metals no recycling is credited on product level, but it is assumed that the input
material contains already a mix of primary and secondary metals.
Thanks to this recycling, credit is given for the manufacturing of virgin material (for all material
groups except metals), i.e. the value presented in sheet “Results” in column K is calculated as a
percentage of the material manufacturing:
Reuse: 75% credit of material manufacturing
Material recycling: 40% credit of material manufacturing
Energy recovery: 30% credit of the material manufacturing
These percentages are fixed values, reflect very rough estimates for general product
replacement and are not product specific. The more detailed assumptions behind this are
described in MEErP 2011.
In comparison, the recyclability benefit rate presents an additional benefit in case some plastic
parts are easy to recycle based on detailed, product-specific assumptions.
When doing the analysis with the EcoReport tool, the recyclability benefit rate might seem
relatively low compared to the values of the generic recycling (i.e. values in the column K and
column O in sheet “Results”). This is explained by the different way of calculating the impacts of
recycling and the benefit of additional recycling. The generic recycling covers all materials in the
product, whereas the recyclability benefit rate only includes additional benefits due to the plastic
parts marked specifically as recyclable. Therefore, the interpretation of the recyclability benefit
8 The general assessment of recycling in EcoReport 2011 is maintained in EcoReport tool 2013. The RBR is an additional
feature, which does not affect the general recycling.

Part 2: Enhancing MEErP for Ecodesign
12 | Material-efficiency Ecodesign Report and Module to the Methodology for the Ecodesign of Energy-related Products (MEErP)
rate should be compared against the total impacts of the product’s life cycle or the production
phase, rather than against the generic recycling value.
1.1.4 Implementation of Recyclability Benefit Rate in the
EcoReport Tool
The RBR is implemented according to formula 11 in DG JRC report6.
))
The recyclability benefit is calculated individually for each material and impact category. The
following input parameters are used:
mrec: Recyclable mass per material
RCR: Recycling rate for the recyclable materials
D: Impact of end-of-life treatment (impact of disposal and benefit of general
recycling)
k: Downcycling index
V: Impact of material production of the primary (“virgin”) material
R: Impact of the recycling process
Mass of the recyclable parts mrec
mrec is the mass of these plastic parts which are recyclable. A part is only accounted for as
recyclable when it is marked with “yes” in sheet “Inputs”, column G.
Downcycling index k
The downcycling index k for plastics is defined by the quality of primary and secondary material
(as proposed by DG JRC):
Qr: Quality of recycled material “measured in terms of physical parameters (e.g.
the tensile strength of the recycled material) or economic parameters (e.g. the
value of the secondary material)”
QV: Quality of virgin/primary material “measured in terms of physical parameters
(e.g. the tensile strength of the virgin material) or economic parameters (e.g. the
value of primary material)”
A higher downcycling index k means a higher quality of the recycled material. Thereby, k ≤ 1.
In sheet “Input RBR”, all materials included in the EcoReport tool are listed. For other materials
than plastics, the downcycling index k is set to “0”. This does not mean that the materials cannot
by recycled, but that a downcycling index is not known at the moment. Therefore, these
materials are not included in the calculation of the EcoReport tool.

Material efficiency in the MEErP
Material-efficiency Ecodesign Report and Module to the Methodology for the Ecodesign of Energy-related Products (MEErP)
| 13
Default values for the downcycling index k are implemented in the EcoReport tool and presented
in Table 1. Within this project, the downcycling indices were based on economic parameters, i.e.
the market prices. Market prices for primary and secondary plastics are used from plasticker
market reports9 to calculate the downcycling index. By displaying the downcycling rates in a
specific Excel sheet “Input RBR” in the EcoReport tool, the assumed downcycling rates are
transparent for the user and easy to update (e.g. if future secondary plastics might have a higher
quality/price).
For plastics for which no prices were available, k = 0.4 as the lowest calculated value was used as
default value (indicated in blue in the EcoReport tool, sheet “Input RBR”, column C and
highlighted in green in Table 1). These can be changed by the user of the EcoReport tool when
specific data is available. Thereby, the user can also address characteristics of the analysed
product, e.g.:
Plastics in the product are colour-coated: downcycling index is assumed to be low
as colour coating is hindering for recycling.
Only one type of plastic is used in the product, the plastic is not coloured or
coated: downcycling index is higher as such a product is easier to recycle.
Recycling rate for recyclable parts RCR
It can be assumed for the RBR that an improved design for recyclability will lead to higher
recycling rates. No default values are given. The recycling rates should be determined by the
user (sheet “Input RBR”, column D).
Impact of recycling R
For the impact of recycling R, the same values for PVC, PET and HDPE as the data set for
recycled content are used, using information from the US Life Cycle Inventory Data Base and
Franklin Associates 201010. For the other materials, no data could be obtained within this study.
Therefore, the values were determined as a percentage of the production of the virgin material.
The three existing data sets were used to calculate the share of the recycling process to the
primary material production per impact category. The following values were derived:
Total energy: 25%
Electricity: 15%
Process water: 110%
Cooling water: no data
Waste hazardous: 0%
9 Market reports on primary and secondary plastics, September 2013:
http://plasticker.de/preise/marktbericht2.php?j=13&mt=9&quelle=bvse
10 Final Report – Life Cycle Inventory of 100% Postconsumer HDPE and PET recycled Resin from Postconsumer
Containers and Packaging, The Plastics Division of the American Chemistry Council, Inc., The Association of
Postconsumer Plastic Recyclers (APR), The National Association for PET Container Resources (NAPCOR), The PET
Resin Association (PETRA); Franklin Associates, 2010

Part 2: Enhancing MEErP for Ecodesign
14 | Material-efficiency Ecodesign Report and Module to the Methodology for the Ecodesign of Energy-related Products (MEErP)
Waste non-hazardous: 1%
GWP: 55%
Acidification: 10%
VOC: 2%
POP: no data
Heavy Metals to air: 1%
PAH: 0%
Particulate Matter: 4%
Heavy metals to water: 17%
Eutrophication: 1%
The values can be found and edited (for each plastic individually) in sheet “Input RBR” (fields E5
to S24).
Default values for the impact of recycling R are implemented in the EcoReport tool and
presented in Table 1 and Table 2. Fields marked in green in these tables (or blue in the EcoReport
tool) are average values, not specific for this material. For feedstock energy, cooling water and
persistent organic pollutants (POP) no data could be obtained.
Impact of Disposal D
The impact of end-of-life treatment includes the impact of disposal and benefit of general
recycling. The existing values in the EcoReport tool 2011 are used (not visible in the public version
of the EcoReport tool).
Impact of material production of the primary (“virgin”) material V
For the impact of material production of the primary material V, the existing values in the
EcoReport tool 2011 are used (not visible in the public version of the EcoReport tool). V includes
only the impact for the manufacturing of the material and not for the production of the final
product.

Material efficiency in the MEErP
Material-efficiency Ecodesign Report and Module to the Methodology for the Ecodesign of Energy-related Products (MEErP) | 15
Table 1: Downcycling index k and impact for recycling of plastics – 1 –
Downcycling index k
Primary energy
Electric energy
Water process Water cool Waste
hazardous Waste non-hazardous
GWP
MJ/kg MJ/kg L/kg L/kg kg/kg kg/kg kg CO2 eq/kg
1 –LDPE 0.66 19.45 2.00 3.30 0.00 0.44 1.04
2 -HDPE 0.74 9.44 1.76 3.91 0.00 0.08 0.67
3 –LLDPE 0.4 18.50 1.53 2.64 0.00 0.31 1.02
4 –PP 0.39 18.17 1.09 5.28 0.00 0.28 1.09
5 –PS 0.56 21.68 0.54 5.39 0.00 0.22 1.54
6 –EPS 0.4 20.92 0.51 6.27 0.00 0.38 1.49
7 -HI-PS 0.4 23.06 0.70 6.057 0.00 0.30 1.60
8 -PVC 0.42 26.00 1.67 69.20 0.00 0.67 2.06
9 –SAN 0.4 22.35 0.57 6.71 0.00 0.32 1.65
10 -PET 0.41 11.92 1.66 4.80 0.00 0.22 0.80
11 –ABS 0.51 23.76 1.04 10.23 0.00 0.92 1.83
12 -PA 6 0.61 29.88 2.27 17.60 0.00 1.76 4.71
13 –PC 0.63 29.20 2.23 15.40 0.00 1.77 2.97
14 –PMMA 0.4 27.55 1.96 10.78 0.00 1.05 3.30
15 –Epoxy 0.4 35.18 3.68 20.90 0.00 4.07 3.63
16 -Rigid PUR 0.4 26.06 2.62 66.00 0.00 4.27 2.30
17 -Flex PUR 0.4 26.11 2.81 77.00 0.00 5.49 2.46
Part 2: Enhancing MEErP for Ecodesign
16 | Material-efficiency Ecodesign Report and Module to the Methodology for the Ecodesign of Energy-related Products (MEErP)
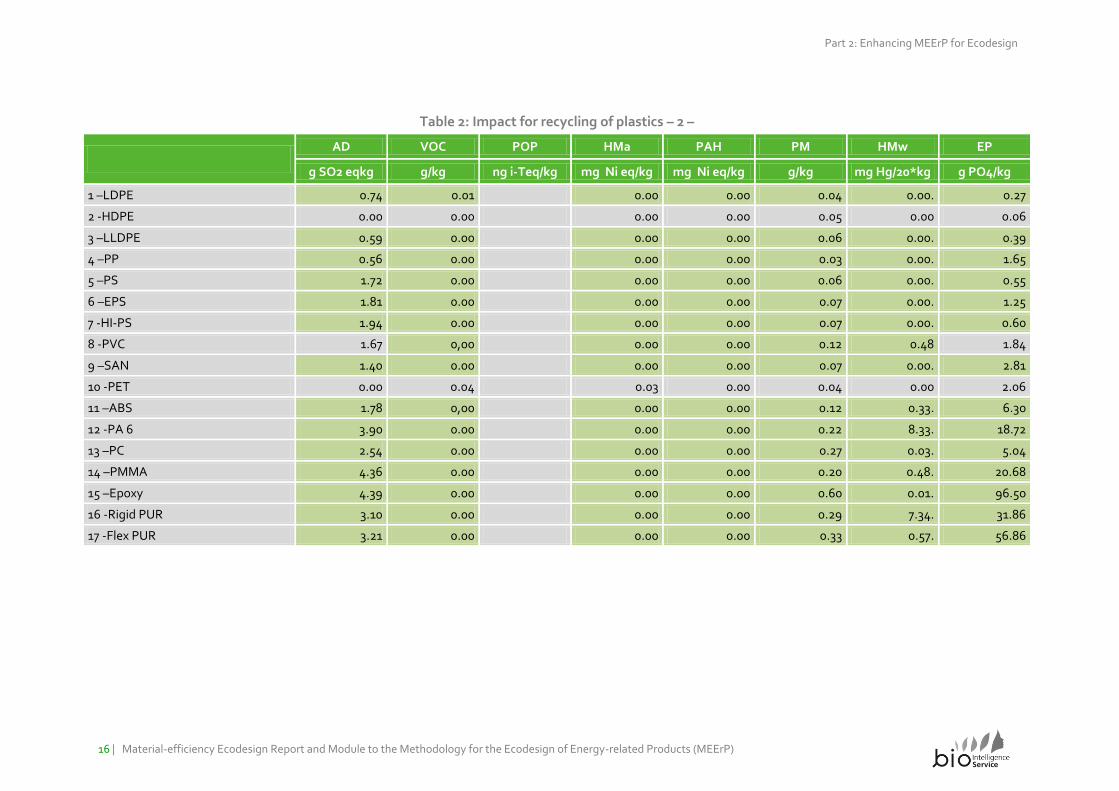
Table 2: Impact for recycling of plastics – 2 –
AD VOC POP HMa PAH PM HMw EP
g SO2 eqkg g/kg ng i-Teq/kg mg Ni eq/kg mg Ni eq/kg g/kg mg Hg/20*kg g PO4/kg
1 –LDPE 0.74 0.01 0.00 0.00 0.04 0.00. 0.27
2 -HDPE 0.00 0.00 0.00 0.00 0.05 0.00 0.06
3 –LLDPE 0.59 0.00 0.00 0.00 0.06 0.00. 0.39
4 –PP 0.56 0.00 0.00 0.00 0.03 0.00. 1.65
5 –PS 1.72 0.00 0.00 0.00 0.06 0.00. 0.55
6 –EPS 1.81 0.00 0.00 0.00 0.07 0.00. 1.25
7 -HI-PS 1.94 0.00 0.00 0.00 0.07 0.00. 0.60
8 -PVC 1.67 0,00 0.00 0.00 0.12 0.48 1.84
9 –SAN 1.40 0.00 0.00 0.00 0.07 0.00. 2.81
10 -PET 0.00 0.04 0.03 0.00 0.04 0.00 2.06
11 –ABS 1.78 0,00 0.00 0.00 0.12 0.33. 6.30
12 -PA 6 3.90 0.00 0.00 0.00 0.22 8.33. 18.72
13 –PC 2.54 0.00 0.00 0.00 0.27 0.03. 5.04
14 –PMMA 4.36 0.00 0.00 0.00 0.20 0.48. 20.68
15 –Epoxy 4.39 0.00 0.00 0.00 0.60 0.01. 96.50
16 -Rigid PUR 3.10 0.00 0.00 0.00 0.29 7.34. 31.86
17 -Flex PUR 3.21 0.00 0.00 0.00 0.33 0.57. 56.86

Material efficiency in the MEErP
Material-efficiency Ecodesign Report and Module to the Methodology for the Ecodesign of Energy-related Products (MEErP)
| 17
1.2 Recycled content
1.2.1 Definition
Recycled content can be defined as the “input” of materials with origin on waste (i.e. secondary
material). This is limited here to some recycled plastics and recycled paper, as metals already
integrate a share of secondary material which is not always known by the manufacturer.
Although the term “recycled content” may lead to the assumptions that it refers the end-of-life
treatment of the product, this parameter is focussed on the manufacturing phase of the life
cycle, defining the origin of materials used for a product (different than the recyclability benefit
rate which depends on the end-of-life treatment).
The aspect of recycled content is not addressed via the rate of recycled content in the product
but by including new data sets of recycled content, which can be used to assess the
environmental impact of a product.
1.2.2 Guidance: How to use “Recycled Content” in the EcoReport
tool
Data for recycled content includes the following new data sets:
Paper:
Office paper from recycled paper
Office paper from primary cellulose
PVC
HDPE
PET
These should be used when a component is made partly or entirely of post-consumer recycled
plastics. Example:
Component “Housing. 300 g” made entirely of recycled plastics:
Model the component as one line in the EcoReport tool. Choose the
corresponding data set for recycled plastics (column F in sheet
“Inputs”) with 300 g.
Component “Housing 300 g” includes 15% recycled plastics:
Model as two different data sets in the EcoReport tool
“Housing conventional plastics”: 255 g
“Housing recycled plastics”: 45 g
The new data sets can be found in the following material categories (column E in sheet “Inputs”):

Part 2: Enhancing MEErP for Ecodesign
18 |
Material-efficiency Ecodesign Report and Module to the Methodology for the Ecodesign of Energy-related Products (MEErP)
Paper: Extra Materials
PVC, HDPE, PET: Bulk Plastics
The presentation of the results does not change when using these new data sets.
If the user wants to add further data sets on recycled content, this can be done via the sheet
“Extra Materials”. To be comparable with the existing data sets, it should be ensured that the
newly included data comprises the impact of material production and component
manufacturing. These new data sets, which can be added by the user, are not limited to plastics,
but are generally open also to other materials. When adding e.g. new data sets for e.g. recycled
metals, the user should keep in mind that the existing data sets in the EcoReport tool already
include a mix of recycled and primary metals.
Besides, the sheet “Extra Materials” cannot only be used for recycled materials but also to add
any other material, which is not yet included in the EcoReport tool.
1.2.3 Guidance: How to understand and interpret the results
When comparing the results of a product with and without recycled content, the differences in
environmental impact of the whole product can be compared (sheet “Results”). In case the two
compared product designs include more differences than the type of plastic, the individual
impact of the recycled plastic can be found in sheet “Raw”.
1.2.4 Implementation of Recycled Content in the EcoReport Tool
Within this project, no new data could be obtained from industry. Only publicly available data
could be used. Therefore, the new data sets are limited to three recycled plastics plus recycled
paper. The choice of materials should not be understood as the most important materials or
plastics for ErPs but was driven by the availability of data. Sources of the Life Cycle Inventories of
the new data sets are:
Paper:
Office paper from recycled paper: IFEU 200611
Office paper from primary cellulose: IFEU 2006
PVC: VinyLoop12
PET: Franklin Associates 201013
11 IFEU (2006) Ökologischer Vergleich von Büropapieren in Abhängigkeit vom Faserrohstoff/Ecolologic comparison of
office paper based on the fibre resource, IFEU.
12 The Eco-Footprint on VinyLoop – Benchmarking of the environmental impact of PVC compound recycled in the
VinyLoop process with PVC compound produced in conventional route (virgin PVC compound and incineration),
August 2012.
13 Final Report – Life Cycle Inventory of 100% Postconsumer HDPE and PET recycled Resin from Postconsumer
Containers and Packaging, The Plastics Division of the American Chemistry Council, Inc., The Association of

Material efficiency in the MEErP
Material-efficiency Ecodesign Report and Module to the Methodology for the Ecodesign of Energy-related Products (MEErP)
| 19
HDPE: Franklin Associates 2010
The new data sets on plastic are included in the general list of bulk materials. Impact of material
manufacturing for the recycled plastics is taken from the cited literature sources. For the impact
of production of the final product, the existing values in the EcoReport tool are used.
Paper is included in the sheet “Extra Materials”.
For paper, two new data sets were included, one for recycled paper and one for paper from
primary cellulose. This was done because the data set for recycled paper by IFEU 2006 had higher
values for energy and water consumption than the original value in The EcoReport tool. This
seems to be very unlikely as many environmental assessment show the effect of less energy and
water use for recycling paper.
It is not known which exact data source was used for the existing paper data set in the EcoReport
tool. However, the value for process water was zero. As water use is one of the main impacts
from paper production, this data set does not seem very reliable. Therefore, two new data sets
for recycled and primary paper were included. As they are both from the same data source, the
assessment approach as well as system boundaries and cut-offs are similar.
Comparison with the draft BREF on paper14 showed that the data presented there is significantly
smaller (see Table 5). This refers to the energy consumption (electricity and total energy) and
water consumption. The amount of waste is in the same range as the data by IFEU 2006. The
data on the manufacturing processes in BREF 2013 is very detailed on mostly primary data from
current plants. However, it is not possible to derive in all cases (especially for recycled paper and
cardboard) results for the final impact categories (GWP, Acidification potential, etc.). The data in
BREF 2013 is up-to-date and mostly primary data from European plants. However, as it is also
very fragmented and it is not clear if upstream processes were addressed in any way, it was
decided within this project to include in the EcoReport tool data by IFEU 2006 on primary and
secondary paper.
For all new included data sets, the values for each impact category are presented in Table 3 and
Table 4. If a cell is empty, this means that the existing environmental assessment did not cover
that impact category and the value is not known. If the value is 0.00, the value for this impact
category is zero or less than 0.005.
For comparative reasons, it should be taken into account that the existing data sets in the
EcoReport tool (EcoReport tool 2011) do also not cover all listed impact categories:
Bulk and tech plastics: no data on persistent organic pollutants (POP) and heavy
metals to air (HMa), only partly data on heavy metals to water (HMw)
Office paper: no data on water use (process and cooling), hazardous waste, POP,
HWa, HWm and PAH
Postconsumer Plastic Recyclers (APR), The National Association for PET Container Resources (NAPCOR), The PET
Resin Association (PETRA); Franklin Associates, 2010
14 BREF 2013: Best Available Techniques (BAT) Reference Document for the Production of Pulp, Paper and Board –
Final Draft; JRC, July 2013; http://eippcb.jrc.ec.europa.eu/reference/BREF/PP_BREF_FD_07_2013.pdf

Part 2: Enhancing MEErP for Ecodesign
20 | Material-efficiency Ecodesign Report and Module to the Methodology for the Ecodesign of Energy-related Products (MEErP)
Table 3: New data sets included in the EcoReport tool (values per kg material) – 1 –
Primary energy Electric energy Feedstock Water process Water cool
Waste hazardous
Waste non-hazardous
MJ MJ MJ L L kg kg
Office paper (from recycled paper) 15.14 3.81 20.46
Office paper (from primary cellulose) 39.71 1.80 52.23 0.00 0.02
PVC (recycled) 26.00 69.20
PET (recycled) 11.92 1.66 4.80 0.00 0.22
HDPE (recycled) 9.44 1.76 3.91 0.00 0.08
Table 4: New data sets included in the EcoReport tool (values per kg material) – 2 –
GWP AD VOC POP HMa PAH PM HMw EP
kg CO2 eq g SO2 eq g ng i-Teq mg Ni eq. mg Ni eq. g mg Hg/20 g PO4
Office paper (from recycled paper) 0.93 2.57 2.45 0.35
Office paper (from primary cellulose) 1.20 9.09 8.45 0.74
PVC (recycled) 2.06 1.67 1.84
PET (recycled) 0.80 0.00 0.04 0.03 0.00 0.04 0.00 2.06
HDPE (recycled) 0.67 0.00 0.00 0.00 0.00 0.05 0.00 0.06

Material efficiency in the MEErP
Material-efficiency Ecodesign Report and Module to the Methodology for the Ecodesign of Energy-related Products (MEErP)
| 21
Table 5: Comparison of life cycle data on paper
Material
Primary energy
Electric energy
Feedstock
Water process
Water cool
Waste hazardous
Waste non-
hazardous GWP AD VOC PM EP
Source
MJ MJ MJ L L kg kg kg CO2 eq. g SO2 eq. g g g PO4
Office paper (from recycled paper)
15.14 3.81 20.46 0.93 2.57 2.45 0.35
IFEU 2006
Office paper (from primary cellulose)
39.71 1.80 52.23 0.00 0.02 1.20 9.09 8.45 0.74
IFEU 2006
Office paper 13 6 0 0.068 0.6 5 0.2 2 5.288 MEErP 2011
Cardboard 12 2 0 0.052 0.7 1 0.086 MEErP 2011
Paper (coated and uncoated paper)
9.63 2.04 4.20 0.00 0.02 0.43a)
BREF 2013
Recycled paper (Newsprint)
1.80 14.50 0.50
BREF 2013
Recycled paper (Packaging paper)
0.72 18.25 0.08
BREF 2013
a) The CO2 value in BREF 2013 (0.229 kg CO2/kg) did not include purchased electricity. So this was added using an EU average electricity conversion factor (0.34723 kg
CO2/kWh according to DEFRA 2013).

Part 2: Enhancing MEErP for Ecodesign
22 |
Material-efficiency Ecodesign Report and Module to the Methodology for the Ecodesign of Energy-related Products (MEErP)
1.3 Lifetime
1.3.1 Definition
The general term “Lifetime” can refer to
The technical lifetime is the time that a product is designed to last to fulfil its
primary function (technical lifetime).
The actual time in service is the time the product is used by the consumer (service
lifetime). The actual time in service is not a typical parameter in industry and
depends more on the user than on the manufacturers or the product design.
In the existing version of the EcoReport tool, the average “service lifetime”15 is used to calculate
the emissions over the whole life cycle of the product.
To emphasize the aspect of lifetime in the analysis, the results will be displayed not only as total
number over the whole lifespan but also per year of use, allowing an easier comparison of
products with different lifetimes or analysing the effect of lifetime extension.
1.3.2 Guidance: How to use Lifetime in the EcoReport tool
The results per year of use of the analysed product are displayed as an additional result table in
the sheet “Results” in the EcoReport tool (B53 to N93). Thereby, the effects of a longer lifetime
due to a different product design can be easily compared.
The years of use will be calculated according to the lifetime which is implemented in sheet
“Inputs”, field D246/272. In case no lifetime is set, the results per year of use will be displayed as
not available (“n.a.”).
1.3.3 Guidance: How to understand and interpret the results
Section 1.3.2 above describes how the new way of displaying “results per years of use” can be
used in the EcoReport tool 2013. This section describes what aspects should be analysed and
which different assumptions should be compared to fully assess the impact of the assumed
lifetime on the assessment of the base case and possible improvement options.
The user should asses the different lifetimes typical for the analysed product group:
Technical lifetime
15 In the existing EcoReport tool 2011, service lifetime was defined as “Product service life is period in use (not out of
use but still not discarded).” This corresponds to the definition given above for “service lifetime”.

Material efficiency in the MEErP
Material-efficiency Ecodesign Report and Module to the Methodology for the Ecodesign of Energy-related Products (MEErP)
| 23
Service lifetime: if relevant for the analysed product group, it should be
differentiated between first and second use (e.g. main TV shifts for second use in
the kids room, secondary purchase via eBay)
The aspect of first and second use might be relevant when use patterns are defined (e.g. more
heavy use in first use, less frequent use in second use). Besides, it should be assessed if the use
pattern has a significant impact on the lifetime (e.g. products which are used heavily live shorter).
The different lifetimes can vary more or less, depending on the considered product group. For
some product groups the technical lifetime might be more or less identical with the years of use.
For “lifestyle” products the years of use might be shorter than the technical lifetime.
The warranty cannot be used as proxy for the technical lifetime or years of use but (for most
products) indicates the minimum lifetime. Therefore, the user should analyse typical warranties
offered for this product group when carrying out Task 3 of the MEErP.
It should be analysed and evaluated which technical aspects of the product design (e.g. easy
reparability) and/or effects of the marketing strategy of a company can have a significant effect
on the technical lifetime and use time of the product. Examples for marketing strategies which
can influence the use time and should be considered when estimating the actual time in service
of a product are:
Availability of spare parts could increase actual time in service
Low/high prices for repair compared to a new product could increase/decrease
actual time in service
Possibility to hand in old devices to get a discount on new devices could
decrease actual time in service
Durable product design which increases the technical lifetime (e.g. metal instead
of plastic parts) could increase actual time in service
Upgradability, long support time (e.g. with software updates) could increase
actual time in service
Regarding the use time, durability aspects should be analysed. This includes the wear which
reduces the performance or outer appearance of the product without impairing the product’s
ability to fulfil its main function. These durability aspects depend highly on the product group
under consideration, for instance:
Are there performance losses over time, e.g. the product consumes more energy
for the same performance, increased noise, colour faults (displays, lamps)?
Does the chassis show wearing (scratches, stains, etc.)?
Will the standby/use time significantly shorten due to battery wear-down?
To reflect the (potential) benefits of a longer service lifetime of products (thanks to improvement
options), the results should be compared per year of use, using the new result fields in the
EcoReport tool. A longer lifetime is usually beneficial, but at EU level a shorter lifetime would
help replace the stock so that new and more energy efficient units would substitute the stock and

Part 2: Enhancing MEErP for Ecodesign
24 |
Material-efficiency Ecodesign Report and Module to the Methodology for the Ecodesign of Energy-related Products (MEErP)
reduce the total EU energy consumption, resulting in a conflict between material and energy
efficiency.
For products were the service lifetime is more or less equivalent to the technical lifetime, the
focus should be on design options to increase the technical lifetime. For products which are used
shorter than the technical lifetime would allow (e.g. “lifestyle” products), the focus of the
improvement options should not be on design options to increase the technical lifetime but on
design options which might promote a longer use (e.g. different chassis which does not show
wearing, upgradability, changeable batteries).
1.3.4 Implementation of Lifetime in the EcoReport tool
To display the results per year of use, no new information are inserted in the EcoReport tool. The
existing results from sheet “Results”, fields E26 to N44 are divided through the number of years
of the given lifetime (sheet “Inputs”, field D246/272).
1.4 CRM (Critical Raw Materials)
1.4.1 Definition
The CRM indicator is not an environmental indicator as such, but describes the scarcity of a
material from economic perspective. From the European list of 14 critical raw materials16, the
MEErP methodology 2011 has developed an indicator ranging the individual scarcity of the
materials within that group. The characterization factors are based on the following aspects: 17
Consumption in the EU
Import dependency
Substitutability
Complement of the recycling rate
1.4.2 Guidance: How to calculate the CRM index
This indicator is not included in the EcoReport tool but can be applied separately. The CRM
indicator can be calculated according to the following formula:
∑
16 Tackling the Challenges in Commodity Markets and on Raw Materials, COM(2011)25 final of 2.2.2011, http://eur-
lex.europa.eu/LexUriServ/LexUriServ.do?uri=COM:2011:0025:FIN:en:PDF.
17 Methodology for Ecodesign of Energy-related Products MEErP 2011 – Methodology Report, Part 2: Environmental
policies & data.

Material efficiency in the MEErP
Material-efficiency Ecodesign Report and Module to the Methodology for the Ecodesign of Energy-related Products (MEErP)
| 25
With
mi: mass of critical raw material i in the product
ci: characterization factor of critical raw material i (see Table 6)
i to N: critical raw materials listed in Table 6
Table 6: Characterization factors to calculate the CRM indicator according to MEErP 201118
Critical Raw Material Characterization factor
kg Sb eq./kg
Germanium (Ge) 18
Beryllium (Be) 12
Tantalum (Ta) 9
Indium (In) 9
Platinum Group metals (PGM) 8
Gallium (Ga) 8
Antimony (Sb) 1
Tungsten 0.2
Niobium (Nb) 0.04
Rare earth elements (Sc, Y, Nd) 0.03
Cobalt (Co) 0.02
Graphite (C) 0.01
Fluorspar (CaF2) 0.001
Magnesium (Mg) 0.0005
1.4.3 Guidance: How to interpret the CRM index
It should be analysed if the product includes critical raw materials and if there are differences
between different product designs/improvement options. In case there are differences regarding
the amount of CRM, the user has to decide if the CRM indicator needs to be applied.
A list of product in which CRM are often used is included in the MEErP 2011 (Part 2, page 20).
The user should keep in mind that a positive result with the CRM indicator does not mean
that the product has lower environmental impacts, but that it includes less scarce materials
(from economic perspective).Thereby, the CRM indicator addresses the topic not from
environmental but from scarcity perspective. The CRM indicator can help to assess whether the
use of some rare earth would be better or worse than the use of e.g. platinum group metals from
scarcity perspective. Thereby, the indicator take into account only the 14 CRM defined by for the
EU19.
18 Methodology for Ecodesign of Energy-related Products MEErP 2011 – Methodology Report, Part 2: Environmental
policies & data, page 21
19 “Critical raw materials for the EU”, Report of the Ad-hoc Working Group on defining critical raw materials, 30 July
2010.

Part 2: Enhancing MEErP for Ecodesign
26 |
Material-efficiency Ecodesign Report and Module to the Methodology for the Ecodesign of Energy-related Products (MEErP)
1.4.4 Implementation of the CRM indicator in the EcoReport tool
The CRM indicator is not directly added in the EcoReport tool calculations but an extra sheet is
now available (sheet “CRM”), where the CRM indicator can be calculated separately. Therefore,
the user has to enter the amount of CRM in grams per product (sheet “CRM”, column C). The
result is then automatically calculated (sheet “CRM”, field E17) according to the formula
presented in section 1.4.2.

This page is left intentionally blank

5 December 2013
20-22 Villa Deshayes 75014 Paris
+ 33 (0) 1 53 90 11 80 biois.com