
Material Degradation of Nuclear Structures Mitigation by ... · A Short Review on the Iron-Carbon...
54
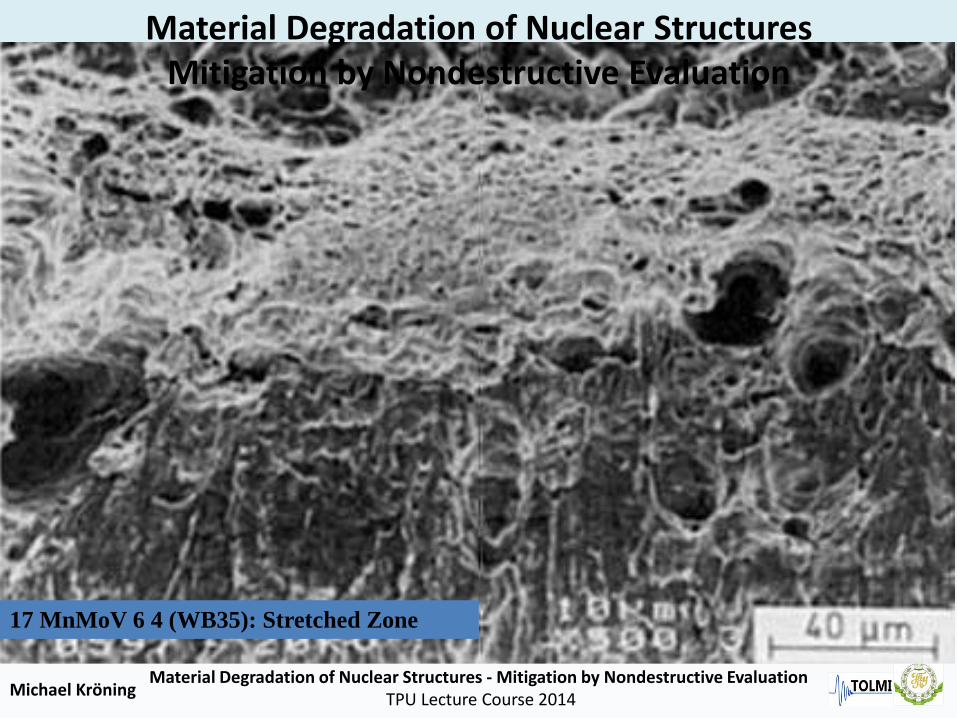
Michael Kröning Material Degradation of Nuclear Structures - Mitigation by Nondestructive Evaluation TPU Lecture Course 2014 Material Degradation of Nuclear Structures Mitigation by Nondestructive Evaluation 17 MnMoV 6 4 (WB35): Stretched Zone
Transcript of Material Degradation of Nuclear Structures Mitigation by ... · A Short Review on the Iron-Carbon...
Michael KröningMaterial Degradation of Nuclear Structures - Mitigation by Nondestructive Evaluation
TPU Lecture Course 2014
Material Degradation of Nuclear Structures Mitigation by Nondestructive Evaluation
17 MnMoV 6 4 (WB35): Stretched Zone

Michael KröningMaterial Degradation of Nuclear Structures - Mitigation by Nondestructive Evaluation
TPU Lecture Course 2014
Material Degradation of Nuclear Structures Mitigation by Nondestructive Evaluation
3. Focus on Steel – Carbon Steels
3.1. Basic Characteristics of Steel
3.2. Steel Qualities and Characterization Methods
3.3. Carbon Steel Microstructures
3.4. Microstructure Transformation
3.5. Transformation Diagrams
3.6. Localized Hardening
3.7. Steel Alloys

Michael KröningMaterial Degradation of Nuclear Structures - Mitigation by Nondestructive Evaluation
TPU Lecture Course 2014
Michael KröningMaterial Degradation of Nuclear Structures - Mitigation by Nondestructive Evaluation
TPU Lecture Course 2014

Michael KröningMaterial Degradation of Nuclear Structures - Mitigation by Nondestructive Evaluation
TPU Lecture Course 2014
Heat Treatments Transformation Diagrams
Transformation Diagrams help to understand transformations
There are two main types of transformation diagrams
that are helpful in selecting the optimum steel and processing route
to achieve a specified set of properties:
time-temperature transformation (TTT) diagram
continuous cooling transformation (CCT) diagram

Michael KröningMaterial Degradation of Nuclear Structures - Mitigation by Nondestructive Evaluation
TPU Lecture Course 2014
Heat Treatments
Time-temperature transformation (TTT) diagrams(isothermal diagrams: rate of transformation at a constant temperature)
Continuous cooling transformation (CCT) diagrams(extent of transformation during a continiously decreasing temperature)
A sample is:
austenitized,
then cooled rapidly to a specified lower temperature,
then held at that temperature for a specified time
A sample is:
austenitized,
then cooled at a predetermined rate
(the rate and degree of transformation is measured by dilatometry, for example)

Michael KröningMaterial Degradation of Nuclear Structures - Mitigation by Nondestructive Evaluation
TPU Lecture Course 2014
Heat Treatments
For understanding:
Let us go to the roots, the
IRON CARBON DIAGRAM

Michael KröningMaterial Degradation of Nuclear Structures - Mitigation by Nondestructive Evaluation
TPU Lecture Course 2014
Heat Treatments A Short Review on the Iron-Carbon Phase Diagram
Iron–Iron Carbide (Fe–Fe3C) Phase Diagram
(Steel Part up to 7% Carbon

Michael KröningMaterial Degradation of Nuclear Structures - Mitigation by Nondestructive Evaluation
TPU Lecture Course 2014
Heat Treatments - Microstructure Eutectoid Steel Hypoeutectoid Steel

Michael KröningMaterial Degradation of Nuclear Structures - Mitigation by Nondestructive Evaluation
TPU Lecture Course 2014
Heat Treatments Pearlite
Photomicrograph of Pearlite(Dark bands: Cementite)
Michael KröningMaterial Degradation of Nuclear Structures - Mitigation by Nondestructive Evaluation
TPU Lecture Course 2014
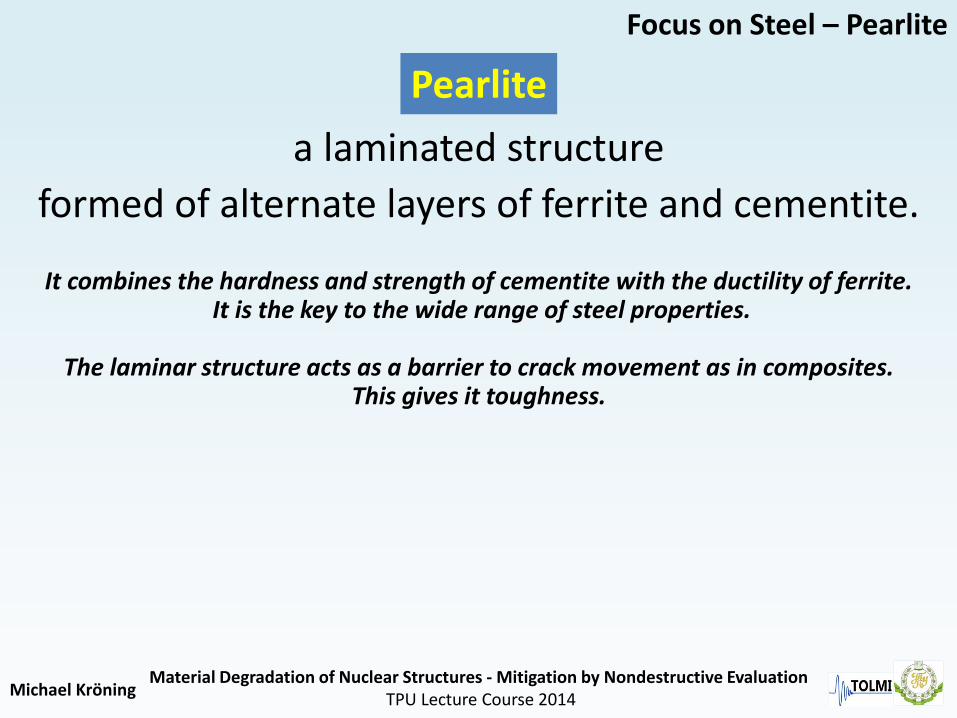
a laminated structure
formed of alternate layers of ferrite and cementite.
Focus on Steel – Pearlite
Pearlite
It combines the hardness and strength of cementite with the ductility of ferrite.It is the key to the wide range of steel properties.
The laminar structure acts as a barrier to crack movement as in composites. This gives it toughness.

Michael KröningMaterial Degradation of Nuclear Structures - Mitigation by Nondestructive Evaluation
TPU Lecture Course 2014
Heat Treatments – Hypoeutectic Alloys
Eutectoid α Proeutectoid α

Michael KröningMaterial Degradation of Nuclear Structures - Mitigation by Nondestructive Evaluation
TPU Lecture Course 2014
Heat Treatments – Microstructure of Hypereutectic Steels
Michael KröningMaterial Degradation of Nuclear Structures - Mitigation by Nondestructive Evaluation
TPU Lecture Course 2014
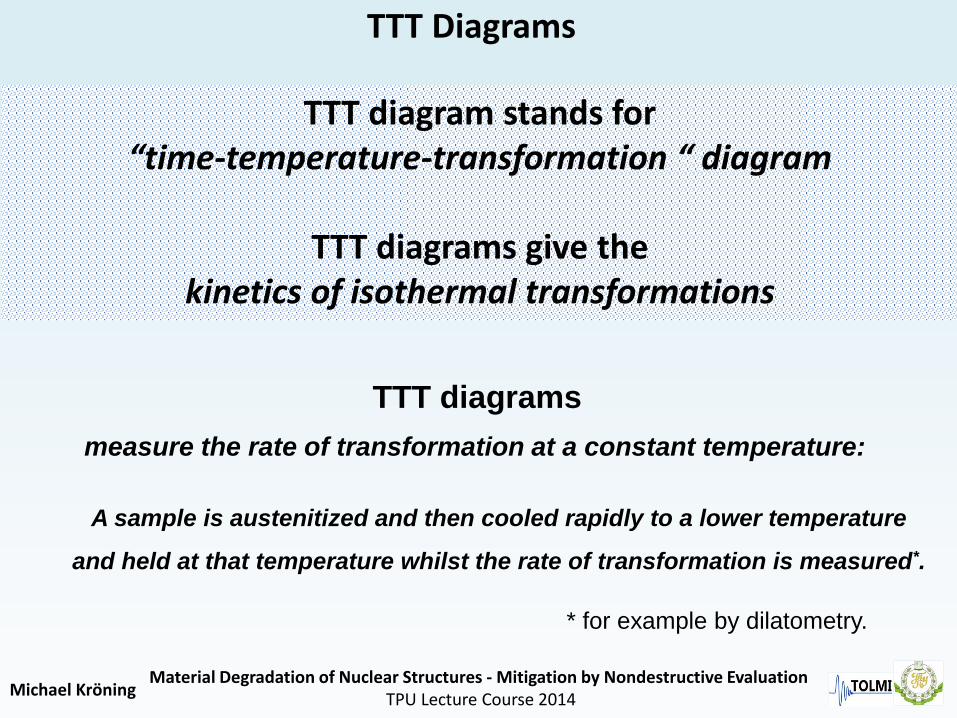
TTT Diagrams
TTT diagram stands for“time-temperature-transformation “ diagram
TTT diagrams give the kinetics of isothermal transformations
TTT diagrams
measure the rate of transformation at a constant temperature:
A sample is austenitized and then cooled rapidly to a lower temperature
and held at that temperature whilst the rate of transformation is measured*.
* for example by dilatometry.

Michael KröningMaterial Degradation of Nuclear Structures - Mitigation by Nondestructive Evaluation
TPU Lecture Course 2014
At T1:t2 = incubation periodt4 = finish time
At t1 (“nose”):minimum incubation period
R. Manna: Time Temperature Transformation(TTT) Diagrams,University of [email protected] of Technology,Banaras Hindu University,Varanasi, [email protected]
Heat Treatments-Isothermal Transformation (TTT-) Diagram
Time temperature transformation (schematic) diagram for plain carbon eutectoid steel

Michael KröningMaterial Degradation of Nuclear Structures - Mitigation by Nondestructive Evaluation
TPU Lecture Course 2014
Heat Treatments-Isothermal Transformation (TTT-) Diagram (Temperature, Time, and % Transformation)C
EXAMPLE: EUTECTOID STEEL
The S-shaped curves are shifted to longer times at higher Tshowing that the transformation is dominated by nucleation and not by diffusion.
Diffusion occurs faster at higher temperatures,nucleation rate increases with super-cooling.
Michael KröningMaterial Degradation of Nuclear Structures - Mitigation by Nondestructive Evaluation
TPU Lecture Course 2014
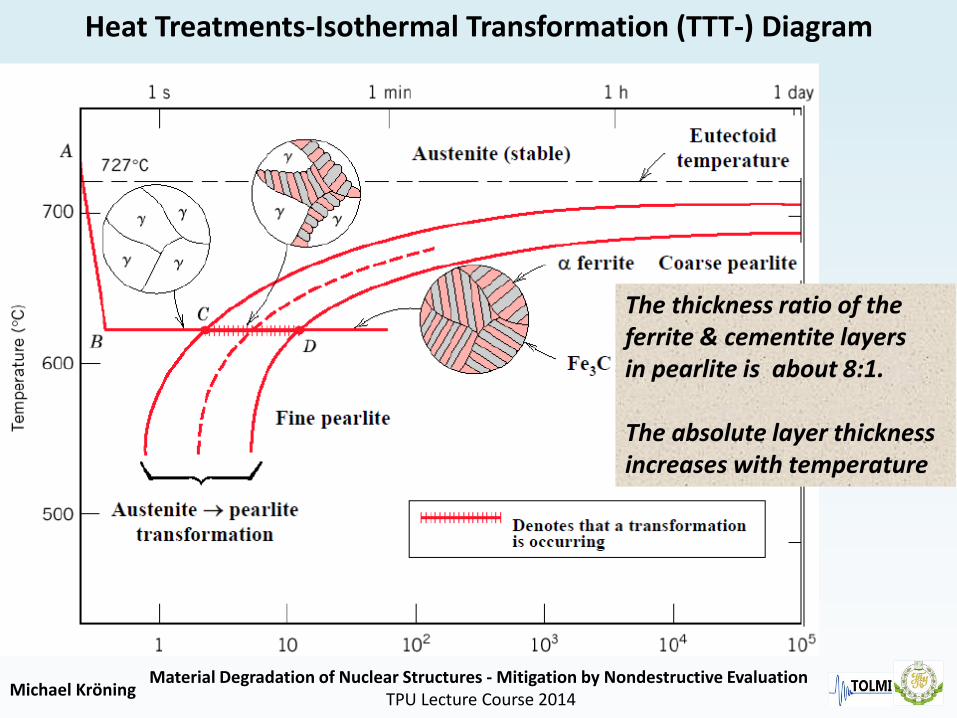
Heat Treatments-Isothermal Transformation (TTT-) Diagram
The thickness ratio of the ferrite & cementite layersin pearlite is about 8:1.
The absolute layer thickness increases with temperature
Michael KröningMaterial Degradation of Nuclear Structures - Mitigation by Nondestructive Evaluation
TPU Lecture Course 2014
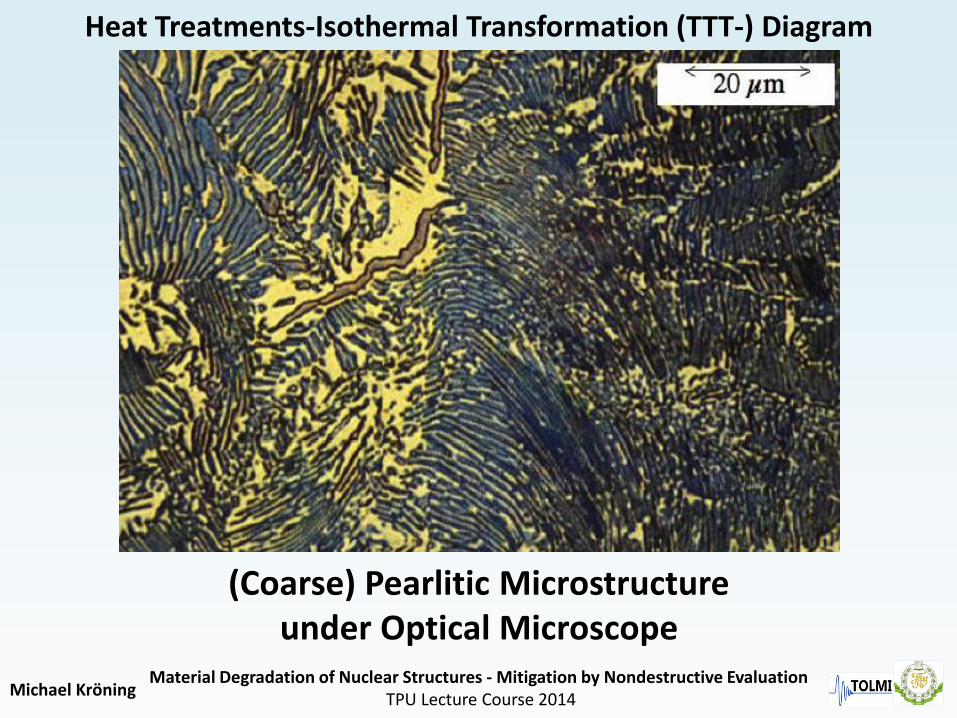
Heat Treatments-Isothermal Transformation (TTT-) Diagram
(Coarse) Pearlitic Microstructureunder Optical Microscope
Michael KröningMaterial Degradation of Nuclear Structures - Mitigation by Nondestructive Evaluation
TPU Lecture Course 2014
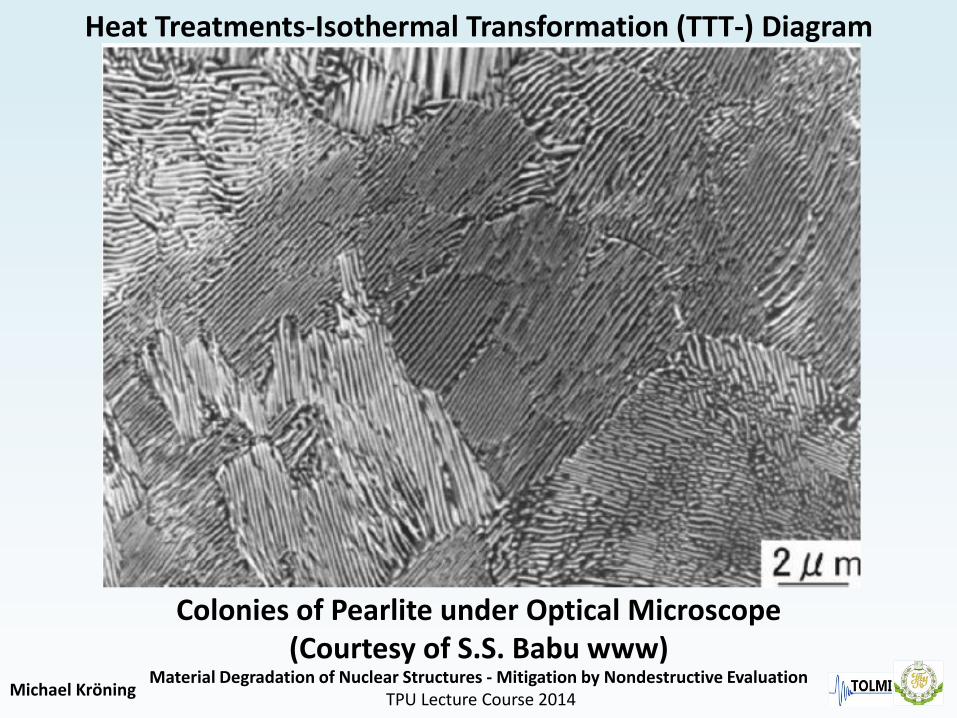
Heat Treatments-Isothermal Transformation (TTT-) Diagram
Colonies of Pearlite under Optical Microscope(Courtesy of S.S. Babu www)

Michael KröningMaterial Degradation of Nuclear Structures - Mitigation by Nondestructive Evaluation
TPU Lecture Course 2014
Heat Treatments-Isothermal Transformation (TTT-) Diagram
Transmission Electron Micrograph of extremely fine Pearlite
Michael KröningMaterial Degradation of Nuclear Structures - Mitigation by Nondestructive Evaluation
TPU Lecture Course 2014
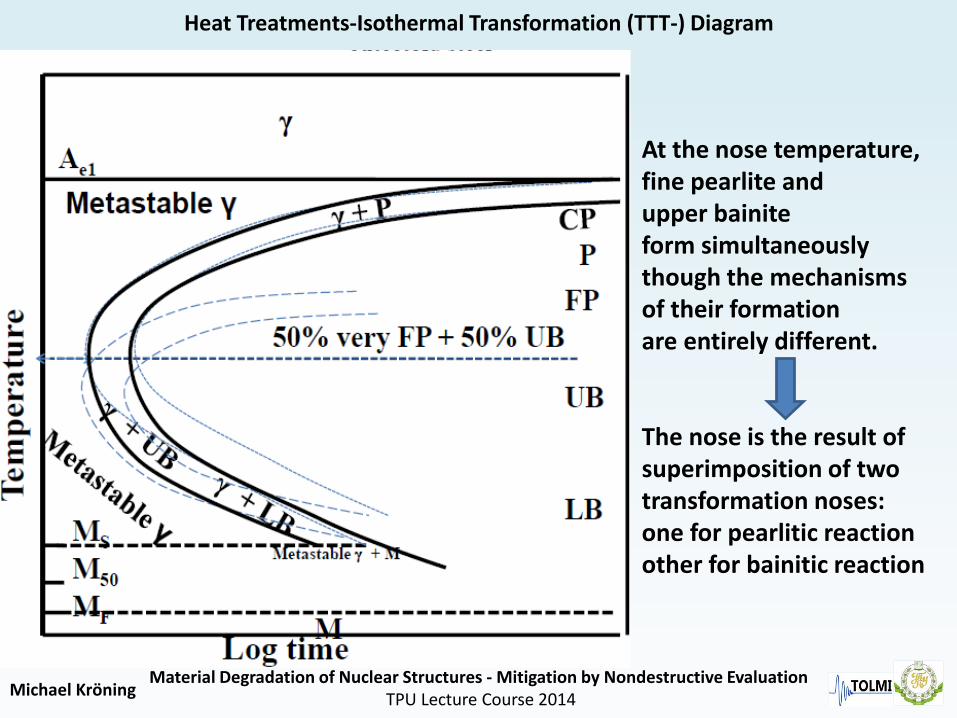
Heat Treatments-Isothermal Transformation (TTT-) Diagram
At the nose temperature,fine pearlite and upper bainiteform simultaneouslythough the mechanisms of their formationare entirely different.
The nose is the result of superimposition of twotransformation noses:one for pearlitic reactionother for bainitic reaction
Michael KröningMaterial Degradation of Nuclear Structures - Mitigation by Nondestructive Evaluation
TPU Lecture Course 2014
Heat Treatments TTT Diagram
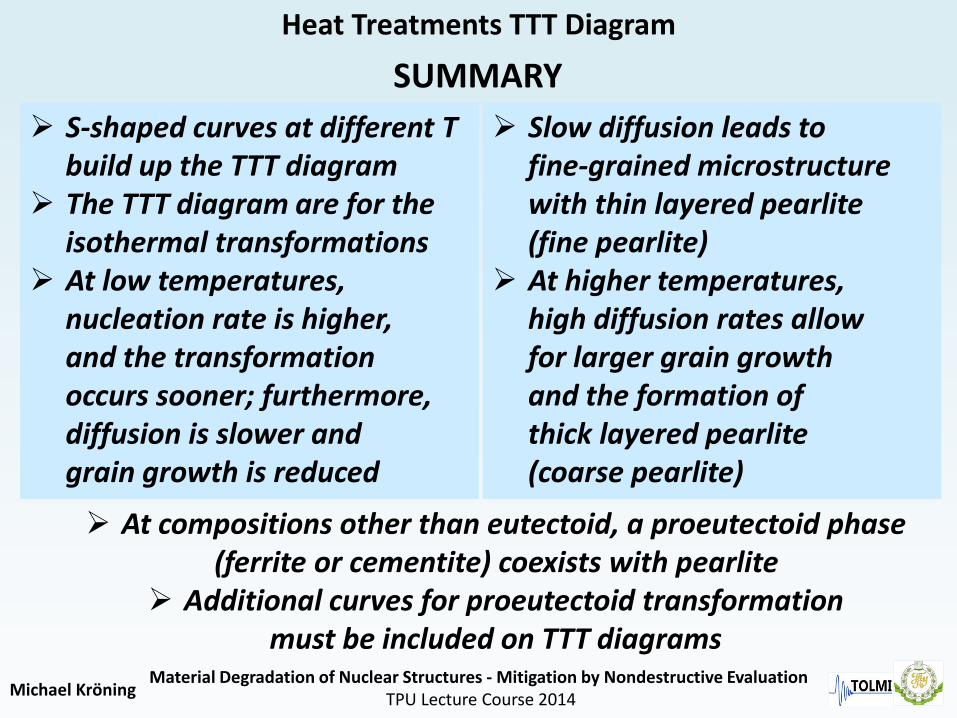
S-shaped curves at different T build up the TTT diagram
The TTT diagram are for theisothermal transformations
At low temperatures,nucleation rate is higher,and the transformation occurs sooner; furthermore, diffusion is slower andgrain growth is reduced
Slow diffusion leads tofine-grained microstructurewith thin layered pearlite(fine pearlite)
At higher temperatures,high diffusion rates allowfor larger grain growth and the formation ofthick layered pearlite(coarse pearlite)
At compositions other than eutectoid, a proeutectoid phase (ferrite or cementite) coexists with pearlite
Additional curves for proeutectoid transformation must be included on TTT diagrams
SUMMARY
Michael KröningMaterial Degradation of Nuclear Structures - Mitigation by Nondestructive Evaluation
TPU Lecture Course 2014
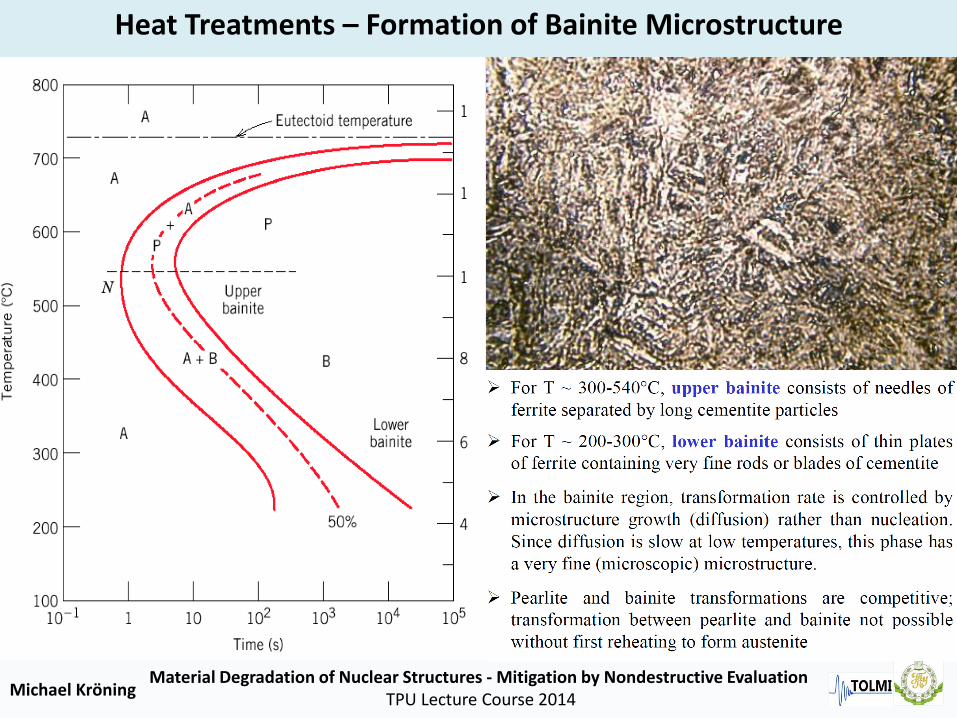
Heat Treatments – Formation of Bainite Microstructure

Michael KröningMaterial Degradation of Nuclear Structures - Mitigation by Nondestructive Evaluation
TPU Lecture Course 2014
Heat Treatments – Formation of Bainite Microstructure

Michael KröningMaterial Degradation of Nuclear Structures - Mitigation by Nondestructive Evaluation
TPU Lecture Course 2014
Heat Treatments TTT Diagram
Factors affecting TTT diagram?
Composition of steel
(a) carbon wt%,
(b) alloying element wt%
Grain size of austenite
Heterogeneity of austenite
Strain

Michael KröningMaterial Degradation of Nuclear Structures - Mitigation by Nondestructive Evaluation
TPU Lecture Course 2014
Transformation Diagrams – Effect of Carbon Content
Carbon wt%- (C%) < 0.77 wt%
C% A3 and Ar3
The incubation period for the austenite to pearlite increases:
i.e. the C-curve of the diagram moves to right.
Austenite becomes less stable with respect to cementite precipitation,
transformation to pearlite becomes faster. Therefore C curve moves towards left.
during cooling (Ar3)
during heating (Ac3)
Equilibrium (Ac3
Carbon wt% > 0.77 wt%
C% Acm
The critical cooling rate required to prevent diffusional transformation
is minimum for eutectoid steel.

Michael KröningMaterial Degradation of Nuclear Structures - Mitigation by Nondestructive Evaluation
TPU Lecture Course 2014
Schematic TTT diagram for plain carbon hypoeutectoid steel
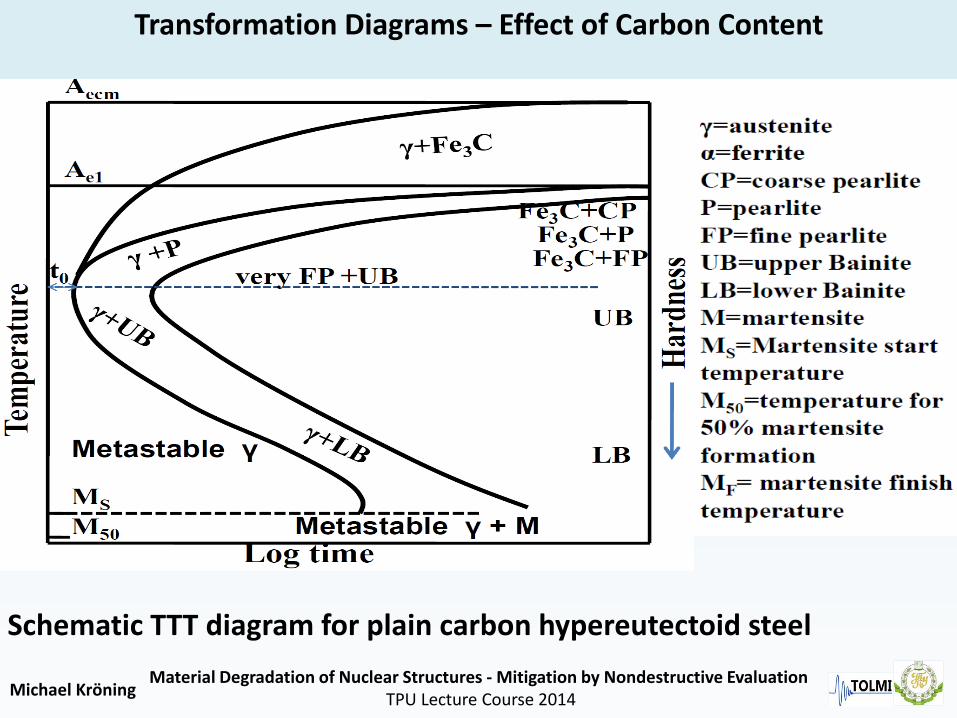
Transformation Diagrams – Effect of Carbon Content
Michael KröningMaterial Degradation of Nuclear Structures - Mitigation by Nondestructive Evaluation
TPU Lecture Course 2014
Schematic TTT diagram for plain carbon hypereutectoid steel
Transformation Diagrams – Effect of Carbon Content
Michael KröningMaterial Degradation of Nuclear Structures - Mitigation by Nondestructive Evaluation
TPU Lecture Course 2014
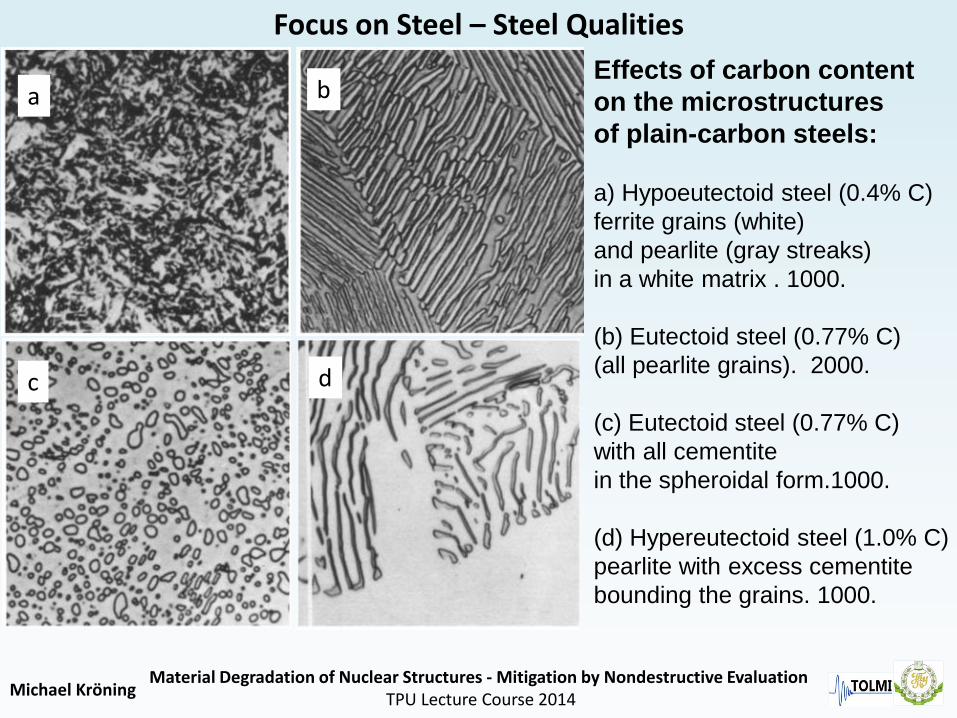
Focus on Steel – Steel Qualities
Effects of carbon content
on the microstructures
of plain-carbon steels:
a) Hypoeutectoid steel (0.4% C)
ferrite grains (white)
and pearlite (gray streaks)
in a white matrix . 1000.
(b) Eutectoid steel (0.77% C)
(all pearlite grains). 2000.
(c) Eutectoid steel (0.77% C)
with all cementite
in the spheroidal form.1000.
(d) Hypereutectoid steel (1.0% C)
pearlite with excess cementite
bounding the grains. 1000.
a b
c d

Michael KröningMaterial Degradation of Nuclear Structures - Mitigation by Nondestructive Evaluation
TPU Lecture Course 2014
Effect of Austenite Grain Size on TTT Diagram of Plain Carbon Hypoeutectoid Steel
Transformation Diagrams – Effect of Austenite Grain Size

Michael KröningMaterial Degradation of Nuclear Structures - Mitigation by Nondestructive Evaluation
TPU Lecture Course 2014
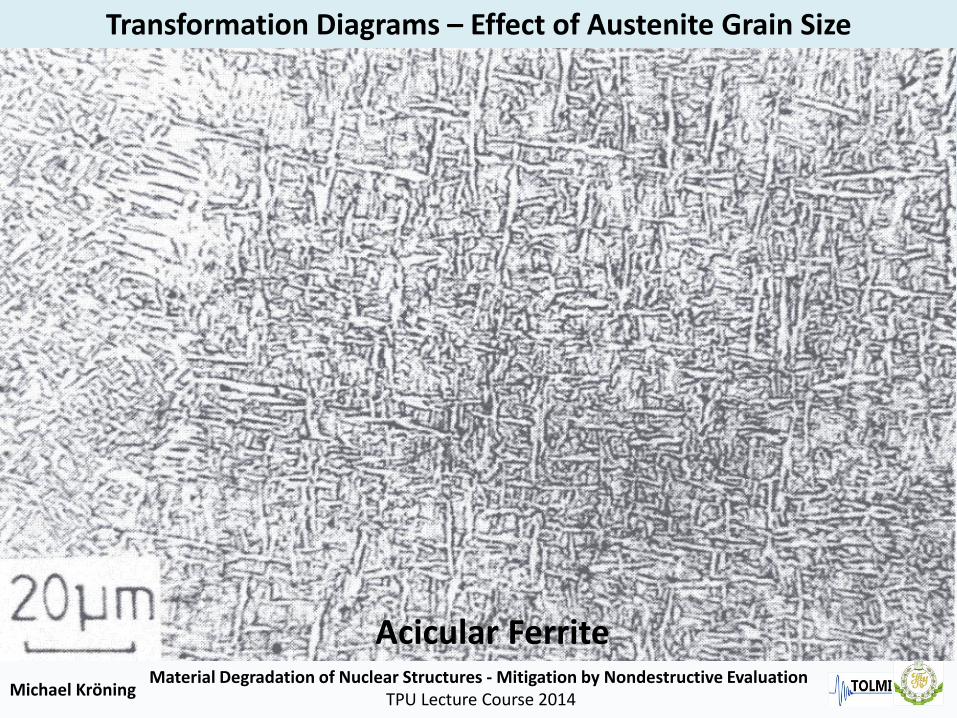
Transformation Diagrams – Effect of Austenite Grain Size
Within the bainitic transformation temperature range, large grain size promotes acicular ferrite formation under isothermal condition
Morphology and Nucleation Site of Acicular Ferrite
Michael KröningMaterial Degradation of Nuclear Structures - Mitigation by Nondestructive Evaluation
TPU Lecture Course 2014
Acicular Ferrite
Transformation Diagrams – Effect of Austenite Grain Size
Michael KröningMaterial Degradation of Nuclear Structures - Mitigation by Nondestructive Evaluation
TPU Lecture Course 2014
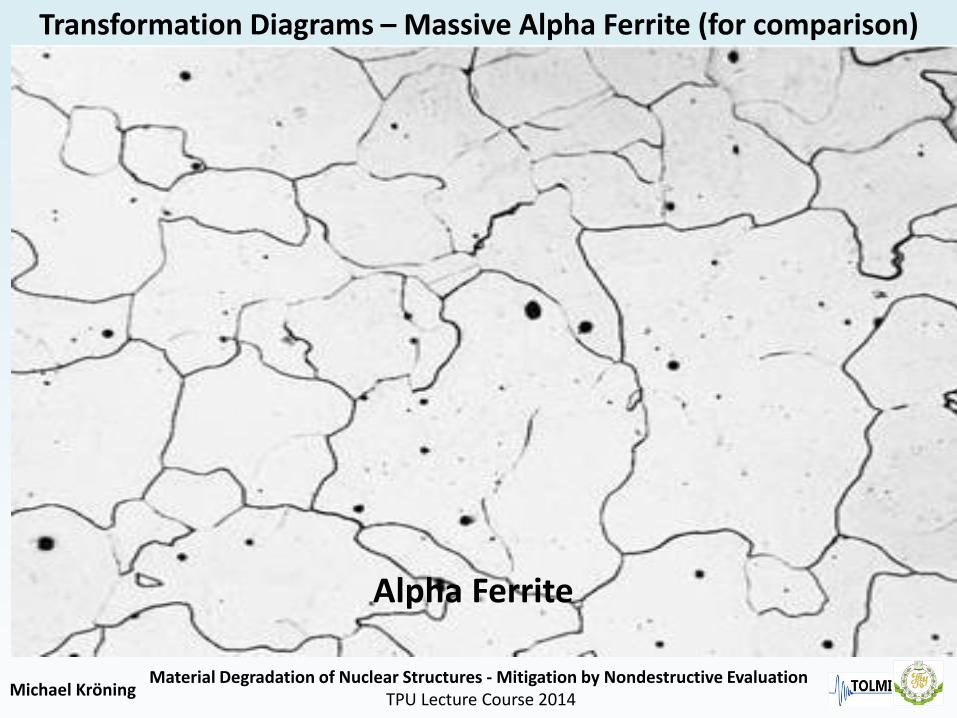
Alpha Ferrite
Transformation Diagrams – Massive Alpha Ferrite (for comparison)

Michael KröningMaterial Degradation of Nuclear Structures - Mitigation by Nondestructive Evaluation
TPU Lecture Course 2014
Heat Treatments TTT Diagram –Modification by Strain
Principles of dynamic strain induced transformation (DSIT)
during deformation at constant temperature
Michael KröningMaterial Degradation of Nuclear Structures - Mitigation by Nondestructive Evaluation
TPU Lecture Course 2014
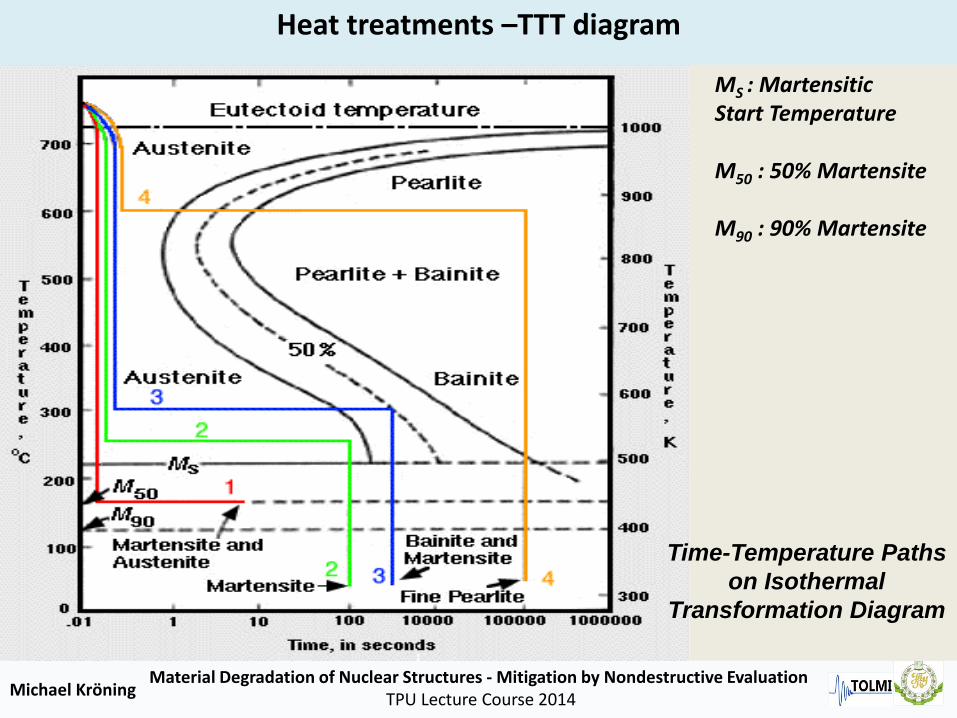
Time-Temperature Paths
on Isothermal
Transformation Diagram
Heat treatments –TTT diagram
MS : Martensitic Start Temperature
M50 : 50% Martensite
M90 : 90% Martensite

Michael KröningMaterial Degradation of Nuclear Structures - Mitigation by Nondestructive Evaluation
TPU Lecture Course 2014
Heat Treatments Time Temperature Transformation (TTT) Diagram
Time-Temperature Paths on Isothermal Transformation Diagram
The specimen is cooled rapidly to 433 K and left for 20 minutes. The cooling rate is too rapid for pearlite to form at higher temperatures; therefore, the steel remains in the austenitic phase until the Ms temperature is passed, where martensite begins to form. Since 433 K is the temperature at which half of the austenite transforms to martensite, the direct quench converts 50% of the structure to martensite. Holding at 433 K forms only a small quantity of additional martensite, so the structure can be assumed to behalf martensite and half retained austenite.
The specimen is held at 523 K for 100 seconds, which is not long enough
to form bainite.
Therefore, the second quench from 523 K to room temperature develops a martensitic structure.
An isothermal hold at 573 K for 500 seconds
produces a half-bainite and half-austenite structure.
Cooling quickly would result in a final structure of
martensite and bainite.
Austenite converts completely to fine pearlite
after eight seconds at 873 K. This phase is stable and
will not be changed on holding for 100,000 seconds at 873 K.
The final structure, when cooled, is fine pearlite.

Michael KröningMaterial Degradation of Nuclear Structures - Mitigation by Nondestructive Evaluation
TPU Lecture Course 2014
Focus on Steel – Quenching and Tempering
ASTM A508 / A508M - 14
Standard Specification for Quenched and Tempered
Vacuum-Treated Carbon and Alloy Steel Forgings for Pressure Vessels
Basic chemical composition of the steel, wt. (%)
C Mn Si P S Cu Ni Cr Mo
0.09 0.27 0.08 0.011 0.008 0.09 3.75 1.68 0.48
V Ti As Sn Sb Al Nb N O 0.008 0.006 0.005 0.004 0.003 0.010 0.003 0.0029 0.0052

Michael KröningMaterial Degradation of Nuclear Structures - Mitigation by Nondestructive Evaluation
TPU Lecture Course 2014
Focus on Steel – Quenching and Tempering
A508 SteelEtched in Nital 2%
low carbon martensite,
slightly decomposed in ferrite and carbides during the 350 °C tempering treatment.
The large austenite grain size increased the steel hardenability
and so favored both martensite transformation (at the expenses of the bainite)
and austenite retaining, the latter as small acicular areas

Michael KröningMaterial Degradation of Nuclear Structures - Mitigation by Nondestructive Evaluation
TPU Lecture Course 2014
Focus on Steel – Quenching and Tempering
A508 SteelEtched in Nital 2%
Partial recrystallization during discontinuous cooling,
induced a heterogeneous distribution of austenitic grains. The elevated austenitizing temperatures
favored the formation of a coarse microstructure, as well as alloying segregation at the grain boundaries
(intergranular fracture!).
The microstructure presents heavily spheroidized carbides as a result of the tempering treatment at 575 °C.
The material's hardenability was reduced due to the recrystallization, grain homogenization and refinement cycles,
sequentially applied to the material, which prevented austenite retaining and
favored the formation of tempered bainite, at the expenses of the martensite.

Michael KröningMaterial Degradation of Nuclear Structures - Mitigation by Nondestructive Evaluation
TPU Lecture Course 2014
Focus on Steel – Quenching and Tempering
A508 SteelEtched in Nital 2%
The microstructure exhibits a quite complex arrangement of different phases,
in which it can be inferred retained austenite, martensite, bainiteand a mixture of ferrite and carbides
slightly coalesced during the
350 °C tempering process.
Michael KröningMaterial Degradation of Nuclear Structures - Mitigation by Nondestructive Evaluation
TPU Lecture Course 2014
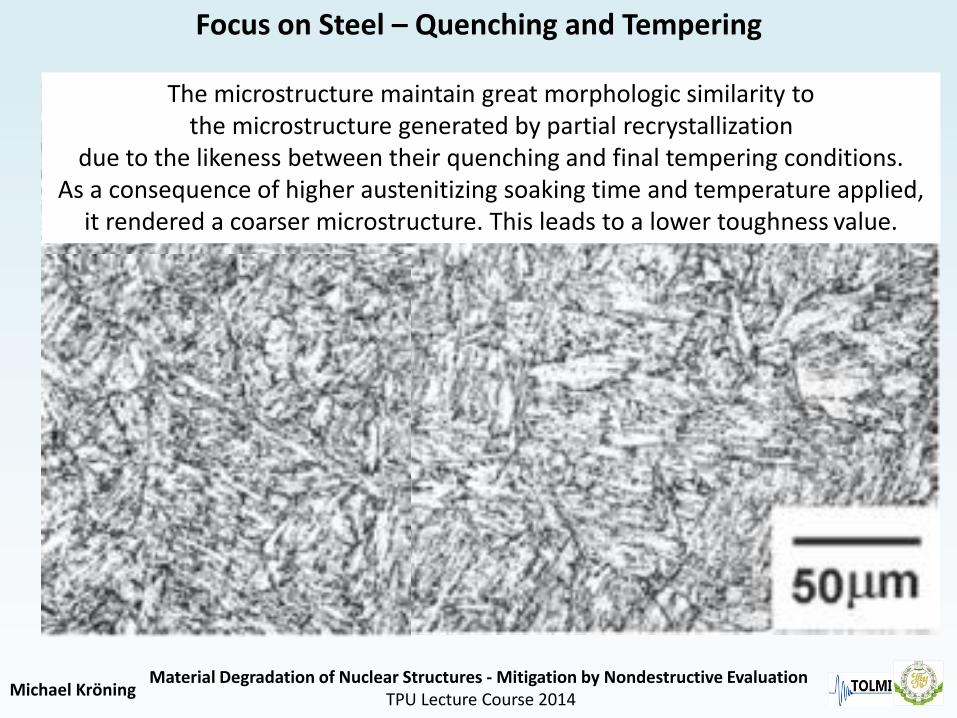
Focus on Steel – Quenching and Tempering
A508 SteelEtched in Nital 2%
The microstructure maintain great morphologic similarity to the microstructure generated by partial recrystallization
due to the likeness between their quenching and final tempering conditions. As a consequence of higher austenitizing soaking time and temperature applied,
it rendered a coarser microstructure. This leads to a lower toughness value.

Michael KröningMaterial Degradation of Nuclear Structures - Mitigation by Nondestructive Evaluation
TPU Lecture Course 2014
Focus on Steel – Quenching and Tempering
A508 SteelEtched in Nital 2%Very high austenitizing soaking times and temperatures
result in grain coarseness. This condition also induces segregation at grain boundaries
with the risk of intergranular crack propagation. It resembles the microstructure of “low carbon martensite”
related to the very high hardenability caused by large austenitic grain size that gave rise to low carbon martensite, instead of bainite.

Michael KröningMaterial Degradation of Nuclear Structures - Mitigation by Nondestructive Evaluation
TPU Lecture Course 2014
A continuous cooling transformation (CCT) phase diagram is used to represent which types of phase changes will occur in a material
as it is cooled at different rates. These diagrams are often more useful than TTT diagrams
because it is more convenient to cool materials at a certain rate than to cool quickly and hold at a certain temperature.
Types of Continuous Cooling Diagrams
There are two types of continuous cooling diagrams drawn for practical purposes.The diagrams plot transformation start, a specific transformation fraction, and
transformation finish temperature for all products against:
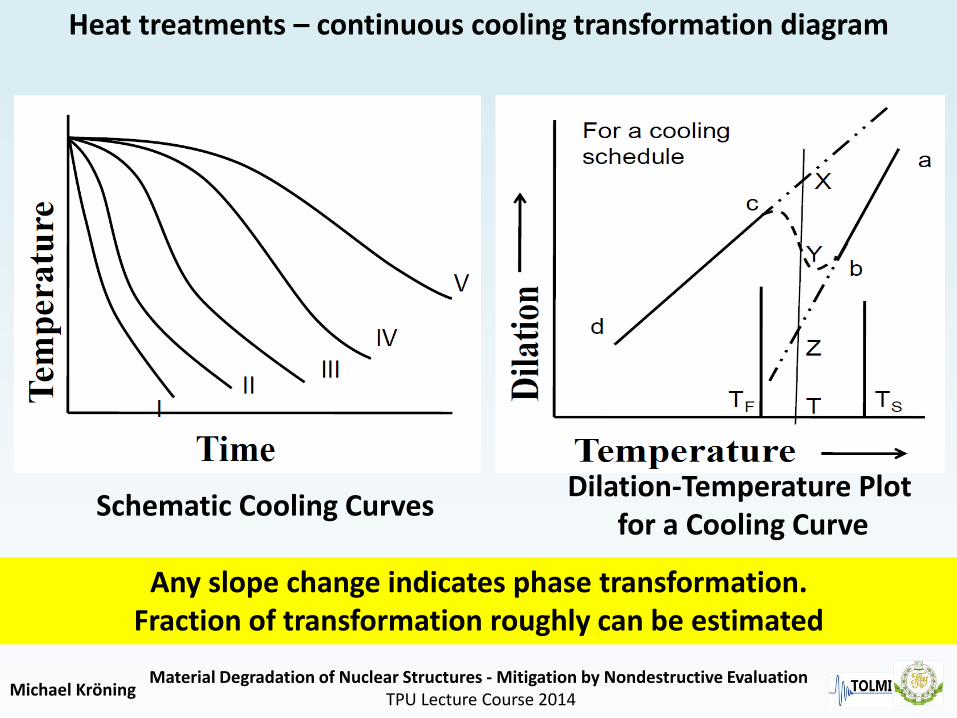
Heat treatments – continuous cooling transformation diagram
Type 1: transformation time on each cooling curve
Type 2: cooling rate or bar diameter of the specimenfor each type of cooling medium.

Michael KröningMaterial Degradation of Nuclear Structures - Mitigation by Nondestructive Evaluation
TPU Lecture Course 2014
Illustration of a continuous cooling transformation (cct) diagram for steel
Heat treatments – continuous cooling transformation diagram
Michael KröningMaterial Degradation of Nuclear Structures - Mitigation by Nondestructive Evaluation
TPU Lecture Course 2014
Heat treatments – continuous cooling transformation diagram
Schematic Cooling CurvesDilation-Temperature Plot
for a Cooling Curve
Any slope change indicates phase transformation. Fraction of transformation roughly can be estimated
Michael KröningMaterial Degradation of Nuclear Structures - Mitigation by Nondestructive Evaluation
TPU Lecture Course 2014
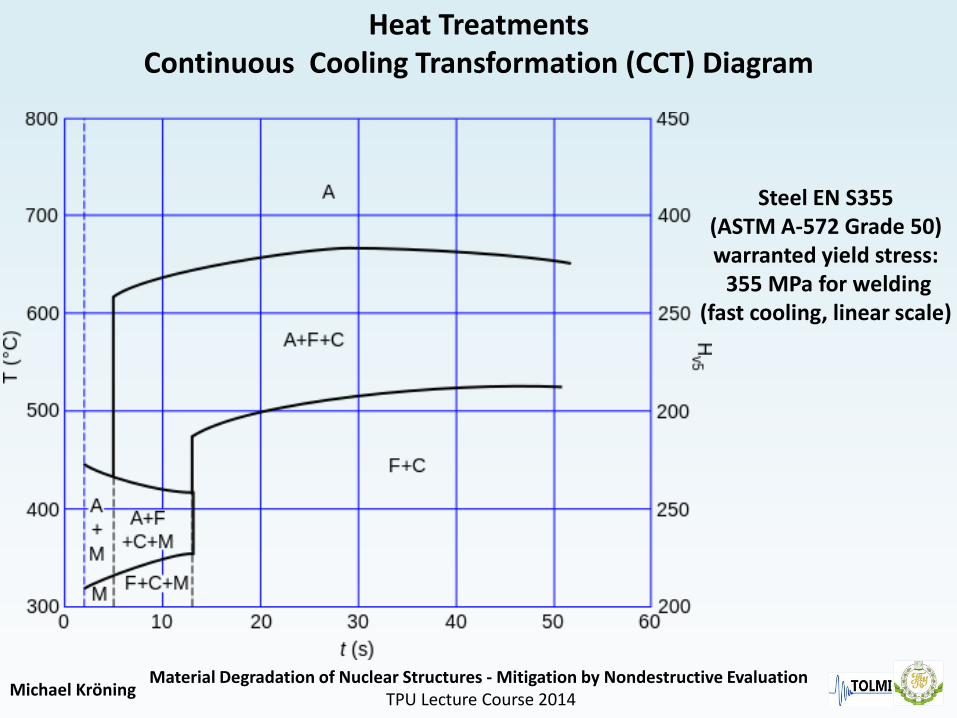
Heat Treatments Continuous Cooling Transformation (CCT) Diagram
Steel EN S355 (ASTM A-572 Grade 50) warranted yield stress:
355 MPa for welding (fast cooling, linear scale)
Michael KröningMaterial Degradation of Nuclear Structures - Mitigation by Nondestructive Evaluation
TPU Lecture Course 2014
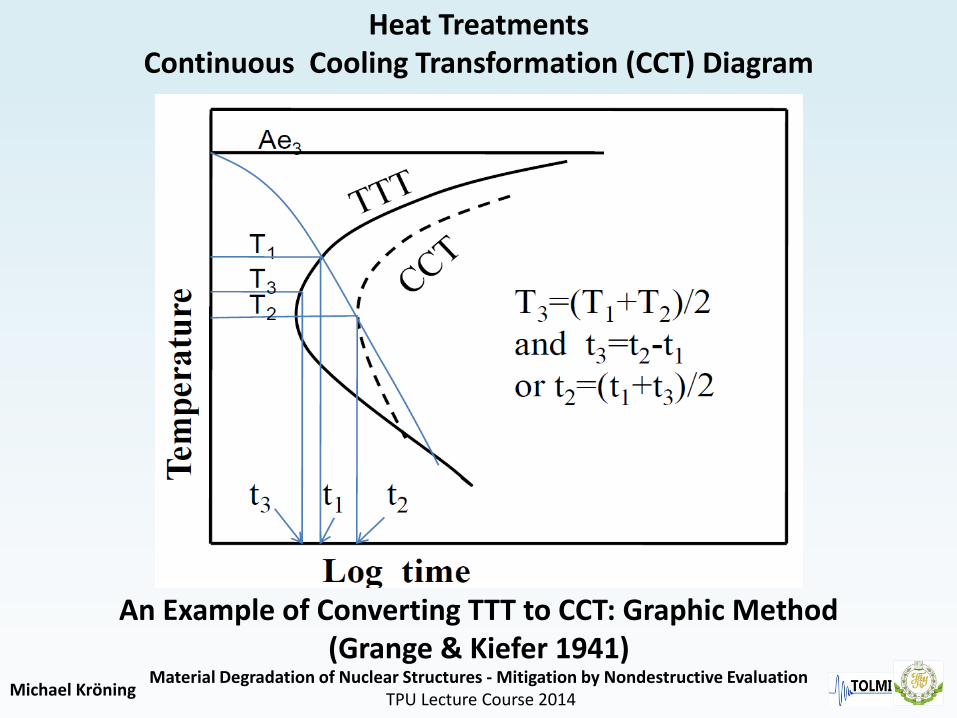
Heat Treatments Continuous Cooling Transformation (CCT) Diagram
An Example of Converting TTT to CCT: Graphic Method (Grange & Kiefer 1941)
Michael KröningMaterial Degradation of Nuclear Structures - Mitigation by Nondestructive Evaluation
TPU Lecture Course 2014
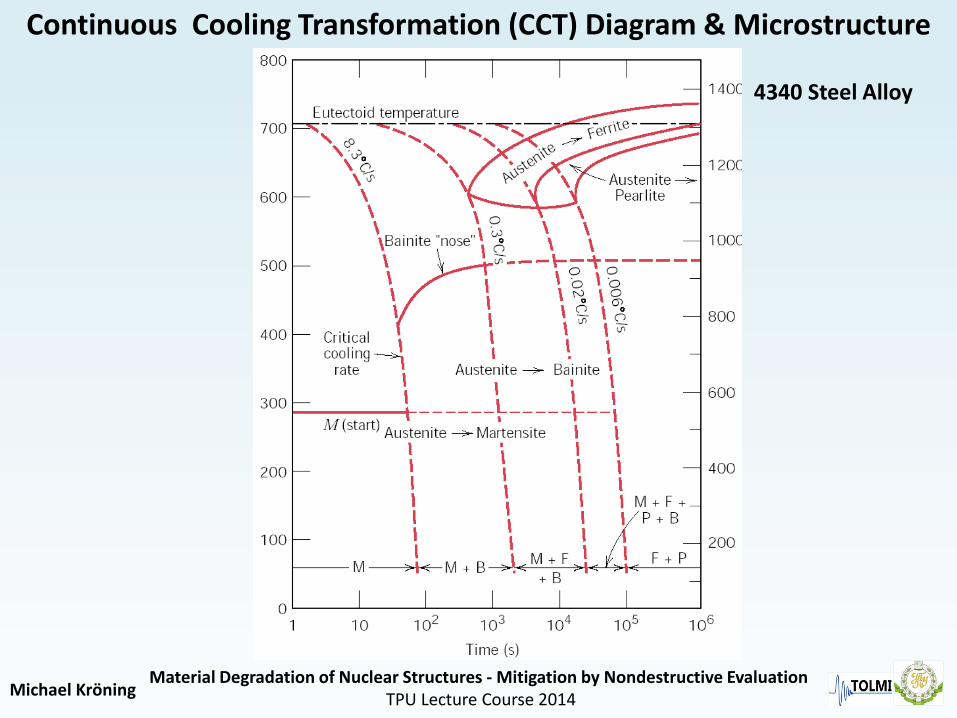
Continuous Cooling Transformation (CCT) Diagram & Microstructure
4340 Steel Alloy

Michael KröningMaterial Degradation of Nuclear Structures - Mitigation by Nondestructive Evaluation
TPU Lecture Course 2014
Focus on Steel – Carbon Steels
Spec Grade Remarks
ASME
Sec VIII DIV1 UCS-56Post Weld Heat Treatment for Pressure Vessels Constructed of Low Alloy Steels
Sec VIII DIV1 UNF-56 Post Weld Heat Treatment of Nonferrous Materials
Sec VIII DIV1 UHA-32Post Weld Heat Treatment for Pressure Vessels Constructedof High Alloy Steels
ASTM
A671 Table 2Heat Treatment of EFW Steel Pipe for Atmosphericand Low Temperatures
A672 Table 2Heat Treatment of EFW Steel Pipe for High-pressure Serviceat Moderate Temperatures
A691 Table 2Heat Treatment of Carbon & Alloy Steel Pipe,EFW for High-Pressure Service at High Temperatures
Others Normalized or Normalized and Tempered of Steel Structure
Typical Industrial Heat Treatment Service

Michael KröningMaterial Degradation of Nuclear Structures - Mitigation by Nondestructive Evaluation
TPU Lecture Course 2014
Focus on Steel – Carbon Steels
For example, the group „mechanical properties of interfaces“ investigates
homophase (grain boundaries, stacking faults) as well as
heterophase (coatings, precipitates, lamellar alloys) interfaces,with a focus on metals and alloys.
IT IS A MATTER OF CONTINUING RESEARCH & DEVELOPMENT:

Michael KröningMaterial Degradation of Nuclear Structures - Mitigation by Nondestructive Evaluation
TPU Lecture Course 2014
Focus on Steel – Steel Qualities
Literature
1. web.utk.edu/~prack/MSE%20300/FeC.pdf
2. R. Manna, Time Temperature Transformation (TTT) Diagrams,
Centre of Advanced Study, Department of Metallurgical Engineering,
Institute of Technology, Banaras Hindu University, Varanasi-221 005, India;
3. Heat Treatment of Steel Terminology
TPU Lectures 14 15\Heat Treatment Of Steel Terminology.docx
4. http://www.virginia.edu/bohr/mse209/chapter11.htm
5. M. Shaban, S. Gozalzadeh and B. Eghbali, Dynamic Strain Induced Transformation of Austenite to Ferrite during High Temperature Extrusion of Low Carbon Steel, Materials Transactions, Vol. 52, No. 1 (2011) pp. 8 to 11
Michael KröningMaterial Degradation of Nuclear Structures - Mitigation by Nondestructive Evaluation
TPU Lecture Course 2014
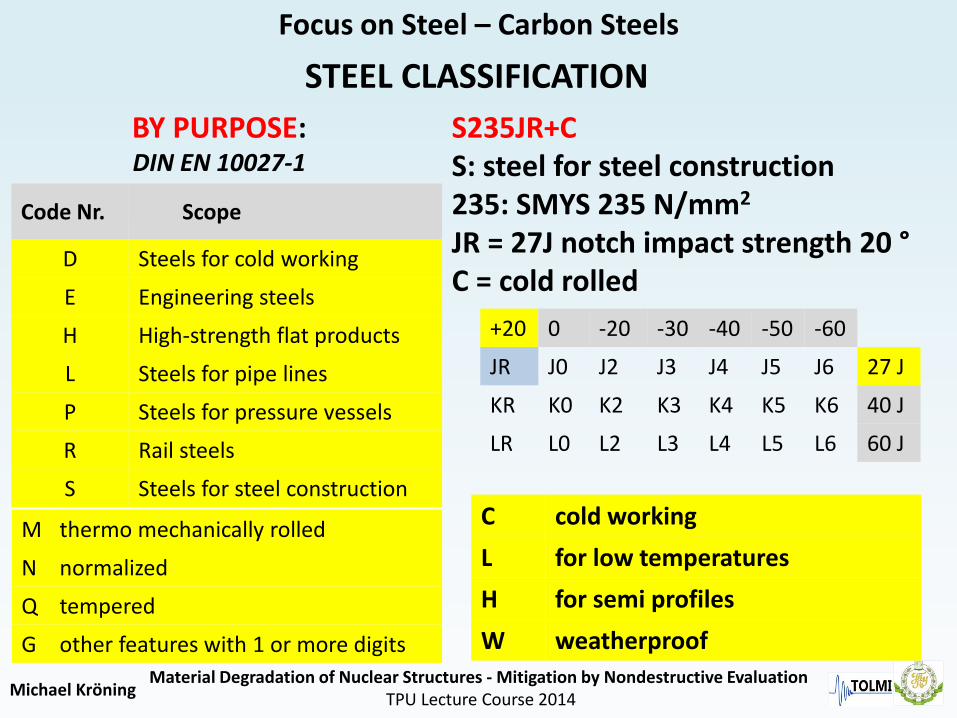
Focus on Steel – Carbon Steels
STEEL CLASSIFICATION
BY PURPOSE:DIN EN 10027-1
S235JR+CS: steel for steel construction235: SMYS 235 N/mm2
JR = 27J notch impact strength 20 °C = cold rolled
Code Nr. Scope
D Steels for cold working
E Engineering steels
H High-strength flat products
L Steels for pipe lines
P Steels for pressure vessels
R Rail steels
S Steels for steel construction
+20 0 -20 -30 -40 -50 -60
JR J0 J2 J3 J4 J5 J6 27 J
KR K0 K2 K3 K4 K5 K6 40 J
LR L0 L2 L3 L4 L5 L6 60 J
M thermo mechanically rolled
N normalized
Q tempered
G other features with 1 or more digits
C cold working
L for low temperatures
H for semi profiles
W weatherproof

Michael KröningMaterial Degradation of Nuclear Structures - Mitigation by Nondestructive Evaluation
TPU Lecture Course 2014
Focus on Steel – Carbon Steels
Over 0.8% Carbon
As carbon content increases beyond 0.8%, no more pearlite can be formed.
The excess carbon forms cementite which is deposited in between the pearlite grains. This increases the hardness, but slightly reduces the strength. The ductility of all plain carbon steels over 0.8% carbon is very low.

Michael KröningMaterial Degradation of Nuclear Structures - Mitigation by Nondestructive Evaluation
TPU Lecture Course 2014
Bainite Microstructure
Focus on Steel – Bainit Formation


![[XLS]kemco.or.krkemco.or.kr/up_load/blog/금속재질관련용어정의.xls · Web view공석 반응 (eutectoid reaction) 고상이 냉각중에 새로운 두 개의 고상으로](https://static.fdocuments.net/doc/165x107/5b030d447f8b9ab9598ec04d/xlskemcoor-xlsweb-view-eutectoid.jpg)

