Material Compatibility for Passive Two-Phase Immersion ...
107
Material Compatibility for Passive Two-Phase Immersion Cooling Applications by Alexander Lee Kelly A thesis submitted to the Graduate Faculty of Auburn University in partial fulfillment of the requirements for the Degree of Master of Science Auburn, Alabama May 3, 2014 Keywords: Dielectric Fluids, Characterization, Thermal Management Copyright 2014 by Alexander Lee Kelly Approved by Virginia A. Davis, Chair, Sanders Associate Professor of Chemical Engineering Steve R. Duke, Alumni Associate Professor, Samuel Ginn College of Engineering Allan E. David, John W. Brown Assistant Professor of Chemical Engineering Michael C. Hamilton, Assistant Professor of Electrical and Computer Engineering
Transcript of Material Compatibility for Passive Two-Phase Immersion ...

Material Compatibility for Passive Two-Phase Immersion Cooling Applications
by
Alexander Lee Kelly
A thesis submitted to the Graduate Faculty of
Auburn University
in partial fulfillment of the
requirements for the Degree of
Master of Science
Auburn, Alabama
May 3, 2014
Keywords: Dielectric Fluids, Characterization, Thermal Management
Copyright 2014 by Alexander Lee Kelly
Approved by
Virginia A. Davis, Chair, Sanders Associate Professor of Chemical Engineering
Steve R. Duke, Alumni Associate Professor, Samuel Ginn College of Engineering
Allan E. David, John W. Brown Assistant Professor of Chemical Engineering
Michael C. Hamilton, Assistant Professor of Electrical and Computer
Engineering
ii
Abstract
The objective of this work was to investigate potential material compatibility issues
related to immersion cooling for high performance computing applications. Extended
exposure of potential performance computing components and fluid handling materials to
3M’s NovecTM 649, NovecTM HFE-7100, and FluorinertTM FC-72 engineered fluids was
simulated using a Soxhlet extractor. This accelerated testing led to chemical elution from
some polymeric materials into the fluid. In most cases, the fluid contaminants were
polymer additives, particularly plasticizers. The contaminants were identified using
attenuated total reflectance Fourier transform infrared (ATR-FTIR) spectroscopy as well
as gas chromatography/mass spectrometry (GC/MS). The total contaminant
concentrations were determined using mass balances. In addition, an ultraviolet-visible
spectroscopy (UV-Vis) calibration curve was developed to measure the concentration of
dioctyl phthalate (DOP) extracted from poly(vinyl chloride) (PVC) into the fluids. UV-
Vis was also used to show the amount of DOP that could be removed from the fluid using
consumer grade activated carbon. The use of fundamental thermodynamic relationships
for selection of compatible materials with dielectric fluids was also explored. Additional
thermodynamic modeling research would enable formulation and/or selection of materials
with improved compatibility. Meanwhile, the empirical data has resulted in material
selection guidelines for passive two-phase immersion cooling using the engineered
dielectric fluids.
iii
Acknowledgements
I would like to thank Dr. Virginia A. Davis for her support and guidance throughout
the course of this work and my graduate studies. I would like to thank my committee
members for their knowledge and time in the critical review and preparation of this
manuscript. I would also like to thank Alexander Haywood, Joyanta Goswami, and Teng
(Daisy) Xu for their assistance with many aspects of this work.
Personal gratitude is also extended to Dr. Mario Eden and Dr. Robert Ashurst for
their guidance unrelated to research.
Finally, this work would not have been possible without the continued support from
Mary Ann and Thomas J. Kelly.

iv
Table of Contents
Abstract ............................................................................................................................... ii
Acknowledgements ............................................................................................................ iii
List of Figures .................................................................................................................... vi
List of Tables ...................................................................................................................... x
1 Introduction ..................................................................................................................... 1
2 Background ..................................................................................................................... 3
2.1 Thermal Management ........................................................................................... 3
2.2 Dielectric Fluids ................................................................................................... 5
2.3 Accelerated Testing .............................................................................................. 8
2.4 Computing Materials .......................................................................................... 10
2.5 Solubility Parameters ......................................................................................... 15
2.5.1 Kauri-Butanol .......................................................................................... 16
2.5.2 Hildebrand Solubility Parameter.............................................................. 17
2.5.3 Hansen Solubility Parameter.................................................................... 18
3 Experimental Details ..................................................................................................... 20
3.1 Soxhlet Extraction .............................................................................................. 20
3.2 Small Scale Tank Testing ................................................................................... 22
3.3 Mass Balances .................................................................................................... 23
3.4 Optical Microscopy ............................................................................................ 25

v
3.5 Scanning Electron Microscopy .......................................................................... 26
3.6 Ultraviolet-Visible Spectroscopy ....................................................................... 26
3.7 Fourier Transform Infrared Spectroscopy .......................................................... 29
3.8 Thermogravimetric Analysis .............................................................................. 32
3.9 Differential Scanning Calorimetry ..................................................................... 32
3.10 Gas Chromatography-Mass Spectrometry ....................................................... 33
4 Results and Discussion ................................................................................................. 34
4.1 Soxhlet Screening Study .................................................................................... 34
4.1.1 Error Estimation ....................................................................................... 34
4.1.2 Mass Balances .......................................................................................... 38
4.1.3 Fluid Comparison..................................................................................... 47
4.1.4 Effects of Immersion on Components ..................................................... 53
4.1.5 Identification of Contaminants ................................................................ 60
4.1.6 Other Analysis Methods .......................................................................... 66
4.2 Laboratory Tests of Remediation Strategies ...................................................... 69
4.3 Thermodynamic Relationships ........................................................................... 74
4.4 Combined Electrical and Thermal Compatibility Testing ................................. 77
4.4.1 Powered Structures in Soxhlet Thimbles ................................................. 78
4.4.2 Powered Structures in Round Bottom Flasks .......................................... 84
4.5 Small Scale Tank Testing Using Contaminated Dielectric Fluid ....................... 87
5 Conclusions and Recommendations ............................................................................. 90
References ......................................................................................................................... 93
Appendix A – Materials Included in Screening Study ..................................................... 96

vi
List of Figures
Figure 1. Accelerated testing and analysis overview. ........................................................ 2
Figure 2. Chemical structure of FC-72 (left), Novec 649 (center), and HFE-7100 (right) 6
Figure 3. Soxhlet extraction apparatus and key extraction parameters [7]. ....................... 9
Figure 4. DOP migration from PVC over seven day period of exposure to silica gel ..... 13
Figure 5. Changes in dielectric strength as the concentration of DOP present within PVC
decreases [20]. .................................................................................................. 14
Figure 6. Twelve simultaneous Soxhlet extractions of component materials. ................ 21
Figure 7. Sampling procedure. ......................................................................................... 22
Figure 8. Tank testing apparatus and data acquisition diagram [31]. .............................. 23
Figure 9. Chemical structure of dioctyl phthalate (DOP) and its UV-VIS absorption
spectrum. .......................................................................................................... 28
Figure 10. Calibration curve of DOP in hexane use for concentration determination. ... 29
Figure 11. Efforts to avoid joint leakage showing aluminum foil tape (bottom) over
traditional Parafilm (top)................................................................................. 38
Figure 12. Mass extracted percentages of component materials subjected to accelerated
testing in Novec 649. ...................................................................................... 39
Figure 13. Mass absorbed percentages of component materials subjected to accelerated
testing in Novec 649. ...................................................................................... 39
Figure 14. Soxhlet extraction of (21) PVC apparatus setup for concentration profile
determination. ................................................................................................. 41
Figure 15. Concentration of DOP within Soxhlet setup during extraction of (21) PVC
with Novec 649 and HFE-7100. ..................................................................... 41

vii
Figure 16. Mass extracted and mass absorbed data for the first 5 days of extraction and
two week intervals up to 8 weeks. .................................................................. 43
Figure 17. Passive extraction of (21) PVC tubing via hexane and Novec 649. ............... 45
Figure 18. Comparison of mass extraction data from extended four week test and five
day test. ........................................................................................................... 46
Figure 19. Comparison of mass absorption data from extended four week test and five
day test. ........................................................................................................... 47
Figure 20. (44) EPDM tubing undergoing extraction with HFE-7100 and FC-72 .......... 48
Figure 21. Fluid residues of (26) latex rubber tubing after extraction in Novec 649 (left),
HFE-7100 (center), and FC-72 (right). ........................................................... 49
Figure 22. Mass extracted of component materials in all three dielectric fluids. ............ 50
Figure 23. Mass absorbed of component materials in all three dielectric fluids. ............ 50
Figure 24. Comparison of masses extracted in all three fluids. ....................................... 52
Figure 25. Compilation of component mass absorbed in all three fluids. ....................... 53
Figure 26. (24) Nalgene tubing (left) and (18) Tygon tubing (right) after extraction with
HFE-7100. ....................................................................................................... 54
Figure 27. Originally acquired sample (29) polyurethane tubing (blue). ........................ 55
Figure 28. Sample comparison of (29-1) polyurethane tubing after extraction with all
three dielectric fluids and a non-extracted control. ......................................... 55
Figure 29. DSC thermogram of (29-1) polyurethane tubing after extraction with Novec
649 and HFE-7100. ......................................................................................... 56
Figure 30. Linear integration of (29-1) polyurethane crystallization peaks after extraction
with Novec 649 and HFE-7100. ..................................................................... 57
Figure 31. Linear integration of (29-1) polyurethane melting peaks after extraction with
Novec 649 and HFE-7100. ............................................................................. 57
Figure 32. Thermal degradation of (21) PVC after extraction with Novec 649. ............. 58
Figure 33. DSC of (24) Nalgene after extraction with all three dielectric fluids............. 59

viii
Figure 34. HDPE cap/pour neck (left) and Tri Sure seal (right). ..................................... 63
Figure 35. GC/MS spectrum of HFE-7100 sample after 19 data runs............................. 64
Figure 36. GC/MS spectra comparison of tank test samples. .......................................... 66
Figure 37. Residues from extraction of (25) natural rubber in Novec 649 (left) and HFE-
7100 (right) and respective microscope images at 40x. .................................. 67
Figure 38. CRAIC UV-Vis spectra for (20) EPDM after extraction with Novec 649..... 68
Figure 39. Chemical structure of bis(2-ethylhexyl) sebacate (DOS). .............................. 69
Figure 40. SEM image of Fluval activated carbon. ......................................................... 70
Figure 41. DOP concentration change via increasing adsorption onto activated carbon. 72
Figure 42. DOP concentration change with time given a constant mass of Fluval. ........ 73
Figure 43. (44) EPDM rubber tubing residue before and after twenty-four hour exposure
to Fluval activated carbon. .............................................................................. 74
Figure 44. Group contribution breakdown of the two methods used for HFE-7100 HSP
calculation. ...................................................................................................... 76
Figure 45. Gap structure used in powered Soxhlet testing. ............................................. 77
Figure 46. Powered gap structures placed within thimble of Soxhlet extractors next to
component materials during accelerated testing. ............................................ 78
Figure 47. Optical microscopy images of powered gap structures after Soxhlet extraction
of (21) PVC in Novec 649. ............................................................................. 79
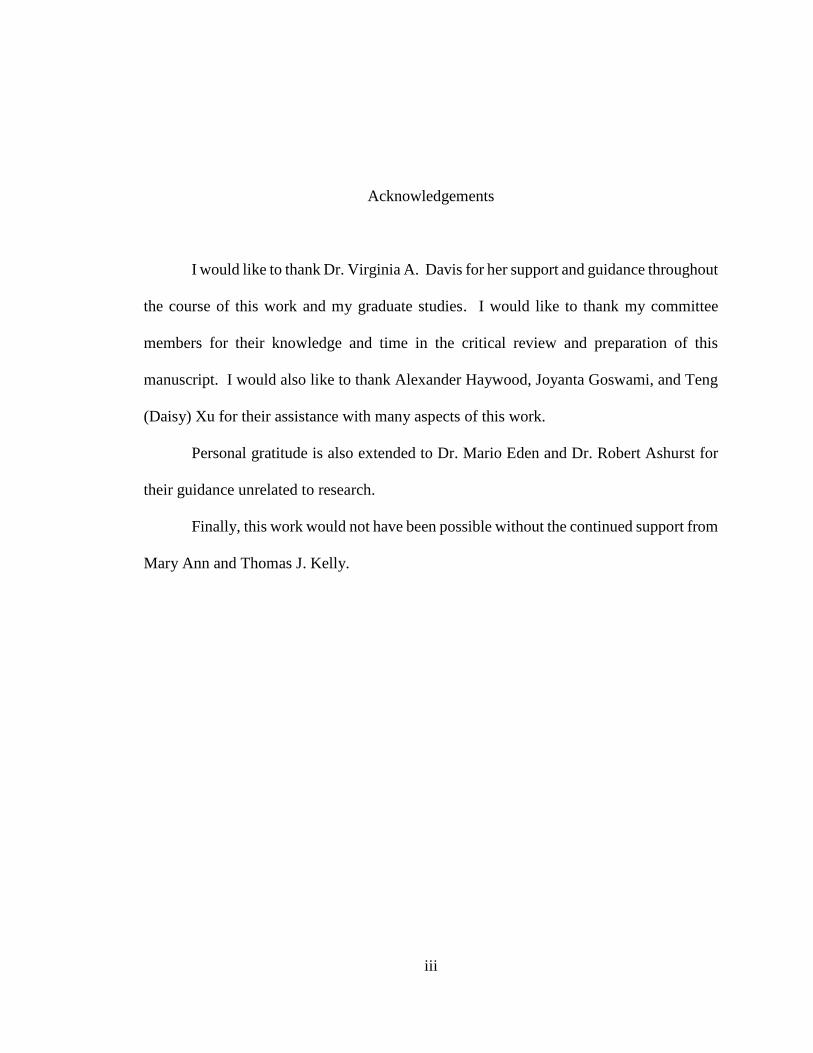
Figure 48. SEM and EDS of gap structures after accelerated testing of (21) PVC ......... 80
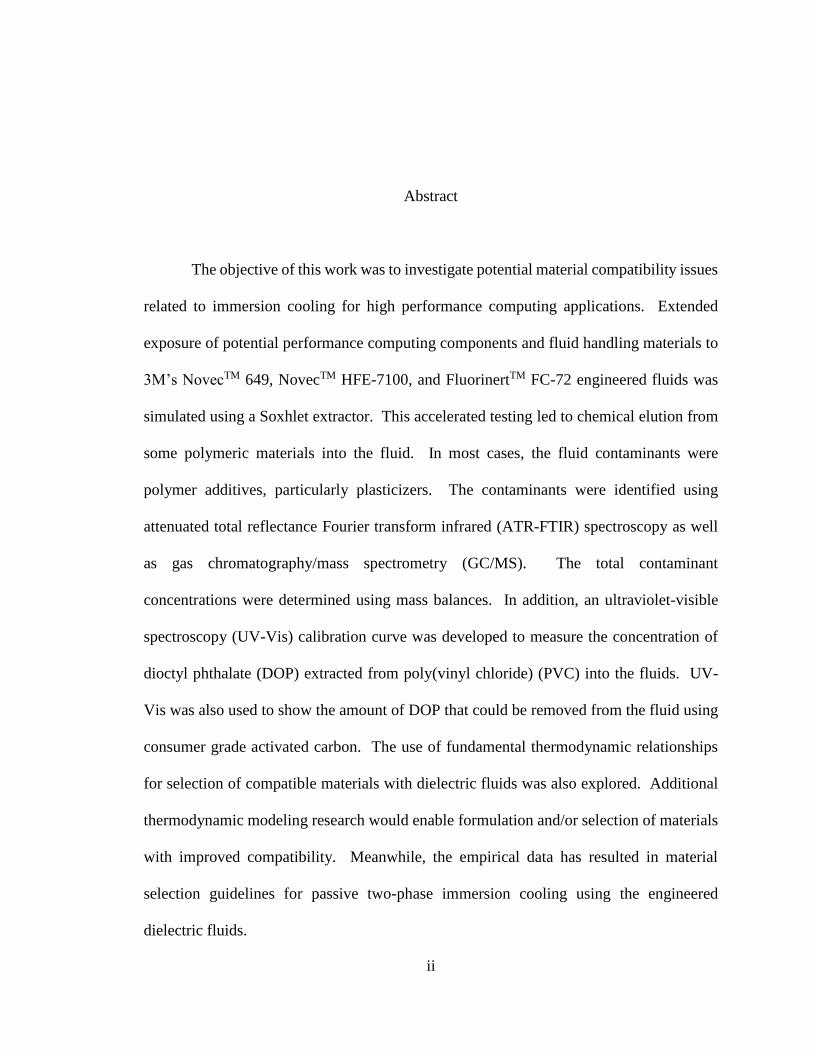
Figure 49. SEM and EDS of gap structures after accelerated testing of (20) EPDM ...... 80
Figure 50. Mass extracted percentages for materials exposed to powered gap structures
during extraction with Novec 649................................................................... 81
Figure 51. Mass absorbed percentages for materials exposed to powered gap structures
during extraction with Novec 649................................................................... 82

ix
Figure 52. Materials extracted with Novec 649, HFE-7100, and FC-72 in the presence of
a 5V powered 0.5 mm gap strucutre placed in the Soxhlet thimble. .............. 83
Figure 53. Materials extracted with Novec 649, HFE-7100, and FC-72 in the presence of
a 5V powered 0.5 mm gap structures placed in the Soxhlet thimble. ............. 83
Figure 54. Powered gap structures placed within the round bottom flask of Soxhlet
extractors during accelerated testing. .............................................................. 84
Figure 55. Mass extracted figures for materials extracted with HFE-7100 in the presence
of a powered gap and without. ........................................................................ 85
Figure 56. Mass extracted figures for materials extracted with HFE-7100 in the presence
of a powered gap and without. ........................................................................ 85
Figure 57. Gap structures at 20x after extraction within the round bottom flasks of (18)
Tygon in FC72 (left) and (21) PVC in Novec 649. ........................................ 86
Figure 58. An unused thru structure (left) and (24) Nalgene after extraction with FC72
(right). ............................................................................................................. 87
Figure 59. Satchels containing Fluval activated carbon. ................................................. 89

x
List of Tables
Table 1. Physical properties of engineered fluids used for immersion cooling [5, 11]. .... 7
Table 2. Commonly used external plasticizers and abbreviations [14, 18]. .................... 12
Table 3. Plasticizer-related technical challenges [17]. ..................................................... 14
Table 4. 3M dielectric fluid KB values [7]. ..................................................................... 16
Table 5. Soxhlet error determination of masses extracted, masses absorbed, and
concentration with (21) PVC in Novec 649. ...................................................... 35
Table 6. Standard deviation of masses extracted and absorbed for some materials
extracted more than once. .................................................................................. 36
Table 7. Contaminant comparison of materials extracted with Novec 649 and FC-72. .. 51
Table 8. ATR-FTIR match results for (21) PVC tubing residue after extraction with
Novec 649. ......................................................................................................... 61
Table 9. ATR-FTIR match results for Tri Sure seal. ....................................................... 63
Table 10. GC/MS identified compounds from an HFE-7100 sample after 9 tank test
thermal data runs. ............................................................................................ 65
Table 11. Solubility parameters [27-29, 39]. .................................................................. 76
Table 12. HSP via group contribution and ASPEN Plus prediction. .............................. 77

1
Chapter 1
Introduction
To date, a scientific approach to analyzing the interaction between immersion
cooling fluids and computing materials has not been developed. This thesis presents a
detailed investigation of material compatibility for use within passive two-phase
immersion cooling applications. Accelerated testing using a Soxhlet extraction technique
allowed for the characterization of the effects of prolonged exposure of dielectric fluids to
component materials. Leaching of solid materials and additives such as plasticizers was
discovered via optical microscopy as well as infrared and ultraviolet spectroscopy
techniques. The concentrations of extractable components were quantified to the extent
possible. Preliminary investigation of changes in the physical properties of polymeric
materials was conducted. In addition, a potential remediation method for organic
contaminants was proposed via the use of activated carbon adsorption. A database of
infrared spectroscopy spectra was developed and unknown material extracts from
application testing were matched to leached components from broad spectrum analysis of
potential computing materials. Design considerations and guidelines were proposed for
passive two-phase immersion cooling implementation within commercial applications.
The removal of heat from power electronics and performance computing systems
is a growing problem. The increase in component speed and circuitry density results in an
increased heat flux at the chip and package level. Removal of this additional heat has

2
garnered interest into advanced cooling techniques. Recent research has documented the
efficiency and performance potential immersion cooling has over other, more complex
systems. Although the benefits of immersion cooling have been well demonstrated,
component compatibility and material design considerations have not been examined in
detail. There is a need for large scale investigation of potential compatible materials and
resulting long term exposure to cooling fluids. Knowledge of and remediation techniques
for the removal of extractable components from long term exposure to immersion cooling
fluids are vital design considerations in moving forward with the development and
application of immersion cooling systems.
Figure 1 provides a graphical outline of this research. The document is organized
in the following manner: Chapter 2 provides a background of the materials and techniques
used throughout the course of this work. Chapter 3 is a description of the experimental
work performed including general operating principles for the instrumentation. Chapter 4
describes the experimental results. Chapter 5 concludes the document and provides
suggested design considerations for implementation of immersion cooling within high
performance computing (HPC) applications.
Figure 1. Accelerated testing and analysis overview.
Identification
Quantification
Remediation
Proposed Design Plans
Accelerated Testing

3
Chapter 2
Background
2.1 Thermal Management
The rapid development of modern computing technology has led to an increase in
the packing density of integrated circuits. This in turn has led to the production of high
power density microelectronic devices. With an increased density has come increases in
heat production at the chip and package level. In addition, high performance computing
system designers struggle with the limitation of increased heat production. Increases in
temperature affect the performance and reliability of integrated circuits when working
outside of the desired operating range. The control and removal of heat is of particular
importance and has led to significant research efforts in developing novel techniques and
refining the use of traditional cooling methods.
The flow of heat within a process is a function of the heat transfer coefficient, heat
transfer surface area, and the temperature difference. An increase in heat removal within
a system is achieved by increasing either of these variables. Increasing the temperature
difference is often limited by the process or material constraints; maximizing the surface
area of heat transfer is a common macro-scale technique that cannot be applied to the
growing microelectronics industry. Thus, manipulation of the heat transfer coefficient has
become of particular interest [1].

4
The heat transfer coefficient is often increased by improving the heat transfer
method or transport properties of the material itself. Traditional cooling techniques such
as air cooling have often been combined with heat sinks to make use of forced convection.
However, air cooling is not effective within applications that maintain heat fluxes greater
than 100 W/cm2 or systems that do not lend themselves to the physical dimensions
necessary for proper implementation. Microchannel heat sinks have been combined with
the superior thermal properties of liquid cooling for increased cooling capability through
single-phase forced convection [2]. Recently, there has been investigation on the addition
of colloidal and nano-sized particles within heat transfer fluids for increased thermal
performance. However, much of this research remains plagued with inconsistent results
due to a lack of dispersion characterization and method description [3].
Immersion of electronic components within inert liquid for cooling has been
practiced in a number of areas of microelectronics. Immersion cooling has significant
advantages over air cooling in that the heat transfer rate is increased and the liquid has a
higher heat capacity than that of a gas. In addition, engineered dielectric thermal fluids,
such as fluoroether and fluoroketone liquids from 3M, have advantageous physical
properties such as low boiling points and large fluid temperature ranges [4-6]. The lower
boiling points allow the implementation of two-phase cooling in which the fluid in direct
contact with the integrated circuits undergoes a phase change from liquid to vapor. This
particular method of cooling uses the latent heat of the fluid rather than its sensible heat.
This allows the coolant and heat sink to remain at constant temperatures.
Passive two-phase immersion cooling can be simpler and less costly than single-
phase forced convection cooling methods since equipment costs such as fans, heat sinks,

5
pumps, and hoses are no longer needed. In addition, the thermal performance is often
superior [7]. Although immersion cooling has several significant advantages over
traditional cooling methods, it is not without shortcomings. The heat transfer
characteristics between the fluid and integrated circuits are not yet well understood. In
addition, the material compatibility between the engineered fluids and the component
materials found within computing systems remains to be characterized. Further advances
in mechanical and electrical construction of the electronic assembly remain to be
completed to take full advantage of the capabilities of immersion cooling [8].
2.2 Dielectric Fluids
Dielectric strength is a measure of a material’s electrical stability as an insulator.
The maximum voltage required to produce a dielectric breakdown is termed the dielectric
strength and is expressed in volts per unit thickness. A higher dielectric strength correlates
to a higher quality insulator. Dielectric strength is affected by the operating temperature
and frequency of electric field. The dielectric strength of a material is often measured by
one of three procedures: short-time method, slow-rate-of-rise method, and step-by-step
method. All three methods entail placing a sample of material between two electrodes and
ramping the voltage at a consistent rate until dielectric breakdown is determined [9].
Dielectric fluids are used as electrical insulators in a variety of high voltage
applications including transformers, high voltage cabling, and microelectronic systems.
Ideal dielectric fluids have a high dielectric strength, thermal stability, and chemical
inertness while also being non-flammable, non-toxic, and environmentally friendly. In
addition, dielectric fluids are often used as a method for heat dissipation. Traditional

6
dielectric fluids include mineral oil, silicone oil, and purified water with each possessing
key characteristics ideal for use in specific applications [10]. Engineered fluids represent
an attempt by companies such as 3M to develop dielectric fluids that have a broader range
of applications by possessing higher heat capacities, greater chemical inertness, and wider
operating conditions, all while yielding a decreased environmental impact.
3M Novec Engineered fluids and 3M Fluorinert Electronic liquids are a class of
thermal management fluids with boiling points ranging from 34°C to 175°C and freezing
points from -38°C to -138°C. Figure 2 shows the chemical structures of the three fluids
investigated. Novec 649 has the lowest global warming potential within the Novec family.
Novec 7100, commonly referred to as HFE-7100, is a mixture of n- and iso-butyl isomers
of methoxyperfluorobutane. FC-72 is a member of the Fluorinert family and is fully
fluorinated (perfluorohexane). This perfluorinated structure provides significant chemical
inertness. Novec 649’s fluoroketone structure suggests that it has an intermediate solvent
power, whereas HFE-7100’s ether linkage and hydrogenated portion increase its solvent
power over the other two fluids. Novec 649 was chosen as the most applicable fluid for
testing given its thermal properties.
Figure 2. Chemical structure of FC-72 (left), Novec 649 (center), and HFE-7100 (right).

7
Table 1 provides some of the physical and thermal properties of the engineered
fluids chosen for testing. It should be noted that the dielectric properties of Novec 649
(C6F12O) are similar to those of FC-72 (C6F14). HFE-7100 (C5F9OH3) has a significantly
higher dielectric constant and lower resistivity. Novec 649’s global warming potential of
1 is among the lowest of any man-made compound. These specific thermal properties
make all these fluids well suited for heat transfer systems, but Novec 649 was the primary
focus of this research due to its preferential combination of thermal and dielectric
properties.
Table 1. Physical properties of engineered fluids used for immersion cooling [5, 11].
Property Working Fluid
Trade Name FC-72 HFE-7100 Novec 649
Molecular Formula C6F14 C5F9OH3 C6F12O
Fluid Type PFC HFE FK
Tb [°C] 56 61 49
Tcritical [°C] 178 195 169
Pcritical [MPa] 1.83 2.23 1.88
Tfreeze [°C] <-100 <-100 <-100
Tflash [°C] None None None
σ [mN/m] 12.0 13.6 10.8
k [W/m-K] 0.057 0.069 0.059
Cp of liquid [J/kg-K] 1050 1183 1103
ρ [kg/m3] 1680 1510 1600
ν [cSt] 0.40 0.38 0.40
h @ Tb [kJ/kg] 88 112 88
Psat at 25 °C [kPa] 30.9 27 40.4
Resistivity [Gohm-cm] 1000000 0.1 10000
Dielect. Const. 1.76 7.4 1.84
DS [[email protected] mm] ~40 ~40 ~40
GWP 9300 297 1
EG [ppmv] NA 750 150

8
2.3 Accelerated Testing
Accelerated testing took place primarily within a Soxhlet extraction apparatus.
Soxhlet extraction is a standard chemistry method used to extract nonvolatile and
semivolatile organic compounds from a solid sample that typically have a low solubility in
the solvent. This type of extraction is commonly referred to as solid-liquid extraction. As
depicted in Figure 3, a solid sample material (1) is placed within the thimble holder. During
operation, this thimble is gradually filled with newly condensed solvent from the
distillation flask. Solvent boils within the distillation flask (3) producing a vapor that
travels up the vapor tube (6) to the condenser (7). The condensed solvent then falls into
the thimble holder (8). When the solvent level reaches the overflow level (9), the siphon
aspirates the fluid within the thimble holder back into the distillation flask (10), taking with
it any extracted analytes. The solvent is then recirculated though the system and the process
continues [12].
Soxhlet extraction provides many advantages over other extraction methods such
as supercritical fluids. These advantages include simplicity, relatively high system
temperatures, and a constant concentration gradient. A high system temperature is
observed as the heat from the boiling solvent within the distillation flask reaches the
extraction cavity. Since the fluid in contact with the component material is distilled, the
analyte concentration within the solvent is effectively zero. This continual reintroduction
of fresh solvent prevents the chance of a reduction in the concentration gradient driving
force for extraction. In addition, increased sample throughput or breadth can be achieved
by running simultaneous extractions [7, 12].

9
Figure 3. Soxhlet extraction apparatus and key extraction parameters [7].
Some of the drawbacks of Soxhlet extraction include the long time necessary for
extraction compared to other techniques. Although 3M states that forty-eight hours is
sufficient to remove most of the substance from a 1mm thick elastomer sample, longer
extraction periods were needed for large component materials [7]. In addition, the large
amount of solvent required for proper operation of the Soxhlet apparatus represents a
significant cost of operation. Due to the increased temperature necessary to boil the
solvent, thermal decomposition of samples is a possibility where solvent boiling points are

10
high. In addition, the direct contact the component material has with the solvent potentially
leaves the component with absorbed and/or adsorbed fluid which may affect subsequent
analysis. Soxhlet extraction was chosen over other extraction techniques for its similarity
with the process predicted within immersion cooling applications. While more advanced
extraction techniques such as microwave or ultrasound assisted Soxhlet extraction would
have potentially yielded a greater analyte concentration, the processes were less indicative
of the immersion cooling applications.
In a limited case, passive hexane extraction of polymeric materials was conducted.
Passive extraction was utilized over hexane within the Soxhlet apparatus for safety
concerns. Provided that hexane is a much stronger solvent than the dielectric fluids under
consideration, it was used to extract large amounts of plasticizer from polymeric materials
(e.g., poly vinyl choloride). HallStar indicates that 85% of the contained plasticizer content
within PVC can be extracted via soaking in hexane [13].
2.4 Computing Materials
High performance computing and high heat flux computing systems are constructed
of numerous types of materials. In passive two-phase immersion cooling, the fluid is in
direct contact with computing system materials. Although most of the performance
centered materials are constructed of metals and metalloids, a significant portion of the
remaining components are made of, or coated with, polymeric materials. These
components include casings, fixtures, interconnects, and packaging. Thus, it is necessary
to consider the chemical makeup of these materials, specifically polymeric materials. A
list of materials chosen for analysis is provided in Appendix A – Materials Included in

11
Screening Study. These materials included those that may be used in application, test
tanks, or are typically used in laboratory or commercial handling and sealing of fluids. It
was understood that not all of the materials named would be used in high performance
computing applications, but a comprehensive approach was taken to evaluate all potentially
viable materials.
The primary concern in immersion cooling is the leaching of polymer additives into
the dielectric fluids. Many polymeric materials contain additives to tailor properties
including stability, flexibility, color, and surface chemistry. Typically, multiple additives
are needed to obtain the desired properties for a given application. For example, poly(vinyl
chloride) (PVC) typically includes additives such as antioxidants, blowing agents, flame
retardants, impact modifiers, plasticizer, and a UV stabilizer [14, 15]. The world additives
market amounts to 7.8 million tonnes and is projected to grow 3.5-4 % per year [16].
Plasticizers are of particular interest in that they are usually included in order to
produce flexible plastics for specific applications. Plasticizers are also used to lower a
polymer’s melt viscosity to facilitate processing. Flexible plastics are achieved by the
inclusion of a plasticizing agent. This plasticizing agent acts as a lubricant between
polymer molecules and increases its free volume. There are two distinct classes of
plasticizers, those that are dissolved in the polymer (external) and those that are chemically
bonded to the polymer (internal). Through reaction, internal plasticizers lead to a reduction
in the molecular weight of the polymer [17]. Table 2 provides a list of commonly used
external plasticizers and their abbreviations.

12
Table 2. Commonly used external plasticizers and abbreviations [14, 18].
Plasticizer Abbreviation
Aromatic esters
Dibutyl phthalate DBP
Dimethoxyethyl phthalate
Di-2-ethylhexyl phthalate DOP, DEHP
Di-n-undecyl phthalate
Di-n-tridecyl phthalate
Butyl benzyl phthalate
Butyl octyl phthalate
Tri-2-ethylhexyl trimellitate
Aliphatic esters
Di-2-ethylhexyl adipate (DOA) DOA
Di-n-butyl sebacate (DBS) DBS
Di-2-ethylhexyl sebacate (DOS) DOS
Di-2-ethylhexyl azelate DIDA
Epoxidized oils
Epoxidized soybean oil
Epoxidized linseed oil
Epoxidized tall oil fatty adds
Flame retardant
Aryl and atylalkyl phosphates
Chlorinated paraffins
Polymeric
Poly(alky1ene adipates, sebacates, and azelates
Acrylonitrile-butadiene copolymers
Phthalates account for 92% of the plasticizers produced worldwide with DOP
representing 51% [17]. DOP has been used extensively since its introduction in 1930.
Phthalate esters were initially determined to be benign to humans [19]. This led to their
use within medical plastics and children’s toys. More recent research has brought phthalate
esters’ biocompatibility into question upon evidence of migration. Phthalates are often
used in polymeric materials that are in intimate contact with medical solutions. Issues such
as migration and leaching are of particular concern during storage [20]. Shah et al.
demonstrated the loss of plasticizer from PVC over a seven day period from migration to

13
silica gel. A total of 40% plasticizer was used with various blends of DOP, butyl benzyl
phthalate (BBP), isodecyl diphenyl phosphate (IDDP), and polybutylene adipate (PBA).
Figure 4 shows that the replacement of DOP with other plasticizers leads to decreased
migration from PVC. The migration of plasticizer within the PVC sample was deemed to
be a function of the molecular weight of the species [20].
Figure 4. DOP migration from PVC over seven day period of exposure to silica gel [20].
In the same study, Shah et al. demonstrated that the dielectric strength of PVC
increases with decreasing DOP concentration following ASTM D-149. Figure 5 shows
that as the ratio of the other included plasticizers increases so does the dielectric strength.
Migration, specifically liquid leaching, is of most concern for high performance computing
systems in which polymeric materials make up a large subset of components. The effect

14
of increased plasticizer concentration within dielectric fluids is of particular concern. Such
issues need to be accounted for within application implementation of passive two-phase
immersion cooling. Table 3 provides a list of plasticizer-related technical challenges.
Figure 5. Changes in dielectric strength as the concentration of DOP present within PVC
decreases [20].
Table 3. Plasticizer-related technical challenges [17].
Migration out of plastic
Solid–solid migration
Evaporation
Liquid leaching
High temperature flexibility
Low temperature lubricity
Health and environmental effects (cytotoxicity)
Flammability concern regarding plasticizers
Compatibility with new polymers
Stability to ultraviolet rays
Biodegradability
Improved material lifetime

15
2.5 Solubility Parameters
The migration of plasticizers within immersion cooling applications is a function
of the polymer, plasticizer, and dielectric fluid. The movement of plasticizer though the
polymer (permeation) depends on the solubility and diffusion coefficients of the plasticizer
in the polymeric material [21]. Diffusion of some plasticizers within PVC is described by
Fick’s second law, where the diffusion coefficient is a function of the concentration
gradient, and is impacted by the morphology of the polymer [22, 23]. Solubility, as it
relates to plasticizers and dielectric fluids, is the capacity of the fluid to uptake plasticizer.
Extending these relationships to immersion cooling applications may provide the use of
solubility parameters in predicting the interaction of component materials and dielectric
fluids.
The term solubility parameter refers to the value of a quantity δ that is often used
in a semi-quantitative manner to predict and interpret the thermodynamic likeness of two
components. There are many parameters in use today including the Kauri-Butanol number,
heptane number, analine cloud point, Hildebrand solubility parameter, and the Hansen
Solubility parameter. All of the parameters are relative to their particular scale and
typically can be converted between systems except for those that are based purely on
empirical relationships. Interestingly, Tuma et al. used the KB value to describe
engineered fluids even though this parameter was empirically developed for a dramatically
different class of chemicals [7].

16
2.5.1 Kauri-Butanol
Kauri-Butanol (KB) has been used to measure engineered fluid solvent power based
upon ASTM standard D1133 for hydrocarbon solvents. However, it is typically used to
describe solvents within paint and lacquer formulations with an initial boiling point over
40°C and a dry point under 300°C. The KB value of solvents is the volume of solvent
necessary to produce a defined degree of turbidity when added to 20 g of a standard solution
of kauri resin in n-butyl alcohol. A higher KB value indicates a stronger solvency. In a
typical experiment, a solvent of interest is titrated into a solution of kauri resin located
within an Erlenmeyer flask. The endpoint of this titration is determined when the sharp
outlines of 10-point print placed directly under the Erlenmeyer flask is blurred or obscured.
The volume of solvent, in mL, needed to reach the endpoint of titration C is inserted into
Equation 2.1 along with the volume of toluene A and a heptane-toluene blend consisting of
25 ± 0.1% toluene and 75 ± 0.1% n-heptane B required to titrate the same solution, in mL
[24].
Table 4 provides the KB values of the three dielectric fluids used in this work.
𝐾𝐵 =65(𝐶−𝐵)
(𝐴−𝐵)+ 40 (2.1)
Table 4. 3M dielectric fluid KB values [7].
Dielectric Fluid KB Value
Novec 649 0
HFE-7100 10
FC-72 0

17
2.5.2 Hildebrand Solubility Parameter
Joel H. Hildebrand laid the foundation of modern solubility theory when he
proposed that the square root of the cohesive energy density yielded a value representative
of a solvent’s relative solvency power. The Hildebrand parameter is a numerical estimation
of the attractive forces between molecules better known as the van der Waals forces. These
forces can be split into three categories: London dispersion forces, dipole induced-dipole
interactions (Debye), and permanent dipole-dipole interactions (Keesom). Given its
foundation, the Hildebrand parameter is most applicable to non-polar solvents. In addition,
the solubility parameter of solvent mixtures can be calculated by averaging the Hildebrand
values of the individual solvent components [25].
A working definition of the Hildebrand solubility parameter 𝛿 is often used
𝛿 = (−𝐸
𝑉𝑙 )0.5
(2.2)
where −𝐸 is the energy of vaporization to the gas phase with infinite separation of the
molecules and 𝑉𝑙 the molar volume of the liquid [26]. At low vapor pressures, the vapor-
liquid equilibrium is considered ideal and allows for the simplification of Equation 2.2 to
Equation 2.3
𝛿 = (∆H𝑉− 𝑅𝑇
𝑉𝑙 )0.5
(2.3)
where ∆H𝑉 is the heat of vaporization, 𝑅 the ideal gas constant, and 𝑇 is the temperature.
This simplification directly allows the calculation of the Hildebrand parameter
calorimetrically. For polymeric materials, swelling behavior is often used to assign
Hildebrand values [26]. The units of the Hildebrand parameter are often expressed as
MPa0.5, which is 2.0455 times larger than that in cal0.5cm-1.5.

18
2.5.3 Hansen Solubility Parameter
The Hansen solubility parameter (HSP) is closely related to the Hildebrand
parameter in that it attempts to further delineate the interactions between molecules.
Hansen describes the total energy of vaporization of a liquid as consisting of (atomic)
dispersion forces, (molecular) permanent dipole-permanent dipole forces, and (molecular)
hydrogen bonding. Hansen attempts to provide potentially more information regarding
solubility by breaking down the fundamental interactions into three components, shown in
Equation 2.4, where the total cohesive energy, E, is the sum of the energies that encompass
it
𝐸 = 𝐸𝐷 + 𝐸𝑃 + 𝐸𝐻 (2.4)
where 𝐸𝐷 is the energy from dispersion forces, 𝐸𝑃 the polar cohesive energy, and 𝐸𝐻 the
electron exchange parameter. Dividing Equation 2.4 by the molar volume gives the square
of the total (Hildebrand) solubility parameter as the sum of the squares of the individual
Hansen components (Equation 2.5) in MPa0.5
𝛿2 = 𝛿𝐷2 + 𝛿𝑃
2 + 𝛿𝐻2 (2.5)
The HSP can potentially allow for more accurate determination of solvent
interactions since component parameters can now be compared. For example,
nitromethane and ethanol have similar total (Hildebrand) solubility parameters of 25.1 and
26.1 MPa0.5, respectively, but their affinities are very different. In this case, ethanol is
water soluble and nitromethane is not. The sole use of the Hildebrand parameter would
have precluded this determination [27]. In addition to the large amount of HSP currently
available, a method of group contribution exists for prediction of individual solvent

19
parameters for components not yet determined. HSP can be calculated with a table of
molecular group contributions and Equation 2.6
𝛿 = (∑ 𝑛𝑖𝐹𝑖 + ∑ 𝑚𝑗𝑆𝑗 + 75954.1)𝑗𝑖0.383837
− 56.14 (2.6)
where 𝐹𝑖 is the contribution of a first-order group of type i and 𝑛𝑖 the number of times that
i appears in the compound, and 𝑆𝑗 is the contribution of second-order group of type j that
appears 𝑚𝑗 times. In addition to hand calculations, many computer programs are available
to automate this process such as ThermoData Engine (TDE) provided within the ASPEN
Plus software suite. TDE is a thermodynamic data prediction, evaluation, and correlation
tool provided though a long-term collaboration agreement with the National Institute of
Standards and Technology (NIST). This particular program accepts input of the molecular
structure of the compound with key species properties such as molecular weight and
specific gravity for parameter estimation. TDE utilizes twenty-eight predictive methods
based on group contribution, corresponding states theory, and a library of electronic
databases of experimental data. The primary focus of TDE is on pure organic compounds
comprised of carbon, hydrogen, oxygen, nitrogen, fluorine, chlorine, bromine, iodine,
sulfur, and silicon [28, 29].

20
Chapter 3
Experimental Details
This thesis is focused on material compatibility in passive two-phase immersion
cooling applications. The research was conducted as part of a larger multidisciplinary
project and some results herein involved other researchers. For example, radio frequency
(RF) testing was carried out with Dr. Michael Hamilton’s group in the electrical
engineering department and small scale tank tests were conducted with Dr. Sushil
Bhavnani’s group in the mechanical engineering department, both at Auburn University.
All other work not referenced was a product of the author’s alone.
3.1 Soxhlet Extraction
Accelerated testing of component materials took place within a Soxhlet extractor.
A portion of component material taking up approximately 30-40% of the thimble volume
was placed within the Soxhlet apparatus; 120 mL of engineered dielectric fluid was added
to the round bottom flask. The masses of the component material and round bottom flask
were recorded before experiment initiation. The Soxhlet apparatus was assembled, placing
the thimble within the extractor and connecting the round bottom flask and condenser to
the extractor. Glass joints were sealed with Parafilm and the round bottom flask was
covered in a sheet of insulation. The six-position Glas-Col heaters were set to a dial
position of 4.5 which correlated to approximately 95°C, based on water tests. This

21
temperature setting maintained heated glassware and prevented early condensation of the
engineered fluid within the vapor tube. It also helped to account for boiling point elevation
as the contaminant concentration increased during accelerated testing. Figure 6 displays a
typical Soxhlet setup used during the extraction process.
Figure 6. Twelve simultaneous Soxhlet extractions of component materials.
After extraction, the extraction apparatus was disassembled and the component material
weighed. Three 20 mL extraction fluid samples were collected and the masses determined.
These samples were collected specifically for general, pH, and RF testing. RF testing of
contaminated samples was carried out via the previously mentioned collaboration [30].
The remaining extraction fluid was allowed to evaporate within an evaporation flask in
order to determine the representative percentage of contaminant within the extraction fluid.

22
The round bottom flask was allowed to dry and the final mass was recorded. Figure 7
displays the typical sampling procedure. In some cases the accuracy of the mass balances
were more important than the collection of extraction fluid. Here, sample collection was
forgone and the extraction fluid was left within the round bottom flask to evaporate. The
final mass of the round bottom flask was determined after complete evaporation of the
extraction fluid.
Figure 7. Sampling procedure.
3.2 Small Scale Tank Testing
In some cases, contaminated fluid was acquired from small scale tank tests
conducted by collaborator Dr. Sushil Bhavnani. In those tests, printed circuit boards and
Teflon insulated wiring were in direct contact with the dielectric fluid. Integrated circuit
chips were powered in a four die configuration on a vertically-oriented printed circuit
board. The chips were subjected to increasing and decreasing heat flux cycles, referred to
20 mL Sample
Vials
Evaporation
Flask
Round Bottom
Flask
General
Testing
pH
Testing
RF
Testing

23
as data runs. Figure 8 provides a graphical depiction of the testing process and the tank
testing setup itself. In a limited case, data runs were completed with intentionally
contaminated Novec 649 fluid. These runs were completed to examine the effect severely
contaminated fluid would have on the thermal performance of the system. To create the
intentionally contaminated fluid, 30 mL of DOP were added to 8 L of Novec 649 yielding
a concentration of 3.70 g/L or 0.23 wt% contaminants.
Figure 8. Tank testing apparatus and data acquisition diagram [31].
3.3 Mass Balances
A main source of data collected during accelerated testing was through the use of
mass balances. This was a similar approach to that taken by 3M and others [7]. However,
in the other cases, all dielectric fluid was allowed to vaporize from the distillation flask
leaving behind only the contaminant substances. This resulted in less mass balance error

24
but prevented obtaining chemical or electrical information on the contaminated fluid. In
this work, the sampling procedure was refined during initial experimental runs. A standard
procedure was developed where three sample vials with 20 mL of contaminated fluid were
taken from each accelerated test to be distributed for general analysis (e.g., ATR-FTIR),
pH testing, and dielectric testing. The remainder of the fluid was set aside within an
evaporation flask for quantification of the mass of contaminant (residue) removed from the
material under extraction.
In order to determine the mass of the fluid within a sample vial or evaporation vial,
the mass of the empty vial was subtracted from the mass of the full vial as shown in
Equation 3.1.
𝑚𝑓𝑙𝑢𝑖𝑑,𝑠𝑎𝑚𝑝𝑙𝑒 = 𝑚 𝑠𝑎𝑚𝑝𝑙𝑒,𝑓𝑢𝑙𝑙 − 𝑚 𝑠𝑎𝑚𝑝𝑙𝑒,𝑒𝑚𝑝𝑡𝑦 (3.1)
The total residual mass of material extracted was determined by allowing the remaining
fluid not consumed by the sample vials to evaporate within the evaporation flask.
Subtracting the mass of the empty evaporation vial from the mass of the evaporation vial
after allowing the fluid to evaporate yields the mass of the residue within the evaporation
vial (Equation 3.2).
𝑚𝑟𝑒𝑠𝑖𝑑𝑢𝑒,𝑒𝑣𝑎𝑝 = 𝑚 𝑒𝑣𝑎𝑝,𝑠𝑎𝑚𝑝𝑙𝑒 − 𝑚 𝑒𝑣𝑎𝑝,𝑒𝑚𝑝𝑡𝑦 (3.2)
Next, the total residue extracted from the component was determined by dividing
the mass of the residue within the evaporation flask by the weight percentage of the fluid
added to the evaporation flask as shown in Equation 3.3. This weight percentage permits
the estimation of the residue within the sample vials without having to allow them to
completely dry.
𝑚𝑟𝑒𝑠𝑖𝑑𝑢𝑒,𝑡𝑜𝑡𝑎𝑙 =𝑚 𝑟𝑒𝑠𝑖𝑑𝑢𝑒,𝑒𝑣𝑎𝑝
𝑤 𝑓𝑙𝑢𝑖𝑑,𝑒𝑣𝑎𝑝=
𝑚 𝑟𝑒𝑠𝑖𝑑𝑢𝑒,𝑒𝑣𝑎𝑝𝑚 𝑓𝑙𝑢𝑖𝑑,𝑒𝑣𝑎𝑝
𝑚 𝑓𝑙𝑢𝑖𝑑,𝑡𝑜𝑡𝑎𝑙
(3.3)

25
Finally, the mass extracted was calculated by subtracting the empty flask weight
from the mass of the flask after extraction (i.e., containing residue) and adding the mass of
the residue determined to be in the sample vials (Equation 3.4). This value was then
divided by the total mass of the material initially to arrive at a percentage (Equation 3.5).
𝑚𝑒 = (𝑚 𝑓𝑙𝑎𝑠𝑘,𝑟𝑒𝑠𝑖𝑑𝑢𝑒 − 𝑚 𝑓𝑙𝑎𝑠𝑘,𝑒𝑚𝑝𝑡𝑦) + 𝑚𝑟𝑒𝑠𝑖𝑑𝑢𝑒,𝑡𝑜𝑡𝑎𝑙 (3.4)
𝑚𝑒% =𝑚 𝑒
𝑚 𝑚𝑎𝑡𝑒𝑟𝑖𝑎𝑙,𝑖𝑛𝑡𝑖𝑎𝑙𝑙𝑦 𝑥 100% (3.5)
In addition, the mass absorbed was determined in a similar manner by subtracting the initial
mass of the material from the final mass of the material and adding the mass extracted
(Equation 3.6). Again, this value was divided by the total initial mass to arrive at a
percentage (Equation 3.7).
𝑚𝑎 = (𝑚 𝑚𝑎𝑡𝑒𝑟𝑖𝑎𝑙,𝑓𝑖𝑛𝑎𝑙 − 𝑚 𝑚𝑎𝑡𝑒𝑟𝑖𝑎𝑙,𝑖𝑛𝑡𝑖𝑎𝑙𝑙𝑦) + 𝑚𝑒 (3.6)
𝑚𝑎% =𝑚 𝑎
𝑚 𝑚𝑎𝑡𝑒𝑟𝑖𝑎𝑙,𝑖𝑛𝑡𝑖𝑎𝑙𝑙𝑦 𝑥 100% (3.7)
3.4 Optical Microscopy
A Nikon (Melville, NY) Eclipse 80i optical microscope was used to examine the
changes in surface characteristics of the component materials as well as study any
particulates that showed up in the contaminate residues. Samples were illuminated with
either reflected or transmitted light. Component material samples were prepared by placing
them on a glass slide and residue samples were allowed to dry before viewing. A 20x (0.45
NA) Nikon “Luminous Universal Plan Fluor” objective was used either with a 1x or 2x
magnification applied before the camera yielding a maximum effective magnification of
40x. Images were captured and processed in Nikon Elements software.

26
3.5 Scanning Electron Microscopy
A scanning electron microscope (SEM) was utilized for characterization of sample
surface morphology. In addition, energy dispersive X-ray spectroscopy (EDS) was used
in conjunction with SEM for elemental analysis. Samples were prepared by adhering
double sided carbon tape to a JEOL Specimen Mount and pressing materials onto the
surface of the carbon tape. Samples were then gold sputter coated to enhance their
conductivity. Examination was carried out using a JEOL 7000-F Field Emission-Scanning
Electron Microscope.
3.6 Ultraviolet-Visible Spectroscopy
Ultraviolet-visible spectroscopy (UV-Vis) is an analytical technique often used for
the quantification of analytes such as organic compounds. UV-Vis is particularly useful
for compounds that have π-electrons, non-bonding valence-shell electrons and/or a great
deal of conjugation. This technique uses a range of wavelengths starting from the near UV
range of 200-380 nm progressing through the visible wavelengths of 380-780 nm to 800
nm. Within this range, molecules undergo electronic transitions from a ground state to an
excited state. The energy difference between these two excited states is equal to the energy
of the photons absorbed by the molecule. UV-Vis spectra consist of broad absorption
bands rather than sharp lines is due to the absorption of radiation over a range of
wavelengths. Furthermore, the electronic transition can be accompanied by a change
between the vibrational levels. Thus, photons that have excess or insufficient energy can
be accepted by a molecule whether the molecule undergoes a pure electronic transition or
a transition between vibrational levels [32].

27
Quantification of analytes is a particularly useful result obtainable from UV-Vis
analysis. Concentrations of absorbing species are commonly determined utilizing the
Beer-Lambert law shown in Equation 3.8
𝐴 = log (𝐼0
𝐼) = 𝜖𝑐𝐿 (3.8)
where 𝐼0 is the intensity of incident light at a particular wavelength, 𝐼 the intensity of
transmitted light, 𝜖 is extinction coefficient, c the concentration, and L the path length. The
extinction coefficient is a fundamental molecular property (directly measureable) for a
particular solvent, specific for a particular wavelength, temperature and pressure [33].
UV-Vis was particularly useful for species containing conjugated ring structures
and the non-bonding electrons found on oxygen. Polymeric additives such as plasticizers
are organic species that encompass such structures. This particular technique was applied
to dioctyl phthalate (DOP), a largely used plasticizer. The non-bonding valence shell
electrons of oxygen present correspond to the first peak around 200 nm and the conjugated
ring structure leads to the second peak around 275 nm. The structure of DOP and its UV-
Vis absorbance spectrum are provided in Figure 9. Making use of these peaks, a calibration
curve was created for quantification of DOP present within a component’s residue. Some
concentrations were diluted in order to maintain the absorption values within the linear
region of the Beer-Lambert law.

28
Figure 9. Chemical structure of dioctyl phthalate (DOP) and its UV-Vis absorption
spectrum.
A stock solution of DOP in hexane was created. From this solution, samples were
diluted to obtain a range of concentrations (weight fractions). These samples were placed
within a 1 cm quartz cuvette and analyzed with UV-Vis. The absorbance at 275 nm was
recorded. A plot of the absorbance values with weight fraction was produced and a linear
line fitted to the data. Figure 10 shows the data and linear fit. The extinction coefficient
was determined to be 1800.8 g total g DOP-1 cm-1.
0
0.5
1
1.5
2
190 290 390 490 590 690 790 890
Abso
rban
ce
Wavelength (nm)

29
Figure 10. Calibration curve of DOP in hexane used for concentration determination.
UV-Vis spectroscopy was performed with a Thermo Scientific NanoDrop 2000c
spectrophotometer with a 1 cm quartz cuvette. 1 mL of a component residue was allowed
to dry within a sample vial, leaving behind the contaminant. 3 mL of hexane were added
to the remaining contaminant and mixed with a Barnstead/Thermolyne Maxi-Mix Plus
mixer. Masses were recorded for all fluid measuring steps and concentrations were
determined via a calibration curve.
3.7 Fourier Transform Infrared Spectroscopy
Fourier Transform Infrared (FTIR) can be applied to all forms of samples whether
solids, liquids, or gasses. FTIR passes infrared radiation through a sample and registers
the radiation that passes through (transmitted). The result is a spectrum that represents the
molecular fingerprint of the sample. This fingerprint can be used to qualitatively probe the
y = 1800.8x
R² = 0.9931
0
0.2
0.4
0.6
0.8
1
0.0E+00 1.0E-04 2.0E-04 3.0E-04 4.0E-04 5.0E-04
Ab
sorb
ance
(2
75
n
m)
WDOP (g DOP/g total)
Calibration SolutionLinear (Calibration Solution)

30
chemical composition and molecular structure of an unknown compound. Such
determinations are typically made via comparisons of an unknown spectrum to a library of
known compounds. For less common materials, FTIR can be coupled with mass
spectrometry, X-ray diffraction, nuclear magnetic resonance, and various other techniques
for positive identification. In addition, the size of the peaks within an FTIR spectrum
directly correlate to the amount of material present, allowing for quantitative analysis [34,
35].
FTIR spectroscopy is based on the vibrational excitation of molecular bonds by the
absorption of infrared light energy. A molecular bond can vibrate at several specific
frequencies. These vibrational frequencies are caused by the absorption of infrared light
energy. The light energy absorbed (determined by wavelength) is exactly equal to the
difference between the two energy states – usually the ground state (E0) and the first excited
state (E1) [36]. Consistent with the infrared portion of the electromagnetic spectrum, the
energy associated with these (successive) transitions in molecular vibrational states is
around 1-10 kilocalories/mole [35].
Originally, dispersive spectroscopy separated individual frequencies of energy via
a prism or grating. The detector then measured the energy at each frequency that passed
through the sample resulting in a plot of intensity versus frequency (spectrum). FTIR was
developed to overcome the limitations of dispersive instruments such as slow scanning
times. FTIR measures all of the frequencies simultaneously rather than individually though
the use of an interferometer. As the infrared beam passes through the interferometer, a set
of mirrors are used to cause wave interference that produces a resulting signal
(interferogram) that contains information about every infrared frequency that comes from

31
the source. The raw data of absorption versus mirror position is collected and processed
using a fast Fourier transform (FFT) algorithm to produce the spectrum [33].
Attenuated total reflectance (ATR-FTIR) makes use of a crystal (e.g., germanium,
diamond, etc.) that observes total internal reflection. Upon impact of the infrared light with
the surface of the crystal that is in contact with the sample, an evanescent wave is created
that penetrates the sample. In regions of the IR spectrum where the sample absorbed
energy, the evanescent wave will be altered or attenuated [33]. Any attenuated energy is
passed back into the crystal from the sample and registered by the detector. ATR-FTIR is
a critical technique used in the analysis of solid materials or small amounts of liquids.
In order to identify unknown compounds within residues of the extraction fluid,
infrared spectroscopy was conducted. A Thermo Scientific Nicolet iS10 FTIR
spectrometer was used in conjunction with a HATR diamond attenuated total reflectance
crystal for full spectral range analysis from 4000 – 400 cm-1. Two methods of sample
preparation were conducted. The first method allowed extraction fluid samples to directly
dry on the crystal whereas the second method allowed extraction fluids to condense within
a sample vial. The remaining residue was swabbed and placed onto the ATR crystal for
identification. The sample spectra were collected and analyzed within Omnic Series 8.1
software. Compound identifications were made with the OMNIC Spectra Advanced
Material Characterization Software package containing over 9,000 spectra was well as
literature searches.

32
3.8 Thermogravimetric Analysis
Thermogravimetric analysis (TGA) is a method of thermal analysis used to
determine physical and chemical properties of materials as a function of increasing
temperature or time. TGA is often used to examine the mass lost or gained due to
decomposition as well as the loss of volatiles such as water or other fluids that may be
absorbed or adsorbed. TGA is particularly useful in determining relative changes in these
properties for a given experimental compound.
Thermal characterization of polymers and activated carbon was conducted using a
TA Instruments Q50 Thermal Gravimetric Analyzer (TGA). Polymer samples were
compared after extraction with all three engineered fluids. Samples were loaded into a
tared platinum, high temperature weigh pan and the sample chamber was purged with both
air and argon at a flowrate of 90 cm3/min. The temperature was held at 10°C above the
boiling point of the engineered fluids for twenty minutes and then ramped at 10°C/min to
100°C beyond the thermal degradation point of the polymer.
3.9 Differential Scanning Calorimetry
Differential scanning calorimetry (DSC) is a thermal analysis technique that
measures the difference in the amount of heat required to increase/decrease the temperature
of a sample and a reference. DSC is often used to detect phase transitions of samples such
as melting, crystallization, or glass transition temperatures. In these instances, the heat
flow required for these transitions will increase or decrease depending upon whether the
process is endothermic (requiring heat) or exothermic (outputting heat). DSC is commonly
used to examine the thermal characteristics of polymer materials. Thermal characterization

33
of polymeric component materials was conducted using a TA Instruments Q2000
differential scanning calorimeter (DSC). DSC studies were performed within hermitically
sealed aluminum pans at a scan rate of 10°C per minute over a temperature range of -90 to
300°C with three thermal cycles of heating-cooling-heating.
3.10 Gas Chromatography-Mass Spectrometry
Samples were prepared for gas chromatography-mass spectrometry (GC/MS) by
first allowing the component residues to completely dry within a sample vial. This allowed
for a condensed sample to be reconstituted within acetonitrile for injection into a Waters
GCT Premier mass spectrometer. The GCT Premier is an orthogonal acceleration time-of-
flight (oa-TOF) mass spectrometer housed within the Mass Spectrometry Center and
maintained under the College of Sciences and Mathematics located on Auburn University’s
campus. Spectrum analysis was conducted using Masslynx (V4.1: SCN 569) software with
compound matches made to NIST/NIH/EPA Mass Spectral Library for positive
identification. Samples were ionized via electron ionization (EI) and passed through a ZB-
5MS, 30 mm x 0.25 mm x 0.25 µM (length x diameter x coating), Phenomenex column
with a helium carrier gas.

34
Chapter 4
Results and Discussion
4.1 Soxhlet Screening Study
The individual component materials chosen for investigation are listed in Appendix
A – Materials Included in Screening Study. These materials were subjected to an
accelerated testing procedure entailing a standardized five day Soxhlet extraction. Samples
were numbered for identification purposes and followed the format: (Identification #)
Material Name. Upon completion of extraction, mass balances were calculated for the
amount of material, termed residue, removed from the component material and analysis
was conducted to determine the chemical makeup of the eluted compounds. Where
possible, concentrations were calculated for the residues found in solution.
4.1.1 Error Estimation
Twelve Soxhlet extractions of 4.34 grams of (21) PVC were carried out in Novec
649. The mass extracted and mass absorbed data, along with some basic statistical figures,
are provided in Table 5. The standard deviation was found to be 0.80% and 0.40% for the
mass extracted and mass absorbed (absolute value) calculations, respectively. Error was
estimated as two standard deviations yielding ± 1.60% for mass extracted and ± 0.80% for
mass absorbed. Ideally, extractions on all materials would have been repeated multiple

35
times in order to develop confidence in the data obtained. However, the number of
materials named for testing combined with the length of extraction and cost of
materials/fluids made this impractical. In a limited case, some materials were extracted
more than once in Novec 649. These materials and the standard deviations of masses
extracted and absorbed are shown in Table 6. It was expected that component materials
would elute compounds at differing rates dependent on thermodynamic interactions and
diffusion kinetics. However, comparison of the estimated error from repeated PVC
extractions is similar to that of materials only extracted a few times. The large difference
determined in (18) Tygon is likely due to its composition containing a greater amount of
leachables.
Table 5. Soxhlet error determination of masses extracted, masses absorbed, and
concentration with (21) PVC in Novec 649.
Sample # me% ma% Concentration (g/L)
1 2.10% 0.10% 0.525
2 2.60% 0.20% 0.732
3 4.50% 1.50% 0.361
4 2.70% 0.00% 0.661
5 3.50% 0.10% 0.488
6 4.00% 0.70% 0.706
7 2.10% 0.00% 0.294
8 2.90% 0.90% 0.513
9 1.70% 0.40% 0.585
10 2.30% 0.10% 0.810
11 2.50% 0.20% 0.691
12 2.40% 0.20% 0.145
Std. Dev.: 0.80% 0.40% 0.198
Average: 2.78% 0.37% 0.543
Max: 4.50% 1.50% 0.810
Min: 1.70% 0.00% 0.145
Range: 2.80% 1.50% 0.665
Std. Error: 0.24% 0.16% 0.057

36
Table 6. Standard deviation of masses extracted and absorbed for some materials
extracted more than once.
Material Standard Deviation Number of
Extractions # Name me% ma%
18 Tygon 8.19% 8.80% 3
20 EPDM 0.55% 0.66% 3
24 Nalgene 0.25% 0.06% 3
25 Natural Rubber 0.21% 0.26% 3
26 Latex Rubber Tubing 0.40% 0.29% 3
Average: 1.92% 2.01%
Max: 8.19% 8.80%
Min: 0.21% 0.06%
The standard deviation of the concentration data provided in Table 5 was found to
be 0.198 g/L. This is significantly large given that the minimum amount of DOP
concentration determined was 0.145 g/L. This raises question on the accuracy of the
procedure for determining concentration. A large assumption is made during the
concentration calculation that the DOP within the sample vial is of negligible mass or
volume. Essentially, the amount of DOP added to the hexane is an insignificant amount
compared to the much larger amount of solvent added. This is a reasonable assumption as
the weight of DOP left in a vial after evaporation of 1 mL of fluid sample (i.e., Novec 649,
HFE-7100, FC-72) is not easily determined via a scale due to the small amount that
remains.
Another point to note is that the larger concentrations determined do not necessarily
coincide with the larger mass extracted percentages. This indicates there is a discrepancy
between the concentration being determined and the mass extracted which should be
connected. It is believed that during collection of the sample that was to be used for
concentration determination, contaminant (e.g., DOP) that was freely floating (i.e., super

37
saturated solvent) may have been pulled into the syringe and deposited into the sample vial
producing an egregiously large concentration. This type of error was unavoidable for
contaminants that were extracted to the extent DOP was. The average concentration of
0.543 g/L is probably a reasonable estimation of the amount of DOP extracted from (21)
PVC with Novec 649 since most concentrations fall around the 0.500 g/L point.
The main source of error was believed to be the rapid evaporation of the solvent
during sample collection and via leakage at the Soxhlet setup joints. Several remediation
strategies were attempted such as sealing the joints with aluminum foil tape over traditional
Parafilm as well as a Parafilm-Teflon tape-Parafilm layering technique. Figure 11 shows
the aluminum foil tape over Parafilm at the round bottom flask/extractor joint as well as
the traditional Parafilm setup. The attempted remediation strategies did not produce a
noticeable decrease in solvent leakage. With aluminum foil, it was believed that the
Parafilm prevented proper sealing of the connections by forming a barrier between the
glass and the foil tape. This provided a route of escape even with the foil tape on top. In
addition, the dielectric fluids’ chemical structure similarity to Teflon prevented this tape
from being used alone. Upon use of this tape in conjunction with Parafilm, the Parafilm
appeared to overheat from the insulation of the Teflon tape and thus prevent a good seal
around the glassware junctions.

38
Figure 11. Efforts to avoid joint leakage showing aluminum foil tape (bottom) over
traditional Parafilm (top).
4.1.2 Mass Balances
For all materials subjected to accelerated testing, mass balances provided a key
source of information regarding the movement of material within the system. It was simple
to pick out the component materials that displayed the greatest amount of leaching. These
materials were often polymeric in nature and represent the focus of the majority of analysis
conducted. Figure 12 and Figure 13 display the masses extracted and absorbed,
respectively, for the majority of materials. In most cases, the differences in material
extractions and/or absorptions are not statistically different.

39
Figure 12. Mass extracted percentages of component materials subjected to accelerated
testing in Novec 649.
Figure 13. Mass absorbed percentages of component materials subjected to accelerated
testing in Novec 649.
0.0%
5.0%
10.0%
15.0%
20.0%
25.0%
30.0%
LT
CC
Si+
Al-
X
Hyso
l
Co
pper
SnP
b S
old
er
SnA
g S
old
er
Mem
ory
Modu
le M
old
ing
Xce
de
Co
nnec
tor
Ser
ay C
on
nec
tor
Neo
Sca
le C
onn
ecto
r
Rib
bon C
onnec
tor
Avag
o
Tygo
n T
ubin
g
EP
DM
PV
C T
ub
ing
Poly
eth
yle
ne
Tubin
g (
Bla
ck)
Typic
al S
ilic
one
Tu
bin
g
Nal
gen
e T
ubin
g
Nat
ura
l R
ub
ber
(R
ed)
Lat
ex R
ub
ber
Tub
ing
Lat
ex T
ub
ing
Poly
ure
than
e T
ubin
g (
Blu
e)
Gla
ss S
lide
Lex
an (
poly
carb
onat
e)
Ple
xig
las
Shin
Ets
u X
-23
TS
F T
ack
y F
lux
Vac
uum
Gre
ase
Dura
lco
Tef
lon
Wir
ing
PV
C W
irin
g
Nylo
n W
irin
g
Ch
lori
nat
ed P
oly
ethy
lene
Wir
ing
FE
P W
irin
g
EP
DM
Tubin
g
Nit
rile
Glo
ve
PV
C R
ibbon
Neo
pre
ne
O-R
ing
FK
M O
-Rin
g
Tef
lon
Fil
led O
-Rin
g
EP
DM
O-R
ing
EP
DM
Gas
ket
Lat
ex G
lov
e
Poly
ure
than
e T
ubin
g (
Cle
ar)
Tef
lon
Wir
ing
0.0%
2.0%
4.0%
6.0%
8.0%
10.0%
12.0%
14.0%
16.0%
18.0%
LT
CC
Si+
Al-
X
Hyso
l
Co
pper
SnP
b S
old
er
SnA
g S
old
er
Mem
ory
Modu
le M
old
ing
Xce
de
Co
nnec
tor
Ser
ay C
on
nec
tor
Neo
Sca
le C
onn
ecto
r
Rib
bon C
onnec
tor
Avag
o
Tygo
n T
ubin
g
EP
DM
PV
C T
ub
ing
Poly
eth
yle
ne
Tubin
g (
Bla
ck)
Typic
al S
ilic
one
Tu
bin
g
Nal
gen
e T
ubin
g
Nat
ura
l R
ub
ber
(R
ed)
Lat
ex R
ub
ber
Tub
ing
Lat
ex T
ub
ing
Poly
ure
than
e T
ubin
g (
Blu
e)
Gla
ss S
lide
Lex
an (
poly
carb
onat
e)
Ple
xig
las
Shin
Ets
u X
-23
TS
F T
ack
y F
lux
Dura
lco
Tef
lon
Wir
ing
PV
C W
irin
g
Nylo
n W
irin
g
Ch
lori
nat
ed P
oly
ethy
lene
Wir
ing
FE
P W
irin
g
EP
DM
Tubin
g
Nit
rile
Glo
ve
PV
C R
ibbon
Neo
pre
ne
O-R
ing
FK
M O
-Rin
g
Tef
lon
Fil
led O
-Rin
g
EP
DM
O-R
ing
EP
DM
Gas
ket
Lat
ex G
lov
e
Poly
ure
than
e T
ubin
g (
Cle
ar)
Tef
lon
Wir
ing

40
As previously mentioned, increasing the amount of post-Soxhlet residue sample
available for analytical testing decreased the accuracy of the mass balance. In the standard
Soxhlet test performed by 3M and others, all fluid was evaporated directly from the
Soxhlet. This makes the mass balance simple, however, it precludes measuring fluid
properties and leaves any residue distributed over a relatively large, somewhat inaccessible
surface area. Removing fluid samples for analysis and evaporating off a portion of the
fluid in a smaller container increased mass balance measurement error. Data on the mass
change of the component material under study was generally less accurate than
measurements of the amount of material extracted into the fluid. This was due to an initial
amount of Novec 649 absorbed into the component which was rapidly evaporating during
efforts to make final mass measurements. It was therefore difficult to assess the amount
of initial absorption/swelling that existed during immersion. Similarly, more tightly
adsorbed Novec 649 can compensate for the loss of additives/plasticizers during testing.
In order to evaluate the change in fluid contamination with time, studies were
performed to examine the extraction rates of some component materials. Samples were
collected from a sample collection port installed in the side arm of the round bottom flasks.
The setup for this experiment is shown in Figure 14. A 3.4 g sample of (21) PVC tubing
was extracted in Novec 649 and HFE-7100 for twelve hours with two hour sample
intervals. (21) PVC tubing was chosen given the ability to determine concentrations via
UV-Vis. The results are shown in Figure 15.

41
Figure 14. Soxhlet extraction of (21) PVC apparatus setup for concentration profile
determination.
Figure 15. Concentration of DOP within Soxhlet setup during extraction of (21) PVC
with Novec 649 and HFE-7100.
0.000
0.050
0.100
0.150
0.200
0.250
0.300
0.350
0.400
0 2 4 6 8 10 12
DO
P C
on
centr
atio
n (
g/L
)
Time (Hours)
Novec 649
HFE 7100
Sample
Collection
Port

42
There was an initial increase in the concentration determined with time for both
fluids, however, after the six hour point there was more scatter in the data. The rate of
extraction was also clearly lower than in the first few hours. The error was determined to
be a result of the Soxhlet extractor’s status with regard to the number of times the thimble
containing the material had emptied and been refilled with fresh fluid. Attention was not
given to the Soxhlet extractor’s turnover status during sample collection in order to
preclude bias. A simpler method might entail counting extractor turnover and determining
concentrations after a given number of refreshes. The amount of turnover for a given hour
period could be determined and extrapolated for interval determination. Although this
method could have led to a greater understanding of the transport kinetics involved and
perhaps the barrier properties of the polymer, these analyses were outside the scope of the
project. Further investigation would be necessary in order to develop a better
understanding of the transport processes at hand. Feldman has explained these processes
to be dependent upon many factors such as the physical properties of the polymer (e.g.,
density, solubility, morphology, etc.), nature of the fluid, and temperature among others
[37].
A second approach was tested in which the concentration profile was split into
twenty-four hour increments and three Soxhlet setups were initiated for each interval. This
method did not provide the detailed information of the aforementioned procedure but
instead provided a general consensus of the effect prolonged exposure to the dielectric
fluids would have on the component materials. In addition, increasing the interval
decreased the amount of error. Again this experiment was carried out with (21) PVC tubing

43
and Novec 649. Figure 16 shows the mass extracted and mass absorbed data for the first
five days of extraction as well as two, four, six, and eight week intervals.
In some instances where extraction took place over many weeks it was necessary
to replenish fluid that escaped out at the glass joints. As previously mentioned, it was
difficult to properly seal the extraction apparatus given the chemical makeup of the
engineered fluids. The Soxhlet apparatus was refilled through the opening at the top of the
condenser while extraction was continually carried out. This replenishing had no effect on
the final data collected given the use of pristine fluid. All of the contaminants extracted to
this point remained within the evaporation flask per the design of a Soxhlet extraction
apparatus.
Figure 16. Mass extracted and mass absorbed data for the first 5 days of extraction and
two week intervals up to 8 weeks.
The mass absorbed data on Day 42 is believed to be an outlier, since none of the
other data from any of the accelerated testing experiments suggest significant absorption
0.0%
2.0%
4.0%
6.0%
8.0%
10.0%
12.0%
0 1 2 3 4 5 6 7 8 9
Per
centa
ge
Days of Extraction
Mass Extracted
Mass Absorbed
14 28 42 56

44
by PVC. Ideally, to investigate the possible error, this instance would have been repeated
but given the substantial cost of such a prolonged experiment its significance was not
justified. The nearly exponential increase in the mass extracted was transport and
thermodynamically driven. Since there is a finite amount of DOP present in the PVC, there
cannot be a true exponential trend. Eventually the data would need to level off, however,
obtaining the long term data is problematic. Interestingly, 3M data indicates that forty-
eight hours is enough time to remove most of the extractables from elastomeric samples
approximately 1 mm in thickness [7]. It is difficult to corroborate their information since
larger amounts of component material were experimented on (around 4.34 g) and the
geometry of the (21) PVC tubing was not accounted for.
From hexane extraction, it was determined that the total amount of DOP within a
representative sample of (21) PVC tubing was around 36.4% which suggests that
approximately one-third of the total DOP was extracted in the first 56 days [13]. For
comparison, a 50% plasticizer content achieves sufficient flexibility for use in shower
curtains [11, 14]. It was also found that the amount of DOP extracted during a five day
exposure period depended upon the geometry of the PVC. Figure 17 shows the 14%
difference between a piece of PVC that was extracted unaltered (whole) and a piece that
was cut into smaller (ground) portions. It was believed that the amount of DOP extracted
in a given amount of time would increase with decreasing size of the PVC portions. It was
also reasonable to believe that the time for extraction would decrease with decreasing
sample size (or increasing specific surface area) due to the reduced diffusion path length,
assuming miscible materials. Although the geometry of the PVC played a significant factor
in the amount of DOP extracted from the sample with hexane, this was not the case for

45
Novec 649. Figure 17 shows that the mass extracted remained 0.8% regardless of the
geometry. This result is likely due to the low solubility of DOP in Novec 649, limiting the
driving force for diffusion.
Figure 17. Passive extraction of (21) PVC tubing via hexane and Novec 649.
The results of the four week (extended) Soxhlet extraction of (18) Tygon tubing,
(21) PVC tubing, (24) Nalgene tubing, and (39) Teflon wiring insulation were compared
to those of the standard five day extraction testing. These materials were chosen to provide
a range of polymers with different chemical makeup and different physical attributes
without having to conduct four week studies on all materials. For example, Tygon was
chosen for its likelihood to show high extraction and Teflon for its inertness. In addition,
PVC is widely used and the concentrations of DOP extracted are readily determinable.
Nalgene was chosen for its lower extraction. These extended extractions took place in all
three dielectric fluids. There were no noticeable visual differences in the materials
16.9%
30.9%
0.8% 0.8%
0.0%
5.0%
10.0%
15.0%
20.0%
25.0%
30.0%
35.0%
Whole Ground
Hexane
Novec 649

46
extracted in the extended runs compared to those extracted for five days. For example,
(18) Tygon tubing showed slight cloudiness on the end of the sample that was not
submerged in fluid, similar to that found during five day testing. All of the polymers did
appear to be more rigid and resistant to flexing, more so than that seen from the standard
five day extraction. Comparisons of mass extracted and mass absorbed were made with
the standard five day extraction data. These comparisons can be seen in Figure 18 and
Figure 19. Comparing the four week test data with that of the five day test data, it is
difficult to state any trends as most differences fall within the estimated error.
Figure 18. Comparison of mass extraction data from extended four week test and five
day test.
0.0%
5.0%
10.0%
15.0%
20.0%
25.0%
30.0%
Tygon
Tubing
PVC Tubing Nalgene
Tubing
Teflon
Wiring
Novec 649
Novec 649 (4 week)
HFE 7100
HFE 7100 (4 week)
FC 72
FC 72 (4 week)

47
Figure 19. Comparison of mass absorption data from extended four week test and five
day test.
4.1.3 Fluid Comparison
The experimental results from the Soxhlet extractions showed that materials
experienced significantly different interactions with the three dielectric fluids. For
example, (44) EPDM rubber tubing produced a residue that was bright yellow in color
upon extraction with HFE-7100. Figure 20 displays a comparison to other materials
undergoing extraction with HFE-7100 as well as (44) EPDM under extraction with FC-72.
The sample undergoing extraction with FC-72 shows a cloudy fluid within the round
bottom flask, consistent with extraction of other soft component materials, including other
EPDM materials. The results observed with (44) EPDM rubber tubing are consistent with
the prevailing trends observed. Typically, softer more pliable materials appear to contain
greater amounts of leachable components and tend to yield greater amounts of
contaminants in the collected residues, while physically harder materials tend to yield
significantly less contaminants.
0.0%
5.0%
10.0%
15.0%
20.0%
25.0%
30.0%
Tygon
Tubing
PVC Tubing Nalgene
Tubing
Teflon
Wiring
Novec 649
Novec 649 (4 week)
HFE 7100
HFE 7100 (4 week)
FC 72
FC 72 (4 week)

48
Figure 20. (44) EPDM rubber tubing undergoing extraction with HFE-7100 and FC-72.
Figure 21 displays the fluid residues of (26) latex rubber tubing after extraction in
all three fluids. The HFE-7100 sample shows greater turbidity than the other two fluid
samples - indicative of greater extraction. The masses extracted were determined to be
0.1%, 2.1%, and 0.1% for Novec 649, HFE-7100, and FC-72, respectively. Given Novec
649 and FC-72 have a similar physical structure, these results were in line with those
expected.
(44) EPDM Rubber
HFE-7100
(44) EPDM Rubber
FC-72

49
Figure 21. Fluid residues of (26) latex rubber tubing after extraction in Novec 649 (left),
HFE-7100 (center), and FC-72 (right).
In order to develop a better understanding of the interaction of the three fluids with
the various components, four benchmark polymeric materials were chosen for the ease of
comparison. Again, these materials included (18) Tygon tubing, (21) PVC tubing, (24)
Nalgene tubing, and (39) Teflon wiring insulation. It was expected that HFE-7100 would
show the greatest amount of extraction followed by Novec 649 and then FC-72 based upon
the KB values and physical structures of the fluids. This expected trend was not observed
in every case. Figure 22 and Figure 23 show the masses extracted and absorbed,
respectively. The values obtained for Teflon in the presence of the three fluids are a direct
result of the fluid structures. FC-72 has a chemical structure very similar to that of Teflon;
this facilitates fluid transport and increases solubility. Although FC-72 is often viewed as
inert and has a KB value of 0, it does maintain the ability to extract plasticizers given the
creation of a concentration gradient within the Soxhlet extraction apparatus. This in

50
conjunction with previous investigations of passive two-phase immersion cooling with FC-
72, suggests that some level of contamination is tolerable within high performance
computing applications.
Figure 22. Mass extracted of component materials in all three dielectric fluids.
Figure 23. Mass absorbed of component materials in all three dielectric fluids.
ATR-FTIR spectral matching was used to verify that the materials extracted with
FC-72 were the same as those extracted by Novec 649. Spectral matching cannot quantify
0.0%
5.0%
10.0%
15.0%
20.0%
25.0%
30.0%
35.0%
Tygon PVC Nalgene Teflon
Novec 649
HFE 7100
FC-72
0.0%
5.0%
10.0%
15.0%
20.0%
25.0%
30.0%
Tygon PVC Nalgene Teflon
Novec 649
HFE 7100
FC-72

51
the amounts of component present, but can provide the likelihood that a given compound
is present. As shown in Table 7, matching spectra from Novec 649 and FC-72 yielded
similar results as to which components were present. The dominant materials were
plasticizers or other additives. The presence of DOP plasticizer within Tygon and PVC
tubing was expected and the identification of poly(ethylene:propylene:diene) and
thermoplastic elastomer are believed to be the result of unbound monomer.
Table 7. Contaminant comparison of materials extracted with Novec 649 and FC-72.
Item # Item Contaminant Match %
Novec 649 FC-72
18 Tygon tubing Dioctyl Phthalate 57.28 91.63
20 EPDM Poly(Ethylene:Propylene:Diene) 94.55 90.33
20-1 EPDM Gasket Thermoplastic Elastomer 95.80 94.70
21 PVC Tubing Dioctyl Phthalate 86.13 93.31
24 Nalgene Tubing
Silopren E 3078 90.05 91.15
Silopren E 3096 89.93 89.88
Poly(Dimethyl Siloxane) 85.97 86.66
25 Natural Rubber Tubing Thermoplastic Elastomer 96.45 94.99
Some components were extracted in more than one fluid to develop a benchmark
against FC-72. Figure 24 and Figure 25 provide a comparison of the masses extracted and
absorbed for the components in the three fluids, respectively. A general trend that is further
substantiated from Figure 24 is the more pliable materials typically show greater extraction
percentages such as (18) Tygon tubing, (20) ethylene propylene diene monomer (EPDM),
(21) PVC tubing, and (23) silicon pump tubing. This can be attributed to the fact that these
polymers typically contain more plasticizer which is unbound and free to migrate out of

52
the polymer. (18) Tygon tubing is one of the more pliable materials under study and
showed the highest mass extracted, as expected.
Figure 24. Comparison of masses extracted in all three fluids.
0.0%
5.0%
10.0%
15.0%
20.0%
25.0%
Novec 649
HFE 7100
FC-72

53
Figure 25. Compilation of component mass absorbed in all three fluids.
4.1.4 Effects of Immersion on Components
In addition to the changes seen in the dielectric fluids after accelerated testing,
physical changes to the components themselves were sometimes also observed. Many
materials showed no obvious changes under optical microscopy, however, a few materials
showed changes that were very apparent to the naked eye. These changes were seen in the
polymeric materials with the greatest masses extracted and primarily after extraction with
HFE-7100. Figure 26 shows a comparison of (24) Nalgene after extraction with HFE-
7100; the portion of material that was submerged within the fluid shows a color change
compared with the material that was not submerged. Figure 26 also shows the physical
0.0%
5.0%
10.0%
15.0%
20.0%
25.0%
30.0%
Novec 649
HFE 7100
FC-72

54
change of (18) Tygon after extraction with HFE-7100. This material became very opaque
and exhibited a significant reduction in its pliability when compared to the original
material.
Figure 26. (24) Nalgene tubing (left) and (18) Tygon tubing (right) after extraction with
HFE-7100.
Another example of the macroscopic changes seen in the physical appearance of
component materials was identified after accelerated testing of (29-1) polyurethane tubing.
(29-1) Polyurethane tubing was used for fluid transport within a small scale tank testing
environment due to its low mass extraction and absorption figures. The initially acquired
sample of polyurethane was colored blue as shown in Figure 27. The tubing acquired for
fluid transport was instead clear. After extraction with all three dielectric fluids (Novec
649, HFE-7100, and FC-72), the sample exposed to Novec 649 exhibited a change in color.
Yellowing in polymers is typically indicative of a degradation reaction. Singh, et al. have
demonstrated yellowing within polyurethane coatings as a result of the formation of
chromophores such as quinones and stilbenequinones through photo-oxidation [38].
Figure 28 shows a comparison of the samples after extraction in all three fluids. It should
be noted that no color change was observed in the fluid, and based on pH measurements
Submerged Not Submerged After Extraction
Before Extraction

55
there were no indications of acid formation in Novec 649. ATR-FTIR was conducted on
all three sample residues. The results were similar to the sample that was initially obtained
for accelerated testing, (29) polyurethane tubing (blue). Since the yellowing was not
observed with the blue tubing, these results suggest that coloring agents may mask changes
taking place in the material. It is also possible that the blue tubing may have contained
additional stabilizers.
Figure 27. Originally acquired sample (29) polyurethane tubing (blue).
Figure 28. Sample comparison of (29-1) polyurethane tubing after extraction with all
three dielectric fluids and a non-extracted control.
Novec 649 HFE-7100 FC-72 Non-extracted

56
Thermal characterization was used as an additional means of exploring potential
degradation for selected materials. Figure 29 shows the DSC thermogram of (29-1)
polyurethane tubing after extraction with Novec 649 and HFE-7100 against a non-extracted
control. Figure 30 and Figure 31 show the linear integration of each run’s crystallization
peak and melting peak, respectively. There was no significant change in total heat of
crystallization or melting.
Figure 29. DSC thermogram of (29-1) polyurethane tubing after extraction with Novec
649 and HFE-7100.

57
Figure 30. Linear integration of (29-1) polyurethane crystallization peaks after extraction
with Novec 649 and HFE-7100.
Figure 31. Linear integration of (29-1) polyurethane melting peaks after extraction with
Novec 649 and HFE-7100.

58
Figure 32 shows the thermal degradation profile of a piece of (21) PVC tubing after
extraction with Novec 649 in comparison to that of a control. Examining the temperatures
at which 95% of the mass was lost does not reveal a significant change for the extracted
sample nor does a comparison of the total mass lost at 550°C. Similar results were found
for the (29-1) polyurethane tubing samples. Figure 33 displays a sectioned DSC
thermogram of a (24) Nalgene sample after extraction with all three fluids in comparison
to a non-extracted control. Nalgene is a proprietary polymer blend that contains low
density polyethylene, a semi-crystalline polymer. Some changes in the melting
temperature around -42°C and crystallization peak around -70°C were observed, however,
further research would need to be conducted to understand the significance and
reproducibility of these results.
Figure 32. Thermal degradation of (21) PVC after extraction with Novec 649.

59
Figure 33. DSC of (24) Nalgene after extraction with all three dielectric fluids.
Material degradation due to loss of plasticizers and other additives is less likely to
be a concern for immersion cooled HPC applications than applications where the
components are subjected to repeated spooling, bending or other handling; however, it is
possible that the changes noted above could result in a reduced life cycle. Additional
research focused on the materials and not the fluid would be needed to better evaluate this
potential issue. In the interim, the results above suggest that not only are materials with
low extractables less likely to impact fluid performance, they are less likely to deteriorate.

60
4.1.5 Identification of Contaminants
A combination of attenuated total reflectance Fourier transform infrared (ATR-
FTIR) spectroscopy, ultraviolet-visible spectroscopy (UV-Vis), and gas chromatography
mass spectrometry (GC/MS) were used to aid in identifying contaminants within
component residues. These methods were not intended to yield relative concentrations of
contaminants, but to identify the materials comprising the total mass extracted determined
in the mass balance. Although it is difficult to completely determine an unknown
composition with ATR-FTIR, background knowledge of the polymers and their typical
additives were used to determine the legitimacy of the suggested match results. When
possible, literature searches were used to specifically identify the primary chemical
compounds for ATR-FTIR spectra. However, in many cases extraction of multiple
components and small residual (sample) amounts made it difficult to acquire confidence in
the species matched.
Upon analysis of component residues, consistent match results were returned for
polymer additives - primarily plasticizers. Table 8 provides a representative list of species
matches to the contaminants found within the (21) PVC tubing residue after extraction with
Novec 649. The main contaminant detected was bis(2-ethylhexyl) phthalate, also known
as dioctyl phthalate (DOP). Three libraries confirmed its presence along with the greatest
probability match percent of 88.08%. Dibutyl, dioctyl, and diheptal phthalate, different
molecular weight analogs of the same material, were also found.

61
Table 8. ATR-FTIR match results for (21) PVC tubing residue after extraction with
Novec 649.
Match Compound name Library
88.08 Bis(2-ethylhexyl) phthalate HR Specta IR Demo 84.71 Tygon polymer R-1000 HR Nicolet Sampler Library 82.50 Dioctyl phthalate HR Nicolet Sampler Library 82.50 Dioctyl phthalate HR Nicolet Sampler Library 82.50 Dioctyl phthalate, 99% HR Aldrich Esters, Lactones, and Anhydrides 81.81 Tygon polymer B-44-4X HR Nicolet Sampler Library 79.31 Diheptyl phthalate, 97% HR Aldrich Esters, Lactones, and Anhydrides 78.58 Dibutyl phthalate HR Specta IR Demo 78.56 Hexanal, 98% HR Aldrich Aldehydes and Ketones 77.67 Alkyd resin Hummel Polymer Sample Library
Analyzing the residues of the individual components subjected to accelerated
testing via ATR-FTIR led to the creation of a list of probable contaminants expected to
leach from each component material. This list was useful in determining the source of
unknown contaminants such as those from the small scale tank testing. Initial analysis of
the Novec 649 and HFE-7100 tank test samples consistently returned high match
percentages to nonyl aldehyde via ATR-FTIR. In comparing this result with the list of
ATR-FTIR match data accumulated from accelerated testing, this contaminant was linked
to (0-3) PVC ribbon and (40) PVC wiring insulation. Samples of (0-3) PVC ribbon and
(40) PVC wiring insulation were again tested in all three fluids to develop confidence in
the initial Soxhlet extraction match data. (0-3) PVC ribbon showed a match to nonyl
aldehyde as well as trihexyl trimellitate, found to be another plasticizer.
In an effort to determine other potential sources of contaminant present within the
tank testing samples, attention was focused on the containers used for fluid transport and
storage – specifically the lining. Samples were collected from an FC-72 fluid container of

62
the opaque high density polyethylene (HDPE) cap/pour neck and the white Tri Sure seal
covering the cap (found on fluid drums), shown in Figure 34. The HDPE cap was extracted
with all three fluids and the Tri Sure seal was extracted with HFE-7100. Initially, ATR-
FTIR was attempted on the fluid samples collected. Due to the small amount of
contaminants present, ATR-FTIR did not register any peaks. To compensate, all samples
were allowed to evaporate and the remaining residues were analyzed. The HDPE cap
ATR-FTIR match results showed the greatest comparison to hexadecane in all three fluids.
The Tri Sure seal showed matches to nonyl aldehyde and bis(2-ethylhexyl) phthalate
(DOP). ATR-FTIR match results are provided in Table 9. Given these findings and after
discussions with the tank testing personnel, it is possible that the Tri Sure seal came into
contact with the tank test fluids. The nonyl aldehyde match shown from the ATR-FTIR
analysis of the tank test samples could have been the result of this contact or inadvertent
PVC contamination.
Although comparison of the results from the tank testing residues with the compiled
list of probable contaminants yielded a positive identification, it was determined that the
limits of ATR-FTIR (e.g., multiple contaminants present in the sample) might have not
have provided an accurate representation of all of the contaminant species present within
samples - both accelerated testing extraction residues and tank testing. ATR-FTIR worked
well to confirm trends and match contaminants that were expected to show after Soxhlet
extraction of a component material but an additional method was ultimately needed for
identification of the range of contaminants within the tank test samples. Gas
chromatography-mass spectrometry (GC/MS) was chosen for its ability to separate out
multiple contaminants as well as its potential to identify the individual species.

63
Figure 34. HDPE cap/pour neck (left) and Tri Sure seal (right).
Table 9. ATR-FTIR match results for Tri Sure seal.
Match Compound name Library
83.77 Nonyl aldehyde, 98% Aldrich Condensed Phase Sample Library
81.11 Nonyl aldehyde, 95% HR Aldrich Aldehydes and Ketones
80.48 Decyl aldehyde, 95% HR Aldrich Aldehydes and Ketones
80.18 Dodecyl aldehyde, 92% HR Aldrich Aldehydes and Ketones
78.66 Bis(2-ethylhexyl) phthalate HR Specta IR Demo
77.52 Alkyd resin Hummel Polymer Sample Library
77.28 Undecyclic aldehyde, 97% HR Aldrich Aldehydes and Ketones
77.17 Tygon polymer R-1000 HR Nicolet Sampler Library
76.60 Tridecanal, Tech., 90% HR Aldrich Aldehydes and Ketones
75.50 Octyl aldehyde, 99% HR Aldrich Aldehydes and Ketones
Initially, a concentrated HFE-7100 fluid sample that went through nineteen data
runs within the test tank was analyzed with GC/MS. This sample was produced by
Tri Sure
seal

64
allowing the HFE-7100 fluid to evaporate, leaving behind the contaminant residue. This
residue was dissolved within acetonitrile for injection. The spectrum yielded for this
sample can be seen in Figure 35. The spectrum clearly exhibits multiple peaks, indicative
of several compounds present. Analysis of the individual peaks with comparison to the
NIST/NIH/EPA Mass Spectral Library allowed for determination of the individual
components present. Table 10 provides these results along with the percent match provided
by the spectral library. Figure 35 also shows the comparison of the spectrum of the sample
at 24.73 minutes (red) with that of the spectrum known for DOP (blue).
Figure 35. GC/MS spectrum of HFE-7100 sample after 19 data runs.
reconstituted
Time5.00 10.00 15.00 20.00 25.00
%
0
100
Kelly_HFE_19_092313_3 TOF MS EI+ TIC
4.58e6
26.79
24.73
23.46
22.1321.09
18.69
26.09
27.39
(mainlib) Bis(2-ethylhexyl) phthalate
40 120 200 280 360
0
50
100
43
57
71
113
132
149
167
279
390
O O
O
O
Kelly_HFE_19_092313_3 635 (24.726) Cm (630:639-611:620x5.000) Bis(2-ethylhexyl) phthalate
40 60 80 100 120 140 160 180 200 220 240 260 280 300 320 340 360 380 400
0
50
100
50
100
41
43
50
57
70
7183
93
93
104
113
121
132
149
149
167
167
179
189 205 227 245 261
261
279
279
390
390
Unknown Residue
DOP Reference
Rel
ativ
e A
bu
nd
ance

65
Table 10. GC/MS identified compounds from an HFE-7100 sample after 9 tank test
thermal data runs.
Time Identified Compound Match %
18.69 9,10-Anthracenedione, dioxoanthracene 58.5
21.09 Phthalic acid, methyl neopentyl ester 48.0
22.13 Tributyl acetylcitrate 97.8
23.19 (Z)-9-Octadecenoic acid butyl ester 19.7
23.46 Hexanedioic acid, bis(2-ethylhexyl) ester 58.6
24.73 Bis(2-ethylhexyl) phthalate, dioctyl phthalate 61.9
26.09 Nonanedioic acid, bis(2-ethylhexyl) ester 62.6
26.79 1,3-Benzenedicarboxylic acid, bis(2-ethylhexyl) ester 94.0
27.39 Hexanedioic acid, bis[2-(2-butoxyethoxy)ethyl] ester 97.5
GC/MS analysis of the other tank test samples collected was conducted and a
comparison of the spectra showed consistent peaks independent of the fluid or amount of
data runs completed. Figure 36 shows a comparison of all of the tank test samples
analyzed. This result suggest that new contaminants were not introduced into the system
after the first sample was collected and that the previous contaminants remained through
serial testing.

66
Figure 36. GC/MS spectra comparison of tank test samples.
4.1.6 Other Analysis Methods
Other analysis methods such as pH, optical microscopy, CRAIC, and scanning
electron microscopy (SEM) were used to analyze the component materials and subsequent
residues from accelerated testing as necessary. It was determined that the pH of the
engineered fluids never changed (i.e., registered no pH) upon exposure to the component
materials or after Soxhlet extraction, except in one isolated case. A pH change was
registered after Novec 649 was exposed to water from the addition of activated carbon at
atmospheric conditions and an acid was produced. The potential reaction of Novec 649
with water to form trifluoroacetic acid is a known potential issue with Novec 649. The
acid produced after activated carbon addition resulted in the etching of some glassware.

67
Optical microscopy of the component materials before and after accelerated testing
did not reveal any significant changes to the microstructure of the materials. This type of
microscopy did prove useful in noticing the buildup of contaminant on the LTCC structures
during powered testing. In most cases, particulates did not appear in the component
residues except for within the residue of (25) natural rubber tubing after extraction with
Novec 649 and HFE-7100. Figure 37 shows the comparison of the two particulate
formations found. Within Novec 649, the solid contaminant appeared rod like and within
HFE-7100 it appeared granular.
Figure 37. Residues from extraction of (25) natural rubber in Novec 649 (left) and HFE-
7100 (right) and respective microscope images at 40x.
The use of the CRAIC UV-Vis-Fluorescent microscope was limited to the early
investigation of residue structure elucidation. The instrument provided valuable insights,
but was only capable of gathering data in transmission, so only transparent or translucent
samples could be analyzed. The addition of an attachment to enable reflectance
50 µm
50 µm

68
measurements would make the instrument much more versatile as it would enable looking
at deposits on the heat sinks, modules, and electrical contacts. Figure 38 shows the CRAIC
UV-Vis spectra of the residue spots for (20) EPDM after extraction with Novec 649. It
can be seen that analysis of multiple locations of the residue yielded a similar spectrum
allowing for the conclusion that a singular contaminant or that of multiple similar
contaminants were present. SEM was useful for examining the residues left behind on the
LTCC structures after inclusion in the accelerated testing apparatus. Energy dispersive
spectrometry (EDS) was used to analyze the chemical makeup of these residues (see 4.4
Combined Electrical and Thermal Compatibility Testing).
Figure 38. CRAIC UV-Vis spectra for a (20) EPDM residue after extraction with Novec
649.
The presence of multiple plasticizers within many materials prevented
quantification. The residue from (42) chlorinated polyethylene wiring insulation showed
similar condensing characteristics as that of (21) PVC tubing. Under the initial impression

69
that the contaminant was DOP, a sample was collected for UV-Vis analysis. The residue
was analyzed via ATR-FTIR and determined to be a combination of DOP and bis(2-
ethylhexyl) sebacate (DOS). The chemical structure of DOS, shown in Figure 39, does not
contain two independent electronic characteristics like that of DOP (i.e., conjugated ring
structure and non-bonding electrons). This meant the UV-Vis spectrum yielded only a
single peak. Given that the residue from (42) chlorinated polyethylene wiring insulation
contained both DOP and DOS, it was impossible to distinguish between the two without
two peaks present in each species’ individual spectrum. Two sets of peaks would have
allowed the solving of a system of equations for arrival at the individual concentrations
(i.e., two equations, two unknowns).
Figure 39. Chemical structure of bis(2-ethylhexyl) sebacate (DOS).
4.2 Laboratory Tests of Remediation Strategies
After subjecting the wide spectrum of proposed component materials to the
accelerated testing procedure, it became clear that the most likely contaminants were
plasticizers. The more pliable a material was, the more likely it was to leach contaminants
into the solvent. Thus, it is recommended that soft polymeric materials be avoided when
possible and more rigid structures chosen as replacements.

70
A remediation study was executed to determine the ability of removing additives
such as plasticizers from the dielectric fluids. Dioctyl phthalate (DOP) was chosen as the
model contaminant given its comprehensive use as a plasticizer. Activated carbon was
chosen as the remediation media given its well-known uses in the consumer market and
significant amount of surface area available for contaminant deposit. A Brunauer–
Emmett–Teller (BET) analysis of the activated carbon yielded a specific surface area SBET
of 858.1 ± 20.5 m2/g. SEM of the Fluval activated carbon shown in Figure 40 depicts the
significant amount of surface area available for adsorption of organic contaminants. HFE-
7100 was chosen as the initial solvent since 1) it has a KB value of 10 and 2) does not form
an acid upon addition of water. Extending this method to Novec 649 would require careful
drying of the carbon to make sure no moisture was introduced to the fluid.
Figure 40. SEM image of Fluval activated carbon.

71
A stock solution of DOP and HFE-7100 was created. Equal amounts of the stock
solution were distributed over varying masses of Fluval activated carbon. No consideration
was given to the differences in the sizes of the Fluval pieces – a potential source of error.
A sample was taken after twenty-four hours and the concentration of DOP determined via
solvation in hexane and examination via UV-Vis spectrometry. No agitation was provided
to the Fluval/HFE-7100/DOP vials except before sample collection. A slight swirling was
applied to the vials to help ensure a representative sample was collected.
As shown in Figure 41, the addition of the carbon resulted in a decrease in the
fluid’s DOP concentration. The connecting lines are provided to guide the reader’s eye.
Standard error bars are shown for both concentration and Fluval mass. This shows that the
carbon adsorbed the DOP as expected. Increased Fluval mass led to a decrease in DOP
concentration. The greatest source of error within this experiment was from the rapid
evaporation of the solvents used (i.e., HFE-7100 and hexane).
Given the apparent dependence DOP concentration has with time in the presence
of Fluval, it was decided to examine the concentration change of a DOP/HFE-7100 solution
after addition to a constant Fluval mass. 110 mL of a 0.231 g/L stock solution was added
to a constant 1 g of Fluval. 1 mL samples were taken every five minutes for the first two
hours and then at hour and day intervals thereafter. Figure 42 shows the data collected.
The final concentration determined, after four days of exposure, is not shown. The
concentration at this point was determined to be 0 g/L. The data is somewhat noisy. It is
believed that the high point at 20 minutes is from a contaminated (i.e., previously used)
cuvette, however, the other deviations are not readily explainable.

72
Figure 41. DOP concentration change via increasing adsorption onto activated carbon.
It is possible that during collection, samples were not taken from the same height within
the vial and thus concentration determination could have been affected by a developed
gradient within the experimental vial. In order to prevent this type of gradient forming, a
slight swirl was applied to the solution before collection. The data roughly follows a linear
trend (R2 = 0.84), but repeated experiments would need to be completed to confirm and
better quantify this relationship.
0.000
0.050
0.100
0.150
0.200
0.250
0.300
0.0
000
0.0
250
0.0
500
0.0
750
0.1
000
0.1
250
0.1
500
0.1
750
0.2
000
0.2
250
0.2
500
0.2
750
0.3
000
0.3
250
DO
P C
once
ntr
atio
n (
g/L
)
Mass of Fluval Activated Carbon (g)
24 Hours
48 Hours
72 Hours
96 Hours

73
Figure 42. DOP concentration change with time given a constant mass of Fluval.
Given that phthalate plasticizers are similar in structure to one another, and carbon
can adsorb a broad range of organic compounds, it is reasonable to assume this technique
would be applicable in most cases where additive leaching occurs from polymeric
components. In addition to the phthalate plasticizer studied, Fluval activated carbon was
added to a bright yellow residue collected from (44) EPDM rubber tubing (see 4.1.3 Fluid
Comparison) believed to be identified as thermoplastic elastomer (ATR-FTIR). After
twenty-four hours of exposure, the sample residue cleared up and the ATR-FTIR results
no longer showed the inclusion of thermoplastic elastomer in its match listings. Figure 43
shows the comparison of the sample residues before and after Fluval exposure.
0.000
0.050
0.100
0.150
0.200
0.250
0.300
0 25 50 75 100 125 150 175 200 225 250
DO
P C
once
ntr
atio
n (
g/L
)
Time (hours)

74
Figure 43. (44) EPDM rubber tubing residue before and after twenty-four hour exposure
to Fluval activated carbon.
4.3 Thermodynamic Relationships
The experimental results of this research, growing awareness of the plethora of
materials that could be used in immersion cooled HPC systems, and the differences in
composition and extractability for seemingly similar materials such as EPDM highlight the
need for choosing materials based on more than empirical results. Thermodynamic
solubility of the additives in the polymers and in the fluids dictates the level of
extractability that can be expected. The Kauri Butanol value has been used by 3M
personnel as an indication of dielectric fluid solvent power [7]. However, the empirical
basis of the KB value makes its applicability to dielectric fluids for immersion cooling
questionable. Also, the data presented here highlights a discrepancy in the KB values of
Novec 649 and FC-72. Both Novec 649 and FC-72 have been assigned KB values of zero
but the data has shown in a number of cases the fluids extracted different amounts of
materials from polymeric components. This further highlights the limited applicability of
the KB value for this application. It would seem reasonable to refer to a solubility

75
parameter more widely studied such as the Hildebrand parameter or Hansen solubility
parameters (HSP).
The widespread use of Hildebrand and HSP makes their identification for
component species easily determinable via literature searches. Table 4 lists the KB and
HSP values for several species encountered during accelerated testing. Following the
general rule of “like dissolves like”, those species with the most similar HSP would be
most miscible. The values for the engineered fluids were predicted via several group
contribution methods including the ThermoData Engine found in the ASPEN Plus software
suite and the HSP group contribution method. The HSP group contribution method
assumed first-order contributions. Two schemes were implemented for the molecular
breakdown of HFE-7100. The first separated the methoxy group into its component
oxygen and methyl groups and the second utilized them grouped. The two schemes used
are illustrated in Figure 44 and the predicted solubility parameters are shown in Table 11.
Surprisingly, this method did result in significant differences in HSP. Additional research
using higher order interaction terms could provide new insights. Obtaining a more
meaningful thermodynamic analysis that results in agreement between theory and
observation would enable more rational material selection and provide information on
specific preferred (or to be avoided) additives.

76
Table 11. Solubility parameters [27-29, 39].
Solubility Parameter
Type Species KB
Value
Hansen
(MPa)1/2
Engineered
Fluids
Novec 649 0 12.53
HFE-7100 10 13.67
FC-72 0 12.52
Plasticizers
Diethyl phthalate 20.55
Dioctyl phthalate (DOP) 19.21
Di-n-butyl phthalate 20.19
Dioctyl sebacate (DOS) 17.47
Dibutyl sebacate 15.17
Triisooctyl Trimellitate 17.83
Polymers
Poly(vinyl chloride) 60 19.55
Polypropylene 18.10
Polyethylene (linear) 16.26
Poly(methyl methacrylate) 21.52
Solvents
n-Hexane 29-30 14.90
Acetonitrile 24.42
Water 6.5 47.82
Figure 44. Group contribution breakdown of the two methods used for HFE-7100 HSP
calculation.
Method 1:
Method 2:

77
Table 12. HSP via group contribution and ASPEN Plus prediction.
Fluid Group Contribution
(MPa)0.5
Aspen Predicted
(MPa)0.5 % Difference
Novec 649 20.07 12.53 60.3%
HFE-7100 (1) 12.33 13.67
9.9%
HFE-7100 (2) 12.05 11.9%
FC-72 8.31 12.52 33.6%
4.4 Combined Electrical and Thermal Compatibility Testing
Given the presence of electric fields within immersion cooling applications, an
attempt was made to examine the effect its presence may have on the interaction of
component materials and the dielectric fluids. A 5 V direct current (DC) was applied to a
DuPont 9K7 LTCC and Si substrate with Asahi AL-X thin films forming various distances
of open structures (0.125, 0.5, and 1.0 mm). Figure 45 shows a representative structure
used during testing. Testing was completed in all three fluids with several component
materials under extraction: (18) Tygon tubing, (21) PVC tubing, (24) Nalgene tubing, (20)
EPDM, (25) natural rubber, and (39) Teflon wiring insulation. These materials, except
Teflon, were chosen due to their previously well characterized ability to leach contaminants
during accelerated testing. Testing was completed with the powered structures located
within the extractor thimble and within the round bottom flask.
Figure 45. Gap structure used in powered Soxhlet testing.

78
4.4.1 Powered Structures in Soxhlet Thimbles
A powered, open gap structure was placed alongside the component material within
the Soxhlet thimble. Initially, several gap sizes were explored to look for potential effects
the leachable species may have on the powered structures. Figure 46 shows a typical
placement of the gap within the Soxhlet apparatus.
Figure 46. Powered gap structures placed within thimble of Soxhlet extractors next to
component materials during accelerated testing.
After initial extraction of the component materials in the presence of a powered gap
structure, discoloration and possible deposition was noticed on a few of the gaps placed
within the thimbles. In order to determine the source of this buildup and whether or not it
was a concern, the materials were gold coated and both SEM and EDS were performed.
Example optical microcopy images are shown in Figure 47. SEM images and EDS spectra
are shown in Figure 48 and Figure 49, respectively. The EDS results were not conclusive.

79
The detected silver was from the coating and the other elements could have come from the
device itself or incidental contamination. In addition, DOP could have been the cause of
the oxygen peak but oxygen is a very common contaminant in EDS measurements.
Figure 47. Optical microscopy images of powered gap structures after Soxhlet extraction
of (21) PVC in Novec 649.
Soldered ceramic board from PVC-Novec 649 powered (10X)
Soldered ceramic board from PVC-Novec 649 powered (40X)
Soldered ceramic board from EPDM-Novec 649 powered (10X and 40X)
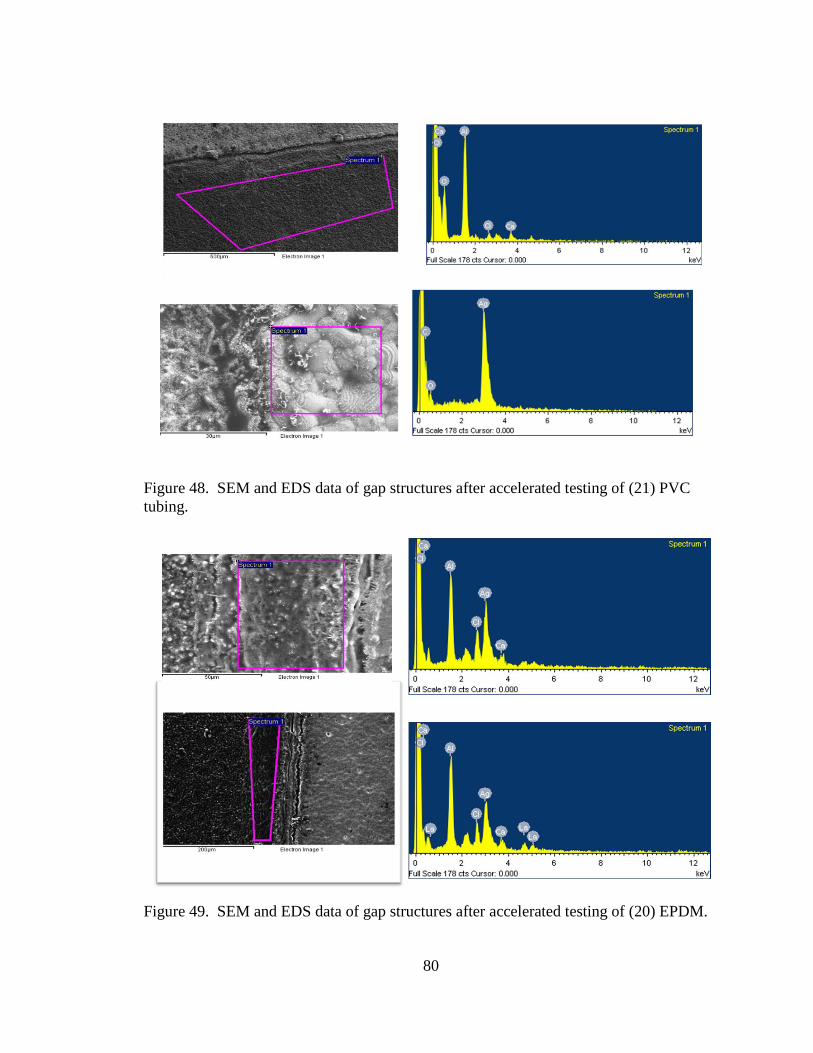
80
Figure 48. SEM and EDS data of gap structures after accelerated testing of (21) PVC
tubing.
Figure 49. SEM and EDS data of gap structures after accelerated testing of (20) EPDM.

81
In addition to any effects observed on the gap structures themselves, mass balances
were conducted on the component materials to look for changes compared to the standard
Soxhlet extraction data. Figure 50 and Figure 51 show the mass extracted and mass
absorbed figures for the varying gap sizes, respectively. Most of the masses extracted for
the powered runs remained below their respective non-powered counterparts, but the data
was not statistically significant due the lack of additional repeated experimental data and
the variances of masses of (21) PVC tubing chosen for testing. However, given that all of
the mass extracted data for (21) PVC was below 5.0% and the predicted maximum amount
of plasticizer present was 36.4%, it is reasonable to conclude that the powered structures
did not yield a result worth concern for adoption within cooling applications. The missing
mass extracted data for (21) PVC tubing is a result of an experimental mishap. This
instance was not repeated given the complexity of setup and expense of materials. The
mass extracted data for (39) Teflon wiring insulation was 0.0%.
Figure 50. Mass extracted percentages for materials exposed to powered gap structures
during extraction with Novec 649.
0.0%
2.0%
4.0%
6.0%
8.0%
10.0%
12.0%
0.125 0.5 1.0 Non-Powered
Mas
s E
xtr
acte
d
Gap Size (mm)
21 PVC Tubing
24 Nalgene Tubing
25 Natural Rubber
39 Teflon Wiring

82
Figure 51. Mass absorbed percentages for materials exposed to powered gap structures
during extraction with Novec 649.
After exploring the various gap sizes within Novec 649, a common size of 0.5 mm
was settled upon for testing in the other two engineered fluids. At this width and applied
voltage, a field of 10 kV/mm was created. A comparison of the masses extracted and
absorbed for runs with a 0.5 mm gap present and without are provided in Figure 51 and
Figure 52. Again, it is difficult to note specific trends in the data. The HFE-7100 mass
extracted value for (39) Teflon wiring is believed to be the result of an experimental error
given that the chemical structure similarities between Teflon and the fluids should result in
swelling (absorption) rather than extraction. Most of the masses extracted for components
in the presence of the gap structures are within error of the non-powered data. In addition,
the masses extracted in all three fluids appear within error of each other for (21) PVC
tubing, (24) Nalgene tubing, and (25) natural rubber leading to the conclusion that the
powered structures had no obvious effect on the accelerated testing of the materials
themselves.
0.0%
1.0%
2.0%
3.0%
4.0%
5.0%
6.0%
7.0%
8.0%
9.0%
0.125 0.5 1.0 Non-Powered
Mas
s A
bso
rbed
Gap Size (mm)
21 PVC Tubing24 Nalgene Tubing25 Natural Rubber39 Teflon Wiring

83
Figure 52. Materials extracted with Novec 649, HFE-7100, and FC-72 in the presence of
a 5V powered 0.5 mm gap strucutre placed in the Soxhlet thimble.
Figure 53. Materials extracted with Novec 649, HFE-7100, and FC-72 in the presence of
a 5V powered 0.5 mm gap structures placed in the Soxhlet thimble.
0.0%
2.0%
4.0%
6.0%
8.0%
10.0%
12.0%
14.0%
16.0%
PVC Tubing Nalgene
Tubing
EPDM Natural
Rubber (Red)
Teflon Wiring
Mas
s E
xtr
acte
d
Novec 649 (0.5 mm Gap)
Novec 649 (non-powered)
HFE 7100 (0.5 mm Gap)
HFE 7100 (non-powered)
FC-72 (0.5 mm Gap)
FC-72 (non-powered)
0.0%
5.0%
10.0%
15.0%
20.0%
25.0%
30.0%
PVC Tubing Nalgene
Tubing
EPDM Natural Rubber
(Red)
Teflon Wiring
Mas
s A
bso
rbed
Novec 649 (0.5 mm Gap)
Novec 649 (non-powered)
HFE 7100 (0.5 mm Gap)
HFE 7100 (non-powered)
FC-72 (0.5 mm Gap)
FC-72 (non-powered)

84
4.4.2 Powered Structures in Round Bottom Flasks
It was determined during powered testing with gap placement inside of the
extraction thimble that since only the distilled fluid reaches the thimble, the contaminants
(i.e., leachable species) were not coming in contact with the gap structure itself. It was
decided that placing the gap within the round bottom flask (RBF) may yield a more realistic
simulation as the amount of contaminant built up during the extraction period. New
glassware was designed for this purpose and the tests were rerun with all three dielectric
fluids. Figure 54 shows the modified extraction setup.
Figure 54. Powered gap structures placed within the round bottom flask of Soxhlet
extractors during accelerated testing.
Even with the increase in contaminant concentration around the powered gap
structures, completion of the circuit was not discovered in any of the runs. Mass balances
did not show any unique results. Comparisons were made between the masses extracted

85
and absorbed where the powered structure was present in the thimble and when the
structure was absent. Figure 55 and Figure 56 show these comparisons within HFE-7100.
Again, most of the data falls within the estimation of error.
Figure 55. Mass extracted figures for materials extracted with HFE-7100 in the presence
of a powered gap and without.
Figure 56. Mass extracted figures for materials extracted with HFE-7100 in the presence
of a powered gap and without.
0.0%
1.0%
2.0%
3.0%
4.0%
5.0%
6.0%
7.0%
8.0%
PVC Tubing Nalgene Tubing EPDM Natural Rubber
(Red)
Mas
s E
xtr
acte
d
Powered (0.5 mm Gap)
Non-Powered
Powered RBF (0.5 mm Gap)
0.0%
5.0%
10.0%
15.0%
20.0%
25.0%
30.0%
PVC Tubing Nalgene Tubing EPDM Natural Rubber
(Red)
Mas
s A
bso
rbed
Powered (0.5 mm Gap)
Non-Powered
Powered RBF (0.5 mm Gap)

86
Microscope images were taken of the gap structures from the RBF powered runs.
Buildup of contaminant on the gap structure was discovered as well as between the gap
itself. Figure 57 shows the presence of DOP from a (18) Tygon sample after extraction
with FC-72 and a (21) PVC sample after extraction with Novec 649. ATR-FTIR confirmed
the presence of DOP on these structures. Similar results were observed for the gap
structures from (20) EPDM after extraction with HFE-7100 and Novec 649, (21) PVC
tubing after extraction with HFE-7100 and Novec 649, and (25) natural rubber after
extraction with FC-72. Although residue was discovered on some of the structures, others
were clean. Figure 58 shows the gap without contaminants for (24) Nalgene after
extraction with FC-72 and an unused thru structure.
Figure 57. Gap structures at 20x after extraction within the round bottom flasks of (18)
Tygon in FC72 (left) and (21) PVC in Novec 649.
250 µm

87
Figure 58. An unused thru structure (left) and (24) Nalgene after extraction with FC72
(right).
4.5 Small Scale Tank Testing Using Contaminated Dielectric Fluid
A small scale system test was conducted using Novec 649 after deliberate
contamination with DOP. It was found that the provided tank test sample of HFE-7100
after nineteen data runs exhibited a total contaminant concentration of 0.161 g/L HFE or
0.011 wt% contaminants and a sample of Novec 649 after twenty-two data runs exhibited
a contaminant concentration of 0.129 g/L or 0.008 wt% contaminants. The amount of DOP
added to the dielectric fluid was estimated to about three times higher than the highest
amount of contamination observed in Soxhlet extraction. This value was used to estimate
a worst case scenario concentration, and 30 mL of DOP were added to 8L of Novec 649
yielding a concentration of 3.70 g/L or 0.23 wt% contaminants. DOP was chosen as the
contaminant due to its common use as a plasticizer and the extensive characterization
within the other aspects of this work. Testing was completed with the contaminated Novec
649 and comparisons in the performance figures made with those from virgin Novec 649.
A significant deterioration in performance was observed in which a noticeable increase in
250 µm

88
wall superheat varied with increasing heat flux (Sushil Bhavnani, personal communication,
November 12, 2013).
The tank test experimental data runs were completed with microporous heat sinks.
These heat sinks were chosen due to their very small surface morphology which would
make them most susceptible to changes introduced by the contaminated fluid. It was found
that the highly contaminated fluid severely impacted the cooling performance initially
provided from clean fluid. It is believed that the deposition of DOP on all surfaces of the
small tank, including the printed circuit board and heat sinks, led to interaction with the
nucleation sites on the microporous heaters.
In order to demonstrate the ability to successfully remove DOP from the
contaminated fluid, 15.35 g of dried activated carbon (Fluval) was added to the two
containers shown in Figure 59 and allowed to passively remove DOP for twenty-four
hours. Due to space limitations, the amount of carbon used was much less than would be
needed for complete removal based on the laboratory scale remediation testing. In real
immersion systems, flow through filters could be used or the computing blades could be
designed to hold a reasonable amount of material for passive filtration.
The carbon was vacuum dried prior to use and care was taken to prevent moisture
absorption before immersion. The activated carbon was allowed to rest inside the tank
with contaminated fluid overnight. Fluid samples were collected before and after the run.
The limited amount of carbon used still resulted in removal of 6.93 g (7.03 mL) of DOP.
The thermal performance after passive filtration was found to be slightly better than it was
before the carbon was introduced (Sushil Bhavnani, personal communication, November
12, 2013). Additional carbon or active filtration would have likely resulted in a more

89
significant change in performance. The pH of the testing fluid was measured at several
intervals during testing to ensure that the dielectric properties of the fluid were not altered.
No changes were found.
Figure 59. Satchels containing Fluval activated carbon.

90
Chapter 5
Conclusions and Recommendations
Broad analysis of component material compatibility with three engineered
dielectric fluids was conducted. Materials that exhibited greater pliability tended to yield
greater amounts of contaminant residues during extraction. These contaminants were
linked to polymeric additives such as plasticizers. Generally, more rigid component
materials contained fewer plasticizers and showed decreased extraction. It was found that
extended material extraction showed increased contaminant elution, beyond the
standardized five day testing cycle, but not near the total determined additives of PVC.
No significant effects were seen on the powered structures in the presence of fluid
contaminated during accelerated testing, whether near the component material or within
the pool of contaminant collection (RBF). Organic contaminants such as plasticizers were
shown to be removable via passive introduction of consumer grade activated carbon within
a contaminated dielectric fluid. Finally, examination of fluid samples provided from tank
testing showed reoccurring contaminants (primarily plasticizers) in both fluid systems,
Novec 649 and HFE-7100. Intentionally high levels of contamination did show some
changes in thermal properties, most likely due to contaminants at the surface affecting
nucleation.
This work has provided a systematic approach to characterizing the interaction of
component materials with engineered fluids. It has highlighted the range of possible

91
materials that could be used in two-phase immersion cooling applications, and that even
the same type of materials (e.g., EPDM) can have significantly different types and amounts
of leachable components. Therefore a more theoretical approach is needed to replace large
scale experimental testing. Additional research to obtain refined solubility parameters
would provide a sound thermodynamic basis for selecting materials (both specific material
types and additives contained in specific products) would enable more judicious material
selection. The results of this work have also shown that real world effects of polymer
degradation and decreased pliability on long term component durability should be
investigated.
While additional research is needed for detailed design guidelines and lifetime
predictions, the results of this work suggest the following design guidelines for passive
two-phase immersion cooling in dielectric fluids:
Soxhlet testing can be used to screen potential materials for significant leaching.
Novec 649 is preferred over HFE-7100 for its improved thermal and dielectric
properties, as well as its lower tendency to extract materials from immersed
components.
Engineered fluid contact with polymeric materials should be minimized.
Component materials should be chosen that are known to be inert but similarity to
the fluid must also be considered. Although polytetrafluoroethylene (PTFE) is
highly non-reactive, it exhibits a tendency to swell in the presence of the engineered
fluids.

92
Polymeric materials coming in contact with the engineered fluids should be rigid
and less pliable when possible, or polymeric materials designed to have low
leachability should be used.
Material suppliers should be contacted to obtain low extractable/more chemically
inert formulations for transfer tubing, wiring insulation, gaskets, etc.
Passive or active removal of contamination with high surface area material such as
activated carbon should be considered if high levels of fluid contamination are
anticipated.
Due to the potential for acid formation, caution should be used to ensure water is
not introduced into Novec 649, however, ambient moisture during fluid handling
did not present a concern.
The engineered fluids can readily absorb into and diffuse through Teflon due to
their chemical similarity, however, Teflon wire insulation appears to be acceptable
for use. Teflon has the advantage of limited leaching into the engineered fluids.

93
References
1. Saidur, R., K.Y. Leong, and H.A. Mohammad, A review on applications and
challenges of nanofluids. Renewable and Sustainable Energy Reviews, 2011.
15(3): p. 1646-1668.
2. Kandlikar, S.G., High flux heat removal with microchannels—a roadmap of
challenges and opportunities. Heat Transfer Engineering, 2005. 26(8): p. 5-14.
3. Wen, D., et al., Review of nanofluids for heat transfer applications. Particuology,
2009. 7(2): p. 141-150.
4. 3M, 3M Novec 649 Engineered Fluid, in Product Information. 2009, Electronics
Markets Materials Division
5. 3M, 3M Novec 7100 Engineered Fluid, in Product Information. 2009, Electronics
Markets Materials Division.
6. 3M, 3M Fluorinert Electronic Liquid FC-72, in Product Information. 2000,
Specialty Materials.
7. Tuma, P.E. Design considerations relating to non-thermal aspects of passive 2-
phase immersion cooling. in Semiconductor Thermal Measurement and
Management Symposium (SEMI-THERM), 2011 27th Annual IEEE. 2011.
8. Cray Jr, S.R., Immersion cooled high density electronic assembly, 1986, Google
Patents.
9. ASTM, Standard Test Method for Dielectric Breakdown Voltage and Dielectric
Strength of Solid Electrical Insulation Materials at Commerical Powere
Frequencies, 2013, ASTM International: West Conshohocken, PA.
10. Leão, F.N. and I.R. Pashby, A review on the use of environmentally-friendly
dielectric fluids in electrical discharge machining. Journal of Materials
Processing Technology, 2004. 149(1–3): p. 341-346.
11. Barnes, C.M. and P.E. Tuma, Practical considerations relating to immersion
cooling of power electronics in traction systems. Power Electronics, IEEE
Transactions on, 2010. 25(9): p. 2478-2485.

94
12. Luque de Castro, M.D. and L.E. Garcı́a-Ayuso, Soxhlet extraction of solid
materials: an outdated technique with a promising innovative future. Analytica
Chimica Acta, 1998. 369(1–2): p. 1-10.
13. HallStar, Monomeric Plasticizers for Flexibile PVC.
14. Stevens, M.P., Polymer additives: Part I. Mechanical property modifiers. Journal
of Chemical Education, 1993. 70(6): p. 444.
15. Stevens, M.P., Polymer additives: II. Chemical and aesthetic property modifiers.
Journal of Chemical Education, 1993. 70(7): p. 535.
16. Murphy, J., Additives for plastics handbook. 2001: Elsevier.
17. Rahman, M. and C.S. Brazel, The plasticizer market: an assessment of traditional
plasticizers and research trends to meet new challenges. Progress in Polymer
Science, 2004. 29(12): p. 1223-1248.
18. Wypych, A., Plasticizers Databook. 2013: Elsevier.
19. Phthalate Information Center. 2013 [cited 2013 December 18]; Available from:
http://phthalates.americanchemistry.com/.
20. Shah, B.L. and V.V. Shertukde, Effect of plasticizers on mechanical, electrical,
permanence, and thermal properties of poly(vinyl chloride). Journal of applied
polymer science, 2003. 90(12): p. 3278-3284.
21. Vahdat, N. and V.D. Sullivan, Estimation of permeation rate of chemicals
through elastometric materials. Journal of applied polymer science, 2001. 79(7):
p. 1265-1272.
22. Tüzüm Demir, A.P. and S. Ulutan, Migration of phthalate and non-phthalate
plasticizers out of plasticized PVC films into air. Journal of applied polymer
science, 2013. 128(3): p. 1948-1961.
23. Hedenqvist, M. and U.W. Gedde, Diffusion of small-molecule penetrants in
semicrystalline polymers. Progress in Polymer Science, 1996. 21(2): p. 299-333.
24. ASTM, Standard Test Method for Kauri-Butanol Value of Hydrocarbon Solvents,
2013, ASTM International: West Conshohocken, PA.
25. Rodriguez, F., Principles of polymer systems. Vol. 4. 1996: Taylor & Francis New
York.
26. Hildebrand, J.H. and R.L. Scott, The solubility of nonelectrolytes. 1955.

95
27. Hansen, C.M., Hansen solubility parameters: a user's handbook. 2007: CRC
press.
28. Diky, V., et al., ThermoData Engine (TDE): Software implementation of the
dynamic data evaluation concept. 2. Equations of state on demand and dynamic
updates over the web. Journal of chemical information and modeling, 2007. 47(4):
p. 1713-1725.
29. Frenkel, M., et al., ThermoData Engine (TDE): software implementation of the
dynamic data evaluation concept. Journal of chemical information and modeling,
2005. 45(4): p. 816-838.
30. Pfeiffenberger, A., Dielectric Permittivity Measurements of Electronics Cooling
Fluids. 2013.
31. Ramakrishnan, B., Bhavnani, S. H., Gess, J., Knight, R. W., Harris, D. K., and
Johnson, R. W., Effect of System and Operational Parameters on the
Performance of an Immersion-Cooled Multichip Module for High Performance
Computing (Accepted), in 30th Annual Thermal Measurement, Modeling, and
Management Symposium. 2014, SemiTherm: San Jose, CA.
32. Owen, A., Fundamentals of UV-visible spectroscopy. 1996.
33. Settle, F.A., Handbook of instrumental techniques for analytical chemistry. 1997:
Prentice Hall PTR.
34. Smith, B.C., Fundamentals of Fourier transform infrared spectroscopy. 2011:
CRC press.
35. Suzuki, H., Electronic absorption spectra and geometry of organic molecules: An
application of molecular orbital theory. 1967: Elsevier.
36. Griffiths, P. and J.A. De Haseth, Fourier transform infrared spectrometry. Vol.
171. 2007: John Wiley & Sons.
37. Feldman, D., Polymer Barrier Films. Journal of Polymers and the Environment,
2001. 9(2): p. 49-55.
38. Singh, R.P., N.S. Tomer, and S.V. Bhadraiah, Photo-oxidation studies on
polyurethane coating: effect of additives on yellowing of polyurethane. Polymer
degradation and stability, 2001. 73(3): p. 443-446.
39. Barton, A.F.M., Solubility parameters. Chemical Reviews, 1975. 75(6): p. 731-
753.

96
Appendix A – Materials Included in Screening Study
Printed Wiring Boards (PWBs):
1) Megtron6 laminate - no solder mask (from EI)
2) Megtron6 circuit board (scrap Mezz card from EI)
3) KPPE-6053 (from EI)
4) LTCC (9K7 and external metallization) (from UArk)
5) Si + Al-X (from Auburn)
6) Other materials being considered by EI
Packaging materials:
7) Namics U8437-2 underfill
8) Copper
9) Solder alloys (Sn/Pb and SAC 305)
10) Memory module molding compound slug (from ISI)
11) Samsung memory package
12) Micron memory package
Connectors:
13) XCede connector
14) SEARAY connector
15) NeoScale connector
16) Ribbon connector
Optical Modules:
17) Avago

97
Common materials for fluid containment and transfer:
18) Tygon O-ring
19) Kalrez O-ring
20) Ethylene Propylene Diene Monomer (EPDM) gasket (McMaster and
Grainger)
20-1) Ethylene Propylene Diene Monomer (EPDM) sheet
21) Polyvinyl chloride (PVC) tubing
22) Polyethylene (PE) tubing
23) Typical Silicone Pump Tubing
24) Nalgene® 50 Platinum-Cured Silicone Tubing (Phthalate Free)
25) “Natural” Rubber tubing (Red and Black)
26) Latex Rubber Tubing
27) Latex Tubing (White and Black)
28) PFA Tubing (Fluropolymer)
29) Polyurethane Tubing (blue)
29-1) Polyurethane Tubing (clear)
30) Glass tubing
31) Lexan (polycarbonate)
32) Plexiglas (polymethyl methacrylate (PMMA))
33) Quartz
Greases & Sealants:
34) Shin Etsu Thermal Grease G-751
35) TSF-6521C No-Clean Tacky Soldering Flux
36) Vacuum Grease
37) Loctite Polyurethane
38) Cured DURALCO 4538
Wiring with insulation made of:
39) Teflon
40) PVC
41) Nylon
42) Chlorinated Polyethylene
43) Fluorinated Ethylene Propylene (high flexibility)
44) EPDM Rubber Tubing


![Passive Components [Compatibility Mode]](https://static.fdocuments.net/doc/165x107/577cc0be1a28aba71190f111/passive-components-compatibility-mode.jpg)