
Mastersizer S, Mastersizer 2000 and Mastersizer 3000 ... · ›A particle can be described as a...
65
Mastersizer S, Mastersizer 2000 and Mastersizer 3000: Method transfer – how to get the same results on all three systems
Transcript of Mastersizer S, Mastersizer 2000 and Mastersizer 3000 ... · ›A particle can be described as a...

Mastersizer S, Mastersizer 2000 and Mastersizer 3000:Method transfer – how to get the same results on all three systems

Overview
› Introduction to particle sizing› Introduction to laser diffraction› Evolution of laser diffraction systems› Method transfer
Dispersion Analysis
› Case studies
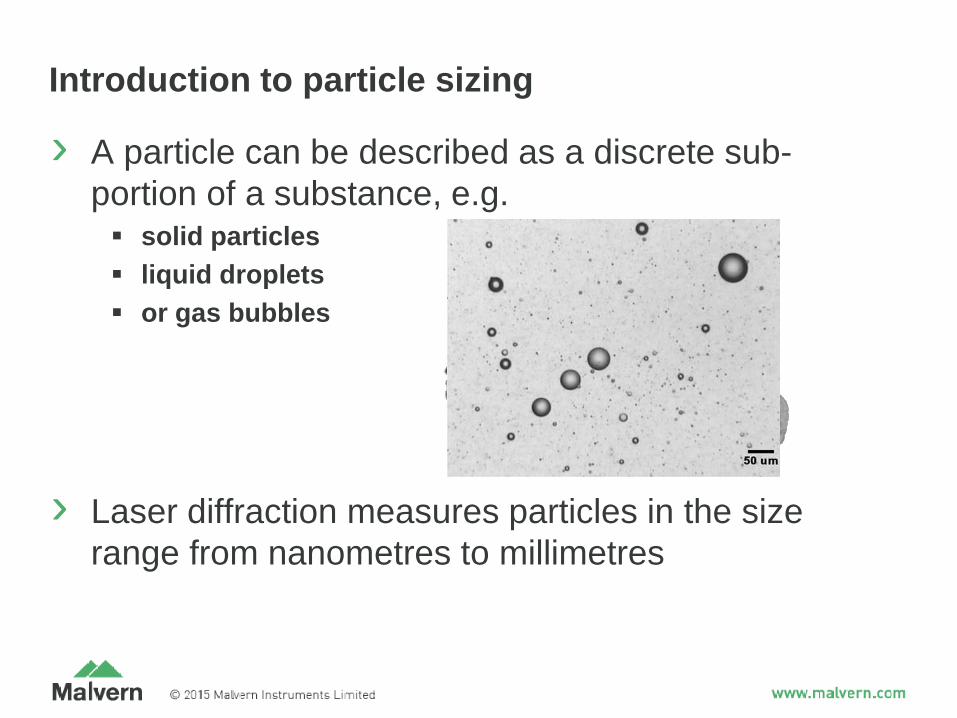
Introduction to particle sizing
› A particle can be described as a discrete sub-portion of a substance, e.g. solid particles liquid droplets or gas bubbles
› Laser diffraction measures particles in the size range from nanometres to millimetres

How do we describe the size of particles
› Equivalent spheres Maximum length Minimum length
Max. length
Min. length
Max. lengthMin. length

How do we describe the size of particles
› Equivalent spheres Maximum length Minimum length Sedimentation rate
Max. lengthMin. length
Sedimentation rate
Sedimentation rate

How do we describe the size of particles
› Equivalent spheres Maximum length Minimum length Sedimentation rate Sieve aperture
Max. lengthMin. length Sedimentation rate
Sieve aperture
Sieve aperture

How do we describe the size of particles
› Equivalent spheres Maximum length Minimum length Sedimentation rate Sieve aperture Surface area
Max. lengthMin. length Sedimentation rate Sieve aperture
Surface area
Surface area

How do we describe the size of particles
› Equivalent spheres Maximum length Minimum length Sedimentation rate Sieve aperture Surface area Volume
Max. lengthMin. length Sedimentation rate Sieve aperture
Surface area
Volume

Size classes / m
0.01 0.1 1 10 100 1000 10000
Volu
me
dens
ity /
%
0
2
4
6
8
10
The particle size distribution
› Laser diffraction measurements produce volume based particle size distributions
INTRODUCTION TO LASER DIFFRACTION

The diffraction pattern

Dependence of diffraction pattern on particle size
Dr Kevin Powers, PERC, University of Florida5 microns 800 nanometres
Incident lightSmall angle scattering
Incident light Large angle scattering

Scattering models: Mie Theory
› Models the interaction of light with matter Assuming that the particles are spherical Assuming that it is a two phase system
› Valid for all wavelengths of light and all particle sizes› Predicts the dependence of scattering intensity on
particle size› Predicts that secondary scattering is observed for small
particles
‘For particles smaller than about 50μm Mie theory offers the best general solution’
ISO13320
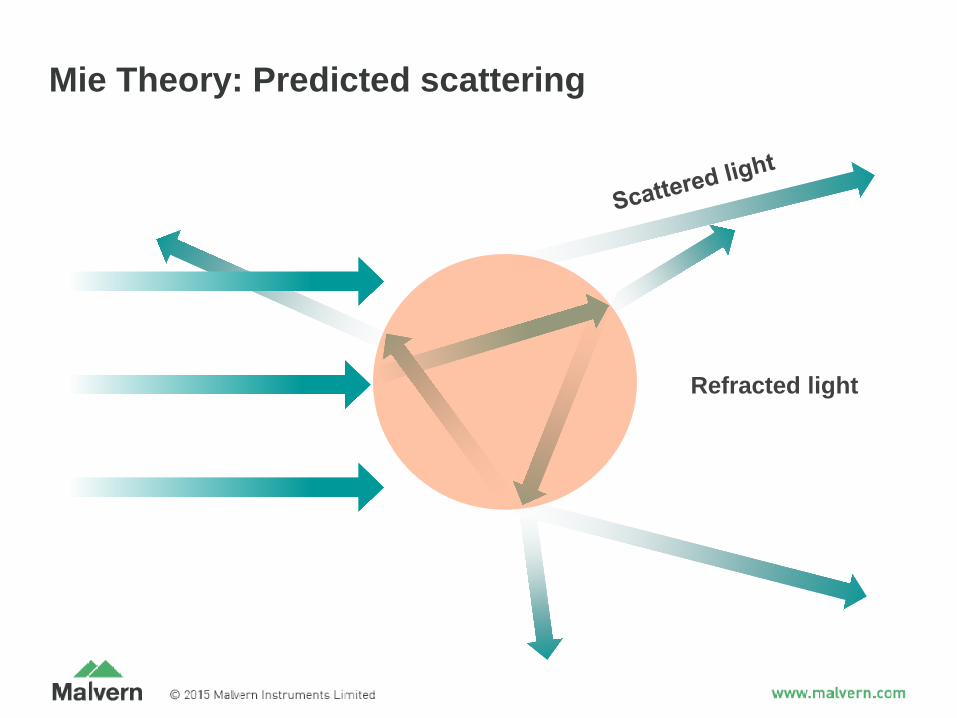
Mie Theory: Predicted scattering
Refracted light

Mie Theory: Optical properties
Absorption
“….. the Mie theory offers the best general solution.”
ISO 13320: 2009
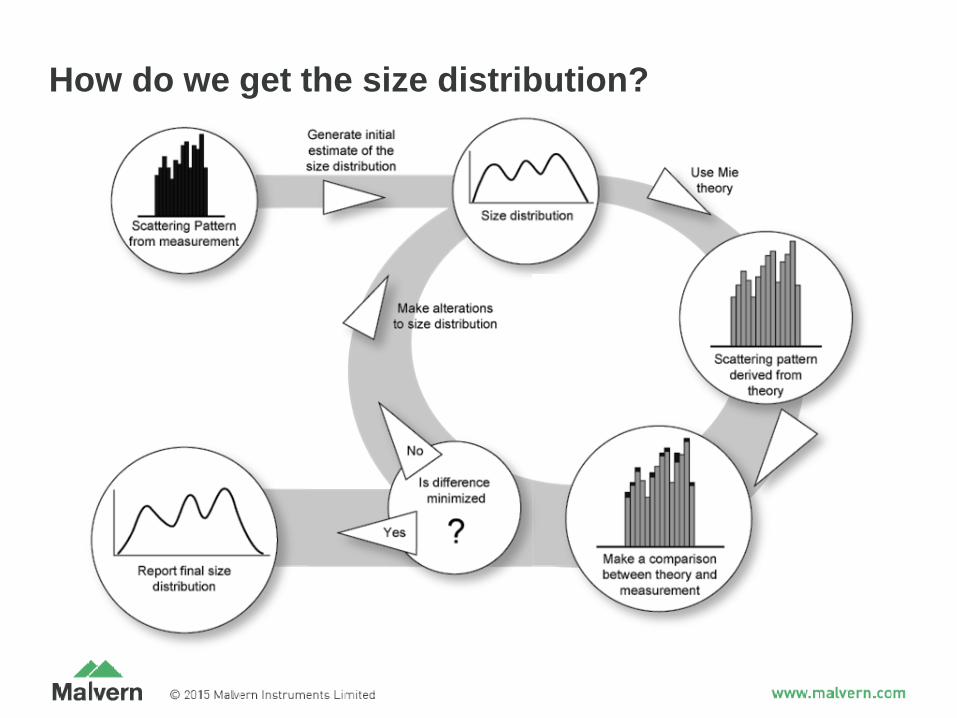
How do we get the size distribution?
Diameter
% V
olum
e
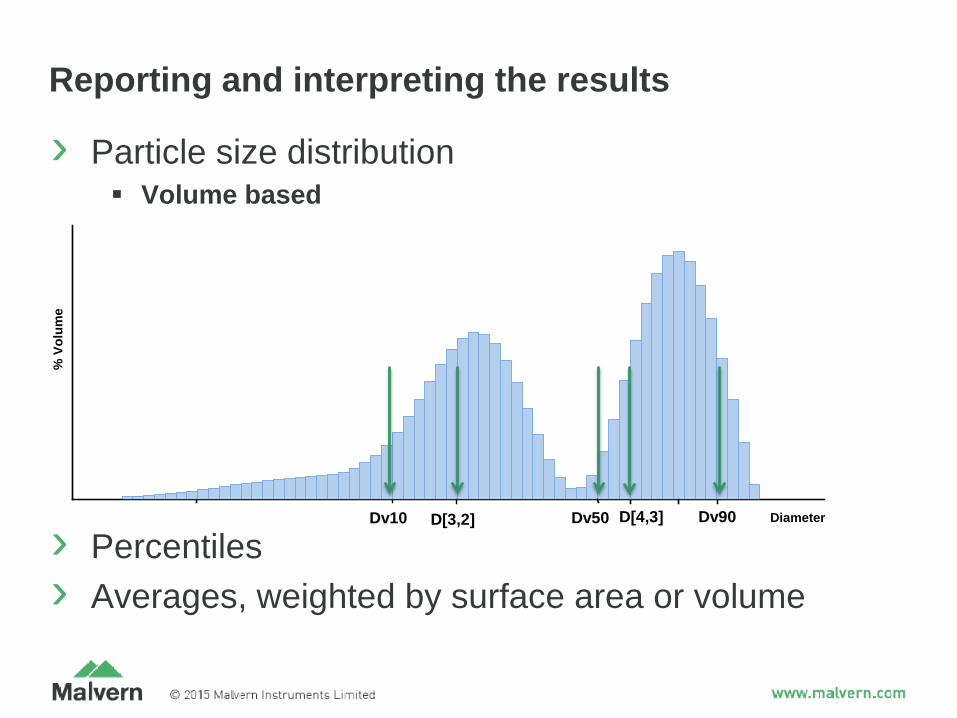
Reporting and interpreting the results
› Particle size distribution Volume based
› Percentiles› Averages, weighted by surface area or volume
Dv10 Dv50 Dv90D[3,2] D[4,3]

EVOLUTION OF LASER DIFFRACTION SYSTEMS

› Extremely successful - 10,000’s users worldwide Routine tool in many industries – versatility and ease of
use are key Mastersizer 3000 is the latest generation
Evolution of Laser Diffraction Particle Sizing
1988 1994 1998 2011

A basic laser diffraction system
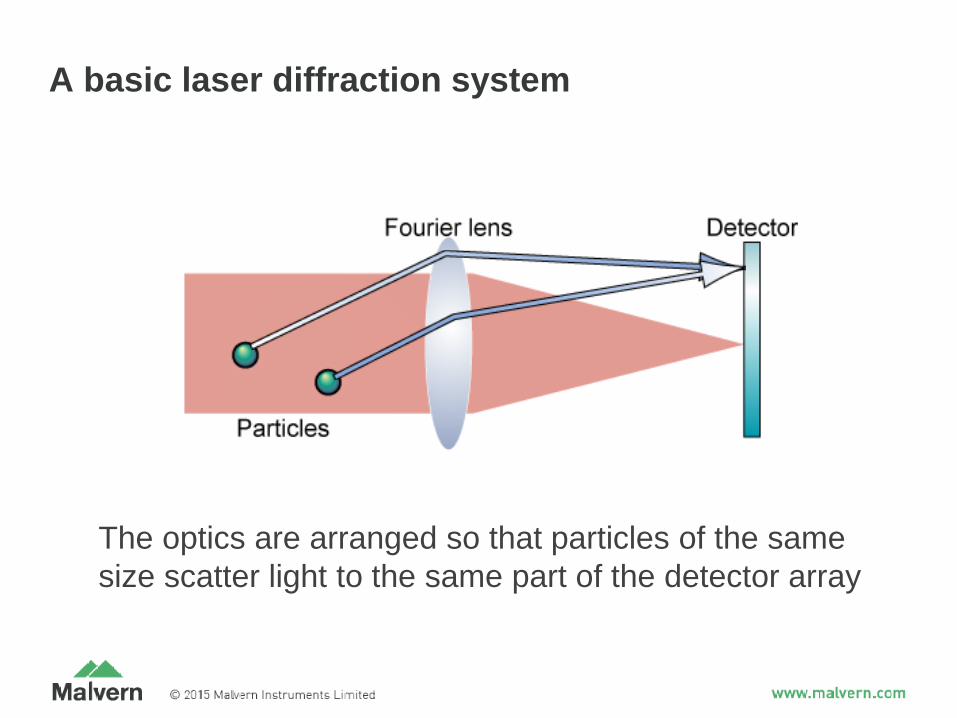
A basic laser diffraction system
The optics are arranged so that particles of the same size scatter light to the same part of the detector array

Optical systems: Mastersizer S
Lens Size range300RF 0.05 to 880um300mm 0.5 to 880um1000mm (long bench) 4.2 to 3480um

Optical systems: Mastersizer 2000 red light
Size range: 0.1 to 2000um

Optical systems: Mastersizer 2000 blue light
› The scattering intensity observed for sub-micron particles is increased by using 466nm blue light source
Size range: 0.02 to 2000um

Measurement cell Focal plane detectors
Side scatter detectors
Back scatter detectors
633nm red laser
Precision folded optics
Optical systems: Mastersizer 3000 red light
Size range: 0.1 to 3500um

Optical systems: Mastersizer 3000 blue light
470nm blue light source
Side scatter detectors
Measurement cell
Back scatter detectors
Size range: 0.01 to 3500um

SAMPLE DISPERSION
Wet dispersion unitsDispersion conditionsUltrasoundStirrer speedConcentrationDry dispersion

Method development and method transfer
› A laser diffraction measurement requires
‘a representative sample, dispersed at an adequate concentration in a suitable liquid or gas’
<USP429>
› Method development must define appropriate Sampling Dispersion Measurement conditions
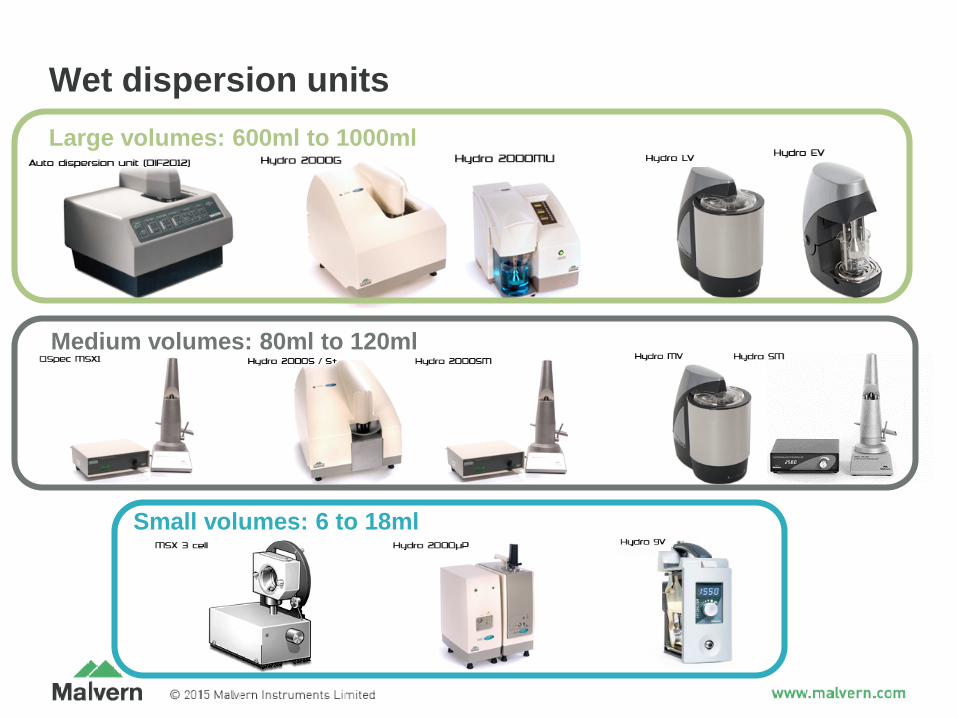
Wet dispersion unitsLarge volumes: 600ml to 1000ml
Medium volumes: 80ml to 120ml
Small volumes: 6 to 18ml

Method transfer: dispersion conditions
Agglomerated Dispersed
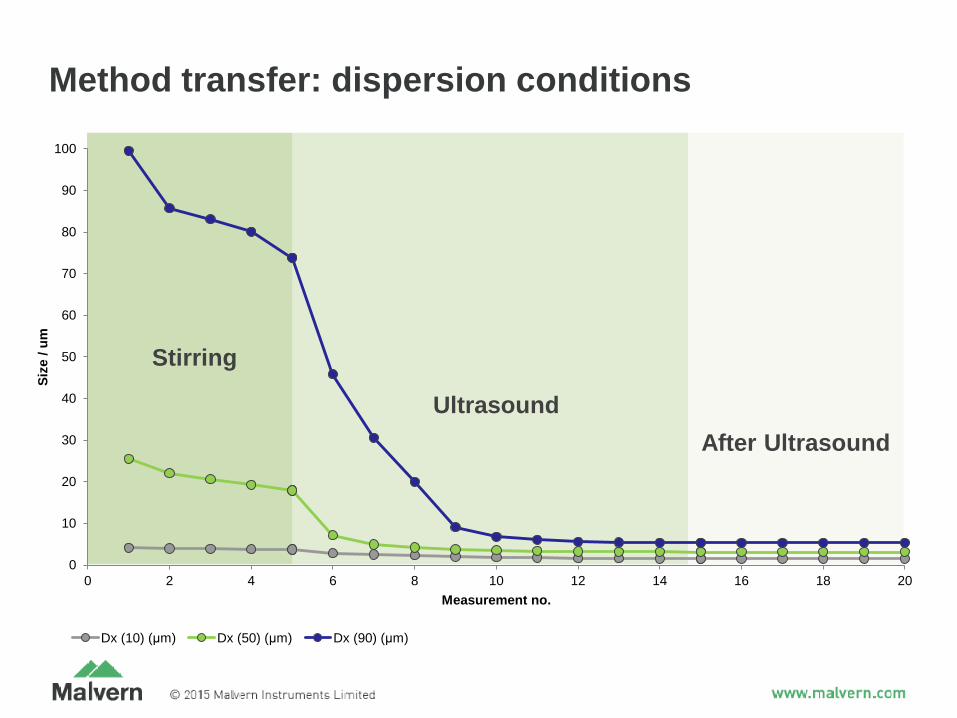
Method transfer: dispersion conditions
0
10
20
30
40
50
60
70
80
90
100
0 2 4 6 8 10 12 14 16 18 20
Size
/ um
Measurement no.
Dx (10) (μm) Dx (50) (μm) Dx (90) (μm)
After Ultrasound
Stirring
Ultrasound

Method transfer: ultrasound
› Ultrasound titration – ground glass› In-line sonication can reduce required ultrasound duration
Ultrasound duration / s
-100 0 100 200 300
Dv9
0 / µ
m
1
10
100
1000
10000MS2000 Dv90 MS3000 Dv90

Method transfer: stirrer speed
› MS3000 dispersion units have a combined pump and stir
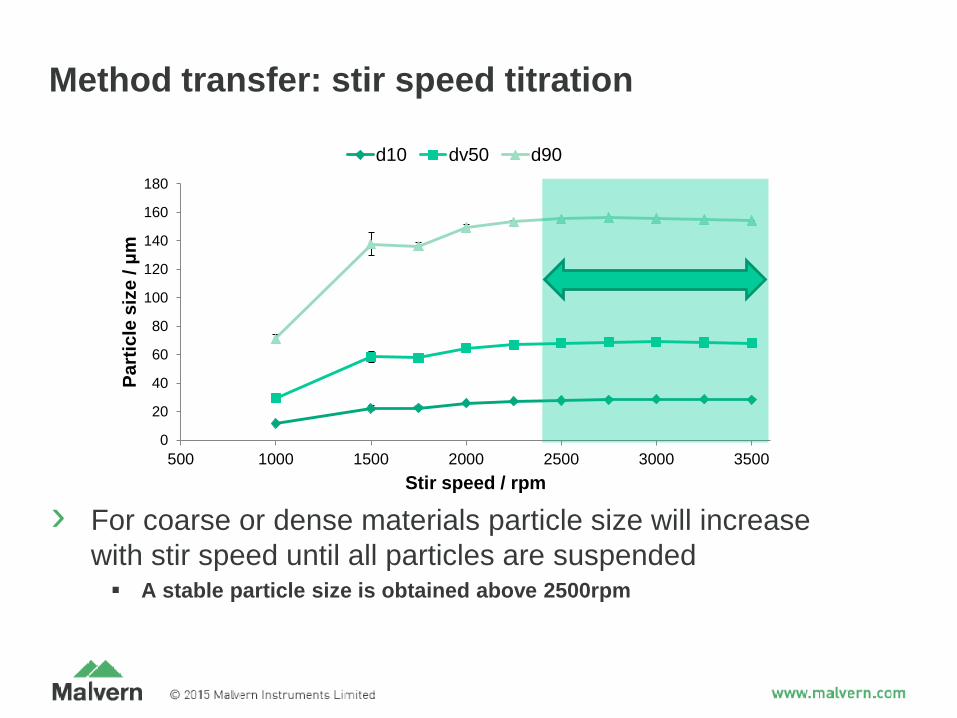
Method transfer: stir speed titration
› For coarse or dense materials particle size will increase with stir speed until all particles are suspended A stable particle size is obtained above 2500rpm
0
20
40
60
80
100
120
140
160
180
500 1000 1500 2000 2500 3000 3500
Part
icle
siz
e / μ
m
Stir speed / rpm
d10 dv50 d90

› Obscuration is a measure of concentration› The low limit is defined by signal to noise ratio
and measurement reproducibility
› The high limit is defined by multiple scattering
Method transfer: concentration
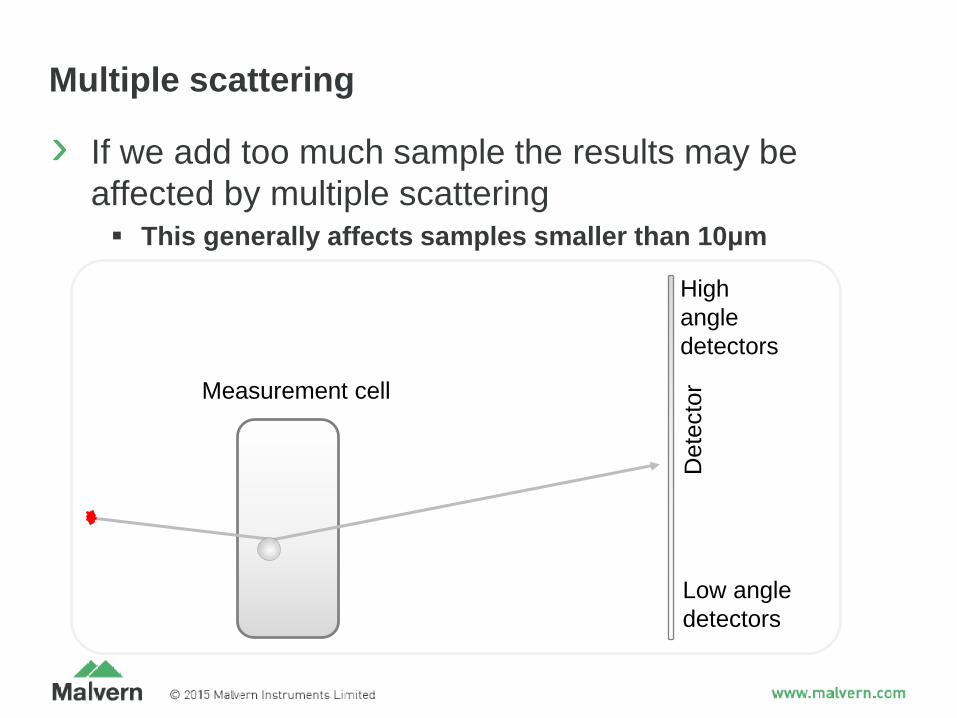
Multiple scattering
› If we add too much sample the results may be affected by multiple scattering This generally affects samples smaller than 10μm
Measurement cell
Det
ecto
r
Low angle detectors
High angledetectors

Multiple scattering
› If we add too much sample the results may be affected by multiple scattering This generally affects samples smaller than 10μm
Measurement cell
Det
ecto
r
Low angle detectors
High angledetectors
Increase in scattering angle

Achieving comparable results: concentration Particle Size Distribution
0.01 0.1 1 10 100 1000 3000 Particle Size (µm)
0
2
4
6
8 Vo
lum
e (%
)
Averaged 3%, 18 March 2011 15:32:25 Averaged 5%, 18 March 2011 15:35:46Averaged 9%, 18 March 2011 15:42:01 Averaged 13%, 18 March 2011 15:49:02Averaged 17%, 18 March 2011 15:53:59

Achieving comparable results: obscuration titration
Obscuration / %
0 2 4 6 8 10 12 14 16 18 20 22
Dv1
0 / µ
m
0.05
0.10
0.15
0.20
0.25
0.30
0.35MS3000MS2000
› Comparison of MS2000 and MS3000 results vs. obscuration

Wet dispersion method transfer summary
› Ultrasound efficiency will vary with: Power and frequency of generator Mechanism: in-line or dip-in probe Volume of dispersion unit
› Concentration Different systems show multiple scattering at effects
different obscurations
› Stirrer speed Stir speed titration may be required to achieve
comparability

Dry dispersion unitsMastersizer S Mastersizer 2000
Mastersizer 3000

The Aero S has a range of different tray designs to aid method transfer
Micro tray
Macro tray General purpose tray with hopper
Large volume tray

Dry powder dispersion: Mechanisms
› Importance of each mechanism depends on: Disperser geometry Flow rate or pressure drop Material type
› Higher impact energies may improve the dispersion effectiveness Needs to be balanced against the risk of particle break-up
Energy/aggressive

Dry powder dispersion: Disperser geometries
Standard Venturi High-Energy Venturi

Method transfer: pressure titration
› Make measurements at 4, 3, 2, 1, 0.5 and 0.1 bar. Investigate the effect of pressure on the state of
dispersion

Method transfer: comparing dispersers
405060708090
100110120130140
0 0.5 1 1.5 2 2.5 3 3.5 4
Dv5
0 / u
m
Air Pressure / bar
Aero Standard Aero High Energy Wet Dispersion

Method transfer: Aero vs Sirocco
40
50
60
70
80
90
100
110
120
130
140
0 0.5 1 1.5 2 2.5 3 3.5 4
Dv5
0 / u
m
Air Pressure / bar
Aero Standard
Aero High Energy
Scirocco
Wet Dispersion

Dry dispersion method transfer summary
› Different disperser mechanisms are used Carry out a pressure titration Choose the pressure that gives equivalent and robust
results
› Choose the best tray option for your material Volume of material to be measured Flowability
› Different vibration mechanisms are used Choose the vibration rate that gives a consistent flow
within the obscuration range.

ANALYSIS

Analysis: Optical properties
› Calcium carbonate sample› Optical properties
Refractive index: 1.52 Absorption: 0.1
Size / m
0.01 0.1 1 10 100 1000
Vol
ume
frequ
ency
/ %
0
2
4
6
8
MS3000MS2000
Dv 10 Dv 50 Dv 90 Residual Weighted residualMS2000 0.92 4.17 10.41 1.13 2.37MS3000 1.04 4.07 10.90 0.79 1.75Average 0.98 4.12 10.66
Standard deviation 0.07 0.06 0.26%RSD 6.73 1.41 2.47

Data Graph - Light Scattering
1 3 5 7 9 11 13 15 17 19 21 23 25 27 29 31 33 35 37 39 41 43 45 47 49 51 Detector Number
0
5
10
15
20
25
30
Ligh
t Ene
rgy
Fit data(weighted) calcium carbonate, 27 January 2011 15:31:52
Analysis: Assessing the data fit
Residual Weighted residual
0.79 1.75
Residual Weighted residual
1.13 2.37

Data Graph - Light Scattering
1 3 5 7 9 11 13 15 17 19 21 23 25 27 29 31 33 35 37 39 41 43 45 47 49 51 Detector Number
0
5
10
15
20
25
30
Ligh
t Ene
rgy
Fit data(weighted) calcium carbonate, 27 January 2011 15:31:52
Analysis: Assessing the data fit
Residual Weighted residual0.69 0.81
Residual Weighted residual
0.59 0.59

The optical property optimiser (OPO)
› Offers a quick way to adjust optical properties and assess the fit and result

Size / m
0.01 0.1 1 10 100 1000
Vol
ume
frequ
ency
/ %
0
2
4
6
8
MS3000MS2000
Analysis: Correct optical properties
› Calcium carbonate sample› Optical properties
Refractive index : 1.6 Absorption: 0.01 Dv 10 Dv 50 Dv 90 Residual Weighted residual
MS2000 1.87 4.98 11.48 0.69 0.81MS3000 1.84 4.79 11.54 0.59 0.59Average 1.85 4.88 11.51
Standard deviation 0.02 0.11 0.07%RSD 0.85 2.17 0.64

Analysis: Models

Analysis: Particle shape

Analysis: MS2000 emulated analysis

CASE STUDIES

Size / m
0.01 0.1 1 10 100 1000
Vol
ume
frequ
necy
/ %
0
2
4
6
8
10MS3000MS2000MSS
Case study: Calcium carbonate
› Correct optical properties Refractive index between 1.53 and 1.65, absorption 0.01
› No multiple scattering 5% to 10% obscuration
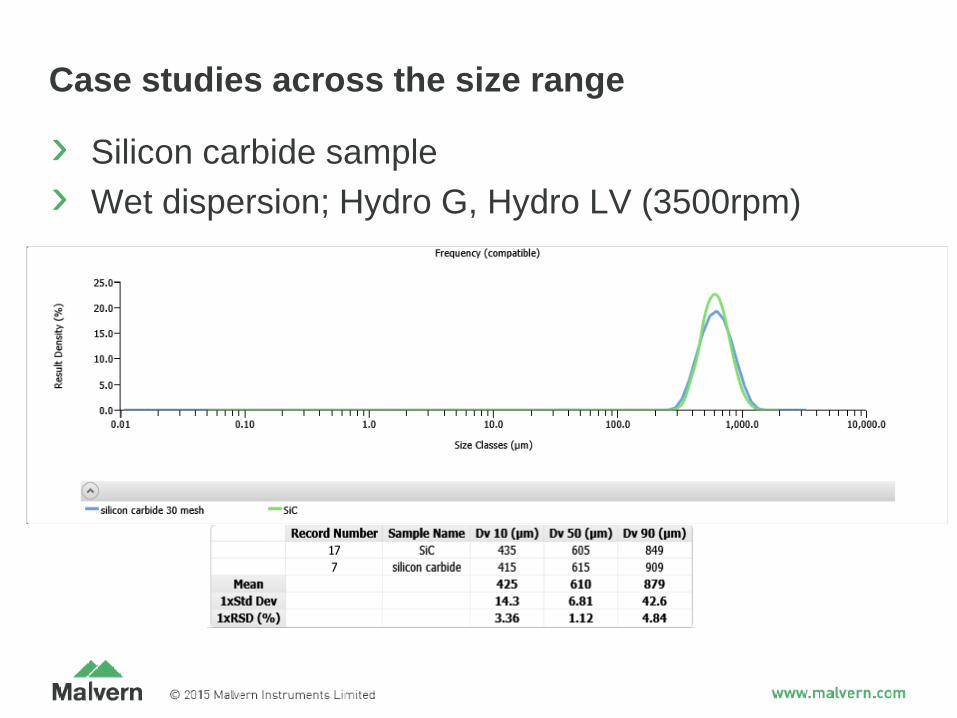
Case studies across the size range
› Silicon carbide sample› Wet dispersion; Hydro G, Hydro LV (3500rpm)

Case studies across the size range
› Pigment sample› Wet dispersion, Hydro S, Hydro MV (2100rpm)

Case studies across the size range
› Calcium carbonate› Wet dispersion, Hydro MU, Hydro EV

Case studies across the size range
› Emulsion sample, wet dispersion, Hydro S, Hydro MV Particle Size Distribution
0.01 0.1 1 10 100 1000 3000 Particle Size (µm)
0
2
4
6
8
10
Volu
me
(%)
emulsion, 11 June 2012 13:55:38

Examples at the extremes of the size range
› Coffee› Dry dispersion, Aero S standard venturi, Scirocco

Summary
› The optical systems of diffraction systems have evolved to measure a wider particle size range: measurements at narrower angles due to smaller detector
elements more high angle scattering data due to more sensitive
detector elements Additional lower wavelength light sources
› The dispersion units have evolved to Provide more efficient dispersion Provide dry dispersion mechanisms tailored to the
robustness of the material
› By understanding the materials state of dispersion, excellent comparability can be achieved


