MASTER’S PROG RAMME (October 2005 – September 2006)1)28689.pdfmaster’s prog tember 2006) ramme...
96
MASTER’S PROG tember 2006) RAMME (October 2005 – Sep THESIS : THE IMPACTS OF THE SMOKE HAZE POLLUTION ON URBAN ENVIRONMENT A CASE OF PEKANBARU CITY, RIAU PROVINCE, INDONESIA by M U K S I N Indonesia Supervisors: 1. Prof. Ir. Achmad Djunaedi, MUP., Ph.D. Urban and Regional Planning Master’s Programme, Gadjah Mada University Jogjakarta, Indonesia 2. Dr. Ogenis M. Brilhante Urban Management and Development Master’s Programme, Institute for Housing and Urban Development Studies )- Erasmus University Rotterdam (EUR), Rotterdam, the Netherlands Gadjah Mada University, Jogjakarta-Indonesia in cooperation with Institute for Housing and Urban Development Studies (IHS)- Erasmus University Rotterdam (EUR), Rotterdam-the Netherlands (Double Degree Programme IHS-UGM) Jogjakarta-Indonesia, November 8, 2006
Transcript of MASTER’S PROG RAMME (October 2005 – September 2006)1)28689.pdfmaster’s prog tember 2006) ramme...
MASTER’S PROGtember 2006) RAMME
(October 2005 – Sep
THESIS :
THE IMPACTS OF THE SMOKE HAZE POLLUTION ON URBAN ENVIRONMENT
A CASE OF PEKANBARU CITY, RIAU PROVINCE, INDONESIA
by
M U K S I N
Indonesia
Supervisors:
1. Prof. Ir. Achmad Djunaedi, MUP., Ph.D. Urban and Regional Planning Master’s Programme,
Gadjah Mada University Jogjakarta, Indonesia
2. Dr. Ogenis M. Brilhante
Urban Management and Development Master’s Programme, Institute for Housing and Urban Development Studies )-
Erasmus University Rotterdam (EUR), Rotterdam, the Netherlands
Gadjah Mada University, Jogjakarta-Indonesia in cooperation with
Institute for Housing and Urban Development Studies (IHS)- Erasmus University Rotterdam (EUR),
Rotterdam-the Netherlands (Double Degree Programme IHS-UGM)
Jogjakarta-Indonesia, November 8, 2006
ACKNOWLEDGMENT
First of all, I would like to thank the God as I can finally complete my research. This research is one of the requirements for the completion of my study in the master double degree programme between the regional and urban planning master programme of Gadjah Mada University (MPKD-UGM), Jogjakarta-Indonesia with the urban management and development master programme of the Institute of Housing and Urban Development Studies (IHS) – Erasmus University, Rotterdam-the Netherlands. Secondly, I would also like to express my sincere gratitude to all people who have supported my study completion, especially for the following; 1. Dr. Dedy S. Priatna (head of Pusbindiklatren-Bappenas RI) 2. Mrs. Monique Soesman (NEC) 3. Dr. Kawiek Sugiana (head of MPDK-UGM) 4. Mr. Jan Fransen (IHS) 5. Prof. Ir. Achmad Djunaedi, MUP., Ph. D. (my supervisor in Indonesia) 6. Dr. Ogenis M. Brilhante (my supervisor in the Netherlands) 7. Ir. Bakti Setiawan, M.A., Ph.D. (examiner) 8. Dr. Maartje van Eerd (examiner) 9. My beloved family; my mother, my wife (Risnawati Alwi), my daughter (Aisyah
‘Echa’ Fathaniah), my sister (Suhartina), my brother (Enka) and my nephew/niece (aan and iin), my brothers-in-law and my parents-in-law.
10. All my colleagues in the double degree batch 2 programme (DD 2) 11. All my colleagues in urban management and development 2 (UMD 2) 12. All staffs of Pusbindiklatren-Bappenas RI 13. All staffs of the Netherlands Education Centre (NEC) 14. All staffs of MPKD (Mbak Putri, Pak Ale’ etc) 15. All staffs of IHS (Sharon, Ruud, Cocky, Wouter etc)
Finally, I fully recognise that my research still have many weaknesses. Therefore, I am still looking forward to get constructive suggestions from the readers. Thank you very much.
Jogjakarta, November 8, 2006 Sincerely yours M U K S I N
ii
ABSTRACT Smoke haze in Pekanbaru City is mainly caused by forest and land fire, mostly occuring out of Pekanbaru City. It is predicted to have resulted in adverse impacts on urban environment of Pekanbaru. Therefore, this research tries to investigate the possible influence of forest and land fire in Riau Province as well as dominant direction of wind on the deterioration of air quality, due to smoke haze pollution, in Pekanbaru City. In addition, the research is aimed at identifying impacts of smoke haze on urban environment of Pekanbaru City according to opinions of experts & perception of citizents. The type of the research is a mixed explanatory-descriptive-exploratory research with a time scope of 2002-2005 using a purposive sampling technique used to choose key persons/experts and citizents.
The research confirms that forest and land fire as well as wind direction, in general, contributed to deterioration of air quality of Pekanbaru City. Even, it looks like to exist a trend to relate the air quality deterioration of Pekanbaru City with the increase of hotspot number especially when the number of hotspot in Riau Province is very high and the number of hotspots of regencies from which dominant wind direction blows is high as it was the case of February & March 2005. However, the analysis for February and March 2002 shows that contribution of the increase of forest & land fire as well as dominant wind direction on the deterioration of air quality of Pekanbaru City is very less evident. This is probably because the existence of other variables, besides dominant wind direction, such as raining rate, wind speed and temperature which may also play an important role in the air quality of Pekanbaru City. Thereby, the hypothesis “the increase of forest and land fire as well as wind direction have contributed to the deterioration of air quality in Pekanbaru City” is only partially accepted.
On top of that, smoke haze pollution in Pekanbaru City, both according to the opinions of key persons/experts and the perception of citizents, has caused adverse impacts on urban environment of Pekanbaru City both on environmental aspect and human aspect. In terms of environmental aspect, the environmental impacts are deterioration of air quality and reduction of visibility range. Meanwhile, in the light of human aspect, the impacts can be both health and social impacts. Health impacts include respiratory diseases such as Acute Respiratory Infection (ARI), eye irritation and the increasing risks of traffic accidents in the streets as a result of a reduced visibility range. On the other hand, the social impacts comprise disruption of educational activities and transportation and restriction of people from doing their daily activities.
Finally, the research result also shows that key actors involved in the forest and land fire in Riau Province, leading to smoke haze pollution in Pekanbaru City, in the period 2002-2005 are categorized into 2 types; indirect actors (mostly palm-oil companies, timber estate companies and cukong) and direct actors (migrand and local community). To overcome forest and land fire in Riau Province, three types measures undertaken are prevention, suppression and law enforcement. Key words; smoke haze, forest and land fire, wind direction & deterioration of air quality
iii
ABBREVIATION
1. BAPEDALDA : Badan Pengendalian Dampak Lingkungan Daerah
(Regional Environmental Impact Control Agency)
2. BPS : Biro Pusat Statistik (Statistical Bureau)
3. DISHUT : Dinas Kehutanan (Forestry Service)
4. HPH : Hak Pengusahaan Hutan (Forest Concession Right)
5. HTI : Hutan Tanaman Industri
(Timber Estate or Industrial Plantation Forest)
6. ISPA : Infeksi Saluran Pernapasan Atas
(Acute Respiratory Infection)
7. ISPU : Indeks Standar Pencemar Udara
(Pollutant Standard Index)
8. ITTO : International Tropical Timber Organization
9. JIKALAHARI : Jaringan Kerja Penyelamat Hutan Riau
(Riau’s Forest Rescue Network)
10. NOAA : National Oceanic Atmospheric Administration
11. PM10 : Particulate Matter 10
12. PP : Peraturan Pemerintah (Governmental regulation)
13. PUSDAL : Pusat Pengendalian Kebakaran Hutan dan Lahan
KARHUTLA (Center for Forest and Land Control)
14. REGDAM : Regu Pemadaman Kebakaran Hutan dan Lahan
KARHUTLA (Fire suppression team of forest and land fire)
15. SATLAKDAL : Satuan Pelaksana Pengendalian Kebakaran Hutan dan
KARHUTLA Lahan (Operational unit of forest & land fire control)
16. SATGASDAL : Satuan Tugas Pengendalian Kebakaran Hutan dan
KARHUTLA Lahan (Task unit of forest and land fire control)
17. SK Gubernur : Surat Keputusan Gubernur (Decree of governor)
18. UU : Undang Undang (Act)
19. WMO : World Metereological Organization 20. WHO : World Health Organization
iv
TABLE OF CONTENT Acknowledgment.……………………………………..……………………………. Abstract………………………………………………..……………………………. Abbreviation…….………………………………………….………………………. Table of Content……………………………………………………………………. List of Table.…..…………………………………………………………………… List of Figure.…..……………..……………………………………………………. List of Annex………………………………………………………………………. Chapter 1 Introduction……….………………………..…………………………… 1.1. Background of Problem…..……………………….…………………………… 1.2. Statement of Problem………………………………………………………….. 1.3. Justification of Study……………………………….………………………….. 1.4. Research Objectives…………………………………………………………… 1.5. Research Questions………………………………….…………………………. Chapter 2 Literature Review………………………………………………………. 2.1. Urban Environmental Problems……………………………………………….. 2.2. Forest and Land Fire…………………………………………………………... 2.3. Air Pollution…………………………………………………………………… 2.4. Perception……………………………………………………………………… 2.5. Conceptual Framework………………………………………………………... Chapter 3 Description of the Research Area……..………….……………………. Chapter 4 Research Method………..…………………….……..………………… 4.1. Type and Scope of Research...………………………………………………… 4.2. Data Collection …………………………………………..…………………… 4.3. Data Analysis………………………………………………………………….. . 4.4. Unit of Analysis, Variables and Indicators…………………………………….. 4.5. Working/Operational Definitions……………………………………………… 4.6. Research Design……………………………………………………………….. 4.7. Thesis Structure………………………………………………………………… 4.8. Limitations and Problems during the Fieldwork………………………………. Chapter 5 Result and Analysis……………….……………………………………. Chapter 6 Conclusion and Recommendation……………..……………………….. Reference………….…………………………...…………………………………… Annex……………………………………………………………………………….
ii iii iv v vi
viii ix 1 1 3 4 4 4 5 5 6 10 22 23
26
29 29 29 30 31 31 32 32 32
33
61
63 67
v
LIST OF TABLE 1. Table 1; The urban environment components...……………………………. 2. Table 2; Effects & control measures to reduce pollutant emissions…….…. 3. Table 3; Major potential ecological effects of traditional air pollutants…… 4. Table 4; Major potential health effects of traditional air pollutants……….. 5. Table 5; Relationship between PM10 concentration and health effects…… 6. Table 6; List of social economy impacts………………………………….... 7. Table 7; Methods of parameter measurement……………………………… 8. Table 8; Limits of the PSI……………………………………………….…. 9. Table 9; Pollution Standard Index and influences of each parameter……... 10. Table 10; Relationship between smoke concentrations and visibility……..… 11. Table 11; Population and population density of Riau Province 2004……..… 12. Table 12; Number of medium & large industries in 2004….…………..…… 13. Table 13; Number of vehicles by type in Pekanbaru 2002 - 2004…….….…. 14. Table 14; Sources of secondary data………………………………………… 15. Table 15; List of key person organisations for in-depth interview…………. 16. Table 16; List of respondents for survey with questionnaires………………. 17. Table 17; Category and indices of PSI……………………………………… 18. Table 18; Number of days with deteriorating air quality in Pekanbaru City
and hotspot number in Riau Province per month 2002-2005……. 19. Table 19; Dominant wind direction in Pekanbaru City 2002-2005………….. 20. Table 20; Causes of smoke haze pollution in Pekanbaru City………………. 21. Table 21; General causes of air pollution in Pekanbaru City………………… 22. Table 22; Respondent who consider that smoke haze created impacts….…... 23. Table 23; Respondent who (do not) get affected by smoke haze impacts.… 24. Table 24; Environmental impacts of smoke haze according to experts……… 25. Table 25; Air quality measured in february & march 2005 in Pekanbaru .….. 26. Table 26; Environmental impacts of smoke haze perceived by citizents……. 27. Table 27; Health impacts of smoke haze according to experts………………. 28. Table 28; Health impacts of smoke haze perceived by citizents………….…. 29. Table 29; Social impacts of smoke haze according to experts…….…………. 30. Table 30; Social impacts of smoke haze perceived by citizents.…………….. 31. Table 31; Respondents who know about measures of government.…………. 32. Table 32; Measures/actions undertaken by government…………..…………. 33. Table 33; Assessment of respondents about measures of government..…….. 34. Table 34; Summary of key persons about key actors involved…..……..…… 35. Table 35; Summary of key persons about measures of government…….….. 36. Table 36; List of names of key persons….……………………..……….…... 37. Table 37; Age of groups of respondents………………………………….….. 38. Table 38; Sex of respondents…………………………………..……….…… 39. Table 39; Occupation of respondents…………………………….……..…… 40. Table 40; Monthly income of respondents……………………………….….. 41. Table 41; Highest education level of respondents…………………………… 42. Table 42; Summary of research method…………………………………….
5 12 15 15 16 17 19 21 21 26 28 28 28 29 29 30 30
34 34 41 41 41 42 43 43 44 45 47 49 50 52 52 53 54 59 73 74 74 74 74 74 75
vi
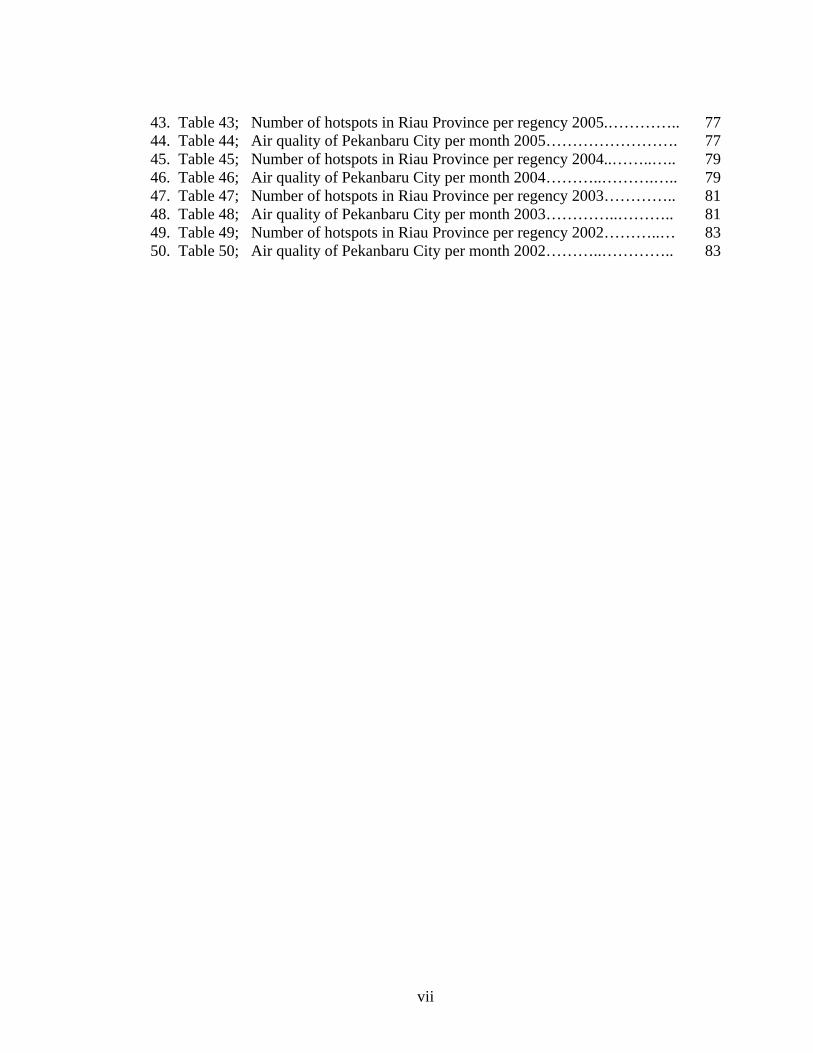
43. Table 43; Number of hotspots in Riau Province per regency 2005.………….. 44. Table 44; Air quality of Pekanbaru City per month 2005……………………. 45. Table 45; Number of hotspots in Riau Province per regency 2004..……..….. 46. Table 46; Air quality of Pekanbaru City per month 2004………..……….….. 47. Table 47; Number of hotspots in Riau Province per regency 2003………….. 48. Table 48; Air quality of Pekanbaru City per month 2003…………..……….. 49. Table 49; Number of hotspots in Riau Province per regency 2002………..… 50. Table 50; Air quality of Pekanbaru City per month 2002………..…………..
77 77 79 79 81 81 83 83
vii
LIST OF FIGURE
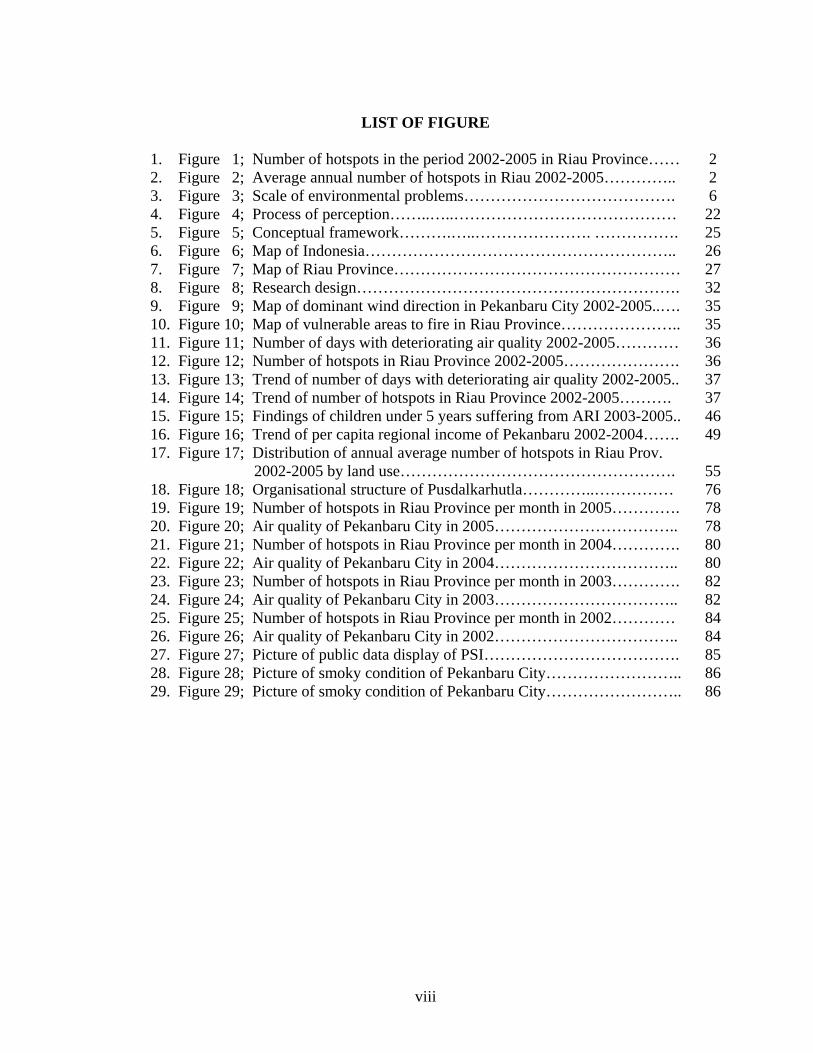
1. Figure 1; Number of hotspots in the period 2002-2005 in Riau Province…… 2. Figure 2; Average annual number of hotspots in Riau 2002-2005………….. 3. Figure 3; Scale of environmental problems…………………………………. 4. Figure 4; Process of perception……..…..…………………………………… 5. Figure 5; Conceptual framework……….…..…………………. ……………. 6. Figure 6; Map of Indonesia………………………………………………….. 7. Figure 7; Map of Riau Province……………………………………………… 8. Figure 8; Research design……………………………………………………. 9. Figure 9; Map of dominant wind direction in Pekanbaru City 2002-2005..…. 10. Figure 10; Map of vulnerable areas to fire in Riau Province………………….. 11. Figure 11; Number of days with deteriorating air quality 2002-2005………… 12. Figure 12; Number of hotspots in Riau Province 2002-2005…………………. 13. Figure 13; Trend of number of days with deteriorating air quality 2002-2005.. 14. Figure 14; Trend of number of hotspots in Riau Province 2002-2005………. 15. Figure 15; Findings of children under 5 years suffering from ARI 2003-2005.. 16. Figure 16; Trend of per capita regional income of Pekanbaru 2002-2004……. 17. Figure 17; Distribution of annual average number of hotspots in Riau Prov. 2002-2005 by land use……………………………………………. 18. Figure 18; Organisational structure of Pusdalkarhutla…………..…………… 19. Figure 19; Number of hotspots in Riau Province per month in 2005…………. 20. Figure 20; Air quality of Pekanbaru City in 2005…………………………….. 21. Figure 21; Number of hotspots in Riau Province per month in 2004…………. 22. Figure 22; Air quality of Pekanbaru City in 2004…………………………….. 23. Figure 23; Number of hotspots in Riau Province per month in 2003…………. 24. Figure 24; Air quality of Pekanbaru City in 2003…………………………….. 25. Figure 25; Number of hotspots in Riau Province per month in 2002………… 26. Figure 26; Air quality of Pekanbaru City in 2002…………………………….. 27. Figure 27; Picture of public data display of PSI………………………………. 28. Figure 28; Picture of smoky condition of Pekanbaru City…………………….. 29. Figure 29; Picture of smoky condition of Pekanbaru City……………………..
2 2 6 22 25 26 27 32 35 35 36 36 37 37 46 49
55 76 78 78 80 80 82 82 84 84 85 86 86
viii
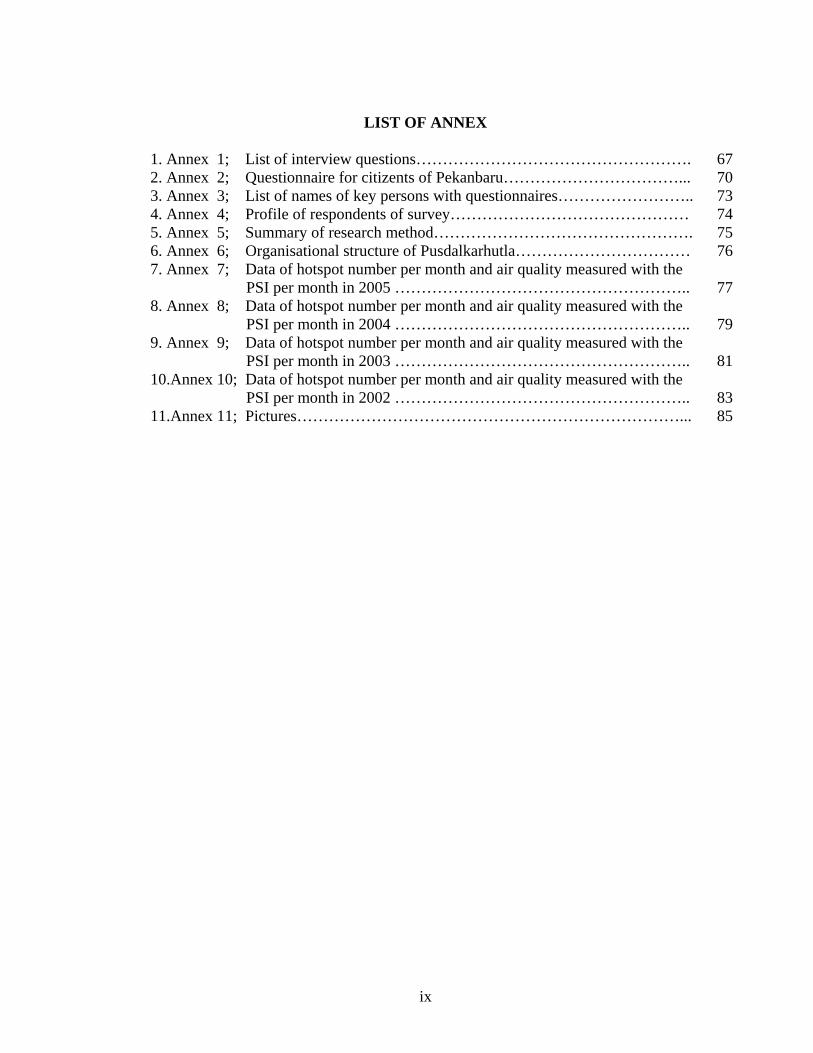
LIST OF ANNEX 1. Annex 1; List of interview questions……………………………………………. 2. Annex 2; Questionnaire for citizents of Pekanbaru……………………………... 3. Annex 3; List of names of key persons with questionnaires…………………….. 4. Annex 4; Profile of respondents of survey……………………………………… 5. Annex 5; Summary of research method…………………………………………. 6. Annex 6; Organisational structure of Pusdalkarhutla…………………………… 7. Annex 7; Data of hotspot number per month and air quality measured with the
PSI per month in 2005 ……………………………………………….. 8. Annex 8; Data of hotspot number per month and air quality measured with the
PSI per month in 2004 ……………………………………………….. 9. Annex 9; Data of hotspot number per month and air quality measured with the
PSI per month in 2003 ……………………………………………….. 10.Annex 10; Data of hotspot number per month and air quality measured with the
PSI per month in 2002 ……………………………………………….. 11.Annex 11; Pictures………………………………………………………………...
67 70 73 74 75 76
77
79
81
83 85
ix
CHAPTER 1 INTRODUCTION
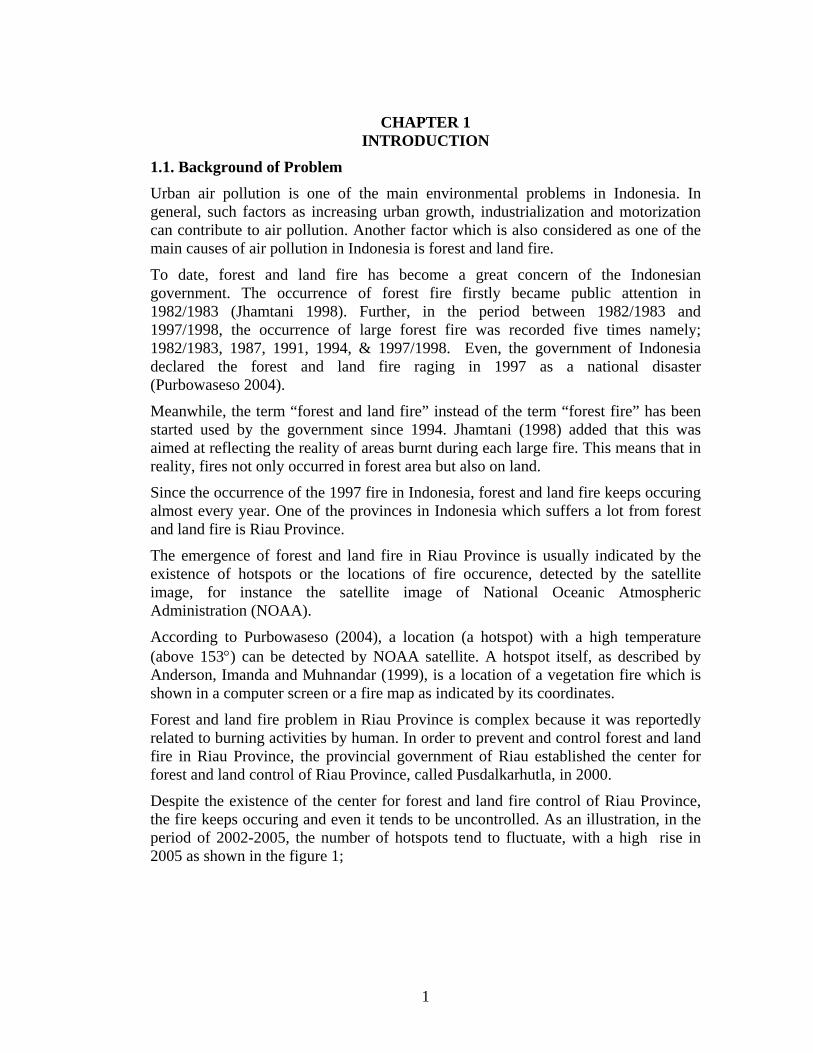
1.1. Background of Problem Urban air pollution is one of the main environmental problems in Indonesia. In general, such factors as increasing urban growth, industrialization and motorization can contribute to air pollution. Another factor which is also considered as one of the main causes of air pollution in Indonesia is forest and land fire.
To date, forest and land fire has become a great concern of the Indonesian government. The occurrence of forest fire firstly became public attention in 1982/1983 (Jhamtani 1998). Further, in the period between 1982/1983 and 1997/1998, the occurrence of large forest fire was recorded five times namely; 1982/1983, 1987, 1991, 1994, & 1997/1998. Even, the government of Indonesia declared the forest and land fire raging in 1997 as a national disaster (Purbowaseso 2004).
Meanwhile, the term “forest and land fire” instead of the term “forest fire” has been started used by the government since 1994. Jhamtani (1998) added that this was aimed at reflecting the reality of areas burnt during each large fire. This means that in reality, fires not only occurred in forest area but also on land.
Since the occurrence of the 1997 fire in Indonesia, forest and land fire keeps occuring almost every year. One of the provinces in Indonesia which suffers a lot from forest and land fire is Riau Province.
The emergence of forest and land fire in Riau Province is usually indicated by the existence of hotspots or the locations of fire occurence, detected by the satellite image, for instance the satellite image of National Oceanic Atmospheric Administration (NOAA).
According to Purbowaseso (2004), a location (a hotspot) with a high temperature (above 153°) can be detected by NOAA satellite. A hotspot itself, as described by Anderson, Imanda and Muhnandar (1999), is a location of a vegetation fire which is shown in a computer screen or a fire map as indicated by its coordinates.
Forest and land fire problem in Riau Province is complex because it was reportedly related to burning activities by human. In order to prevent and control forest and land fire in Riau Province, the provincial government of Riau established the center for forest and land control of Riau Province, called Pusdalkarhutla, in 2000.
Despite the existence of the center for forest and land fire control of Riau Province, the fire keeps occuring and even it tends to be uncontrolled. As an illustration, in the period of 2002-2005, the number of hotspots tend to fluctuate, with a high rise in 2005 as shown in the figure 1;
1
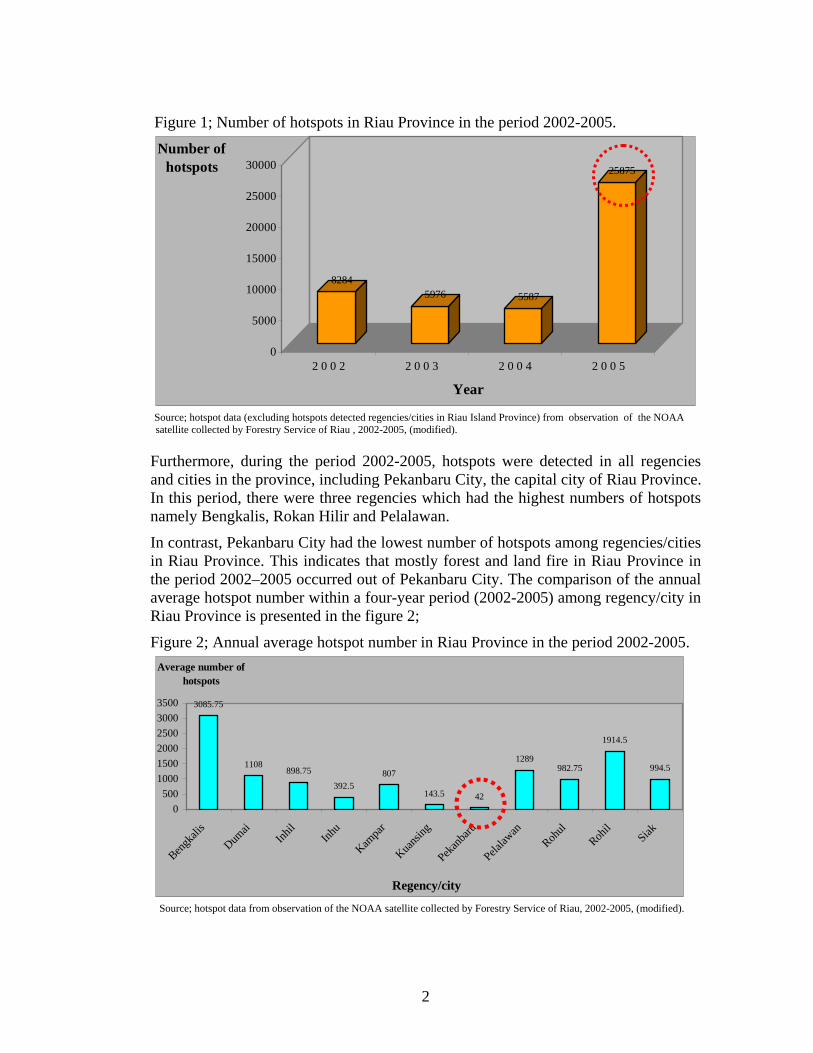
Figure 1; Number of hotspots in Riau Province in the period 2002-2005.
82845976 5587
25875
0
5000
10000
15000
20000
25000
30000Number of
hotspots
2 0 0 2 2 0 0 3 2 0 0 4 2 0 0 5
Year Source; hotspot data (excluding hotspots detected regencies/cities in Riau Island Province) from observation of the NOAA
satellite collected by Forestry Service of Riau , 2002-2005, (modified).
Furthermore, during the period 2002-2005, hotspots were detected in all regencies and cities in the province, including Pekanbaru City, the capital city of Riau Province. In this period, there were three regencies which had the highest numbers of hotspots namely Bengkalis, Rokan Hilir and Pelalawan.
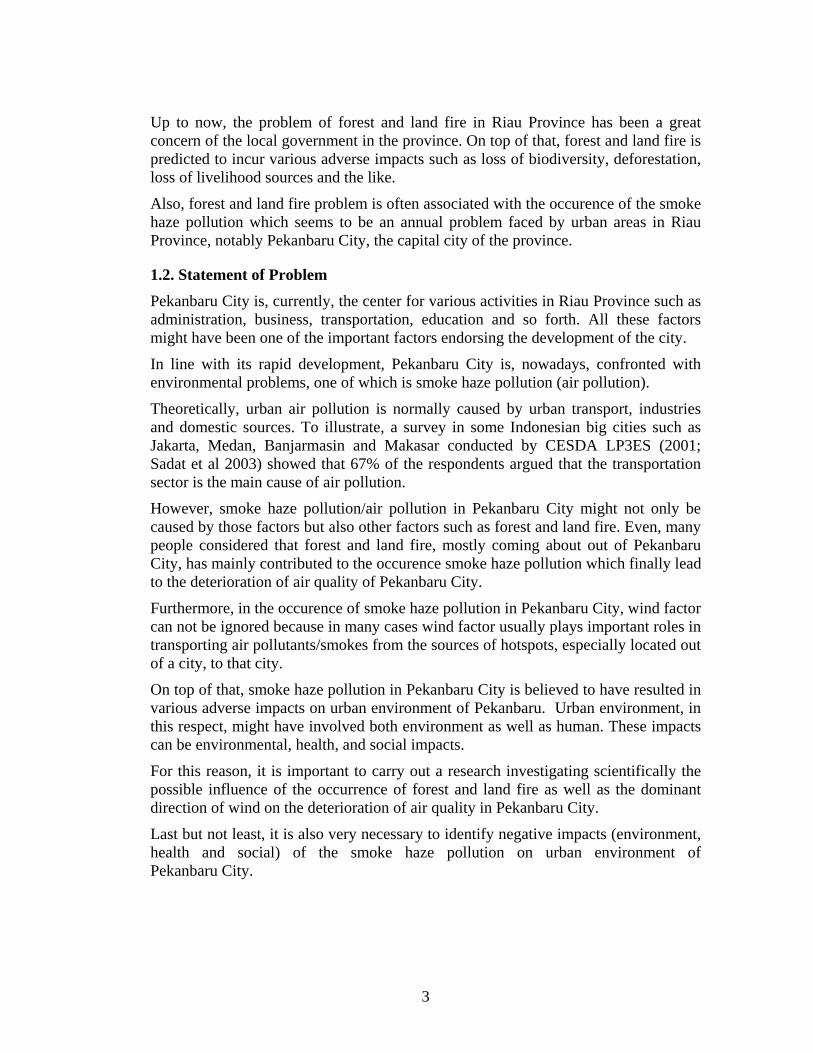
In contrast, Pekanbaru City had the lowest number of hotspots among regencies/cities in Riau Province. This indicates that mostly forest and land fire in Riau Province in the period 2002–2005 occurred out of Pekanbaru City. The comparison of the annual average hotspot number within a four-year period (2002-2005) among regency/city in Riau Province is presented in the figure 2;
Figure 2; Annual average hotspot number in Riau Province in the period 2002-2005.
3085.75
1108898.75
392.5807
143.5 42
1289982.75
1914.5
994.5
0500
100015002000250030003500
Bengk
alis
Dumai
Inhil
Inhu
Kampa
r
Kuansi
ng
Pekan
baru
Pelalaw
anRoh
ulRoh
ilSiak
Regency/city
Average number of hotspots
Source; hotspot data from observation of the NOAA satellite collected by Forestry Service of Riau, 2002-2005, (modified).
2
Up to now, the problem of forest and land fire in Riau Province has been a great concern of the local government in the province. On top of that, forest and land fire is predicted to incur various adverse impacts such as loss of biodiversity, deforestation, loss of livelihood sources and the like.
Also, forest and land fire problem is often associated with the occurence of the smoke haze pollution which seems to be an annual problem faced by urban areas in Riau Province, notably Pekanbaru City, the capital city of the province.
1.2. Statement of Problem Pekanbaru City is, currently, the center for various activities in Riau Province such as administration, business, transportation, education and so forth. All these factors might have been one of the important factors endorsing the development of the city.
In line with its rapid development, Pekanbaru City is, nowadays, confronted with environmental problems, one of which is smoke haze pollution (air pollution).
Theoretically, urban air pollution is normally caused by urban transport, industries and domestic sources. To illustrate, a survey in some Indonesian big cities such as Jakarta, Medan, Banjarmasin and Makasar conducted by CESDA LP3ES (2001; Sadat et al 2003) showed that 67% of the respondents argued that the transportation sector is the main cause of air pollution.
However, smoke haze pollution/air pollution in Pekanbaru City might not only be caused by those factors but also other factors such as forest and land fire. Even, many people considered that forest and land fire, mostly coming about out of Pekanbaru City, has mainly contributed to the occurence smoke haze pollution which finally lead to the deterioration of air quality of Pekanbaru City.
Furthermore, in the occurence of smoke haze pollution in Pekanbaru City, wind factor can not be ignored because in many cases wind factor usually plays important roles in transporting air pollutants/smokes from the sources of hotspots, especially located out of a city, to that city.
On top of that, smoke haze pollution in Pekanbaru City is believed to have resulted in various adverse impacts on urban environment of Pekanbaru. Urban environment, in this respect, might have involved both environment as well as human. These impacts can be environmental, health, and social impacts.
For this reason, it is important to carry out a research investigating scientifically the possible influence of the occurrence of forest and land fire as well as the dominant direction of wind on the deterioration of air quality in Pekanbaru City.
Last but not least, it is also very necessary to identify negative impacts (environment, health and social) of the smoke haze pollution on urban environment of Pekanbaru City.
3
1.3. Justification of Study A study about impacts of the smoke haze on urban environment is very important to be carried out. It will help us perceive the smoke haze pollution problem comprehensively. The findings of the research are hoped to give a better understanding of the main causes and impacts of the smoke haze pollution problem. By understanding its main causes and impacts of the problem, recommendations for future solutions might be developed. Furthermore, the result of the study is also hoped to contribute to the development of knowledge in urban environmental problems. Finally, this study will be part of the requirement to obtain master’s double degrees in urban management and development of Institute of Housing and Urban Development Studies (IHS)-Erasmus University and in urban and regional planning of Gadjah Mada University (MPKD UGM).
1.4. Research Objective To investigate the possible influence of forest and land fire in Riau Province on the deterioration of air quality of Pekanbaru City as well as to identify the environmental, health & social impacts of smoke haze pollution.
1.5. Research Questions a. What is the possible influence of forest and land fire in Riau Province as well as
the dominant direction of wind in Pekanbaru City on the deterioration of air quality in Pekanbaru City?
with a hypothesis as follows; “the increase of forest and land fire occurrence in Riau Province as well as the
dominant direction of wind in Pekanbaru City have contributed to the deterioration of air quality in Pekanbaru City”
b. What are the environmental, health and social impacts of the smoke haze pollution on urban environment of Pekanbaru City according to the opinions of experts and the perception of citizents?
c. Which key actors were involved in forest and land fire in Riau Province?
d. What kinds of measures/efforts were undertaken by the Provincial Government of Riau to overcome forest and land fire in Riau Province?
4
CHAPTER 2 LITERATURE REVIEW
2.1. Urban Environmental Problems
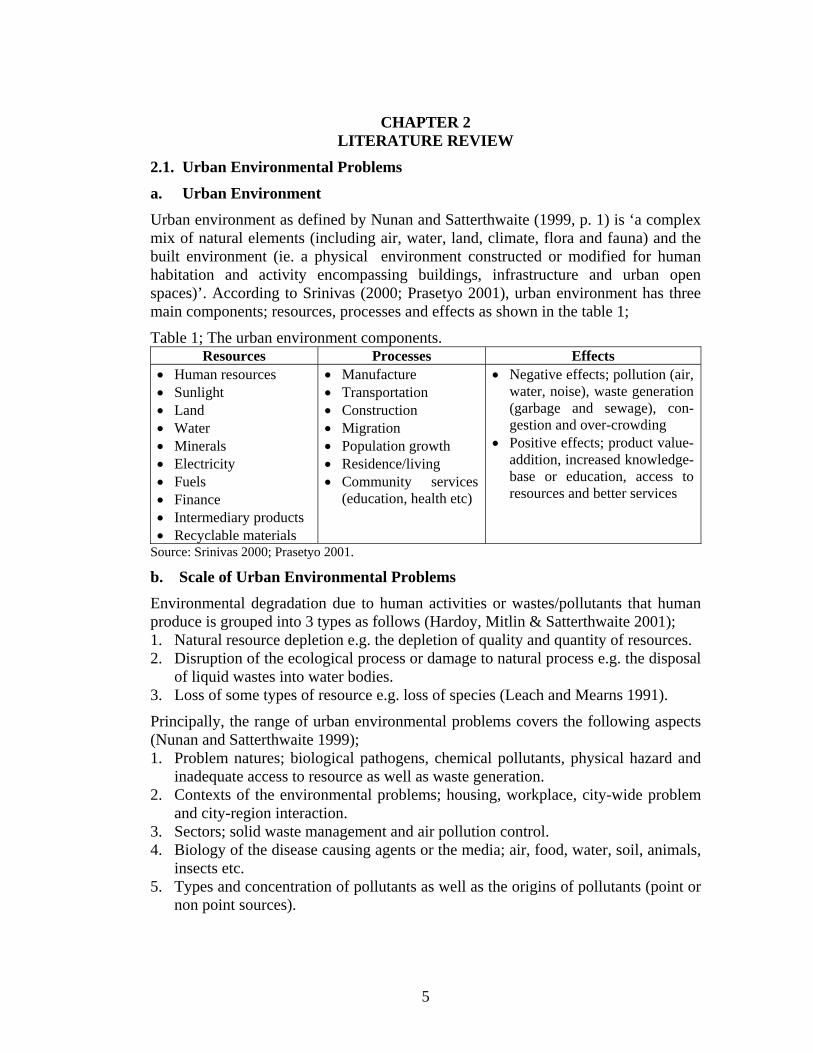
a. Urban Environment Urban environment as defined by Nunan and Satterthwaite (1999, p. 1) is ‘a complex mix of natural elements (including air, water, land, climate, flora and fauna) and the built environment (ie. a physical environment constructed or modified for human habitation and activity encompassing buildings, infrastructure and urban open spaces)’. According to Srinivas (2000; Prasetyo 2001), urban environment has three main components; resources, processes and effects as shown in the table 1;
Table 1; The urban environment components. Resources Processes Effects
• Human resources • Sunlight • Land • Water • Minerals • Electricity • Fuels • Finance • Intermediary products • Recyclable materials
• Manufacture • Transportation • Construction • Migration • Population growth • Residence/living • Community services
(education, health etc)
• Negative effects; pollution (air, water, noise), waste generation (garbage and sewage), con-gestion and over-crowding
• Positive effects; product value-addition, increased knowledge-base or education, access to resources and better services
Source: Srinivas 2000; Prasetyo 2001.
b. Scale of Urban Environmental Problems Environmental degradation due to human activities or wastes/pollutants that human produce is grouped into 3 types as follows (Hardoy, Mitlin & Satterthwaite 2001); 1. Natural resource depletion e.g. the depletion of quality and quantity of resources. 2. Disruption of the ecological process or damage to natural process e.g. the disposal
of liquid wastes into water bodies. 3. Loss of some types of resource e.g. loss of species (Leach and Mearns 1991).
Principally, the range of urban environmental problems covers the following aspects (Nunan and Satterthwaite 1999); 1. Problem natures; biological pathogens, chemical pollutants, physical hazard and
inadequate access to resource as well as waste generation. 2. Contexts of the environmental problems; housing, workplace, city-wide problem
and city-region interaction. 3. Sectors; solid waste management and air pollution control. 4. Biology of the disease causing agents or the media; air, food, water, soil, animals,
insects etc. 5. Types and concentration of pollutants as well as the origins of pollutants (point or
non point sources).
5

In an urban context, the scale of environmental problems can be divided into four types; region/nation, city, community and household (GDRC 2000; Prasetyo 2001) as can be seen in the figure 3;
Figure 3; The scale of urban environmental problems.
Water pollution
Loss of habitat, biodiversity and
species dedangered
Region/Nation Soil erosion and increased salinity
Toxic run-off and acid rain
Amenity loss Traffic congestion City Loss of heritage
and historical buildings
Reduced property and building
values
Accidents and disasters
Inadequate tax/financial
revenues
Flooding and surface drainage
Lack of, and inappropriate,
laws and legislation
Toxic and hazardous
wastes/dumps
Polluted land Community inappropriate and
inadequate technology use
Trash dumping
Household household
health, garbage generation,
air/water/noise pollution, spread of diseases
Lack of understanding of environmental
problems
Flooding Noise pollution Natural disasters
High living densities
Loss of agricultural land
and desertification Air pollution Water pollution
Inadequate supply and transmission loss of electricity
Misguided urban governments and
management practices
Natural and man-made hazards and
disasters
Land clearance and loss of forest
cover
Effects of climate change and global
warming.
Source; GDRC 2000; Prasetyo 2001.
2.2. Forest and Land Fire
a. Forest Forest can be defined as both a collection of individual trees and a complex community of plants which includes trees, shrubs, wet plants, soil microbes and other animals (Anonymous 1989). Forest as an ecosystem (Odum 1971; Sumardi and Widyastuti 2004) includes a community of plants and animals as well as its whole interaction with growth site factor and environment. Further, the types of forest are as follows (Van Steenis 1950; Anonymous 1997); lowland evergreen tropical rain forest, submontane tropical rain forest, montane tropical rain forest, sub alpine tropical forest, heath forest, forest on calcarens rocks, forest on ultrabasic rocks, coastal
6
vegetation, mangrove forest, branchis water forest, peatswamp forest, freshwater swamp forest and seasonal swamp forest, evergreen subtropical rain forest, moist tropical deciduous forest and other drier formation.
b. Land As a stated in the governmental regulation No. 4/2001 (Peraturan Pemerintah no. 4 tahun 2001) concerning the control of environmental damage and pollution related to forest and land fire, land is a spreadout area of mainland ecosystem earmarked for enterprise and or cultivation and or plantation for community. A more complete definition about land is stated in the provincial decree of the governor of Riau No.1/2003 (Surat Keputusan Gubernur Riau no. 1 tahun 2003) concerning the center for forest and land fire. In this decree, land is defined as a landscape of a mainland (non-forest area) earmarked for the purposes of agriculture, plantation, transmigration, mining, animal husbandry, fishery and settlement.
c. Fire
Fire, as stated in the provincial decree of the governor of Riau No.1/2003 concerning the center for forest and land fire, is defined as a process of flame which occurs due to the presence of three elements; oxygen/air, fuel and high heat/temperature. Purbowaseso (2004) defined forest fire as a fire occuring within a forest area whereas land fire is defined as a fire occuring out of a forest area. In the meantime, Adinugroho et al (2005) defined forest and land fire as a fire occurrence both due to natural factor and human factor characterized by a fire spreading which consumes fuel available in burnt forest or land.
Furthermore, fire in forest can be grouped into three types; surface, crown and ground fires. A crown fire advances from one top of a tree to another or shrubs of surface-fire and the height of crown canopy whereas a surface fire consumes surface litter, other loose debris on the forest floor and small vegetation. Meanwhile, a ground fire burns organic materials below the surface of litter of forest floor (Brown & Davis 1973; Priadjati 2002).
With respect to ground fire, Adinugroho et al (2005) pointed out that fire on peat land belongs to a ground fire in which fire burns organic material without smoldering combustion so that only smoke appears on the ground surface. They also described that this is the reason why fire suppression on peat land is very difficult to do. Fire suppression on peatland will only be succesful if burnt peat layer is waterlogged. Therefore, water in great amount, which might come from stick pump or heavy rain, is highly needed. Sastry (2000) added that peat, which is a blend of decaying organic matters, can burn easily and spread fire rapidly during a period of drought.
d. Fire Causes According to Sumardi and Widyastuti (2004), forest fires can be caused by three major factors namely; human activity factor (intentional burning, rest of burning activity of a farmer whose cultivation field is close to forest, cigarette butts,vehicles such as train which uses coal fuels, shifting cultivation, reforestation on alang-alang
7
field, recreation, camping and logging and grazing), natural factor (lightning strike and volcano activity) and other factors. Sumardi and Widyastuti (2004) added that the occurrence of forest fire due to human factor as its major cause is usually supported by some factors; climate, topography, fuel and bad forest area management
In the meantime, Adinugroho et al (2005) mentioned that the causes of fires on peat forest and land can be divided into five causes as follows; 1. Land conversion; fire is caused by land preparation (by burning) for agriculture,
industry, road, bridges, buildings etc. 2. Vegetation burning; fire is caused by intentional burning of vegetation. However,
fire is uncontrolled and jumps into other areas. This usually occurs in opening of timber estate and plantation areas as well as land preparation by community.
3. Activities to utilize natural resource 4. Land occupation; fire is often used by local community to get their rights for land
or occupy no man’s land. 5. Development of canals; canals are usually used not only as irrigations but also as
water transportation routes to carry logs. Canals without a door to control water will cause the loss of peat water so that peat becomes dry and easy to get burnt.
Adinugroho et al (2005) added that development of canals has made peat experience excessive drying in a dry season. This condition finally damages peat because peat experiences an irreversible drying symptom and peat turns into charcoal so that it can not absorb nutrient and retain water anymore.
In addition, forest fires are influenced by predisposing factors or inherent conditions (ed. Qadri 2001) such as economy (poverty & dependence of rural communities upon forests for livelihood), demography (pressure of growing population upon forests), socioculture (cultural significance of fire to forest dwelling and rural community), metereology (weather conditions e.g. high temperature and low humidity), crop conditions, nature and condition of ecosystem as well as institutions.
e. Fire Impacts Impacts of forest fire have some dimensions; economic, environmental, ecological, social and others (ed. Qadri 2001). Meanwhile, Sumardi and Widyastuti (2004) described that forest fire can result in both beneficial and detrimental effects such as; 1. Detrimental effects; decrease of air quality, health disturbance (Acute Respiratory
Infection, asthma, bronchitis, pneumonia, eye and skin irritation), vegetation damage, forest soil damage, loss of wildlife, ecosystem damage, damage on recreational site, beauty of nature and scientific value, etc.
2. Beneficial effects; seed bed preparation, land clearing, reduction of litter and fuel accumulation, regulation of plant succession pattern, influencing the diversity of plant age classes and vegetation types, controlling the composition of forest plant community, recycling nutrients and increasing or suppressing organism which damages plants.
Furthermore, Purbowaseso (2004) pointed out that forest and land fire can have impacts on physical environment among other things;
8
1. Impact on soil in which forest and land fire can damage physical and chemical structures of soil.
2. Impact on water in which forest and land fire can disturb the hydrological cycle. 3. Impact on climate and air quality in which forest and land fire produces smoke.
When smoke becomes thicker, it will cause the deterioration of air quality.
Effects of forest fire can also be found in the cases of the forest fire in the Brazil Amazon and forest fire in the Pacific Northwest of the United States (international experiences). In the case of mercury contamination in the Brazil Amazon, a research project by researches from Canada and Brazil found that mining activities had little contribution to the existing global contamination in the Brazil Amazon. On the other hand, it was mainly caused by deforestation through the forest clearance by burning along the river banks. As a result, climatic condition of the area were conducive to the methylation of mercury and its transfer to chain food leading to adverse effects on human health (IDRC; Brilhante and Frank 2003). Meanwhile, Boubel et al (1994) described that forest fire in the Pacific Northwest of the United States has emitted a plume causing in a reduced visibility and sunlight until 350 km from the actual fire.
f. Fire Management and Control According to the guidelines of International Tropical Timber Organization (ITTO) on fire management in tropical forest (1997), integrated fire management measures includes the aspects of fire prevention, fire pre-suppression, fire suppression, training and education, law enforcement and the use of incentives and prescribed burning for specific purposes.
Meanwhile, Adinugroho et al (2005) defined forest and land fire control as all activities incolving fire prevention, fire suppression and measures after the occurrence of forest and land fire. He, further, defined all those activities as follows; 1. Forest and land fire prevention; all measures to prevent or to reduce the
possibility of the occurrence of forest and land fire. 2. Forest and land fire suppression; all measures to extinguish forest and land fire. 3. Measures after the occurrence of forest and land fire; all measures to investigate
the occurrence of forest and land fire in order to identify the impacts and actors who burnt forest or land. These measures will, in turn, enable to implement law enforcement and forest or land rehabilitation.
Similarly, Purbowaseso (2004) divided strategies of forest and land fire control into three among other things; 1. Forest and land fire prevention (before the occurrence of forest and land fire); the
making of maps of areas vulnerable to fire, monitoring wheather, fuel accumulation and symptoms of fire vulnerability, preparation of fire teams, development of control towers, preparation of fire equipment, preparation of fire breaks, giving information to community and establishment of forest and land fire control organisations.
2. Forest and land fire suppression 3. Rehabilitation of areas which have been burnt
9
g. Hotspot Monitoring System As revealed by Adinugroho et al (2005), the method used in monitoring hotspots is the remote sensing with the assistance of satellites. One of the satellites often used for this purpose is the NOAA (National Oceanic and Atmospheric Administration) satellite, launched by the NASA (the National Aeronautics and Space Administration), through the AVHRR (Advanced Very High Resolution Radiometer) sensor (Adinugroho et al 2005).
According to Purbowaseso (2004), the number of hotspots has a correlation with the vulnerability level. Meaning that the higher the hotspot number is, the more vulnerable the area will be.
However, Adinugroho et al (2005) pointed out that the NOAA satellite has two main weaknesses. Firstly, the NOAA satellite can not penetrate cloud, smoke and aerosol so that the satellite might detect fewer hotspots during a big fire than it should be. Secondly, the sensor of the satellite is sensitive to the earth’s surface temperature. This weakness can make the satellite inaccurately detect a hotspot on the earth. For instance, chimneys of oil or gas mining are often detected as hotspots.
2.3. Air Pollution
a. Definition Air pollution as stated in the governmental regulation No. 41/1999 (Peraturan Pemerintah no. 41 tahun 1999) about air pollution control is defined as the entering of substances and energy from other components into free air due to human activities making air quality falls into a level at which it can not fulfil its function anymore.
Meanwhile, Weber (1982; Elsom 1992 p. 13) defined the atmospheric pollution as ‘the presence of substances in the ambient atmosphere, resulting from the activity of man or from natural processes, causing adverse effects to man and environment’.
Another definition was put forward by Elsom (1992 p.13) who defined the air pollution as ‘the presence in the atmosphere of substances or energy in such quantities and of such duration liable to cause harm to human, plant, or animal life, or damage to human-made materials and structures, or changes in the weather and climate, or interference with the comfortable enjoyment of life or property or other human activities’.
b. Scale According to Brilhante and Frank (2003) that air pollution can happen at indoor, local, urban and regional as well as global levels. Similarly, Boubel et al (1994) classified the scales of air pollution problems as follows; 1. Local scale (scale is up to 5 km); local scale is normally characterized by one or
several large emitters or a large number of relatively small emitters. 2. Urban scale (scale extends to the order of 50 km); urban air pollution problems
can be grouped into two types; The first one is the release of primary pollutants or
10
released directly from sources. The second one is the formation of secondary pollutants or formed through chemical reactions of the primary pollutants).
3. Regional scale (scale is from 50 km to 500 km); the air pollution problems at the regional scale can generally be classified into three types namely; • The carryover of urban oxidant problems to the regional scale. Normally, the
air from one metropolitan area having secondary & primary pollutants goes to the adjacent metropolitan area.
• The release of relatively slow-reacting primary air pollutants experiencing reactions and transformation during long trans-port times.
• Visibility which might be reduced by specific plumes or by the regional levels of particulate matter producing various intensities of haze.
4. Continental (scale is from 500 km to several thousand km); the greatest concern related to the continental scale is that policies on air pollution of a country might result in impacts on its neighboring countries.
5. Global scale (scale extends worldwide); there are some examples of air pollution problems having a global scale among other things; (1). The release of chlorofluorocarbons used as propellants in spray cans and in air conditioners as well as their effect on the ozone layer high in the atmosphere, (2). The problem generated by carbondioxide, which is a greenhouse gas, (3). Injection into the atmosphere of fine particulate debris by volcanoes.
c. Types and Sources Air pollutants consist of two main types among other things (Boubel et al 1994); 1. Primary pollutants namely those emitted directly from sources consisting of;
(1). Pollutants from combustion process; carbon dioxide, carbon monoxide, sulfur dioxide, and nitric oxide, (2). Pollutants from industrial processes (hydrogen sulfide, ammonia, hydrogen chloride and hydrogen fluoride).
2. Secondary pollutants namely those manufactured in the air (salt particle, H2SO4 etc). Secondary pollutants are considered to be responsible for most of smog, haze, eye irritation, plant and material damage attributable to air pollution.
Boubel et al (1994) also described that a source is a place from which pollutants originate whereas a receptor is something adversely affected by air pollution. Receptors can be persons, animals, plants, trees, materials (e.g. paper, leather, cloth, metal, stone or paint), properties of atmosphere (e.g. ability to transmit radiant energy).
Boubel et al (1994) finally classified the sources of air pollution into two main sources among other things; 1. Natural sources; erupting volcanoes, accidental fires in forests and on prairies,
dust storms, oceans, plants and trees, alkaline and saltwater lakes. 2. Anthropogenic sources; industrial sources, utilities, personal sources
(automobiles, home furnaces, home fireplaces and stoves, backyard barbecue grills and open burning of refuse and leaves).
11
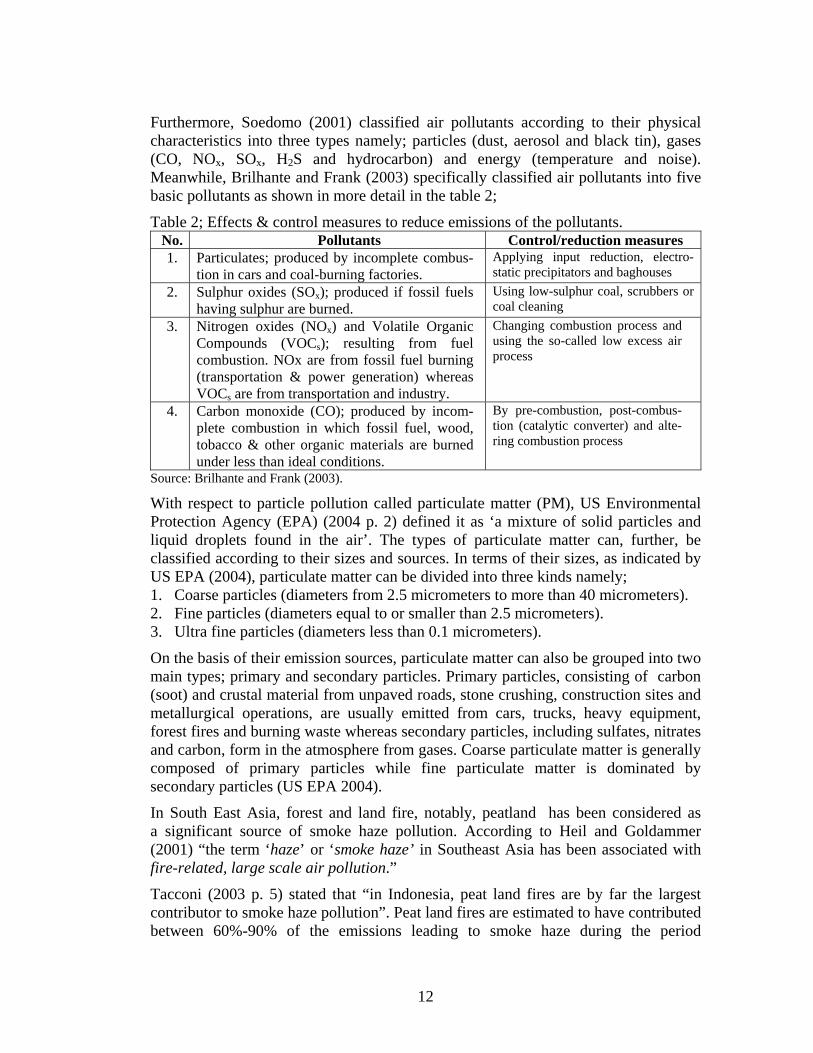
Furthermore, Soedomo (2001) classified air pollutants according to their physical characteristics into three types namely; particles (dust, aerosol and black tin), gases (CO, NOx, SOx, H2S and hydrocarbon) and energy (temperature and noise). Meanwhile, Brilhante and Frank (2003) specifically classified air pollutants into five basic pollutants as shown in more detail in the table 2;
Table 2; Effects & control measures to reduce emissions of the pollutants. No. Pollutants Control/reduction measures 1. Particulates; produced by incomplete combus-
tion in cars and coal-burning factories. Applying input reduction, electro-static precipitators and baghouses
2. Sulphur oxides (SOx); produced if fossil fuels having sulphur are burned.
Using low-sulphur coal, scrubbers or coal cleaning
3. Nitrogen oxides (NOx) and Volatile Organic Compounds (VOCs); resulting from fuel combustion. NOx are from fossil fuel burning (transportation & power generation) whereas VOCs are from transportation and industry.
Changing combustion process and using the so-called low excess air process
4. Carbon monoxide (CO); produced by incom-plete combustion in which fossil fuel, wood, tobacco & other organic materials are burned under less than ideal conditions.
By pre-combustion, post-combus-tion (catalytic converter) and alte-ring combustion process
Source: Brilhante and Frank (2003).
With respect to particle pollution called particulate matter (PM), US Environmental Protection Agency (EPA) (2004 p. 2) defined it as ‘a mixture of solid particles and liquid droplets found in the air’. The types of particulate matter can, further, be classified according to their sizes and sources. In terms of their sizes, as indicated by US EPA (2004), particulate matter can be divided into three kinds namely; 1. Coarse particles (diameters from 2.5 micrometers to more than 40 micrometers). 2. Fine particles (diameters equal to or smaller than 2.5 micrometers). 3. Ultra fine particles (diameters less than 0.1 micrometers).
On the basis of their emission sources, particulate matter can also be grouped into two main types; primary and secondary particles. Primary particles, consisting of carbon (soot) and crustal material from unpaved roads, stone crushing, construction sites and metallurgical operations, are usually emitted from cars, trucks, heavy equipment, forest fires and burning waste whereas secondary particles, including sulfates, nitrates and carbon, form in the atmosphere from gases. Coarse particulate matter is generally composed of primary particles while fine particulate matter is dominated by secondary particles (US EPA 2004).
In South East Asia, forest and land fire, notably, peatland has been considered as a significant source of smoke haze pollution. According to Heil and Goldammer (2001) “the term ‘haze’ or ‘smoke haze’ in Southeast Asia has been associated with fire-related, large scale air pollution.”
Tacconi (2003 p. 5) stated that “in Indonesia, peat land fires are by far the largest contributor to smoke haze pollution”. Peat land fires are estimated to have contributed between 60%-90% of the emissions leading to smoke haze during the period
12
1997/1998, (Bappenas-ADB 1999; Tacconi 2003). He also specifically mentioned that smoke haze pollution in 1997 affecting Singapore, Malaysia and Sumatera Island (Indonesia) is mainly contributed by fires occuring in the peat lands of the provinces of Jambi, Riau and South Sumatera. Sastry (2000) added that the amount of smoke emitted due to burning peat is larger than that of burning other forms of biomass.
Normally, the instant aerial combustion products generated from burning vegetation are carbondioxide, carbon monoxide, methane, nonmethane hydrocarbons, nitric oxide, sulfur oxide, methil chloride, policyclic aromatic hydrocarbons and other gases (ed. Qadri 2001). Those combustion products are later an important source of transboundary atmospheric pollution. In terms of the dominant pollutant during a smoke haze period, a study about air quality in Kuala Lumpur revealing that the smoke haze was associated with high levels of suspended micro-particulate matter, but relatively low levels of other gaseous pollutants such as carbon monoxide, nitrogen dioxide, sulphur dioxide, and ozone (Noor, 1998; Awang et al., 2000; Sastry 2001). Another relevant notion pointed out that during the smoke haze episode in 1997, particulate matter was the pollutant which consistently rose exceeding national ambient air quality (Department of Environment 1998; Emmanuel and Lim 1998; Phonboon 1998; WHO 1998; Radojevic and Hassan 1999; Goldammer & Heil 2001).
Meanwhile, Boubel et al (1994) defined atmospheric haze as a condition in which the visibility is reduced. This condition is due to the existence of fine particles or NO2 in the atmosphere. He added that components of atmospheric haze can be sulfate particulate matter, nitrate particulate matter, graphitic material, fine fly ash and organic aerosols. Haze is also defined by the World Metereological Organization (WMO) (1992; Heil and Goldammer 2001 p. 25) as ‘a suspension of extremely small, dry particles in the atmosphere and hence does not specify a specific course’ whereas smoke is defined by Deutches Institut fur Normung (Anderson, Imanda and Muhnandar 1999 p. v) as ‘a visible aerosol resulting from combustion’. Another definition of smoke is also described by the WMO in the health guidelines for vegetation fire events of WHO (ed. Schwela, D., Goldammer, J. G., Morawska, L. H., and Simpson, O. 1999 Annex C, p. 14) as ‘a suspension in the atmosphere of small particles produced by combustion’.
d. Factors Influencing Air Pollution As indicated by Brilhante and Frank (2003) that the effect of air pollution is influenced by local weather conditions e.g. temperature. As an example, cars release more pollutants by the time they are started in winter morning than in summer because during winter cars’ engines do not burn fuel efficiently leading to an incomplete combustion. However, they added that the most important local weather phenomenon influencing air pollution is a thermal inversion happening when a layer of warm air overlies cooler air inverting the usual condition in which air gets cooler when altitude increases.
13
Meanwhile, Boubel et al (1994) pointed out that transport (the mechanism of movement of pollutants from a source to a receptor) and dispersion of air pollutants are related to the following factors; 1. Wind velocity (wind direction and wind speed); wind direction at the source
determines the initial direction of pollutant transport from their sources. If wind blows toward a receptor, a change in direction of as little as 5° results in concentrations at the receptor to fall around 10% under unstable conditions, approximately 50% under neutral conditions and about 90% under stable conditions. Meanwhile effects of wind speed are to dilute continuously released pollutants at the emission points & related to travel time from source to receptor.
2. Turbulence; turbulence is very erratic motion of wind. There are two causes of turbulent eddies; mechanical turbulence and thermal turbulence. Furthermore, the most important mixing process in the atmosphere resulting in air pollutant dispersion is called eddy diffusion.
e. Effects/impact
According to Soemarwoto (2003), an impact is a change which occurs as a result of an activity (both nature and human). Meanwhile, Brilhante, El-Hefnawi and El-Sherif (2002 p. 9) defined the term effect/impact, which can be either positive or negative, as ‘the change from the natural baseline state resulting from a particular activity’. Effects/impact can be categorized into three main kinds; effects on abiotic environment, effects on biotic environment and effects on humans.
Effects on human can further be elaborated into three types; economic, social and health impacts (Brilhante, El-Hefnawi and El-Sherif 2002). They also added that effects can also be either inside the jurisdiction in which an activity takes place or outside the jurisdiction (transboundary effect). In relation to a significance of an impact, Beanland and Duinker (1982; Westman 1985 p. 14) described that ‘what is considered important by decision makers, the public and scientists should be the guide to significance’. In the meantime, impacts of air pollution/smoke haze pollution can be looked at from the following aspects;
e.1. Environmental Impact Environmental impact is described as ‘the change in an environmental parameter, over a specific period and within a defined area, resulting from a particular activity compared with the situation which would have occurred if the activity had not been initiated’ (Wathern 1989; Brilhante, El-Hefnawi and El-Sherif 2002 p. 64).
Furthermore, according to Elsom (1992), there are five kinds of damage caused to environment by air pollutants namely; (1). Damage to vegetation, (2). Damage to animals, birds and insects, (3). Damage to human-made materials (painted surfaces, rubber, nylon and metals), (4). Soiling of materials (clothing, buildings etc.) and (5). Weather and climatic changes (smogs, reduced solar radiation, visibility deterioration, increase of surface temperature).
14
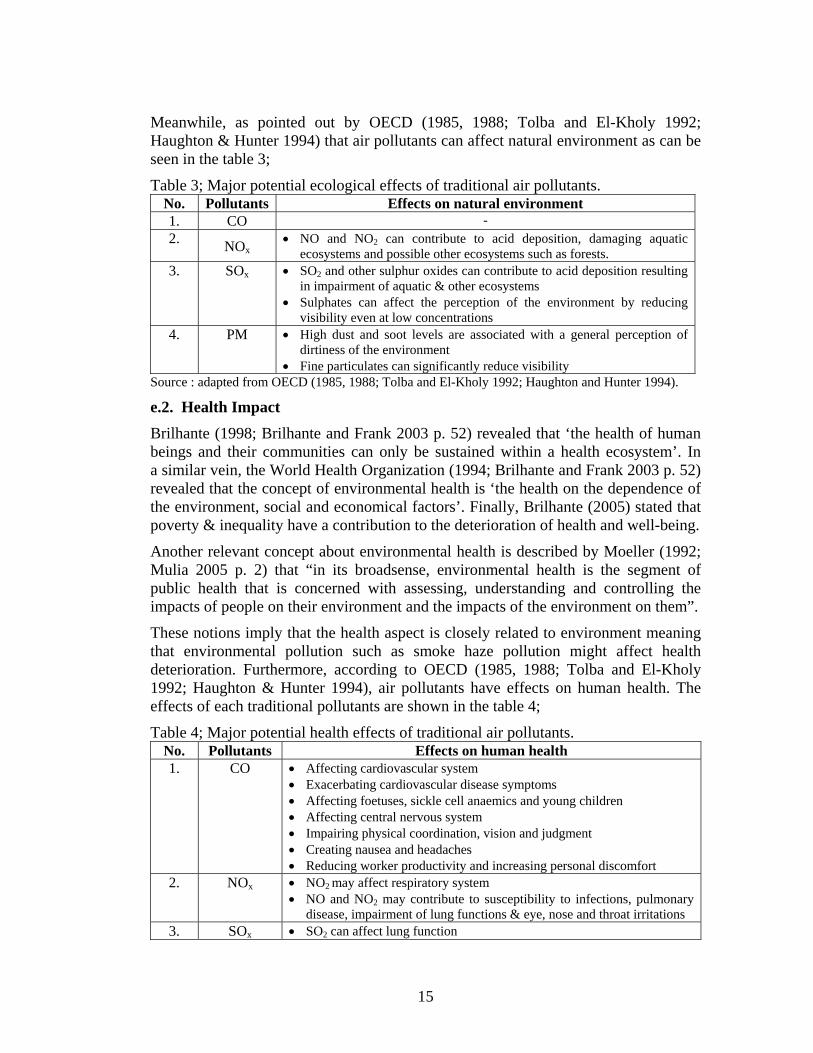
Meanwhile, as pointed out by OECD (1985, 1988; Tolba and El-Kholy 1992; Haughton & Hunter 1994) that air pollutants can affect natural environment as can be seen in the table 3;
Table 3; Major potential ecological effects of traditional air pollutants. No. Pollutants Effects on natural environment 1. CO - 2. NOx
• NO and NO2 can contribute to acid deposition, damaging aquatic ecosystems and possible other ecosystems such as forests.
3. SOx • SO2 and other sulphur oxides can contribute to acid deposition resulting in impairment of aquatic & other ecosystems
• Sulphates can affect the perception of the environment by reducing visibility even at low concentrations
4. PM • High dust and soot levels are associated with a general perception of dirtiness of the environment
• Fine particulates can significantly reduce visibility Source : adapted from OECD (1985, 1988; Tolba and El-Kholy 1992; Haughton and Hunter 1994). e.2. Health Impact Brilhante (1998; Brilhante and Frank 2003 p. 52) revealed that ‘the health of human beings and their communities can only be sustained within a health ecosystem’. In a similar vein, the World Health Organization (1994; Brilhante and Frank 2003 p. 52) revealed that the concept of environmental health is ‘the health on the dependence of the environment, social and economical factors’. Finally, Brilhante (2005) stated that poverty & inequality have a contribution to the deterioration of health and well-being.
Another relevant concept about environmental health is described by Moeller (1992; Mulia 2005 p. 2) that “in its broadsense, environmental health is the segment of public health that is concerned with assessing, understanding and controlling the impacts of people on their environment and the impacts of the environment on them”.
These notions imply that the health aspect is closely related to environment meaning that environmental pollution such as smoke haze pollution might affect health deterioration. Furthermore, according to OECD (1985, 1988; Tolba and El-Kholy 1992; Haughton & Hunter 1994), air pollutants have effects on human health. The effects of each traditional pollutants are shown in the table 4;
Table 4; Major potential health effects of traditional air pollutants. No. Pollutants Effects on human health 1. CO • Affecting cardiovascular system
• Exacerbating cardiovascular disease symptoms • Affecting foetuses, sickle cell anaemics and young children • Affecting central nervous system • Impairing physical coordination, vision and judgment • Creating nausea and headaches • Reducing worker productivity and increasing personal discomfort
2. NOx • NO2 may affect respiratory system • NO and NO2 may contribute to susceptibility to infections, pulmonary
disease, impairment of lung functions & eye, nose and throat irritations 3. SOx • SO2 can affect lung function
15
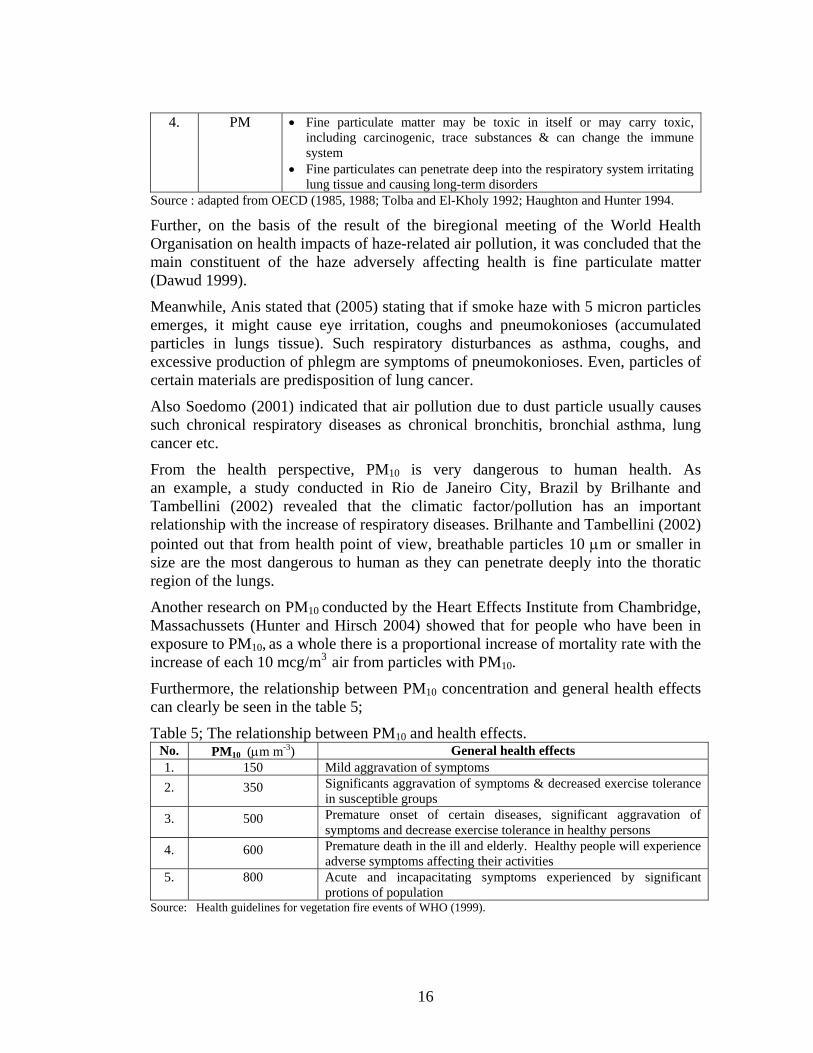
4. PM • Fine particulate matter may be toxic in itself or may carry toxic, including carcinogenic, trace substances & can change the immune system
• Fine particulates can penetrate deep into the respiratory system irritating lung tissue and causing long-term disorders
Source : adapted from OECD (1985, 1988; Tolba and El-Kholy 1992; Haughton and Hunter 1994. Further, on the basis of the result of the biregional meeting of the World Health Organisation on health impacts of haze-related air pollution, it was concluded that the main constituent of the haze adversely affecting health is fine particulate matter (Dawud 1999).
Meanwhile, Anis stated that (2005) stating that if smoke haze with 5 micron particles emerges, it might cause eye irritation, coughs and pneumokonioses (accumulated particles in lungs tissue). Such respiratory disturbances as asthma, coughs, and excessive production of phlegm are symptoms of pneumokonioses. Even, particles of certain materials are predisposition of lung cancer.
Also Soedomo (2001) indicated that air pollution due to dust particle usually causes such chronical respiratory diseases as chronical bronchitis, bronchial asthma, lung cancer etc.
From the health perspective, PM10 is very dangerous to human health. As an example, a study conducted in Rio de Janeiro City, Brazil by Brilhante and Tambellini (2002) revealed that the climatic factor/pollution has an important relationship with the increase of respiratory diseases. Brilhante and Tambellini (2002) pointed out that from health point of view, breathable particles 10 µm or smaller in size are the most dangerous to human as they can penetrate deeply into the thoratic region of the lungs.
Another research on PM10 conducted by the Heart Effects Institute from Chambridge, Massachussets (Hunter and Hirsch 2004) showed that for people who have been in exposure to PM10, as a whole there is a proportional increase of mortality rate with the increase of each 10 mcg/m3
air from particles with PM10.
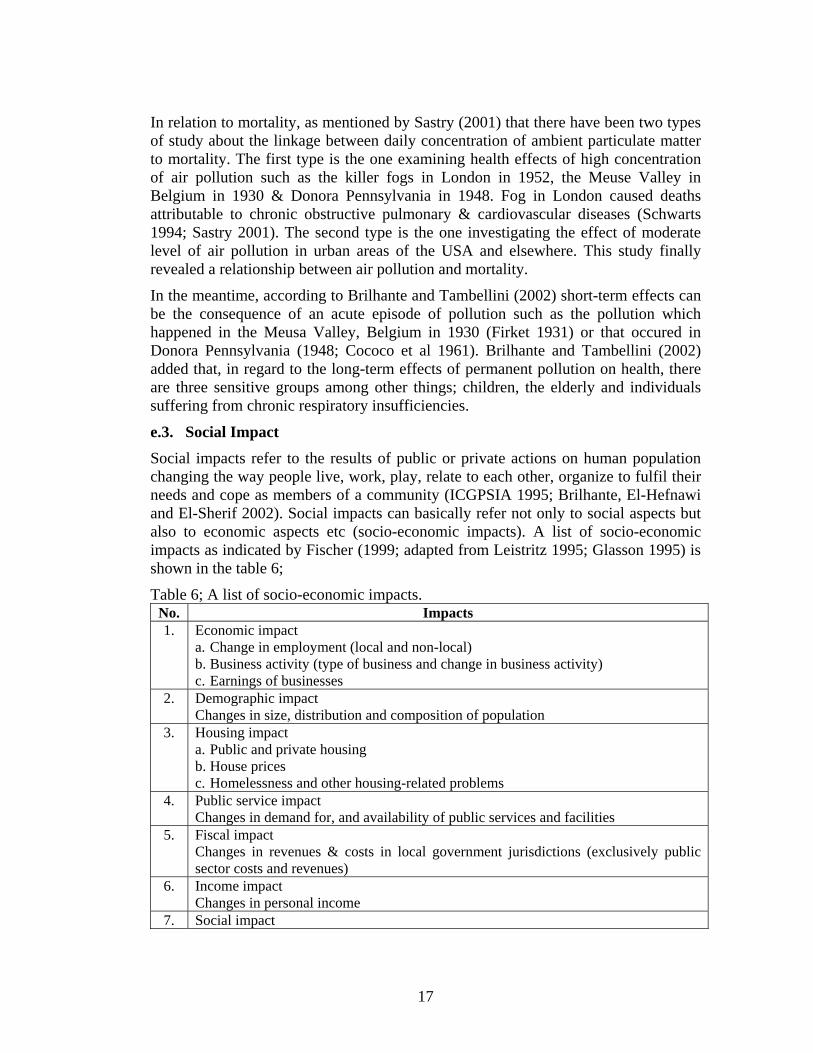
Furthermore, the relationship between PM10 concentration and general health effects can clearly be seen in the table 5;
Table 5; The relationship between PM10 and health effects. No. PM10 (µm m-3) General health effects 1. 150 Mild aggravation of symptoms 2. 350 Significants aggravation of symptoms & decreased exercise tolerance
in susceptible groups 3. 500 Premature onset of certain diseases, significant aggravation of
symptoms and decrease exercise tolerance in healthy persons 4. 600 Premature death in the ill and elderly. Healthy people will experience
adverse symptoms affecting their activities 5. 800 Acute and incapacitating symptoms experienced by significant
protions of population Source: Health guidelines for vegetation fire events of WHO (1999).
16
In relation to mortality, as mentioned by Sastry (2001) that there have been two types of study about the linkage between daily concentration of ambient particulate matter to mortality. The first type is the one examining health effects of high concentration of air pollution such as the killer fogs in London in 1952, the Meuse Valley in Belgium in 1930 & Donora Pennsylvania in 1948. Fog in London caused deaths attributable to chronic obstructive pulmonary & cardiovascular diseases (Schwarts 1994; Sastry 2001). The second type is the one investigating the effect of moderate level of air pollution in urban areas of the USA and elsewhere. This study finally revealed a relationship between air pollution and mortality.
In the meantime, according to Brilhante and Tambellini (2002) short-term effects can be the consequence of an acute episode of pollution such as the pollution which happened in the Meusa Valley, Belgium in 1930 (Firket 1931) or that occured in Donora Pennsylvania (1948; Cococo et al 1961). Brilhante and Tambellini (2002) added that, in regard to the long-term effects of permanent pollution on health, there are three sensitive groups among other things; children, the elderly and individuals suffering from chronic respiratory insufficiencies.
e.3. Social Impact Social impacts refer to the results of public or private actions on human population changing the way people live, work, play, relate to each other, organize to fulfil their needs and cope as members of a community (ICGPSIA 1995; Brilhante, El-Hefnawi and El-Sherif 2002). Social impacts can basically refer not only to social aspects but also to economic aspects etc (socio-economic impacts). A list of socio-economic impacts as indicated by Fischer (1999; adapted from Leistritz 1995; Glasson 1995) is shown in the table 6;
Table 6; A list of socio-economic impacts. No. Impacts 1. Economic impact
a. Change in employment (local and non-local) b. Business activity (type of business and change in business activity) c. Earnings of businesses
2. Demographic impact Changes in size, distribution and composition of population
3. Housing impact a. Public and private housing b. House prices c. Homelessness and other housing-related problems
4. Public service impact Changes in demand for, and availability of public services and facilities
5. Fiscal impact Changes in revenues & costs in local government jurisdictions (exclusively public sector costs and revenues)
6. Income impact Changes in personal income
7. Social impact
17
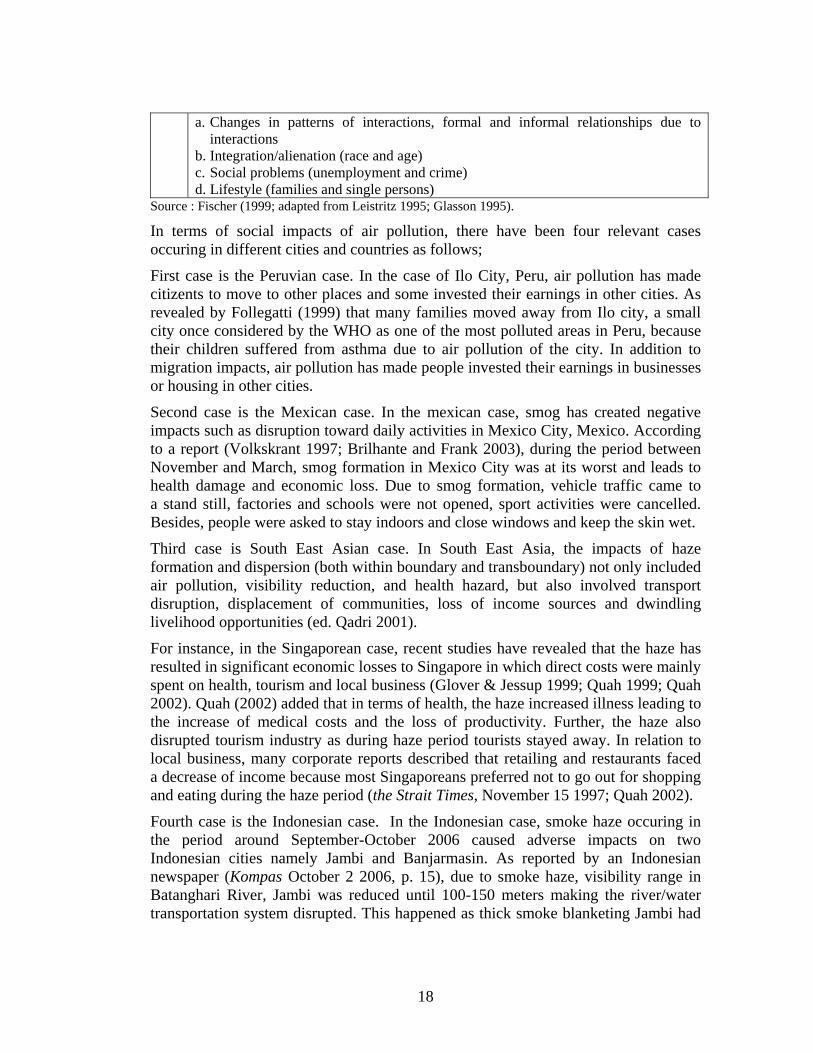
a. Changes in patterns of interactions, formal and informal relationships due to interactions
b. Integration/alienation (race and age) c. Social problems (unemployment and crime) d. Lifestyle (families and single persons)
Source : Fischer (1999; adapted from Leistritz 1995; Glasson 1995).
In terms of social impacts of air pollution, there have been four relevant cases occuring in different cities and countries as follows;
First case is the Peruvian case. In the case of Ilo City, Peru, air pollution has made citizents to move to other places and some invested their earnings in other cities. As revealed by Follegatti (1999) that many families moved away from Ilo city, a small city once considered by the WHO as one of the most polluted areas in Peru, because their children suffered from asthma due to air pollution of the city. In addition to migration impacts, air pollution has made people invested their earnings in businesses or housing in other cities.
Second case is the Mexican case. In the mexican case, smog has created negative impacts such as disruption toward daily activities in Mexico City, Mexico. According to a report (Volkskrant 1997; Brilhante and Frank 2003), during the period between November and March, smog formation in Mexico City was at its worst and leads to health damage and economic loss. Due to smog formation, vehicle traffic came to a stand still, factories and schools were not opened, sport activities were cancelled. Besides, people were asked to stay indoors and close windows and keep the skin wet.
Third case is South East Asian case. In South East Asia, the impacts of haze formation and dispersion (both within boundary and transboundary) not only included air pollution, visibility reduction, and health hazard, but also involved transport disruption, displacement of communities, loss of income sources and dwindling livelihood opportunities (ed. Qadri 2001).
For instance, in the Singaporean case, recent studies have revealed that the haze has resulted in significant economic losses to Singapore in which direct costs were mainly spent on health, tourism and local business (Glover & Jessup 1999; Quah 1999; Quah 2002). Quah (2002) added that in terms of health, the haze increased illness leading to the increase of medical costs and the loss of productivity. Further, the haze also disrupted tourism industry as during haze period tourists stayed away. In relation to local business, many corporate reports described that retailing and restaurants faced a decrease of income because most Singaporeans preferred not to go out for shopping and eating during the haze period (the Strait Times, November 15 1997; Quah 2002).
Fourth case is the Indonesian case. In the Indonesian case, smoke haze occuring in the period around September-October 2006 caused adverse impacts on two Indonesian cities namely Jambi and Banjarmasin. As reported by an Indonesian newspaper (Kompas October 2 2006, p. 15), due to smoke haze, visibility range in Batanghari River, Jambi was reduced until 100-150 meters making the river/water transportation system disrupted. This happened as thick smoke blanketing Jambi had
18
made the condition of Jambi dark. Meanwhile, in Banjarmasin, smoke haze resulted in ash rain soiling houses, offices, shops & places for religious activities.
f. Air Quality
f.1. Definition Environmental quality is defined by Brilhante & Frank (2003 p. 55) as ‘the quality that does not cause hazards or risks to the environmental media (air, water, soil and biota), society, health, human beings and ecosystems’. Meanwhile, according to Porteous (2000), air quality refers to concentration of one or more pollutants in air.
f.2. Parameters Generally, there are some major pollutants measured for the purpose of air quality control namely; CO, NO2, O3, SO2, PM10 (Particulate Matter 10) and lead (Brilhante and Frank 2003). Brilhante and Frank (2003) added that in some countries a Pollutant Standar Index (PSI), which is developed on the basis of the above six pollutants, is also used to measure the air quality.
In the meantime, to measure the level of air pollution in Indonesia, according to Jayachandran (2005), there are two common measures usually employed among other things; Particulate Matter 10 (PM10) and Pollution Standard Index (PSI). Specifically parameters used in the PSI of Indonesia are stipulated in the letter of the head of Environmental Impact Agency of Indonesia No. 107/1997 (Keputusan Kepala Bapedal No. 107 tahun 1997) about the calculation, report & information of Pollution Standard Index.
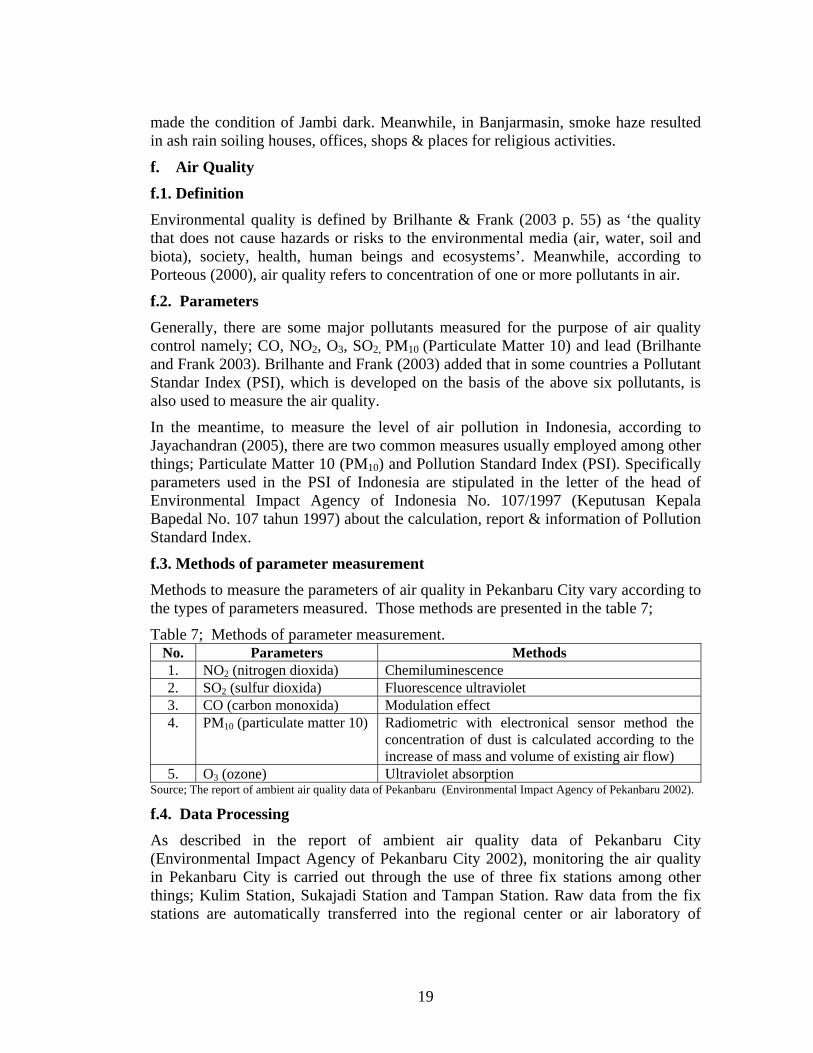
f.3. Methods of parameter measurement Methods to measure the parameters of air quality in Pekanbaru City vary according to the types of parameters measured. Those methods are presented in the table 7;
Table 7; Methods of parameter measurement. No. Parameters Methods 1. NO2 (nitrogen dioxida) Chemiluminescence 2. SO2 (sulfur dioxida) Fluorescence ultraviolet 3. CO (carbon monoxida) Modulation effect 4. PM10 (particulate matter 10) Radiometric with electronical sensor method the
concentration of dust is calculated according to the increase of mass and volume of existing air flow)
5. O3 (ozone) Ultraviolet absorption Source; The report of ambient air quality data of Pekanbaru (Environmental Impact Agency of Pekanbaru 2002).
f.4. Data Processing As described in the report of ambient air quality data of Pekanbaru City (Environmental Impact Agency of Pekanbaru City 2002), monitoring the air quality in Pekanbaru City is carried out through the use of three fix stations among other things; Kulim Station, Sukajadi Station and Tampan Station. Raw data from the fix stations are automatically transferred into the regional center or air laboratory of
19
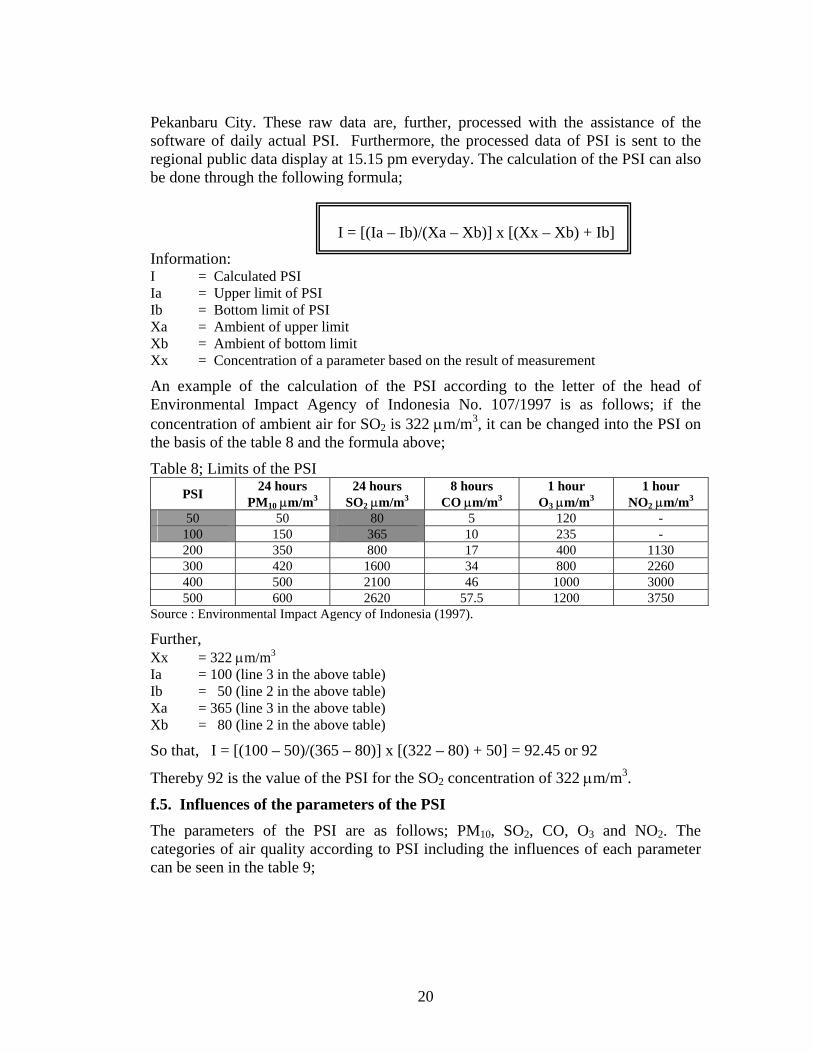
Pekanbaru City. These raw data are, further, processed with the assistance of the software of daily actual PSI. Furthermore, the processed data of PSI is sent to the regional public data display at 15.15 pm everyday. The calculation of the PSI can also be done through the following formula; I = [(Ia – Ib)/(Xa – Xb)] x [(Xx – Xb) + Ib]
Information: I = Calculated PSI Ia = Upper limit of PSI Ib = Bottom limit of PSI Xa = Ambient of upper limit Xb = Ambient of bottom limit Xx = Concentration of a parameter based on the result of measurement An example of the calculation of the PSI according to the letter of the head of Environmental Impact Agency of Indonesia No. 107/1997 is as follows; if the concentration of ambient air for SO2 is 322 µm/m3, it can be changed into the PSI on the basis of the table 8 and the formula above;
Table 8; Limits of the PSI PSI 24 hours
PM10 µm/m324 hours
SO2 µm/m38 hours
CO µm/m31 hour
O3 µm/m31 hour
NO2 µm/m3
50 50 80 5 120 - 100 150 365 10 235 - 200 350 800 17 400 1130 300 420 1600 34 800 2260 400 500 2100 46 1000 3000 500 600 2620 57.5 1200 3750
Source : Environmental Impact Agency of Indonesia (1997).
Further, Xx = 322 µm/m3
Ia = 100 (line 3 in the above table) Ib = 50 (line 2 in the above table) Xa = 365 (line 3 in the above table) Xb = 80 (line 2 in the above table) So that, I = [(100 – 50)/(365 – 80)] x [(322 – 80) + 50] = 92.45 or 92
Thereby 92 is the value of the PSI for the SO2 concentration of 322 µm/m3.
f.5. Influences of the parameters of the PSI The parameters of the PSI are as follows; PM10, SO2, CO, O3 and NO2. The categories of air quality according to PSI including the influences of each parameter can be seen in the table 9;
20
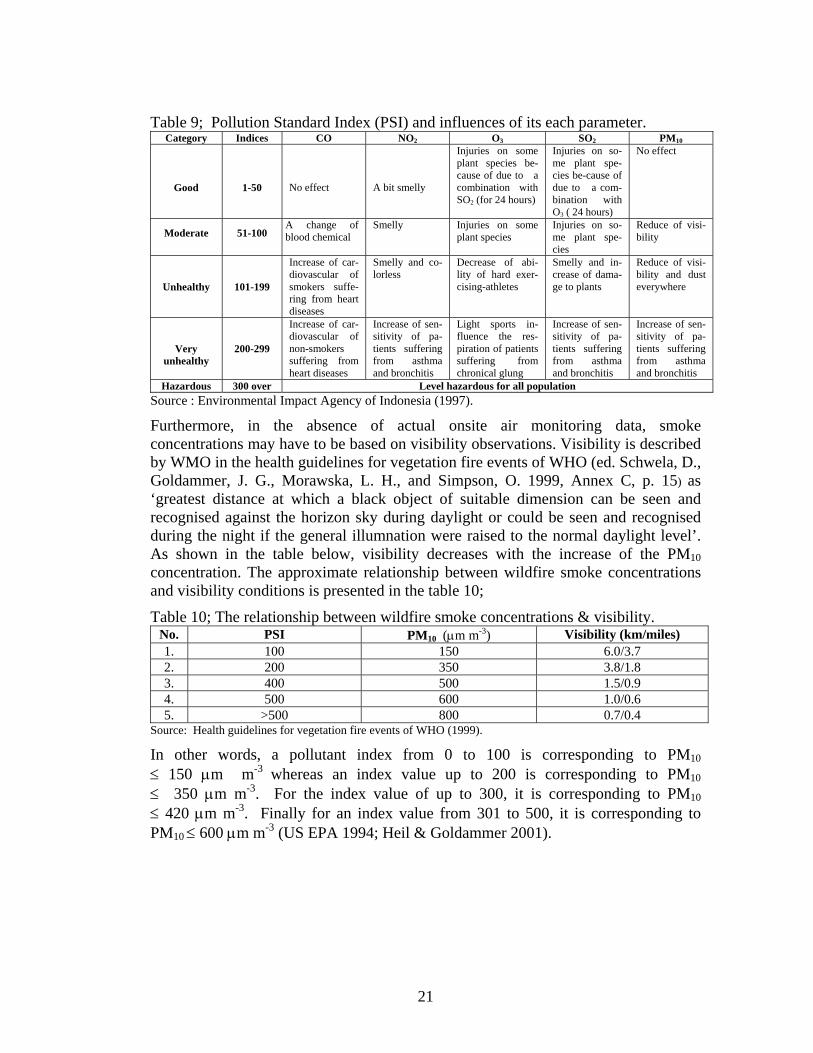
Table 9; Pollution Standard Index (PSI) and influences of its each parameter. Category Indices CO NO2 O3 SO2 PM10
Good
1-50
No effect
A bit smelly
Injuries on some plant species be-cause of due to a combination with SO2 (for 24 hours)
Injuries on so-me plant spe-cies be-cause of due to a com-bination with O3 ( 24 hours)
No effect
Moderate 51-100 A change of blood chemical
Smelly Injuries on some plant species
Injuries on so-me plant spe-cies
Reduce of visi-bility
Unhealthy
101-199
Increase of car-diovascular of smokers suffe-ring from heart diseases
Smelly and co-lorless
Decrease of abi-lity of hard exer-cising-athletes
Smelly and in-crease of dama-ge to plants
Reduce of visi-bility and dust everywhere
Very unhealthy
200-299
Increase of car-diovascular of non-smokers suffering from heart diseases
Increase of sen-sitivity of pa-tients suffering from asthma and bronchitis
Light sports in-fluence the res-piration of patients suffering from chronical glung
Increase of sen-sitivity of pa-tients suffering from asthma and bronchitis
Increase of sen-sitivity of pa-tients suffering from asthma and bronchitis
Hazardous 300 over Level hazardous for all population Source : Environmental Impact Agency of Indonesia (1997). Furthermore, in the absence of actual onsite air monitoring data, smoke concentrations may have to be based on visibility observations. Visibility is described by WMO in the health guidelines for vegetation fire events of WHO (ed. Schwela, D., Goldammer, J. G., Morawska, L. H., and Simpson, O. 1999, Annex C, p. 15) as ‘greatest distance at which a black object of suitable dimension can be seen and recognised against the horizon sky during daylight or could be seen and recognised during the night if the general illumnation were raised to the normal daylight level’. As shown in the table below, visibility decreases with the increase of the PM10 concentration. The approximate relationship between wildfire smoke concentrations and visibility conditions is presented in the table 10;
Table 10; The relationship between wildfire smoke concentrations & visibility. No. PSI PM10 (µm m-3) Visibility (km/miles) 1. 100 150 6.0/3.7 2. 200 350 3.8/1.8 3. 400 500 1.5/0.9 4. 500 600 1.0/0.6 5. >500 800 0.7/0.4
Source: Health guidelines for vegetation fire events of WHO (1999).
In other words, a pollutant index from 0 to 100 is corresponding to PM10 ≤ 150 µm m-3 whereas an index value up to 200 is corresponding to PM10 ≤ 350 µm m-3. For the index value of up to 300, it is corresponding to PM10 ≤ 420 µm m-3. Finally for an index value from 301 to 500, it is corresponding to PM10 ≤ 600 µm m-3 (US EPA 1994; Heil & Goldammer 2001).
21
g. Mitigation Measures Mitigation measures are defined by Brilhante, El-Hefnawi and El-Sherif (2002 p. 13) as ‘additional measures for limiting negative environmental impacts or compensating for them’. With respect to mitigation measures for health effects of air pollution, the World Health Organization (1999) recommends some measures as follows; remaining indoors, modifying personal lifestyle e.g. reduction of physical activities and restriction of cigarette smoking, using air cleaners to households with members vulnerable to effects of deterioration of air quality, using masks to people involved in outdoor activities during air pollution periods, taking outdoor precautionary measures e.g. the provision of suitable respirators for workers for outdoor work by employers, evacuating susceptible people to emergency shelters with effective air conditioning and particle filtration and closing or curtailing school and business activities.
Other examples of health impact mitigation measures undertaken during 1997 haze are also described by Dawud (1999) such as campaigns to enhance the awareness of community by the Directorate General of Communicable Disease Control and Environmental Health of Indonesia’s Health Ministry and health professional associations. In addition, this directorate instructed provincial health offices to monitor daily air quality, strengthen surveillance for Acute Respiratory Infection (ARI), asthmatic bronchitis & eye irritation, protect high risk groups (babies, the elderly and pregnant women) by introducing and distributing masks, alerting local government and private health sectors to give 24-hour services. In case of emergency, the local authority could immediately close schools and offices activities and to evacuate the high risk groups to safer places.
3.4. Perception
In a narrow sense, perception can be defined as how someone sees something whereas in a broad sense, perception can defined as how someone perceives or interpretes something (Leavitt 1978; Sobur 2003).
Perception, as stated by Walgito (1999), is a process of organizing and interpreting a stimulus received by an organism or individual so that it becomes something meaningful and activities integrated into the individual. He, further, added that in order for a stimulus to be able to be perceived, it must be strong enough.
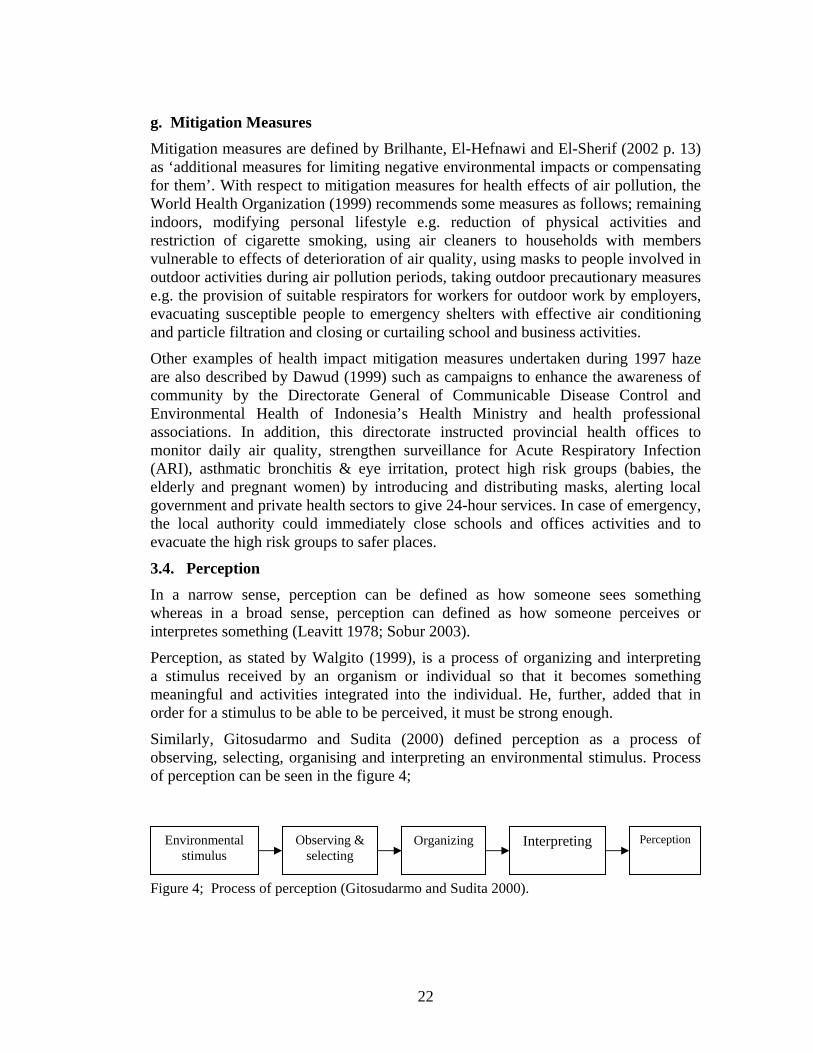
Similarly, Gitosudarmo and Sudita (2000) defined perception as a process of observing, selecting, organising and interpreting an environmental stimulus. Process of perception can be seen in the figure 4;
Perception Interpreting Organizing Observing &
selecting Environmental
stimulus
Figure 4; Process of perception (Gitosudarmo and Sudita 2000).
22
Another definition was put forward by Schiff (1980; Suswati and Taneo 2004) stating that perception is an awareness toward the world and its characteristics, objects, places or events.
Meanwhile, according to Bennet (1989; Suswati and Taneo 2004), perception is subjective instead of objective.
Walgito (1999) added that perception between one individual with another might be different due to different experiences, different thinking ability and different reference.
Perception is essentially influenced by four factors as revealed by Irwan et al (1994; Suswati and Taneo 2004) as follows; selective attention, characteristics of stimulus, individual need and values and previous experience. Meanwhile, Walgito (1999) mentioned that factors influencing perception are external factor (stimulus and environment factors) and internal factor (individual factor).
Another opinion mentioned that factors influencing perception can be grouped into four categories (Rakhmat 1994; Krech and Crutchfield 1975; Sobur 2003); 1. Functional factor; these factors result from needs, happiness, service and previous
experiences. 2. Structural factor; these factors result from stimulus forms, neutral effects of nerve
system of an individual. 3. Situational factor; these factors are mostly related to non verbal language. 4. Personal factor; these factors include experience, motivation and personality
(Rakhmat 1994).
3.5. Conceptual Framework of Smoke Haze Pollution Referring to the literature review, a conceptual framework of smoke haze pollution impacts for the research was formulated. The objective of this conceptual framework is to try to explain logical relations among notions/concepts, for instance smoke haze pollution, urban environment, smoke haze pollution impacts etc, being engaged in this research. The relation of those notions/concepts is elaborated as follows;
Sources of air pollution/smoke haze in Pekanbaru City might be from anthropogenic or natural sources. Anthropogenic sources can be intentional forest and land fire (human activities), automobiles and industries etc. On the other hand, natural sources can be accidental fires in forests, etc. Furthemore, pollutants emitted from those sources of air pollution/smoke haze either anthropogenic or natural sources, including forest and land fire can be CO, NO2, O3, SO2 and PM10. All these pollutants will, in turn, contribute to the occurrence of smoke haze pollution leading to the deterioration of air quality of Pekanbaru City. For air pollutants generated from a source located out of Pekanbaru City e.g. forest and land fire, the role of wind will be important in transporting smoke/air pollutants to the city. For the purpose of this research, it is important to define the smoke haze pollution. With respect to this case, there are two relevant definitions that can be employed namely the definition of air pollution according the governmental regulation No. 41/1999 about air pollution control
23
defining air pollution as the entering of substances and energy from other components into free air due to human activities which make the air quality falls into a level at which free air can not fulfil its function anymore.
Another definition was by Weber (1982; Elsom 1992 p. 13) who defined the atmospheric pollution as ‘the presence of substances in the ambient atmosphere, resulting from the activities of man or from natural processes, causing adverse effects to man and environment’. Meanwhile, haze is a suspension of extremely small and dry particles. Particles can be smoke which is a visible aerosol resulting from combustion. Smoke itself is viewed as one of the main particles normally emerging during smoke haze. For this reason, smoke haze pollution is demarcated, by combining those definitions above, ‘the entering and suspension of smoke or other particles/substances in the free air, due to the activities of man or natural processes leading to the fall of air quality into a level at which free air can not fulfil its function (deterioration of air quality) & causing adverse impacts on man and environment’.
Deterioration of air quality in this research is defined as the state of air quality in which the air quality is already categorized unhealthy, very unhealthy or hazardous measured by the PSI. To measure the deterioration of air quality due to smoke haze pollution in Pekanbaru City, the Pollutant Standard Index (PSI), a composite measure of carbon monoxide, nitrogen dioxide, sodium dioxide, ozone and PM10, will be used as the main indicator of smoke haze pollution because the PSI measures not only PM10 but also other parameters such as CO, NO2, O3, SO2. In the meantime, smoke haze pollution can affect urban environment. Urban environment as defined by Nunan and Satterthwaite (1999, p. 1) is ‘a complex mix of natural elements (including air, water, land, climate, flora and fauna) and the built environment (ie. a physical environment constructed or modified for human habitation & activity encompassing buildings, infrastructure and urban open spaces)’. But, this definition does not explicitly mention human as part of urban environment. Meanwhile, according to Srinivas (2000; Prasetyo 2001), urban environment has three main components; resources, processes and effects. Human resource itself belongs to resource component. Thereby, referring to this notion, in this research, the scope of urban environment will not simply be limited to environment aspect but also to include human aspect.
In terms of impacts on urban environment, smoke haze pollution can cause significant impacts, impacts which are considered important by decision makers/scientists and the public, on biotic and abiotic environments as well as on human. Impacts on human itself consist of health and social impacts. In this research, the term social impacts are flexibly used. It refers not only to social impacts but also to social economy impacts. Therefore, to identify those impacts, the research will mainly be based not only on the opinions/views of experts (decision makers (government)/scientists (lecturers from university) but also on the perception of citizens (the public) because perception of citizents is a local knowledge needed to understand the major perceived impacts of smoke haze. The conceptual framework is shown in the figure 5;
24
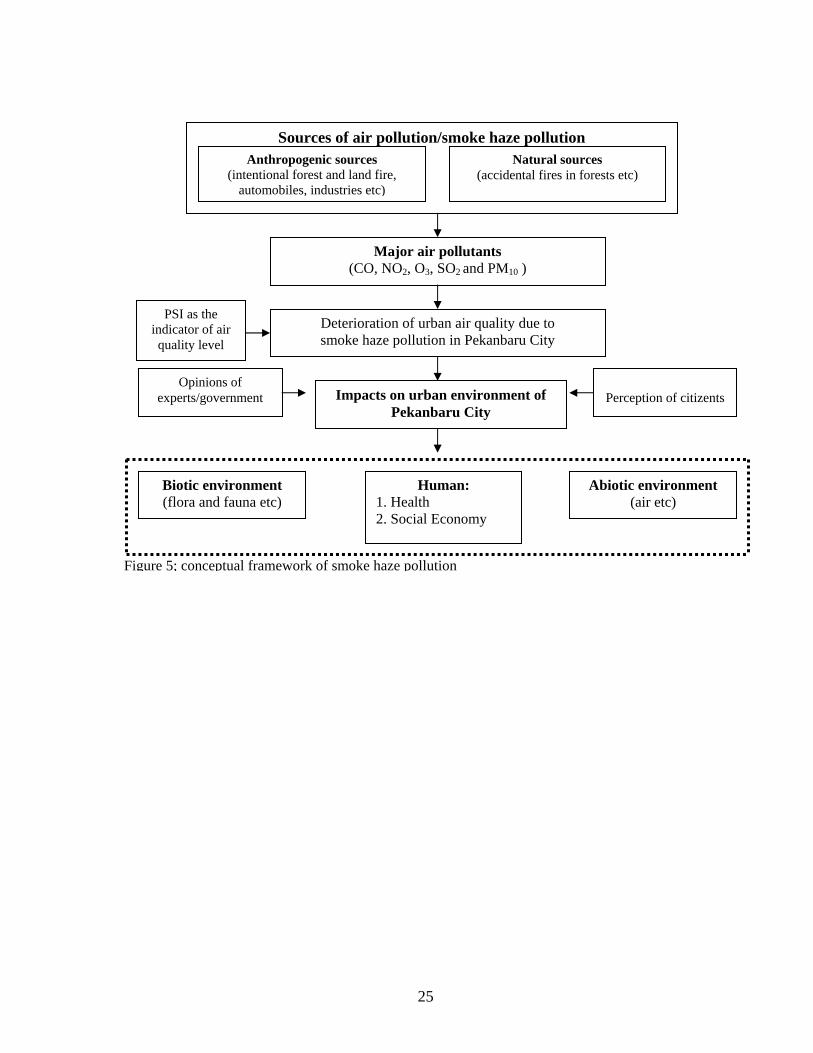
Sources of air pollution/smoke haze pollution
Natural sources (accidental fires in forests etc) (in
PSI as the indicator of air quality level
Opinions oexperts/governm
Biotic enviro(flora and fau
Anthropogenic sources tentional forest and land fire,
automobiles, industries etc)
Deterioration of urban air quality due to smoke haze pollution in Pekanbaru City
Major air pollutants (CO, NO2, O3, SO2 and PM10 )
f ent
Perception of citizents Impacts on urban environment of
Pekanbaru City
nment na etc)
Human: 1. Health 2. Social Economy
Abiotic environment (air etc)
Figure 5; conceptual framework of smoke haze pollution25
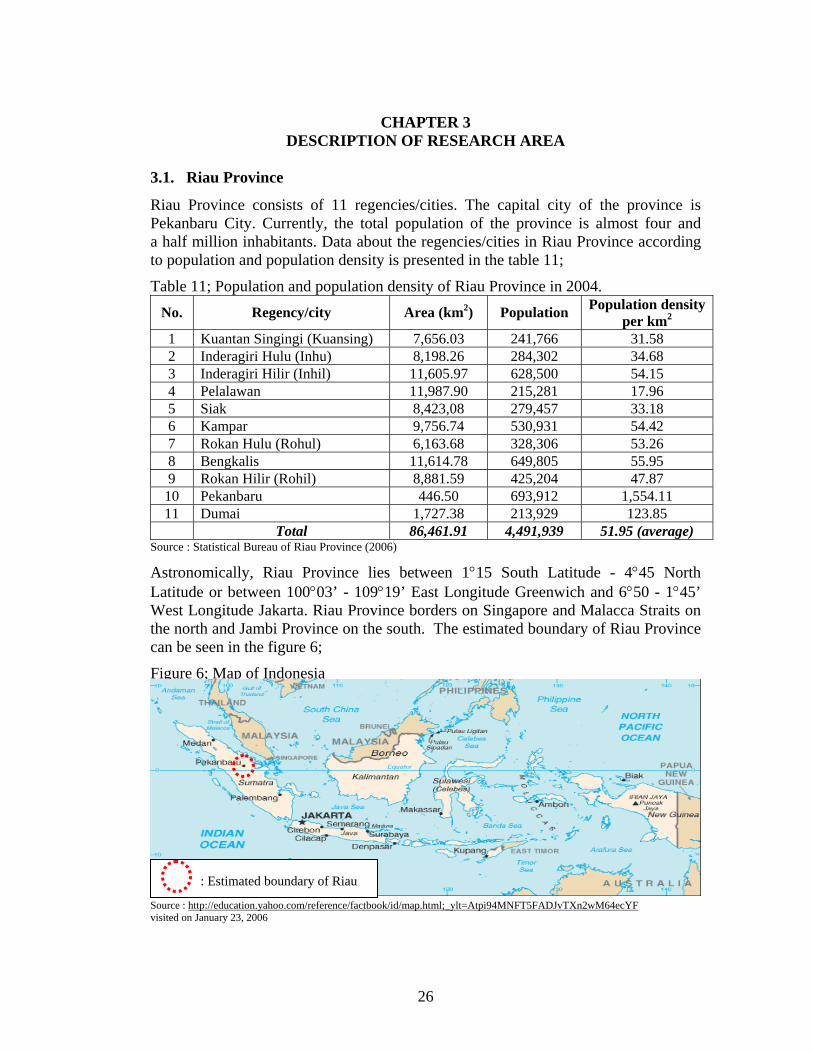
CHAPTER 3 DESCRIPTION OF RESEARCH AREA
3.1. Riau Province
Riau Province consists of 11 regencies/cities. The capital city of the province is Pekanbaru City. Currently, the total population of the province is almost four and a half million inhabitants. Data about the regencies/cities in Riau Province according to population and population density is presented in the table 11;
Table 11; Population and population density of Riau Province in 2004. No. Regency/city Area (km2) Population Population density
per km2
1 Kuantan Singingi (Kuansing) 7,656.03 241,766 31.58 2 Inderagiri Hulu (Inhu) 8,198.26 284,302 34.68 3 Inderagiri Hilir (Inhil) 11,605.97 628,500 54.15 4 Pelalawan 11,987.90 215,281 17.96 5 Siak 8,423,08 279,457 33.18 6 Kampar 9,756.74 530,931 54.42 7 Rokan Hulu (Rohul) 6,163.68 328,306 53.26 8 Bengkalis 11,614.78 649,805 55.95 9 Rokan Hilir (Rohil) 8,881.59 425,204 47.87
10 Pekanbaru 446.50 693,912 1,554.11 11 Dumai 1,727.38 213,929 123.85
Total 86,461.91 4,491,939 51.95 (average) Source : Statistical Bureau of Riau Province (2006)
Astronomically, Riau Province lies between 1°15 South Latitude - 4°45 North Latitude or between 100°03’ - 109°19’ East Longitude Greenwich and 6°50 - 1°45’ West Longitude Jakarta. Riau Province borders on Singapore and Malacca Straits on the north and Jambi Province on the south. The estimated boundary of Riau Province can be seen in the figure 6;
Figure 6; Map of Indonesia
: Estimated boundary of Riau
Source : http://education.yahoo.com/reference/factbook/id/map.html;_ylt=Atpi94MNFT5FADJvTXn2wM64ecYF visited on January 23, 2006
26
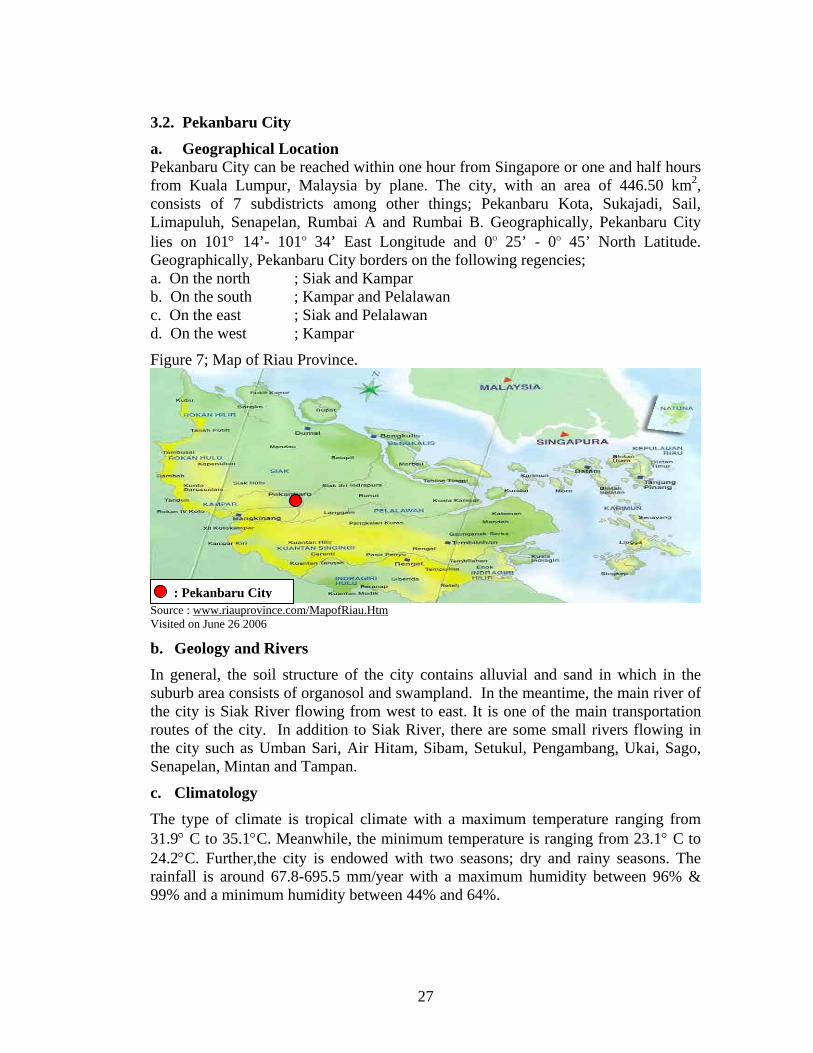
3.2. Pekanbaru City
a. Geographical Location Pekanbaru City can be reached within one hour from Singapore or one and half hours from Kuala Lumpur, Malaysia by plane. The city, with an area of 446.50 km2, consists of 7 subdistricts among other things; Pekanbaru Kota, Sukajadi, Sail, Limapuluh, Senapelan, Rumbai A and Rumbai B. Geographically, Pekanbaru City lies on 101° 14’- 101º 34’ East Longitude and 0º 25’ - 0º 45’ North Latitude. Geographically, Pekanbaru City borders on the following regencies; a. On the north ; Siak and Kampar b. On the south ; Kampar and Pelalawan c. On the east ; Siak and Pelalawan d. On the west ; Kampar
Figure 7; Map of Riau Province.
S
V
bIstrtS
cT32r9
: Pekanbaru City
ource : www.riauprovince.com/MapofRiau.Htm isited on June 26 2006. Geology and Rivers n general, the soil structure of the city contains alluvial and sand in which in the uburb area consists of organosol and swampland. In the meantime, the main river of he city is Siak River flowing from west to east. It is one of the main transportation outes of the city. In addition to Siak River, there are some small rivers flowing in he city such as Umban Sari, Air Hitam, Sibam, Setukul, Pengambang, Ukai, Sago, enapelan, Mintan and Tampan.
. Climatology he type of climate is tropical climate with a maximum temperature ranging from 1.9° C to 35.1°C. Meanwhile, the minimum temperature is ranging from 23.1° C to 4.2°C. Further,the city is endowed with two seasons; dry and rainy seasons. The ainfall is around 67.8-695.5 mm/year with a maximum humidity between 96% & 9% and a minimum humidity between 44% and 64%.
27
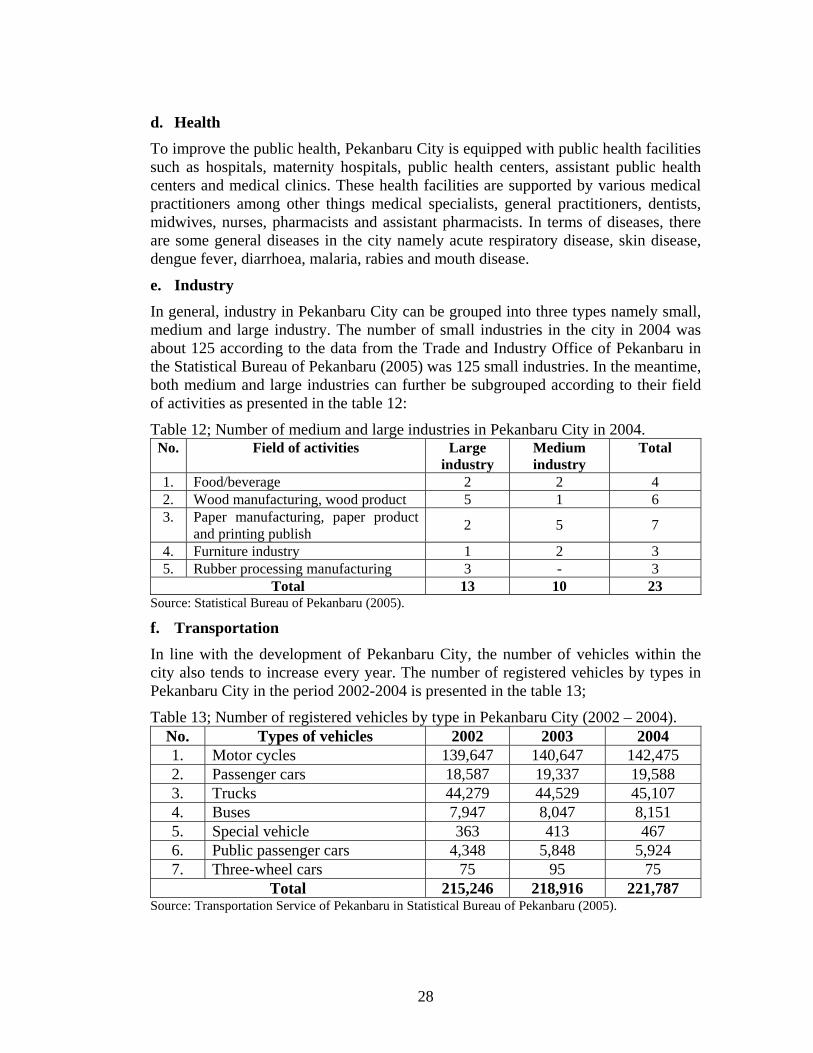
d. Health To improve the public health, Pekanbaru City is equipped with public health facilities such as hospitals, maternity hospitals, public health centers, assistant public health centers and medical clinics. These health facilities are supported by various medical practitioners among other things medical specialists, general practitioners, dentists, midwives, nurses, pharmacists and assistant pharmacists. In terms of diseases, there are some general diseases in the city namely acute respiratory disease, skin disease, dengue fever, diarrhoea, malaria, rabies and mouth disease.
e. Industry In general, industry in Pekanbaru City can be grouped into three types namely small, medium and large industry. The number of small industries in the city in 2004 was about 125 according to the data from the Trade and Industry Office of Pekanbaru in the Statistical Bureau of Pekanbaru (2005) was 125 small industries. In the meantime, both medium and large industries can further be subgrouped according to their field of activities as presented in the table 12:
Table 12; Number of medium and large industries in Pekanbaru City in 2004. No. Field of activities Large
industry Medium industry
Total
1. Food/beverage 2 2 4 2. Wood manufacturing, wood product 5 1 6 3. Paper manufacturing, paper product
and printing publish 2 5 7
4. Furniture industry 1 2 3 5. Rubber processing manufacturing 3 - 3
Total 13 10 23 Source: Statistical Bureau of Pekanbaru (2005).
f. Transportation In line with the development of Pekanbaru City, the number of vehicles within the city also tends to increase every year. The number of registered vehicles by types in Pekanbaru City in the period 2002-2004 is presented in the table 13;
Table 13; Number of registered vehicles by type in Pekanbaru City (2002 – 2004). No. Types of vehicles 2002 2003 2004 1. Motor cycles 139,647 140,647 142,475 2. Passenger cars 18,587 19,337 19,588 3. Trucks 44,279 44,529 45,107 4. Buses 7,947 8,047 8,151 5. Special vehicle 363 413 467 6. Public passenger cars 4,348 5,848 5,924 7. Three-wheel cars 75 95 75
Total 215,246 218,916 221,787 Source: Transportation Service of Pekanbaru in Statistical Bureau of Pekanbaru (2005).
28
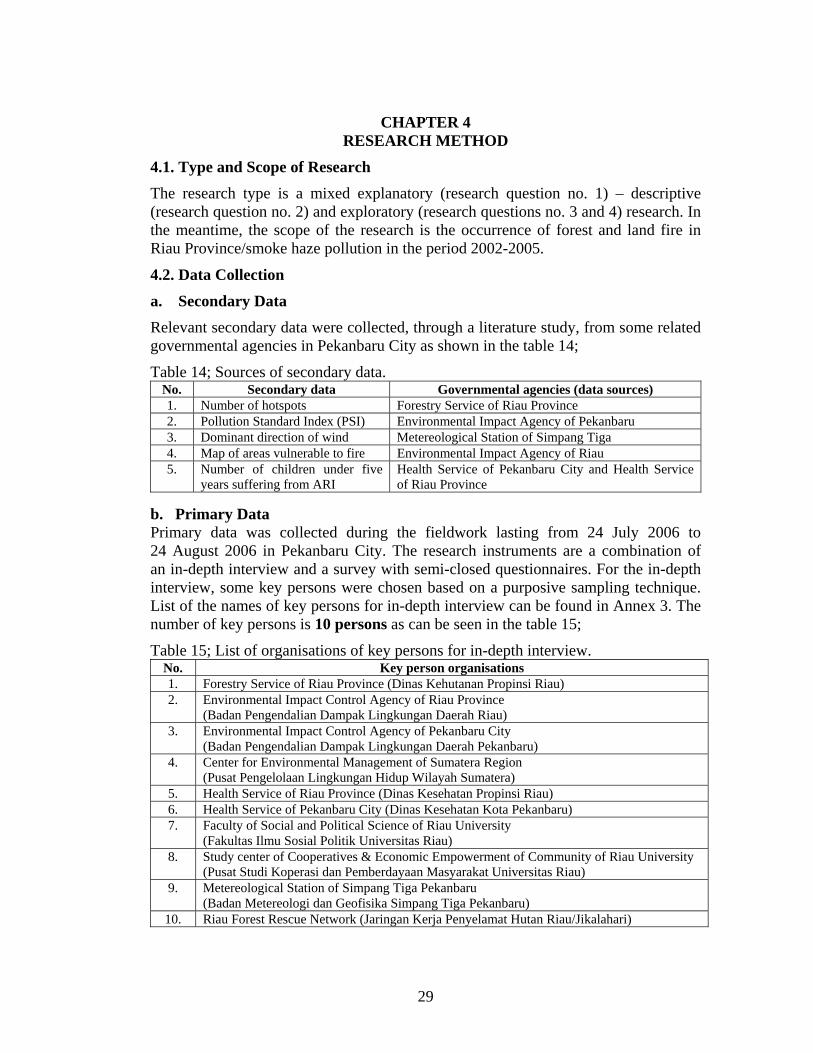
CHAPTER 4 RESEARCH METHOD
4.1. Type and Scope of Research The research type is a mixed explanatory (research question no. 1) – descriptive (research question no. 2) and exploratory (research questions no. 3 and 4) research. In the meantime, the scope of the research is the occurrence of forest and land fire in Riau Province/smoke haze pollution in the period 2002-2005.
4.2. Data Collection
a. Secondary Data Relevant secondary data were collected, through a literature study, from some related governmental agencies in Pekanbaru City as shown in the table 14;
Table 14; Sources of secondary data. No. Secondary data Governmental agencies (data sources) 1. Number of hotspots Forestry Service of Riau Province 2. Pollution Standard Index (PSI) Environmental Impact Agency of Pekanbaru 3. Dominant direction of wind Metereological Station of Simpang Tiga 4. Map of areas vulnerable to fire Environmental Impact Agency of Riau 5. Number of children under five
years suffering from ARI Health Service of Pekanbaru City and Health Service of Riau Province
b. Primary Data Primary data was collected during the fieldwork lasting from 24 July 2006 to 24 August 2006 in Pekanbaru City. The research instruments are a combination of an in-depth interview and a survey with semi-closed questionnaires. For the in-depth interview, some key persons were chosen based on a purposive sampling technique. List of the names of key persons for in-depth interview can be found in Annex 3. The number of key persons is 10 persons as can be seen in the table 15;
Table 15; List of organisations of key persons for in-depth interview. No. Key person organisations 1. Forestry Service of Riau Province (Dinas Kehutanan Propinsi Riau) 2. Environmental Impact Control Agency of Riau Province
(Badan Pengendalian Dampak Lingkungan Daerah Riau) 3. Environmental Impact Control Agency of Pekanbaru City
(Badan Pengendalian Dampak Lingkungan Daerah Pekanbaru) 4. Center for Environmental Management of Sumatera Region
(Pusat Pengelolaan Lingkungan Hidup Wilayah Sumatera) 5. Health Service of Riau Province (Dinas Kesehatan Propinsi Riau) 6. Health Service of Pekanbaru City (Dinas Kesehatan Kota Pekanbaru) 7. Faculty of Social and Political Science of Riau University
(Fakultas Ilmu Sosial Politik Universitas Riau) 8. Study center of Cooperatives & Economic Empowerment of Community of Riau University
(Pusat Studi Koperasi dan Pemberdayaan Masyarakat Universitas Riau) 9. Metereological Station of Simpang Tiga Pekanbaru
(Badan Metereologi dan Geofisika Simpang Tiga Pekanbaru) 10. Riau Forest Rescue Network (Jaringan Kerja Penyelamat Hutan Riau/Jikalahari)
29
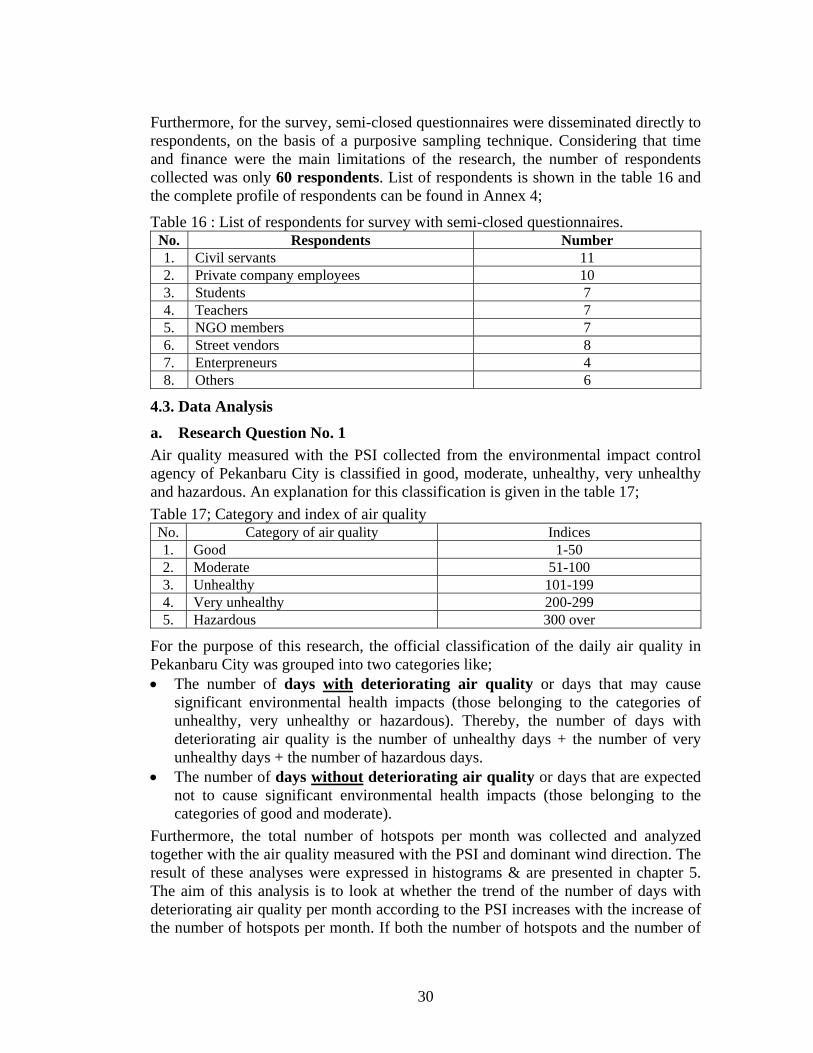
Furthermore, for the survey, semi-closed questionnaires were disseminated directly to respondents, on the basis of a purposive sampling technique. Considering that time and finance were the main limitations of the research, the number of respondents collected was only 60 respondents. List of respondents is shown in the table 16 and the complete profile of respondents can be found in Annex 4;
Table 16 : List of respondents for survey with semi-closed questionnaires. No. Respondents Number 1. Civil servants 11 2. Private company employees 10 3. Students 7 4. Teachers 7 5. NGO members 7 6. Street vendors 8 7. Enterpreneurs 4 8. Others 6
4.3. Data Analysis
a. Research Question No. 1 Air quality measured with the PSI collected from the environmental impact control agency of Pekanbaru City is classified in good, moderate, unhealthy, very unhealthy and hazardous. An explanation for this classification is given in the table 17; Table 17; Category and index of air quality No. Category of air quality Indices 1. Good 1-50 2. Moderate 51-100 3. Unhealthy 101-199 4. Very unhealthy 200-299 5. Hazardous 300 over
For the purpose of this research, the official classification of the daily air quality in Pekanbaru City was grouped into two categories like; • The number of days with deteriorating air quality or days that may cause
significant environmental health impacts (those belonging to the categories of unhealthy, very unhealthy or hazardous). Thereby, the number of days with deteriorating air quality is the number of unhealthy days + the number of very unhealthy days + the number of hazardous days.
• The number of days without deteriorating air quality or days that are expected not to cause significant environmental health impacts (those belonging to the categories of good and moderate).
Furthermore, the total number of hotspots per month was collected and analyzed together with the air quality measured with the PSI and dominant wind direction. The result of these analyses were expressed in histograms & are presented in chapter 5. The aim of this analysis is to look at whether the trend of the number of days with deteriorating air quality per month according to the PSI increases with the increase of the number of hotspots per month. If both the number of hotspots and the number of
30
days with deteriorating air quality show the same trends, either increasing or decreasing, in the same time, and dominant wind direction is in favour of, it can be concluded that the increase of forest and land fire occurrence as well as wind direction have contributed to the deterioration of air quality in Pekanbaru or the hypothesis “the increase of forest and land fire occurrence in Riau Province as well as wind direction have contributed to the deterioration of air quality in Pekanbaru City” is accepted and vice versa. This trend analysis is further confronted with a qualitative analysis of the opinions of experts who were interviewed during the fieldwork.
b. Research Question No. 2 The questionnaires and interview results were organized in tables and percentages were calculated for the answers of the questionnaires. List of interview questions and questionnaire can be found in the annex 1 and annex 2.
c. Research Questions No. 3 and 4
Data and information collected from the relevant key persons were analyzed qualitatively through identification and categorisation.
4.4. Unit of Analysis, Variables and Indicators Units of analysis of this research are the event of forest and land fire in Riau Province in the period 2002-2005 and the information collected from respondents and key persons. Meanwhile, the variables and indicators for the hypothesis are as follows; a. Fire occurrence with the indicator; Number of hotspots in Riau. b. Wind direction with the indicator; Dominant wind direction in Pekanbaru City c. Deterioration of air quality with the indicator; Number of days with deteriorating
air quality or days categorized unhealthy, very unhealthy or hazardous days measured with the PSI.
4.5. Working/Operational Definitions a. The term smoke haze, coming from two words smoke and haze, can literally be
translated into Indonesian language namely ‘kabut asap’. Basically, there are some other similar terms such as haze or smog (smoke and fog), but in this research, the term smoke haze pollution is preferred to be used consistently.
b. Smoke haze pollution is ‘the entering & suspension of smoke or other particles/substances in the free air, due to activities of man or natural processes leading to the fall of air quality into a level at which free air can not fulfil its function (deterioration of air quality) & causing impacts on man & environment.
c. Forest & land fire is defined as a fire occurrence within forest or land indicated by the existence of a hotspot (an indicator of an occurrence of forest & land fire).
d. Deterioration of air quality is the state of air quality in which the air quality is already categorized unhealthy, very unhealthy or hazardous measured by the PSI.
e. Pollutant Standard Index (PSI) is a composite measure of carbon monoxide, nitrogen dioxide, sodium dioxide, ozone and PM10.
f. Significant impacts are demarcated as the impacts which are considered important by both experts and citizents.
31
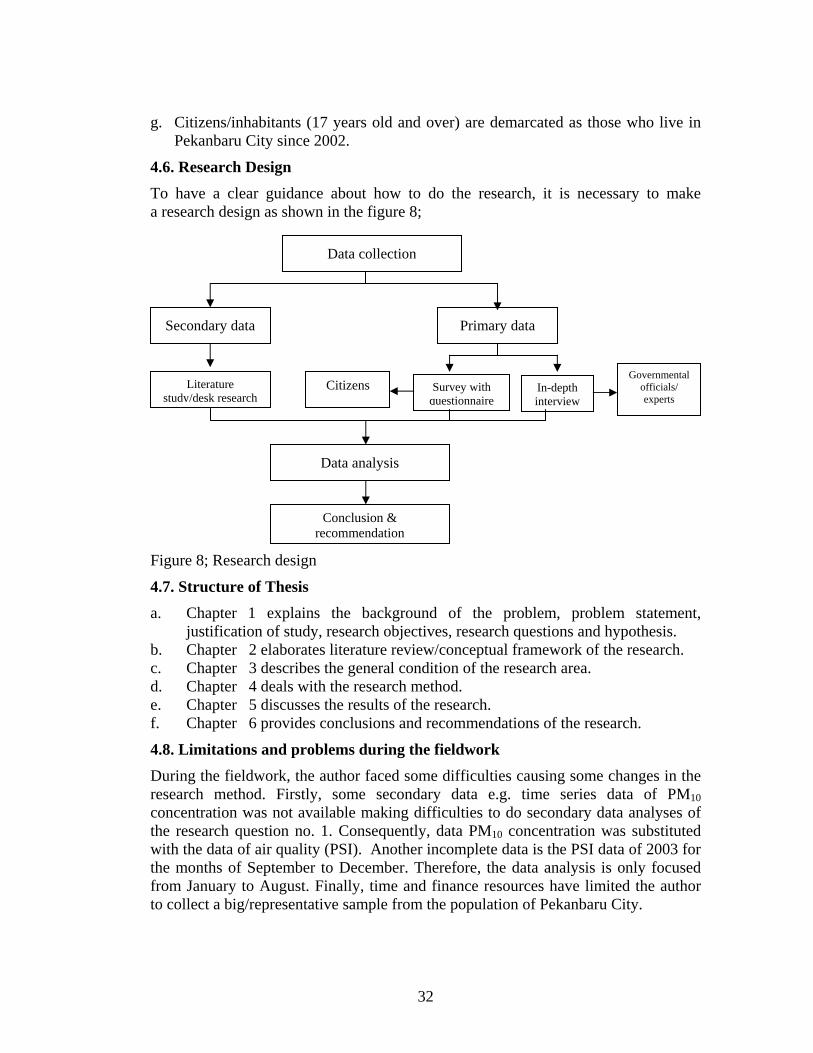
g. Citizens/inhabitants (17 years old and over) are demarcated as those who live in Pekanbaru City since 2002.
4.6. Research Design To have a clear guidance about how to do the research, it is necessary to make a research design as shown in the figure 8;
Survey with questionnaire
Governmental officials/ experts
In-depth interview stud
Citizens
Secondary data Primary data
Data collection
Figu
4.7. a.
b. c. d. e. f. 4.8. Durireseaconcthe rwiththe mfromto co
Literature y/desk research
Data analysis
n
re 8; Research design
Structure of Thesis Chapter 1 explainjustification of studyChapter 2 elaborateChapter 3 describeChapter 4 deals witChapter 5 discusseChapter 6 provides
Limitations and prong the fieldwork, therch method. Firstlyentration was not avaesearch question no. the data of air quality
onths of September January to August. llect a big/representa
Conclusion & recommendatio
s the background of the problem, problem statement, , research objectives, research questions and hypothesis. s literature review/conceptual framework of the research.
s the general condition of the research area. h the research method. s the results of the research. conclusions and recommendations of the research.
blems during the fieldwork author faced some difficulties causing some changes in the , some secondary data e.g. time series data of PM10 ilable making difficulties to do secondary data analyses of
1. Consequently, data PM10 concentration was substituted (PSI). Another incomplete data is the PSI data of 2003 for
to December. Therefore, the data analysis is only focused Finally, time and finance resources have limited the author tive sample from the population of Pekanbaru City.
32
CHAPTER 5 RESULT AND ANALYSIS
5.1.The Possible Influence of Forest & Land Fire in Riau as well as Dominant Direction of Wind on the Deterioration of Air Quality in Pekanbaru City
In this research, the hypothesis which is tested is “the increase of forest and land fire as well as wind direction have contributed to the deterioration of air quality in Pekanbaru City”.
To test this hypothesis, a trend analysis of number of days with deteriorating air quality and hotspot number in the period 2002-2005 using histograms is used. In addition, to support the result of the trend analysis, a qualitative analysis of the opinions of some interviewed key persons is applied.
a. Data analysis of the period 2002-2005 The data analysis of the period 2002-2005 is only focused on the trend of air quality and hotspot for the months of January till August since the data for the air quality for the months of September till December of the year of 2003 were not available.
Nevertheless, if we look at the trends of the number of days with deteriorating air quality in the months of September, October, November & December in the years of 2002, 2004 & 2005, air quality trend in Pekanbaru City tend to decrease with the decrease of hotspot number in Riau Province.
Furthermore, in this analysis, the daily air quality of Pekanbaru City is grouped into two main groups namely;
a.1. Days without deteriorating air quality or days that are expected not to cause environmental health impacts (those belonging to the categories of good or moderate).
a.2. Days with deteriorating air quality or days that may cause significant environmental health impacts (those belonging to the categories of unhealthy, very unhealthy or hazardous).
This analysis only focuses on looking at the monthly trend of the number of days with deteriorating air quality compared to the monthly trend of hotspot number in a four year period 2002-2005 because the aim of this analysis is to look at whether the number of days with deteriorating air quality per month increases with the increase of hotspot number per month. Data of the number of days with deteriorating air quality and hotspot number per month in the period 2002-2005 is presented in the table 18;
33
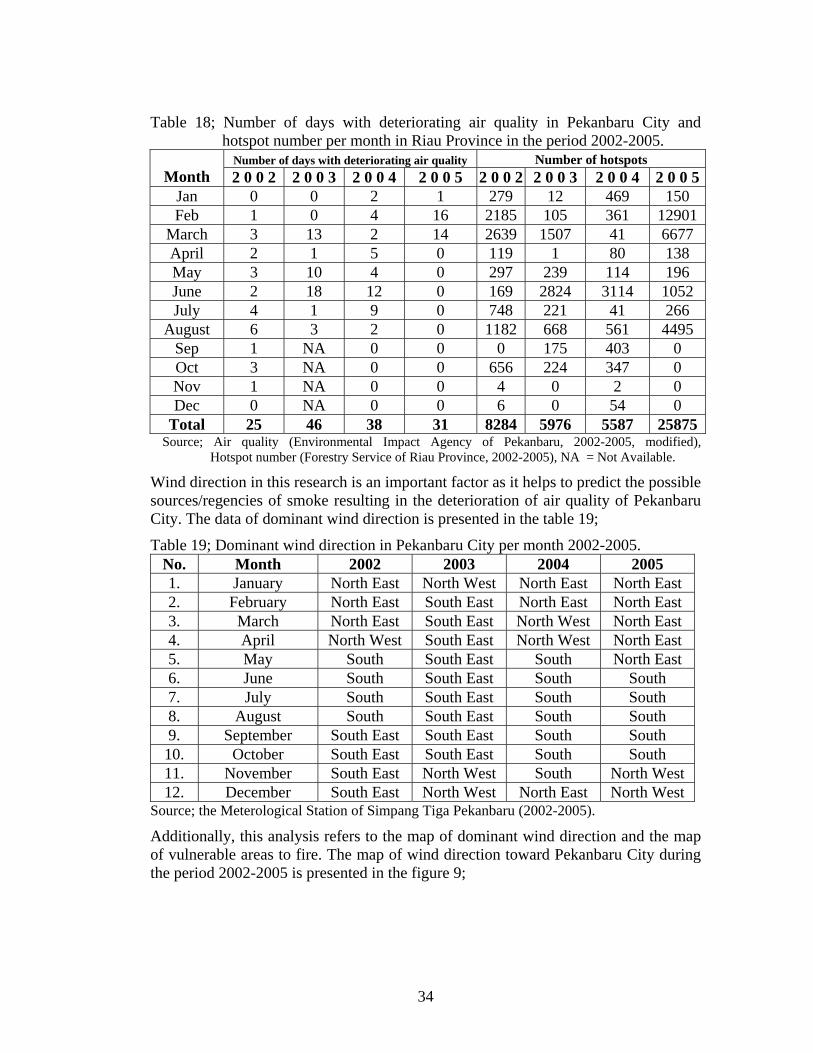
Table 18; Number of days with deteriorating air quality in Pekanbaru City and hotspot number per month in Riau Province in the period 2002-2005.
Number of days with deteriorating air quality Number of hotspots Month 2 0 0 2 2 0 0 3 2 0 0 4 2 0 0 5 2 0 0 2 2 0 0 3 2 0 0 4 2 0 0 5
Jan 0 0 2 1 279 12 469 150 Feb 1 0 4 16 2185 105 361 12901
March 3 13 2 14 2639 1507 41 6677 April 2 1 5 0 119 1 80 138 May 3 10 4 0 297 239 114 196 June 2 18 12 0 169 2824 3114 1052 July 4 1 9 0 748 221 41 266
August 6 3 2 0 1182 668 561 4495 Sep 1 NA 0 0 0 175 403 0 Oct 3 NA 0 0 656 224 347 0 Nov 1 NA 0 0 4 0 2 0 Dec 0 NA 0 0 6 0 54 0
Total 25 46 38 31 8284 5976 5587 25875Source; Air quality (Environmental Impact Agency of Pekanbaru, 2002-2005, modified),
Hotspot number (Forestry Service of Riau Province, 2002-2005), NA = Not Available.
Wind direction in this research is an important factor as it helps to predict the possible sources/regencies of smoke resulting in the deterioration of air quality of Pekanbaru City. The data of dominant wind direction is presented in the table 19;
Table 19; Dominant wind direction in Pekanbaru City per month 2002-2005. No. Month 2002 2003 2004 2005 1. January North East North West North East North East 2. February North East South East North East North East 3. March North East South East North West North East 4. April North West South East North West North East 5. May South South East South North East 6. June South South East South South 7. July South South East South South 8. August South South East South South 9. September South East South East South South 10. October South East South East South South 11. November South East North West South North West 12. December South East North West North East North West
Source; the Meterological Station of Simpang Tiga Pekanbaru (2002-2005).
Additionally, this analysis refers to the map of dominant wind direction and the map of vulnerable areas to fire. The map of wind direction toward Pekanbaru City during the period 2002-2005 is presented in the figure 9;
34
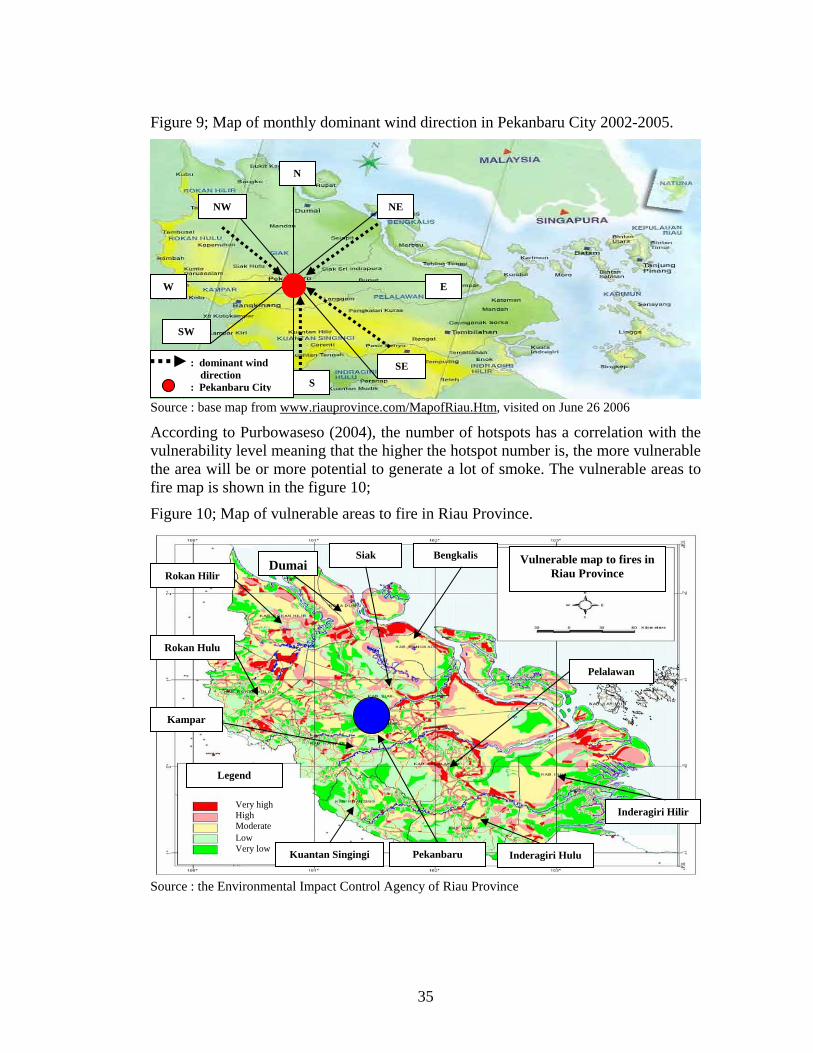
Figure 9; Map of monthly dominant wind direction in Pekanbaru City 2002-2005.
N
Source : base map from www.riauprovince.com/MapofRiau.Htm, visited on June 26 2006
NW
SW
W
S SE
E
NE
According to Purbowaseso (2004), the number of hotspots has a correlation with the vulnerability level meaning that the higher the hotspot number is, the more vulnerable the area will be or more potential to generate a lot of smoke. The vulnerable areas to fire map is shown in the figure 10;
Figure 10; Map of vulnerable areas to fire in Riau Province.
Rokan Hulu
Pelalawan
Kampar
Inderagiri Hilir
Le
Vulnerable map to fires in Riau Province i
Rokan Hilir
Siak Bengkalis
Source : the En
Very highHigh Moderate Low Very low
gend
viron
Duma
: dominant wind direction : Pekanbaru City
Kuantan Singingi Inderagiri Hulu Pekanbaru
mental Impact Control Agency of Riau Province
35
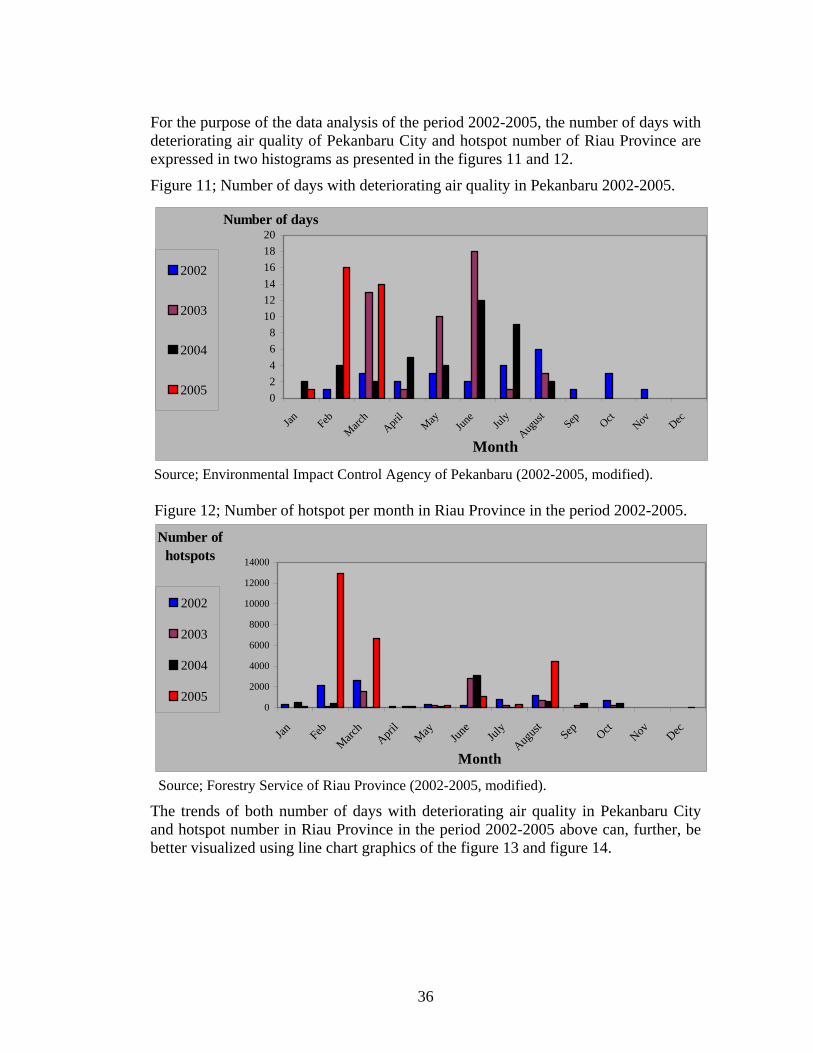
For the purpose of the data analysis of the period 2002-2005, the number of days with deteriorating air quality of Pekanbaru City and hotspot number of Riau Province are expressed in two histograms as presented in the figures 11 and 12.
Figure 11; Number of days with deteriorating air quality in Pekanbaru 2002-2005.
02468
101214161820
Jan FebMarc
hApri
lMay
June
July
August Sep Oct
Nov Dec
Month
Number of days
2002
2003
2004
2005
Source; Environmental Impact Control Agency of Pekanbaru (2002-2005, modified). Figure 12; Number of hotspot per month in Riau Province in the period 2002-2005.
0
2000
4000
6000
8000
10000
12000
14000
Jan FebMarc
hApri
lMay Jun
eJul
y
August Sep Oct
Nov Dec
Month
Number of hotspots
2002
2003
2004
2005
Source; Forestry Service of Riau Province (2002-2005, modified).
The trends of both number of days with deteriorating air quality in Pekanbaru City and hotspot number in Riau Province in the period 2002-2005 above can, further, be better visualized using line chart graphics of the figure 13 and figure 14.
36
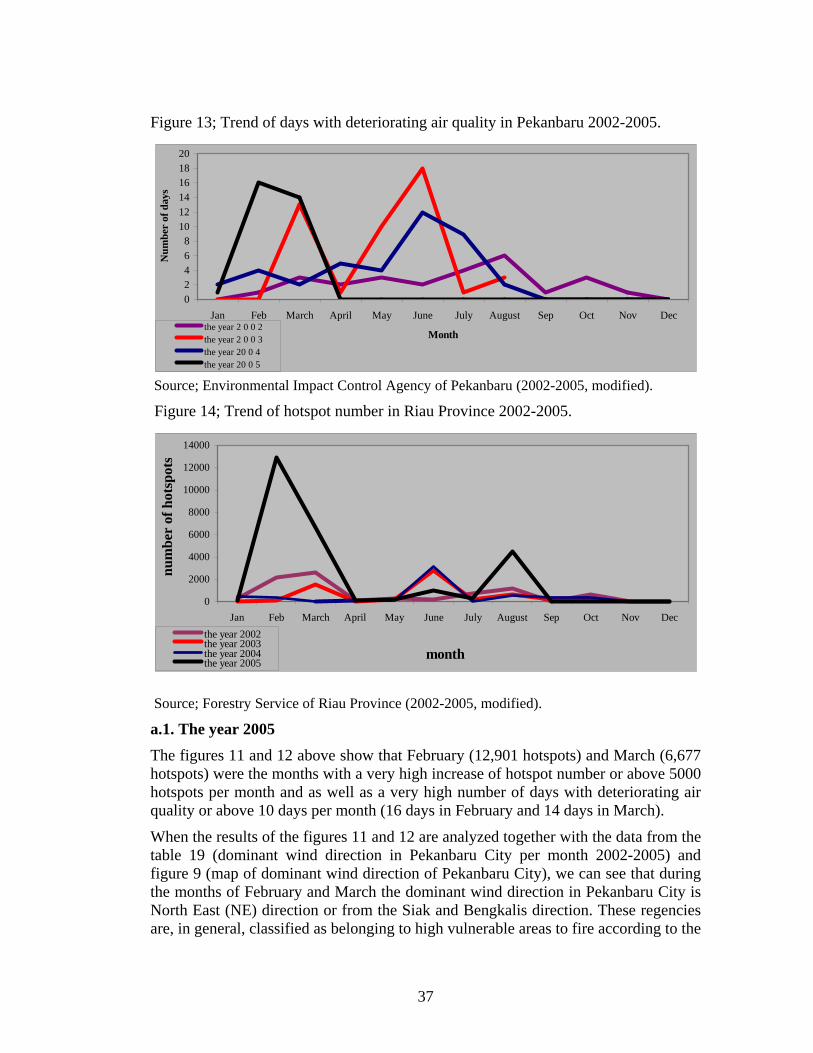
Figure 13; Trend of days with deteriorating air quality in Pekanbaru 2002-2005.
02468
101214161820
Jan Feb March April May June July August Sep Oct Nov Dec
Month
Num
ber
of d
ays
the year 2 0 0 2the year 2 0 0 3the year 20 0 4the year 20 0 5
Source; Environmental Impact Control Agency of Pekanbaru (2002-2005, modified).
Figure 14; Trend of hotspot number in Riau Province 2002-2005.
0
2000
4000
6000
8000
10000
12000
14000
Jan Feb March April May June July August Sep Oct Nov Dec
month
num
ber
of h
otsp
ots
the year 2002the year 2003the year 2004the year 2005
Source; Forestry Service of Riau Province (2002-2005, modified).
a.1. The year 2005 The figures 11 and 12 above show that February (12,901 hotspots) and March (6,677 hotspots) were the months with a very high increase of hotspot number or above 5000 hotspots per month and as well as a very high number of days with deteriorating air quality or above 10 days per month (16 days in February and 14 days in March).
When the results of the figures 11 and 12 are analyzed together with the data from the table 19 (dominant wind direction in Pekanbaru City per month 2002-2005) and figure 9 (map of dominant wind direction of Pekanbaru City), we can see that during the months of February and March the dominant wind direction in Pekanbaru City is North East (NE) direction or from the Siak and Bengkalis direction. These regencies are, in general, classified as belonging to high vulnerable areas to fire according to the
37
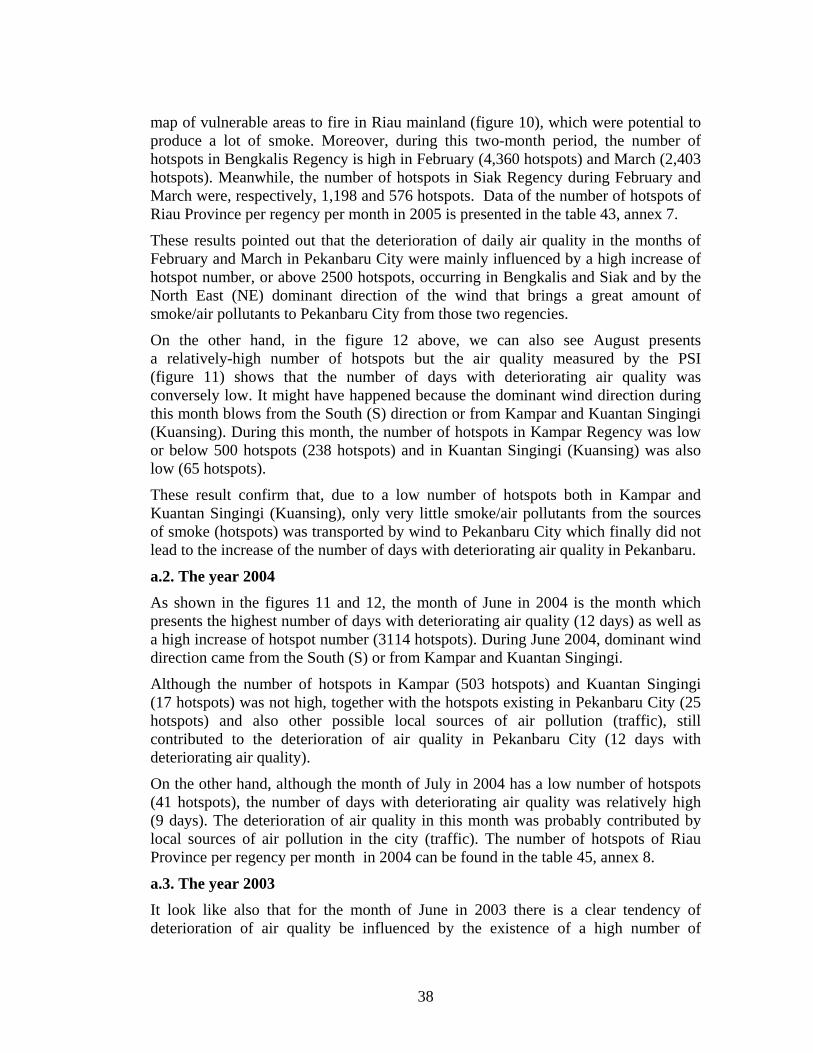
map of vulnerable areas to fire in Riau mainland (figure 10), which were potential to produce a lot of smoke. Moreover, during this two-month period, the number of hotspots in Bengkalis Regency is high in February (4,360 hotspots) and March (2,403 hotspots). Meanwhile, the number of hotspots in Siak Regency during February and March were, respectively, 1,198 and 576 hotspots. Data of the number of hotspots of Riau Province per regency per month in 2005 is presented in the table 43, annex 7.
These results pointed out that the deterioration of daily air quality in the months of February and March in Pekanbaru City were mainly influenced by a high increase of hotspot number, or above 2500 hotspots, occurring in Bengkalis and Siak and by the North East (NE) dominant direction of the wind that brings a great amount of smoke/air pollutants to Pekanbaru City from those two regencies.
On the other hand, in the figure 12 above, we can also see August presents a relatively-high number of hotspots but the air quality measured by the PSI (figure 11) shows that the number of days with deteriorating air quality was conversely low. It might have happened because the dominant wind direction during this month blows from the South (S) direction or from Kampar and Kuantan Singingi (Kuansing). During this month, the number of hotspots in Kampar Regency was low or below 500 hotspots (238 hotspots) and in Kuantan Singingi (Kuansing) was also low (65 hotspots).
These result confirm that, due to a low number of hotspots both in Kampar and Kuantan Singingi (Kuansing), only very little smoke/air pollutants from the sources of smoke (hotspots) was transported by wind to Pekanbaru City which finally did not lead to the increase of the number of days with deteriorating air quality in Pekanbaru.
a.2. The year 2004 As shown in the figures 11 and 12, the month of June in 2004 is the month which presents the highest number of days with deteriorating air quality (12 days) as well as a high increase of hotspot number (3114 hotspots). During June 2004, dominant wind direction came from the South (S) or from Kampar and Kuantan Singingi.
Although the number of hotspots in Kampar (503 hotspots) and Kuantan Singingi (17 hotspots) was not high, together with the hotspots existing in Pekanbaru City (25 hotspots) and also other possible local sources of air pollution (traffic), still contributed to the deterioration of air quality in Pekanbaru City (12 days with deteriorating air quality).
On the other hand, although the month of July in 2004 has a low number of hotspots (41 hotspots), the number of days with deteriorating air quality was relatively high (9 days). The deterioration of air quality in this month was probably contributed by local sources of air pollution in the city (traffic). The number of hotspots of Riau Province per regency per month in 2004 can be found in the table 45, annex 8.
a.3. The year 2003 It look like also that for the month of June in 2003 there is a clear tendency of deterioration of air quality be influenced by the existence of a high number of
38
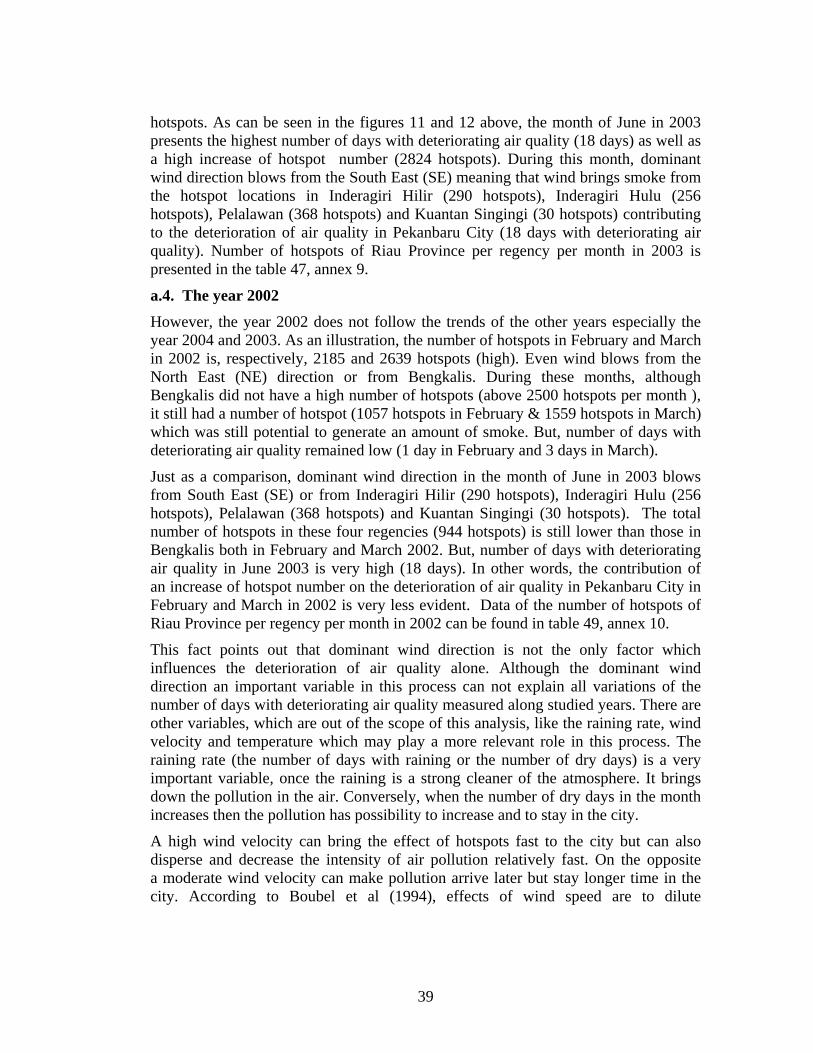
hotspots. As can be seen in the figures 11 and 12 above, the month of June in 2003 presents the highest number of days with deteriorating air quality (18 days) as well as a high increase of hotspot number (2824 hotspots). During this month, dominant wind direction blows from the South East (SE) meaning that wind brings smoke from the hotspot locations in Inderagiri Hilir (290 hotspots), Inderagiri Hulu (256 hotspots), Pelalawan (368 hotspots) and Kuantan Singingi (30 hotspots) contributing to the deterioration of air quality in Pekanbaru City (18 days with deteriorating air quality). Number of hotspots of Riau Province per regency per month in 2003 is presented in the table 47, annex 9.
a.4. The year 2002 However, the year 2002 does not follow the trends of the other years especially the year 2004 and 2003. As an illustration, the number of hotspots in February and March in 2002 is, respectively, 2185 and 2639 hotspots (high). Even wind blows from the North East (NE) direction or from Bengkalis. During these months, although Bengkalis did not have a high number of hotspots (above 2500 hotspots per month ), it still had a number of hotspot (1057 hotspots in February & 1559 hotspots in March) which was still potential to generate an amount of smoke. But, number of days with deteriorating air quality remained low (1 day in February and 3 days in March).
Just as a comparison, dominant wind direction in the month of June in 2003 blows from South East (SE) or from Inderagiri Hilir (290 hotspots), Inderagiri Hulu (256 hotspots), Pelalawan (368 hotspots) and Kuantan Singingi (30 hotspots). The total number of hotspots in these four regencies (944 hotspots) is still lower than those in Bengkalis both in February and March 2002. But, number of days with deteriorating air quality in June 2003 is very high (18 days). In other words, the contribution of an increase of hotspot number on the deterioration of air quality in Pekanbaru City in February and March in 2002 is very less evident. Data of the number of hotspots of Riau Province per regency per month in 2002 can be found in table 49, annex 10.
This fact points out that dominant wind direction is not the only factor which influences the deterioration of air quality alone. Although the dominant wind direction an important variable in this process can not explain all variations of the number of days with deteriorating air quality measured along studied years. There are other variables, which are out of the scope of this analysis, like the raining rate, wind velocity and temperature which may play a more relevant role in this process. The raining rate (the number of days with raining or the number of dry days) is a very important variable, once the raining is a strong cleaner of the atmosphere. It brings down the pollution in the air. Conversely, when the number of dry days in the month increases then the pollution has possibility to increase and to stay in the city.
A high wind velocity can bring the effect of hotspots fast to the city but can also disperse and decrease the intensity of air pollution relatively fast. On the opposite a moderate wind velocity can make pollution arrive later but stay longer time in the city. According to Boubel et al (1994), effects of wind speed are to dilute
39
continuously released pollutants at emision points & related to travel time from source to receptor.
The temperature also plays a role in the air quality. It has influence on the dispersion of the wind (thermal inversion). According to Brilhante and Frank (2003), termal inversion is the most important local weather phenomenon that can influence air pollution. It happens when a layer of warm air overlies cooler air, inverting the normal condition in which air turns into cooler as altitude rises.
Thereby, from the result of the trend analysis it can be summarized that it looks like to exist a trend to relate the air quality deterioration of Pekanbaru City with the increase of hotspot number. This is clear when the number of hotspot in Riau Province is very high (above 5000 hotspots) and the number of hotspots of regencies/high vulnerable areas from which dominant wind direction blows is high (above 2500 hotspots) as it was the case of the months of February and March 2005.
b. Analysis of opinions of key persons (governmental officials) The result of the trend analysis above is further confronted with the result of the qualitative analysis of the opinions of experts. For the purpose of this analysis, interviews with four related key persons were also conducted. The opinions of those key persons are discussed below;
According to the key person 1 from the Environmental Impact Control Agency of Pekanbaru City, the main cause of smoke haze in period 2002-2005 is forest and land fire. Forest and land fire in Riau Province contributed to the deterioration of air quality of Pekanbaru City. A similar opinion was also revealed by the key person 2 from the Environmental Impact Control Agency of Riau Province who argued that the main cause of smoke haze in Pekanbaru City in period 2002-2005 was forest & land fire occuring in other areas.
Also, the key person 3 from the Center for Environmental Management of Sumatera expressed a similar opinion that the main cause of smoke haze in Pekanbaru City in 2002-2005 is forest and land fire taking place out of Pekanbaru City. However, he said that wind factor was an important factor in the occurrence of smoke haze in Pekanbaru City because wind brings smoke due to from forest & land fire, to the city. Finally, the key person 4 from the Metereological and Geophysical Agency of Pekanbaru City explained that smoke haze usually occurs in a dry season during which people normally burn forest or land. He, further, explained that smoke is dry particles floating or suspended in the atmosphere. When smoke exists, the sun light becomes reddish because it is blocked by smoke in the atmosphere. He also recognised that wind factor plays important roles in the occurrence of smoke haze, due to forest and land fire, in Pekanbaru City.
On the basis of the opinions of experts, it can be concluded that smoke haze was mainly caused by forest and land fire mostly out of Pekanbaru City. These opinions are relevant with what citizents perceived as the main cause of smoke haze. As shown in the table 20, most citizents perceived forest and land fire as the main cause of smoke haze (74%).
40
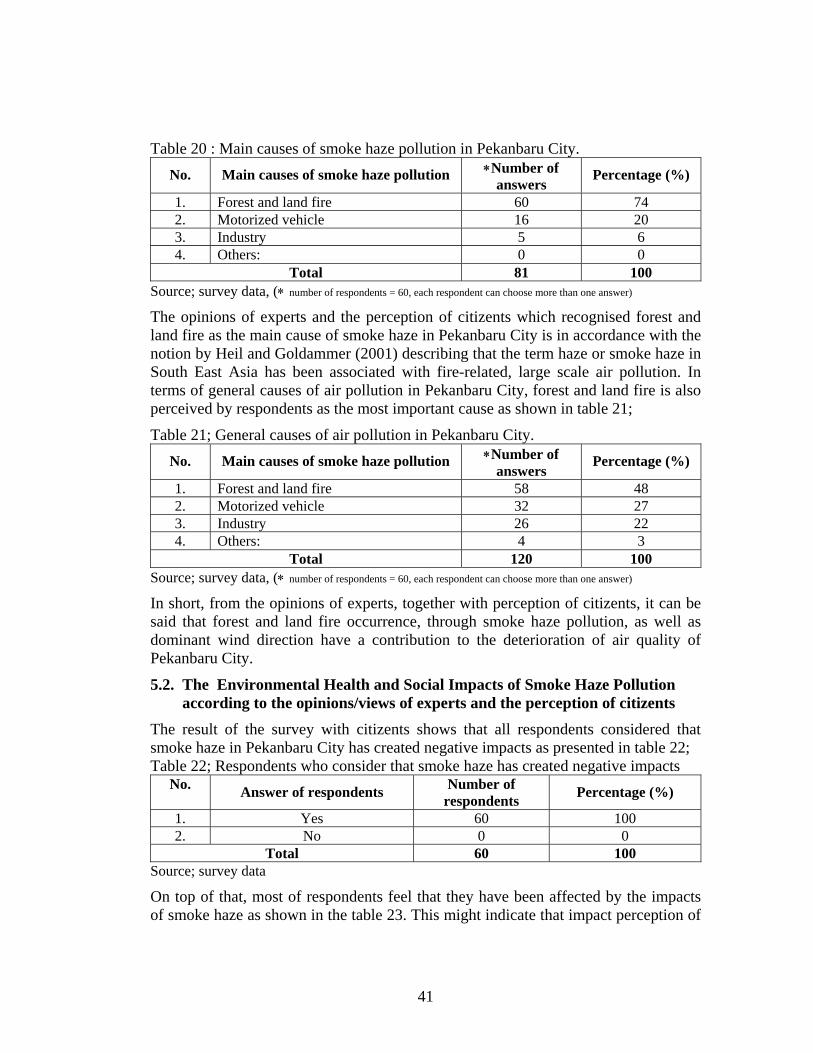
Table 20 : Main causes of smoke haze pollution in Pekanbaru City. No. Main causes of smoke haze pollution ∗Number of
answers Percentage (%)
1. Forest and land fire 60 74 2. Motorized vehicle 16 20 3. Industry 5 6 4. Others: 0 0
Total 81 100 Source; survey data, (∗ number of respondents = 60, each respondent can choose more than one answer) The opinions of experts and the perception of citizents which recognised forest and land fire as the main cause of smoke haze in Pekanbaru City is in accordance with the notion by Heil and Goldammer (2001) describing that the term haze or smoke haze in South East Asia has been associated with fire-related, large scale air pollution. In terms of general causes of air pollution in Pekanbaru City, forest and land fire is also perceived by respondents as the most important cause as shown in table 21;
Table 21; General causes of air pollution in Pekanbaru City. No. Main causes of smoke haze pollution ∗Number of
answers Percentage (%)
1. Forest and land fire 58 48 2. Motorized vehicle 32 27 3. Industry 26 22 4. Others: 4 3
Total 120 100 Source; survey data, (∗ number of respondents = 60, each respondent can choose more than one answer) In short, from the opinions of experts, together with perception of citizents, it can be said that forest and land fire occurrence, through smoke haze pollution, as well as dominant wind direction have a contribution to the deterioration of air quality of Pekanbaru City.
5.2. The Environmental Health and Social Impacts of Smoke Haze Pollution according to the opinions/views of experts and the perception of citizents The result of the survey with citizents shows that all respondents considered that smoke haze in Pekanbaru City has created negative impacts as presented in table 22; Table 22; Respondents who consider that smoke haze has created negative impacts
No. Answer of respondents Number of respondents Percentage (%)
1. Yes 60 100 2. No 0 0
Total 60 100 Source; survey data On top of that, most of respondents feel that they have been affected by the impacts of smoke haze as shown in the table 23. This might indicate that impact perception of
41

respondents is likely to be influenced by their previous experience or feeling affected by smoke haze pollution. This is relevant with the notion of Irwan et al (1994; Suswati and Taneo 2004) mentioning four factors influencing perception, one of which is previous experience.
Table 23; Respondents who (do not) get affected by impacts of smoke haze No. Answer of respondents Number of
respondents Percentage (%)
1. Get affected 58 97 2. Not get affected 2 3
Total 60 100 Source; survey data
The negative impacts of smoke haze in general consist of three types namely environmental, health and social impacts. The identification of those impacts were based not only on the perception citizents but also on the opinions of experts and elaborated as follows;
a. Environmental impact According to the key person 1 from the Environmental Impact Control Agency of Pekanbaru City, the environmental impact of smoke haze was a decrease of air quality. Besides, smoke haze also threatened the existence of flora and fauna in the city. He refers to the unhealthy category of the PSI. In the category of unhealthy air quality (the indices of the PSI between 101-199), the air quality is not good for human and sensitive fauna.
In addition, in his view, smoke haze might have contributed to water pollution especially in a rainy season. Rain water takes the particles in air down to the surface water such as rivers. He finally mentioned that smoke haze created particles which could soil buildings.
Meanwhile, the key person 2 from the Environmental Impact Control Agency of Riau Province described that environmental impacts of smoke haze were deterioration of air quality and the reduction of visibility range. A reduced visibility range, in turn, disrupted the transportation (air, water and land). On the contrary, in his opinion, the impact of smoke haze on the existence of flora and fauna, building soiling and water pollution was not significant yet.
Finally, another key person (key person 3) from the Center for Environmental Management of Sumateran Region pointed out that the environmental impacts of smoke haze were deterioration of air quality and the reduction of visibility range.
He added that as a result of a reduced visibility range, the air transportation schedule is also disrupted such as delays of flights. Furthermore, the opinions of those key persons/experts are summarized in the table 24;
42
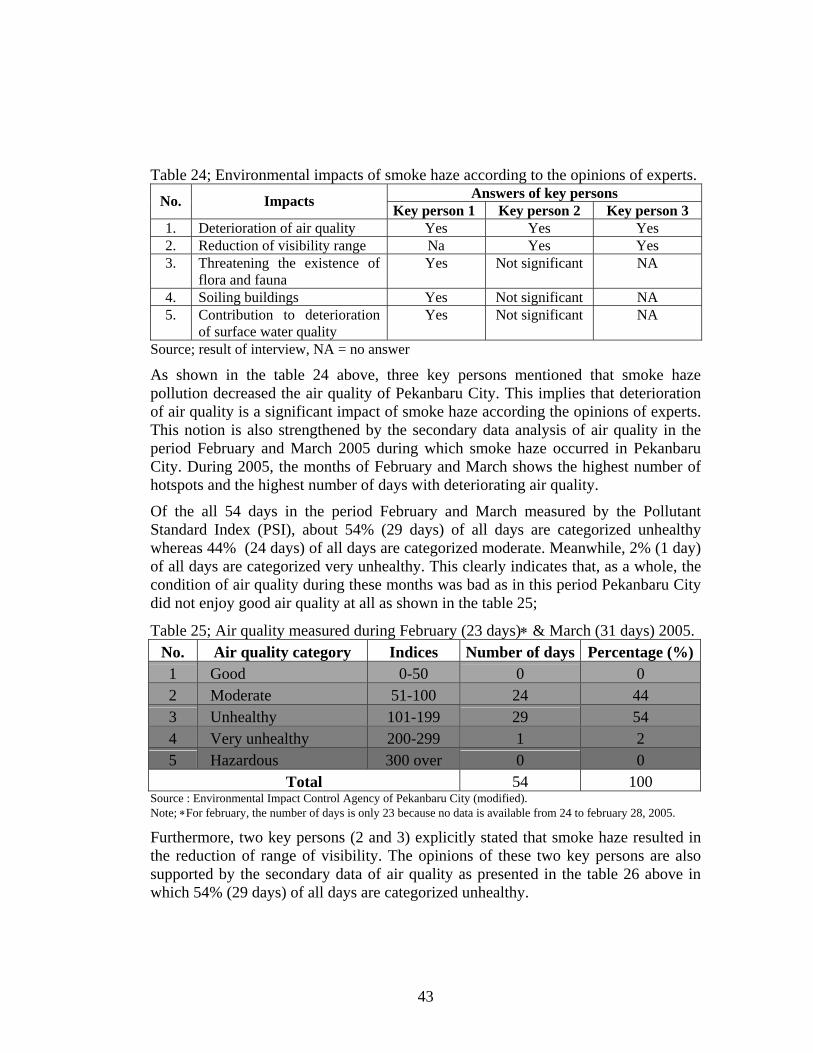
Table 24; Environmental impacts of smoke haze according to the opinions of experts. Answers of key persons No. Impacts Key person 1 Key person 2 Key person 3
1. Deterioration of air quality Yes Yes Yes 2. Reduction of visibility range Na Yes Yes 3. Threatening the existence of
flora and fauna Yes Not significant NA
4. Soiling buildings Yes Not significant NA 5. Contribution to deterioration
of surface water quality Yes Not significant NA
Source; result of interview, NA = no answer
As shown in the table 24 above, three key persons mentioned that smoke haze pollution decreased the air quality of Pekanbaru City. This implies that deterioration of air quality is a significant impact of smoke haze according the opinions of experts. This notion is also strengthened by the secondary data analysis of air quality in the period February and March 2005 during which smoke haze occurred in Pekanbaru City. During 2005, the months of February and March shows the highest number of hotspots and the highest number of days with deteriorating air quality.
Of the all 54 days in the period February and March measured by the Pollutant Standard Index (PSI), about 54% (29 days) of all days are categorized unhealthy whereas 44% (24 days) of all days are categorized moderate. Meanwhile, 2% (1 day) of all days are categorized very unhealthy. This clearly indicates that, as a whole, the condition of air quality during these months was bad as in this period Pekanbaru City did not enjoy good air quality at all as shown in the table 25;
Table 25; Air quality measured during February (23 days)∗ & March (31 days) 2005. No. Air quality category Indices Number of days Percentage (%)1 Good 0-50 0 0 2 Moderate 51-100 24 44 3 Unhealthy 101-199 29 54 4 Very unhealthy 200-299 1 2 5 Hazardous 300 over 0 0
Total 54 100 Source : Environmental Impact Control Agency of Pekanbaru City (modified). Note; ∗For february, the number of days is only 23 because no data is available from 24 to february 28, 2005.
Furthermore, two key persons (2 and 3) explicitly stated that smoke haze resulted in the reduction of range of visibility. The opinions of these two key persons are also supported by the secondary data of air quality as presented in the table 26 above in which 54% (29 days) of all days are categorized unhealthy.
43
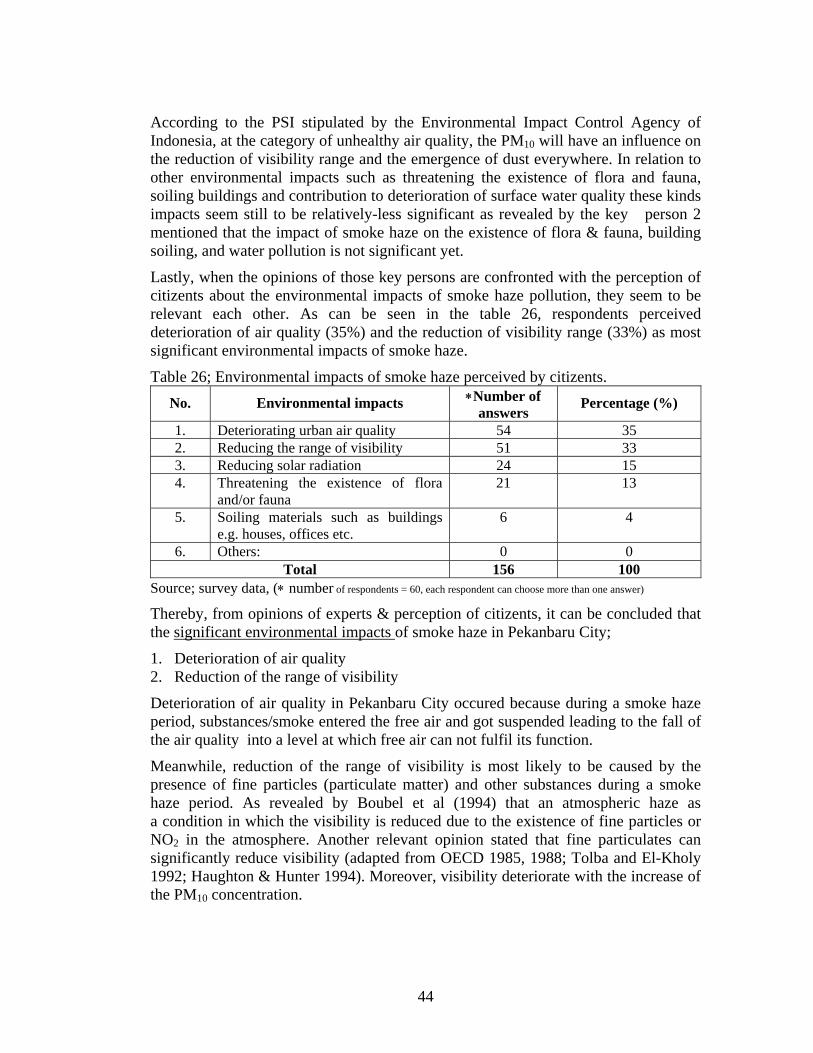
According to the PSI stipulated by the Environmental Impact Control Agency of Indonesia, at the category of unhealthy air quality, the PM10 will have an influence on the reduction of visibility range and the emergence of dust everywhere. In relation to other environmental impacts such as threatening the existence of flora and fauna, soiling buildings and contribution to deterioration of surface water quality these kinds impacts seem still to be relatively-less significant as revealed by the key person 2 mentioned that the impact of smoke haze on the existence of flora & fauna, building soiling, and water pollution is not significant yet.
Lastly, when the opinions of those key persons are confronted with the perception of citizents about the environmental impacts of smoke haze pollution, they seem to be relevant each other. As can be seen in the table 26, respondents perceived deterioration of air quality (35%) and the reduction of visibility range (33%) as most significant environmental impacts of smoke haze.
Table 26; Environmental impacts of smoke haze perceived by citizents. No. Environmental impacts ∗Number of
answers Percentage (%)
1. Deteriorating urban air quality 54 35 2. Reducing the range of visibility 51 33 3. Reducing solar radiation 24 15 4. Threatening the existence of flora
and/or fauna 21 13
5. Soiling materials such as buildings e.g. houses, offices etc.
6 4
6. Others: 0 0 Total 156 100
Source; survey data, (∗ number of respondents = 60, each respondent can choose more than one answer) Thereby, from opinions of experts & perception of citizents, it can be concluded that the significant environmental impacts of smoke haze in Pekanbaru City;
1. Deterioration of air quality 2. Reduction of the range of visibility
Deterioration of air quality in Pekanbaru City occured because during a smoke haze period, substances/smoke entered the free air and got suspended leading to the fall of the air quality into a level at which free air can not fulfil its function.
Meanwhile, reduction of the range of visibility is most likely to be caused by the presence of fine particles (particulate matter) and other substances during a smoke haze period. As revealed by Boubel et al (1994) that an atmospheric haze as a condition in which the visibility is reduced due to the existence of fine particles or NO2 in the atmosphere. Another relevant opinion stated that fine particulates can significantly reduce visibility (adapted from OECD 1985, 1988; Tolba and El-Kholy 1992; Haughton & Hunter 1994). Moreover, visibility deteriorate with the increase of the PM10 concentration.
44
b. Health Impacts The key person 1 from the Health Service of Pekanbaru City stated that smoke haze caused some diseases such as eye irritation, skin infection and ARI (both pneumonia and non pneumonia). He added that smoke haze also increased the risks of traffic accidents in the streets as a result of a reduced visibility range and the risks of mortality for those who have pre-existing asthma. The condition of those who have pre-existing asthma will get worse when they are exposed to smoke. Finally he emphasized that children under 5 years are the most vulnerable group to smoke haze.
Another opinion was revealed the key person 2 from the Health Service of Riau Province. He described that smoke haze resulted in two types of health impacts; direct and indirect impacts. Direct impacts include asthma and eye irritation (red eye) depending upon the thickness of smoke, the thicker the smoke is, the faster its impact on human will be.
Conversely, ARI pneumonia is an example of the indirect impact of smoke because it is normally caused by germs. Like the key person 1, the key person 2 mentioned that smoke haze increased the risks of traffic accidents in the streets as a result of a reduced visibility range and the risks of mortality for those who have pre-existing respiratory diseases because smoke worsens the condition of lungs of those with pre-existing respiratory diseases.
On the contrary to the opinion of key person 1, key person 2 stated that the possibility of smoke haze to result in skin irritation was small. He finally emphasized that the most vulnerable groups to smoke haze pollution are children under 5 years, elder people & people with pre-existing asthma & bronchitis diseases. Furthermore, opinions of the key persons/experts are summarized in the table 27;
Table 27; Health impacts of smoke haze according to the opinions of experts. Answers of key persons No. Impacts Key person 1 Key person 2
1. Causing respiratory system dis-turbance
Yes Yes
2. Causing eye irritation Yes Yes 3. Causing skin irritation Yes No 4. Increasing risks of traffic acci-
dents in the streets due to a redu-ced visibility range
Yes Yes
5. Increasing risks of mortality for those with pre-existing asthma.
Yes Yes
Source; result of interview
45
As shown in the table 27 above, in general, both two key persons have similar opinions concerning health impacts of smoke haze, except skin irritation. Both have opinions that smoke haze resulted in the Acute Respiratory Infection (both pneumonia and non pneumonia), eye irritation, the increasing risks of traffic accidents in the streets as a result of a reduced visibility range and the increasing risks of mortality for those who have pre-existing asthma.
In terms of the most vulnerable group to smoke haze-related diseases especially ARI, both key persons mentioned that children under 5 years are the most vulnerable one. According to the decree of health ministry (Surat Keputusan Menteri Kesehatan) no. 1537.A/Menkes/SK/XII/2002 about the guidance of the alleviation of the ARI of children under five years, ARI is an acute infection disease attacking one part or more of respiratory system from nose (upper part) to alveoli (lower part). Data of children under 5 years suffering from ARI is shown in the figure 15;
Figure 15; Findings of children under 5 years suffering from ARI 2003-2005 in Pekanbaru City.
0
5000
10000
15000
20000
25000
30000
35000
40000Number of children
2 0 0 3 2 0 0 4 2 0 0 5
YearPneumonia patientsNon pneumonia patients
Source: ARI data of 2004 and 2005 from the Health Service of Pekanbaru & ARI data of 2003 from the Health Service of Riau (modified). As shown in the figure 15 above, the number of children under 5 years suffering from ARI in a three year period (2003-2005) tends to rise. This figure suggests that smoke haze look like to be an important factor linked to the occurrence of the Acute Respiratory Infection (ARI) in Pekanbaru City.
Although none of the two key persons above explained that the increasing risks of traffic accidents in the streets as a result of a reduced visibility range and the increasing risks of mortality for those who have pre-existing asthma are direct impacts of smoke haze, by referring to the notion of Sastry (2001), these impacts can be considered as direct impacts of smoke haze because according to Sastry (2001), respiratory infections together with mortality and death from accidents are short
46
effects of exposure to air pollution. Eventually, when the opinions of the two key persons about the health impacts are confronted with the health impacts perceived by citizents they are more or less similar one another.
Respondents from citizens mentioned that some significant health impacts of smoke haze such as causing respiratory system disturbance/disease (31%), increasing the risk of traffic accidents of drivers on the streets due to a reduced visibility (25%) and causing eye irritation (24%). The health impacts of smoke haze perceived by citizents are presented in the table 28;
Table 28; Health impacts of smoke haze perceived by citizents.
No. Health impacts ∗Number of answers
Percentage (%)
1. Causing respiratory system distur-bance/disease 60 31
2. Causing eye irritation 44 24 3. Causing skin irritation 9 5 4. Increasing the risk of traffic
accidents of drivers on the streets due to a reduced visibility
47
25
5. Increasing the mortality risk of elderly people and those with pre-existing respiratory diseases
27
14
6. Other: causing diarrhoea 1 1 Total 187 100
Source; survey data, (∗ number of respondents = 60, each respondent can choose more than one answer)
Therefore, on the basis of opinions of experts & perception of citizents, the significant health impacts of smoke haze in Pekanbaru City are categorized into two;
1. Direct impacts ; respiratory disease (ARI non pneumonia), eye irritation and the increasing risks of traffic accidents in the streets due to a reduced visibility range.
2. Indirect impacts ; respiratory disease (ARI pneumonia)
It is important to explain why smoke haze/air pollution in Pekanbaru City can cause health impacts e.g. respiratory diseases. Theoretically, as revealed by Brilhante (1998; Brilhante and Frank 2003 p. 52) that ‘the health of human beings and their communities can only be sustained within a health ecosystem’. This conversely implies that if the ecosystem is unhealthy, the health of human beings and community can not be sustained anymore. Referring to this notion, smoke haze leading to the deterioration of air quality in Pekanbaru City has made the urban environment/ecosystem of the city is unhealthy meaning that under this condition, the health of human beings and community in the city can not be sustained anymore.
Furthermore, in the case of Pekanbaru City, during a smoke haze period, the most dominant parameter of the PSI is generally the Particulate Matter 10 (the critical parameter). This fact was revealed by the key person from the Environmental Impact Control Agency of Pekanbaru City. This notion is also in line with a study of air
47
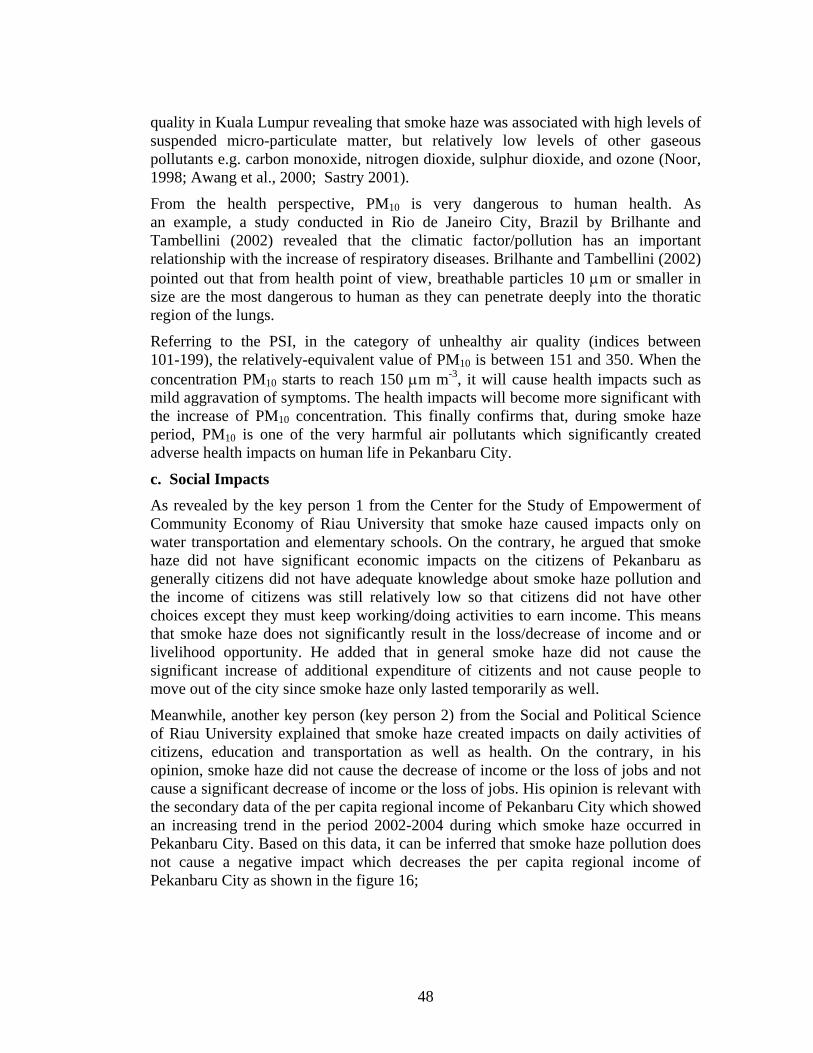
quality in Kuala Lumpur revealing that smoke haze was associated with high levels of suspended micro-particulate matter, but relatively low levels of other gaseous pollutants e.g. carbon monoxide, nitrogen dioxide, sulphur dioxide, and ozone (Noor, 1998; Awang et al., 2000; Sastry 2001).
From the health perspective, PM10 is very dangerous to human health. As an example, a study conducted in Rio de Janeiro City, Brazil by Brilhante and Tambellini (2002) revealed that the climatic factor/pollution has an important relationship with the increase of respiratory diseases. Brilhante and Tambellini (2002) pointed out that from health point of view, breathable particles 10 µm or smaller in size are the most dangerous to human as they can penetrate deeply into the thoratic region of the lungs.
Referring to the PSI, in the category of unhealthy air quality (indices between 101-199), the relatively-equivalent value of PM10 is between 151 and 350. When the concentration PM10 starts to reach 150 µm m-3, it will cause health impacts such as mild aggravation of symptoms. The health impacts will become more significant with the increase of PM10 concentration. This finally confirms that, during smoke haze period, PM10 is one of the very harmful air pollutants which significantly created adverse health impacts on human life in Pekanbaru City.
c. Social Impacts As revealed by the key person 1 from the Center for the Study of Empowerment of Community Economy of Riau University that smoke haze caused impacts only on water transportation and elementary schools. On the contrary, he argued that smoke haze did not have significant economic impacts on the citizens of Pekanbaru as generally citizens did not have adequate knowledge about smoke haze pollution and the income of citizens was still relatively low so that citizens did not have other choices except they must keep working/doing activities to earn income. This means that smoke haze does not significantly result in the loss/decrease of income and or livelihood opportunity. He added that in general smoke haze did not cause the significant increase of additional expenditure of citizents and not cause people to move out of the city since smoke haze only lasted temporarily as well.
Meanwhile, another key person (key person 2) from the Social and Political Science of Riau University explained that smoke haze created impacts on daily activities of citizens, education and transportation as well as health. On the contrary, in his opinion, smoke haze did not cause the decrease of income or the loss of jobs and not cause a significant decrease of income or the loss of jobs. His opinion is relevant with the secondary data of the per capita regional income of Pekanbaru City which showed an increasing trend in the period 2002-2004 during which smoke haze occurred in Pekanbaru City. Based on this data, it can be inferred that smoke haze pollution does not cause a negative impact which decreases the per capita regional income of Pekanbaru City as shown in the figure 16;
48
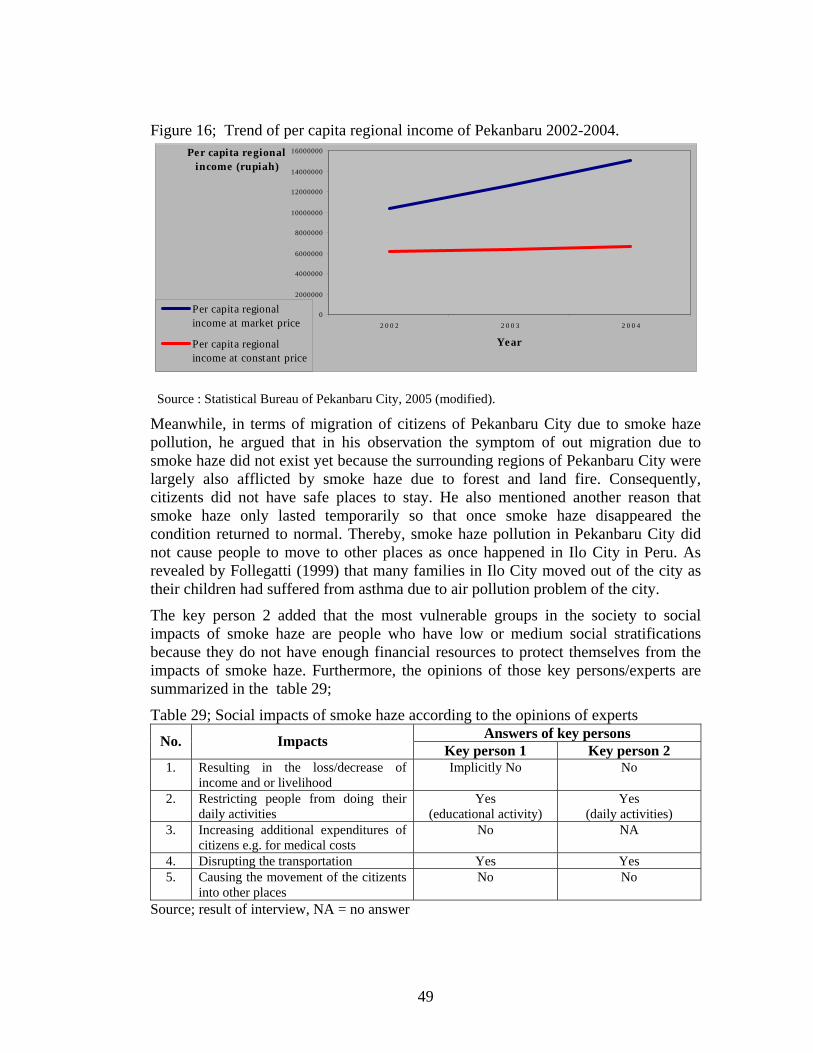
Figure 16; Trend of per capita regional income of Pekanbaru 2002-2004.
0
2000000
4000000
6000000
8000000
10000000
12000000
14000000
16000000
2 0 0 2 2 0 0 3 2 0 0 4
Year
Per capita regional income (rupiah)
Per capita regionalincome at market price
Per capita regionalincome at constant price
Source : Statistical Bureau of Pekanbaru City, 2005 (modified). Meanwhile, in terms of migration of citizens of Pekanbaru City due to smoke haze pollution, he argued that in his observation the symptom of out migration due to smoke haze did not exist yet because the surrounding regions of Pekanbaru City were largely also afflicted by smoke haze due to forest and land fire. Consequently, citizents did not have safe places to stay. He also mentioned another reason that smoke haze only lasted temporarily so that once smoke haze disappeared the condition returned to normal. Thereby, smoke haze pollution in Pekanbaru City did not cause people to move to other places as once happened in Ilo City in Peru. As revealed by Follegatti (1999) that many families in Ilo City moved out of the city as their children had suffered from asthma due to air pollution problem of the city.
The key person 2 added that the most vulnerable groups in the society to social impacts of smoke haze are people who have low or medium social stratifications because they do not have enough financial resources to protect themselves from the impacts of smoke haze. Furthermore, the opinions of those key persons/experts are summarized in the table 29;
Table 29; Social impacts of smoke haze according to the opinions of experts Answers of key persons No. Impacts Key person 1 Key person 2
1. Resulting in the loss/decrease of income and or livelihood
Implicitly No No
2. Restricting people from doing their daily activities
Yes (educational activity)
Yes (daily activities)
3. Increasing additional expenditures of citizens e.g. for medical costs
No NA
4. Disrupting the transportation Yes Yes 5. Causing the movement of the citizents
into other places No No
Source; result of interview, NA = no answer
49
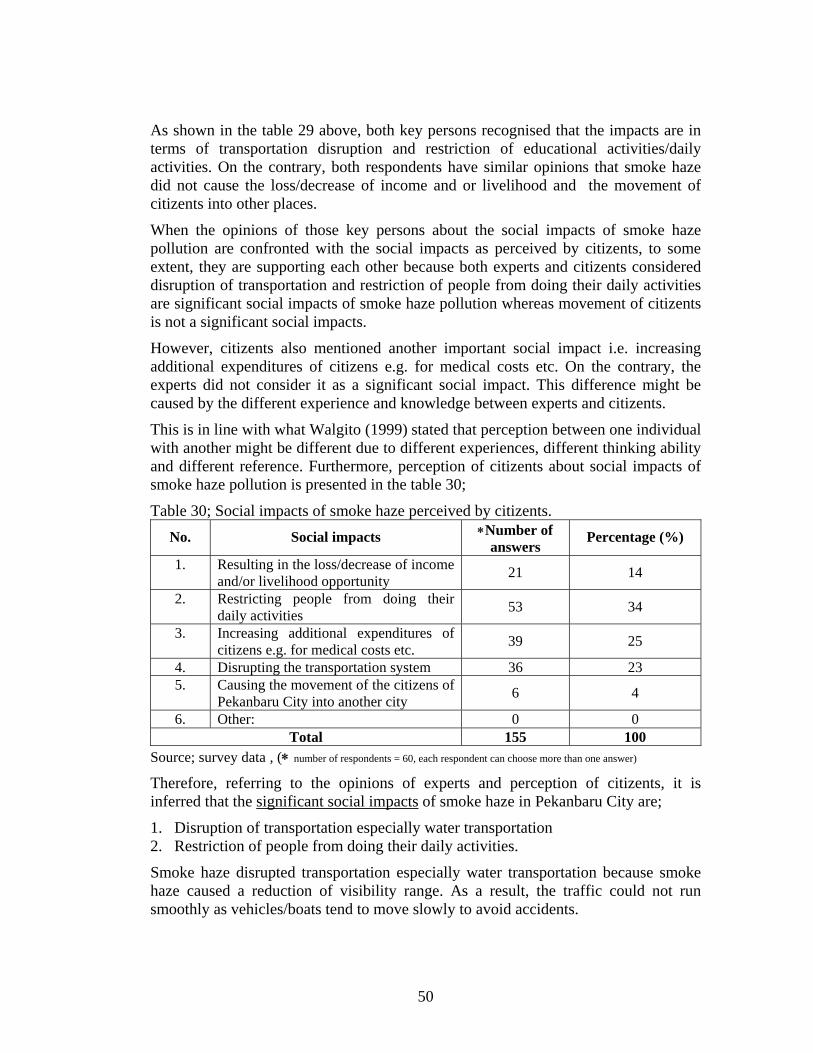
As shown in the table 29 above, both key persons recognised that the impacts are in terms of transportation disruption and restriction of educational activities/daily activities. On the contrary, both respondents have similar opinions that smoke haze did not cause the loss/decrease of income and or livelihood and the movement of citizents into other places.
When the opinions of those key persons about the social impacts of smoke haze pollution are confronted with the social impacts as perceived by citizents, to some extent, they are supporting each other because both experts and citizents considered disruption of transportation and restriction of people from doing their daily activities are significant social impacts of smoke haze pollution whereas movement of citizents is not a significant social impacts.
However, citizents also mentioned another important social impact i.e. increasing additional expenditures of citizens e.g. for medical costs etc. On the contrary, the experts did not consider it as a significant social impact. This difference might be caused by the different experience and knowledge between experts and citizents.
This is in line with what Walgito (1999) stated that perception between one individual with another might be different due to different experiences, different thinking ability and different reference. Furthermore, perception of citizents about social impacts of smoke haze pollution is presented in the table 30;
Table 30; Social impacts of smoke haze perceived by citizents. No. Social impacts ∗Number of
answers Percentage (%)
1. Resulting in the loss/decrease of income and/or livelihood opportunity 21 14
2. Restricting people from doing their daily activities 53 34
3. Increasing additional expenditures of citizens e.g. for medical costs etc. 39 25
4. Disrupting the transportation system 36 23 5. Causing the movement of the citizens of
Pekanbaru City into another city 6 4
6. Other: 0 0 Total 155 100
Source; survey data , (∗ number of respondents = 60, each respondent can choose more than one answer)
Therefore, referring to the opinions of experts and perception of citizents, it is inferred that the significant social impacts of smoke haze in Pekanbaru City are;
1. Disruption of transportation especially water transportation 2. Restriction of people from doing their daily activities.
Smoke haze disrupted transportation especially water transportation because smoke haze caused a reduction of visibility range. As a result, the traffic could not run smoothly as vehicles/boats tend to move slowly to avoid accidents.
50
This kind of impact is similar to that once happened in Jambi, a neighbouring province. As reported by an Indonesian newspaper (Kompas October 2 2006, p. 15), due to smoke haze, visibility range in Batanghari River, Jambi was reduced until 100-150 meters making the river/water transportation system being disrupted.
Furthemore, smoke haze restricted daily activities of citizens because it reduced the range of visibility, on the streets in particular. As a consequence, people could not move or walk freely and comfortably in the city. This condition, in turn, disturbed daily activities of people such as living and working. This is relevant with the notion stating that social impacts refer to the results of public or private actions on human population changing the way people live, work, play, relate to each other, organize to fulfil their needs and cope as members of a community (ICGPSIA 1995; Brilhante, El-Hefnawi & El-Sherif 2002). Restriction of citizents from doing their daily activities might, in turn, have resulted in adverse impacts on local bussiness in Pekanbaru City as many people prefered to stay home instead of going out to do daily activities such as shopping.
d. Mitigation Measures
For impact mitigation measures, the key person from the Environmental Impact Control Agency of Pekanbaru City, revealed that prevention and impact mitigation measure is to monitor and report the air quality of Pekanbaru City to the public. Monitoring and reporting air quality help citizents to know the air quality of the city so that they can stay indoor when smoke haze occurs.
In addition, the city government observed and monitored the land fire occurrence in the city which can also produce smoke. In relation to health impacts, the key person from the Health Service of Pekanbaru City, described that some mitigation measures undertaken by the City Government of Pekanbaru are advising citizents for using masks if they are outdoor and for reducing outdoor activities during smoke haze period. Furthermore, the key person from the Health Service of Riau Province, explained that measures usually undertaken by the Provincial Government of Riau are socialisation on the health impacts of smoke, dissemination of masks, surveillance of diseases due to smoke and advise to the governor to close schools when the air quality has endangered the human health. He, further, pointed out that impact mitigation measures have some constraints such as lack of budget and skilful human resources in impact mitigation. In the meantime, many citizents have known about the mitigation measures undertaken by the City Government of Pekanbaru and/or the Provincial Government of Riau. The answers of respondents are shown in table 31;
51
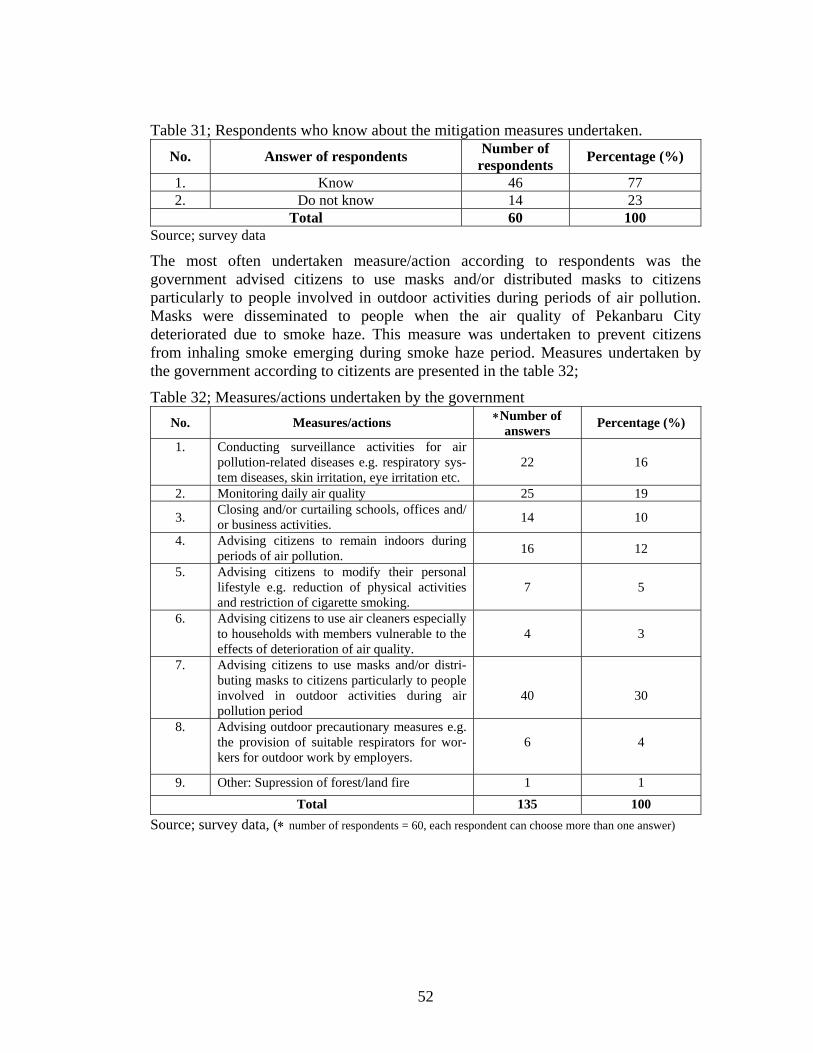
Table 31; Respondents who know about the mitigation measures undertaken. No. Answer of respondents Number of
respondents Percentage (%)
1. Know 46 77 2. Do not know 14 23
Total 60 100 Source; survey data The most often undertaken measure/action according to respondents was the government advised citizens to use masks and/or distributed masks to citizens particularly to people involved in outdoor activities during periods of air pollution. Masks were disseminated to people when the air quality of Pekanbaru City deteriorated due to smoke haze. This measure was undertaken to prevent citizens from inhaling smoke emerging during smoke haze period. Measures undertaken by the government according to citizents are presented in the table 32;
Table 32; Measures/actions undertaken by the government No. Measures/actions ∗Number of
answers Percentage (%)
1. Conducting surveillance activities for air pollution-related diseases e.g. respiratory sys-tem diseases, skin irritation, eye irritation etc.
22
16
2. Monitoring daily air quality 25 19
3. Closing and/or curtailing schools, offices and/ or business activities. 14 10
4. Advising citizens to remain indoors during periods of air pollution. 16 12
5. Advising citizens to modify their personal lifestyle e.g. reduction of physical activities and restriction of cigarette smoking.
7
5
6. Advising citizens to use air cleaners especially to households with members vulnerable to the effects of deterioration of air quality.
4
3
7. Advising citizens to use masks and/or distri-buting masks to citizens particularly to people involved in outdoor activities during air pollution period
40
30
8. Advising outdoor precautionary measures e.g. the provision of suitable respirators for wor-kers for outdoor work by employers.
6
4
9. Other: Supression of forest/land fire 1 1 Total 135 100
Source; survey data, (∗ number of respondents = 60, each respondent can choose more than one answer)
52
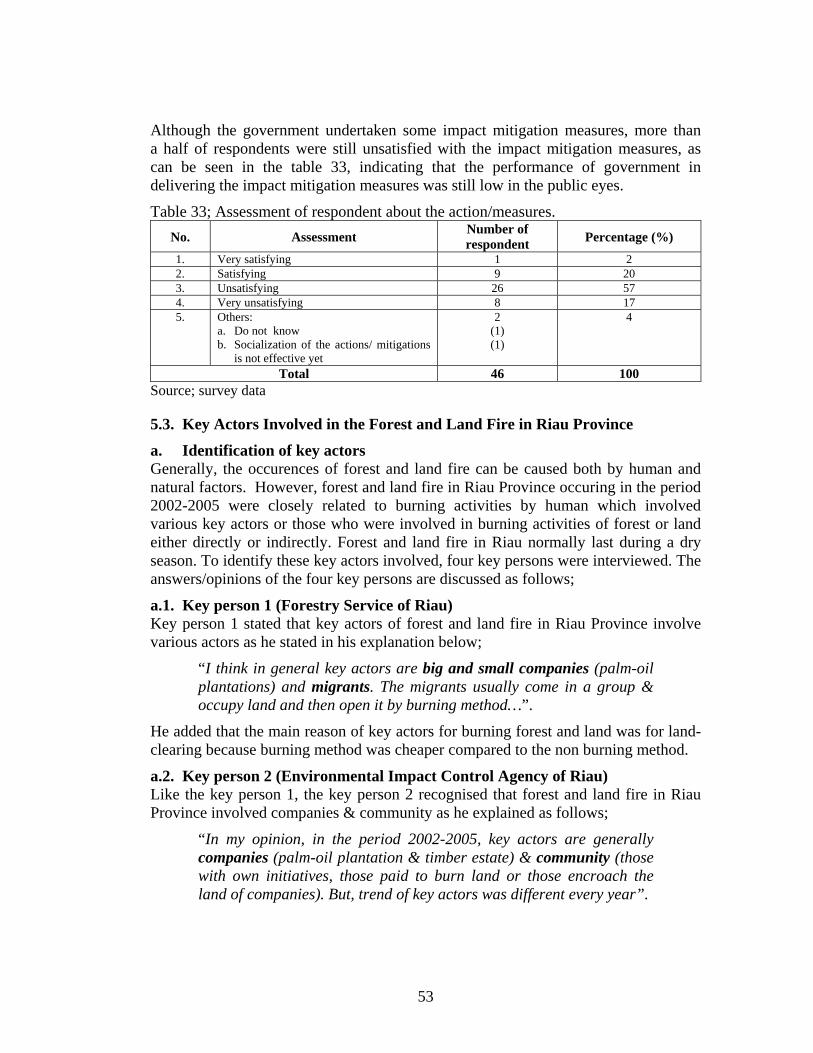
Although the government undertaken some impact mitigation measures, more than a half of respondents were still unsatisfied with the impact mitigation measures, as can be seen in the table 33, indicating that the performance of government in delivering the impact mitigation measures was still low in the public eyes.
Table 33; Assessment of respondent about the action/measures. No. Assessment Number of
respondent Percentage (%) 1. Very satisfying 1 2 2. Satisfying 9 20 3. Unsatisfying 26 57 4. Very unsatisfying 8 17 5. Others:
a. Do not know b. Socialization of the actions/ mitigations
is not effective yet
2 (1) (1)
4
Total 46 100 Source; survey data
5.3. Key Actors Involved in the Forest and Land Fire in Riau Province
a. Identification of key actors Generally, the occurences of forest and land fire can be caused both by human and natural factors. However, forest and land fire in Riau Province occuring in the period 2002-2005 were closely related to burning activities by human which involved various key actors or those who were involved in burning activities of forest or land either directly or indirectly. Forest and land fire in Riau normally last during a dry season. To identify these key actors involved, four key persons were interviewed. The answers/opinions of the four key persons are discussed as follows;
a.1. Key person 1 (Forestry Service of Riau) Key person 1 stated that key actors of forest and land fire in Riau Province involve various actors as he stated in his explanation below;
“I think in general key actors are big and small companies (palm-oil plantations) and migrants. The migrants usually come in a group & occupy land and then open it by burning method…”.
He added that the main reason of key actors for burning forest and land was for land-clearing because burning method was cheaper compared to the non burning method.
a.2. Key person 2 (Environmental Impact Control Agency of Riau) Like the key person 1, the key person 2 recognised that forest and land fire in Riau Province involved companies & community as he explained as follows;
“In my opinion, in the period 2002-2005, key actors are generally companies (palm-oil plantation & timber estate) & community (those with own initiatives, those paid to burn land or those encroach the land of companies). But, trend of key actors was different every year”.
53
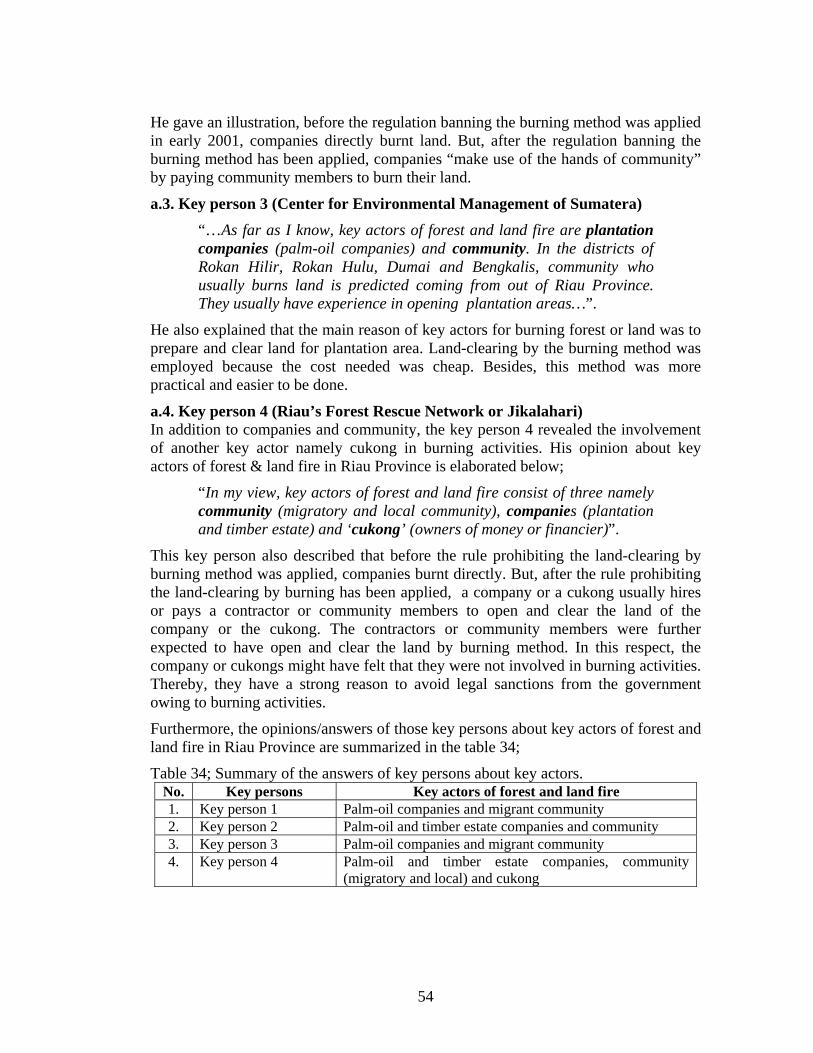
He gave an illustration, before the regulation banning the burning method was applied in early 2001, companies directly burnt land. But, after the regulation banning the burning method has been applied, companies “make use of the hands of community” by paying community members to burn their land.
a.3. Key person 3 (Center for Environmental Management of Sumatera) “…As far as I know, key actors of forest and land fire are plantation companies (palm-oil companies) and community. In the districts of Rokan Hilir, Rokan Hulu, Dumai and Bengkalis, community who usually burns land is predicted coming from out of Riau Province. They usually have experience in opening plantation areas…”.
He also explained that the main reason of key actors for burning forest or land was to prepare and clear land for plantation area. Land-clearing by the burning method was employed because the cost needed was cheap. Besides, this method was more practical and easier to be done.
a.4. Key person 4 (Riau’s Forest Rescue Network or Jikalahari) In addition to companies and community, the key person 4 revealed the involvement of another key actor namely cukong in burning activities. His opinion about key actors of forest & land fire in Riau Province is elaborated below;
“In my view, key actors of forest and land fire consist of three namely community (migratory and local community), companies (plantation and timber estate) and ‘cukong’ (owners of money or financier)”.
This key person also described that before the rule prohibiting the land-clearing by burning method was applied, companies burnt directly. But, after the rule prohibiting the land-clearing by burning has been applied, a company or a cukong usually hires or pays a contractor or community members to open and clear the land of the company or the cukong. The contractors or community members were further expected to have open and clear the land by burning method. In this respect, the company or cukongs might have felt that they were not involved in burning activities. Thereby, they have a strong reason to avoid legal sanctions from the government owing to burning activities.
Furthermore, the opinions/answers of those key persons about key actors of forest and land fire in Riau Province are summarized in the table 34;
Table 34; Summary of the answers of key persons about key actors. No. Key persons Key actors of forest and land fire 1. Key person 1 Palm-oil companies and migrant community 2. Key person 2 Palm-oil and timber estate companies and community 3. Key person 3 Palm-oil companies and migrant community 4. Key person 4 Palm-oil and timber estate companies, community
(migratory and local) and cukong
54
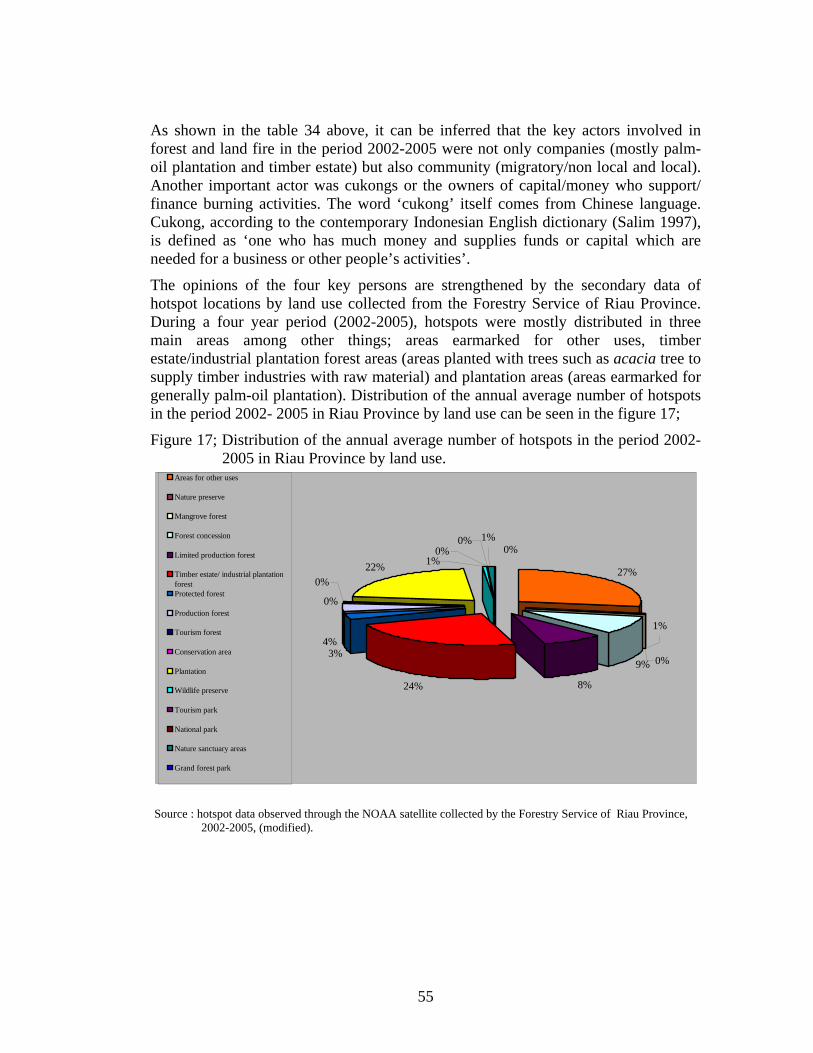
As shown in the table 34 above, it can be inferred that the key actors involved in forest and land fire in the period 2002-2005 were not only companies (mostly palm-oil plantation and timber estate) but also community (migratory/non local and local). Another important actor was cukongs or the owners of capital/money who support/ finance burning activities. The word ‘cukong’ itself comes from Chinese language. Cukong, according to the contemporary Indonesian English dictionary (Salim 1997), is defined as ‘one who has much money and supplies funds or capital which are needed for a business or other people’s activities’.
The opinions of the four key persons are strengthened by the secondary data of hotspot locations by land use collected from the Forestry Service of Riau Province. During a four year period (2002-2005), hotspots were mostly distributed in three main areas among other things; areas earmarked for other uses, timber estate/industrial plantation forest areas (areas planted with trees such as acacia tree to supply timber industries with raw material) and plantation areas (areas earmarked for generally palm-oil plantation). Distribution of the annual average number of hotspots in the period 2002- 2005 in Riau Province by land use can be seen in the figure 17;
Figure 17; Distribution of the annual average number of hotspots in the period 2002- 2005 in Riau Province by land use.
27%
9%
8%24%
3%4%
0%
22%0%
0%1%0%
0%
1%
0%
1%
Areas for other uses
Nature preserve
Mangrove forest
Forest concession
Limited production forest
Timber estate/ industrial plantationforestProtected forest
Production forest
Tourism forest
Conservation area
Plantation
Wildlife preserve
Tourism park
National park
Nature sanctuary areas
Grand forest park
Source : hotspot data observed through the NOAA satellite collected by the Forestry Service of Riau Province, 2002-2005, (modified).
55
As shown in the figure 17 above, 24% of hotspots was found in timber estate/industrial plantation forest areas whereas 22% was detected in plantation area. This shows that almost 50% of hotspots in a four-year period (2002-2005) was located in the areas of business activities of companies. However, this does not mean that nearly 50% of forest and land fire occurrences were caused by companies because the NOAA satellite itself sometimes inaccurately detected the locations of hotspots. For instance, the position of a hotspot on the hotspot map might have possibly deviated from its position on the ground. Therefore, this figure simply indicates that the involvement of companies both palm-oil plantation and timber estate in forest and land fire can not be denied at all since the hotspots are detected in the areas earmarked for plantation and timber estate/industrial plantation forest activities. Meanwhile, the hotspots detected in the areas for other purposes (27%) indicates that community (both local and migratory) were likely to be involved as areas for other purposes are usually earmarked for various activities, notably community activities.
b. Categorization of key actors Since forest and land fire involved various key actors, it is necessary to categorize the types of key actor. Categorization in this research is based on the nature of key actor involvement in forest and land fire in Riau Province (direct or indirect involvement). However, it is important to note that this categorization does not mean that all companies both palm-oil and timber estate as well as communities in Riau Province were involved in burning activities of forest or land. This is simply used to portrait the types of key actors involved in burning activities. Thereby, it is safe to say that, the key actors of forest and land fire can be categorized into two types as follows:
1. Indirect actors These actors usually only support/finance direct actors to burn forest and land. These actors include companies (mostly palm-oil plantation and timber estate/plantation forest) and cukongs. In terms of the main reason for burning, the results of the interviews show that the main reason of indirect actors (companies and cukongs) for burning forest or land was with the purpose of land-clearing. Land-clearing was carried out in order to prepare palm-oil plantation or timber estate areas. In doing a land-clearing, a burning method was preferred because this method was cheaper and more practical compared to a non burning method. In other words, the main reason behind the land-clearing by a burning method was based generally on economic motives. Furthermore, it is clear that these actors play indirect roles in burning activities because they seemed to try to avoid sanctions (jail and fine penalty) from the government. According to the Indonesian act of forestry, sanctions will be imposed on those who burn forest or land. Thereby, the best way to clear their land with cheap costs while avoiding any penalty is to make use of other parties in clearing their land using a burning method.
56
2. Direct actors These actors usually play direct roles in burning activities of forest or land in Riau Province. These actors include migratory and local community as well as contractors. The main reason of direct actors for burning forest and land is because of an economic reason such as they were paid by companies or cukongs to do a land-clearing/burning activities. Another reason is a traditional reason, local community in particular. For instance, local community burnt forest or land with their own initiatives using the burning method because of their long tradition in clearing land for plantation by burning. Although, local community was also considered one of the key actors of forest and land fire, their contribution to forest and land fire is viewed still small as revealed by the key person 1 stated that the contribution of local community to forest and land fire in Riau Province is small as they only burnt small areas. Another relevant view was revealed by the key person 4 that the contribution of local community compared to migratory community, in terms of smoke generated from burning activities, was smaller because local community usually knows better the situation/condition of an area in which they will set on fire. On the contrary, migratory community does not know well the situation/condition of an area in which they will set on fire. As a result, they usually have a bad fire management.
He gave an example that migratory community burnt peatland whereas local community did not. Besides, local community has their own ways in burning land. For example, in burning land, they generally prevent fire from burning other areas (controlled burning). Therefore, fire set by local community does not produce a lot of smoke. To sum up, the problem of forest and land fire in Riau Province is very complex as it involved various key actors from community to companies. This problem even becomes more complex because it is also incurred not only by traditional reason but also economic reason. 5.4. Measures of Government of Riau Province to Overcome Forest & Land Fire
a. Identification of measures To overcome forest and land fire in Indonesia, there have been two legal bases which are usually used by the government namely the act of forestry no. 41/1999 and the governmental regulation no. 4/2001 about the control of damage and or environmental pollution related to forest and or land fire. In the act of forestry no. 41, the prohibition of burning forest is clearly stated in the article no. 50, verse 3d whereas the sanctions (jail and fine penalty) are stated in the article 78, verse 3. Furthermore, the division of authority and responsibility in coping with forest & land fire is regulated in the governmental regulation no. 4/2001.
Like, the act of forestry no. 41, the governmental regulation no. 4 prohibits every people to burn forest and or land as stated in its article no. 11. These further become important legal bases for measures undertaken by the provincial government of Riau Province, in cooperation with other governmental agencies especially central government, to prevent and control forest & land fire in Riau Province. To encourage the implementation of measures to cope with forest and land fire, the center for forest
57
and land fire control of Riau Province called Pusdalkarhutla was established by the governor of Riau through the decree of the governor of Riau No. Kpts.25/V/2000 dated May 30 2000 which was further replaced with a decree of the Governor of Riau No. 1/2003 dated January 10, 2003.
This decree was finally revised with a new decree of the governor of Riau no. 6 in 2006. Pusdalkarhutla involves such governmental agencies as Environmental Impact Agency of Riau, Estatecrops Service of Riau, Forestry Service of Riau, Local Police of Riau etc. In general, the types of measures to control forest and land fire by Pusdalkarhutla are mainly prevention, fire suppression and law enforcement. The organisational structure of Pusdalkarhutla can be found in the annex 6. Furthermore, to identify measures, including their constraints, to overcome forest and land fire in Riau Province, information was collected from four key persons. The answers/opinions of the four key persons are discussed as follows;
a.1. Key person 1 (Forestry Service of Riau) Key person 1 explicitly divided measures to deal with forest and land fire in Riau Province into three types among other things; prevention measure (socialisation, campaign and advise toward palm-oil companies and timber estate companies about the prohibition of burning forest and land) and direct suppression measure. Another measure is law enforcement (jail & fine penalties). He, further, explained that the main constraints were low quality and the quantity of human resource who deal with forest and land fire, inadequate fire equipment and difficult access to the locations of fire, especially remote areas. On top of that, he added that peat factor is one of the main problems in controlling forest and land fire because fire on peatland is a ground fire which is very difficult to be extinguished.
To put out the fire on peat needs a high intensity of rain water so that peat land becomes waterlogged. In terms of law enforcement, he stated that there were some constraints. Firstly, proving the actor who burn forest and land is very tricky because according to the law they must be caught red-handed. Secondly, having witnesses seeing directly the actor who burn forest and land is difficult.
a.2. Key person 2 (Environmental Impact Control Agency of Riau) According to the key person 2, mitigation measure undertaken is a direct suppression in locations of forest and land fire. However, he added that the peat factor is one of the main constraints in extinguishing fire because fire on peatland experiences an incomplete combustion resulting in a great amount of smoke.
a.3. Key person 3 (Center for Environmental Management of Sumatera) Measures to control forest and land fire as revealed by the key person 3 are among other things; socialisation about forest and land fire prevention, workshop on forest and land fire and investigation of companies accused of burning forest or land. He also described that according to the governmental regulation, owners of land can be imposed sanctions (civil law or criminal law) if their land gets burnt. In other words, the owners of land are responsible for protecting their land from fire. However, although, hotspots detected by the satellite can help predict the locations of forest or
58
land fire, including the names of companies/owners of land, imposing legal sanctions is an uneasy task. In terms of law enforcement, he pointed out that the different perception or interpretation among law apparatus concerning sanctions for those who burn forest and land is a main constraint.
a.4. Key person 4 (Riau’s Forest Rescue Network or Jikalahari) The key person 4 only explained that there are some constraints of overcoming forest and land fire problem. Firstly, the credibility of law apparatus in the eyes of public is still low. Secondly, proving actors who burnt forest and land legally is very tricky because according to the Indonesian positive law that proving the actor burning needs eye witnesses and proof/evidence. But, in practice, having eye witnesses and proofs is sometimes uneasy. Furthermore, measures undertaken the government of Riau Province to overcome forest and land fire are shown in table 35;
Table 35; Summary of the answer of key persons about measures. No. Key persons Measures 1. Key person 1 Prevention (socialisation, campaign & advise), fire
suppression and law enforcement (jail & fine penalties) 2. Key person 2 Fire suppression in locations of forest and land fire 3. Key person 3 Socialisation, workshop, and investigation
b. Categorization of measures Categorization of measures can be based on the implementation time of measures undertaken (before, during and after of forest and land fire occurences) as follows;
1. Prevention Measure Prevention is an effort to prevent or to reduce the possibility of the occurrence of forest and land fire. Prevention is normally carried out before the occurrence of forest and land fire. These measures include workshop, socialisation, campaign and advise toward palm-oil companies and timber estate companies about the prohibition of burning forest and land. Although none of respondents explicitly stated that the establishment of Pusdalkarhutla of Riau Province to prevent and control forest and land fire in Riau Province is a prevention measure, referring to Purbowaseso (2004) who explained that forest and land fire prevention strategy includes some measures, one of which is the establishment of forest and land fire control organisations, the establishment of Pusdalkarhutla of Riau can be categorized as a prevention measure. In relation to the roles of Pusdalkarhutla in preventing and controlling forest and land fire in Riau Province, the key person 1 explained that the role of Pusdalkarhutla is only to coordinate various agencies involved in Pusdalkarhutla. In his opinion, this role makes Pusdalkarhutla less able to do its tasks in controlling forest and land fire effectively. Therefore, he argued that it is necessary to establish a permanently-special body to control forest and land fire similar to Bomba, the Malaysian fire brigade, which deals with all kinds of fires including forest and land fire.
59
2. Suppression Measure Suppression is a direct measure to extinguish forest and land fire. Suppression is usually implemented during the occurrence of forest and land fire by fire teams. Although suppression measures have been undertaken some constraints to control forest and land fire in Riau Province were faced among other things; low quality and the quantity of human resource who deal with forest and land fire, inadequate fire equipment and difficult access to the locations of fire, especially remote areas. On top of that, the peat factor is one of the main problems in controlling forest and land fire because fire on peatland is a ground fire which is very difficult to be put out. This is supported by the notion by Adinugroho et al (2005) stating that, in ground fire, fire, which is not smoldering, burns organic matter so that it only produces white smoke appearing above ground. This makes difficulties in fire suppression activities as fire suppression on peatland will be succesful if burnt peat layer is waterlogged. Therefore, water in great amount is highly needed. Meanwhile Sastry (2000) revealed that peat, which is a blend of decaying organic matters, can burn easily and spread fire rapidly during a period of drought. Sastry (2000) added that the amount of smoke emitted due to burning peat is larger than that of burning other forms of biomass. In the meantime, Jikalahari in its press release dated June 29, 2005 stated that about 45.71% (4,106,242.976 ha) of the mainland of Riau is composed of peat land/forest (Wetlands International 2002). This press release also revealed that the causes of forest and land fire are 0.1% by natural factor and 99% by human factor which consisted of two human activities namely the land-clearing activity for agriculture/ plantation/timber estate/settlement and the canal development activity in peatland. Canals are usually used as an access of wood transportation. However, during a dry season, peatland releases water to canals so that peatland becomes dry and easy to get burnt. Similarly, Adinugroho et al (2005) suggested that development of canals has made peat experience excessive drying in a dry season. This condition finally damages peat because peat experiences an irreversible drying symptom and peat turns into charcoal so that it can not absorb nutrient and retain water anymore.
3. Law enforcement measure Law enforcement measures are imposed on those who proved to burn forest or land. Law enforcement is generally done after the occurrence of forest and land fire. These measures include jail and fine penalties. However, the implementation of law enforcement encountered constraints. Firstly, there is a different perception or interpretation among law apparatus concerning sanctions for those who burn forest and land. Secondly, proving the actor who burn forest and land is very tricky because according to the law they must be caught red-handed. Thirdly, having proofs/evidences and witnesses seeing directly the actor who burn forest and land is difficult. Finally, the credibility of law apparatus in the eyes of public is still low.
To summary, constraints to control forest and land fire in Riau Province in the period 2002-2005 were multi-dimensional involving not only human factor but also natural factor (peat factor).
60
CHAPTER 6 CONCLUSION AND RECOMMENDATION
6.1. Conclusion a. On the basis of both the trend analysis and the opinions of key persons, it can be
concluded that forest and land fire as well as wind direction, in general, contributed to deterioration of air quality of Pekanbaru City. Even, it looks like to exist a trend to relate the air quality deterioration of Pekanbaru City with the increase of hotspot number. This is clear when the number of hotspot in Riau Province is very high (above 5000 hotspots) and the number of hotspots of regencies/high vulnerable areas from which dominant wind direction blows is high (above 2500 hotspots) as it was the case of the months of February and March 2005. Nevertheless, the result of the trend analysis for the months of February and March 2002 shows that the contribution of the increase of forest and land fire as well as dominant wind direction on the deterioration of air quality of Pekanbaru City is very less evident. This is because the dominant wind direction although an important variable in this process can not alone explain all variations of the number of days with deteriorating air quality measured along the studied years. Other variables like raining rate, wind speed and temperature may also play an important role in the air quality of Pekanbaru City. Thereby, the hypothesis “the increase of forest and land fire occurences as well as wind direction have contributed to the deterioration of air quality in Pekanbaru City” is only partially accepted.
b. Smoke haze in Pekanbaru City has resulted in negative impacts both on environment and human. Impacts on environment include deterioration of air quality and reduction of the visibility range. Meanwhile, impacts on human are not only on the health aspect but also on the social aspect. On the health aspect, the impacts vary from direct impacts (respiratory disease or ARI-non pneumonia, eye irritation and the increasing risks of traffic accidents in the streets as a result of a reduced visibility range) to indirect impacts (respiratory disease or ARI-pneumonia). On the other hand, the social impacts include disruption of educational activities and transportation and restriction of people from doing their daily activities. Although the local government (both the provincial government of Riau and the city government of Pekanbaru) have undertaken impact mitigation measures especially health impacts in order to minimise the impacts of smoke haze pollution, it is considered unsatisfied yet.
c. Human burning activities have been the main cause of forest and land fire in Riau Province in the period 2002-2005 involving various actors both indirect and direct actors. Indirect actors or those who only supported/financed burning activities involve mostly palm-oil plantation and timber estate/industrial plantation forest companies as well as cukongs. On the contrary, direct actors or those who usually burn forest or land directly include community both migratory and local community. The main reason of key actors for burning
61
forest and land was with the purpose of land-clearing using the burning method. For the indirect actors, the main consideration to clear land using the burning method is economic considerations in which it is viewed cheaper and faster compared to the non burning method. Conversely, for local community, the main considerations are not only economic consideration but also traditional consideration in which the burning method in land clearing has been their long tradition.
d. Furthermore, although measures had been undertaken such as prevention, fire suppression and law enforcement, fires keep occuring. Some major constraints were faced by the government especially in fire suppression and law enforcement. Main constraints in fire suppression not only include human resource factors but also natural factor i.e. peat factor. Meanwhile, main constraints in law enforcement comprise the difficulties in catching red-handed those who burnt forest or land as well as obtaining eye witnesses and proofs of burning activities of forest and land.
6.2. Recommendation a. In general, impact mitigation measures undertaken by the government are
considered still unsatisfying by respondents (citizents), the government (both the Provincial Government of Riau and the City Government of Pekanbaru) need to improve the performance of impact mitigation measures so that negative impacts, especially health impacts of smoke haze can really be reduced.
b. As land-clearing using the burning method is proved to be having triggered forest and land fire in Riau Province, future research on cheap alternative methods (non burning method) of land-clearing needs to be promoted. These alternative methods are hoped to substitute the use of the burning method which in turn can decrease forest and land fire occurrence in Riau Province.
62
REFERENCE Adinugroho, W. C., I. N. N. Suryadiputra, Bambang Hero Saharjo dan Labueni Siboro 2005, Panduan pengendalian kebakaran hutan dan lahan gambut, Proyek Climate Change, Forests and Peatlands in Indonesia, Wetlands International-Indonesia Programme and Wildlife Habitat Canada, Bogor. Anderson, Ivan P., Imanda Ifran D., and Muhnandar 1999, Vegetation fires in Sumatera Indonesia: A first look at vegetation indices and soil dryness indices in relation to fire occurence, Forest Fire Prevention and Control Project, Palembang. Anies 2005, Mewaspadai penyakit lingkungan; berbagai gangguan kesehatan akibat pengaruh faktor lingkungan, Elex Media Komputindo, Jakarta. Anonymous 1999, Undang-Undang Kehutanan RI no. 41 tahun 1999. Anonymous 1989, Kamus kehutanan, Departemen Kehutanan Indonesia, Jakarta. Anonymous 1997, Handbook of Indonesian Forestry, Departemen Kehutanan Indonesia, Jakarta. Anonymous 2006, ‘Indonesia Barat tertutup asap’, Kompas October 2, p. 15. Badan Pengendalian Dampak Lingkungan Daerah (Bapedalda) Kota Pekanbaru 2002, Buku data kualitas udara Kota Pekanbaru, Bapedalda Pekanbaru. Biro Pusat Statistik Pekanbaru 2005, Pekanbaru dalam angka 2004/2005, Biro Pusat Statistik Pekanbaru, Pekanbaru. Boubel, R. W., Fox, D. L., Turner, D. B., and Stern, A.C. 1994, Fundamentals of air pollution, third edition, Academic Press, London. Brilhante, O., El-Hefnawi, A. and El-Sherif, D. 2002, Integrated approach to environmental impact assessment training, Institute of Housing and Urban Development Studies (IHS) & Urban Training & Studies Institute, Rotterdam. Brilhante, O. and Tambellini, Ana M. T., 2002, ‘Particulate suspended matters and cases of respiratory diseases in Rio de Janeiro City (Brazil)’, Environmental Health Research, vol. 12 No. 2 p.p. 169-174. Brilhante, O. and Frank, E. 2003, Municipal environmental planning and management training, Institute of Housing & Urban Development Studies, Rotterdam
63
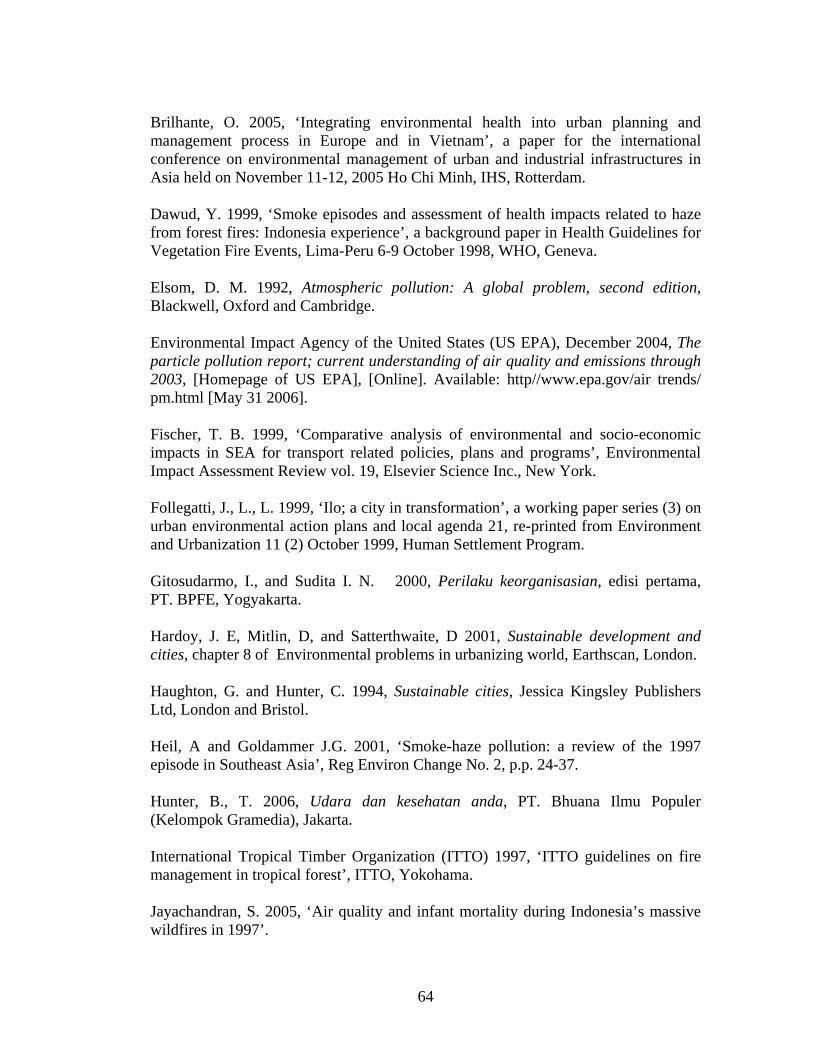
Brilhante, O. 2005, ‘Integrating environmental health into urban planning and management process in Europe and in Vietnam’, a paper for the international conference on environmental management of urban and industrial infrastructures in Asia held on November 11-12, 2005 Ho Chi Minh, IHS, Rotterdam. Dawud, Y. 1999, ‘Smoke episodes and assessment of health impacts related to haze from forest fires: Indonesia experience’, a background paper in Health Guidelines for Vegetation Fire Events, Lima-Peru 6-9 October 1998, WHO, Geneva. Elsom, D. M. 1992, Atmospheric pollution: A global problem, second edition, Blackwell, Oxford and Cambridge. Environmental Impact Agency of the United States (US EPA), December 2004, The particle pollution report; current understanding of air quality and emissions through 2003, [Homepage of US EPA], [Online]. Available: http//www.epa.gov/air trends/ pm.html [May 31 2006]. Fischer, T. B. 1999, ‘Comparative analysis of environmental and socio-economic impacts in SEA for transport related policies, plans and programs’, Environmental Impact Assessment Review vol. 19, Elsevier Science Inc., New York. Follegatti, J., L., L. 1999, ‘Ilo; a city in transformation’, a working paper series (3) on urban environmental action plans and local agenda 21, re-printed from Environment and Urbanization 11 (2) October 1999, Human Settlement Program. Gitosudarmo, I., and Sudita I. N. 2000, Perilaku keorganisasian, edisi pertama, PT. BPFE, Yogyakarta. Hardoy, J. E, Mitlin, D, and Satterthwaite, D 2001, Sustainable development and cities, chapter 8 of Environmental problems in urbanizing world, Earthscan, London. Haughton, G. and Hunter, C. 1994, Sustainable cities, Jessica Kingsley Publishers Ltd, London and Bristol. Heil, A and Goldammer J.G. 2001, ‘Smoke-haze pollution: a review of the 1997 episode in Southeast Asia’, Reg Environ Change No. 2, p.p. 24-37. Hunter, B., T. 2006, Udara dan kesehatan anda, PT. Bhuana Ilmu Populer (Kelompok Gramedia), Jakarta. International Tropical Timber Organization (ITTO) 1997, ‘ITTO guidelines on fire management in tropical forest’, ITTO, Yokohama. Jayachandran, S. 2005, ‘Air quality and infant mortality during Indonesia’s massive wildfires in 1997’.
64
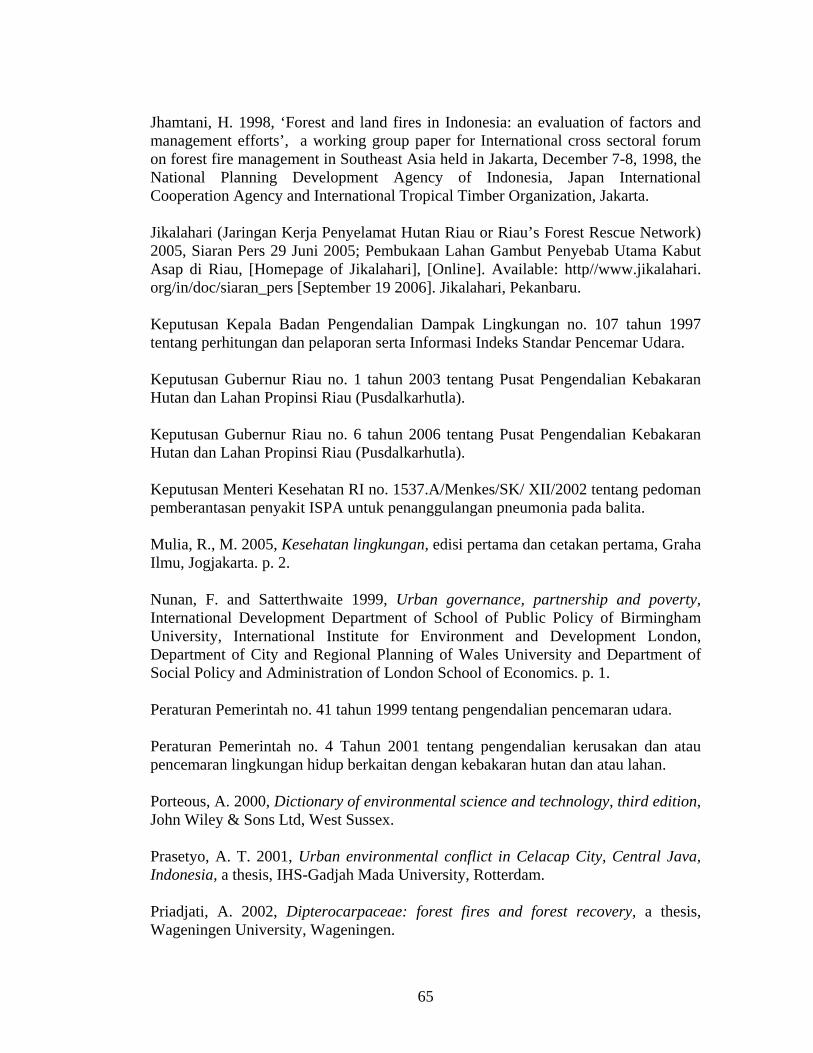
Jhamtani, H. 1998, ‘Forest and land fires in Indonesia: an evaluation of factors and management efforts’, a working group paper for International cross sectoral forum on forest fire management in Southeast Asia held in Jakarta, December 7-8, 1998, the National Planning Development Agency of Indonesia, Japan International Cooperation Agency and International Tropical Timber Organization, Jakarta. Jikalahari (Jaringan Kerja Penyelamat Hutan Riau or Riau’s Forest Rescue Network) 2005, Siaran Pers 29 Juni 2005; Pembukaan Lahan Gambut Penyebab Utama Kabut Asap di Riau, [Homepage of Jikalahari], [Online]. Available: http//www.jikalahari. org/in/doc/siaran_pers [September 19 2006]. Jikalahari, Pekanbaru. Keputusan Kepala Badan Pengendalian Dampak Lingkungan no. 107 tahun 1997 tentang perhitungan dan pelaporan serta Informasi Indeks Standar Pencemar Udara. Keputusan Gubernur Riau no. 1 tahun 2003 tentang Pusat Pengendalian Kebakaran Hutan dan Lahan Propinsi Riau (Pusdalkarhutla). Keputusan Gubernur Riau no. 6 tahun 2006 tentang Pusat Pengendalian Kebakaran Hutan dan Lahan Propinsi Riau (Pusdalkarhutla). Keputusan Menteri Kesehatan RI no. 1537.A/Menkes/SK/ XII/2002 tentang pedoman pemberantasan penyakit ISPA untuk penanggulangan pneumonia pada balita. Mulia, R., M. 2005, Kesehatan lingkungan, edisi pertama dan cetakan pertama, Graha Ilmu, Jogjakarta. p. 2. Nunan, F. and Satterthwaite 1999, Urban governance, partnership and poverty, International Development Department of School of Public Policy of Birmingham University, International Institute for Environment and Development London, Department of City and Regional Planning of Wales University and Department of Social Policy and Administration of London School of Economics. p. 1. Peraturan Pemerintah no. 41 tahun 1999 tentang pengendalian pencemaran udara. Peraturan Pemerintah no. 4 Tahun 2001 tentang pengendalian kerusakan dan atau pencemaran lingkungan hidup berkaitan dengan kebakaran hutan dan atau lahan. Porteous, A. 2000, Dictionary of environmental science and technology, third edition, John Wiley & Sons Ltd, West Sussex. Prasetyo, A. T. 2001, Urban environmental conflict in Celacap City, Central Java, Indonesia, a thesis, IHS-Gadjah Mada University, Rotterdam. Priadjati, A. 2002, Dipterocarpaceae: forest fires and forest recovery, a thesis, Wageningen University, Wageningen.
65
Purbowaseso, B. 2004, Pengendalian kebakaran hutan; suatu pengantar, Rineka Cipta, Jakarta Qadri, S.T. (ed.) 2001, ‘Fire, smoke and haze’; the ASEAN response strategy, Asian Development Bank, Manila. Quah, E. 2002, ‘Transboundary pollution in South East Asia: The Indonesian Fires’, World Development vol. 30 no. 3 pp. 429-441, Elsevier Science Ltd. Sadat, D., N. et al 2003, ‘Udara bersih hak kita bersama’, Pelangi, Jakarta. Salim, P. 1997, The contemporary Indonesian-English dictionary, first edition, Modern English Press, Jakarta. Sastry, N. 2000, ‘Forest fires, air pollution and mortality in Southeast Asia’, a working paper, RAND, Santa Monica CA. Schwela, D., Goldammer, J. G., Morawska, L. H., and Simpson, O. (eds). 1999, ‘Health guidelines for vegetation fires events’, published on behalf of the United Nations Environment Programme-Nairobi, WHO-Geneva, WMO-Geneva and the Institute of Environmental Epidemiology Ministry of the Environment-Singapore. Sobur, A. 2003, Psikologi umum, Pustaka Setia, Bandung. Soedomo, M., 2001, Pencemaran udara, Institut Teknologi Bandung, Bandung. Soemarwoto, O. 2003, Analisis mengenai dampak lingkungan, Gadjah Mada University Press, Jogjakarta. Sumardi and Widyastuti, S. M. 2004, Dasar-dasar perlindungan hutan, Gadjah Mada University Press, Yogyakarta. Suswati, A., C., S., P. and Taneo, S., Y., M 2004, ‘Respon masyarakat penghuni permukiman sekitar industri keramik terhadap pencemaran udara akibat aktifitas pembakaran keramik’, Manusia dan lingkungan, vol. XI, no. 3, november 2004. Tacconi, L. 2003, ‘Fires in Indonesia: causes, costs and policy implications’, an occasional paper no. 38, Center for International Forestry Research, Bogor. Walgito, B. 1999, Psikologi sosial (suatu pengantar), edisi revisi, Andi, Jogjakarta. Westman, W., E. 1985, Ecology, impact assessment and environmental planning, John Wiley & Sons Inc., New York-Chicester-Brisbane-Toronto-Singapore.
66
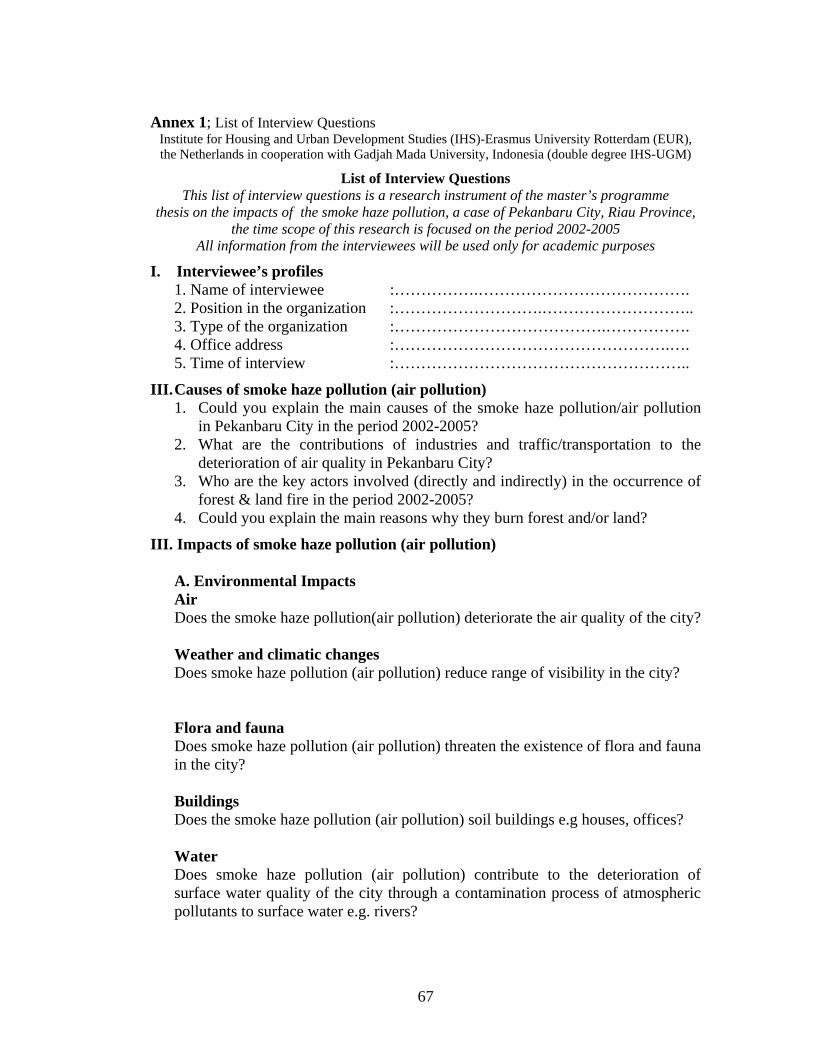
Annex 1; List of Interview Questions Institute for Housing and Urban Development Studies (IHS)-Erasmus University Rotterdam (EUR), the Netherlands in cooperation with Gadjah Mada University, Indonesia (double degree IHS-UGM)
List of Interview Questions This list of interview questions is a research instrument of the master’s programme
thesis on the impacts of the smoke haze pollution, a case of Pekanbaru City, Riau Province, the time scope of this research is focused on the period 2002-2005
All information from the interviewees will be used only for academic purposes
I. Interviewee’s profiles 1. Name of interviewee :…………….…………………………………. 2. Position in the organization :……………………….……………………….. 3. Type of the organization :………………………………….……………. 4. Office address :…………………………………………….…. 5. Time of interview :………………………………………………..
III. Causes of smoke haze pollution (air pollution) 1. Could you explain the main causes of the smoke haze pollution/air pollution
in Pekanbaru City in the period 2002-2005? 2. What are the contributions of industries and traffic/transportation to the
deterioration of air quality in Pekanbaru City? 3. Who are the key actors involved (directly and indirectly) in the occurrence of
forest & land fire in the period 2002-2005? 4. Could you explain the main reasons why they burn forest and/or land?
III. Impacts of smoke haze pollution (air pollution) A. Environmental Impacts Air Does the smoke haze pollution(air pollution) deteriorate the air quality of the city? Weather and climatic changes Does smoke haze pollution (air pollution) reduce range of visibility in the city? Flora and fauna Does smoke haze pollution (air pollution) threaten the existence of flora and fauna in the city? Buildings Does the smoke haze pollution (air pollution) soil buildings e.g houses, offices? Water Does smoke haze pollution (air pollution) contribute to the deterioration of surface water quality of the city through a contamination process of atmospheric pollutants to surface water e.g. rivers?
67
Soil Does the smoke haze pollution (air pollution) contribute to the deterioration of the soil quality of the city through a contamination process of atmospheric pollutants to soil? B. Health Impacts 1. Does the smoke haze pollution (air pollution) cause respiratory system
disturbances/diseases 2. Does the smoke haze pollution (air pollution) cause eye irritation 3. Does the smoke haze pollution (air pollution) cause skin irritation 4. Does the smoke haze pollution (air pollution) increase the risk of traffic
accidents of drivers on the streets due to a reduced visibility. 5. Does the smoke haze pollution (air pollution) increase the mortality risk of
elderly people & those with pre-existing respiratory diseases. 6. What are the groups of citizens who are most affected, in terms of the health
aspect, by the smoke haze pollution (air pollution)? C. Social Impacts 1. Does the smoke haze pollution (air pollution) result in the loss/decrease of
income and/or livelihood opportunity? 2. Does the smoke haze pollution (air pollution) restrict people from doing their
daily activites? 3. Does the smoke haze pollution (air pollution) increase the additional
expenditures of citizens e.g medical costs etc? 4. Does the smoke haze pollution (air pollution) disrupt the transportation of the
city? 5. Does the smoke haze pollution (air pollution) cause the movement of the
citizens of Pekanbaru City into another city? 6. What are the groups of citizens who are most affected, in terms of the social
aspect, by the smoke haze pollution (air pollution)?
IV. Policies/measures 1. Are there are any policies/measures taken by the government (city
government and/or provincial government) to overcome air pollution in Pekanbaru City in general
2. Are there any policies (city/regency, and/or provincial levels) dealing with forest and land fire control?
3. What measures/actions have the provincial government of Riau/the centre for forest and land fire control of Riau (PUSDALKARHUTLA) in the period 2002-2005 undertaken to control forest and land fire?
4. What are the main bottlenecks/constraints faced by the provincial government of Riau/the centre for forest and land fire control of Riau (PUSDALKARHUTLA) in the period 2002-2005 in general in controling forest and land fire?
68
5. How do you see the roles to control the fires by the centre for forest and land fire control of Riau (PUSDALKARHUTLA) in the period 2002-2005 in general?
6. What measures/actions have your organization and the provincial government of Riau as well as the city government of Pekanbaru undertaken to mitigate the impacts (environment, health or social economy) of smoke haze pollution (air pollution)?
7. What are the main bottlenecks/constraints faced by your organization and the provincial government of Riau as well as the city government of Pekanbaru in mitigating the impacts of smoke haze pollution (air pollution)?
69
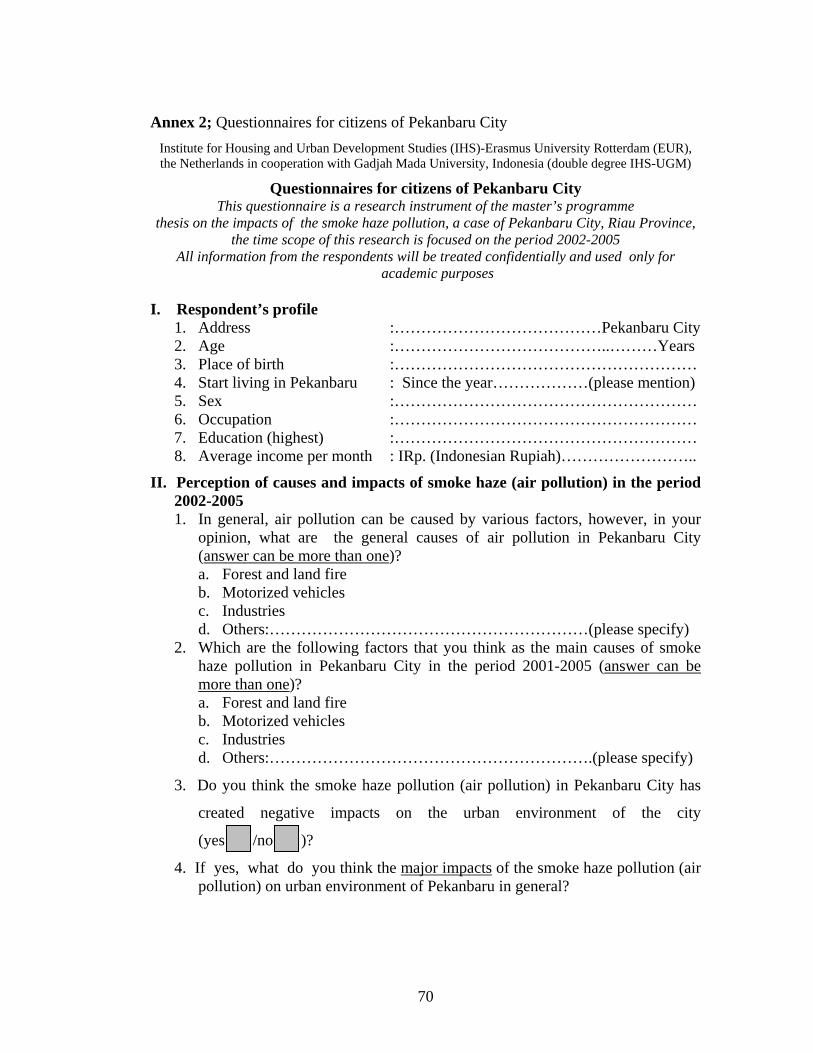
Annex 2; Questionnaires for citizens of Pekanbaru City Institute for Housing and Urban Development Studies (IHS)-Erasmus University Rotterdam (EUR), the Netherlands in cooperation with Gadjah Mada University, Indonesia (double degree IHS-UGM)
Questionnaires for citizens of Pekanbaru City This questionnaire is a research instrument of the master’s programme
thesis on the impacts of the smoke haze pollution, a case of Pekanbaru City, Riau Province, the time scope of this research is focused on the period 2002-2005
All information from the respondents will be treated confidentially and used only for academic purposes
I. Respondent’s profile 1. Address :…………………………………Pekanbaru City 2. Age :…………………………………..………Years 3. Place of birth :………………………………………………… 4. Start living in Pekanbaru : Since the year………………(please mention) 5. Sex :………………………………………………… 6. Occupation :………………………………………………… 7. Education (highest) :………………………………………………… 8. Average income per month : IRp. (Indonesian Rupiah)……………………..
II. Perception of causes and impacts of smoke haze (air pollution) in the period 2002-2005 1. In general, air pollution can be caused by various factors, however, in your
opinion, what are the general causes of air pollution in Pekanbaru City (answer can be more than one)? a. Forest and land fire b. Motorized vehicles c. Industries d. Others:……………………………………………………(please specify)
2. Which are the following factors that you think as the main causes of smoke haze pollution in Pekanbaru City in the period 2001-2005 (answer can be more than one)? a. Forest and land fire b. Motorized vehicles c. Industries d. Others:…………………………………………………….(please specify)
3. Do you think the smoke haze pollution (air pollution) in Pekanbaru City has
created negative impacts on the urban environment of the city
(yes /no )?
4. If yes, what do you think the major impacts of the smoke haze pollution (air pollution) on urban environment of Pekanbaru in general?
70
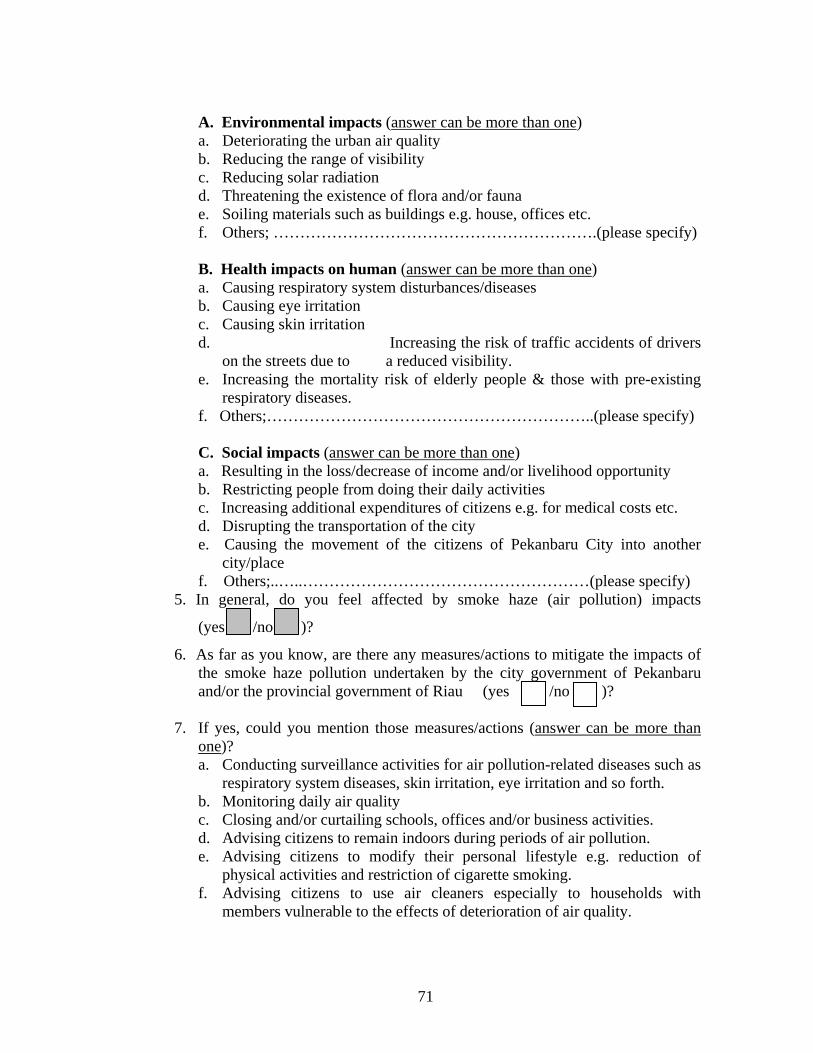
A. Environmental impacts (answer can be more than one) a. Deteriorating the urban air quality b. Reducing the range of visibility c. Reducing solar radiation d. Threatening the existence of flora and/or fauna e. Soiling materials such as buildings e.g. house, offices etc. f. Others; …………………………………………………….(please specify) B. Health impacts on human (answer can be more than one) a. Causing respiratory system disturbances/diseases b. Causing eye irritation c. Causing skin irritation d. Increasing the risk of traffic accidents of drivers
on the streets due to a reduced visibility. e. Increasing the mortality risk of elderly people & those with pre-existing
respiratory diseases. f. Others;……………………………………………………..(please specify) C. Social impacts (answer can be more than one) a. Resulting in the loss/decrease of income and/or livelihood opportunity b. Restricting people from doing their daily activities c. Increasing additional expenditures of citizens e.g. for medical costs etc. d. Disrupting the transportation of the city e. Causing the movement of the citizens of Pekanbaru City into another
city/place f. Others;..…..………………………………………………(please specify)
5. In general, do you feel affected by smoke haze (air pollution) impacts
(yes /no )?
6. As far as you know, are there any measures/actions to mitigate the impacts of the smoke haze pollution undertaken by the city government of Pekanbaru and/or the provincial government of Riau (yes /no )?
7. If yes, could you mention those measures/actions (answer can be more than
one)? a. Conducting surveillance activities for air pollution-related diseases such as
respiratory system diseases, skin irritation, eye irritation and so forth. b. Monitoring daily air quality c. Closing and/or curtailing schools, offices and/or business activities. d. Advising citizens to remain indoors during periods of air pollution. e. Advising citizens to modify their personal lifestyle e.g. reduction of
physical activities and restriction of cigarette smoking. f. Advising citizens to use air cleaners especially to households with
members vulnerable to the effects of deterioration of air quality.
71
g. Advising citizens to use masks and/or distributing masks to citizens particularly to people involved in outdoor activities during periods of air pollution.
h. Advising outdoor precautionary measures e.g. the provision of suitable respirators for workers for outdoor work by employers.
i. Others:………..……………………………..……………..(please specify)
8. How do you feel about measures/actions to mitigate the impacts of the smoke haze undertaken by the city government of Pekanbaru and/or the provincial government of Riau in general (answer can not be more than one)? a. Very satisfied b. Satisfied c. Unsatisfied d. Very unsatisfied e. Others;……….……………………………………………(please specify)
72
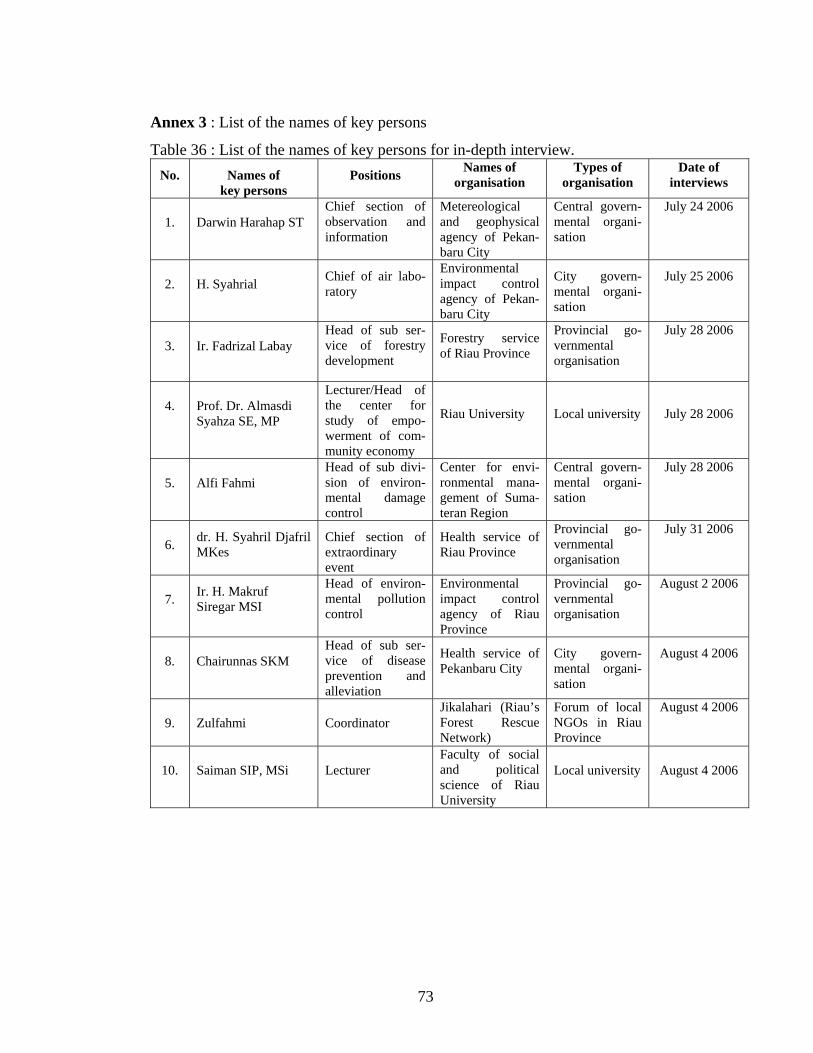
Annex 3 : List of the names of key persons
Table 36 : List of the names of key persons for in-depth interview. No. Names of
key persons Positions Names of
organisation Types of
organisation Date of
interviews
1. Darwin Harahap ST
Chief section of observation and information
Metereological and geophysical agency of Pekan-baru City
Central govern-mental organi-sation
July 24 2006
2. H. Syahrial
Chief of air labo-ratory
Environmental impact control agency of Pekan-baru City
City govern-mental organi-sation
July 25 2006
3. Ir. Fadrizal Labay
Head of sub ser-vice of forestry development
Forestry service of Riau Province
Provincial go-vernmental organisation
July 28 2006
4. Prof. Dr. Almasdi Syahza SE, MP
Lecturer/Head of the center for study of empo-werment of com-munity economy
Riau University Local university July 28 2006
5. Alfi Fahmi
Head of sub divi-sion of environ-mental damage control
Center for envi-ronmental mana-gement of Suma-teran Region
Central govern-mental organi-sation
July 28 2006
6. dr. H. Syahril Djafril MKes
Chief section of extraordinary event
Health service of Riau Province
Provincial go-vernmental organisation
July 31 2006
7. Ir. H. Makruf Siregar MSI
Head of environ-mental pollution control
Environmental impact control agency of Riau Province
Provincial go-vernmental organisation
August 2 2006
8. Chairunnas SKM
Head of sub ser-vice of disease prevention and alleviation
Health service of Pekanbaru City
City govern-mental organi-sation
August 4 2006
9. Zulfahmi
Coordinator Jikalahari (Riau’s Forest Rescue Network)
Forum of local NGOs in Riau Province
August 4 2006
10. Saiman SIP, MSi Lecturer Faculty of social and political science of Riau University
Local university August 4 2006
73
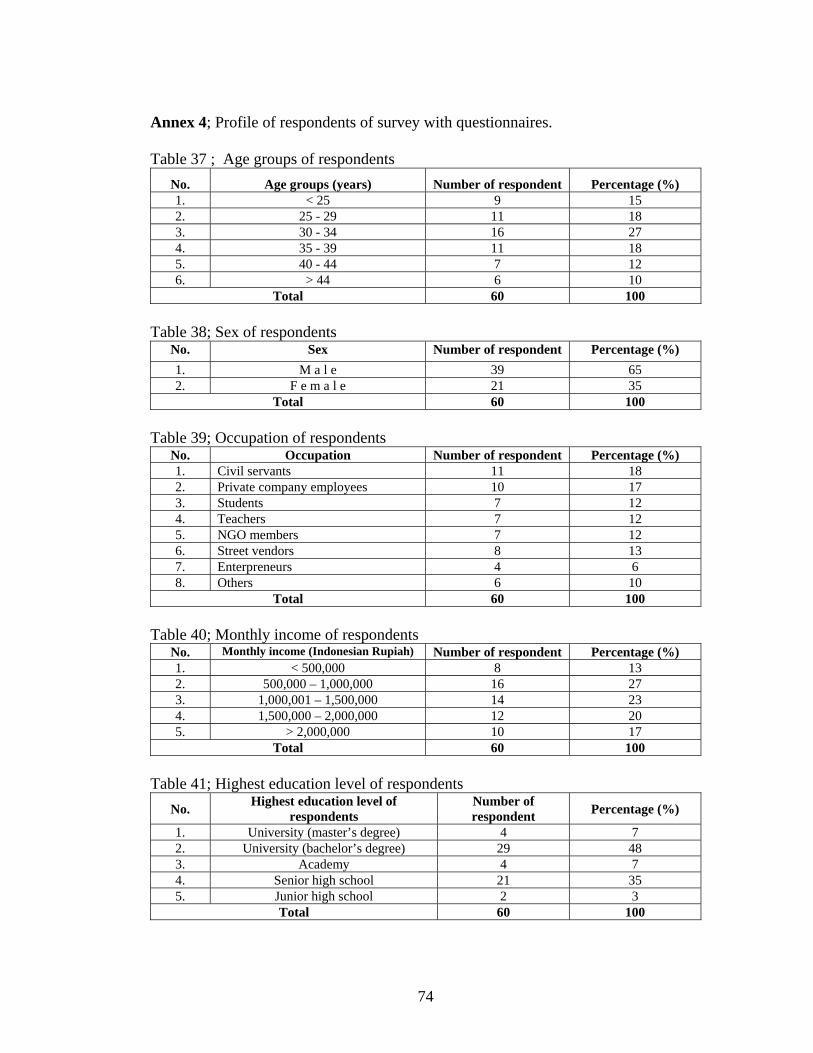
Annex 4; Profile of respondents of survey with questionnaires. Table 37 ; Age groups of respondents
No. Age groups (years) Number of respondent Percentage (%) 1. < 25 9 15 2. 25 - 29 11 18 3. 30 - 34 16 27 4. 35 - 39 11 18 5. 40 - 44 7 12 6. > 44 6 10
Total 60 100 Table 38; Sex of respondents
No. Sex Number of respondent Percentage (%) 1. M a l e 39 65 2. F e m a l e 21 35
Total 60 100 Table 39; Occupation of respondents
No. Occupation Number of respondent Percentage (%) 1. Civil servants 11 18 2. Private company employees 10 17 3. Students 7 12 4. Teachers 7 12 5. NGO members 7 12 6. Street vendors 8 13 7. Enterpreneurs 4 6 8. Others 6 10
Total 60 100 Table 40; Monthly income of respondents
No. Monthly income (Indonesian Rupiah) Number of respondent Percentage (%) 1. < 500,000 8 13 2. 500,000 – 1,000,000 16 27 3. 1,000,001 – 1,500,000 14 23 4. 1,500,000 – 2,000,000 12 20 5. > 2,000,000 10 17
Total 60 100 Table 41; Highest education level of respondents
No. Highest education level of respondents
Number of respondent Percentage (%)
1. University (master’s degree) 4 7 2. University (bachelor’s degree) 29 48 3. Academy 4 7 4. Senior high school 21 35 5. Junior high school 2 3
Total 60 100
74
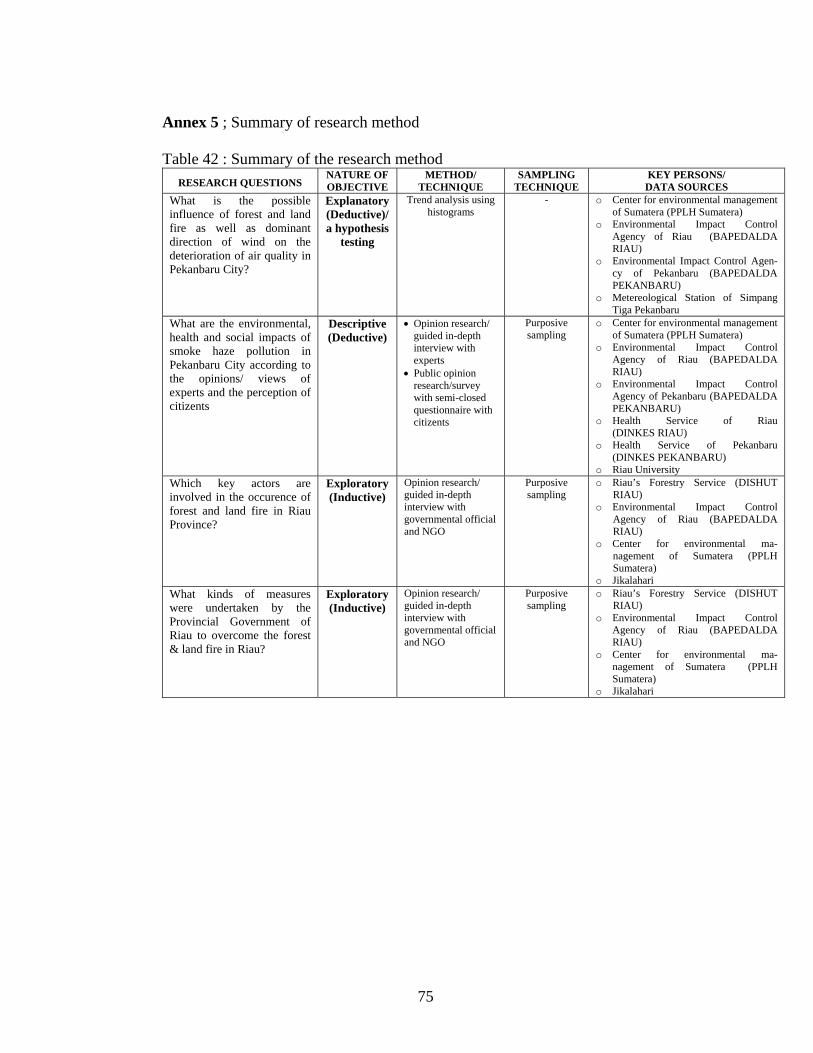
Annex 5 ; Summary of research method Table 42 : Summary of the research method
RESEARCH QUESTIONS NATURE OF OBJECTIVE
METHOD/ TECHNIQUE
SAMPLING TECHNIQUE
KEY PERSONS/ DATA SOURCES
What is the possible influence of forest and land fire as well as dominant direction of wind on the deterioration of air quality in Pekanbaru City?
Explanatory (Deductive)/ a hypothesis
testing
Trend analysis using histograms
- o Center for environmental management of Sumatera (PPLH Sumatera)
o Environmental Impact Control Agency of Riau (BAPEDALDA RIAU)
o Environmental Impact Control Agen-cy of Pekanbaru (BAPEDALDA PEKANBARU)
o Metereological Station of Simpang Tiga Pekanbaru
What are the environmental, health and social impacts of smoke haze pollution in Pekanbaru City according to the opinions/ views of experts and the perception of citizents
Descriptive (Deductive)
• Opinion research/ guided in-depth interview with experts
• Public opinion research/survey with semi-closed questionnaire with citizents
Purposive sampling
o Center for environmental management of Sumatera (PPLH Sumatera)
o Environmental Impact Control Agency of Riau (BAPEDALDA RIAU)
o Environmental Impact Control Agency of Pekanbaru (BAPEDALDA PEKANBARU)
o Health Service of Riau (DINKES RIAU)
o Health Service of Pekanbaru (DINKES PEKANBARU)
o Riau University Which key actors are involved in the occurence of forest and land fire in Riau Province?
Exploratory (Inductive)
Opinion research/ guided in-depth interview with governmental official and NGO
Purposive sampling
o Riau’s Forestry Service (DISHUT RIAU)
o Environmental Impact Control Agency of Riau (BAPEDALDA RIAU)
o Center for environmental ma-nagement of Sumatera (PPLH Sumatera)
o Jikalahari What kinds of measures were undertaken by the Provincial Government of Riau to overcome the forest & land fire in Riau?
Exploratory (Inductive)
Opinion research/ guided in-depth interview with governmental official and NGO
Purposive sampling
o Riau’s Forestry Service (DISHUT RIAU)
o Environmental Impact Control Agency of Riau (BAPEDALDA RIAU)
o Center for environmental ma-nagement of Sumatera (PPLH Sumatera)
o Jikalahari
75
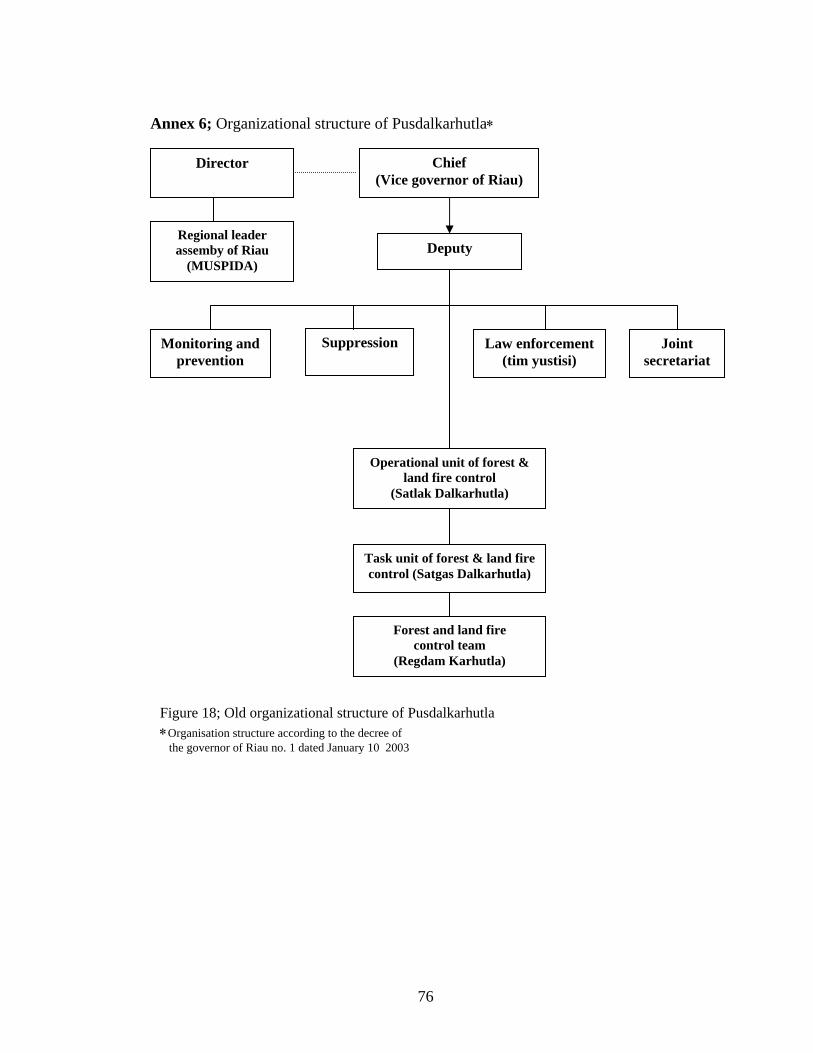
Annex 6; Organizational structure of Pusdalkarhutla∗
Director
Regional leader assemby of Riau
(MUSPIDA) Deputy
Monitoring and prevention
Suppression Law enforcement (tim yustisi)
Joint secretariat
Forest and land fire control team
(Regdam Karhutla)
Task unit of forest & land fire control (Satgas Dalkarhutla)
Operational unit of forest & land fire control
(Satlak Dalkarhutla)
Chief (Vice governor of Riau)
Figure 18; Old organizational structure of Pusdalkarhutla ∗Organisation structure according to the decree of the governor of Riau no. 1 dated January 10 2003
76
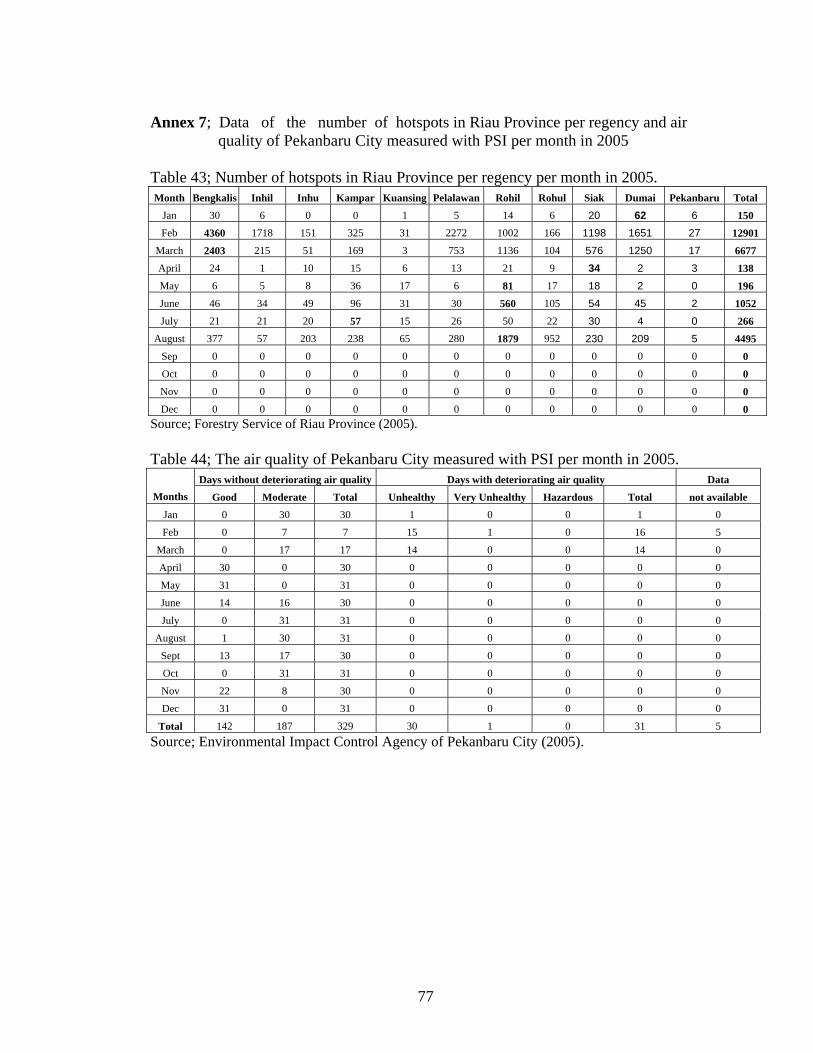
Annex 7; Data of the number of hotspots in Riau Province per regency and air quality of Pekanbaru City measured with PSI per month in 2005 Table 43; Number of hotspots in Riau Province per regency per month in 2005. Month Bengkalis Inhil Inhu Kampar Kuansing Pelalawan Rohil Rohul Siak Dumai Pekanbaru Total
Jan 30 6 0 0 1 5 14 6 20 62 6 150 Feb 4360 1718 151 325 31 2272 1002 166 1198 1651 27 12901
March 2403 215 51 169 3 753 1136 104 576 1250 17 6677 April 24 1 10 15 6 13 21 9 34 2 3 138 May 6 5 8 36 17 6 81 17 18 2 0 196 June 46 34 49 96 31 30 560 105 54 45 2 1052 July 21 21 20 57 15 26 50 22 30 4 0 266
August 377 57 203 238 65 280 1879 952 230 209 5 4495 Sep 0 0 0 0 0 0 0 0 0 0 0 0 Oct 0 0 0 0 0 0 0 0 0 0 0 0 Nov 0 0 0 0 0 0 0 0 0 0 0 0 Dec 0 0 0 0 0 0 0 0 0 0 0 0
Source; Forestry Service of Riau Province (2005). Table 44; The air quality of Pekanbaru City measured with PSI per month in 2005.
Days without deteriorating air quality Days with deteriorating air quality Data Months Good Moderate Total Unhealthy Very Unhealthy Hazardous Total not available
Jan 0 30 30 1 0 0 1 0
Feb 0 7 7 15 1 0 16 5
March 0 17 17 14 0 0 14 0
April 30 0 30 0 0 0 0 0
May 31 0 31 0 0 0 0 0
June 14 16 30 0 0 0 0 0
July 0 31 31 0 0 0 0 0
August 1 30 31 0 0 0 0 0
Sept 13 17 30 0 0 0 0 0
Oct 0 31 31 0 0 0 0 0
Nov 22 8 30 0 0 0 0 0
Dec 31 0 31 0 0 0 0 0
Total 142 187 329 30 1 0 31 5 Source; Environmental Impact Control Agency of Pekanbaru City (2005).
77
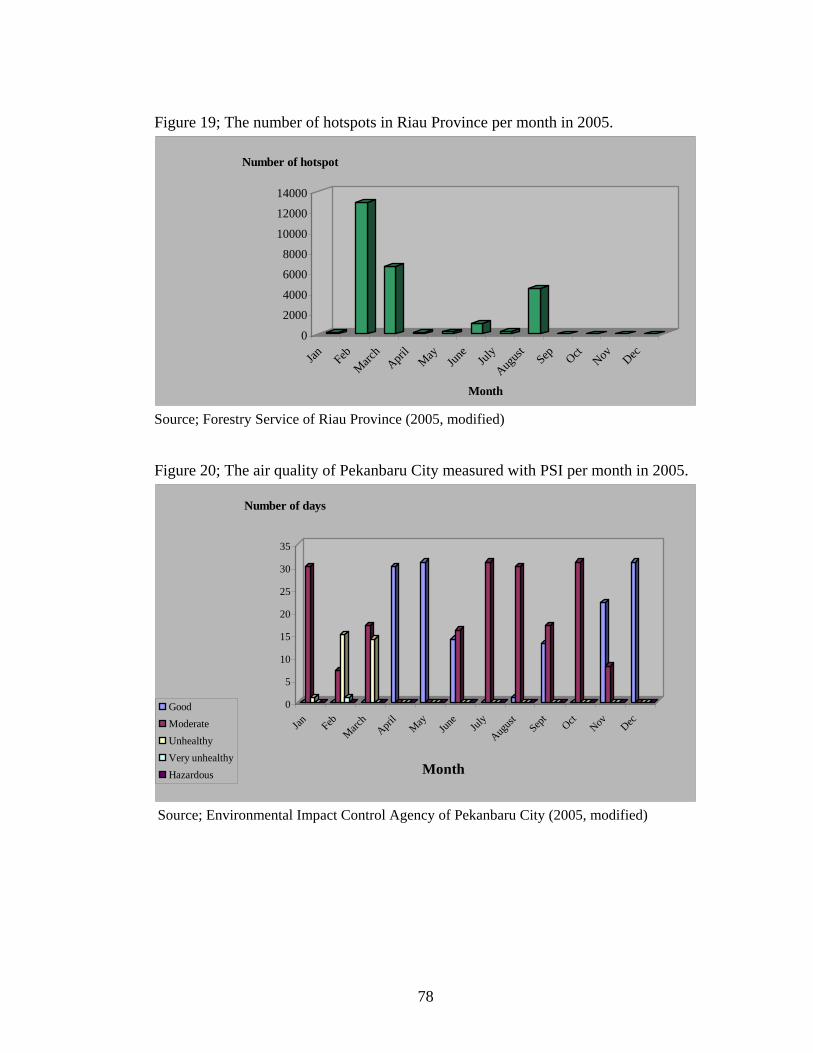
Figure 19; The number of hotspots in Riau Province per month in 2005.
0
2000
4000
6000
8000
10000
12000
14000
Number of hotspot
Jan FebMarc
hApri
lMay Jun
eJul
y
August Sep Oct
Nov Dec
Month
Source; Forestry Service of Riau Province (2005, modified) Figure 20; The air quality of Pekanbaru City measured with PSI per month in 2005.
0
5
10
15
20
25
30
35
Number of days
Jan FebMarc
hApri
lMay Jun
eJul
y
August Sep
tOct
Nov Dec
Month
GoodModerateUnhealthyVery unhealthyHazardous
Source; Environmental Impact Control Agency of Pekanbaru City (2005, modified)
78
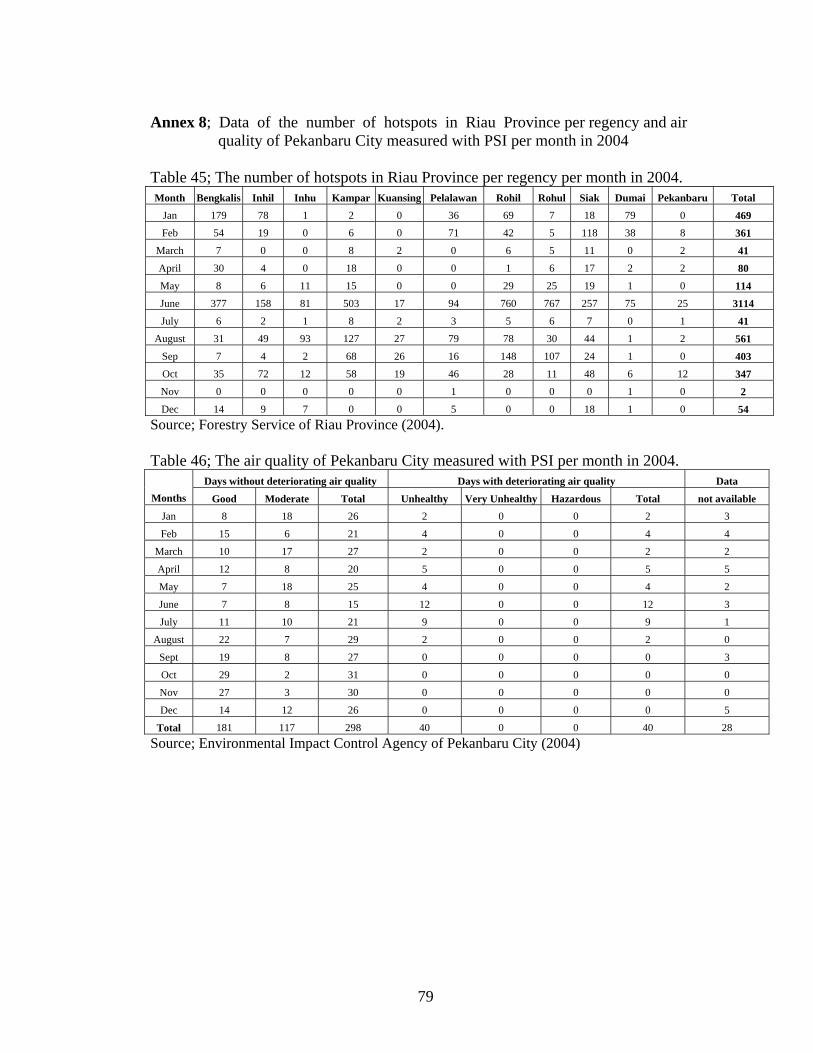
Annex 8; Data of the number of hotspots in Riau Province per regency and air quality of Pekanbaru City measured with PSI per month in 2004 Table 45; The number of hotspots in Riau Province per regency per month in 2004. Month Bengkalis Inhil Inhu Kampar Kuansing Pelalawan Rohil Rohul Siak Dumai Pekanbaru Total
Jan 179 78 1 2 0 36 69 7 18 79 0 469 Feb 54 19 0 6 0 71 42 5 118 38 8 361
March 7 0 0 8 2 0 6 5 11 0 2 41 April 30 4 0 18 0 0 1 6 17 2 2 80 May 8 6 11 15 0 0 29 25 19 1 0 114 June 377 158 81 503 17 94 760 767 257 75 25 3114 July 6 2 1 8 2 3 5 6 7 0 1 41
August 31 49 93 127 27 79 78 30 44 1 2 561 Sep 7 4 2 68 26 16 148 107 24 1 0 403 Oct 35 72 12 58 19 46 28 11 48 6 12 347 Nov 0 0 0 0 0 1 0 0 0 1 0 2 Dec 14 9 7 0 0 5 0 0 18 1 0 54
Source; Forestry Service of Riau Province (2004). Table 46; The air quality of Pekanbaru City measured with PSI per month in 2004.
Days without deteriorating air quality Days with deteriorating air quality Data Months Good Moderate Total Unhealthy Very Unhealthy Hazardous Total not available
Jan 8 18 26 2 0 0 2 3
Feb 15 6 21 4 0 0 4 4
March 10 17 27 2 0 0 2 2
April 12 8 20 5 0 0 5 5
May 7 18 25 4 0 0 4 2
June 7 8 15 12 0 0 12 3
July 11 10 21 9 0 0 9 1
August 22 7 29 2 0 0 2 0
Sept 19 8 27 0 0 0 0 3
Oct 29 2 31 0 0 0 0 0
Nov 27 3 30 0 0 0 0 0
Dec 14 12 26 0 0 0 0 5
Total 181 117 298 40 0 0 40 28 Source; Environmental Impact Control Agency of Pekanbaru City (2004)
79
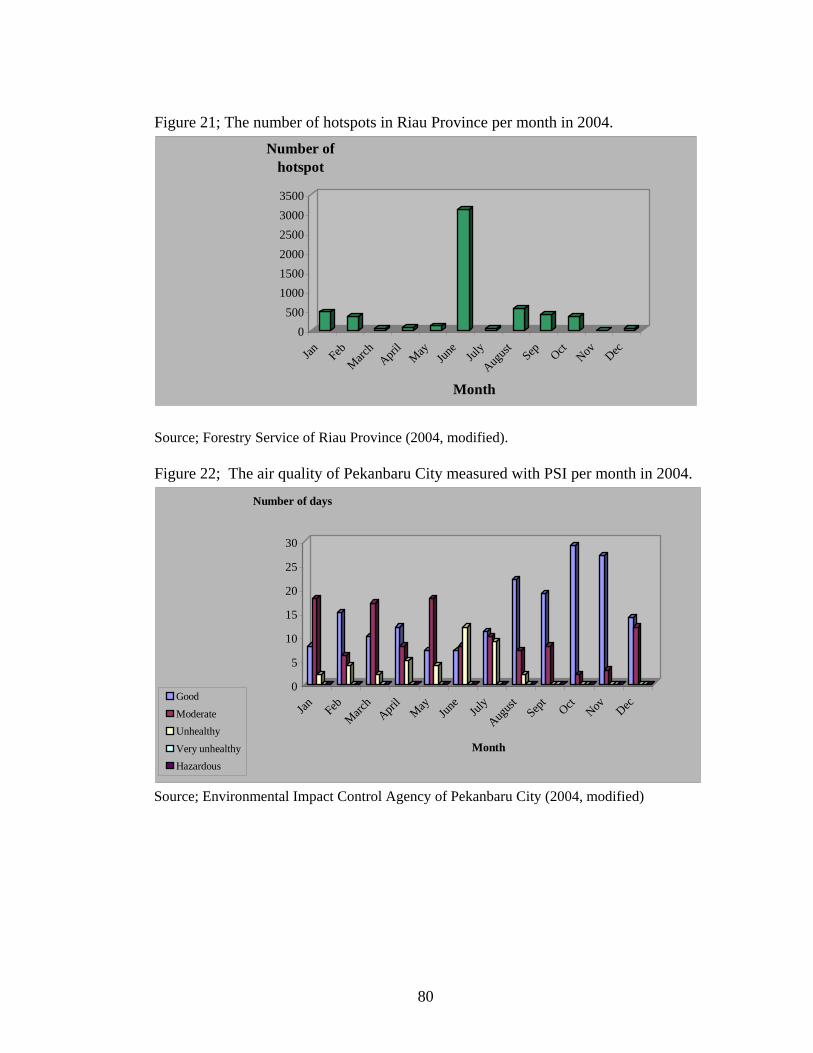
Figure 21; The number of hotspots in Riau Province per month in 2004.
0500
100015002000250030003500
Number of hotspot
Jan FebMarc
hApri
lMay Jun
eJul
y
August Sep Oct
Nov Dec
Month
Source; Forestry Service of Riau Province (2004, modified). Figure 22; The air quality of Pekanbaru City measured with PSI per month in 2004.
0
5
10
15
20
25
30
Number of days
Jan FebMarc
hApri
lMay Jun
eJul
y
August Sep
tOct
Nov Dec
Month
Good
ModerateUnhealthy
Very unhealthyHazardous
Source; Environmental Impact Control Agency of Pekanbaru City (2004, modified)
80
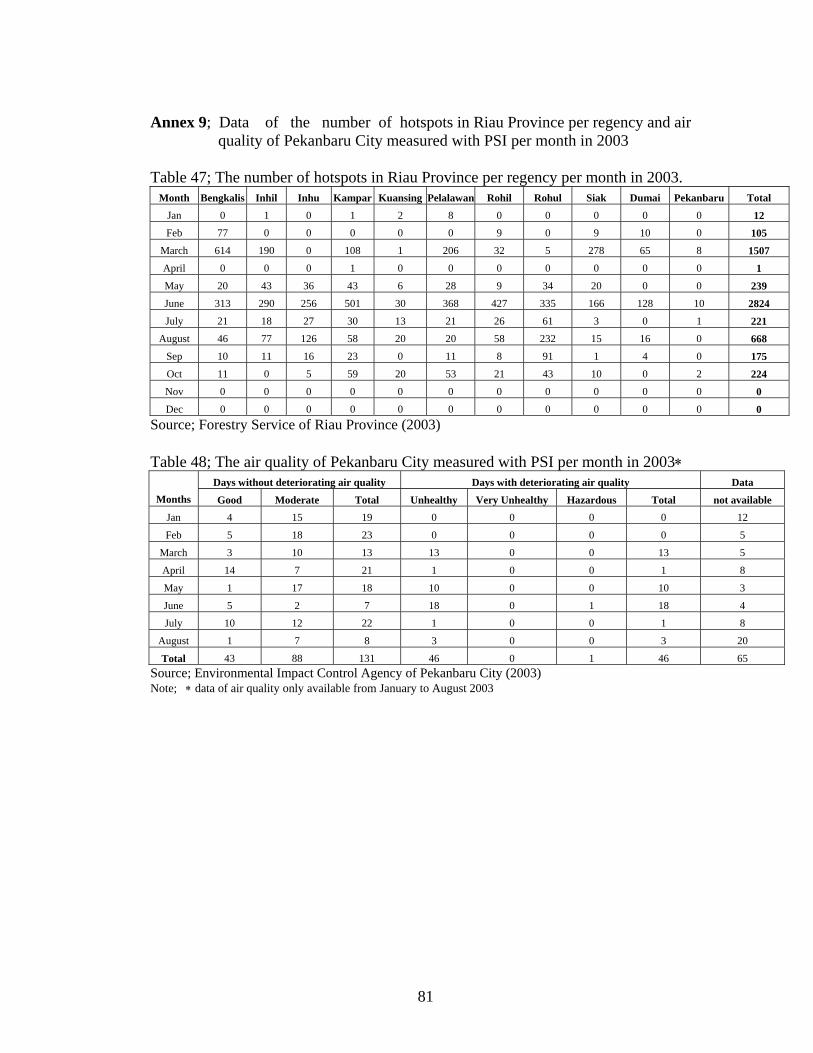
Annex 9; Data of the number of hotspots in Riau Province per regency and air quality of Pekanbaru City measured with PSI per month in 2003 Table 47; The number of hotspots in Riau Province per regency per month in 2003.
Month Bengkalis Inhil Inhu Kampar Kuansing Pelalawan Rohil Rohul Siak Dumai Pekanbaru Total Jan 0 1 0 1 2 8 0 0 0 0 0 12 Feb 77 0 0 0 0 0 9 0 9 10 0 105
March 614 190 0 108 1 206 32 5 278 65 8 1507 April 0 0 0 1 0 0 0 0 0 0 0 1 May 20 43 36 43 6 28 9 34 20 0 0 239 June 313 290 256 501 30 368 427 335 166 128 10 2824 July 21 18 27 30 13 21 26 61 3 0 1 221
August 46 77 126 58 20 20 58 232 15 16 0 668 Sep 10 11 16 23 0 11 8 91 1 4 0 175 Oct 11 0 5 59 20 53 21 43 10 0 2 224 Nov 0 0 0 0 0 0 0 0 0 0 0 0 Dec 0 0 0 0 0 0 0 0 0 0 0 0
Source; Forestry Service of Riau Province (2003) Table 48; The air quality of Pekanbaru City measured with PSI per month in 2003∗
Days without deteriorating air quality Days with deteriorating air quality Data Months Good Moderate Total Unhealthy Very Unhealthy Hazardous Total not available
Jan 4 15 19 0 0 0 0 12
Feb 5 18 23 0 0 0 0 5
March 3 10 13 13 0 0 13 5
April 14 7 21 1 0 0 1 8
May 1 17 18 10 0 0 10 3
June 5 2 7 18 0 1 18 4
July 10 12 22 1 0 0 1 8
August 1 7 8 3 0 0 3 20
Total 43 88 131 46 0 1 46 65 Source; Environmental Impact Control Agency of Pekanbaru City (2003) Note; ∗ data of air quality only available from January to August 2003
81
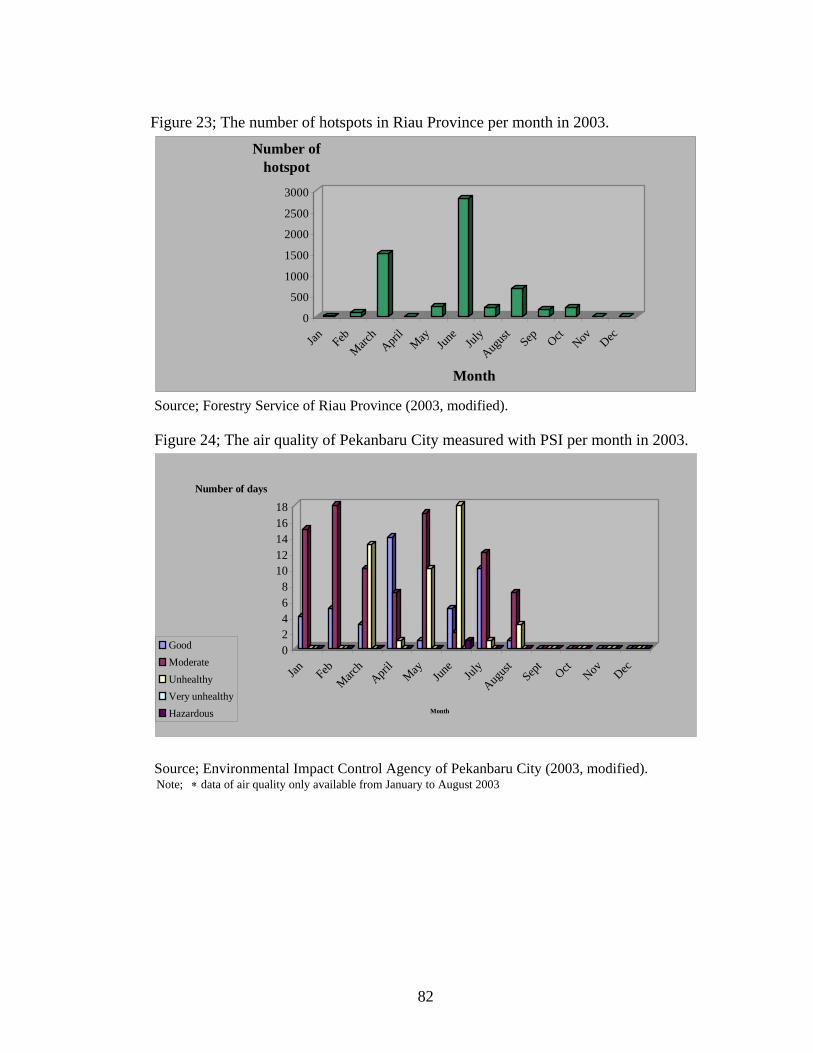
Figure 23; The number of hotspots in Riau Province per month in 2003.
0
500
1000
1500
2000
2500
3000
Number of hotspot
Jan FebMarc
hApri
lMay Jun
eJul
y
August Sep Oct
Nov Dec
Month
Source; Forestry Service of Riau Province (2003, modified). Figure 24; The air quality of Pekanbaru City measured with PSI per month in 2003.
02468
1012141618
Number of days
Jan FebMarc
hApri
lMay Jun
eJul
y
August Sep
tOct
Nov Dec
Month
GoodModerateUnhealthyVery unhealthyHazardous
Source; Environmental Impact Control Agency of Pekanbaru City (2003, modified). Note; ∗ data of air quality only available from January to August 2003
82
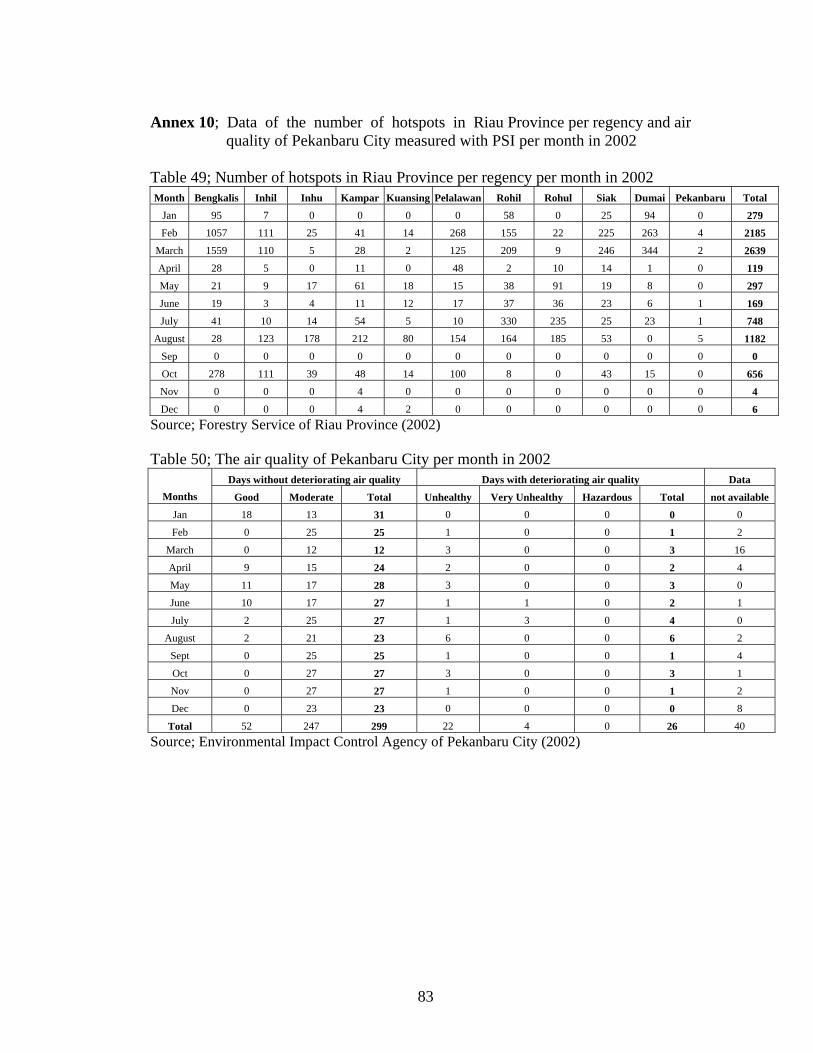
Annex 10; Data of the number of hotspots in Riau Province per regency and air quality of Pekanbaru City measured with PSI per month in 2002 Table 49; Number of hotspots in Riau Province per regency per month in 2002 Month Bengkalis Inhil Inhu Kampar Kuansing Pelalawan Rohil Rohul Siak Dumai Pekanbaru Total
Jan 95 7 0 0 0 0 58 0 25 94 0 279 Feb 1057 111 25 41 14 268 155 22 225 263 4 2185
March 1559 110 5 28 2 125 209 9 246 344 2 2639 April 28 5 0 11 0 48 2 10 14 1 0 119 May 21 9 17 61 18 15 38 91 19 8 0 297 June 19 3 4 11 12 17 37 36 23 6 1 169 July 41 10 14 54 5 10 330 235 25 23 1 748
August 28 123 178 212 80 154 164 185 53 0 5 1182 Sep 0 0 0 0 0 0 0 0 0 0 0 0 Oct 278 111 39 48 14 100 8 0 43 15 0 656 Nov 0 0 0 4 0 0 0 0 0 0 0 4 Dec 0 0 0 4 2 0 0 0 0 0 0 6
Source; Forestry Service of Riau Province (2002) Table 50; The air quality of Pekanbaru City per month in 2002
Days without deteriorating air quality Days with deteriorating air quality Data Months Good Moderate Total Unhealthy Very Unhealthy Hazardous Total not available
Jan 18 13 31 0 0 0 0 0
Feb 0 25 25 1 0 0 1 2
March 0 12 12 3 0 0 3 16
April 9 15 24 2 0 0 2 4
May 11 17 28 3 0 0 3 0
June 10 17 27 1 1 0 2 1
July 2 25 27 1 3 0 4 0
August 2 21 23 6 0 0 6 2
Sept 0 25 25 1 0 0 1 4
Oct 0 27 27 3 0 0 3 1
Nov 0 27 27 1 0 0 1 2
Dec 0 23 23 0 0 0 0 8
Total 52 247 299 22 4 0 26 40 Source; Environmental Impact Control Agency of Pekanbaru City (2002)
83
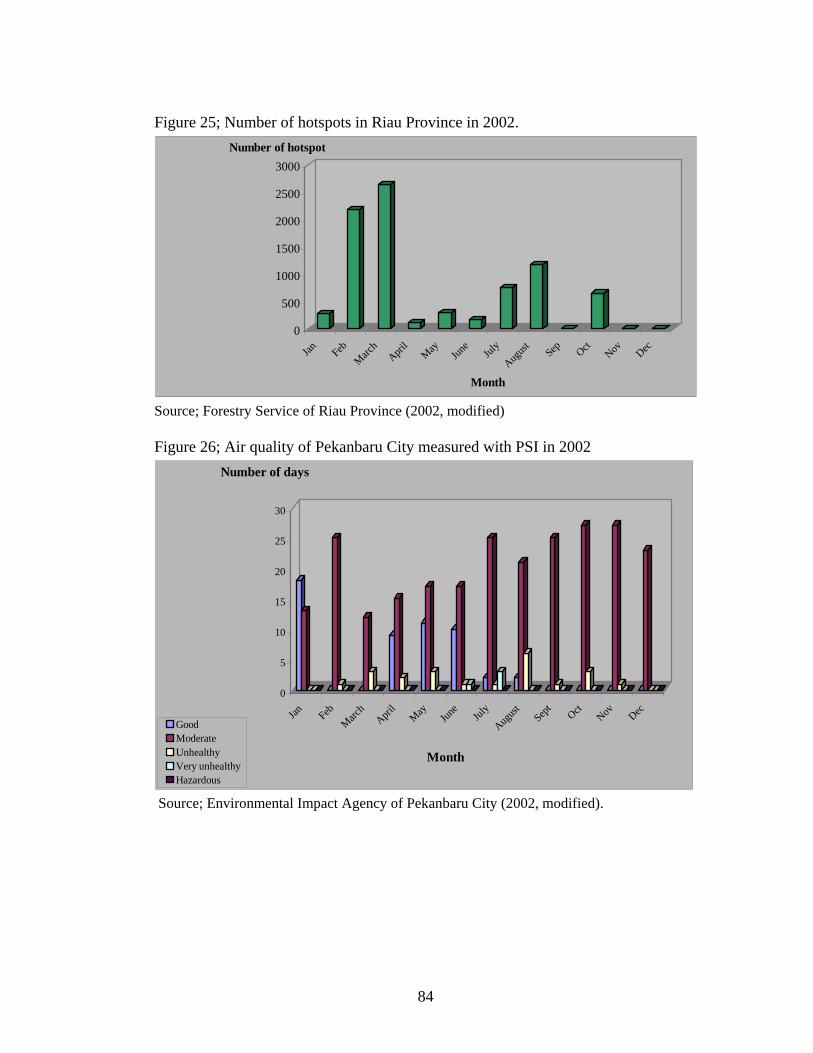
Figure 25; Number of hotspots in Riau Province in 2002.
0
500
1000
1500
2000
2500
3000Number of hotspot
Jan FebMarc
hApri
lMay Jun
eJul
y
August Sep Oct
Nov Dec
Month
Source; Forestry Service of Riau Province (2002, modified) Figure 26; Air quality of Pekanbaru City measured with PSI in 2002
0
5
10
15
20
25
30
Number of days
Jan FebMarc
hApri
lMay Jun
eJul
y
August Sep
tOct
Nov Dec
Month
GoodModerateUnhealthyVery unhealthyHazardous
Source; Environmental Impact Agency of Pekanbaru City (2002, modified).
84
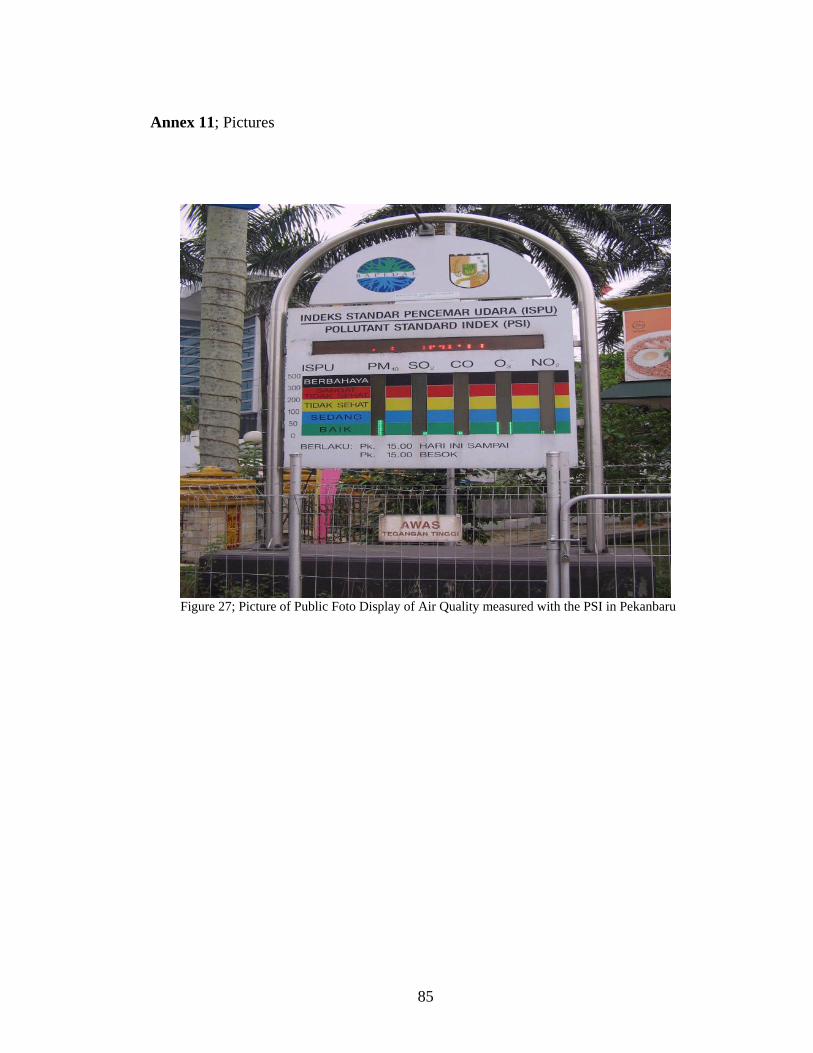
Annex 11; Pictures
Figure 27; Picture of Public Foto Display of Air Quality measured with the PSI in Pekanbaru
85
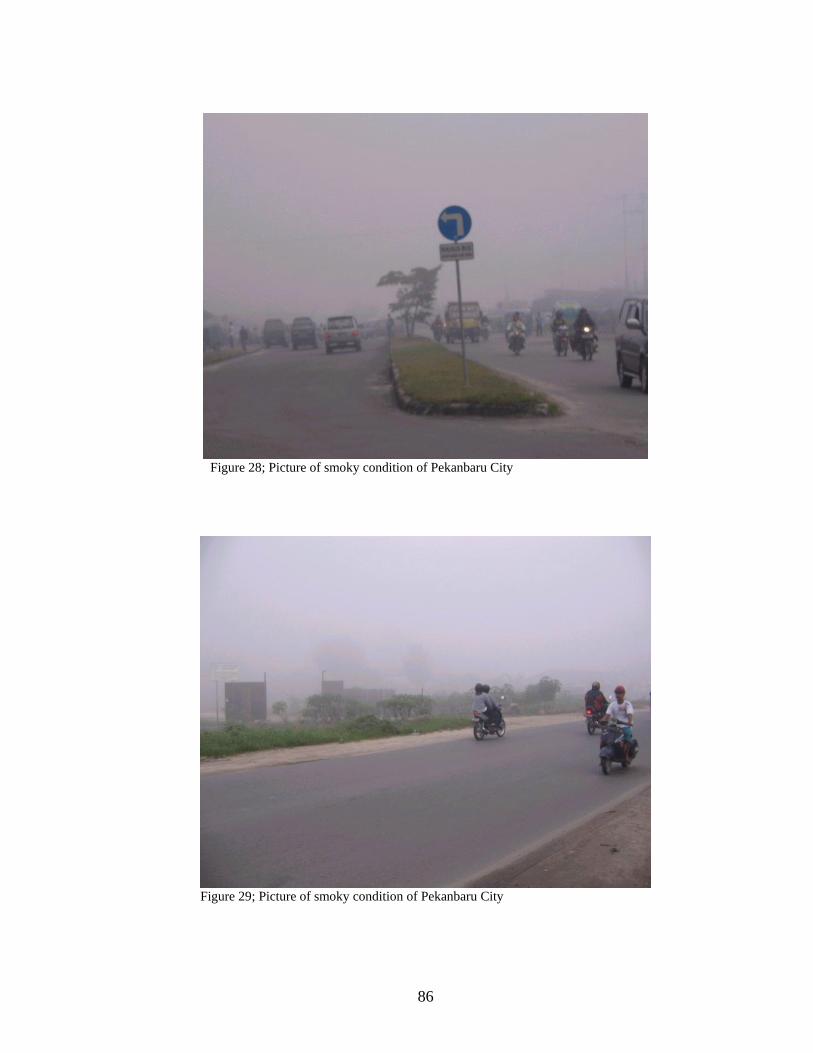
Figure 28; Picture of smoky condition of Pekanbaru City
Figure 29; Picture of smoky condition of Pekanbaru City
86

x