
Master Thesis Serife Akkurt
109
EDIBLE FILMS AND COATINGS FROM CALCIUM CASEINATE AND THEIR APPLICATIONS by SERIFE AKKURT A Thesis submitted to the Graduate School-New Brunswick Rutgers, The State University of New Jersey in partial fulfillment of the requirements for the degree of Master of Science Graduate Program in Food Science written under the direction of Kit L. Yam and approved by ________________________ ________________________ ________________________ ________________________ New Brunswick, New Jersey OCTOBER, 2015
Transcript of Master Thesis Serife Akkurt
EDIBLE FILMS AND COATINGS
FROM CALCIUM CASEINATE AND THEIR APPLICATIONS
by
SERIFE AKKURT
A Thesis submitted to the
Graduate School-New Brunswick
Rutgers, The State University of New Jersey
in partial fulfillment of the requirements
for the degree of
Master of Science
Graduate Program in Food Science
written under the direction of
Kit L. Yam
and approved by
________________________
________________________
________________________
________________________
New Brunswick, New Jersey
OCTOBER, 2015
ii
ABSTRACT OF THE THESIS
Edible Films and Coatings from Calcium Caseinate and Their Applications
By Serife Akkurt
Advisor:
Kit L. Yam, PhD
Thesis Director:
Peggy Tomasula, PhD
Calcium caseinate (CaCas), isolated from nonfat dry milk (NFDM), is a milk
ingredient for the production of protein-based edible films and coatings. When the supply
of NFDM exceeds the demand, the conversion of CaCas to alternative value-added
products through processes such as coating may help utilize and prevent future surpluses
of NFDM. Two studies are examined in this project.
The motivation of the first study is to improve the mechanical properties of
calcium caseinate-based films. Glycerol (Gly), a plasticizer, is currently used in film
solutions to overcome the brittleness of CaCas films. However, Gly reduces the
mechanical strength of the films (Tomasula et al. 1998). The addition of hydrophobic
compounds or modifications of polymer network is a common approach to improve the
mechanical properties of CaCas/Gly films through crosslinks. In this study, high
methoxyl pectin (CP) was used in CaCas/Gly film solutions to make the edible films, and
iii
its effect on elastic modulus (E), elongation at break (EAB), and tensile strength (TS) of
the films were evaluated. The magnitude of the tensile properties showed that edible
CaCas/Gly films was affected by film thickness, relative humidity (RH), and CP content
(Bonnaillie et al. 2014).
The motivation of the second study is to improve the nutrient profiles, extend the
bowl-life, and enhance the textures of RTE breakfast cereals by using CaCas-based
coating materials. In the coating process of RTE breakfast cereals, high sugar
concentrates or slurries are used to provide moisture barrier properties, preserve texture,
and extend bowl-life of the cereals. However, this leads to health concerns such as
childhood obesity and dental problems. In this study, glucose, NFDM, CaCas, and CaCas
in blends with Gly, CP, and NFDM at constant 15% total protein concentration in coating
solutions were applied on Wheaties® breakfast cereals by spraying the solutions on the
surface of flakes with a drying process. The coatings provided an increased protein
source, longer bowl life in milk, and crunchier and crispier texture by forming a uniform,
sheen, and protective coating layer on the surface of the flakes.
iv
ACKNOWLEDGEMENT
I better first begin with my advisor, Dr. Kit L. YAM. “History will be the final
judge,” my advisor frequently said to me and it always made me aware of myself and my
progress in research and life during my graduate education. Also, it taught me to learn a
lesson whenever I was not successful and not repeat mistakes. He has been a great
advisor in my life because he teaches and conveys his scientific knowledge as well as his
real life experiences. Also, he always supports and encourages me to improve my critical
thinking, communication, and writing skills. I have grown in various aspects through his
instruction, enthusiasm, and standards in my academic career. Throughout my research,
he has provided innovative ideas, specific models, and encouragement, which have all
made a self-starter and me more organized. All of this has enabled me to stick to my goal
towards the right direction. I would not have accomplished this thesis without his
instruction.
I am grateful to Dr. Peggy Tomasula for being a co-advisor for my research and
thesis. I would like to thank her for providing her laboratory and resources in ERRC
(Wyndmoor PA) and Dr. Laetitia Bonnaillie for letting me both conduct the research and
write the dissertation under her professional experiences. I also would like to thank John
Mulherin, Raymond Kwoczak, Audrey Thomas, Joseph Uknalis, and James Shieh for
their great help with the films and coatings production, and physical analysis, and
especially Linshu Liu for general research support. This thesis would not have been

v
possible without all of their help.
I would like to thank my research committee members, Dr. Kit L. Yam, Dr.
Peggy Tomasula, Dr. Linshu Liu, and Dr. Nazir Mir for all of their support.
I am indebted to many of my colleagues for supporting me and providing a
stimulating and fun environment in which to learn and grow. I am especially grateful to
Han Zhang, and Carol Saade. They have always been there to provide selfless help and
thought for my research and life. I am also grateful to the whole group: Saifanassour,
Chang, Minqian, Simon, Xi, and Yan. This group has been a source of friendships as well
as good advice and collaboration in our laboratory environment.
Lastly, and most importantly, I would like to thank my family for all their love
and encouragement. It is hard for a student abroad to finish their study without a family’s
support. My parents whose love and support are always the most powerful factors in my
life and have been available whenever I have needed them. I would especially like to
thank my brother, Gokhan, for offering endless positivity and encouragement. In addition,
I cannot forget all of my loving, supportive, encouraging, and many housemates and
roommates whose faithful support is treasured. Finally, I would like to thank my friends
for their endless help. This thesis is dedicated to them.
vi
ABBREVATION
NFDM Nonfat Dry Milk
CaCas Calcium Caseinate
RTE Ready-to-eat
Gly Glycerol
CP Citric Pectin or 3% Citric Pectin Solution
DI Deionized Water
RH Relative Humidity
E Elastic Modulus, MPa
EAB Elongation At Break,%
TS Tensile Strength, MPa
CaCas/Gly Calcium Caseinate and Glycerol solution or films
Ca+2 Calcium ions
Ca-P Calcium Phosphate
CPI Canola Protein Isolates
NaCas Sodium Caseinate
TMPs Total Milk Proteins
UF-TMP Total Milk Proteins via Ultrafiltration
EER Ethanol Extraction Retentate
LDPE Low Density Poly Ethylene
PVDC Polyvinylidene Chloride
WVP Water Vapor Permeability
DE Degrees of Methyl Esterification
HM High Methoxyl Pectin
LM Low Methoxyl Pectin
CaCl2 Calcium Chloride

vii
CaCas/Gly/CP Calcium Caseinate, Glycerol and Citric Pectin solutions of films
ICP-OES Inductely Coupled Plasma-optical Emission Spectrometer
AOAC Official Methods of Analysis, Association of Analytical Chemists
CaCas/CP 15% (w/w) Calcium Caseinate and 0.3% of Citric Pectin Solution
and Coating
CaCas/NFDM (1:2) 10% (w/w) Calcium Caseinate and 5% (w/w) Nonfat Dry Milk
coating solution
CaCas/NFDM (2:1) 5% (w/w) Calcium Caseinate and 10% (w/w) Nonfat Dry Milk
coating solution
CaCas/NFDM (1:1) 7.5% (w/w) Calcium Caseinate and 7.5% (w/w) Nonfat Dry Milk
coating solution
viii
TABLE OF CONTENTS
ABSTRACT OF THE THESIS .......................................................................................... ii ACKNOWLEDGEMENT ................................................................................................. iv ABBREVATION ............................................................................................................... vi TABLE OF CONTENTS ................................................................................................. viii LISTS OF TABLES ............................................................................................................ x LISTS OF ILLUSTRATIONS ........................................................................................... xi CHAPTER 1: BACKGROUND ......................................................................................... 1
1.1. Milk proteins-based films .................................................................................. 1 1.1.1. Casein and Caseinate Structure ............................................................... 1 1.1.2. Caseinate and Glycerol Films ................................................................. 3 1.1.3. Nonfat dry milk (NFDM) Films ............................................................. 5 1.1.4. Cross-linking Methods for Caseinate-based Films ................................. 6
1.2. Edible Coatings on Food Products .................................................................... 7 1.3. Citric Pectin ....................................................................................................... 9
1.3.1. Structure and Properties .......................................................................... 9 1.3.2. Interactions between Pectin and Caseinate ........................................... 10 1.3.3. Caseinate/Pectin Films and Coatings .................................................... 12
1.4. Ready-to-eat breakfast cereals ......................................................................... 13 1.4.1. Flow of RTE Flakes Production ........................................................... 14 1.4.2. Coatings ................................................................................................ 14
1.5. Thesis Objectives ............................................................................................. 17 CHAPTER 2: EDIBLE FILMS APPLICATION ............................................................. 18
2.1. Experimental Design ....................................................................................... 18 2.1.1. Overview ............................................................................................... 18 2.1.2. Materials and Methods .......................................................................... 18 2.1.3. Compositional Analysis of CaCas Powder ........................................... 19 2.1.4. pH Analysis ........................................................................................... 20 2.1.5. Preparation of Edible Film Solution ..................................................... 20 2.1.6. Preparation of Edible Films for Testing ................................................ 23 2.1.7. Analysis of Edible Films ....................................................................... 25
2.2. Results and Discussion .................................................................................... 28 2.2.1. Tensile Properties .................................................................................. 28 2.2.2. Microscopy Images ............................................................................... 41
2.3. Summary .......................................................................................................... 48 CHAPTER 3: EDIBLE COATINGS APPLICATION..................................................... 52
3.1. Experimental Design ....................................................................................... 52 3.1.1. Overview ............................................................................................... 52 3.1.2. Materials and Methods .......................................................................... 52

ix
3.1.3. Compositional Analysis ........................................................................ 53 3.1.4. Preparation of Coating Solutions .......................................................... 55 3.1.5. Preparation of Treated Breakfast Cereals for Testing ........................... 58 3.1.6. Analysis of Edible Coating on Breakfast Cereals ................................. 59
3.2. Results and Discussion .................................................................................... 63 3.2.1. Protein Content ..................................................................................... 63 3.2.2. Amount of Milk Gain and Rate of Milk Absorption ............................ 65 3.2.3. Surface Morphology ............................................................................. 69 3.2.4. Mechanical Properties ........................................................................... 76
3.3. Summary .......................................................................................................... 82 CONCLUSION ................................................................................................................. 87 FUTURE WORK .............................................................................................................. 88 REFERENCES ................................................................................................................. 89

x
LISTS OF TABLES
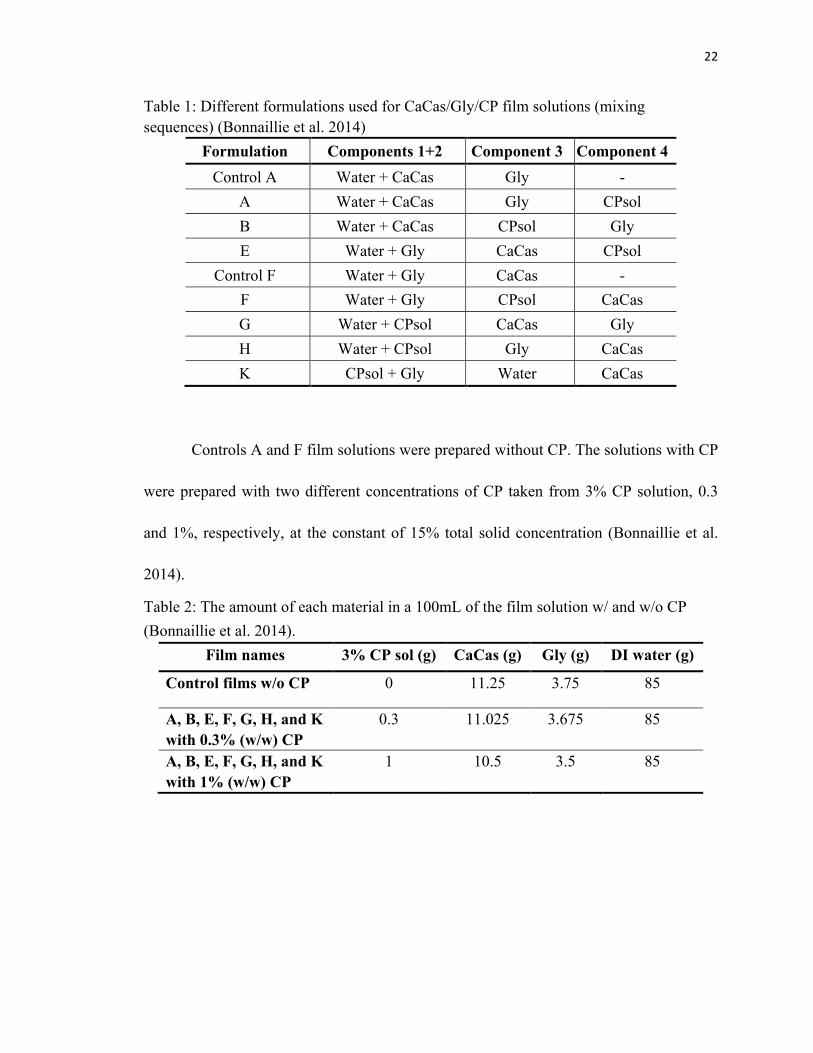
Table 1: Different formulations used for CaCas/Gly/CP film solutions (mixing
sequences) (Bonnaillie et al. 2014) .................................................................... 22
Table 2: The amount of each material in a 100mL of the film solution w/ and w/o CP
(Bonnaillie et al. 2014). ..................................................................................... 22
Table 3: The average tensile properties of Control films (w/o CP) at 59-69% RH ... 34
Table 4: Different formulation used for CaCas/Gly/CP film solutions (mixing
sequences) (Bonnaillie et al. 2014) .................................................................... 36
Table 5: The average tensile properties of A, F, and G films with 0.3 and 1% (w/w)
CP at ~55% RH. ................................................................................................. 39
Table 6: Formulation of Controls A and F (Bonnaillie et al. 2014) .......................... 42
Table 7: The amount of materials for the preparation of coating solutions with
constant concentration of protein sources (except glucose solution), 15%. ...... 56
Table 8: The amount of materials for the preparation of coating solutions with
constant concentration of protein sources, 15%. ............................................... 57
xi
LISTS OF ILLUSTRATIONS
Figure 1: The formation of casein micelles in an aqueous medium (Schmidt 1982). . 2
Figure 2: The gel networking of HM pectin in a liquid medium (Oakenfull 1991). . 10
Figure 3: Egg-box model (Flutti 2003) ...................................................................... 11
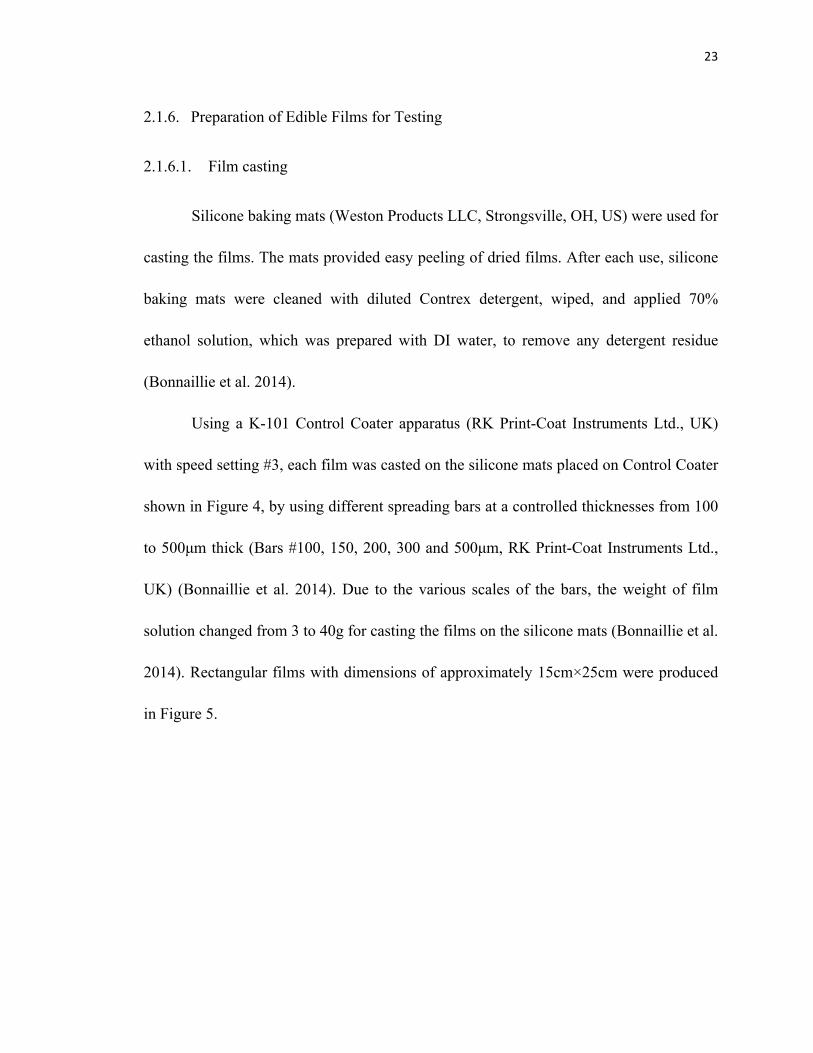
Figure 4: The casting of CaCas/Gly/CP film solution on a silicone mat with different
spreading bars by using the Control Coater. ...................................................... 24
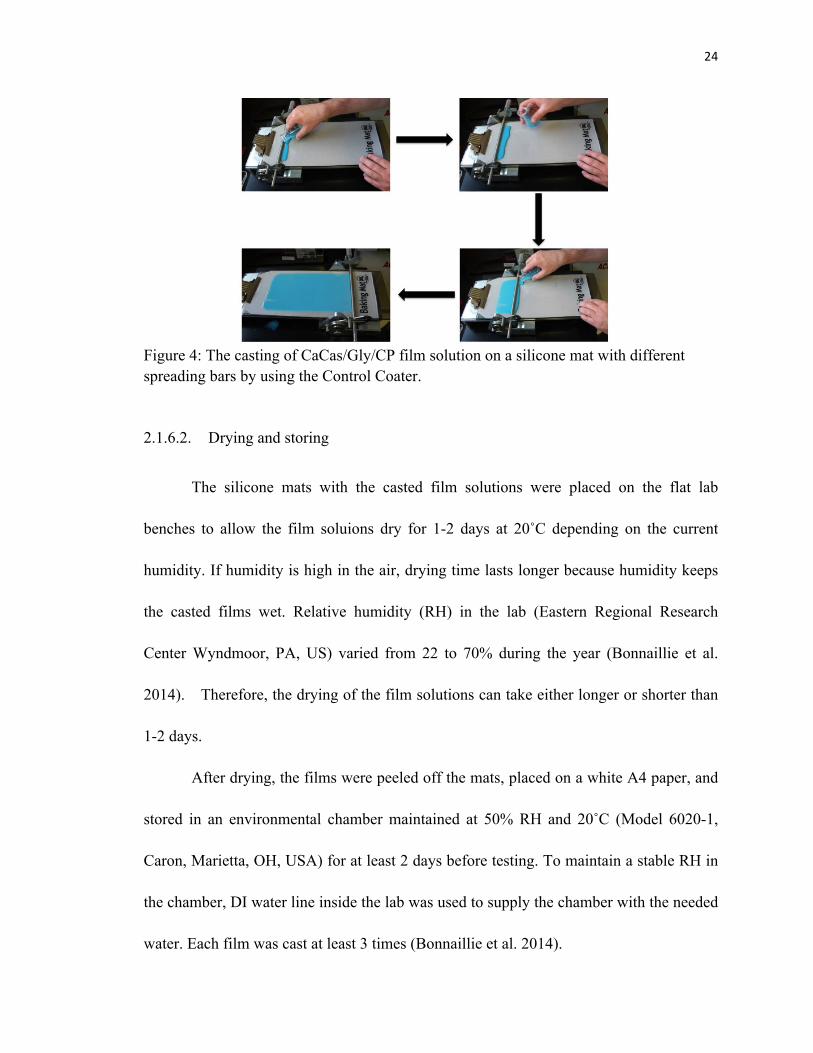
Figure 5: The dried edible films on a white A4 paper. .............................................. 25
Figure 6: The filmstrip mounted on Texture Analyzer, and data obtained from
stress-strain curve. .............................................................................................. 26
Figure 7: The effect of thickness on the E of Control A films at two different ranges
of RH, 58-65% and 67-70% (p>0.05). ............................................................... 29
Figure 8: The effect of thickness on EAB of Control A films at 58-70% RH (p<0.05).
............................................................................................................................ 30
Figure 9: The effect on thickness on TS of Control A films at two different ranges of
RH, 58-65% and 67-70%. .................................................................................. 31
Figure 10: The effect of thickness on E of Control F films at 59-69% RH in
0.025-0.134mm film thickness (p<0.05). .......................................................... 32
Figure 11: The effect of thickness on EAB of Control F films at 59-69% RH
(p<0.05). ............................................................................................................. 33
Figure 12: The effect of thickness on TS of Control F films at 59-69% RH (p<0.05).
............................................................................................................................ 34
Figure 13: E, EAB, and TS properties of different film formulations with 0.3 and 1%
CP at 54-58% RH in 0.03-0.05mm film thickness. Rectangular symbol
represents the average values of Control films according to Table 3 (Bonnaillie
et al. 2014). ........................................................................................................ 38
Figure 14: Micrographs of Controls A and F with 4× magnifications. ..................... 43
Figure 15: Micrographs of film formulations A to K with 0.3% CP concentration

xii
with 4×magnification (Bonnaillie et al. 2014). .................................................. 45
Figure 16: Micrographs of film Formulation A to K with 1.0% CP concentration with
4×magnification (Bonnaillie et al. 2014). .......................................................... 47
Figure 17: The appearance of sample preparation processing: (1) uncoated
Wheaties®, (2) the solution sprayed on flakes, and (3) appearance of flakes after
drying at 60°C for 20h. ...................................................................................... 58
Figure 18: Processing of milk absorption test: (1) 4 g Wheaties ®, (2) pouring 30 mL
milk at 8°C for various minutes, and (3) draining the samples on a 2.8-mm
stainless steel mesh screen for 10s. .................................................................... 60
Figure 19: The uncoated sample in a Kramer shear cell with 1 5-blade Texture
Analyzer, and obtained Force (N)-Distance (mm) curve. .................................. 61
Figure 20: Preparation of the flakes placed in milk (at 8°C for 3 min) and drained to
measure the mechanical properties. ................................................................... 62
Figure 21: Amount of protein added in cereal flakes with five different solutions and
uncoated. All solutions have a 15% (w/w) total protein concentration. ............ 64
Figure 22: Amount of protein added in cereal flakes coated with six different
solutions: glucose, CaCas, NFDM, and blends of CaCas with NFDM with
different ratios. All solutions have a 15% (w/w) total solids concentration. ..... 65
Figure 23: Weight gain of coated cereal during milk absorption of coated samples
after soaking in milk for up to 5 min at 8°C (p<0.05). ...................................... 66
Figure 24: Weight gain during milk absorption of coated samples after soaking in
milk for up to 5 min at 8°C (p>0.05). ................................................................ 67
Figure 25: Surface appearance of the uncoated flakes and the dried flakes treated
with glucose, CaCas, CaCas/Gly, CaCas/Gly/CP, and CaCas/CP solutions. .... 70
Figure 26: Surface appearance of uncoated flakes and the dried flakes treated with
glucose, CaCas, NFDM, and the blending of CaCas/NFDM solutions with
different ratios. ................................................................................................... 71

xiii
Figure 27: SEM images of the edge sides of uncoated and glucose coated flakes. ... 72
Figure 28: Scanning electron microscopy (SEM) images of uncoated flakes and the
flakes coated with glucose, CaCas, CaCas/Gly, CaCas/Gly/CP, and CaCas/CP
solutions. ............................................................................................................ 74
Figure 29: SEM images of uncoated flakes and the flakes coated with glucose,
CaCas, NFDM, and the blending of CaCas and NFDM solutions with different
ratios. .................................................................................................................. 75
Figure 30: Peak force (hardness) of the flakes treated with the various solutions
before (dry state) and after soaking in milk (wet state) at 8°C for 3 min. Colored
bars represent the dried flakes; grey bars represent the wet state. ..................... 77
Figure 31: Hardness of flakes treated with different coating solutions before and after
soaking in milk at 8°C for 3 min. Colored bars represent the dry state of flakes;
grey bars represent the wet state of flakes. ........................................................ 78
Figure 32: Crispness (N.mm) of flakes treated with different coating solutions before
and after soaking in milk at 8°C for 3 min. Colored bars represent the dry state
of flakes, grey bars represent the wet state of flakes. ........................................ 80
Figure 33: Crispness of flakes treated with different coating solutions before and
after soaking in milk at 8°C for 3 min. Colored bars represent the dry state of
flakes, grey bars represent the wet state of flakes. ............................................. 81
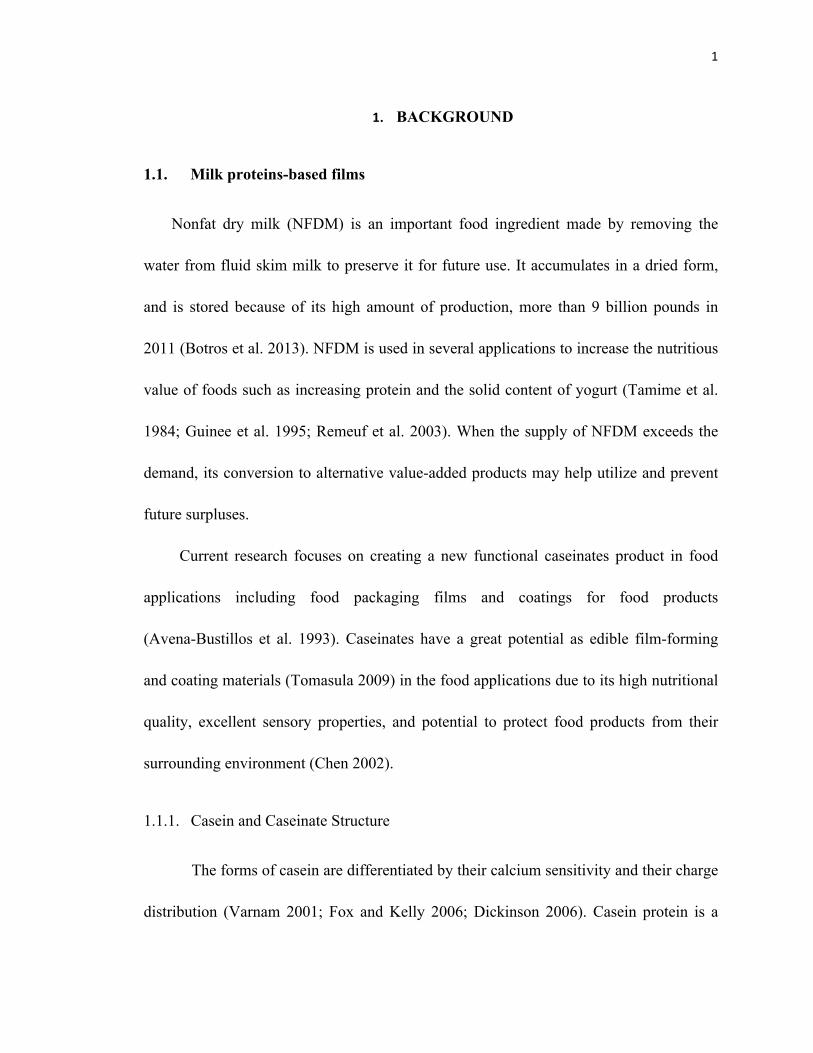
1
1. BACKGROUND
1.1. Milk proteins-based films
Nonfat dry milk (NFDM) is an important food ingredient made by removing the
water from fluid skim milk to preserve it for future use. It accumulates in a dried form,
and is stored because of its high amount of production, more than 9 billion pounds in
2011 (Botros et al. 2013). NFDM is used in several applications to increase the nutritious
value of foods such as increasing protein and the solid content of yogurt (Tamime et al.
1984; Guinee et al. 1995; Remeuf et al. 2003). When the supply of NFDM exceeds the
demand, its conversion to alternative value-added products may help utilize and prevent
future surpluses.
Current research focuses on creating a new functional caseinates product in food
applications including food packaging films and coatings for food products
(Avena-Bustillos et al. 1993). Caseinates have a great potential as edible film-forming
and coating materials (Tomasula 2009) in the food applications due to its high nutritional
quality, excellent sensory properties, and potential to protect food products from their
surrounding environment (Chen 2002).
1.1.1. Casein and Caseinate Structure
The forms of casein are differentiated by their calcium sensitivity and their charge
distribution (Varnam 2001; Fox and Kelly 2006; Dickinson 2006). Casein protein is a

2
phosphoprotein consisting of αs1-casein, αs2-casein, and β-casein, which are calcium
sensitive, and κ-casein, which is calcium insensitive (Uniacke-Lowe 2010). In milk,
κ-caseins stabilize calcium-sensitive caseins avoiding precipitation with calcium ions
(Ca+2) (Swaisgood 1996; Horne 2006). The calcium-sensitive caseins are able to bind
Ca+2 by their phosphate groups located on the hydroxyl groups of serine. Phosphoserine
residues are responsible for the existence of hydrophilic areas with a strong negative
charge (Swaisgood 1996; Horne 2006). One model used to envision the structure of the
casein micelle in milk is that of Schmidt (1982) in which the micelles is composed of
sub-micelles bound via Ca9(PO4)6, shown in Figure 1.
Figure 1: The formation of casein micelles in an aqueous medium (Schmidt 1982).
CaCas is made from NFDM by using acid to dissolve the Ca-P linkages to form
acid casein precipitate and react the precipitate with a Ca(OH)2 to form CaCas. The
micellar structure no longer exists and the caseinate possesses a random coil structure,
which is non-ordinate protein with a low level of α-helical and β-sheet structures
(Chambi and Grosso 2006).
3
1.1.2. Caseinate and Glycerol Films
Due to the random coil structure and amino acid compositions of caseinate, the
interactions —hydrogen, hydrophobic, and electrostatic bonds— play an important role
to form caseinate films (McHugh and Krochta 1994a; Lacroix et al. 1998). The films
need to incorporate a plasticizer such as Gly to reduce the brittleness and increases
flexibility of the edible caseinate films for handling and testing (Tomasula et al. 1998;
Janjarasskul and Krochta 2010). The plasticizer reduces the protein chain-to-chain
interactions by placing into three-dimensional network, which increases the free-volume
and eases the mobility of the polymer chain (Vieira et al. 2011). However, it weakens TS
(a measure of film resistance to tension) and induces the EAB (a measure of film
elasticity) of edible caseinate films (Tomasula et al. 1998; Chen 2002). An additive
molecule with a long molecular chain is also required to provide a better EAB and
mechanical integrity by incorporating a small amount of flexible crosslink (Bonnaillie et
al. 2014).
For example, a research related to the effect of Gly on the mechanical properties
of protein films showed that the molecular mobility (of canola protein isolates-CPI) in the
film matrix was restricted leading to very brittle CPI film due to the interactions between
side chains of partially denatured CPI (Chang and Nickerson 2013). However, the
amount of added Gly played an important role because it caused the film to be too soft
and sticky to be removed from its casting mold (Chang and Nickerson 2013). Gly
4
interferes with the CPI aggregates by forming more volume in the film matrix (Chang
and Nickerson 2013). It was also showed that the films became weaker and more flexible
with increasing Gly amount (Chang and Nickerson 2013). The results are in agreement
with other studies, which showed that increasing plasticizer content (Gly) disrupted
protein-protein interactions in the film matrix and decreased TS and E (a measure of film
stiffness), and increased EAB (Tomasula et al. 1998; Chen 2002; Tomasula et al. 2003;
Dangaran and Tomasula 2009).
Tomasula et al. (1998) reported that TS decreased with increasing Gly amount. At
20% (w/w) Gly content, TS decreased in the CaCas films. The values of EAB decreased
in CaCas films by 40% (w/w) Gly (Tomasula et al. 1998). Since, Gly reduces the
intermolecular forces in the films by inserting itself between the protein chains. Schou et
al. (2005) reported TS and E of the sodium caseinate (NaCas) films incorporated with
Gly decreased with increasing Gly content. The flexibility of NaCas films increased
greatly with 0.24 and 0.32 ratios of Gly to protein (Schou et al. 2005). However,
increasing Gly amount enables NaCas films more stretchable and malleable (Schou et al.
2005).
The presence of Gly also lowers the gas barrier properties and the mechanical
strength of caseinate films (Tomasula 2009; Vieira et al. 2011). Glycerol reduces the
protein chain-to-chain interactions and lowers the protein glass transition temperature,
which is defined as a temperature of crystalline state (rigidity) of product (Hutchinson et
al. 1989), to increase the flexibility of films (Hong and Krochta 2006). Some

5
modification is required to overcome the weaknesses of CaCas/Gly films by broadening
the tensile properties of films for wide range applications. Therefore, the caseinates films
are still at the developmental stage and requires more research to examine the tensile
properties and characteristics of caseinate in the polymer network due to the caseinate
films susceptibility to moisture which limits the use of the films in applications
(Gennadios et al. 1996; Lacroix et al. 1998; Falguera et al. 2011).
1.1.3. Nonfat dry milk (NFDM) Films
Maynes and Krochta (1994) evaluated five total milk proteins (TMPs) films by
comparing their TS, E, and EAB values. Two of them obtained from NFDM by
producing via both ultrafiltration (UF-TMP) and ethanol extraction retentate (EER). The
other three were obtained from commercial TMPs. In the study, UF-TMP showed the
highest E, and highest TS at break. However, commercial TMP films had similar value of
TS at break to low density polyethylene (LDPE) and similar EAB to polyvinylidene
chloride (PVDC) and cellophane (Maynes and Krochta 1994). Therefore, milk
protein-based edible films can be improved to be compatible with current packaging
materials.
Individual proteins which are caseinates, and total milk proteins were derived from the
proteins of NFDM to make the edible films instead of making an edible film directly
from NFDM powder (Avena-Bustillos et al. 1993; McHugh et al. 1994) because the

6
lactose content of NFDM might adversely affect the edible film properties (Maynes and
Krochta 1994).
There are also other studies based on sodium caseinate (NaCas) and calcium
caseinate (CaCas) derived from NFDM milk by acid treatments, some of which are
mentioned in the sections 1.1.2 and 1.3.3.
1.1.4. Cross-linking Methods for Caseinate-based Films
Most of the research on the edible caseinate films is dedicated to improving their
physical properties by applying either the incorporation of hydrophobic compounds or
modification of polymer network through the crosslinks of polymer chains. Chemical,
enzymatic, and physical treatments make the cross-linking process possible due to the
presence of charged functional groups in the amino acids of proteins (Chambi and Grosso
2006).
Avena-Bustillos et al. (1993) reported a chemical cross-linking method on the
pre-formed NaCas and CaCas films. By using calcium chloride (CaCl2) solution, the
films were soaked in the solution for 1 min to induce calcium mediated cross-linking in
casein, which forms ionic cross-links. The result showed that the cross-links reduced
water vapor permeability (WVP) of the films by reducing the protein chain mobility and
flexibility (Avesta-Bustillos et al. 1993).
Gelatin was also used to enhance the mechanical strength as well as the water
vapor barrier properties via enzymatic treatment, reported by Chambi and Grosso (2006).
7
In the study specific case of gelatin-casein films, transglutaminase enzyme was used to
catalyze the crosslink reactions between the reactive functional groups of gelatin and
caseinates (Chambi and Grosso 2006). After the enzyme treatment, a decrease in WVP
and increase of elasticity were observed (Chambi and Grosso 2006). Since, the crosslink
turns the random structure of caseinate (in a solution) into a more organized chain
structure, which result in optimizing molecular packing structure correlated to the
improvement of mechanical and barrier properties (Chambi and Grosso 2006).
Cross-linking induced via physical treatment with UV or γ-irradiation was also
investigated with some positive results (Ouattara et al. 2002) because the proteins were
affected by γ-irradiation, which triggered the conformational changes, oxidation, free
radical formation, and polymerization reactions of proteins. The study reported that the
films were produced with improved mechanical properties because hydroxyl radicals
were generated by irradiation of protein solutions and reacted with aromatic residues to
form covalent bonds with more cohesion between polypeptide chains, which produce the
films with better mechanical properties (Ouattara et al. 2002).
1.2. Edible Coatings on Food Products
The mechanical and barrier properties of casein and whey protein films have been
taken advantages of in food applications to improve the quality of foods and extend
shelf-life of dry products (Tomasula 2009) such as dry bakery products (Bravin et al.
2006). Also, Khwaldia et al. (2004) and Vargas et al. (2008) tested some other potential

8
applications of casein and whey films and coatings to provide moisture and gas barrier
properties for fresh fruits and vegetables, meats, cereals, nuts and frozen foods. Whey
protein-based films and coatings that applied on nuts, peanuts, eggs, confectionary
products, meat products, fruits, and vegetables were reported by Dangaran and Krochta
(2009). Another research was carried out based on the transglutaminase-crosslinked whey
protein isolate films as a wrap to prevent quality changes in products such as meat pies
(Yildirim and Hettiarachchy 1998).
Edible films and coatings provide an extension for the shelf life of the products by
maintaining the sensory qualities and enhancing nutritional quality of fresh, minimally
processed fruits and vegetables (Falguera et al. 2011). An example would be that research
has been done on the effects of polyvinyl chloride incorporated with edible maize
starch-based coatings, with glycerol as a plasticizer, applied on Brussels sprouts to
preserve the quality parameters such as weight, firmness, commercial acceptability and
nutritional quality (Falguera et al. 2011).
Edible films and coatings would also reduce the fat uptake and decrease water
loss in deep-fat fried products by applying composite films made of soy protein isolate
and whey protein isolate (Albert and Mittal 2002). Freitas et al. (2009) studied the effect
of edible coatings from pectin, whey protein and soy protein isolate on the
deep-fat-frying of products made from cassava flour and its puree. Whey protein
provided 27% reduction in fat absorption (Freitas et al. 2009).

9
1.3. Citric Pectin
Pectin usually comes from most of the plant tissues, but apple pomace and citrus
peels currently are the main sources of pectin as commercially available. Citric pectin
(CP) is produced by extracting from raw materials (citrus peels) right after juice
extractions to avoid the activity of pectin methylesterase enzyme, which produces blocks
of deesterified material resulting in destroying pectin structure (May 1990). It can then be
stored for many months and used in value-added applications.
1.3.1. Structure and Properties
Pectin is one of the natural water-soluble polysaccharides. It is used as a highly
effective additive to improve product and processing properties in fields of foodstuffs.
The basic structure of pectin is a linear chain of poly-α-(1-4)-D-galacturonic acid with
varying degrees of methyl esterification (DE) (Kurita et al. 2008). Depending on DE,
pectins are divided between high methoxyl (HM) and low methoxyl (LM) pectin. HM
pectins form gels mainly via hydrophobic interactions and hydrogen bonds in the
presence of more than 55% sugar, while LM pectins can gel with only a small amount of
sugar in the presence of calcium ions, Ca2+ (Löfgren and Hermansson 2007).
The behavior of HM pectin in a solution is the formation of crosslinks, which
forms a tangled and interconnected network in a three dimensional helix via hydrogen
bonds with water molecules, known junction zones (Oakenfull 1984). Intermolecular
forces, which are hydrophobic interactions and hydrogen bonding, play an important role

10
to stabilize the junction zones shown in Figure 2. Hydrophobic interactions occurred
between the ester methyl groups of pectin molecules stabilize the threefold helical
conformation in an aqueous medium by avoiding to contact with the water (Ben-Naim
1980; Oakenfull 1991). These interactions are driven by three dimensional hydrogen
bonded water molecules, which adjacent to a hydrophobic surface of pectin chains
(Ben-Naim 1980).
Figure 2: The gel networking of HM pectin in a liquid medium (Oakenfull 1991).
1.3.2. Interactions between Pectin and Caseinate
Pectin can provide rigid and stiff tensile properties to the films. The caseinates are
known to have a random coil structure, which is non-ordinate proteins with a low level of
α-helical and β-sheet structures (Chambi and Grosso 2006) and compose of polar and
nonpolar amino acids (Chen 2002). CaCas has Ca+2, which is responsible for electrostatic
interactions with the methoxyl and carboxyl functional groups of pectin molecules. The
motivation of adding pectin is the crosslinks between the functional groups of pectin and

11
calcium, called egg-box model in Figure 3, to increase tensile strength of the edible films
(Rees et al. 1975; Morris et al. 1982; Flutti 2003).
Figure 3: Egg-box model (Flutti 2003)
Other interactions such as hydrogen bonding and hydrophobic interactions occur
to form the caseinate films (McHugh and Krochta 1994a; Lacroix et al. 1998). CaCas has
both polar and nonpolar sites that possibly take a place between water and nonpolar
pectin sites, which results in the films with more structured and compact network in
molecular level (Chen 2002).
The various interactions between pectin and caseinate are complex and are greatly
affected by the stoichiometric caseinate:pectin ratio, the pH, the presence of salts, etc
(Pedersen and Jorgensen 1991; Maroziene and de Kruif 2000).
The casein films has several problems to be solved because they are affected by
relative humidity and temperature changes, processing (e.g. casting), drying rate and
type, storage conditions, plasticizers, thickness, addition of pectin, mixing sequences, etc.
(Bonnaillie et al. 2014). In this case, films require more work to be done for broad
commercial application.
12
1.3.3. Caseinate/Pectin Films and Coatings
Although the combination of other milk protein-based films and coating (ex.
whey, total milk proteins, etc.) with pectin or other carbohydrates (ex. agar, carrageenan,
etc.) were broadly studied (Bonnaillie et al. 2014). Due to the limited studies of
caseinates, current research focuses on creating a new functional caseinates product with
some modifications to use in food applications including food packaging films and
coatings for food products (Avena-Bustillos et al. 1993).
Lacroix et al. (1998) studied on the effect of irradiation dose on the mechanical
properties of cross-linked CaCas films. With the irradiation treatment and addition of
CaCl2 in the film solutions, the results showed that the cohesion of protein was improved
due to the formation of electrostatic bonds. CaCl2 made synergistic effect, and
γ-irradiation increased the number of cross-links in molecular level (Lacroix et al. 1998).
These improvements would be responsible for the increased mechanical strength of the
films (Lacroix et al. 1998).
Letendre et al. (2002) evaluated the effect of polysaccharides, pectin and agar on
the physicochemical properties of CaCas and WPI films. By treating pectin and agar with
autoclaving, the cross-links occurred between protein and polysaccharides, which results
in enhancing mechanical properties (Letendre et al. 2002). The possibility of cross-links
was increased due to the disordered and disassociated polysaccharide chains by
autoclaving (Letendre et al. 2002).

13
Bonnaillie et al. (2014) reported the addition of CP affected on the structure and
mechanical properties of CaCas films plasticizing with Gly. The incorporation of CP with
the range from 0.05% to 1% (w/w) into CaCas/Gly films increase the E of the films at
~35% RH, which results in the film with fragile properties. The films with ~0.4% CP, the
EAB decreased than the films without CP (Control CaCas/Gly films). Beside CP
amounts, the molecular structure of films and the interactions of materials, which are
directly effective on the mechanical properties of the films were highly dependent on RH
flocculation, and the preparation of film solutions (Bonnaillie et al. 2014).
Regarding to these studies, with different modifications such as crosslinking
methods, incorporation with other compounds, CaCas can be improved and applicable for
food applications to take benefits of its mechanical and nutritional properties.
1.4. Ready-to-eat breakfast cereals
Breakfast cereal is a RTE product consumed with milk, milk-based products, or
without milk. RTE breakfast cereals are made of one or more of the cereal grains or their
milled fractions as a major constituent. Other constituents, sweeteners, nutrients,
flavoring and texturing ingredients are also used in the production of RTE cereals
(Caldwell et al. 2000; Brennan et al. 2013). There are several types of RTE breakfast
cereals categorized on its manufacturing processes such as flaking, puffing or shredding
(Fast 2000; Nowakowski and Green 2012). For flaking, soft red wheat kernels are mainly

14
used and the addition of malt and sugars for flavor enhancement provide the desired
brown color (Caldwell et al. 2000).
1.4.1. Flow of RTE Flakes Production
The flow of production is differentiated based on both the type of RTE breakfast
cereals and source of cereal grains. Wheat flakes are produced based on several numbers
of steps: 1) preprocessing, which provides a complete gelatinization of starch, an even
distribution of flavor, and crushing kernels, 2) formulation, which represents the amounts
of ingredients for production, 3) cooking, 4) lump breaking, 5) drying, 6) cooling and
tempering, and 7) flaking, which improves the texture of final product (Fast 2000;
Nowakowski and Green 2012).
1.4.2. Coatings
There is a coating process, which usually applies after drying process in the
manufacture of RTE breakfast cereals (flakes). Coating with a sugar slurry solution is the
last step to sweeten the pieces of the cereals to meet consumer demands linked to the
several properties of the cereals. Sensory, textural, and bow-life properties are some of
these properties, and the sensory properties, which are related to the appearance, flavor,
and taste of the RTE flakes, and textural properties, which are linked to the hardness and
crispness of the flakes (Caldwell 2000; Ricardo et al. 2012). The hardness is defined as
maximum force applied to crush the RTE flakes (Anderson and Singh 2003), and the
15
crispness represents the work done on the flakes, which mimics the sensation of crispness
of the flakes between teeth (Vincent 1998; Hofsetz and Lopes 2005). For instance, if
the product is brittle, it requires little work to fracture the flakes, and it occurs quickly
(Vincent 1998; Saklar et al. 1999). The bowl-life of RTE flakes is a measure of how long
RTE flakes stay crunchy and crispy before absorbing milk, and it is always a concern for
consumers (Long and Chatel 2006; Ricardo et al. 2012). The high sugar concentrates or
slurries, of which are honey, sugars, or syrups are used in the coating process (Fast 2000)
to enhance the texture and extend the bowl-life of the cereals. Therefore, the coating with
a sugar solution provides moisture barrier properties, preserve the texture, and extend the
bowl-life of the RTE flakes (Calandro and Murray 1992). However, most RTE breakfast
cereals contain high sugar with the range of 1-56% concentration (Albertson et al. 2013),
and the consumers have several health concerns, especially obesity and dental problems
(Ruxton et al. 1999; Johnson and Frary 2001) in response to the consumption of RTE
flakes.
The high consumption of RTE breakfast cereals in US, which accounts for over
80% RTE products retail sale in the US (Brennan et al. 2013), is another reason
emphasizing the importance of health concern to modify the coating materials.
Therefore, reducing the sugar content of RTE cereal flakes has become an important
issue.
Current research and some companies focus on the reduction of sugar coating and
the enhancement of nutrient quality by investigating alternative coating materials in order

16
to provide similar qualities as sugar coating. Long and Chatel (2006) reported that the
coating with artificial sweeteners, but this results in lack of the textural and bowl life
properties of original flakes.
Thomas et al. (2013) reported an examination based on the data in the USDA
National Nutrient Database for Standard Reference (SR) to track trends in RTE breakfast
cereals in response to health concerns. The top-selling companies, Kellogg and General
Mills, which were determined based on unit sales from August 2010 to August 2011,
reformulated their products in 6 years from 2005 to 2011. They reduced their sugar
content from 27.5 to 24.8/100 g product in 6 years, but it was not a significant reduction
(Thomas et al. 2013).
Luckett and Wang (2012) reported the investigation of debranched corn starches
(Common corn, Waxy corn and Hylon II) with varying amylose content coating on
Wheaties ® breakfast cereals. All three debranched starches provided better barrier
properties than glucose coating as well as reducing milk absorption, which were
correlated with their texture. Hylon II, containing high amylose content had an ability to
form a coating layer and contributed a higher dietary fiber value. However, consumers
prefer that breakfast cereals contain less sugar, more nutrition, and the desired texture all
at the same time.
Cereal flakes need to be improved to enhance the texture and extend the bowl-life
of the flakes by replacing of the sugar-based coating materials with alternative materials
(Bone et al. 1986; Carpenter et al. 1989; Long and Chatel 2006; Luckett and Wang 2012).

17
1.5. Thesis Objectives
The long-term goal is to increase the utilization of NFDM by using its protein
derivate, CaCas. Two studies were conducted towards achieving this goal: (1) by making
edible CaCas-based films for packaging application, and (2) by producing edible
CaCas-based coatings to apply on breakfast cereals to enhance their textural and
nutritional properties.
The objective of the first project is to study the effects of ambient humidity, film
thickness, and the addition of citric pectin on the tensile properties of edible CaCas/Gly
films as described in Chapter 2.
The objective of the second project is to develop the coating solutions made from
NFDM, CaCas, and CaCas in blends with Gly, CP, and NFDM to improve the nutrient
profile, extend the bowl-life, and enhance the texture of RTE breakfast cereals as
described in Chapter 3.
18
2. EDIBLE FILMS APPLICATION
2.1. Experimental Design
2.1.1. Overview
CaCas/Gly with CP solutions were prepared to produce CaCas/Gly and
CaCas/Gly/CP edible films. The tensile properties of the films were tested at different
humidity, film thickness, and amounts of CP. Also, the microscopy images of the films
were obtained.
2.1.2. Materials and Methods
CaCas powder was obtained from the American Casein Co. (Burlington, NJ, US).
Thermo Fisher Scientific Company (Madison, WI) provided its mineral analysis run with
an ICP-OES (inductively coupled plasma-optical emission spectrometer), model iCAP
6300 Duo. CaCas contained (as measured over 3 to 6 replicates) 3.0% minerals,
consisting of 47.7% calcium, 29.6% phosphorus, 18.2% sodium, 3.8% potassium, 0.5%
magnesium, 0.1% zinc and iron, and trace amounts of copper and manganese (Bonnaillie
et al. 2014). Glycerol was ACS grade and obtained from Sigma-Aldrich (St Louis, MO,
US). DI water was produced by a Milli-Q Synthesis water purification system (Millipore,
Billerica, MA, US). Pectin 1400, CP, with a high degree of methoxylation of 60±1% and
a molecular weight of 236,000 g/mol (236KDa) was obtained from Danisco USA Inc.
19
(Madison, WI, US). Food colorant was purchased from a local store (McCormick &Co
Inc., Hunt Valley, MD, US) (Bonnaillie et al. 2014).
2.1.3. Compositional Analysis of CaCas Powder
2.1.3.1. Moisture Content
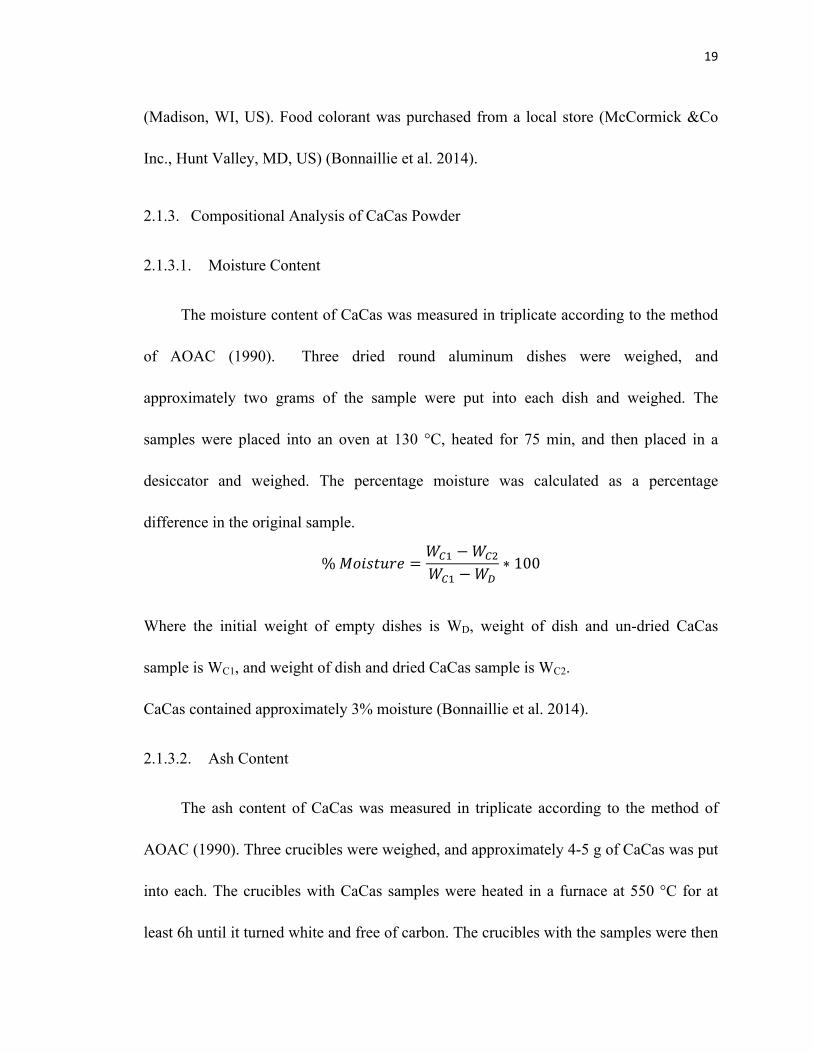
The moisture content of CaCas was measured in triplicate according to the method
of AOAC (1990). Three dried round aluminum dishes were weighed, and
approximately two grams of the sample were put into each dish and weighed. The
samples were placed into an oven at 130 °C, heated for 75 min, and then placed in a
desiccator and weighed. The percentage moisture was calculated as a percentage
difference in the original sample.
% 𝑀𝑜𝑖𝑠𝑡𝑢𝑟𝑒 =𝑊!! −𝑊!!
𝑊!! −𝑊!∗ 100
Where the initial weight of empty dishes is WD, weight of dish and un-dried CaCas
sample is WC1, and weight of dish and dried CaCas sample is WC2.
CaCas contained approximately 3% moisture (Bonnaillie et al. 2014).
2.1.3.2. Ash Content
The ash content of CaCas was measured in triplicate according to the method of
AOAC (1990). Three crucibles were weighed, and approximately 4-5 g of CaCas was put
into each. The crucibles with CaCas samples were heated in a furnace at 550 °C for at
least 6h until it turned white and free of carbon. The crucibles with the samples were then
20
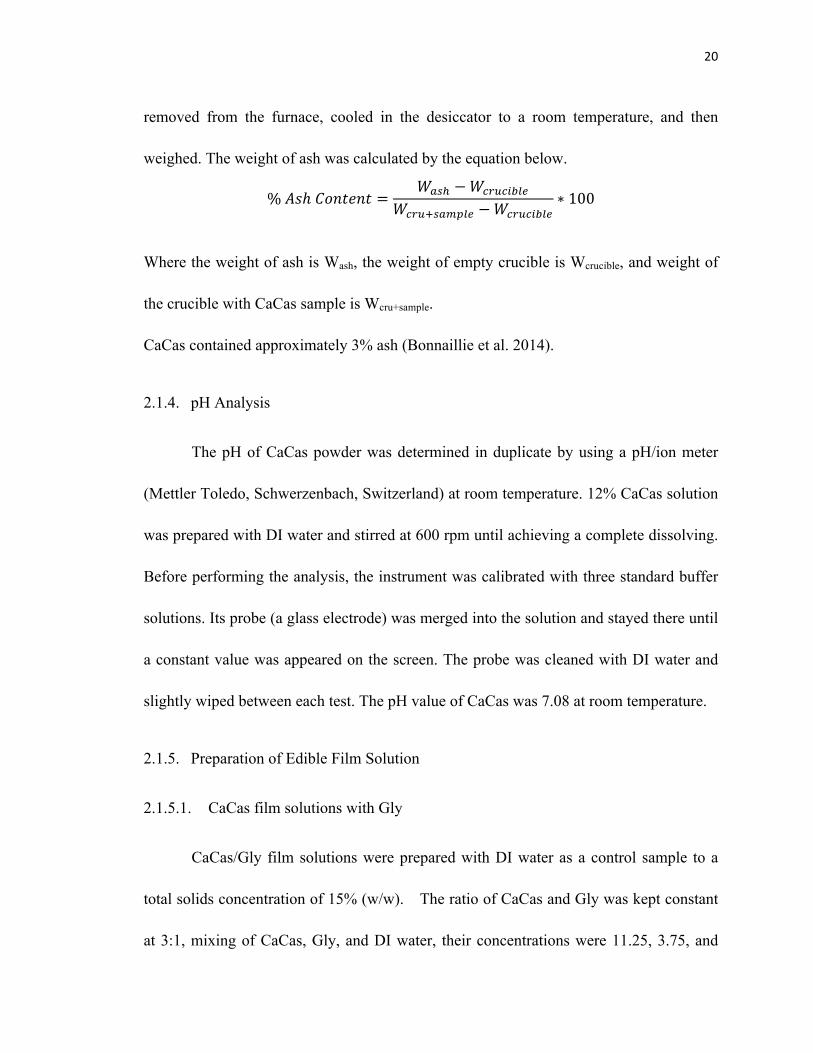
removed from the furnace, cooled in the desiccator to a room temperature, and then
weighed. The weight of ash was calculated by the equation below.
% 𝐴𝑠ℎ 𝐶𝑜𝑛𝑡𝑒𝑛𝑡 =𝑊!"! −𝑊!"#!$%&'
𝑊!"#!!"#$%& −𝑊!"#!$%&'∗ 100
Where the weight of ash is Wash, the weight of empty crucible is Wcrucible, and weight of
the crucible with CaCas sample is Wcru+sample.
CaCas contained approximately 3% ash (Bonnaillie et al. 2014).
2.1.4. pH Analysis
The pH of CaCas powder was determined in duplicate by using a pH/ion meter
(Mettler Toledo, Schwerzenbach, Switzerland) at room temperature. 12% CaCas solution
was prepared with DI water and stirred at 600 rpm until achieving a complete dissolving.
Before performing the analysis, the instrument was calibrated with three standard buffer
solutions. Its probe (a glass electrode) was merged into the solution and stayed there until
a constant value was appeared on the screen. The probe was cleaned with DI water and
slightly wiped between each test. The pH value of CaCas was 7.08 at room temperature.
2.1.5. Preparation of Edible Film Solution
2.1.5.1. CaCas film solutions with Gly
CaCas/Gly film solutions were prepared with DI water as a control sample to a
total solids concentration of 15% (w/w). The ratio of CaCas and Gly was kept constant
at 3:1, mixing of CaCas, Gly, and DI water, their concentrations were 11.25, 3.75, and
21
85% (w/w) in a 100 mL film solution, respectively. After mixing the solution for 2 hours,
McCormick Assorted food colorants (two drops/ 40 mL solution), which were blue
(Brilliant blue−FD&C Blue 1), green (Allura red AC−FD&C Red 40), yellow
(Tartrazine−FD&C Yellow 5), and red (Erythrosine−FD&C Red 3), were added into each
film solution to observe the appearance and structure of the dried films because the films
without colorant were quite transparent (Tomasula et al. 1998; Bonnaillie et al. 2014).
2.1.5.2. Calcium caseinate/glycerol/citric pectin (CaCas/Gly/CP)
Citric pectin solution (CP)
3% (w/w) CP solution was prepared with DI water by stirring at 1200 rpm for 2
hours because the pectin is hard to dissolve or mix well in the solutions (Rolin 1993).
After preparing CP solution, it was added at various amounts in the constant ratio (3:1) of
(CaCas/Gly) solution by keeping the same total solids concentration of solution at 15%
(w/w). The compounds were added into the DI water one by one, giving an hour to mix
for each. After all components were added, the solution was mixed for 2 h followed by
adding two drops of food colorant. The film solutions were placed to vacuum filtration
flasks to remove air bubbles in the solutions by the laboratory vacuum system (Bonnaillie
et al. 2014). In this study, the compounds of film solutions mixed in different sequences
to observe the effect of mixing sequences on the tensile properties of the films. Nine film
solutions were prepared based on the different formulations with the same compounds at
a constant amount of each compound for each solution shown in Table 1.
22
Table 1: Different formulations used for CaCas/Gly/CP film solutions (mixing sequences) (Bonnaillie et al. 2014)
Formulation Components 1+2 Component 3 Component 4 Control A Water + CaCas Gly -
A Water + CaCas Gly CPsol B Water + CaCas CPsol Gly E Water + Gly CaCas CPsol
Control F Water + Gly CaCas - F Water + Gly CPsol CaCas G Water + CPsol CaCas Gly H Water + CPsol Gly CaCas K CPsol + Gly Water CaCas
Controls A and F film solutions were prepared without CP. The solutions with CP
were prepared with two different concentrations of CP taken from 3% CP solution, 0.3
and 1%, respectively, at the constant of 15% total solid concentration (Bonnaillie et al.
2014).
Table 2: The amount of each material in a 100mL of the film solution w/ and w/o CP (Bonnaillie et al. 2014).
Film names 3% CP sol (g) CaCas (g) Gly (g) DI water (g)
Control films w/o CP 0 11.25 3.75 85
A, B, E, F, G, H, and K with 0.3% (w/w) CP
0.3 11.025 3.675 85
A, B, E, F, G, H, and K with 1% (w/w) CP
1 10.5 3.5 85
23
2.1.6. Preparation of Edible Films for Testing
2.1.6.1. Film casting
Silicone baking mats (Weston Products LLC, Strongsville, OH, US) were used for
casting the films. The mats provided easy peeling of dried films. After each use, silicone
baking mats were cleaned with diluted Contrex detergent, wiped, and applied 70%
ethanol solution, which was prepared with DI water, to remove any detergent residue
(Bonnaillie et al. 2014).
Using a K-101 Control Coater apparatus (RK Print-Coat Instruments Ltd., UK)
with speed setting #3, each film was casted on the silicone mats placed on Control Coater
shown in Figure 4, by using different spreading bars at a controlled thicknesses from 100
to 500µm thick (Bars #100, 150, 200, 300 and 500µm, RK Print-Coat Instruments Ltd.,
UK) (Bonnaillie et al. 2014). Due to the various scales of the bars, the weight of film
solution changed from 3 to 40g for casting the films on the silicone mats (Bonnaillie et al.
2014). Rectangular films with dimensions of approximately 15cm×25cm were produced
in Figure 5.
24
Figure 4: The casting of CaCas/Gly/CP film solution on a silicone mat with different spreading bars by using the Control Coater.
2.1.6.2. Drying and storing
The silicone mats with the casted film solutions were placed on the flat lab
benches to allow the film soluions dry for 1-2 days at 20˚C depending on the current
humidity. If humidity is high in the air, drying time lasts longer because humidity keeps
the casted films wet. Relative humidity (RH) in the lab (Eastern Regional Research
Center Wyndmoor, PA, US) varied from 22 to 70% during the year (Bonnaillie et al.
2014). Therefore, the drying of the film solutions can take either longer or shorter than
1-2 days.
After drying, the films were peeled off the mats, placed on a white A4 paper, and
stored in an environmental chamber maintained at 50% RH and 20˚C (Model 6020-1,
Caron, Marietta, OH, USA) for at least 2 days before testing. To maintain a stable RH in
the chamber, DI water line inside the lab was used to supply the chamber with the needed
water. Each film was cast at least 3 times (Bonnaillie et al. 2014).
25
Figure 5: The dried edible films on a white A4 paper.
2.1.6.3. Preparation of strips and thickness measurement
The films were cut into 5 mm×35 mm strips with a razor blade after storing them
at 50% RH for 2 days. The filmstrips were subjected to ambient humidity (22 to 70%
RH) overnight to reach an equilibrium state before testing the tensile properties of the
films. The thickness of each filmstrip was measured using a thickness gauge with 1 µm
precision (Mitutoyo Corp., Kanagawa, Japan) on five random locations on the strip. The
average value was calculated as the thickness of the films.
2.1.7. Analysis of Edible Films
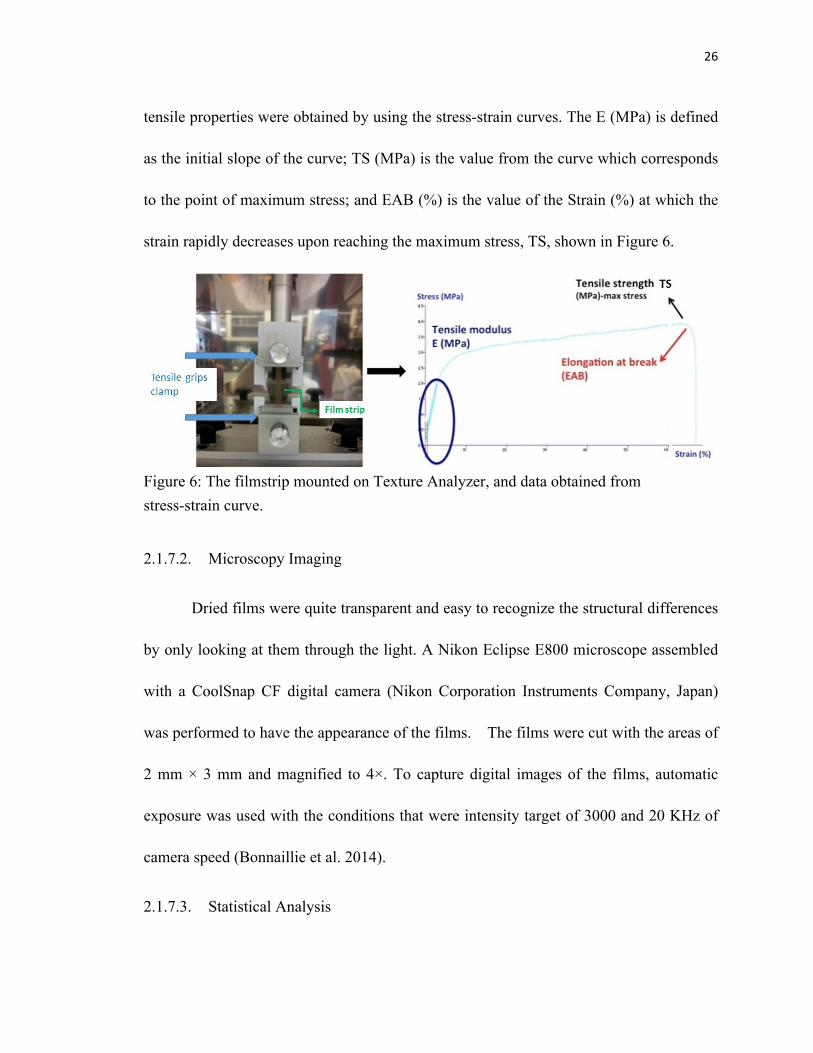
2.1.7.1. Tensile Properties Analysis
The E, TS, and EAB of the films were determined according to the ASTM
D882-98 method (ASTM 1998) by using a TA.XTPlus Texture Analyzer (Texture
Technologies Corp., Scarsdale, NY, US) with a cross-head speed of 0.2 mm/sec (Figure
6). The filmstrips were mounted vertically onto a tensile grips clamp with 25 mm gauge
length, and stress/strain curves were recorded 5-6 strips of each film tested. The various
26
tensile properties were obtained by using the stress-strain curves. The E (MPa) is defined
as the initial slope of the curve; TS (MPa) is the value from the curve which corresponds
to the point of maximum stress; and EAB (%) is the value of the Strain (%) at which the
strain rapidly decreases upon reaching the maximum stress, TS, shown in Figure 6.
Figure 6: The filmstrip mounted on Texture Analyzer, and data obtained from stress-strain curve.
2.1.7.2. Microscopy Imaging
Dried films were quite transparent and easy to recognize the structural differences
by only looking at them through the light. A Nikon Eclipse E800 microscope assembled
with a CoolSnap CF digital camera (Nikon Corporation Instruments Company, Japan)
was performed to have the appearance of the films. The films were cut with the areas of
2 mm × 3 mm and magnified to 4×. To capture digital images of the films, automatic
exposure was used with the conditions that were intensity target of 3000 and 20 KHz of
camera speed (Bonnaillie et al. 2014).
2.1.7.3. Statistical Analysis
27
Differences among E, EAB, and TS of the films based on the film thickness, RH,
and CP content were evaluated by analysis of variance with means separation (One-way
ANOVA), performed by using SPSS Version 21 (IBM Corp., London, UK) (provided by
The State University of New Jersey, Rutgers Software System).

28
2.2. Results and Discussion
2.2.1. Tensile Properties
As mentioned in section 2.1.7.1, the various tensile properties of the films were
obtained from the stress-strain curves. The E, TS, and EAB of the CaCas/Gly films were
analyzed as a function of humidity, film thickness and CP content in this section.
2.2.1.1. The Effects of Thickness and Humidity on the Tensile Properties of Controls
films
Control A Films
Control A films were prepared by first mixing CaCas with DI water and then
adding Gly with a constant 3:1 ratio of CaCas to Gly, which was a 15% (w/w) total solid
concentration. Due to the random coil structure of CaCas (Chen 2002; Chambi and
Grosso 2006) and the polar and nonpolar amino acid compositions of casein (Swaisgood
1992), CaCas completely hydrated in DI water. Both hydrogen bonds, which are between
polar amino acids and water molecules, and the hydrophobic interactions, which are
between the nonpolar amino acids chains, play an important role to form the molecular
structure of the films. In the film solutions, Gly is used as a plasticizer, which may slip
between the protein network chains to facilitate chain movement (Tomasula et al. 2003).
Therefore, it provides flexibility and stretchability properties to the films.

29
At 58-65% RH and 67-70% RH
Figures 7, 8, and 9 represent the values of E, EAB, and TS for the Control A films
as a function of film thickness, which were obtained from the stress-strain curves at
58-65% and 67-70% RH (Bonnaillie et al. 2014).
Figure 7: The effect of thickness on the E of Control A films at two different ranges of RH, 58-65% and 67-70% (p>0.05).
Figure 7 shows that E of Control A films was not affected by film thickness at
67-70% RH. There was a small change but not statistically significant (p>0.05). E
decreased from 1.9 to 0.7 MPa at 67-70% RH, whereas E decreased from 4.3-1.4 MPa
over the 0.011-0.144mm range of film thicknesses at 58-65% RH.
The results showed that the E values of Control A films at a high RH (67-70%)
were less than those at 58-65% RH. The high humidity condition caused the films to
become swollen with water molecules because the water molecule had a plasticizing
effect in the protein films that increased the effect of the plasticizer (Gly) (Chen 2002). E
y = -‐4.8601x + 1.6722
y = -‐13.64x + 3.3825
0
1
2
3
4
5
6
0.00 0.02 0.04 0.06 0.08 0.10 0.12 0.14 0.16 0.18
Elas5c Mod
ulus-‐E (M
Pa)
Thickness (mm)
E (MPa) at 67-‐70% RH
E (MPa) at 58-‐65% RH
30
was adversely affected by the presence of the plasticizer because the plasticizer increased
the mobility of protein chains by inserting itself in three-dimensional polymer network
(Siew et al. 1999). Therefore, the interactions were interfered and then loosened the stiff
and compact structure of film matrix.
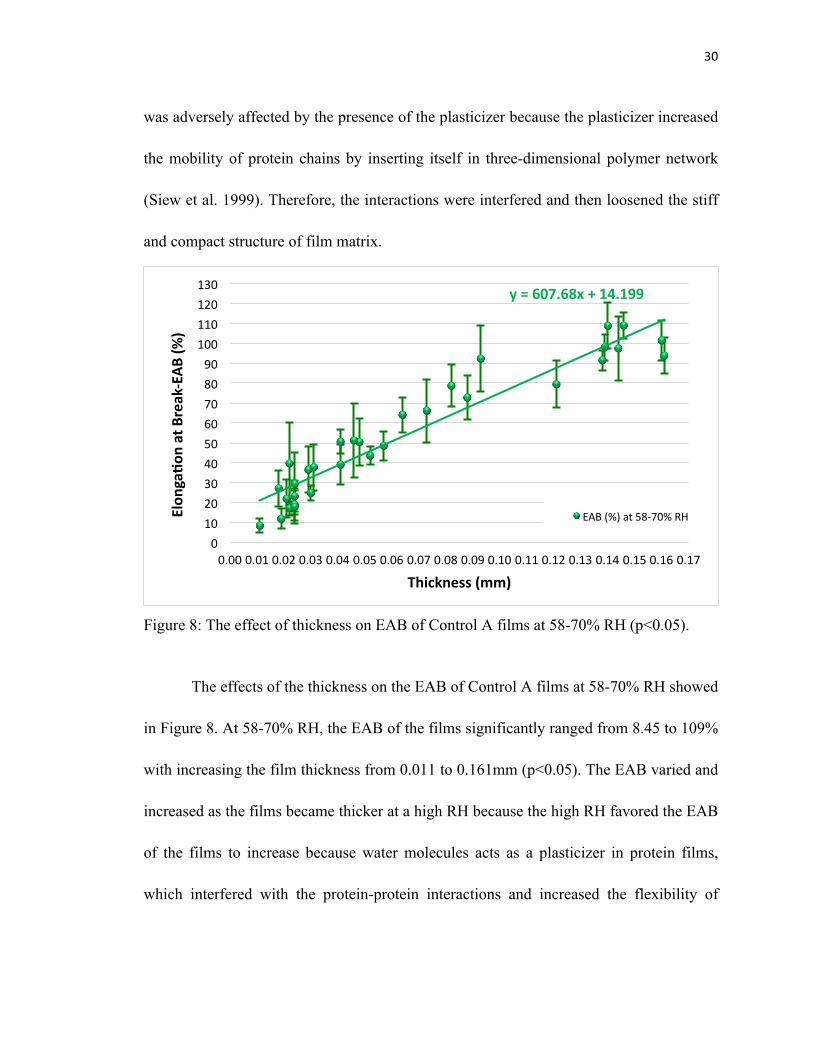
Figure 8: The effect of thickness on EAB of Control A films at 58-70% RH (p<0.05).
The effects of the thickness on the EAB of Control A films at 58-70% RH showed
in Figure 8. At 58-70% RH, the EAB of the films significantly ranged from 8.45 to 109%
with increasing the film thickness from 0.011 to 0.161mm (p<0.05). The EAB varied and
increased as the films became thicker at a high RH because the high RH favored the EAB
of the films to increase because water molecules acts as a plasticizer in protein films,
which interfered with the protein-protein interactions and increased the flexibility of
y = 607.68x + 14.199
0
10
20
30
40
50
60
70
80
90
100
110
120
130
0.00 0.01 0.02 0.03 0.04 0.05 0.06 0.07 0.08 0.09 0.10 0.11 0.12 0.13 0.14 0.15 0.16 0.17
Elon
ga5on
at B
reak-‐EAB (%
)
Thickness (mm)
EAB (%) at 58-‐70% RH

31
protein chains (Tomasula et al. 1998; Chen 2002; Tomasula et al. 2003). Therefore, the
films with the plasticizer became more elastic and stretchable.
Figure 9: The effect on thickness on TS of Control A films at two different ranges of RH, 58-65% and 67-70%.
The effect of thickness on TS of Control A films at 58-65% and 67-70%RH is
shown in Figure 9. The TS of the films slightly increased while increasing the film
thickness at 67-70% RH compared to the ones at 58-65% RH (p>0.05). Higher ratios of
protein to plasticizer in the film solutions resulted in higher values of TS of the films
(Chick and Ustunol 1998; Tomasula et al. 1998). However, a high RH favored Gly to
decrease the ratio of protein to plasticizer due to the plasticizing effect of water molecules
in the protein films (Chen 2002). Therefore, the interactions were adversely affected and
then reduced the TS of the films.
y = 5.194x + 3.3219
y = -‐2.3504x + 5.7945
0.0
1.0
2.0
3.0
4.0
5.0
6.0
7.0
8.0
9.0
0.00 0.02 0.04 0.06 0.08 0.10 0.12 0.14 0.16 0.18
Tensile Stren
gth-‐TS (M
Pa)
Thickness (mm)
TS (MPa) at 67-‐70% RH
TS (MPa) at 58-‐65% RH

32
Control F Films
Control F films were prepared by first mixing Gly with DI water and then adding CaCas
with a constant 3:1 ratio of CaCas to Gly as the same compositions of Control A films,
which was a 15% (w/w) total solid concentration.
At 59-69% RH:
Figures 10, 11, and 12 show the E, EAB, and TS of Control F films with a range
of film thicknesses. There was a significant change in the E, EAB, and TS of the films,
which either increased or decreased, while increasing film thickness ranged from 0.025 to
0.134mm at 59-69% RH (p<0.05).
E of Control F films varied and decreased from 4.81 to 0.78 MPa with increasing
film thickness from 0.025 to 0.134mm at 59-69% RH in Figure 10.
Figure 10: The effect of thickness on E of Control F films at 59-69% RH in 0.025-0.134mm film thickness (p<0.05).
y = -‐28.013x + 4.0874
0.0 0.5 1.0 1.5 2.0 2.5 3.0 3.5 4.0 4.5 5.0 5.5 6.0 6.5
0.00 0.02 0.04 0.06 0.08 0.10 0.12 0.14 0.16
Elas5c Mod
ulus (MPa)
Thickness (mm)
E at 59-‐69% RH
33
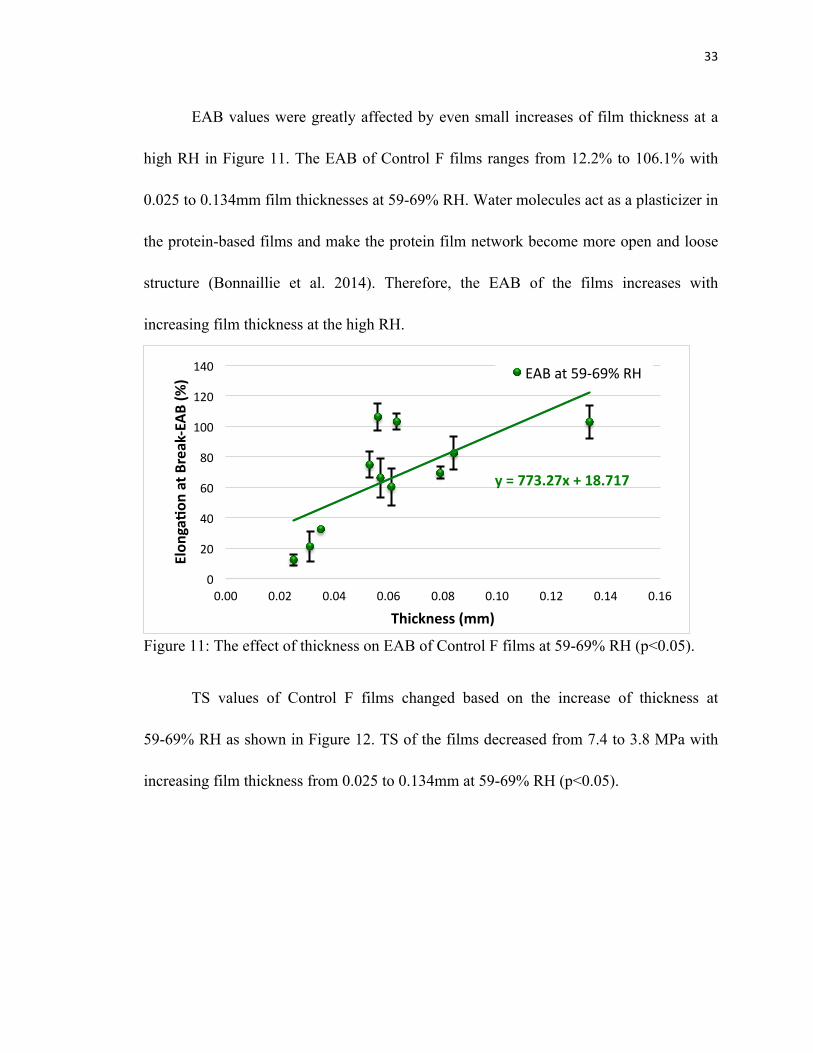
EAB values were greatly affected by even small increases of film thickness at a
high RH in Figure 11. The EAB of Control F films ranges from 12.2% to 106.1% with
0.025 to 0.134mm film thicknesses at 59-69% RH. Water molecules act as a plasticizer in
the protein-based films and make the protein film network become more open and loose
structure (Bonnaillie et al. 2014). Therefore, the EAB of the films increases with
increasing film thickness at the high RH.
Figure 11: The effect of thickness on EAB of Control F films at 59-69% RH (p<0.05).
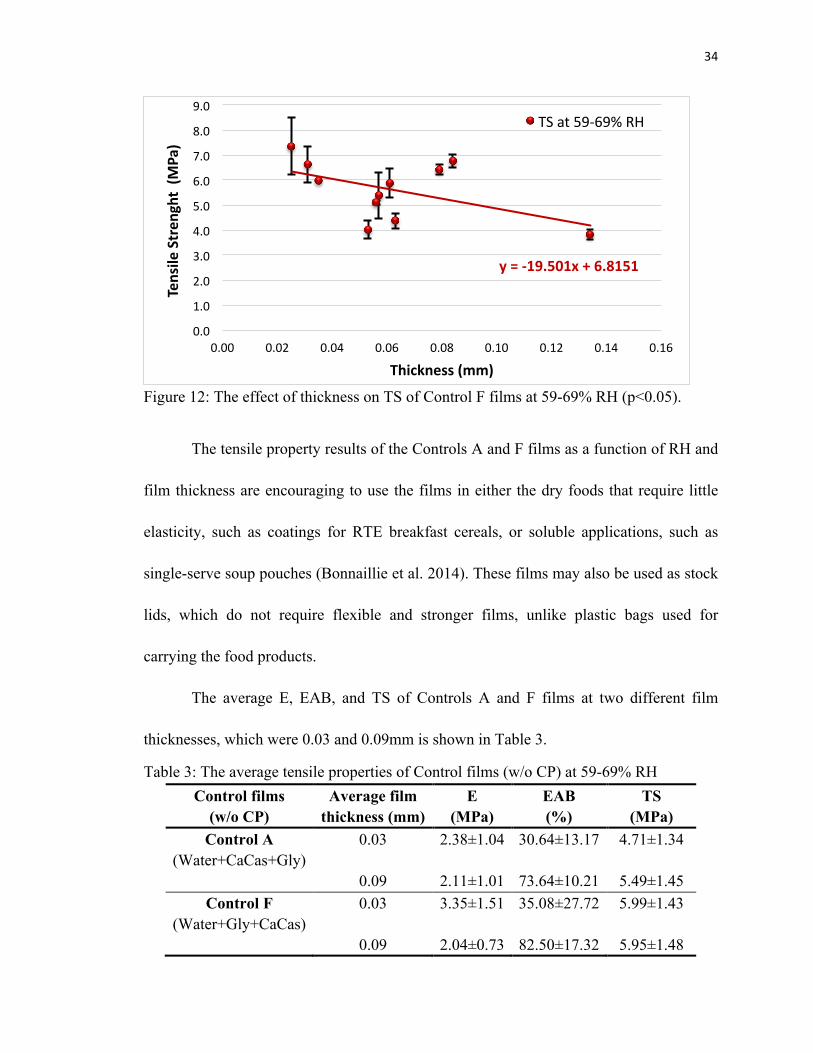
TS values of Control F films changed based on the increase of thickness at
59-69% RH as shown in Figure 12. TS of the films decreased from 7.4 to 3.8 MPa with
increasing film thickness from 0.025 to 0.134mm at 59-69% RH (p<0.05).
y = 773.27x + 18.717
0
20
40
60
80
100
120
140
0.00 0.02 0.04 0.06 0.08 0.10 0.12 0.14 0.16
Elon
ga5on
at B
reak-‐EAB (%
)
Thickness (mm)
EAB at 59-‐69% RH
34
Figure 12: The effect of thickness on TS of Control F films at 59-69% RH (p<0.05).
The tensile property results of the Controls A and F films as a function of RH and
film thickness are encouraging to use the films in either the dry foods that require little
elasticity, such as coatings for RTE breakfast cereals, or soluble applications, such as
single-serve soup pouches (Bonnaillie et al. 2014). These films may also be used as stock
lids, which do not require flexible and stronger films, unlike plastic bags used for
carrying the food products.
The average E, EAB, and TS of Controls A and F films at two different film
thicknesses, which were 0.03 and 0.09mm is shown in Table 3.
Table 3: The average tensile properties of Control films (w/o CP) at 59-69% RH Control films
(w/o CP) Average film
thickness (mm) E
(MPa) EAB (%)
TS (MPa)
Control A (Water+CaCas+Gly)
0.03 2.38±1.04 30.64±13.17 4.71±1.34
0.09 2.11±1.01 73.64±10.21 5.49±1.45 Control F
(Water+Gly+CaCas) 0.03 3.35±1.51 35.08±27.72 5.99±1.43
0.09 2.04±0.73 82.50±17.32 5.95±1.48
y = -‐19.501x + 6.8151
0.0
1.0
2.0
3.0
4.0
5.0
6.0
7.0
8.0
9.0
0.00 0.02 0.04 0.06 0.08 0.10 0.12 0.14 0.16
Tensile Stren
ght (M
Pa)
Thickness (mm)
TS at 59-‐69% RH

35
EAB was affected by the film thickness. EAB values approximately doubled with
the increase of the film thickness. The addition of Gly reduced polymer chain interactions
that reduced the strength of polymer network and increased the susceptibility of the films
to swell water vapor molecules (Tomasula et al. 1998; Dangaran et al. 2006; Bonnaillie et
al. 2014). This change in molecular structure enabled the film to become more elastic and
resistant to the force applied. Due to the plasticizing effects of water molecules, the
movement of polymer chains in the protein network was facilitated that was related to the
increase of film flexibility (Chen 2002). However, the values of tensile properties of
CaCas/Gly films in our study did not confirm the previous study results in Tomasula et
al. (1998). Tomasula and others (1998) found that the TS of CaCas/Gly with 7:3 ratio
was 1.9 MPa in 0.15mm film thickness, which was lower than our value of 5.95 MPa in
0.09mm thickness, and the EAB was 76% in 0.15mm thickness, which was also lower
than our value of 82.5% in 0.09mm thickness. The reasons for the differences are
probably both the different film thicknesses and the ratio of CaCas to Gly. They used
0.15mm film thickness, which was thicker than our film thickness of 0.09mm, and their
ratio of CaCas to Gly was 7:3, which is lower than the 3:1 ratio of CaCas to Gly in our
study. Tomasula and others (1998) used 30% (w/w) Gly in CaCas film solutions at the
constant of 6% (w/w) total solid concentration, whereas 5% Gly in CaCas solutions at the
constant of 15% (w/w) total solid concentration was used in our study. Therefore, TS
decreased and EAB increased with increasing plasticizer content that resulted in the film
to become less stiff and more stretchable (Chick and Ustunol 1998). Also, the cross-head
36
speed of 5mm/min, which was lower than our value of 12mm/min was used for the
tensile analysis in their study (Bonnaillie et al. 2014).
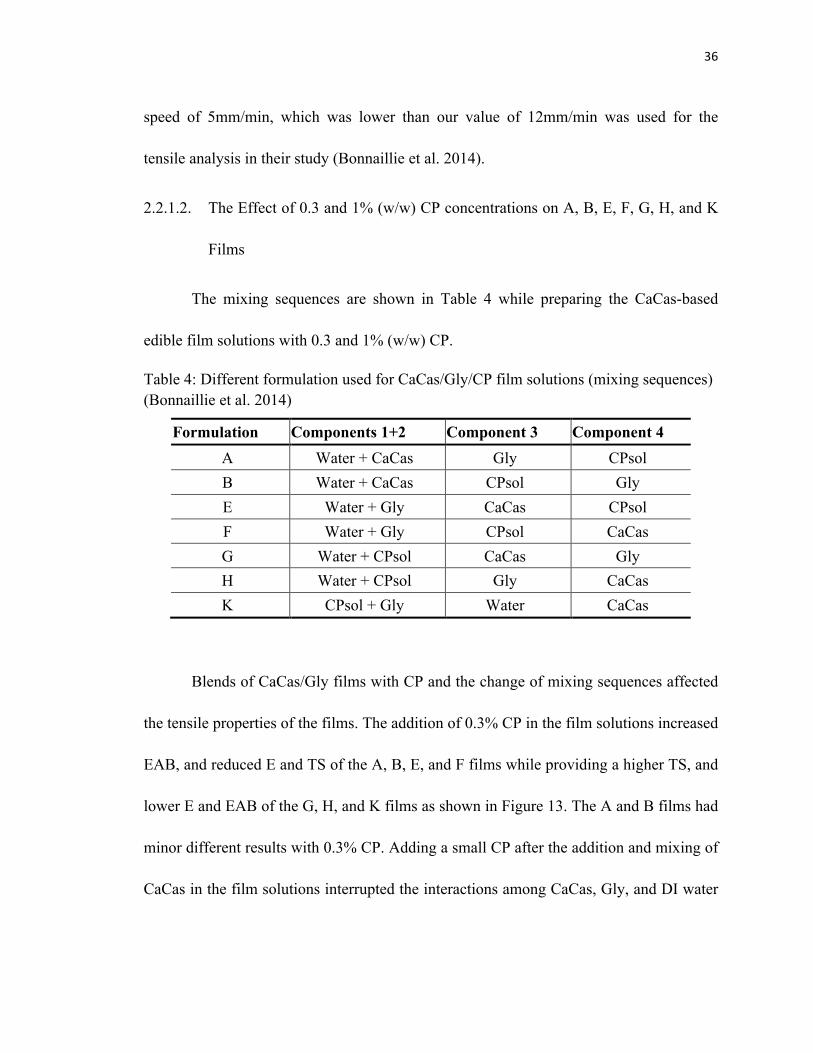
2.2.1.2. The Effect of 0.3 and 1% (w/w) CP concentrations on A, B, E, F, G, H, and K
Films
The mixing sequences are shown in Table 4 while preparing the CaCas-based
edible film solutions with 0.3 and 1% (w/w) CP.
Table 4: Different formulation used for CaCas/Gly/CP film solutions (mixing sequences) (Bonnaillie et al. 2014)
Formulation Components 1+2 Component 3 Component 4 A Water + CaCas Gly CPsol B Water + CaCas CPsol Gly E Water + Gly CaCas CPsol F Water + Gly CPsol CaCas G Water + CPsol CaCas Gly H Water + CPsol Gly CaCas K CPsol + Gly Water CaCas
Blends of CaCas/Gly films with CP and the change of mixing sequences affected
the tensile properties of the films. The addition of 0.3% CP in the film solutions increased
EAB, and reduced E and TS of the A, B, E, and F films while providing a higher TS, and
lower E and EAB of the G, H, and K films as shown in Figure 13. The A and B films had
minor different results with 0.3% CP. Adding a small CP after the addition and mixing of
CaCas in the film solutions interrupted the interactions among CaCas, Gly, and DI water

37
by crosslinking with Ca+2, which caused an uneven distribution of the interactions among
the molecules (Thakur et al. 1997; Maroziene and Kruif 2002; Bonnaillie et al. 2014).
1% CP provided an increase in E, decrease in EAB, and increase in TS of the A,
B, E, and F films. These films became stiffer, stronger, and less elastic, unlike the G, H,
and K films.
With increasing pectin content in the film solutions, the G, H, and K films were
stiffer, more stretchable, and stronger than the same films made from the film solutions
with 0.3% CP concentration. E films with 0.3% CP showed a higher elasticity, less stiff,
and less strong qualities, while the one with 1% CP was stiffer, stronger, and less elastic
(Bonnaillie et al. 2014).

38
Figure 13: E, EAB, and TS properties of different film formulations with 0.3 and 1% CP at 54-58% RH in 0.03-0.05mm film thickness. Rectangular symbol represents the average values of Control films according to Table 3 (Bonnaillie et al. 2014).
39
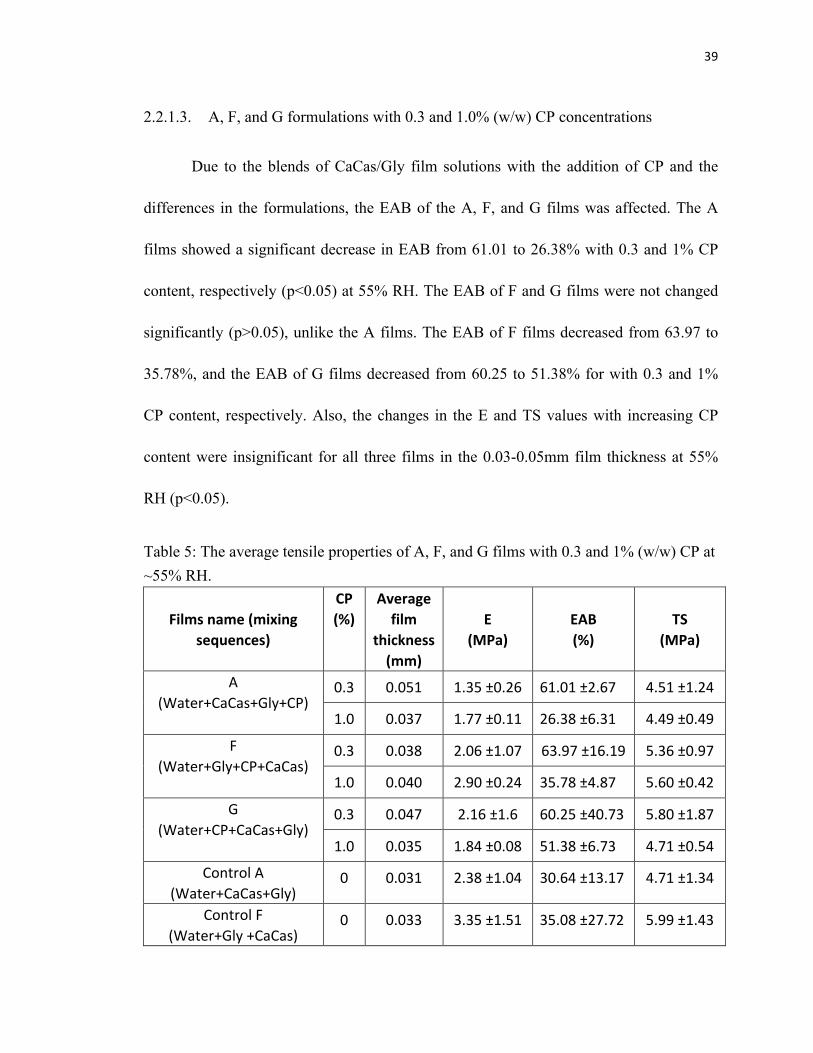
2.2.1.3. A, F, and G formulations with 0.3 and 1.0% (w/w) CP concentrations
Due to the blends of CaCas/Gly film solutions with the addition of CP and the
differences in the formulations, the EAB of the A, F, and G films was affected. The A
films showed a significant decrease in EAB from 61.01 to 26.38% with 0.3 and 1% CP
content, respectively (p<0.05) at 55% RH. The EAB of F and G films were not changed
significantly (p>0.05), unlike the A films. The EAB of F films decreased from 63.97 to
35.78%, and the EAB of G films decreased from 60.25 to 51.38% for with 0.3 and 1%
CP content, respectively. Also, the changes in the E and TS values with increasing CP
content were insignificant for all three films in the 0.03-0.05mm film thickness at 55%
RH (p<0.05).
Table 5: The average tensile properties of A, F, and G films with 0.3 and 1% (w/w) CP at ~55% RH.
Films name (mixing
sequences)
CP (%)
Average film
thickness (mm)
E
(MPa)
EAB (%)
TS
(MPa)
A (Water+CaCas+Gly+CP)
0.3 0.051 1.35 ±0.26 61.01 ±2.67 4.51 ±1.24
1.0 0.037 1.77 ±0.11 26.38 ±6.31 4.49 ±0.49
F (Water+Gly+CP+CaCas)
0.3 0.038 2.06 ±1.07 63.97 ±16.19 5.36 ±0.97
1.0 0.040 2.90 ±0.24 35.78 ±4.87 5.60 ±0.42
G (Water+CP+CaCas+Gly)
0.3 0.047 2.16 ±1.6 60.25 ±40.73 5.80 ±1.87
1.0 0.035 1.84 ±0.08 51.38 ±6.73 4.71 ±0.54
Control A (Water+CaCas+Gly)
0 0.031 2.38 ±1.04 30.64 ±13.17 4.71 ±1.34
Control F (Water+Gly +CaCas)
0 0.033 3.35 ±1.51 35.08 ±27.72 5.99 ±1.43
40
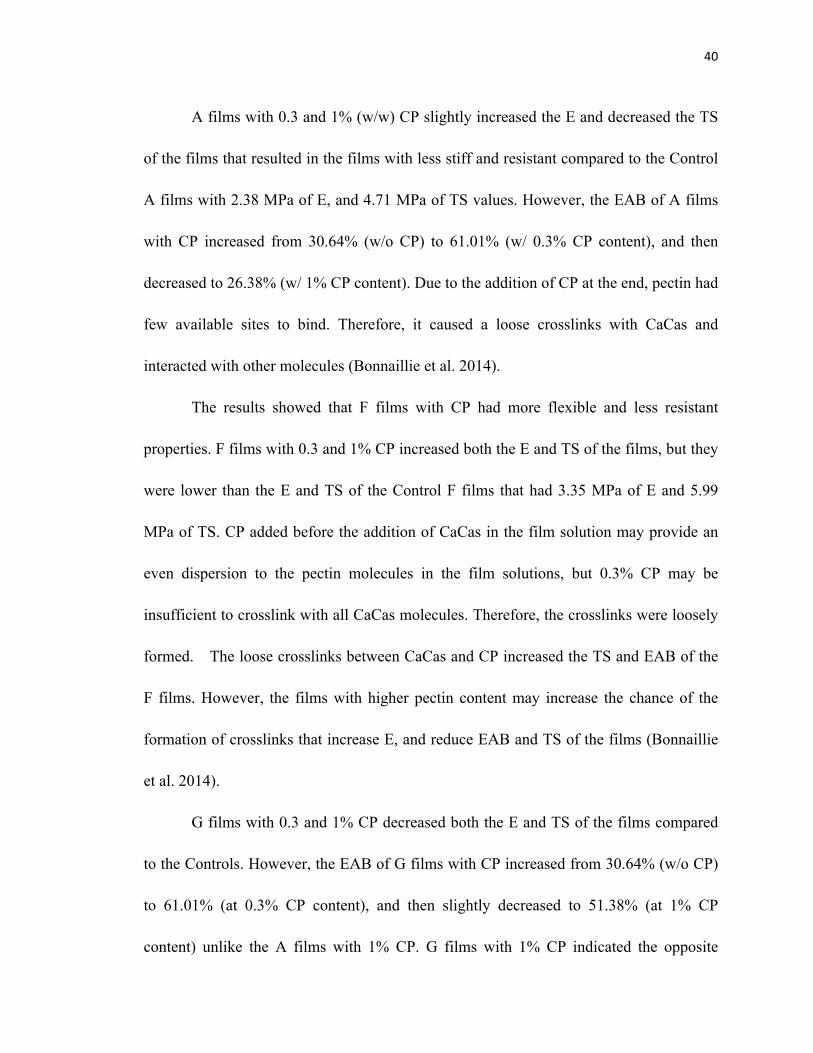
A films with 0.3 and 1% (w/w) CP slightly increased the E and decreased the TS
of the films that resulted in the films with less stiff and resistant compared to the Control
A films with 2.38 MPa of E, and 4.71 MPa of TS values. However, the EAB of A films
with CP increased from 30.64% (w/o CP) to 61.01% (w/ 0.3% CP content), and then
decreased to 26.38% (w/ 1% CP content). Due to the addition of CP at the end, pectin had
few available sites to bind. Therefore, it caused a loose crosslinks with CaCas and
interacted with other molecules (Bonnaillie et al. 2014).
The results showed that F films with CP had more flexible and less resistant
properties. F films with 0.3 and 1% CP increased both the E and TS of the films, but they
were lower than the E and TS of the Control F films that had 3.35 MPa of E and 5.99
MPa of TS. CP added before the addition of CaCas in the film solution may provide an
even dispersion to the pectin molecules in the film solutions, but 0.3% CP may be
insufficient to crosslink with all CaCas molecules. Therefore, the crosslinks were loosely
formed. The loose crosslinks between CaCas and CP increased the TS and EAB of the
F films. However, the films with higher pectin content may increase the chance of the
formation of crosslinks that increase E, and reduce EAB and TS of the films (Bonnaillie
et al. 2014).
G films with 0.3 and 1% CP decreased both the E and TS of the films compared
to the Controls. However, the EAB of G films with CP increased from 30.64% (w/o CP)
to 61.01% (at 0.3% CP content), and then slightly decreased to 51.38% (at 1% CP
content) unlike the A films with 1% CP. G films with 1% CP indicated the opposite
41
results to the F films with 1% CP. The reason could be the addition of Gly at the end in
the film solutions because it may disturb the crosslinks and hydrogen bonds of the protein
chains that reduce the E, and increase the TS of the G films with 1% CP (Bonnaillie et al.
2014).
The results in this section indicated that the mixing sequences of CP in the film
solutions altered the mechanical strength of the A, F, and G films because the carboxyl
groups of pectin interacted with water molecules before CaCas. When adding CaCas in
the film solution after the addition of pectin, CaCas with polar and nonpolar side chains
employed between pectin and water molecules. The polar side of CaCas interacted with
water molecules, and nonpolar amino acid chains of CaCas bound with pectin molecules
(Swaisgood 1992; Chen 2002; BeMiller 2007). Therefore, each compound interacts with
each other differently based on the addition and mixing order of the film compounds in
the film solutions.
2.2.2. Microscopy Images
All microscopy images of the films were captured with a low magnification of 4×
to demonstrate the structure of the films in macromolecular level at about 60% RH
(Bonnaillie et al. 2014).
42
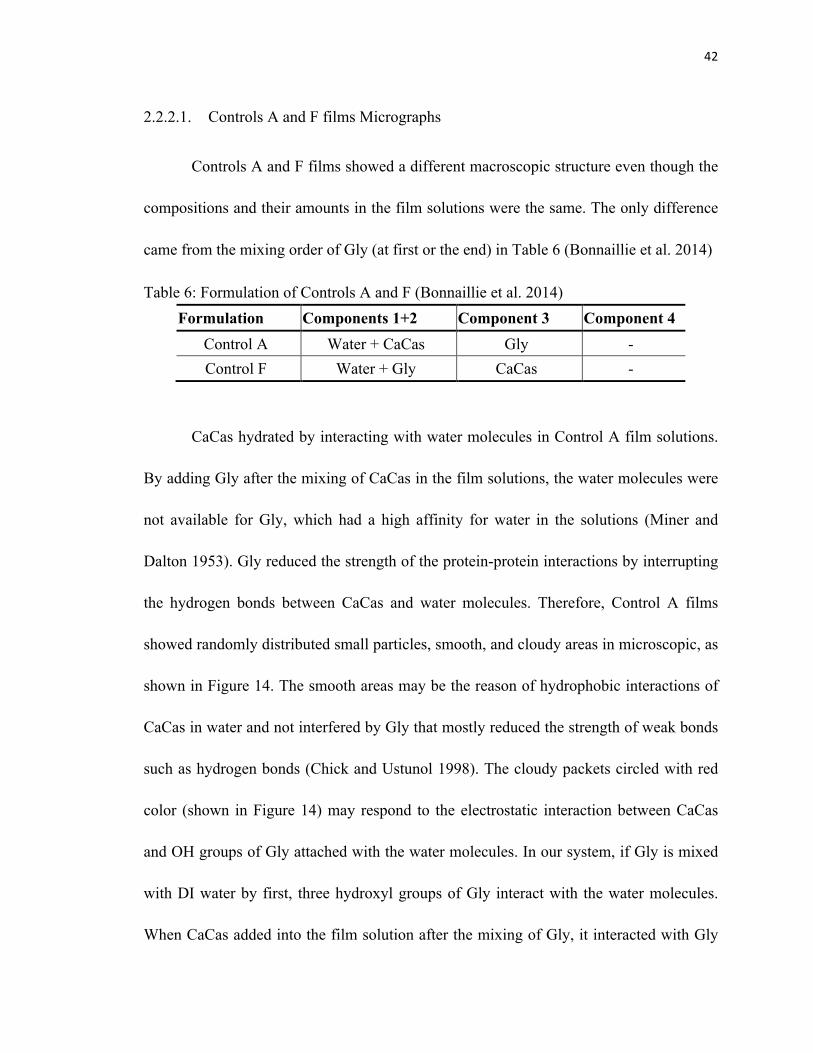
2.2.2.1. Controls A and F films Micrographs
Controls A and F films showed a different macroscopic structure even though the
compositions and their amounts in the film solutions were the same. The only difference
came from the mixing order of Gly (at first or the end) in Table 6 (Bonnaillie et al. 2014)
Table 6: Formulation of Controls A and F (Bonnaillie et al. 2014) Formulation Components 1+2 Component 3 Component 4
Control A Water + CaCas Gly - Control F Water + Gly CaCas -
CaCas hydrated by interacting with water molecules in Control A film solutions.
By adding Gly after the mixing of CaCas in the film solutions, the water molecules were
not available for Gly, which had a high affinity for water in the solutions (Miner and
Dalton 1953). Gly reduced the strength of the protein-protein interactions by interrupting
the hydrogen bonds between CaCas and water molecules. Therefore, Control A films
showed randomly distributed small particles, smooth, and cloudy areas in microscopic, as
shown in Figure 14. The smooth areas may be the reason of hydrophobic interactions of
CaCas in water and not interfered by Gly that mostly reduced the strength of weak bonds
such as hydrogen bonds (Chick and Ustunol 1998). The cloudy packets circled with red
color (shown in Figure 14) may respond to the electrostatic interaction between CaCas
and OH groups of Gly attached with the water molecules. In our system, if Gly is mixed
with DI water by first, three hydroxyl groups of Gly interact with the water molecules.
When CaCas added into the film solution after the mixing of Gly, it interacted with Gly

43
and unbounded water molecules. Therefore, it provided rough, tight, and randomly
distributed small particles of pectin molecules, as pointed with the arrows in Figure 14.
The macroscopic images of Controls A and F films confirmed that molecular
changes were correlated to the tensile properties of the films. Control F films were more
stretchy, stronger, and stiffer than Control A films, shown in Table 3 even though the
tensile properties of both Controls were similar.
Figure 14: Micrographs of Controls A and F with 4× magnifications.
2.2.2.2. CaCas/Gly/CP Films Micrographs
Figures 15 and 16 show the microscopic images of the films prepared based on
the different formulations of the films solutions, which contained 0.3 and 1% (w/w) CP
(Bonnaillie et al. 2014).
The formulations of CaCas/Gly films with 0.3% (w/w) CP
The addition of 0.3% (w/w) CP in the film solutions at the different mixing order,
all films (the A, B, E, F, G, H, and K films) were observed with a new molecular
configuration that composed of either large, heterogeneous, less tight, and aggregated

44
particles, or homogeneous, more tight, and small particles of the pectin molecules. The A
and B films had similar microscopic images because CP was added into the film solution
after the mixing of CaCas in DI water that resulted in CaCas interacted with water
molecules via both hydrogen bonds and hydrophobic interactions (Maroziene and Kruif
2000). After the addition of a small amount of pectin, it interfered with the interactions to
crosslink with Ca+2 that caused an uneven distribution of interactions among the
molecules. Pedersen and Jorgensen (1991) concluded that casein/pectin solution with
Ca+2 favored the crosslink between pectin and casein complexes to forms the aggregated
structure. Also, the images are in agreement with the tensile properties of A and B films
with 0.3% CP, as showed in Figure 13 because the changes in the molecular structure of
the films are correlated to the mechanical strength of the edible films (Lacroix et al. 1998;
Letendre et al. 2002; Bonnaillie et al. 2014).
E films with 0.3% CP had an open and loose film structure as the F films, but E
films had a small, tight and unevenly distributed pectin particles in the microstructure of
the films. The F films with 0.3% CP showed a broad dispersed and loose aggregated
pectin molecules, as shown in Figure 15. The difference was occurred due to the addition
of CP before CaCas in F film solutions, which favored the pectin molecules to disperse
well by forming hydrophobic interactions by avoiding water molecules (BeMiller 2007).
G films with 0.3% CP demonstrated well dispersed, evenly distributed, small, tight, and
homogeneous pectin molecules that were positively correlated with forming a stiffer and
stronger film. Therefore, G films with 0.3% CP showed a higher moduli and strength, and
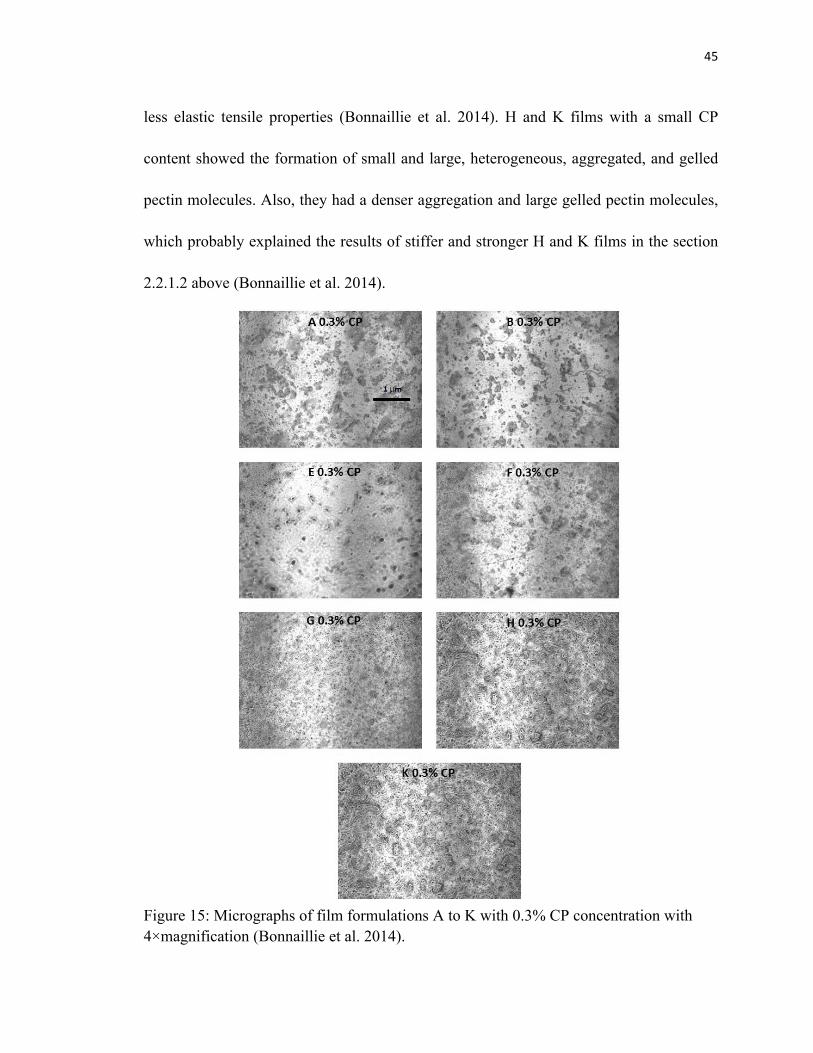
45
less elastic tensile properties (Bonnaillie et al. 2014). H and K films with a small CP
content showed the formation of small and large, heterogeneous, aggregated, and gelled
pectin molecules. Also, they had a denser aggregation and large gelled pectin molecules,
which probably explained the results of stiffer and stronger H and K films in the section
2.2.1.2 above (Bonnaillie et al. 2014).
Figure 15: Micrographs of film formulations A to K with 0.3% CP concentration with 4×magnification (Bonnaillie et al. 2014).
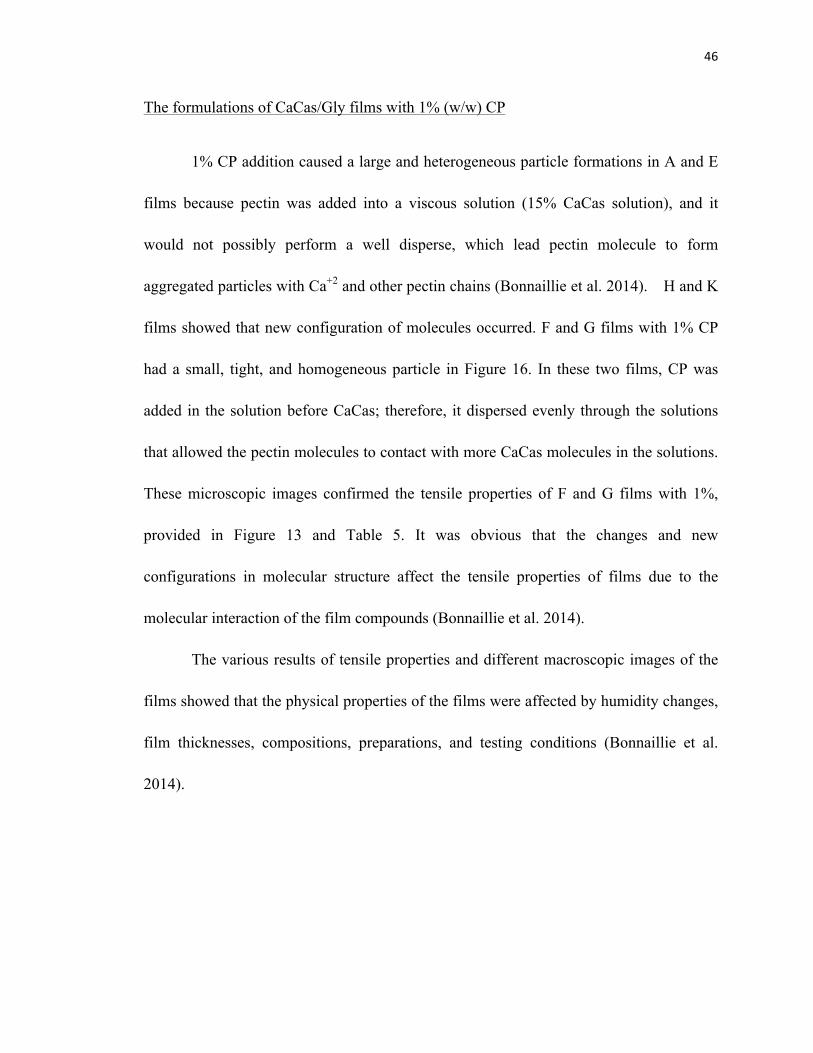
46
The formulations of CaCas/Gly films with 1% (w/w) CP
1% CP addition caused a large and heterogeneous particle formations in A and E
films because pectin was added into a viscous solution (15% CaCas solution), and it
would not possibly perform a well disperse, which lead pectin molecule to form
aggregated particles with Ca+2 and other pectin chains (Bonnaillie et al. 2014). H and K
films showed that new configuration of molecules occurred. F and G films with 1% CP
had a small, tight, and homogeneous particle in Figure 16. In these two films, CP was
added in the solution before CaCas; therefore, it dispersed evenly through the solutions
that allowed the pectin molecules to contact with more CaCas molecules in the solutions.
These microscopic images confirmed the tensile properties of F and G films with 1%,
provided in Figure 13 and Table 5. It was obvious that the changes and new
configurations in molecular structure affect the tensile properties of films due to the
molecular interaction of the film compounds (Bonnaillie et al. 2014).
The various results of tensile properties and different macroscopic images of the
films showed that the physical properties of the films were affected by humidity changes,
film thicknesses, compositions, preparations, and testing conditions (Bonnaillie et al.
2014).
47
Figure 16: Micrographs of film Formulation A to K with 1.0% CP concentration with 4×magnification (Bonnaillie et al. 2014).

48
2.3. Summary
The values of E, EAB, and TS of all films w/ and w/o CP were obtained from
stress-strain curve at different film thicknesses and a narrow range of RH.
The results of Control A films showed that the film thickness had a slight effect
on E and TS of the films, which was insignificant (p>0.05), while EAB values of the
films were significantly affected by the increase of film thickness from 0.01 to 0.144mm
at 58-70% RH (p<0.05). E of Control A films decreased from 4.3 to 1.4 MPa at 58-65%
RH, whereas the E value of the films was 1.9 MPa in 0.02mm film thickness, which was
less than the ones with 4.3 MPa in the same film thickness at 58-65% RH, and decreased
to 0.7 MPa (in 0.14mm thickness) at 67-70% RH.
The E and TS of Control F films varied and decreased, whereas EAB ranged and
greatly affected by increasing film thickness at 59-69% RH (p<0.05). The E values of
Control F films spread and decreased from 4.81 to 0.78 MPa with increasing the film
thickness from 0.025 to 0.134mm at 59-69% RH. The EAB of Control F films ranges
from 12.2% to 106.1% with 0.025 to 0.134mm film thicknesses at 59-69% RH. TS of
Control F films decreased from 7.4 to 3.8 MPa with over the same range of film thickness
and RH. Controls films became less stiff and resistant, and more elastic because network
structure became more open and loose with increasing the film thickness at a high RH
due to the plasticizing effect of water molecules that reduced the E and TS, and increased

49
the EAB of the caseinate-based films (Tomasula et al. 1998; Chen 2002; Bonnaillie et al.
2014).
Beyond E and TS values of Control films, EAB of both films boosted in 0.09mm
film thickness compared to 0.03mm film thickness at 59-69% RH. EAB values
approximately doubled at the 0.03 and 0.09mm of average film thickness. EAB increased
from 30.64 MPa in 0.03mm film thickness to 73.64 MPa in 0.09mm film thickness for
Control A films. EAB of Control F films increased from 35.08 in 0.03mm thickness to
82.50 MPa in 0.09mm thickness. The thick film favored the edible films to become more
elastic and flexible at high RH.
0.3 and 1% (w/w) CP addition and film formulations (A, B, E, F, G, H, and K
films), which were differentiated by the mixing sequences of compounds in the film
solutions, affected the tensile properties of the CaCas/Gly films. 0.3% CP increased EAB,
and reduced E and TS of the A, B, E, and F films while providing stronger, less stiff, and
less elastic properties to the G, H, and K films. 1% CP provided an increase in the E,
decrease in the EAB, and increase in the TS of A, B, E, and F films. These films became
stiffer, less elastic, and stronger, unlike the G, H, and K films. The G, H, and K films
solutions with 1% CP resulted in the films with less stiff, more flexible, and more elastic
than the films with 0.3% CP concentration (Bonnaillie et al. 2014).
The films made of CaCas/Gly/CP showed a decrease in EAB from 61.01 to
26.38% for A films, 63.97 to 35.78% for F films, and 60.25 to 51.38% for G films with
0.3% and 1% CP content, respectively, in approximately 0.05mm film thickness at 55%

50
RH. However, the changes in E and TS values with increasing CP content was not
significant for all three films in 0.05mm thickness (p>0.05) (Bonnaillie et al. 2014).
Microscopy images of films were also captured to observe the molecular structure
changes and new configurations of compounds that were used to make the edible films.
Control A films had randomly distributed small particles, smooth, and cloudy areas,
whereas Control F films had a rough, tight, and mostly homogeneous and randomly
distributed small particles of pectin molecules (Bonnaillie et al. 2014).
With adding of 0.3% CP in each film, all films showed a new molecular
configuration composed of either large particles, heterogeneous, less tight, aggregated, or
homogeneous, tightly aggregated, and small particles of pectin molecules. Both A and B
films had similar microscopic images. E films with 0.3% CP showed an open structure as
F films, but E films had a small, tight, and heterogeneous pectin particles in the open
network structure. F films with 0.3% CP showed a broad spread and loose aggregated
pectin molecules. G films with 0.3% CP demonstrated evenly distributed, small, tight,
and homogeneous pectin molecules that were positively correlated to the formation of
stiffer and stronger film. H and K films with a small CP content showed the formation of
small and large, heterogeneous, aggregated, and gelled pectin molecules (Bonnaillie et al.
2014).
Increasing CP content in the film solutions had both positive and negative effects
on the molecular structure of the films. 1% CP addition caused a large and heterogeneous
particle formations in A and E films while F and G films with 1% CP had a small, tight,

51
and homogeneous pectin particle distributions throughout the film layer. H and K films
showed that new configuration of molecules occurred by forming a tight, small, and
large, pectin molecules in the protein network (Bonnaillie et al. 2014).
52
3. EDIBLE COATINGS APPLICATION
3.1. Experimental Design
3.1.1. Overview
The protein content, milk gain, milk absorption rate, and texture of RTE breakfast
cereals coated with CaCas and in blends with Gly, CP, and NFDM solutions were
examined. The texture analysis of the flakes with different coatings was performed in
both dry state, which is the term used here for the dried flakes coated with the various
solutions and wet state of the flakes, which is the term used for the soaked flakes
resulting from placing the treated flakes in 1% reduced fat milk at 8 °C for 3 min.
Additionally, the surface appearances and morphologies for the different coating
treatments on the flakes were observed.
3.1.2. Materials and Methods
Refer to the analysis in the section 2.1.2 above, the same calcium caseinate
(CaCas), citric pectin (CP), glycerol (Gly), and de-ionized (DI) water were used. Nonfat
dry milk powder (NFDM) was purchased from American Casein Co. (Burlington, NJ).
Glucose (α-D-Glucose anhydrous, 96%) was purchased from Sigma-Aldrich (St. Louis,
MO). Wheaties® (General Mills, Minneapolis, MN) and 1% reduced fat milk (Lehigh
Valley Dairy, Pasteurized-Grade A, Lansdale, PA) was purchased from a local grocery
store. Lehigh Valley Dairy Farms® provided that 1% reduced fat milk contained 90.75%

53
water, and 9.25% solids, of which are 8% protein, 25% phosphorous, and some vitamins
and minerals. Several 314 mL mist bottles with a non-clogging nozzle (Trudeau Corp.
INC, Chicago, IL), were purchased from Walmart (Wyndmoor, PA, US).
Wheaties® (General Mills, Minneapolis, MN) was purchased from a local grocery store
(Wyndmoor, PA, US). Wheaties ® contained 81.5% total carbohydrates, which is
composed of dietary fiber, sugar, and other carbohydrate, 7.4% (2 g) protein, 1.9% fat,
some vitamins and minerals per serving size (27 g), provided by the manufacturer.
3.1.3. Compositional Analysis
3.1.3.1. Moisture and Ash Analysis of NFDM Powder
The moisture content and ash content of NFDM were measured in triplicate
according to the method of AOAC (1990) by following the same conditions in the
sections 2.1.3.1 and 2.1.3.2 above. NFDM contained approximately 6.0% moisture and
6.0% ash.
3.1.3.2. Crude Protein Analysis of CaCas and NFDM Powders
The protein analysis of CaCas and NFDM were carried out according to the
method of AOAC 992.23 (AOAC 2000). Nitrogen content of the sample was obtained
via EA1112 Nitrogen/Protein Analyzer (Thermo Electron Corp. Waltham, MA, US),
known as Combustion Method. Each sample was weighed approx. 20 mg into the tin
capsule and squeezed to prevent any sample leakages without damaging to the capsule

54
surrounded to the samples. Aspartic acid was used for calibration. Each sample analyzed
in duplicate, and the average was counted as nitrogen percentage. The percentage of
crude protein was calculated based on the protein factor of foods. For example, it is 6.38
for milk and dairy products (Jones 1931; Mosse 1990).
𝐶𝑟𝑢𝑑𝑒 𝑝𝑟𝑜𝑡𝑒𝑖𝑛,% = %𝑁 ∗ 𝑝𝑟𝑜𝑡𝑒𝑖𝑛 𝑓𝑎𝑐𝑡𝑜𝑟
%N is the nitrogen percentage of sample
The following test conditions were used: furnace temperature of 950°C for
pyrolysis of the samples in pure (99.9%) oxygen; isolation system, which isolates
liberated nitrogen gas from other combustion products for subsequent measurement by
thermal conductivity detector; and detection system, which interprets detector response as
percent of N (w/w). CaCas and NFDM contained 87.7 and 35.9% of protein, respectively.
3.1.3.3. Crude Protein Analysis of Wheaties
The protein content of Wheaties ® was carried out by following the method of
AOAC 992.23 (AOAC 2000) for cereal grains and their products by using
Nitrogen/Protein Analyzer used the same conditions in the section 3.1.3.2 above. The
cereals flakes were ground using a mortar and pestle to have suitable fineness resulting in
achieving precision, and the fraction that passed through a 1.4- mm screen was collected
and used for the analysis. The sample was weighed approximately 20 mg into the tin
capsule and squeezing it to prevent any sample leakages without damaging to the capsule
surrounded to the samples. Aspartic acid was used for calibration. Each sample analyzed

55
in triplicate, and the average was counted as nitrogen percentage. To calculate the
percentage of crude protein, protein factor that is 5.83 of whole wheat products (Merrill
and Watt, 1973) was used. The result showed that it contained approximately 3-4 g
protein per serving size (27 g of Wheaties). However, the manufacturer provided it
contained 2 g protein per serving size. The reason of difference might be that the
combustion method measures total organic nitrogen, not just protein nitrogen (Jones
1931; Chang 2010).
3.1.4. Preparation of Coating Solutions
3.1.4.1. Glucose and CaCas Solutions with Gly and CP
All solutions were prepared with DI water to a constant 15% (w/w) total protein
concentration (except glucose solution) by mixing for approximately 2h at room
temperature before applying on a cereal product. They were prepared fresh before
spraying.
Glucose solution: 15% (w/w) glucose solution was prepared with DI water by stirring at
600 rpm until it dissolved completely.
CaCas/Gly solution: 5 g Gly was mixed with 80 g DI water stirred at 600 rpm for 30 min.
Then, 15 g CaCas was added into the solution and continued to mix for 2h to prepare a
100mL coating solution.
CaCas/Gly/CP solutions: At first, 3% (w/w) CP solution was prepared with DI water by
stirring at 1200 rpm for 2h (Bonnaillie et al. 2014) because CP is difficult to dissolve in
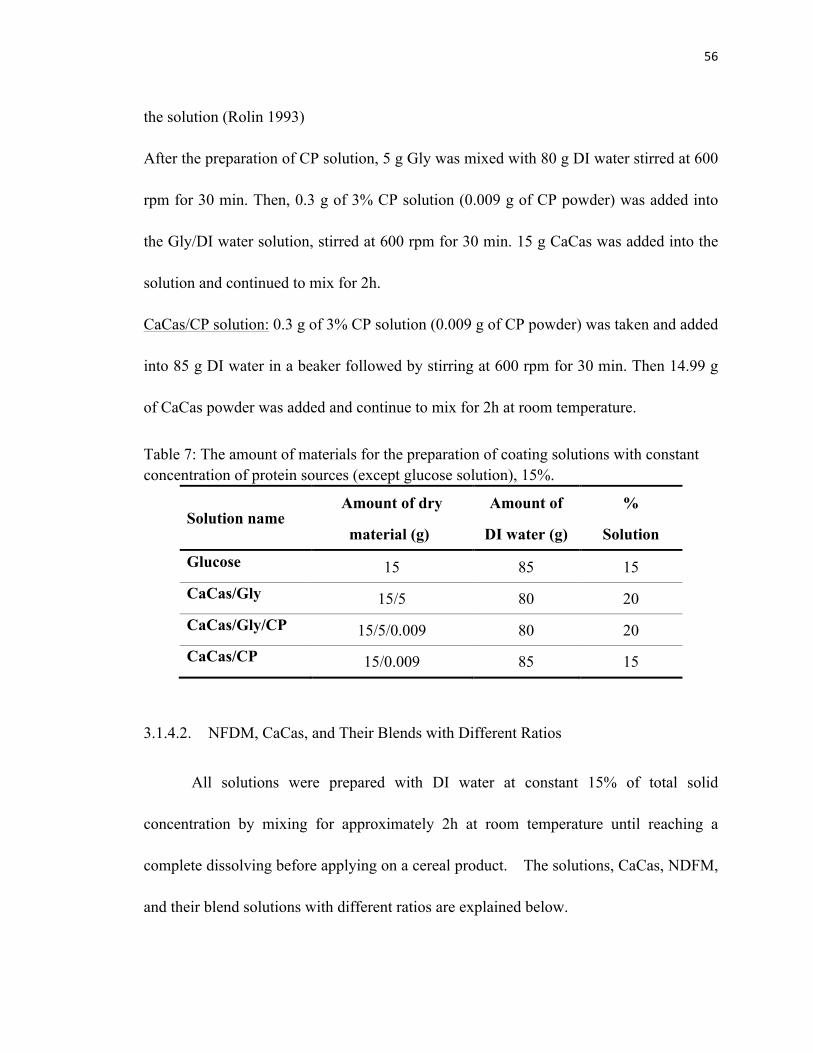
56
the solution (Rolin 1993)
After the preparation of CP solution, 5 g Gly was mixed with 80 g DI water stirred at 600
rpm for 30 min. Then, 0.3 g of 3% CP solution (0.009 g of CP powder) was added into
the Gly/DI water solution, stirred at 600 rpm for 30 min. 15 g CaCas was added into the
solution and continued to mix for 2h.
CaCas/CP solution: 0.3 g of 3% CP solution (0.009 g of CP powder) was taken and added
into 85 g DI water in a beaker followed by stirring at 600 rpm for 30 min. Then 14.99 g
of CaCas powder was added and continue to mix for 2h at room temperature.
Table 7: The amount of materials for the preparation of coating solutions with constant concentration of protein sources (except glucose solution), 15%.
Solution name
Amount of dry
material (g)
Amount of
DI water (g)
%
Solution
Glucose 15 85 15 CaCas/Gly 15/5 80 20 CaCas/Gly/CP 15/5/0.009 80 20 CaCas/CP 15/0.009 85 15
3.1.4.2. NFDM, CaCas, and Their Blends with Different Ratios
All solutions were prepared with DI water at constant 15% of total solid
concentration by mixing for approximately 2h at room temperature until reaching a
complete dissolving before applying on a cereal product. The solutions, CaCas, NDFM,
and their blend solutions with different ratios are explained below.
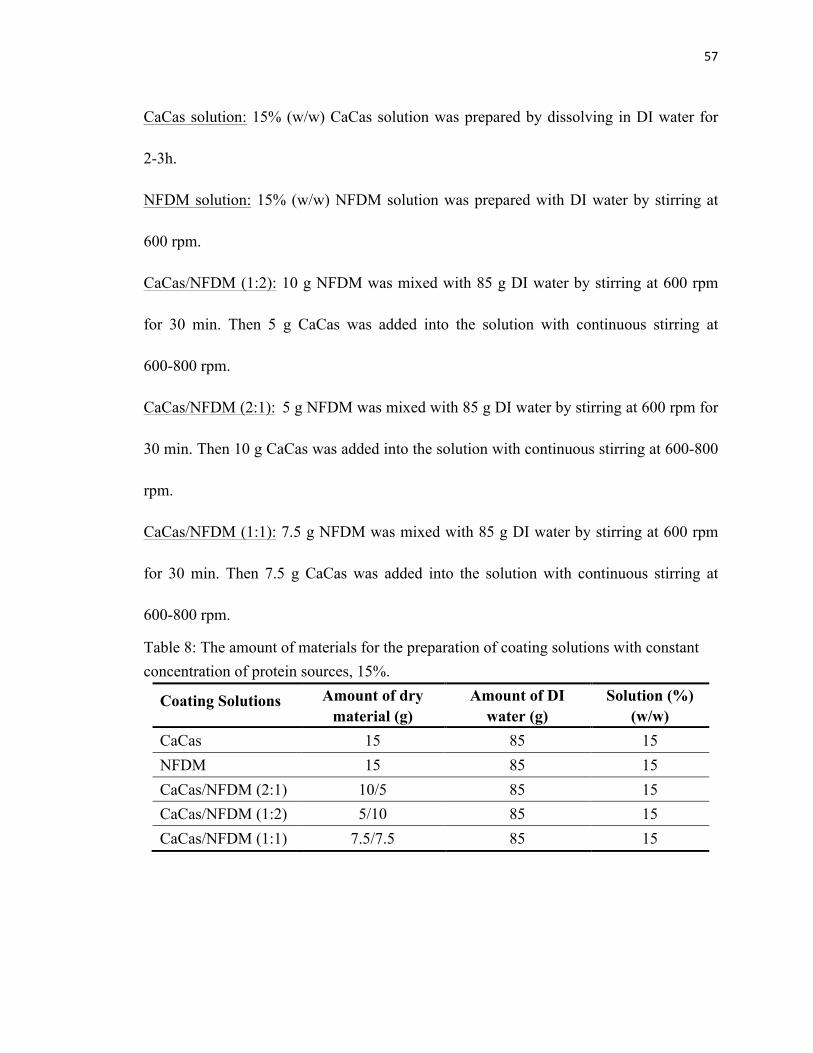
57
CaCas solution: 15% (w/w) CaCas solution was prepared by dissolving in DI water for
2-3h.
NFDM solution: 15% (w/w) NFDM solution was prepared with DI water by stirring at
600 rpm.
CaCas/NFDM (1:2): 10 g NFDM was mixed with 85 g DI water by stirring at 600 rpm
for 30 min. Then 5 g CaCas was added into the solution with continuous stirring at
600-800 rpm.
CaCas/NFDM (2:1): 5 g NFDM was mixed with 85 g DI water by stirring at 600 rpm for
30 min. Then 10 g CaCas was added into the solution with continuous stirring at 600-800
rpm.
CaCas/NFDM (1:1): 7.5 g NFDM was mixed with 85 g DI water by stirring at 600 rpm
for 30 min. Then 7.5 g CaCas was added into the solution with continuous stirring at
600-800 rpm.
Table 8: The amount of materials for the preparation of coating solutions with constant concentration of protein sources, 15%.
Coating Solutions Amount of dry material (g)
Amount of DI water (g)
Solution (%) (w/w)
CaCas 15 85 15 NFDM 15 85 15 CaCas/NFDM (2:1) 10/5 85 15 CaCas/NFDM (1:2) 5/10 85 15 CaCas/NFDM (1:1) 7.5/7.5 85 15

58
3.1.5. Preparation of Treated Breakfast Cereals for Testing
Each solution was poured into the same size plastic mist bottles with adjustable
mist nozzle. Each spray dispensed approximately 5 mL of the solutions. 27 g (serving
size) of Wheaties® flakes were placed on five 900-cm2 stainless steel mesh trays and
sprayed with 5 mL of each solution on one side of each tray at room temperature
following with a drying step of 60°C for 1h in a vacuum oven (Vacuum of 0.08 MPa,
Jeio Tech Co., Billerica, MA, US). Then, the trays with the flakes were taken out from
the oven and twist another side of each tray to apply second spray, again following with
drying process. After six spray applications (3 sprays on one side and 3 sprays on another
side of each tray) were completed, the trays were placed in a vacuum oven at 60°C for
approximately 20h to achieve the complete drying of coatings in Figure 17. Dried coated
breakfast cereals were weighed to calculate the amount of changes as a weight resulting
in approximately 3 g changes for 27 g (~30 g total) flakes.
Figure 17: The appearance of sample preparation processing: (1) uncoated Wheaties®, (2) the solution sprayed on flakes, and (3) appearance of flakes after drying at 60°C for 20h.

59
3.1.6. Analysis of Edible Coating on Breakfast Cereals
3.1.6.1. Protein Analysis
The protein content was determined based on measuring the nitrogen percentage
via EA1112 Nitrogen/Protein Analyzer according to the method of AOAC 46-30
(American Ass. of Official Analytical Chemists 1990).
The cereals treated with the solutions were ground using a mortar and pestle to
have suitable fineness resulting in achieving precision, and the fraction that passed
through a 1.4- mm screen was collected and used for the analysis. Each sample was
weighed approximately 20 mg into the tin capsule and squeezing it to prevent any sample
leakages without damaging to the capsule surrounded to the samples. Aspartic acid was
used as a calibration protein. Each sample analyzed in triplicate, and the average was
counted as nitrogen percentage. To calculate the percentage of crude protein, the protein
contents of treated breakfast cereals were calculated based on 6.2 of protein factor for
mix food products (Jones 1931; Mosse, 1990).
𝐶𝑟𝑢𝑑𝑒 𝑝𝑟𝑜𝑡𝑒𝑖𝑛,% = %𝑁 ∗ 𝑝𝑟𝑜𝑡𝑒𝑖𝑛 𝑓𝑎𝑐𝑡𝑜𝑟
%N is the nitrogen percentage of sample
3.1.6.2. Milk Absorption Analysis
Milk absorption was measured using a modified method of Luckett and Wang
(2012). Approximately 4 g of breakfast cereal (Wheaties ®) was placed in 30 mL of 1%
reduced fat milk at 8°C for each minute up to 5 min. The samples were drained on a

60
2.8-mm stainless steel mesh screen for 10 sec to remove excessive milk on the flakes, and
weighed, shown in Figure 18.
Figure 18: Processing of milk absorption test: (1) 4 g Wheaties ®, (2) pouring 30 mL milk at 8°C for various minutes, and (3) draining the samples on a 2.8-mm stainless steel mesh screen for 10s.
The percent of the milk absorption was calculated by taken percentage of dividing
the difference of original flakes and drained flakes with the original flakes weight.
%𝑀𝑖𝑙𝑘 𝐴𝑏𝑠𝑜𝑟𝑝𝑡𝑖𝑜𝑛 =𝑊! −𝑊!
𝑊!∗ 100
Where W1 is the drained weight and W0 is the original flakes weight (serving size 27 g).
3.1.6.3. Surface Morphology
The appearance of treated cereals was photographed using a Canon digital camera
(12X Canon Inc., USA) on a light gray cloth background. The surface morphology of
flakes with different solution coated was observed using Scanning Electron Microscope,
FEI Quanta 200 F (Hillsboro, OR, US). The samples were mounted on stubs and sputter
gold coated 80 s x 2. They were observed with Scanning Electron Microscope, with an
accelerating voltage of 10 KV in high vacuum mode.
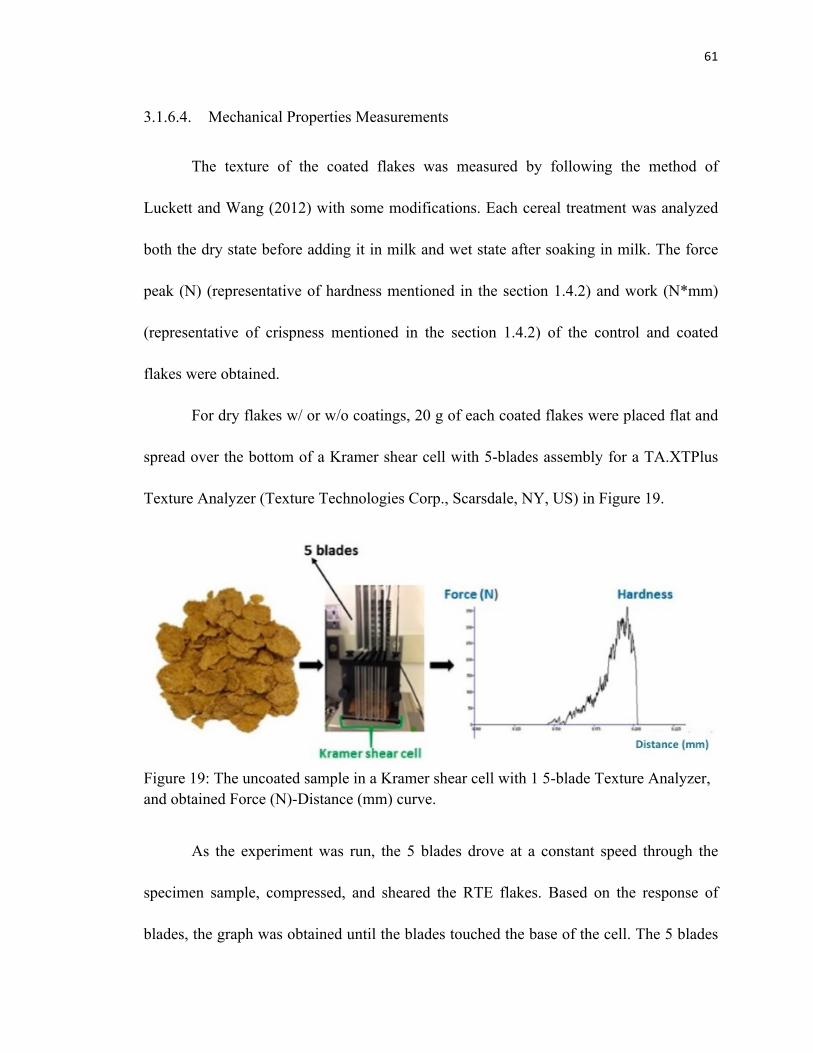
61
3.1.6.4. Mechanical Properties Measurements
The texture of the coated flakes was measured by following the method of
Luckett and Wang (2012) with some modifications. Each cereal treatment was analyzed
both the dry state before adding it in milk and wet state after soaking in milk. The force
peak (N) (representative of hardness mentioned in the section 1.4.2) and work (N*mm)
(representative of crispness mentioned in the section 1.4.2) of the control and coated
flakes were obtained.
For dry flakes w/ or w/o coatings, 20 g of each coated flakes were placed flat and
spread over the bottom of a Kramer shear cell with 5-blades assembly for a TA.XTPlus
Texture Analyzer (Texture Technologies Corp., Scarsdale, NY, US) in Figure 19.
Figure 19: The uncoated sample in a Kramer shear cell with 1 5-blade Texture Analyzer, and obtained Force (N)-Distance (mm) curve.
As the experiment was run, the 5 blades drove at a constant speed through the
specimen sample, compressed, and sheared the RTE flakes. Based on the response of
blades, the graph was obtained until the blades touched the base of the cell. The 5 blades

62
provided a data on several positions at the same time.
For the flakes soaked in milk, 20 g of each breakfast flake sample was placed in
150 mL of 1% reduced fat at 8°C for 3 min. The flakes were removed from milk and
drained for 5 sec followed by placing them on paper towels to eliminate excessive milk
on the flakes with 10 sec in Figure 20. It applied for both side of the flakes by turning the
one side to another side of flakes with 5 sec for each side.
Figure 20: Preparation of the flakes placed in milk (at 8°C for 3 min) and drained to measure the mechanical properties.
Afterward, the sample was placed flat and spread over the bottom of the cell. The
texture analysis of both the dry flakes and the flakes soaked in milk analysis was carried
out by the following conditions: a pre-test speed of 5mm/s, a test-speed of 10mm/s, a
post-test speed of 5 mm/s, and a distance of 120mm/s.
3.1.6.5. Statistical Analysis
Differences among protein analysis, milk gain, and Hardness and Crispness of the
coated flakes based on the various coatings were evaluated by analysis of variance with
means separation (One-way ANOVA), and the means were compared with T-test,
performed by using SPSS Version 21 (IBM Corp., London, UK) (provided by The State
63
University of New Jersey, Rutgers Software System).
3.2. Results and Discussion
Preliminary Results:
The spraying method was used to provide a thin and uniform coating layer on the
RTE breakfast cereals. Andrade et al. (2012) reported that coating methods were an
important parameter for forming a thin and uniform coating layer on the cereals.
In this study, the coating treatments increased the weight of the RTE cereal flakes. The
total amount of each coating solution applied was 30 mL (15% total solid content) for
27g of the cereals, and the weight of the coated flakes increased approximately 10% over
the pre-coated weight.
3.2.1. Protein Content
Figures 21 and 22 represent the increase of protein content (g) of the breakfast
flakes provided by the coatings.
The uncoated and glucose coated flakes were considered to contain approximately
2g protein per serving size, which is 27g. CaCas, CaCas/Gly, CaCas/Gly/CP, and
CaCas/CP coatings provided 3.91, 3.33, 2.59, and 3.19g increase in the protein content
for the coated flakes, respectively, compared to the uncoated and glucose coated flakes as
shown in Figure 21. Due to the increase of the weight of the breakfast cereals by the
coatings, the mass fraction of protein in each coated flakes changed. Therefore,

64
CaCas/Gly, CaCas/Gly/CP, and CaCas/CP coatings provided a little less protein amount
than the CaCas coating even though the 15% of the protein concentration in each solution
was kept the same.
Figure 21: Amount of protein added in cereal flakes with five different solutions and uncoated. All solutions have a 15% (w/w) total protein concentration.
Another application that we examined was the blends of CaCas and NFDM
solutions with different ratios (at the same 15% total solid concentration) coated on RTE
cereals. The blends did not provide much protein content shown in Figure 22. Among the
blends, the higher ratio of CaCas to NFDM in the coating solutions, the coating provided
a higher protein due to the high protein content of CaCas. CaCas and NFDM contained
approximately 88 and 36% of protein, which was determined in the section 3.1.3.2.
0
0.5
1
1.5
2
2.5
3
3.5
4
4.5
5
Uncoated Glu CaCas CaCas/Gly CaCas/Gly/CP CaCas/CP
Amou
nt of P
rotein add
ed by coa5
ng
(g)/ Serving size 27g
Coa5ng Solu5ons
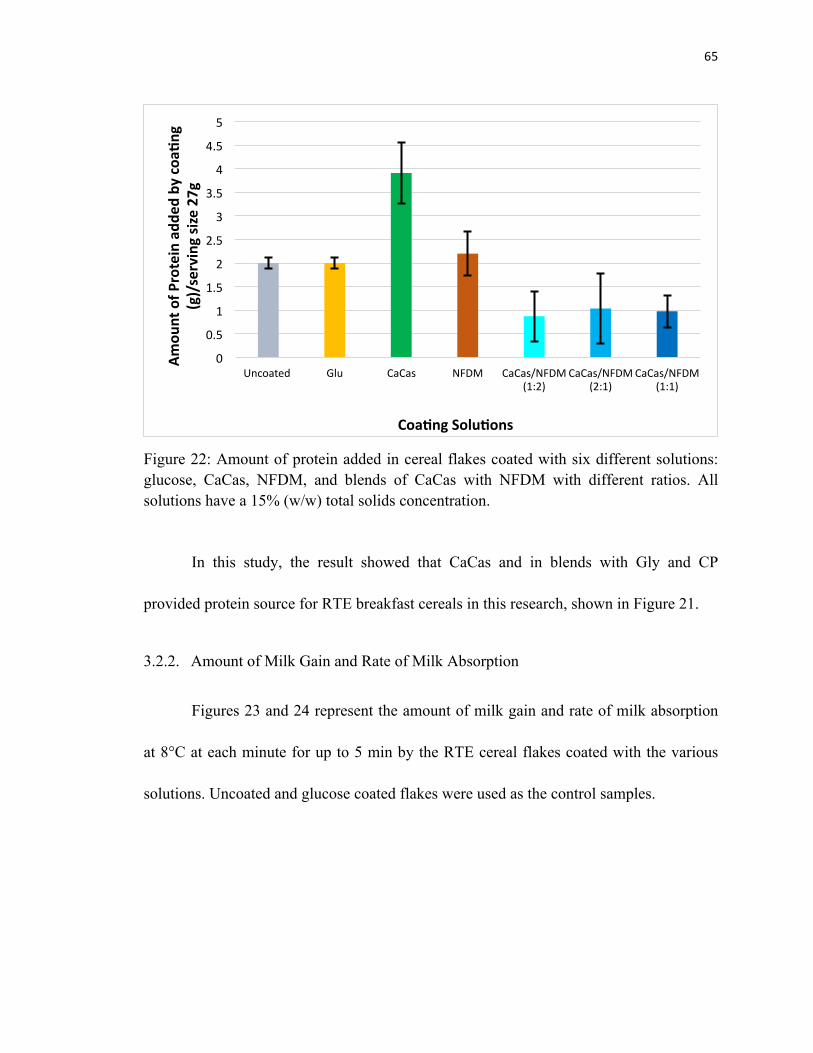
65
Figure 22: Amount of protein added in cereal flakes coated with six different solutions: glucose, CaCas, NFDM, and blends of CaCas with NFDM with different ratios. All solutions have a 15% (w/w) total solids concentration.
In this study, the result showed that CaCas and in blends with Gly and CP
provided protein source for RTE breakfast cereals in this research, shown in Figure 21.
3.2.2. Amount of Milk Gain and Rate of Milk Absorption
Figures 23 and 24 represent the amount of milk gain and rate of milk absorption
at 8°C at each minute for up to 5 min by the RTE cereal flakes coated with the various
solutions. Uncoated and glucose coated flakes were used as the control samples.
0
0.5
1
1.5
2
2.5
3
3.5
4
4.5
5
Uncoated Glu CaCas NFDM CaCas/NFDM (1:2)
CaCas/NFDM (2:1)
CaCas/NFDM (1:1)
Amou
nt of P
rotein add
ed by coa5
ng
(g)/serving size 27g
Coa5ng Solu5ons

66
Figure 23: Weight gain of coated cereal during milk absorption of coated samples after soaking in milk for up to 5 min at 8°C (p<0.05).
All coating treatments significantly lowered the rate of milk absorption and
reduced correlated the milk gain of the coated flakes (p<0.05). After 5 min, the uncoated
flakes, and glucose, CaCas, CaCas/Gly, CaCas/Gly/CP, and CaCas/CP coated flakes
gained milk showed the by about, 129, 113, 71, 96, 77, and 77%, respectively. The
results were equal to the 5.23, 4.58, 2.86, 3.84, 3.04, and 3.11 g of milk gain for 5 min in
milk, respectively.
Glucose, CaCas, CaCas/Gly, CaCas/Gly/CP, and CaCas/CP coatings lowered the
total amount of milk absorption compared to the uncoated flakes by 12, 45, 26, 41, and
41% in 5 min, respectively in Figure 23. Referring to the results of section 2.2.1.2 above,
a small amount of CP (0.3%) loosely interacts with CaCas, Gly, and water molecules in
y = 9.6079x + 76.429 R² = 0.94
y = 9.2508x + 63.022 R² = 0.9563
y = 6.342x + 42.718 R² = 0.9124
y = 8.3725x + 50.261 R² = 0.8965
y = 10.621x + 22.601 R² = 0.9744
y = 6.3199x + 46.38 R² = 0.9564
0
10
20
30
40
50
60
70
80
90
100
110
120
130
140
150
0 1 2 3 4 5 6
Absorbe
d Milk (%)
Time (min)
Uncoated
Glucose
CaCas
CaCas/Gly
CaCas/Gly/CP
CaCas/CP
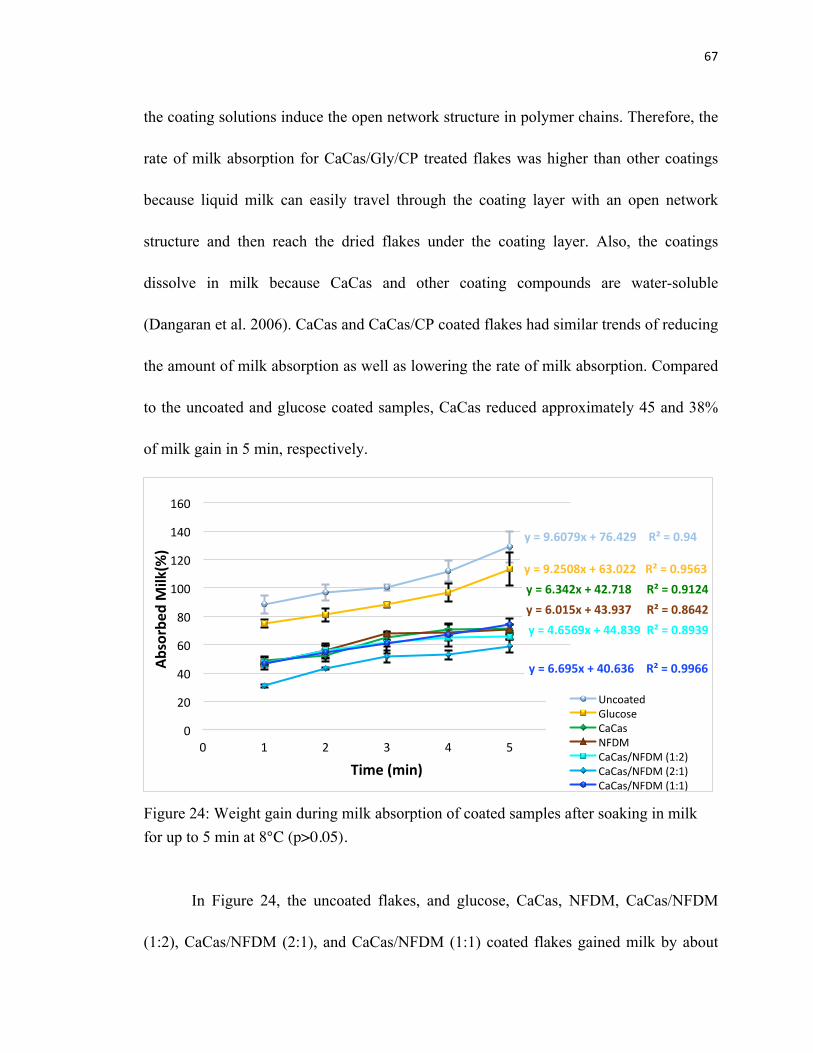
67
the coating solutions induce the open network structure in polymer chains. Therefore, the
rate of milk absorption for CaCas/Gly/CP treated flakes was higher than other coatings
because liquid milk can easily travel through the coating layer with an open network
structure and then reach the dried flakes under the coating layer. Also, the coatings
dissolve in milk because CaCas and other coating compounds are water-soluble
(Dangaran et al. 2006). CaCas and CaCas/CP coated flakes had similar trends of reducing
the amount of milk absorption as well as lowering the rate of milk absorption. Compared
to the uncoated and glucose coated samples, CaCas reduced approximately 45 and 38%
of milk gain in 5 min, respectively.
Figure 24: Weight gain during milk absorption of coated samples after soaking in milk for up to 5 min at 8°C (p>0.05).
In Figure 24, the uncoated flakes, and glucose, CaCas, NFDM, CaCas/NFDM
(1:2), CaCas/NFDM (2:1), and CaCas/NFDM (1:1) coated flakes gained milk by about
y = 9.6079x + 76.429 R² = 0.94
y = 9.2508x + 63.022 R² = 0.9563
y = 6.342x + 42.718 R² = 0.9124
y = 6.015x + 43.937 R² = 0.8642
y = 4.6569x + 44.839 R² = 0.8939
y = 6.5875x + 27.811 R² = 0.9193 y = 6.695x + 40.636 R² = 0.9966
0
20
40
60
80
100
120
140
160
0 1 2 3 4 5 6
Absorbe
d Milk(%
)
Time (min)
Uncoated Glucose CaCas NFDM CaCas/NFDM (1:2) CaCas/NFDM (2:1) CaCas/NFDM (1:1)

68
129, 112, 71, 70, 65, 59, and 74% respectively, which were equal to 5.23, 4.58, 2.86,
2.81, 2.64, 2.39, and 2.98 g of milk gain in 5 min. The flakes coated with CaCas, NFDM,
and the blends of CaCas/NFDM with 1:2, 2:1, and 1:1 ratios significantly reduced the
milk absorption of the flakes, which was approximately 50 and 40% reductions of milk
gain than uncoated and glucose coated flakes, respectively (p<0.05).
The results of the reduction and lowering the milk absorption of the coatings
showed that CaCas coating and in blends with Gly and CP had an ability to retain the
texture of the flakes in milk that extended the bowl life of RTE breakfast cereals. The less
milk gained by the flakes slowed the loss of the flake texture. NFDM and the blends of
CaCas and NFDM coatings did not significantly change the hard and crispy texture of the
coated cereals in milk (p>0.05) and thus CaCas, CaCas/Gly, and CaCas/CP may be
beneficial due to the higher protein content of CaCas than NFDM.
Our results showed that the coatings made from milk ingredients would be capable of
substitutes for sugar-based coatings on the breakfast cereals to enhance nutritional value
and texture properties, and extend the bowl-life of the cereals. Also, the coatings
probably protect the coated flakes from gaining moisture from the environment for
opened packages.
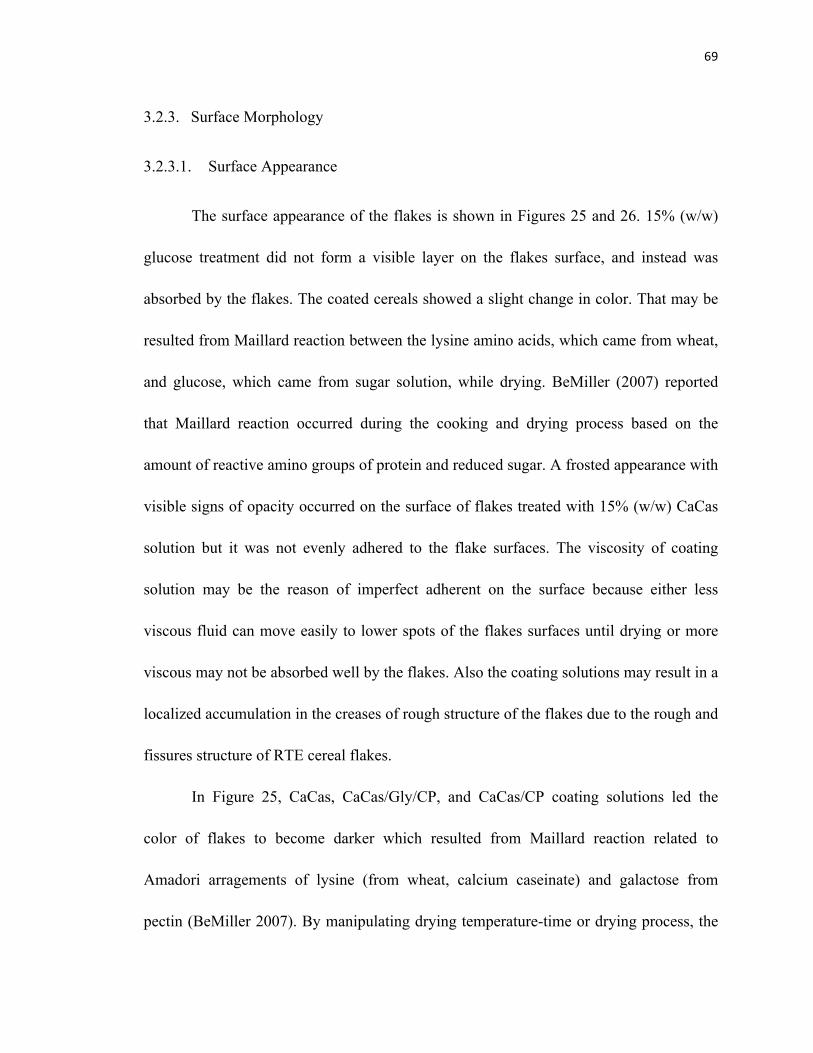
69
3.2.3. Surface Morphology
3.2.3.1. Surface Appearance
The surface appearance of the flakes is shown in Figures 25 and 26. 15% (w/w)
glucose treatment did not form a visible layer on the flakes surface, and instead was
absorbed by the flakes. The coated cereals showed a slight change in color. That may be
resulted from Maillard reaction between the lysine amino acids, which came from wheat,
and glucose, which came from sugar solution, while drying. BeMiller (2007) reported
that Maillard reaction occurred during the cooking and drying process based on the
amount of reactive amino groups of protein and reduced sugar. A frosted appearance with
visible signs of opacity occurred on the surface of flakes treated with 15% (w/w) CaCas
solution but it was not evenly adhered to the flake surfaces. The viscosity of coating
solution may be the reason of imperfect adherent on the surface because either less
viscous fluid can move easily to lower spots of the flakes surfaces until drying or more
viscous may not be absorbed well by the flakes. Also the coating solutions may result in a
localized accumulation in the creases of rough structure of the flakes due to the rough and
fissures structure of RTE cereal flakes.
In Figure 25, CaCas, CaCas/Gly/CP, and CaCas/CP coating solutions led the
color of flakes to become darker which resulted from Maillard reaction related to
Amadori arragements of lysine (from wheat, calcium caseinate) and galactose from
pectin (BeMiller 2007). By manipulating drying temperature-time or drying process, the

70
desired brown color would be achieved for the RTE flakes. Therefore, the addition of
other ingredients may not be required to enhance the color of the flakes in the production
of the RTE breakfast cereals (Caldwell and Fast 2000).
Figure 25: Surface appearance of the uncoated flakes and the dried flakes treated with glucose, CaCas, CaCas/Gly, CaCas/Gly/CP, and CaCas/CP solutions.
The blends of CaCas and NFDM with different ratios demonstrated a much darker
color on the flakes (shown in Figure 26) than the flakes coated with CaCas and along
with Gly and CP coatings in Figure 25. Due to the higher lactose content of NFDM,
which is approximately 85% lactose in dry weight (Baer et al. 1983), lactosylysine
products are probably formed via Maillard reactions because lysine amino acids from
wheat flakes and CaCas react with highly reactive lactose (reduce sugar) from NFDM
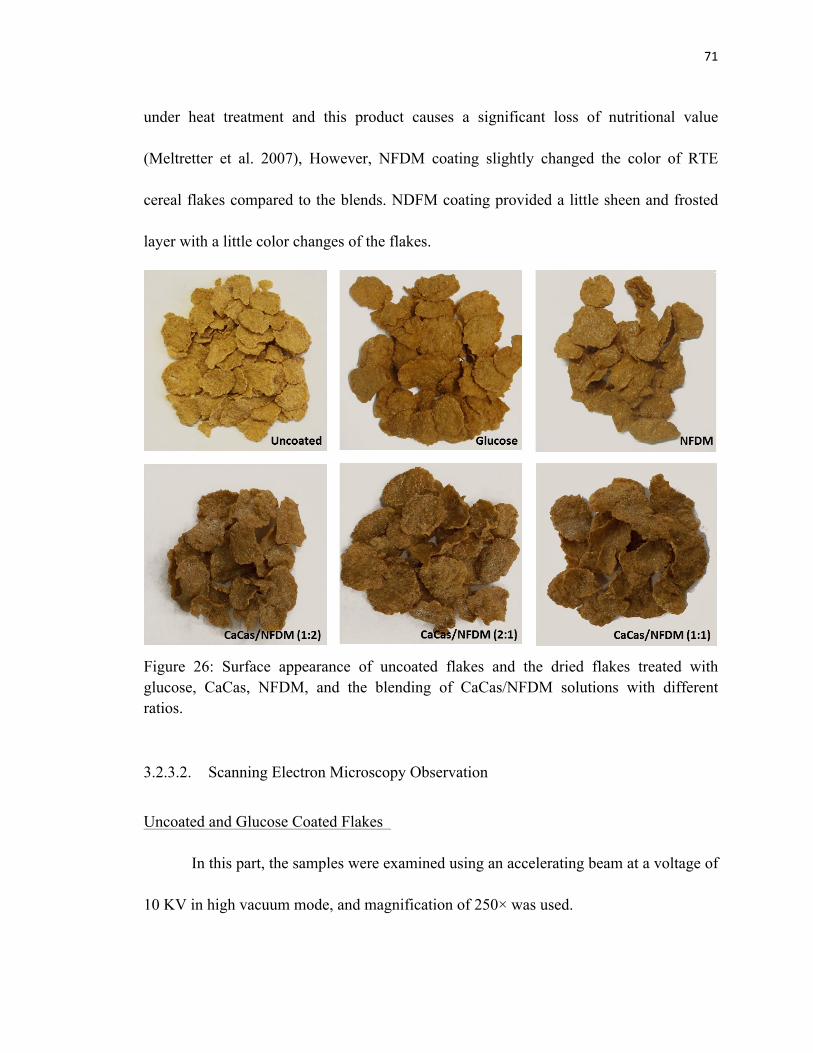
71
under heat treatment and this product causes a significant loss of nutritional value
(Meltretter et al. 2007), However, NFDM coating slightly changed the color of RTE
cereal flakes compared to the blends. NDFM coating provided a little sheen and frosted
layer with a little color changes of the flakes.
Figure 26: Surface appearance of uncoated flakes and the dried flakes treated with glucose, CaCas, NFDM, and the blending of CaCas/NFDM solutions with different ratios.
3.2.3.2. Scanning Electron Microscopy Observation
Uncoated and Glucose Coated Flakes
In this part, the samples were examined using an accelerating beam at a voltage of
10 KV in high vacuum mode, and magnification of 250× was used.
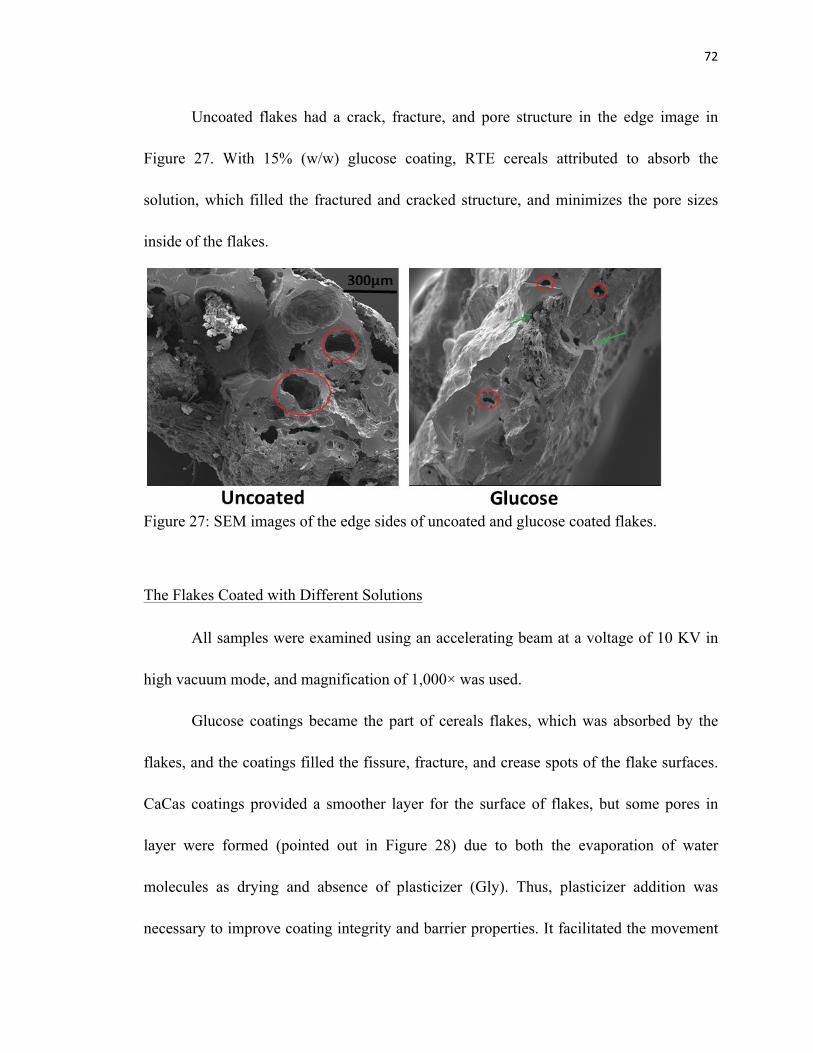
72
Uncoated flakes had a crack, fracture, and pore structure in the edge image in
Figure 27. With 15% (w/w) glucose coating, RTE cereals attributed to absorb the
solution, which filled the fractured and cracked structure, and minimizes the pore sizes
inside of the flakes.
Figure 27: SEM images of the edge sides of uncoated and glucose coated flakes.
The Flakes Coated with Different Solutions
All samples were examined using an accelerating beam at a voltage of 10 KV in
high vacuum mode, and magnification of 1,000× was used.
Glucose coatings became the part of cereals flakes, which was absorbed by the
flakes, and the coatings filled the fissure, fracture, and crease spots of the flake surfaces.
CaCas coatings provided a smoother layer for the surface of flakes, but some pores in
layer were formed (pointed out in Figure 28) due to both the evaporation of water
molecules as drying and absence of plasticizer (Gly). Thus, plasticizer addition was
necessary to improve coating integrity and barrier properties. It facilitated the movement
73
of polymer chains in the protein network by inserting itself between the protein-protein
interactions and water molecules (Chen 2002). Beyond these pores, CaCas provided a
smooth and uniform layer to the surface of the cereal flakes, which built a protective
layer on the surface of the cereals. The results are in agreement with the results of milk
absorption and textural properties because the coating layer reduced the transfer of milk
during consumption and inhibited the transfer of moisture during storage after opening
the package of RTE breakfast cereals, which maintain a harder and crispier textures of
the RTE flakes. Gly and CP additions provided the coating solutions to induce the
coating integrity by crosslinking and interacting with Ca+2. Since, the amino acids chains
of casein in the solution, and all new configurations in the molecular structure had a
positive impact on the coating integrity. Therefore, a uniform CaCas with Gly and CP
coating of breakfast cereals would provide structural integrity that protect the product
from any physical damages during handling, distribution, storage, and marketing.

74
Figure 28: Scanning electron microscopy (SEM) images of uncoated flakes and the flakes coated with glucose, CaCas, CaCas/Gly, CaCas/Gly/CP, and CaCas/CP solutions.
NFDM treatment showed a uniform coating, but the layer fractured itself during
the drying process in Figure 29.
Flakes coated with the blends of CaCas and NFDM solutions followed a different
trend compared to the treatments above. Coating integrity and layer appearance of the
flakes coated with the blends was neither smooth nor uniform. The reason might be the
differences in the molecular structure of CaCas and NFDM. Due to the random coil
structure of caseinates, and the casein content of NFDM in a solution, they interfered
their stabilities in the solutions by disturbing the molecular interaction of each other. The
blends formed some pores, fractured and rough surfaces, which led the treated flakes to

75
become susceptible to the moisture or milk, and then loose the desired hard and crispy
texture of the flakes.
Figure 29: SEM images of uncoated flakes and the flakes coated with glucose, CaCas, NFDM, and the blending of CaCas and NFDM solutions with different ratios.
Besides the coatings, the outer surface of RTE flakes with fissures, fractures, and
creases may cause the flaws of the coatings. That would lead the flakes to be exposed by
moisture or milk easily, and then it would lose its desired crispy texture in a bowl or an
opened package.
76
3.2.4. Mechanical Properties
3.2.4.1. Hardness
Dry state and wet state of the flakes soaking in milk
The results obtained based on the dry state (dried flakes) and wet state of the RTE
flakes (the flakes soaking in milk). In the dry state, all cereal coatings in Figure 30
provided harder texture to the RTE cereal flakes compared to the uncoated flakes.
The CaCas and in blends with Gly and CP coatings provided a harder texture to
the flakes compared to both the uncoated and glucose coated flakes. The CaCas/CP
coating increased the Hardness of the dried flakes by 58% (422.1 N) compared to the
Hardness of the uncoated flakes, which was 265.9 N. It was followed by the CaCas/Gly,
CaCas, CaCas/Gly/CP, and glucose coatings, which increase the Hardness of the flakes
by about, 108.6, 62.8, 46.0, and 24.8 N, respectively. The coatings with CaCas/CP,
CaCas/Gly, CaCas, and CaCas/Gly/CP provided an increase in Hardness of the cereal
flakes by 131.3, 83.8, 38.0, and 21.1 N, respectively, compared to the Hardness of the
flakes coated with glucose solution, which is 290.8 N. The flakes coated with CaCas/CP
solution are the hardest flakes (Figure 30) because CaCas and CP can form crosslinks that
become closer as water evaporates during drying of the film due to their polar and
nonpolar chains (Chen 2002; Bonnaillie et al. 2014).
By soaking in milk for 3 min, both the uncoated and glucose coated flakes lost
their Hardness by about, 40 and 20%, respectively. Uncoated flakes lost approximately

77
half their Hardness in 3 min due to the fissures, fractures, and pore structure of the wheat
flakes as mentioned in the section 3.2.3.2 above. The glucose coating maintained the
crunchy texture of the flakes than the uncoated ones, but glucose can easily dissolve in
water or milk that triggers a loss of RTE cereal texture in a short time.
Figure 30: Peak force (hardness) of the flakes treated with the various solutions before (dry state) and after soaking in milk (wet state) at 8°C for 3 min. Colored bars represent the dried flakes; grey bars represent the wet state.
The Hardness of the cereal flakes coated with CaCas, CaCas/Gly, CaCas/Gly/CP,
and CaCas/CP solutions was negatively correlated with milk absorption after soaking in
milk, shown in Figure 30. The outer surface of the protein-coating layer swelled with
milk, decreasing the glass transition temperature of the coated RTE flakes and then the
layer dissolved in milk that caused a loss in the “crunch sound” associated with the cereal
when fractured. Luckett and Wang (2012) reported that absorbing milk affected the
texture of RTE cereals that causes the loss of brittleness, texture, and crunchy sounds.
0
100
200
300
400
500
600
700
Uncoated Glucose CaCas CaCas/Gly CaCas/Gly/CP CaCas/CP
Hardn
ess (M
ax Force N)
Treated Flakes (Dry & Soaked)

78
Breakfast cereal products are brittle and generate a loud and high crunchy noise when
force applied because they are crispy and crunchy products due to their low density
cellular and porous structure (Roudaut et al. 1998).
Figure 31: Hardness of flakes treated with different coating solutions before and after soaking in milk at 8°C for 3 min. Colored bars represent the dry state of flakes; grey bars represent the wet state of flakes.
NFDM and the blends of CaCas and NFDM coatings showed a decrease in the
peak force in the dried flakes compared to both uncoated and glucose coated cereals in
Figure 31. NFDM absorbs moisture from the environment that results in the treated flakes
become more bendable and soft because it has a hygroscopic nature, which increases the
water content of the dried flakes.
0
100
200
300
400
500
600
Hardn
ess ( M
ax Force N)
Treated Flakes (Dry & Soaked in milk)
79
In Figure 31, the texture of the treated cereals retained their Hardness after
soaking in milk, which was unexpected. It showed that a delay in the milk absorption
occurred in the core of flakes due to the coating layer, which became sticky and rubbery
in milk before dissolving. Therefore, more force was required to crush the flakes.
3.2.4.2. Crispness
Dry state and wet state of the flakes soaking in milk
The work on the flakes (represents as crispness) mentioned in section 1.4.2, which
is the area under the curve of force and displacement, was analyzed for each coating both
for the dry state and wet state of the flakes in 1% reduced fat milk at 8 °C for 3 min.
The flakes coated with CaCas and along with Gly and CP showed a higher
Crispness compared to the uncoated and glucose coated cereals. The dried flakes coated
with CaCas/Gly/CP provided the highest crispness, which is 2714 N.mm, and it is three
times crispier than the uncoated and twice as crispier than the glucose coating, shown in
Figure 32. It followed by CaCas/CP, CaCas/Gly, CaCas, and glucose treatments: by
about, 2540, 1828, 1657, and 1265 N.mm, respectively, compared to the uncoated flakes,
which is 881 N.mm. CaCas/CP, CaCas/Gly, and CaCas increased in Crispness of the
flakes, 101, 44, and 30%, respectively compared to the glucose coating. As mentioned
previously, the differences in molecular structure of the coating compounds affected the
integrity of the coating and structural integrity of the flakes. The coating layers favor the
flakes to have a crispier texture.
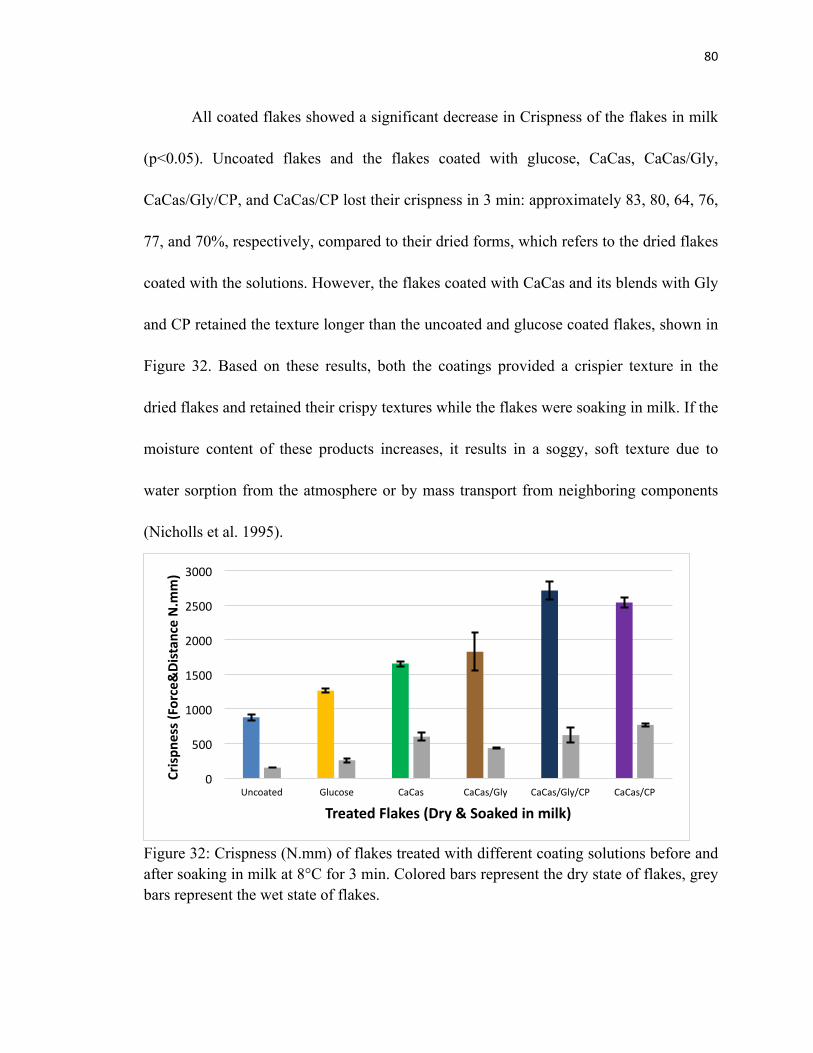
80
All coated flakes showed a significant decrease in Crispness of the flakes in milk
(p<0.05). Uncoated flakes and the flakes coated with glucose, CaCas, CaCas/Gly,
CaCas/Gly/CP, and CaCas/CP lost their crispness in 3 min: approximately 83, 80, 64, 76,
77, and 70%, respectively, compared to their dried forms, which refers to the dried flakes
coated with the solutions. However, the flakes coated with CaCas and its blends with Gly
and CP retained the texture longer than the uncoated and glucose coated flakes, shown in
Figure 32. Based on these results, both the coatings provided a crispier texture in the
dried flakes and retained their crispy textures while the flakes were soaking in milk. If the
moisture content of these products increases, it results in a soggy, soft texture due to
water sorption from the atmosphere or by mass transport from neighboring components
(Nicholls et al. 1995).
Figure 32: Crispness (N.mm) of flakes treated with different coating solutions before and after soaking in milk at 8°C for 3 min. Colored bars represent the dry state of flakes, grey bars represent the wet state of flakes.
0
500
1000
1500
2000
2500
3000
Uncoated Glucose CaCas CaCas/Gly CaCas/Gly/CP CaCas/CP
Crispn
ess (Force&Distance N.m
m)
Treated Flakes (Dry & Soaked in milk)
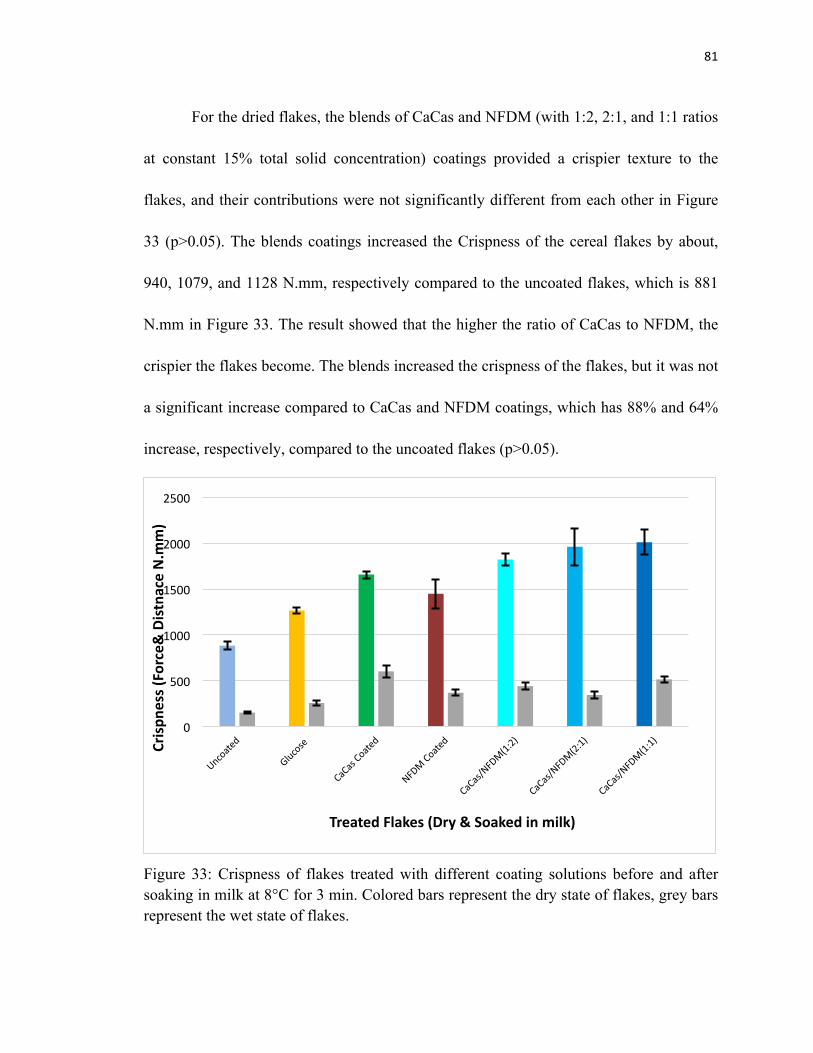
81
For the dried flakes, the blends of CaCas and NFDM (with 1:2, 2:1, and 1:1 ratios
at constant 15% total solid concentration) coatings provided a crispier texture to the
flakes, and their contributions were not significantly different from each other in Figure
33 (p>0.05). The blends coatings increased the Crispness of the cereal flakes by about,
940, 1079, and 1128 N.mm, respectively compared to the uncoated flakes, which is 881
N.mm in Figure 33. The result showed that the higher the ratio of CaCas to NFDM, the
crispier the flakes become. The blends increased the crispness of the flakes, but it was not
a significant increase compared to CaCas and NFDM coatings, which has 88% and 64%
increase, respectively, compared to the uncoated flakes (p>0.05).
Figure 33: Crispness of flakes treated with different coating solutions before and after soaking in milk at 8°C for 3 min. Colored bars represent the dry state of flakes, grey bars represent the wet state of flakes.
0
500
1000
1500
2000
2500
Crispn
ess (Force& Distnace N.m
m)
Treated Flakes (Dry & Soaked in milk)

82
All coated flakes showed a significant decrease in Crispness in milk (p<0.05)
compared to their dried forms in Figure 33. The uncoated flakes and the ones coated with
glucose, CaCas, NFDM, CaCas/NFDM (1:2), CaCas/NFDM (2:1), CaCas/NFDM (1:1)
solutions lost most of their crispy texture in milk for 3 min: approximately 83, 80, 64, 75,
76, 83 and 74%, respectively.
Based on all results in the section 3.1, CaCas and in blends with Gly and CP
provided a higher protein content, increased bowl-life by reducing the amount of milk
absorption, and providing the structural integrity of the flakes that resulted from a harder
and crispier texture of coated flakes. However, the blends of CaCas and NFDM did not
show constant and correlated values, form a uniform and smooth coating layer, and
provide a higher protein content compared to CaCas and in blends with Gly, CP.
3.3. Summary
The coating treatments increased the weight of the RTE breakfast cereals. The
total amount of each coating solution applied was 30 mL (15% total solid content) for 27
g of Wheaties® breakfast cereals, and the final coated flakes increased approximately
10% over the pre-coated weight.
The CaCas and in blends with Gly and CP coatings provided an increase in
protein content of RTE flakes because CaCas contains approximately 88% protein (Chen
2002). CaCas, CaCas/Gly, CaCas/Gly/CP, and CaCas/CP provided 3.91, 3.33, 2.59, and
3.19 g increase in protein content of the cereals, respectively, compared to the uncoated
83
and glucose coated cereal flakes, which contained already 2 g. However, the blends of
CaCas and NFDM with different ratios did not provide a much increase in the protein
content for the flakes.
All coating treatments lowered the rate of milk absorption and reduced the
amount of milk gain. The uncoated flakes and the flakes coated with glucose, CaCas,
CaCas/Gly, CaCas/Gly/CP, and CaCas/CP solutions gained milk by about, 129, 113, 71,
96, 77, and 77%, respectively, after 5 min in 1% reduced fat milk at 8°C. Glucose,
CaCas, CaCas/Gly, CaCas/Gly/CP, and CaCas/CP coatings lowered the amount of milk
absorption compared to the uncoated flakes by 12, 45, 26, 41, and 41%, respectively.
NFDM and the blends coatings had the similar results of milk absorption, which were 70,
65, 59, and 74%, respectively (p>0.05).
The CaCas, CaCas/Gly, CaCas/Gly/CP, and CaCas/CP coatings showed a visible
coating layer with sheen, frosted, less opaque appearance on the surface of the flakes.
Also, the coatings darkened the color of the flakes. The CaCas, CaCas/Gly/CP,
CaCas/CP, NFDM coating solutions led the color of flakes to become darker because
Maillard reaction occurred between amino acids of CaCas or NFDM and reduced sugar
(lactose) with heat. This may help enhance the desired brown color for flakes without
adding other color enhancer in the formulation of RTE breakfast cereal production.
However, the blends of CaCas and NFDM demonstrated a much darker color flakes. The
reason would be the higher lactose content of NFDM, which is approximately 85%

84
lactose in dry weight (Baer et al. 1983) because lactose favors the Maillard reactions to
occur (BeMiller 2007).
Uncoated flakes had a crack, fracture, and pore structure in the edge, and rough,
fissure structure on the surface. Glucose coatings became the part of cereals flakes, and
the glucose solution was absorbed by the flakes, and then filled the fissure, fracture, and
crease spots on the surface of the flakes. CaCas coatings provided a smoother layer to the
surface of flakes, but some pores in the layer were formed, whereas CaCas along with
Gly and CP solutions provided to induce the coating integrity. NFDM treatment showed a
uniform coating, but the layer fractured itself during the drying process resulting from the
lack of adhesive property. The blends of CaCas/NFDM coatings formed some pores,
fractured and rough surface. The coating integrity and layer appearance of the blends
coated flakes were neither smooth, nor uniform.
For the dry state, all cereal treatments (except NFDM and CaCas along with
NFDM with 1:2, 2:1, 1:1 ratios at 15% total solid concentration) provided a harder
texture to the flakes compared to the uncoated flakes. CaCas/CP coating produced the
hardest dry flakes with 58% increase. CaCas/Gly, CaCas, CaCas/Gly/CP, and glucose
coatings increased the Hardness of the flakes by about, 41, 24, 17, and 9%, respectively,
compared to the uncoated flakes. Compared to the glucose coating, CaCas/CP,
CaCas/Gly, CaCas, and CaCas/Gly/CP coatings increased the Hardness of the flakes by
45, 29, 13, and 7%, respectively. NFDM and the blends showed a decrease in the
Hardness of the dried flakes compared to both the uncoated and glucose coated cereals.
85
The uncoated flakes and the flakes coated with the solutions lost their Hardness by
soaking in 1% reduced fat milk in 3 min at 8°C. The uncoated flakes lost its Hardness by
40%, and glucose coated flakes lost it by about 20%. The Hardness of the flakes coated
with CaCas, CaCas/Gly, CaCas/Gly/CP, and CaCas/CP soaking in milk was negatively
correlated with the milk absorption because the outer surface of protein-coating layer
swelled with milk, creating a sticky/rubbery outer surface, and caused a loss in crunch
sounds around the cereals, which required more force to crush the flakes. This negative
correlation showed that the milk retention was delayed in the core of flakes due to the
coating layer.
All cereal treatments favored the coated flakes to become crispier than both
uncoated and glucose coated flakes. Among dried flakes, CaCas/Gly/CP provided the
highest crispness, which was three times crispier than uncoated and twice than glucose
coating. CaCas/CP, CaCas/Gly, CaCas, and glucose treatments followed the
CaCas/Gly/CP with 188, 107, 88, and 43% increase, respectively compared to uncoated
flakes. CaCas/CP, CaCas/Gly, and CaCas increased the Crispness of flakes; 101, 44, and
30%, respectively compared to glucose coating. The blends with 1:2, 2:1, and 1:1 ratios
of CaCas/NFDM coatings provided a 107, 122, and 128% increase in Crispness,
respectively compared to uncoated flakes. All coated flakes showed a decrease in their
crispness in milk. Uncoated, glucose, CaCas, CaCas/Gly, CaCas/Gly/CP, and CaCas/CP
treatments lost their crispness in 3 min: approximately 83, 80, 64, 76, 77, and 70%,
respectively, compared to the dried flakes coated with these solutions. NFDM and the

86
blends coatings lost most of their crispy texture in milk for 3 min: approximately 83, 80,
64, 75, 76, 83 and 74%, respectively compared to the dried flakes treated with these
coatings.

87
CONCLUSION
The tensile properties of edible CaCas/Gly films were affected by film thickness,
relative humidity (RH), and CP content. CP provided a new molecular configuration
through the crosslinks that changed the molecular structure of the film matrix, and
affected either positively or adversely the tensile properties of the edible films. Therefore,
this study requires more studies to understand and evaluate the efficacy of compositions
and environmental changes (RH) of the edible CaCas/Gly films.
Dairy protein-based coatings, based on results, would be a capable substitute of
sugar coatings of RTE breakfast cereals to provide an increased protein source, longer
bowl life in milk, and crispier textures by forming a uniform, sheen, and protective
coating layer on the surface of the flakes. Coating treatments would also enable the
protection of the cereals from physical damages (such as crushing) during supply chain,
transportation, storage, and handling.
The edible CaCas films and coatings have the potential to increase the utilization
of NFDM in both packaging film and coating applications.
88
FUTURE WORK
For the first study, since only E, EAB, and TS values of edible CaCas/Gly with a
small range of film thickness and CP concentration values were examined at 58-69% RH,
different film thicknesses and CP concentration could be tested at a broad range of RH in
the future. The edible films could be tested in a controlled RH and temperature to obtain
more stable results. In a later stage, different analyses could be performed to determine
the molecular interactions of compound in the film solutions besides the tensile properties
of the edible films.
For the second study, several coating solutions with 15% concentration were
applied on only Wheaties® RTE flakes. The concentration of CaCas coating solution
could be increased and applied on the flakes with a different spray technique to achieve
additional protein increases and more uniform coatings. CaCas-based coatings could also
be tested on other cereals. Further research could include the incorporation of probiotics
in the coating solutions to examine the effects of the shelf life of RTE breakfast cereals
and activities of probiotics.
89
REFERENCES
Albert S., Mittal G.S. (2002).“Comparative evaluation of edible coatings to reduce fat uptake in a deep-fried cereal product.” Food Research International 35(5): 445-458.
Albertson A.M., Franko D.L., Thompson D.R., Tuttle C., & Holschuh N.M. (2013). “Ready-to-eat cereal intake is associated with an improved nutrient intake profile among food insecure children in the United States.” Journal of Hunger & Environmental Nutrition 8(2): 200-220.
Anderson B.A., Singh R., & Rovedo C. (2003). “Use of Phytoglycogen Extracted from Corn to Increase the Bowl‐Life of Breakfast Cereal.” Journal Of Food Process Engineering 26(3): 315-322.
Andrade R., Skurtys O., & Osorio F. (2013). “Drop impact behavior on food using spray coating: fundamentals and applications.” Food Research International 54(1): 397-405.
AOAC (1990). “Official Methods of Analysis,” 15th Ed. Association of Analytical Chemists, Washington, DC.
AOAC (2000). “Method 992.23,” In “Official Methods of Analysis”, 17th Ed., AOAC International, Gaithersburg, MD.
ASTM (1998). “Standard test method for tensile properties of thin plastic sheeting D882-98 R.A. Storer (Ed.)” Annuals book of ASTM standards, American Society for Testing and Materials, Philadelphia, PA pp. 163–171.
Avena-Bustillos R., McHugh T.H., Krochta J.M. (1993) “Hydrophilic edible films: modified procedure for water vapor permeability and explanation of thickness effects.” J. Food Sci. 58(4): 899-903.
Baer R.J., Frank J.F., Loewenstein M., & Birth G.S. (1983). “Compositional analysis of whey powders using near infrared diffuse reflectance spectroscopy.” Journal of Food Science 48(3): 959-961.
BeMiller J.N. (2007). “Carbohydrate chemistry for food scientists (No. Ed. 2).” American Association of Cereal Chemists, Inc (AACC).
Ben-Naim A. (1980). “Hydrophobic Interaction among Many Solute Particles.” In Hydrophobic Interactions, Springer US: pp. 117-184.
Bone D.P., Brophy K., Champion R., Meschewski S., McKinney C.W. inventors; Quaker Oats Company, assignee. 1986 May 13. Ready-to-eat Cereals. US Patent 4,588,596.

90
Brennan M.A., Derbyshire E., Tiwari B.K., & Brennan C.S. (2013). “Ready-to-eat snack products: the role of extrusion technology in developing consumer acceptable and nutritious snacks.” International Journal of Food Science & Technology 48(5): 893-902.
Bravin B., Peressini D., Sensidoni A. (2006). "Development and application of polysaccharide–lipid edible coating to extend shelf-life of dry bakery products." Journal of Food Engineering 76(3): 280-290.
Bonnaillie L., Zhang H., et al. (2014). "Casein Films: The Effects of Formulation, Environmental Conditions and the Addition of Citric Pectin on the Structure and Mechanical Properties." Polymers 6(7): 2018-2036.
Botros L.L., Jablonski J., Chang C., Bergana M.M., Wehling P., Harnly J.M., ... & Moore J.C. (2013). "Exploring authentic skim and nonfat dry milk powder variance for the development of nontargeted adulterant detection methods using near-infrared spectroscopy and chemometrics." Journal of agricultural and food chemistry 61(41): 9810-9818.
Calandro T.P., Murray J. (1992). U.S. Patent No. 5,093,146. Washington, DC: U.S. Patent and Trademark Office.
Caldwell E.F., Fast R.B., Ievolella J., Lauhoff C., Levine H., Miller R.C., Slade L., Strahm B.S., Whalen P.J. (2000). “Cooking of ready-to-eat breakfast cereals.” Cereal Foods World 45(6): 244-252.
Carpenter T., Fisher W., Smith T., inventor. General Foods Corp., assignee. 1989 Nov 14. Coating Cereal with Fruit Juice. US Patent 4,880,645.
Chambi H. and C. Grosso (2006). "Edible films produced with gelatin and casein cross-linked with transglutaminase." Food Research International 39(4): 458-466.
Chang S. K. (2010). "Protein analysis." In Food analysis (pp. 133-146). Springer US.
Chang C., Nickerson M.T. (2013). "Effect of protein and glycerol concentration on the mechanical, optical, and water vapor barrier properties of canola protein isolate-based edible films." Food Science and Technology International 213(50):36-45.
Chen H. (1995). "Functional Properties and Applications of Edible Films Made of Milk Proteins." Journal of Dairy Science. 78(11): N 2563-2583.
Chen H. (2002). “Formation and properties of casein films and coatings.” In Protein-based films and coatings: 181-211.
91
Chick J., Ustunol Z. (1998). "Mechanical and barrier properties of lactic acid and rennet precipitated casein-based edible films." J. Food Sci. 63: 1024–1027.
Dangaran K.L., Cooke P., et al. (2006). "The effect of protein particle size reduction on the physical properties of CO2-precipitated casein films." J. Food Sci. 71(4): E196-E201.
Dangaran K.L., Tomasula P.M., et al. (2009). Structure and Function of Protein-Based Edible Films and Coatings, submitted Book chapter.
Dangaran K., & Krochta J.M. (2009). “Whey protein films and coatings.” In Whey Processing, Functionality and Health Benefits 82: 133.
Dickinson E. (2006). "Structure formation in casein-based gels, foams, and emulsions. Colloids and Surfaces A." Physicochemical and Engineering Aspects 288(1): 3-11.
Falguera V., Quintero J.P., et al. (2011). "Edible films and coatings: Structures, active functions and trends in their use." Trends in Food Science & Technology 22(6): 292-303.
Fast R. (2000). “Manufacturing technology of ready-to-eat cereals.” In: Fast, R, Caldwell, E eds. Breakfast cereals and how they are made. American Association of Cereal Chemists, St. Paul, Minnesota, pp. 15-54.
Field A., (2013). “Discovering statistics using IBM SPSS statistics.” Version 21 provided by the State University of New Jersey, Rutgers software system.
Flutti L. (2003). "Pectin: Properties and determination: In Caballero B. (Eds)." Encycopedia of Food Science and Nutrition, Oxford: Academic Press: 4440-4449.
Fox P.F., Kelly A.L. (2006). Chemistry and biochemistry of milk constituents. Food Biochemistry and Food Processing, 425-452.
Freitas D.D.G.C., Berbari S.A.G., Prati P., Fakhouri F.M., Queiroz F.P.C., & Vicente E. (2009). “Reducing fat uptake in cassava product during deep-fat frying.” Journal of Food Engineering 94(3): 390-394.
Gennadios A., Ghorpade V.M., et al. (1996). "Heat curing of soy protein films." Biological System Engineering 39(2): 575-579.
Guinee T.P., Mullins C.G., Reville W.J., & Cotter M.P. (1995). “Physical properties of stirred-curd unsweetened yoghurts stabilised with different dairy ingredients.” Milchwissenschaft 50(4): 196-200.
Hofsetz K., & Lopes C.C. (2005). "Crispy banana obtained by the combination of a high temperature and short time drying stage and a drying process." Brazilian Journal of Chemical Engineering 22(2): 285-292.

92
Hong S.I., Krochta J.M. (2006). "Oxygen barrier performance of whey-protein-coated plastic films as affected by temperature, relative humidity, base film and protein type." Journal of Food Engineering 77(3): 739-745.
Horne D.S. (2006). "Casein micelle structure: Models and muddles." Current Opinion in Colloid & Interface Science 11(2-3): 148-153.
Hutchinson R.J., Mantle S.A., & Smith A.C. (1989). "The effect of moisture content on the mechanical properties of extruded food foams." Journal of Materials Science 24(9): 3249-3253.
Janjarasskul T. and Krochta J.M. (2010). "Edible packaging materials." Annu Rev Food Sci Technol 1: 415-448.
Johnson R.K., Frary C. (2001). "Choose beverages and foods to moderate your intake of sugars: The 2000 Dietary Guidelines for Americans—what’s all the fuss about?." The Journal of Nutrition 131(10): 2766S-2771S.
Jones D.B. (1931). “Factors for converting percentages of nitrogen in foods and feeds into percentages of proteins.” US Dept. Agric. Circular No. 183, August. USDA,Washington, DC.
Khwaldia K., Perez C., Banon S., Desobry S., Hardy J. (2004). "Milk proteins for edible films and coatings." Critical Reviews in Food Science and Nutrition, 44(4): 239-251.
Kurita O., Fujiwara T., et al. (2008). "Characterization of the pectin extracted from citrus peel in the presence of citric acid." Carbohydrate Polymers 74(3): 725-730.
Letendre M., D'aprano G., Lacroix M., Salmieri S., & St-Gelais D. (2002). “Physicochemical properties and bacterial resistance of biodegradable milk protein films containing agar and pectin.” Journal of Agricultural and Food Chemistry 50(21): 6017-6022.
Löfgren C. and Hermansson A.M. (2007). "Synergistic rheological behaviour of mixed HM/LM pectin gels." Food Hydrocolloids 21(3): 480-486.
Long C. and Chatel R. (2006). Reduced sugar RTE cerals with maltodextrin US20060286223 A1, Carol Long US20060286223 A1: 13.
Luckett C.R. and Wang Y.J. (2012). "Application of Enzyme-Treated Corn Starches in Breakfast Cereal Coating." Journal of Food Science 77: 901-906.
Maroziene A. and de Kruif C.G. (2000). "Interaction of pectin and casein micelles." Food Hydrocolloids 14(4): 391-394.

93
May C.D. (1990). “Industrial pectins: sources, production and applications.” Carbohydrate Polymers 12(1), 79-99.
Maynes J.R., & Krochta J.M. (1994). “Properties of edible films from total milk protein.” Journal of Food Science 59(4): 909-911.
Meltretter J., Seeber S., Humeny A., Becker C.M., & Pischetsrieder M. (2007). "Site-specific formation of Maillard, oxidation, and condensation products from whey proteins during reaction with lactose." Journal of Agricultural and Food Chemistry 55(15): 6096-6103.
Merrill A.L., & Watt B.K. (1973). "Energy value of foods—basis and derivation." U.S. Department of Agriculture, Agriculture Handbook No. 74, sl. rev.
McHugh T.H., Weller C.L., Krochta J.M. (1994). "Edible coatings and films based on proteins" : In Edible coatings and films to improve food quality. pg. 201.
Miner C.S., & Dalton N.N. (Eds.). (1953). “Glycerol” (Vol. 117). Reinhold Pub. Corp.
Mosse J. (1990). "Nitrogen-to-protein conversion factor for ten cereals and six legumes or oilseeds. A reappraisal of its definition and determination. Variation according to species and to seed protein content." Journal of Agricultural and Food Chemistry 38(1): 18-24.
Nicholls R.J., Appelqvist I.A.M., Davies A.P., Ingman S.J. and Lillford P.J. (1995). "Glass Transitions and Fracture Behaviour of Gluten and Starches within the Glassy State." J. Cereal Sci. 21: 25–36.
Nowakowski C. and Green D.R. (2012 ). Low sugar presweetened coated cereals and method of preparation the United States of America General Mills Inc. . US Patent 8,137,720.
Oakenfull U.D. (1984). “A method for using measurements of shear modulus to estimate the size and thermodynamic stability of junction zones in noncovalently cross-linked gels.” J. Food Sci. 49, 1103-1110.
Oakenfull D.G. (1991). “The chemistry of high-methoxyl pectins.” (pp. 88-108). Academic Press: New York.
Ouattara B., Canh L.T., et al. (2002). "Use of gamma-irradiation cross-linking to improve the water vapor permeability and the chemical stability of milk protein films." Radiation Phys. Chem. 63(3-6): 821-825.

94
Pedersen H.C.A. and Jorgensen B.B. (1991). "Influence of Pectin on the Stability of Casein Solutions Studied in Dependence of Varying Ph and Salt Concentration." Food Hydrocolloids 5(4): 323-328.
Pestano P., Yeshua E., et al. (2011). "Sugar in children's cereals: Popular brands pack more sugar than snack cakes and cookies." Environmental Working Group.
Powell D.A., Morris E.R., Gidley M.J., Rees D.A. (1982). "Conformations and interactions of pectins: II. Influence of residue sequence on chain association in calcium pectate gels." Journal of Molecular Biology. 155(4): 517-531.
Rees D.A., Whelan W.J. (1975). Biochemistry of carbohydrates. MTP Internat. Rev. Sci. Biochem., 5 Butterworth, London, 1.
Remeuf F., Mohammed S., Sodini I., & Tissier J.P. (2003). “Preliminary observations on the effects of milk fortification and heating on microstructure and physical properties of stirred yogurt.” International Dairy Journal 13(9): 773-782.
Ressouany M., Vachon C., & Lacroix M. (1998). “Irradiation dose and calcium effect on the mechanical properties of cross-linked caseinate films.” Journal of Agricultural and Food Chemistry 46(4): 1618-1623.
Ricardo D., Andrade O.S., Fernando A. Osorio (2012). "Atomizing Spray Systems for Application of Edible Coating." 2012 Institute Food Technologists 11: 323-337.
Rolin C. (1993). “Pectin.” In Industrial gums, eds. R.L. Whistler and J.N. BeMiller. 3rd edn. (New York: Academic Press)
Roudaut G., Dacremont C., & Meste M.L. (1998). "Influence of Water on The Crispness of Cereal‐Based Foods: Acoustic, Mechanical, and Sensory Studies." Journal of Texture Studies 29(2): 199-213.
Ruxton C.H.S., Garceau F.J.S. and Cottrell R.C. (1999). "Guidelines for sugar consumption in Europe: Is a quantitative approach justified?" Eur. J. Clin. Nutr. 53:503–515.
Saklar S., Ungan S. and Katnas S. (1999). "Instrumental Crispness and Crunchiness of Roasted Hazelnuts and Correlations with Sensory Assessment." Journal of Food Science 64(6): 1015-1019.
Schmidt D.G. (1982). "Association of caseins and casein micelle structure." Developments in Dairy Chemistry 1: 61-86.
95
Schou M., Longares A., Montesinos-Herrero C., Monahan F.J., O’Riordan D., O’sullivan M. (2005). "Properties of edible sodium caseinate films and their application as food wrapping." LWT-Food Science and Technology 38(6): 605-610.
Siew D.C., Heilmann C., Easteal A.J., & Cooney R.P. (1999). “Solution and film properties of sodium caseinate/glycerol and sodium caseinate/polyethylene glycol edible coating systems.” Journal of Agricultural and Food Chemistry 47(8): 3432-3440.
Swaisgood H.E. (1992). "Chemistry of the caseins." In: Advanced Dairy Chemistry-1: Proteins. P. F. Fox. London, UK, Elsevier Applied Science. 1: 63-110.
Swaisgood H.E., et al. (1996). "Hydrolysis of feather keratin by immobilized keratinase." Appl. Environ. Microbiol. 62: 4273–4275.
Tamime A.Y., Kalab M., Muir D.D., & Barrantes E. (1995). “The microstructure of set‐style, natural yogurt made by substituting microparticulate whey protein for milk fat.” International Journal of Dairy Technology 48(4): 107-111.
Thakur B.R., Singh R.K., Handa A.K., Rao M.A. (1997). "Chemistry and uses of pectin-A review." Crit. Rev. Food Sci. Nutr. 37: 47–73.
Thomas R.G., Pehrsson P.R., et al. (2013). "Recent Trends in Ready-to-eat Breakfast Cereals in the U.S." Procedia Food Science 2: 20-26.
Tomasula P.M., Parris N., et al. (1998). "Properties of films made from CO2-precipitated casein." Journal of Agriculture and Food Chemistry 46: 4470-4474.
Tomasula P.M. (2002). "Edible, water-solubility resistant casein masses" United States Patent.
Tomasula P.M., Yee W.C., & Parris N. (2003). “Oxygen permeability of films made from CO2-precipitated casein and modified casein.” Journal of Agricultural and Food Chemistry 51(3): 634-639.
Tomasula P.M. (2009). "Using Dairy Ingredients to Produce Edible Films and Biodegradable Packaging Materials." In Dairy-Derived Ingredients: Food and Nutraceutical Uses. M. Corredig: 589-624.
Uniacke-Lowe T., Huppertz T., Fox P.F. (2010). "Equine milk proteins: chemistry, structure and nutritional significance." International Dairy Journal 20(9): 609-629.
Vargas M., Pastor C., Chiralt A., McClements D.J., Gonzalez-Martinez C. (2008). "Recent advances in edible coatings for fresh and minimally processed fruits." Critical Reviews in Food Science and Nutrition 48(6): 496-511.
96
Varnam A., & Sutherland J.P. (2001). Milk and milk products: technology, chemistry and microbiology (Vol. 1). Springer.
Vieira M.G.A., da Silva M.A., et al. (2011). "Natural-based plasticizers and biopolymer films: A review." European Polymer Journal 47(3): 254-263.
Vincent J. F. (1998). "The quantification of crispness." Journal of the Science of Food and Agriculture 78(2): 162-168.
Yildirim M., Hettiarachchy N.S. (1998). "Properties of Films Produced by Cross‐linking Whey Proteins and 11S Globulin Using Transglutaminase." Journal of Food Science 63(2): 248-252.


![Methyl trans-([plus-minus sign])-1-oxo-2-phenethyl-3 ... · Methyl trans-( )-1-oxo-2-phenethyl-3-(thiophen-2-yl)-1,2,3,4-tetrahydro-isoquinoline-4-carboxylate Mehmet Akkurt,a* Selvi](https://static.fdocuments.net/doc/165x107/5f8f753362af594ccf1f8cae/methyl-trans-plus-minus-sign-1-oxo-2-phenethyl-3-methyl-trans-1-oxo-2-phenethyl-3-thiophen-2-yl-1234-tetrahydro-isoquinoline-4-carboxylate.jpg)


