Master thesis Development of Fitness-For-Service ... API510, API570, API 653, and NB-23...
50
Master ’ thesis Development of Fitness-For-Service Assessment Method Based on Reliability 信頼性に基づく構造健全性評価手法の開発 37-116907 Qiang QU Supervising Professor: Shinsuke SAKAI
Transcript of Master thesis Development of Fitness-For-Service ... API510, API570, API 653, and NB-23...
Master’ thesis
Development of Fitness-For-Service
Assessment Method Based on Reliability
信頼性に基づく構造健全性評価手法の開発
37-116907 Qiang QU
Supervising Professor: Shinsuke SAKAI

1
Chapter 1. Introduction ........................................................................................ 3
1.1 Background ....................................................................................... 3
1.1.1 Fitness-For-Service and API standards ................................................................ 3
1.1.2 Present status of FFS assessment of crack-like flaws ....................................... 3
1.2 Objective and research direction ....................................................... 4
Chapter 2. FFS Assessment of Crack-like Flaw .................................... 5
2.1 Assessment Procedures Using Partial Safety Factors ....................... 5
2.1.1 Partial Safety Factor (PSF) ..................................................................................... 5
2.1.2 Failure Assessment Diagram .................................................................................. 6
2.1.3 FFS assessment procedures using PSF ................................................................. 6
2.2 Probabilistic approaches of PSF derivation ...................................... 9
2.2.1 Limit state function ................................................................................................... 9
2.2.2 Reformulation of limit state function.................................................................. 10
2.2.3 Calculation of partial safety factors .................................................................... 11
Chapter 3. Applicability Investigation of API579 PSFs ............... 13
3.1 Applicability investigation process .................................................. 13
3.1.1 API579 PSFs ............................................................................................................ 13
3.1.2 Investigation process .............................................................................................. 15
3.2 Results .............................................................................................. 16
3.2.1 Model 1: Plate containing semi-elliptical shape surface crack subjected to
membrane stress ....................................................................................................... 16
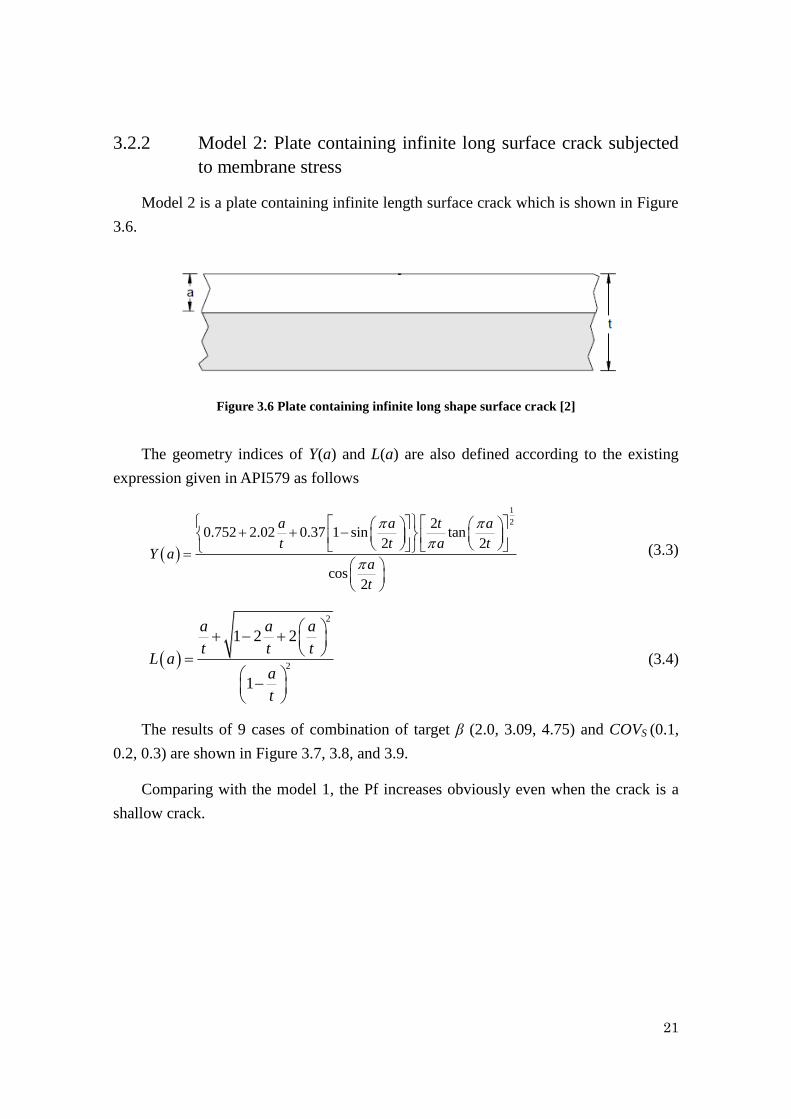
3.2.2 Model 2: Plate containing infinite long surface crack subjected to
membrane stress ....................................................................................................... 21
3.2.3 Model 3: Cylinder containing longitudinal direction, infinite length surface
crack subjected to inner pressure ......................................................................................... 25
3.2.4 Other models ............................................................................................................ 29
Chapter 4. Development of Partial Safety Factors .......................... 30
4.1 PSF calculations of models .............................................................. 30
4.1.1 PSFs calculated from real models ....................................................................... 30
4.1.2 Development of new PSFs .................................................................................... 34
4.2 Applicability investigation of developed PSFs ................................ 38

2
4.3 Probabilistic sensitivity .................................................................... 42
Chapter 5. Conclusions .................................................................................... 46
Applicability of partial safety factors given in API 579 ........................... 46
Development of new partial safety factors ............................................... 46
Acknowledgements ............................................................................................... 47
Reference ............................................................................. 48

3
Chapter 1. Introduction
Background 1.1
1.1.1 Fitness-For-Service and API standards
Fitness-For-Service (FFS) assessments are quantitative engineering evaluations that
are performed to demonstrate the structural integrity of an in-service component
containing a flaw or damage. The results of a FFS assessment can be used to make a
run-repair-replace decision to ensure that the equipment with flaws that have been
identified by inspection can continue to operate safely for some period of time [1].These
FFS assessments are currently recognized and referenced by the API (American
Petroleum Institute) Codes and Standards. API579 is a standard that was developed to
evaluate flaws and damage associated with in-service operation. Besides, API510,
API570, API 653, and NB-23 Codes/Standards are standards for the inspection, repair,
alteration, and rerating of in-service equipment containing flaws.
API579 contains Fitness-For-Service (FFS) assessment procedures that can be used
to evaluate pressurized components containing damage and flaws including metal loss,
corrosion, and crack-like flaws.
1.1.2 Present status of FFS assessment of crack-like flaws
FFS assessment procedures using partial safety factors (PSFs) are provided in
API579-1 [2] to determine the acceptability of crack-like flaws. These procedures are
deterministic in that all information required for an analysis (independent variables as
stress, toughness and crack dimension) are assumed to be known. Generally, the partial
safety factors to be used are products of probabilistic analysis considering the specific
condition of stress and structural geometries.
However, in many instances not all of the important independent variables are
known with a high degree of accuracy (not enough data), otherwise there are difficulties
to conduct probabilistic analysis (excessively complicated structural geometry). In such

4
cases, a group of values of PSFs are given in API579 -1 to be used in the FFS
assessment for an approximate evaluation. The API579 PSFs are shown in Table 3.2 in
Chapter 3.
It is very convenient to use this existing group of API579 PSFs to evaluate various
components with various structural geometries and crack geometries. However, these
PSFs are calculated from the infinite plate model, if these PSFs are applied to evaluate
real models of which the mechanical properties are different from an infinite plate, these
differences in geometries may cause misestimating of the reliability or probability of
failure (Pf) in the result of approximate evaluation. Thus these PSFs are permitted to be
applied only when the underestimation of probability of failure is within an acceptable
region.
However, the applicability (permit region) of these PSFs has not been clear. In
order to promote the accuracy of the approximate evaluation, it is necessary and
important to clarify the applicability of API579 PSFs, and develop applicable PSFs.
Objective and research direction 1.2
This paper investigates the applicability of AIP579-1 PSFs and develops new PSFs
which could provide enough accuracy for an approximate evaluation of the safety
margin.
For this purpose, we apply API579-1 PSFs to several concrete models to examine
how the Pf changes from the target. Also PSFs of all these models including an infinite
plate are calculated by the First Order Reliability Method (FORM), and compared to the
API579-1 PSFs. A group of value of PSFs is generated from these calculated PSFs, and
the applicability of this group of developed PSFs is also examined. Finally, sensitivity
analysis is performed to investigate the dependence of the crack size on the Pf and the
applicability of developed PSFs will be clarified.

5
Chapter 2. FFS Assessment of Crack-like Flaw
Assessment Procedures Using Partial Safety Factors 2.1
FFS assessment evaluating a crack-like flaw is based on the method using Partial
Safety Factors and the Failure Assessment Diagram (FAD).
2.1.1 Partial Safety Factor (PSF)
In a deterministic deign, the safety factor is applied to the resistance in the safety
check expression to ensure the capacity of system exceeds the loads. The expression is
shown as follow.
1
n
i
i
RL
(2.1)
where R is nominal resistance, Li are various loads, and γ is the safety factor. Thus, this
method doesn’t provide a treatment of the uncertainties existing in strength and loads,
and it is also unable to evaluate the actual safety margin by this method.
On the other hand, partial safety factors are individual safety factors that are applied
to the independent variables in the safety expression.
1
n
i i
i
RL
(2.2)
where γi, φ are partial safety factors. These partial safety factors are developed
using probabilistic analysis in which the resistance and loads are defined as random
variables with distributions. The calculation of PSFs is based on reliability method
considering a limit state model, distributions of the main independent variables of the
model, and a target reliability or probability of failure (see paragraph 2.2). Hence, the
uncertainties of loads and resistance can be treated by separately combining the nominal
value of each variable with its own partial safety factor, and also the safety margin is
introduced by the target reliability or probability of failure [3].
6
2.1.2 Failure Assessment Diagram
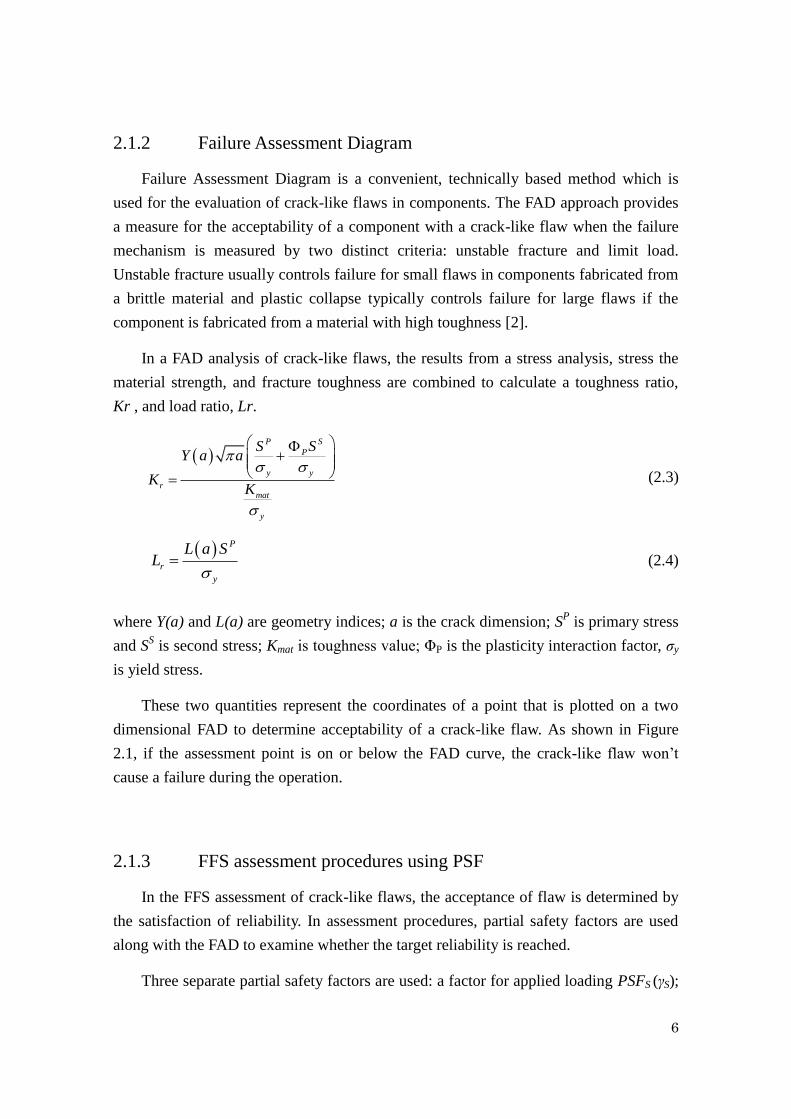
Failure Assessment Diagram is a convenient, technically based method which is
used for the evaluation of crack-like flaws in components. The FAD approach provides
a measure for the acceptability of a component with a crack-like flaw when the failure
mechanism is measured by two distinct criteria: unstable fracture and limit load.
Unstable fracture usually controls failure for small flaws in components fabricated from
a brittle material and plastic collapse typically controls failure for large flaws if the
component is fabricated from a material with high toughness [2].
In a FAD analysis of crack-like flaws, the results from a stress analysis, stress the
material strength, and fracture toughness are combined to calculate a toughness ratio,
Kr , and load ratio, Lr.
SP
P
y y
rmat
y
SSY a a
KK
(2.3)
P
r
y
L a SL
(2.4)
where Y(a) and L(a) are geometry indices; a is the crack dimension; SP is primary stress
and SS is second stress; Kmat is toughness value; ΦP is the plasticity interaction factor, σy
is yield stress.
These two quantities represent the coordinates of a point that is plotted on a two
dimensional FAD to determine acceptability of a crack-like flaw. As shown in Figure
2.1, if the assessment point is on or below the FAD curve, the crack-like flaw won’t
cause a failure during the operation.
2.1.3 FFS assessment procedures using PSF
In the FFS assessment of crack-like flaws, the acceptance of flaw is determined by
the satisfaction of reliability. In assessment procedures, partial safety factors are used
along with the FAD to examine whether the target reliability is reached.
Three separate partial safety factors are used: a factor for applied loading PSFS (γS);

7
a factor for material toughness PSFK (γK); and a factor for flaw dimension PSFa (γa).
These partial safety factors are applied to the stresses, the fracture toughness and the
flaw size parameters prior to conducting a FAD analysis.
S S
SS S (2.5)
S S
SS S (2.6)
mat mat KK K (2.7)
aa a (2.8)
Kr and Lr are computed by equation 2.1 and 2.2, and plotted on the FAD to conduct
the FAD assessment. If the assessment point is on or below the FAD curve, the target
reliability responding with the partial safety factors is satisfied, the crack-like flaw is
acceptable, and the component is suitable for continued operation. A schematic that
illustrates the procedure for FFS assessment of a crack-like flaw using the Failure
Assessment Diagram and PSFs is shown in Figure 2.2
Figure 2.1 Failure assessment diagram analysis

8
Figure 2.2 FFS assessment procedures
9
Probabilistic approaches of PSF derivation 2.2
A probabilistic approach to evaluate the reliability of component is introduced, and
the calculation of PSFs based on this approach is also introduced in this paragraph.
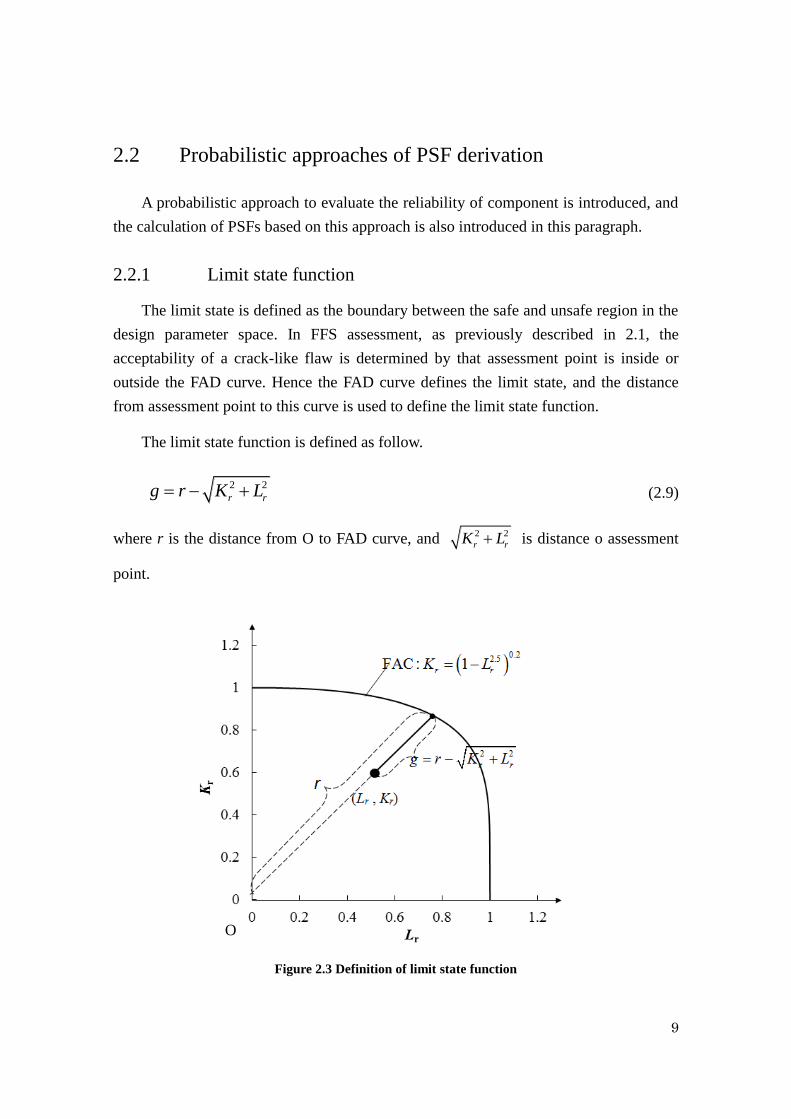
2.2.1 Limit state function
The limit state is defined as the boundary between the safe and unsafe region in the
design parameter space. In FFS assessment, as previously described in 2.1, the
acceptability of a crack-like flaw is determined by that assessment point is inside or
outside the FAD curve. Hence the FAD curve defines the limit state, and the distance
from assessment point to this curve is used to define the limit state function.
The limit state function is defined as follow.
2 2
r rg r K L (2.9)
where r is the distance from O to FAD curve, and 2 2
r rK L is distance o assessment
point.
Figure 2.3 Definition of limit state function
O
10
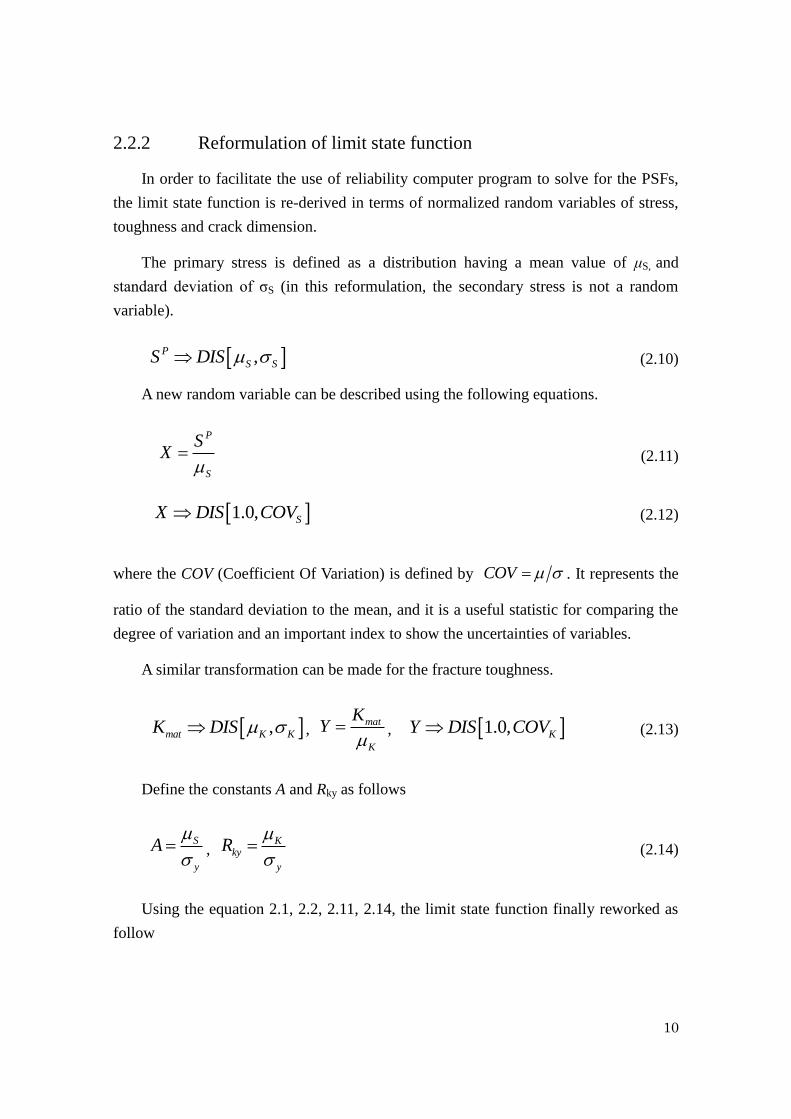
2.2.2 Reformulation of limit state function
In order to facilitate the use of reliability computer program to solve for the PSFs,
the limit state function is re-derived in terms of normalized random variables of stress,
toughness and crack dimension.
The primary stress is defined as a distribution having a mean value of μS, and
standard deviation of σS (in this reformulation, the secondary stress is not a random
variable).
,P
S SS DIS (2.10)
A new random variable can be described using the following equations.
P
S
SX
(2.11)
1.0, SX DIS COV (2.12)
where the COV (Coefficient Of Variation) is defined by COV . It represents the
ratio of the standard deviation to the mean, and it is a useful statistic for comparing the
degree of variation and an important index to show the uncertainties of variables.
A similar transformation can be made for the fracture toughness.
,mat K KK DIS , mat
K
KY
, 1.0, KY DIS COV (2.13)
Define the constants A and Rky as follows
S
y
A
,
Kky
y
R
(2.14)
Using the equation 2.1, 2.2, 2.11, 2.14, the limit state function finally reworked as
follow

11
2
1ky
Y a ag r L a AX
L a R Y
(2.15)
where, L(a) and Y(a) are functions of crack dimension. Though stress analyses, L(a) and
Y(a) are obtained. For different models, the L(a) and Y(a) are different. As a result, the
limit state functions are different for all the models.
2.2.3 Calculation of partial safety factors
In a probabilistic approach, the basic design criterion is either a maximum
allowable probability of failure (target Pf) or a minimum allowable reliability index β
(target reliability β0). Two factors are related as the equation given follow
0Pf (2.16)
where Ф is the standard normal cumulative distribution function (CDF).
A general calculating method of partial safety factors is reliability method including
first order reliability method (FORM) and second order reliability method (SORM). In
reliability method, for nonlinear limit state, the computation of the minimum value of
reliability index becomes an optimization problem:
Minimize
Subject to 0
Tu
u
u
g
(2.17)
where u is a vector of standardized variables.
The algorithm process is required to change the parameter A, B manually until the
target reliability is satisfied (0 ). The outputs of this calculation includes the
direction cosines ( * * *, ,X Y a ), and design point values ( * * *, ,X Y a ) which are used to
derive the PSFs using the following equations.
* *
*, ,Y
X K a
x a
X a
Y
(2.18)
Then, using the equation 2.11 and 2.13 to calculate the PSFs of stress and toughness,
the PSFs are obtained as

12
X SS X
S
,
KK Y
K Y
(2.19)
These tree partial safety factors are applied to the FFS assessment according to the
procedures introduced in 2.13. In Chapter 4, this reliability approaches are used to
calculate PSFs of several models.

13
Chapter 3. Applicability Investigation of
API579 PSFs
Applicability investigation process 3.1
3.1.1 API579 PSFs
As introduced in the paragraph 1.1.2, in API579-1, a group of values of PSFs are
given to be used for an approximate evaluation in the FFS assessment. These PSFs are
shown in Table 3.2. In this table, for the shallow cracks, 18 cases of PSFs divided by
combining 3 target reliability levels, 3 categories of uncertainty in primary stress
(COVS), 2 failure regions (Rky>Rc, plastic collapse region; Rky< Rc, brittle fracture
region) are given, as well as another 18 cases for the deep cracks are also given.
These PSFs are calculated from an infinite plate model of which the geometry
indices L(a) and Y(a) are constant 1.0. Apply these PSFs to real models of which L(a)
and Y(a) are functions of crack dimension, the dependence of crack dimension on the Pf
is weakened and the design point changes in a reliability approaches, finally an
underestimation of Pf is resulted. If the underestimation of Pf is acceptable, it is still
reasonable for us to apply API579 PSFs in the evaluation.
In the derivation of API579 PSFs, random distributions of the independent variables
of stress, toughness and crack dimension are assumed as shown in Table 3.1.
Table 3.1 Independent variables of the derivation of API579 PSFs [4]
Variable Distribution Mena value COV
Crack size (mm) Lognormal 2.5 0.3
Fracture toughness Weibull 1 0.25
Primary membrane stress Gunbel 1 0.1,0.2,0.3

14
Table 3.2 Partial Safety Factors given in API579-1
Notes:
Rc is a cut-off value used to define the regions of brittle fracture and plastic collapse.
The values of Rc has been conversed to IU ( international unit).
Shallow Cracks a<5mm (0.2 inches)
β COVs Rc* Rky<Rc Rky>Rc
PSFs PSFk PSFa PSFs PSFk PSFa
0.1 0.5 1.20 1.43 1.08 1.25 1.0 1.0
2 0.2 0.5 1.30 1.43 1.08 1.50 1.0 1.0
0.3 0.5 1.55 1.43 1.08 1.75 1.0 1.0
0.1 0.7 1.40 1.43 1.20 1.50 1.0 1.0
3.09 0.2 0.7 1.50 1.82 1.10 2.00 1.0 1.0
0.3 0.7 2.00 2.00 1.05 2.50 1.0 1.0
0.1 1.1 1.75 2.00 1.35 2.00 1.0 1.0
4.75 0.2 1.1 2.50 2.00 1.50 3.10 1.0 1.0
0.3 1.1 2.60 2.00 1.50 4.10 1.0 1.0
Deep Cracks a>5mm (0.2 inches)
β COVs Rc Rky<Rc Rky>Rc
PSFs PSFk PSFa PSFs PSFk PSFa
0.1 0.5 1.20 1.33 1.10 1.25 1.0 1.0
2 0.2 0.5 1.40 1.54 1.10 1.50 1.0 1.0
0.3 0.5 1.60 1.67 1.10 1.75 1.0 1.0
0.1 0.7 1.40 1.67 1.15 1.50 1.0 1.0
3.09 0.2 0.7 1.80 1.43 1.10 2.00 1.0 1.0
0.3 0.7 2.30 1.43 1.10 2.50 1.0 1.0
0.1 1.1 1.70 2.00 1.25 2.00 1.0 1.0
4.75 0.2 1.1 2.60 1.82 1.25 3.10 1.0 1.0
0.3 1.1 3.50 1.67 1.25 4.10 1.0 1.0

15
3.1.2 Investigation process
In order to make clear the applicability, API579 PSFs are applied to 7 real models
to investigate whether the reliability or probability of failure is evaluated precisely. The
investigation is performed according to the following steps
[1]. A limit state function of real model is defined (the geometry indices L(a) and Y(a)
are used the theoretical expressions given in API579 Appendix).
, , , , 0kyg X Y a A R (3.1)
[2]. Determine the target reliability β0 and COVS, and choose PSFs from Table 3.1.
Apply the PSFs to the variables, and conduct a FAD analysis. Find the maximum of
allowable Kr for each Lr. Otherwise, we can find the (Amax, Rky) instead of point of
(Lr, Krmax).
, , , , 0X Y a kyg X Y a A R (3.2)
[3]. Evaluate reliability or Pf of the assessment point (Lr, Krmax) by first order reliability
method (FORM).
When we apply API579 PSFs in the evaluation, every assessment point inside or on
the 0i ig X curve are considered to be acceptable because the target reliability is
satisfied. However, if we perform a FORM to draw a reliability contour line of β0, the
result shows that some of the assessment points are on the contour line; while some are
out of the reliability contour line as shown in Figure 3.1. The reliability of these outside
points are not actually reaching the target reliability β0, and in these cases, using the
API579 PSFs will cause a wrong accepting decision of the crack-like flaws. So in these
cases, API579 should not be applied in the evaluation.

16
Figure 3.1 Misestimating of reliability caused by API579 PSFs
Results 3.2
We investigated the applicability of API579 PSFs for 7 models including plates and
cylinders containing surface cracks. We use a crack depth- to-wall thickness ratio (a/t)
instead of nominal depth to show the crack changes from shallow to deep. If the a/t is
deeper than 0.3, we consider it as a deep crack and choose the PSFs from its category in
Table 3.2. Results of applicability investigation of 3 real models are given in this
paragraph.
3.2.1 Model 1: Plate containing semi-elliptical shape surface crack
subjected to membrane stress
Model 1 is a plate containing a semi-elliptical shape surface crack which is shown
in Figure 3.2.
Figure 3.2 Plate containing semi-elliptical shape surface crack [2]

17
The geometry indices of Y(a) and L(a) are defined according to the existing
expression given in API579 as follows
12 24 4 2
1.65
0.89 11.13 0.09 0.54 0.5 14 1 sec
0.2 0.65 2
1 1.464
a a a a c a
c a c t a c c t b tY a
a
c
(3.1)
0.42
1ac
L at c t
(3.2)
The plate length b and crack length c are assumed as 3 6b c a in this
investigation. We investigate the cases when a/t = 0.1, 0.2, 0.3 for each categories of
API579 PSFs. We show the misestimating in the evaluation by using the probability of
failure which provides a more intuitionistic observation.
In Figure 3.3 (a, b, c), the cases of target β=2.0 (Pf=2.3×10⁻²
), COVS=0.1, 0.2, 0.3
have been shown. It can be seen that, in the brittle fracture region, the Pf are greater
than the target Pf, and with the increase of crack depth, this Pf is getting farther from the
target Pf. It is also shown that, when the COVS is chosen a high level, the
underestimation in Pf becomes less. In contrast, in the plastic collapse region, the Pf are
nearly agreeing with the target Pf.
Results of higher target reliability levels are shown in Figure 3.4 and Figure 3.5.
The same characteristics are obtained as the cases β=2.0. However, for a higher
reliability level, the underestimation of Pf is becoming relatively huge.
It can be concluded that, when we evaluate a plate component containing
semi-elliptical surface crack, if the material is a low toughness material for which the
failure model is more likely a brittle fracture, the API579 PSFs should not be applied in
the evaluation because the actual probability of failure is greater than that expected;
while if the material is a high toughness material (plastic collapse region), the API579
PSFs are applicable.

18
Figure 3.3 Underestimation of Pf when API579 PSFs are applied to model 1 for the cases that target
β=2.0 (Pf=0.023), (a) COVS=0.1, (b) COVS=0.2, (c) COVS=0.3
(a)
(b)
(c)
Brittle Fracture Plastic collapse
Brittle Fracture Plastic collapse
Brittle Fracture Plastic collapse

19
Figure 3.4 Underestimation of Pf when API579 PSFs are applied to model 1 for the cases that target
β=3.09 (Pf=0.001), (a) COVS=0.1, (b) COVS=0.2, (c) COVS=0.3
(a)
(b)
(c)

20
Figure 3.5 Underestimation of Pf when API579 PSFs are applied to model 1 for the cases that target
β=4.75 (Pf=10-6
), (a) COVS=0.1, (b) COVS=0.2, (c) COVS=0.3
(a)
(b)
(c)
21
3.2.2 Model 2: Plate containing infinite long surface crack subjected
to membrane stress
Model 2 is a plate containing infinite length surface crack which is shown in Figure
3.6.
Figure 3.6 Plate containing infinite long shape surface crack [2]
The geometry indices of Y(a) and L(a) are also defined according to the existing
expression given in API579 as follows
1
220.752 2.02 0.37 1 sin tan
2 2
cos2
a a t a
t t a tY a
a
t
(3.3)
2
2
1 2 2
1
a a a
t t tL a
a
t
(3.4)
The results of 9 cases of combination of target β (2.0, 3.09, 4.75) and COVS (0.1,
0.2, 0.3) are shown in Figure 3.7, 3.8, and 3.9.
Comparing with the model 1, the Pf increases obviously even when the crack is a
shallow crack.

22
Figure 3.7 Underestimation of Pf when API579 PSFs are applied to model 2 for the cases that target
β=2.00 (Pf=0.023), (a) COVS=0.1, (b) COVS=0.2, (c) COVS=0.3
(a)
(b)
(c)

23
Figure 3.8 Underestimation of Pf when API579 PSFs are applied to model 2 for the cases that target
β=3.09 (Pf=0.001), (a) COVS=0.1, (b) COVS=0.2, (c) COVS=0.3
(c)
(b)
(a)

24
Figure 3.9 Underestimation of Pf when API579 PSFs are applied to model 2 for the cases that target
β=4.75 (Pf=10-6
), (a) COVS=0.1, (b) COVS=0.2, (c) COVS=0.3
(a)
(b)
(c)

25
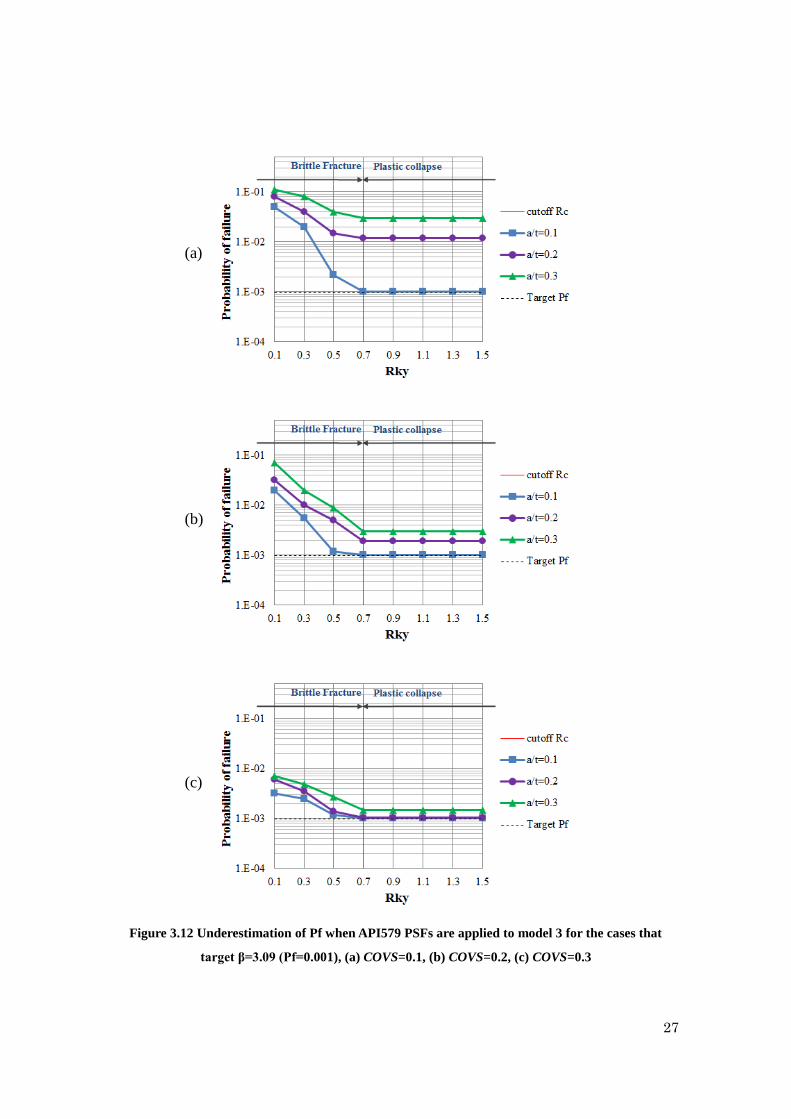
3.2.3 Model 3: Cylinder containing longitudinal direction, infinite
length surface crack subjected to inner pressure
Model 2 is a Cylinder containing longitudinal direction, infinite length surface
crack as shown in Figure 3.10.
Figure 3.10 Cylinder – Surface Crack, Longitudinal Direction, Infinite Length [2]
The geometry indices of Y(a) and L(a) are also defined according to the existing
expression given in API579 as follows
2 4
0.25
0.25
1.1 4.95 1.092
0.2 1 10 20
0.125 0.25 5 10
i i
i i
a aY a
t t
R R
t t
R R
t t
(3.5)
2
2
1 2 2
1
a a a
t t tL a
a
t
(3.6)
The Ri/t is assumed to be 10 in this investigation. The results of 9 cases of
combination of target β (2.0, 3.09, 4.75) and COVS (0.1, 0.2, 0.3) are shown in Figure
3.11, 3.12, and 3.13.

26
Figure 3.11 Underestimation of Pf when API579 PSFs are applied to model 3 for the cases that
target β=2.0 (Pf=0.023), (a) COVS=0.1, (b) COVS=0.2, (c) COVS=0.3
(a)
(b)
(c)
27
Figure 3.12 Underestimation of Pf when API579 PSFs are applied to model 3 for the cases that
target β=3.09 (Pf=0.001), (a) COVS=0.1, (b) COVS=0.2, (c) COVS=0.3
(c)
(b)
(a)

28
Figure 3.13 Underestimation of Pf when API579 PSFs are applied to model 3 for the cases that
target β=4.75 (Pf=10-6
), (a) COVS=0.1, (b) COVS=0.2, (c) COVS=0.3

29
3.2.4 Other models
We also investigate the applicability of API579 PSFs for other 4 models including
1) cylinder containing inner longitudinal direction semi-elliptical surface crack 2)
cylinder containing inner circumferential direction semi-elliptical surface crack, 3) inner
circumferential direction long surface crack, 4) embedded circumferential direction long
surface crack.
The results are nearly same as those of 3 models given above. In the region of
brittle fracture, the Pfs are not evaluated precisely by the API579, therefore these PSFs
should not be applied to evaluate the real models; while in the region of plastic collapse
region, when the crack is shallow (elliptical surface crack: a/t <0.3; long surface crack:
a/t <0.1), these API579 PSFs are applicable.

30
Chapter 4. Development of Partial Safety
Factors
PSF calculations of models 4.1
4.1.1 PSFs calculated from real models
Results given in Chapter 3 showed that the API579 PSFs are not able to evaluate
the Pf precisely in most of the cases. It is necessary to develop a new group of PSFs to
be used for an approximate evaluation. For this purpose, we calculate actual PSFs for
the real models, and generate a new group of new PSFs from these PSFs. The
methodology has been introduced in Chapter 2, and the random independent variables
are assumed as the same as shown in Table 3.1.
The calculation results of model 1, when the target reliability β0 = 3.09, COVS = 0.1,
a/t = 0.1, 0.2, 0.3 are shown in Figure 4.1. It can be seen that when the crack depth
increases, the PSFs of crack dimension reach a higher value; while the PSFs of stress
and toughness change oppositely.
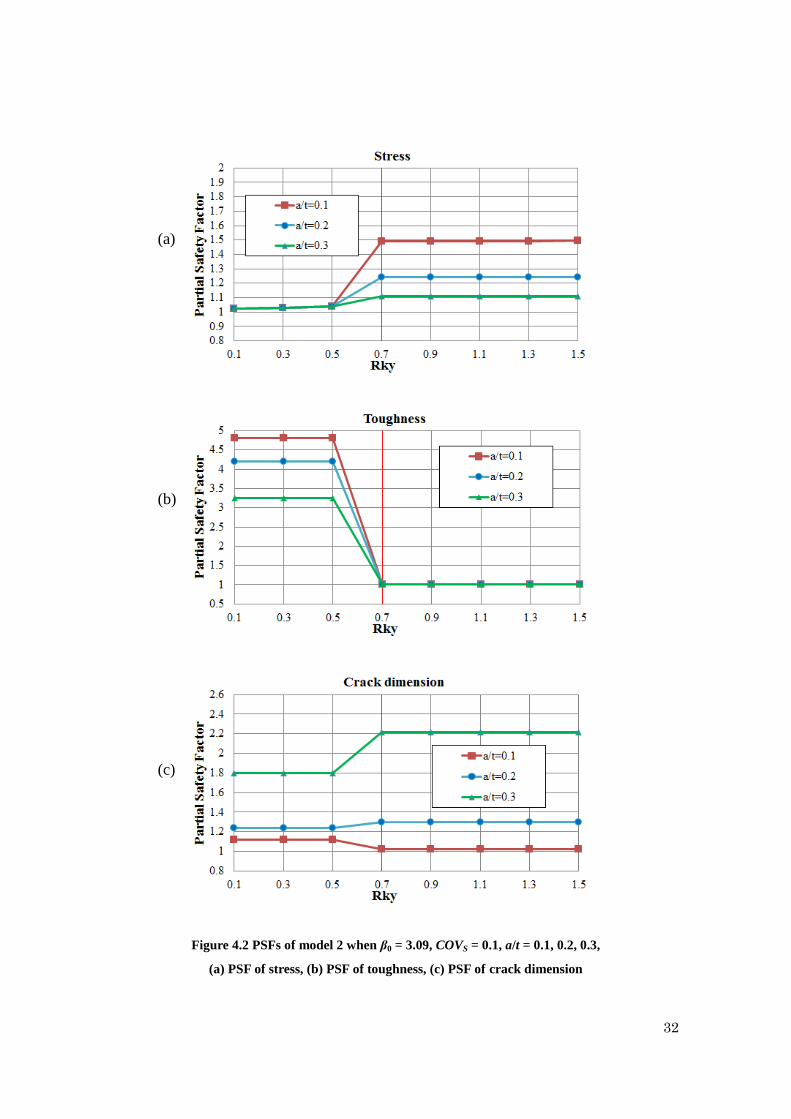
The results of model 2 when the target reliability β0 = 3.09, COVS = 0.1, a/t = 0.1,
0.2, 0.3 are shown in Figure 4.2. The PSFs are changes enormously when the crack gets
deeper. The results of model 3 of the same case are shown in Figure 4.3.
It is shown in 3 groups of results that when the crack depth increases, in the region
of brittle fracture, the PSF of crack dimension increased, and the PSF of toughness
decreased; while in the region of plastic collapse, the PSF of crack dimension also
increased, and the PSF of stress decreased. This is because the increase in crack depth
enhanced the dependence of crack dimension on the probability of failure, and the
dependences of other variables were relatively weakened.
It also can be seen that in the brittle fracture region, the PSFs are calculated by
FORM is not as the same as the PSFs given in API579; while in the plastic collapse
region, the PSFs of shallow cracks are nearly agreeing with the API579 PSFs.
Reviewing the results shown in Chapter 3, this disagreements of PSFs resulted the
misestimating of Pf.

31
Figure 4.1 PSFs of model 1 whenβ0 = 3.09, COVS = 0.1, a/t = 0.1, 0.2, 0.3,
(a) PSF of stress, (b) PSF of toughness, (c) PSF of crack dimension
(b)
(a)
(c)
32
Figure 4.2 PSFs of model 2 when β0 = 3.09, COVS = 0.1, a/t = 0.1, 0.2, 0.3,
(a) PSF of stress, (b) PSF of toughness, (c) PSF of crack dimension
(a)
(b)
(c)

33
Figure 4.3 PSFs of model 3 when β0 = 3.09, COVS = 0.1, a/t = 0.1, 0.2, 0.3,
(a) PSF of stress, (b) PSF of toughness, (c) PSF of crack dimension
(c)
(b)
(a)

34
We obtained that when the crack depth a/t is 0.1, the PSFs of three models are
nearly the same. As a result, it is possible to apply these of PSFs of a/t = 0.1 to evaluate
any model of these three.
We also calculated the PSFs of other 4 models mention in Chapter 3, and
researched that when the crack depth is shallow crack (elliptical surface crack: a/t <0.3;
long surface crack: a/t <0.1), for each case of determined target reliability and COVS,
the PSFs are nearly the same value. Therefore, it is possibly to generate one group of
value which could be apply to evaluate all the models with an acceptably error in the
result.
4.1.2 Development of new PSFs
We calculated the cases of β0 = 2, 3.09, 4.75, COVS = 0.1, 0.2, 0.3 and a/t = 0.01,
0.02, 0.03, ~0.3 (long crack a/t = 0.01, 0.02, 0.03, ~0.1). For each case, we recorded the
PSFs in to the excel sheets and use the statistics analysis tool to take the value which
has the least variation. Because in the region of plastic collapse, for the shallow cracks,
the API579 PSFs has enough accuracy in the result of evaluation, we were only to check
whether the PSFs calculated from real models coincide with the API579 PSFs. If they
are not appreciably different, the API579 PSFs would not be substituted by new PSFs.
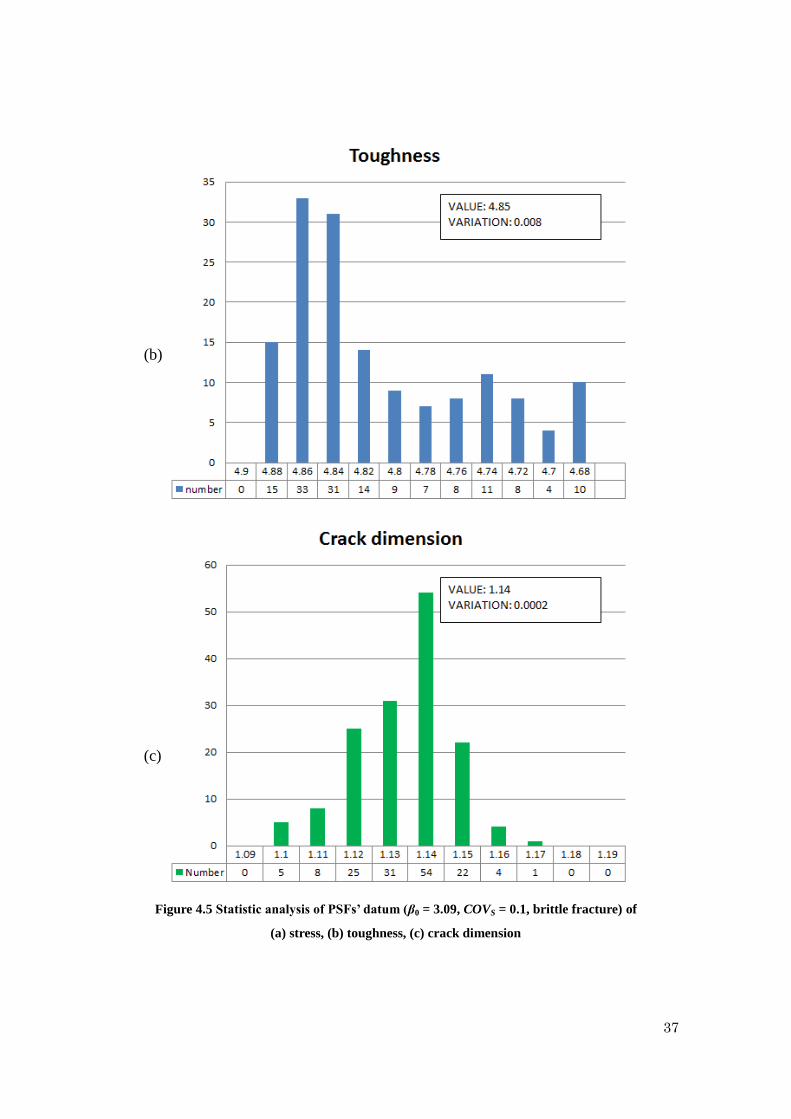
A statistics analysis result when β0 = 3.09, COVS = 0.1 is shown in Figure 4.4 and
4.5. From this analysis, we obtained the value of PSFs of this case as shown below
(Rky>Rc, 1.0 is the value given the API579 PSFs).
Using these approaches, we generated PSFs of every case, and these developed
PSFs are shown in Table 4.1.
β COVs Rc* Rky<Rc Rky>Rc
PSFs PSFk PSFa PSFs PSFk PSFa
3.09 0.1 0.7 1.02 4.75 1.04 1.25 1.0 1.03
(1.0)

35
(a)
(b)

36
Figure 4.4 Statistic analysis of PSFs’ datum (β0 = 3.09, COVS = 0.1, plastic collapse) of
(a) stress, (b) toughness, (c) crack dimension
(c)
(a)
37
Figure 4.5 Statistic analysis of PSFs’ datum (β0 = 3.09, COVS = 0.1, brittle fracture) of
(a) stress, (b) toughness, (c) crack dimension
(b)
(c)

38
Table 4.1 Developed PSFs for shallow cracks
β COVs Rc Rky<Rc Rky>Rc
PSFs PSFk PSFa PSFs PSFk PSFa
2
0.1 0.5 1.02 2.20 1.13 1.25 1 1
0.2 0.5 1.13 2.06 1.13 1.5 1 1
0.3 0.5 1.30 1.90 1.12 1.75 1 1
3.09
0.1 0.7 1.02 4.85 1.14 1.50 1 1
0.2 0.7 1.13 4.51 1.12 2.0 1 1
0.3 0.7 1.32 4.12 1.12 2.50 1 1
4.75
0.1 1.1 1.02 26.9 1.13 2.00 1 1
0.2 1.1 1.14 25.1 1.13 3.10 1 1
0.3 1.1 1.35 22.8 1.13 4.10 1 1
Applicability investigation of developed PSFs 4.2
An applicability investigation of PSFs given in Table 4.1 has conducted. We applied
these PSFs to real model to see whether there is an improvement in the evaluation
results.
The investigation results of applying these PSFs to model 1, 2, 3 are shown in
Figure 4.6, 4.7 and 4.8. Here, we only show the case of COVS=0.1 which is worst case
of the categories of COVS.
Results show that the Pf are evaluated more precisely than API579 PSFs in both of
the failure regions when the component containing a shallow crack. Only at the region
near the cutoff Rc, the Pf is still not evaluated correctly using these Pf. The reason is
considered that near the cutoff Rc, the failure model might be unstable, the limit state
function cannot reflect the limit state of this region correctly, as a result the PSFs of this
region are not able to be calculated accurately. Therefore, using these PSFs may cause
misestimating of Pf. It is better to perform a stress analysis to define the limit state
function by the response surface method.

39
Figure 4.6 Applicability investigation of the developed PSFs on model 1 (COV=0.1)
(a) β0 = 2.0, (b) β0 =3.09, (c) β0 =4.75
(c)
(b)
(a)

40
Figure 4.7 Applicability investigation of the developed PSFs on model 2 (COV=0.1)
(a) β0 = 2.0, (b) β0 =3.09, (c) β0 =4.75
(a)
(b)
(c)

41
Figure 4.8 Applicability investigation of the developed PSFs on model 3 (COV=0.1)
(a) β0 = 2.0, (b) β0 =3.09, (c) β0 =4.75
(c)
(b)
(a)

42
However, it is difficult to define the applicable region for developed PSFs by one
value of crack limit depth. In order to ascertain the misestimating in the approximate
evaluation using developed PSFs, it is necessary to seek out the dominant factor
determining the applicability of these PSFs.
Probabilistic sensitivity 4.3
In the assessment, the various geometries of structures and cracks are expressed by
the geometry indices Y(a) and L(a) which are functions of the crack dimension a.
During seeking the design point in the FORM process, these functions of crack
dimension enhanced the dependence of crack dimension on the Pf and for various
geometries the affections are different. Therefore, to make clear the dependence of crack
dimension on the Pf for different models is helpful to determine the applicable region of
developed PSFs.
Probabilistic sensitivity α is used to measure the dependence of variation of
independent variables on the Pf.
i ix x
i
i Pf i Pf
Pf Pf
x x
(4.1)
Equation 4.1 [5] can be conducted to
**
2
i
i
x i ii i
i Pf x i
xPf
x x
(4.2)
where the *
i is the direction cosine which is a production of the reliability method.
By plotting the values of probabilistic sensitivity of various models and various
COVS, we obtained the relation between the sensitivity and Pf. It is shown that when the
sensitivity of crack dimension is low, the probability of failure maintains a small value
nearly agreeing with the target Pf. However when the sensitivity increases to a high
value, the Pf increases obviously that the underestimating of Pf might reaches ten or
thousands times than target. Also, this is also an explanation for that why the
applicability is influenced by the COVS. When the COVS is chosen a high level, the

43
variation of stress had more influence on the Pf, relatively the influence of crack
dimension is weakened and sensitivity decreased, final the Pf got closer to target Pf
lines [6].
Using the sensitivity to define the applicable region of developed PSFs hasn’t been
a practicable method yet, because the sensitivity requires performing a reliability
method (probabilistic analysis), which might be difficult in same cases. However, this
conclusion
Figure 4.9 Dependence of crack dimension on the probability of failure (β0=2.0)
(a) brittle fracture region, (b) plastic collapse region
(a)
(b)

44
Figure 4.10 Dependence of crack dimension on the probability of failure (β0=3.09)
(a) brittle fracture region, (b) plastic collapse region
(a)
(b)

45
Figure 4.11 Dependence of crack dimension on the probability of failure (β0=3.09)
(a) brittle fracture region, (b) plastic collapse region
(a)
(b)

46
Chapter 5. Conclusions
Applicability of partial safety factors given in API 579
In this paper, we investigated the applicability of API579 PSFs for real models. The
results showed that, when the failure mode is plastic collapse (Rky>Rc,), the API579
PSFs are able to evaluate the component containing shallow cracks for the real models
with various geometries of structure and crack. However, with the increase depth of
crack, these result of the approximate evaluation becomes less precise, the API579 PSFs
should not be used in the evaluation. On the other hand, when the failure mode is brittle
fracture (Rky<Rc,), there is extreme mistake in the assessment result that these PSFs are
not applicable to real models for either shallow or deep cracks.
Development of new partial safety factors
As the API579 PSFs are not applicable in some cases, we developed a new group of
PSFs. These PSFs are generated statistically from the PSFs evaluated from real models
by first order reliability method. It has been shown that, these PSFs could provide a
more accurate evaluation than API579 PSFs when the brittle fracture is the failure
model. However, it is hard to generate a group of PSFs which can be used in the
evaluation for components containing a deep crack. We suggest that for a deeper crack,
it is better to conduct a probabilistic analysis rather than approximate evaluation.
We also found the dominant factor of sensitivity of crack dimension which
determines the applicability of new PSFs. Although this result cannot be used as a
quantitative measurement of the applicability, it still provides help to reduce the
misestimating in the approximate evaluation by improving the degree of accuracy of the
variables’ datum.

47
Acknowledgements
First and foremost, I would like to express my heartfelt gratitude to my advisor
Professor Shinsuke SAKAI and Professor Satoshi IZUMI for giving me the chance to
conduct research at this laboratory, and the valuable guidance in every stage of the
writing of this thesis. Without their enlightening instruction, impressive kindness and
patience, I could not have completed my thesis.
I would also like to extend my thanks to Mr. Junki MAEDA, Mr. Takuyo KAIDA
for their kindness helps. I would also like to thank the stuffs in my laboratory, especially
Miss. Asuka HATANO, and Mr. Hiro TANAKA who have helped me to develop the
fundamental and essential academic competence.
Last but not least, I would like to thank all the members in Sakai-izumi laboratory,
thank them for being kind, friendly and welcoming to me, and also thanks their
encouragement and support.

48
Reference 1. Osage D.A., Wirsching P. H. and Mansour A.E., Application of Partial Safety
Factors For Pressure Containing Equipment, ASME Pressure Vessel and Piping
Conference,(2000).
2. API, Fitness-for-Service ,API 579-1/ASME FFS -1(2007)
3. Yuichi MOGAMI, Shinsuke SAKAI and Tetsuya SASAKI, Evaluation of
Structural Integrity with Partial Safety Factor Method, 2009
4. Amin Muhammed, Background to the derivation of partial safety factors for BS
7910 and API 579, Engineering Failure Analysis 14, (2007), pp.481-488.
5. 戒田 拓洋, 最上 雄一, 泉 聡志, 酒井 信介, API 579-1/ASME FFS -1の
局部減肉評価基準への信頼性手法の適用, 日本機械学会論文集A編, Vol.77,
No.777, p.P736-740(2011)
6. Qiang QU, Satosi IZUMI, Shinsuke SAKAI, Applicability of FFS Assessment
Using Partial Safety Factors Evaluated by Infinite Plate, ASME Pressure Vessel
and Piping Conference,(2013).

49
信
頼
性
に
基
づ
く
構
造
健
全
性
評
価
手
法
の
開
発
Dev
elop
men
t of F
itness-F
or-S
ervice A
ssessmen
t Meth
od
Based
on
Reliab
ility
1
1
6
9
0
7
Qian
g Q
U