MASTER PLAN 2015-2025 - cos.edu
172
Transcript of MASTER PLAN 2015-2025 - cos.edu


MASTER PLAN2015-2025
COLLEGE OF THE SEQUOIAS COMMUNITY COLLEGE DISTRICTBOARD OF TRUSTEESLori Cardoza, PresidentKenneth Nunes, Vice PresidentEarl Mann, ClerkGreg Sherman, TrusteeJohn A. Zumwalt, TrusteeJennifer Cho, Student Trustee
ADMINISTRATIONStan A. Carrizosa, Superintendent/PresidentJennifer Vega La Serna, Ph.D., Vice President, Academic ServicesChristine Statton, Vice President, Administrative ServicesBrent Calvin, Vice President, Student Services


Superintendent/President’s Message ...........................................................................................................................4Mission Statement .........................................................................................................................................................7Acknowledgements .......................................................................................................................................................8Purposes of the Master Plan .......................................................................................................................................11Preparing the Master Plan ...........................................................................................................................................12Executive Summary .....................................................................................................................................................14
CHAPTER 1: BACKGROUNDSequoias Community College District.........................................................................................................................18National, State, and Local Context .............................................................................................................................22
CHAPTER 2: PROFILE OF THE DISTRICT’S COMMUNITIES AND STUDENTSIntroduction .................................................................................................................................................................28Regional population trends and demographics ..........................................................................................................29Local economic trends ................................................................................................................................................34Enrollment trends ........................................................................................................................................................41Student demographics ................................................................................................................................................52Student outcomes .......................................................................................................................................................61Perceptions .................................................................................................................................................................74Current and anticipated challenges ............................................................................................................................77
CHAPTER 3: DISTRICT GOALSDistrict Goal 1 ..............................................................................................................................................................86District Goal 2 ..............................................................................................................................................................86District Goal 3 ..............................................................................................................................................................87District Goal 4 ..............................................................................................................................................................87
CHAPTER 4: PROGRAMS AND SERVICESAcademic Programs ....................................................................................................................................................91Student Services .......................................................................................................................................................122
CHAPTER 5: FACILITIES PLANTulare College Center ................................................................................................................................................147Hanford Educational Center ......................................................................................................................................152Visalia Campus ..........................................................................................................................................................157
TABLE OF CONTENTS

4 College of the Sequoias MASTER PLAN 2015 – 2025
SUPERINTENDENT/PRESIDENT’S MESSAGE
DEAR COLLEAGUES:On behalf of College of the Sequoias, I am pleased to share our 2015-2025 Master Plan.
The Master Plan incorporates our core mission, values, and vision, which build on the rich history of College of the Sequoias.
The intent of the Master Plan is to outline a ten-year projection of the planned needs for the District. College of the Sequoias has experienced many changes and challenges throughout its 87-year existence. Based on historic fluctuations in the state and national economy and the resultant impact on district funding, it is with anticipated continuous uncertainty in our future that we will remain focused on our deep commitment to excellence in teaching, service to students, and the relationships we develop with communities and constituents throughout our region.
The Master Plan is based on an extensive review of relevant data on regional population trends, student demo-graphics, economic development, and state and national education policy, and will set forth broad District Goals. These Goals and accompanying data will guide all other institutional planning and decision-making, including oper-ational and strategic planning, resource allocation, evaluation, and assessment of outcomes.
The Master Plan will initiate development, implementation, and assessment of our District Strategic Plan, which will be reviewed and updated every three years. The Strategic Plan will include measureable District Objectives that align delivery of services, instructional strategies, and allocation of resources to improve student success.
Population trends in our District throughout sections of Tulare and Kings Counties will influence the planning for programs, services, facilities, and staffing to achieve District Objectives.

College of the Sequoias MASTER PLAN 2015 – 2025 5
This Master Plan was developed through a collaborative process set forth in our COS Integrated Planning and Governance and Decision-making Manuals. A Master Plan Task Force comprised of faculty, staff, and administra-tors worked closely with the Institutional Planning and Effectiveness Committee and District Governance Senate to enlist District-wide involvement and participation in the process. Academic Senate led a Master Plan Summit for all interested staff, faculty, board, and community members to engage in shaping the District Goals. The President’s Office dedicated the District-wide Convocation in fall 2014 to a participatory process for all District staff to work on the District Goals. Finally, the Board of Trustees engaged in regular public updates on Master Plan development and formal public readings of the plan prior to its final adoption.
At College of the Sequoias, we are committed to making informed and carefully considered decisions to provide the best and most meaningful educational experience possible for our students. Completion of the Sequoias Communi-ty College District’s ten‐year Master Plan ensures that the District will continue to serve the higher education needs of future generations of students.
Our appreciation and sincere gratitude are extended to the numerous individuals whose efforts and thinking con-tributed to the development of this plan.
Sincerely,
Stan A. CarrizosaSuperintendent/President

6 College of the Sequoias MASTER PLAN 2015 – 2025

College of the Sequoias MASTER PLAN 2015 – 2025 7
MISSION STATEMENT
College of the Sequoias is a comprehensive community college district focused on student learning that leads to productive work, lifelong learning and community involvement.
College of the Sequoias affirms that our mission is to help our diverse student population achieve its transfer and/or occupational objectives and to advance the economic growth and global competitiveness of business and industry within our region.
College of the Sequoias is committed to supporting students’ mastery of basic skills and to providing access to programs and services that foster student success.

8 College of the Sequoias MASTER PLAN 2015 – 2025
ACKNOWLEDGMENTS BOARD OF TRUSTEESLori Cardoza, PresidentKenneth Nunes, Vice PresidentEarl Mann, ClerkGreg Sherman, TrusteeJohn A. Zumwalt, TrusteeJennifer Cho, Student Trustee
SENIOR ADMINISTRATIONStan A. Carrizosa, Superintendent/PresidentJennifer Vega La Serna, Ph.D., Vice President, Academic ServicesChristine Statton, Vice President, Administrative ServicesBrent Calvin, Vice President, Student Services
DISTRICT GOVERNANCE SENATEFACULTY REPRESENTATIVES:Susie Aceron, Human DevelopmentLisa Greer, Work Experience David Hurst, English Donald Nikkel, Social SciencesEd Sense, EnglishStephen Tootle, HistoryPat Twiford, Social Sciences Meng Vang, Counseling
STUDENT REPRESENTATIVES:Alex Bony, Student SenateMaria Garcia, Student SenateJuan Moreno, Student SenateSusan Singkeovilay, Student Senate
STAFF REPRESENTATIVES:Joanne Barkhurst, Accounting Technician, Accounts Payable Shelli Giles, Administrative Assistant, Allied Health & Physical Education
Steve Lamar, Theatre Technician, Fine Arts, CSEA President, (Co-chair)Donna Robinson, College Accountant, Accounts Payable
ADMINISTRATIVE REPRESENTATIVES:John Bratsch, Dean, Human Resources and Legal AffairsBrent Calvin, Vice President, Student Services, (Co-chair)Stan A. Carrizosa, Superintendent/PresidentCindy Delain, Dean, Nursing and Allied Health, Consumer Family Studies, BusinessTim Hollabaugh, Dean, Technology ServicesEric Mittlestead, Dean, FacilitiesJonna Schengel, Ed.D., Director, Physical Therapy Assistant ProgramChristine Statton, Vice President, Administrative ServicesJennifer Vega La Serna, Ph.D., Vice President, Academic Services
INSTITUTIONAL PLANNING AND EFFECTIVENESS COMMITTEEFACULTY REPRESENTATIVES:Juan Arzola, Political Science Milena Seyed, LibraryMarvin Turk, Counseling Gregory Turner, English (Co-chair) Jesse Wilcoxson, Ed.D., Science
STUDENT REPRESENTATIVES:Melissa Alanis, Student SenateNorberto Cervantes, Student Senate
STAFF REPRESENTATIVES:Ryan Barry-Souza, Research Analyst Omar Gutierrez, Payroll/Accounting Coordinator, Payroll Lisa Loewen, Counselor, Counseling Khantee See, Administrative Assistant, Academic Services

College of the Sequoias MASTER PLAN 2015 – 2025 9
ADMINISTRATIVE REPRESENTATIVES:Stephanie Collier, Dean, Student ServicesBelen Kersten, Interim Director, Nursing Lee McDonald, Applications Manager, Technology ServicesMehmet Ozturk, Ph.D., Director, Research, Planning & Institutional Effectiveness Jonna Schengel, Ed.D., Director, Physical Therapy Assistant ProgramJennifer Vega La Serna, Ph.D., Vice President, Academic Services (Co-chair)
MASTER PLAN TASK FORCEFACULTY REPRESENTATIVES:Linda Amaral, Physical Education Jeanne Draper, MathematicsCarol Enns, Social Sciences (Co-chair)Beckee Hobson, Consumer Family Studies Lisa Greer, Work Experience David Hurst, English Renee Marinelli, Business Anne Morris, Nursing Kevin Picciuto, Business Jeff Seaward, Fine Arts Milena Seyed, Library
STUDENT REPRESENTATIVES:Maria Elena Garcia, Student Senate Brenda Ramirez, Student SenateMadeleine Scroggin, Student SenateTrent Terry, Student Senate
STAFF REPRESENTATIVES:Kelly Diaz, Senior Instructional Specialist/Lead CoordinatorElise Garcia, Administrative Assistant, Student Services Darcy Kipnis, Program Specialist, FAO, Student Services Kevin McCusker, Public Info/Marketing Coordinator, Public Information Stephen Meier, Systems Administrator, Technology Services
ADMINISTRATIVE REPRESENTATIVES:Brent Calvin, Vice President, Student ServicesBrent Davis, Associate Dean/Director, Physical Education & AthleticsTim Hollabaugh, Dean, Technology Services Mary-Catherine Oxford, Director, Learning Resource CenterMehmet Dali Ozturk, Ph.D., Director, Research, Planning & Institutional EffectivenessChristine Statton, Vice President, Administrative ServicesJennifer Vega La Serna, Ph.D., Vice President, Academic Services (Co-chair)
SPRING 2014 INTERVIEWSPatti Alvarez, Health ServicesLinda Amaral, Physical EducationChristian Anderson, EconomicsCraig Arnold, Computer ScienceJuan Arzola, Political Science Helen Aviles, Admissions & Records Gwen Aytman, Child DevelopmentAdrian Beltran, Counselor, EOP&SGlenda Bergman, Admissions & RecordsBrian Bettencourt, BusinessJohn Binaski, Fire Technology TrainingMichelle Bolt, Physical EducationJohn Boragno, Physical EducationMatthew Bourez, Mathematics Lisa Brandis, Counseling Amanda Bringe, Allied HealthJanice Brown, Nursing Jared Burch, MathematicsBrent Calvin, Vice President, Student ServicesStan A. Carrizosa, Superintendent/PresidentStephanie Collier, Dean, Student ServicesPura Cordero, ParalegalGlena Crumal, Child Development Alicia Crumpler, Administrative of JusticeBrent Davis, Associate Dean/Director, Physical Education & Athletics Cindy Delain, Dean, Nursing & Allied Health, Consumer Family Studies, BusinessDave DeSilva, AgricultureKelly Diaz, Senior Instructional Specialist/Lead CoordinatorDebbie Douglass, Director, Student Activities & Affairs Jeanne Draper, Mathematics LaDonna Droney, NursingAdrienne Duarte, Title V CounselingKeith Eddy, MathematicsCarol Enns, Philosophy

10 College of the Sequoias MASTER PLAN 2015 – 2025
Valerie Enrlich, EnglishFernando Fernandez, AgricultureJessica Figallo, Dean, Student ServicesPam Flores, Outreach, Career & TransferRichard Flores, Fine ArtsElise Garcia, Student ServicesDennis Goebel, Sports MedicineAdolfo Gonzales, Student Senate Rolando Gonzales, Industry & TechnologyLisa Greer, Work ExperienceRebecca Griffith, Child DevelopmentTeresa Guadianna, CounselingRobert Hansen, BiologyGina Haycock, LibrarianEric Hetherington, Ph.D., GeologyBeckee Hobson, NutritionSan Dee Hodges, Child DevelopmentTim Hollabaugh, Dean, Technology ServicesChris Keen, MathematicsGreg Keen, Assessment & TestingBelen Kersten, Interim Director, Nursing Darcy Kipnis, Financial Aid Barbara Laird-Jackson, ESLLisa Loewen, CounselingDennis Lukehart, Ph.D., Nursing Renee Marinelli, Business & ComputersDon Mast, Director, Disability Resource CenterKevin McCusker, Public Information James McDonnell, Fine ArtsJudy Menezes, JournalismKevin Mizner, Police TrainingJuan Moreno, Student SenateAnne Morris, Nursing Ashley Muniz, Veterans Services
Larry Owens, Ph.D., Engineering/PhysicsMilli Owens, NutritionMary-Catherine Oxford, Director, Learning Resource CenterMehmet Dali Ozturk, Ph.D., Director, Research, Planning & EffectivenessTerri Paden,D.N.P., Nursing Irv Pankey, Physical EducationKim Pitigliano, AgricultureMarla Prochnow, Ed.D, Anthropology Chaumonde Pyatt, Fine ArtsKaren Roberts, Dean, Arts & Letters, Learning Resource CenterDave Robinson, EnglishKristin Robinson, Ph.D., Provost, Hanford Educational CenterJulie Rodriguez, ChemistryRoss Rueger, MathematicsShirin Sadeh, Physical Science/Physics Jonna Schengel, Ed.D, Director, Physical Therapy Assistant ProgramNancy Schneider, Nursing Jeff Seaward, Fine ArtsMilena Seyed, LibraryMike Shuman, Matriculation, CounselingAnnie Silva, SociologyJanell Spencer, AccountingLandon Spencer, EnglishChristine Statton, Vice President, Administrative ServicesAllyson Sullivan, Fine ArtsGailerd Swisegood, Social SciencesFrank Tebeau, Agriculture Trent Terry, Student SenateRegina Trevino, Admissions & RecordsMarvin Turk, CounselingGregory Turner, English
Robert Urtecho, Ph.D., Dean, Science, Mathematics & Engineering, Social ScienceSandy Valenzuela, CounselingMeng Vang, CounselingBenita Vega, Financial Aid Jennifer Vega La Serna, Ph.D., Vice President, Academic ServicesVeronica Vidales, SpanishLouann Waldner, Ph.D., Dean, Career Technical Education Dave Wheeler, CriminologyJesse Wilcoxson, Ed.D., BiologyAnna Williams, Counseling
ACADEMIC SENATE EXECUTIVE OFFICERSThea Trimble, Ph.D., PresidentGregory Turner, Vice PresidentSondra Bergen, Secretary/State RepresentativeLinda Amaral, Committee AJoni Jordan, Curriculum Coordinator/Outcomes and Assessment/GE CommitteeDeborah Nolan, Ph.D., DECOS and FECAlicia Crumpler, Equity Committee

College of the Sequoias MASTER PLAN 2015 – 2025 11
PURPOSES OF THE MASTER PLAN
The College of the Sequoias Master Plan 2015-2025 is a long-term plan that identifies and analyzes the programs and services that the District provides to its students and communities.
The plan is grounded in an analysis of both internal realities, such as the District’s current programs and services, and external influences, such as demographic trends and the local educational interests and workforce needs. That information is used to forecast the chal-lenges that the District will be called upon to address in the coming decade. In this document, these data and challenges are followed by a description of the District’s current and planned facilities.
This Master Plan is a comprehensive data-informed plan that was developed with broad-based collaboration for the following purposes.
• Assess the District’s success in meeting its mission and, based on that assessment, identify its current strengths and weaknesses
• Analyze current state and national trends in higher education and ten-year forecasts of demographic change to project the District’s future challenges and needs
• Develop District Goals that convey the District’s response to these identified challenges
• Connect the District’s educational needs to plans for District facilities
Inform the public of the District’s plans for the future
In the District’s cycle of integrated planning, this Master Plan is the foundation for other planning efforts as de-picted in the following diagram.
12 College of the Sequoias MASTER PLAN 2015 – 2025
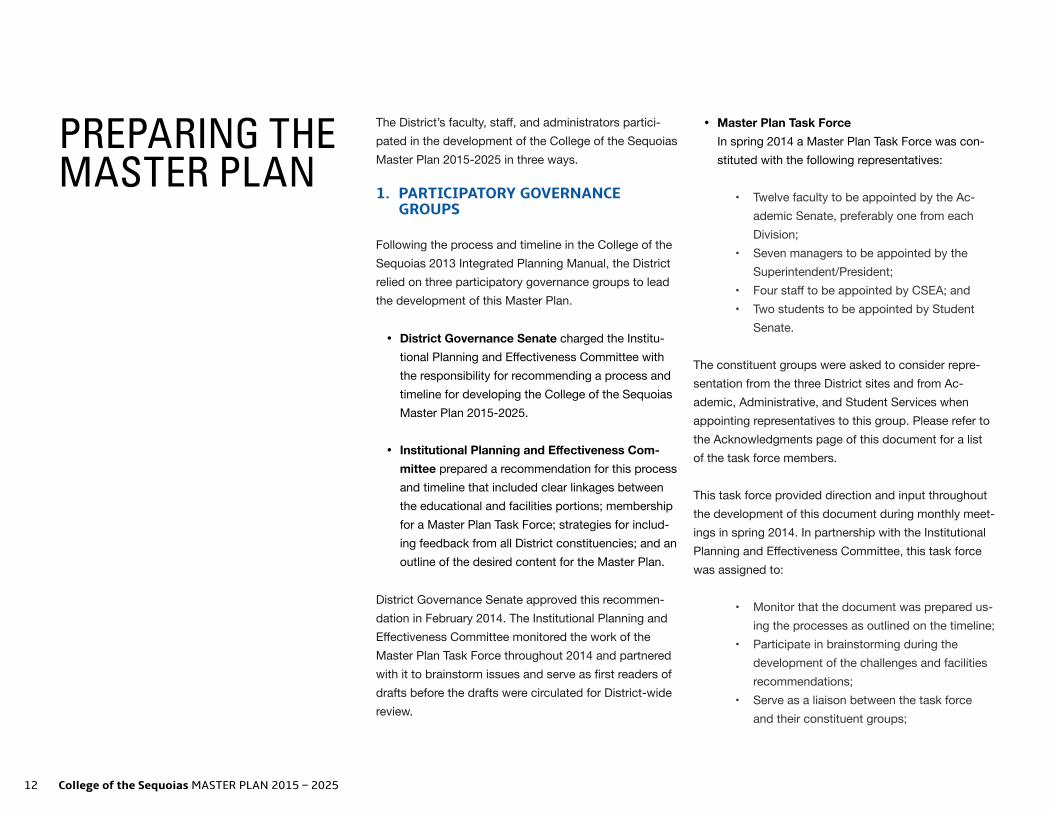
PREPARING THE MASTER PLAN
The District’s faculty, staff, and administrators partici-pated in the development of the College of the Sequoias Master Plan 2015-2025 in three ways.
1. PARTICIPATORY GOVERNANCE GROUPS
Following the process and timeline in the College of the Sequoias 2013 Integrated Planning Manual, the District relied on three participatory governance groups to lead the development of this Master Plan.
• District Governance Senate charged the Institu-tional Planning and Effectiveness Committee with the responsibility for recommending a process and timeline for developing the College of the Sequoias Master Plan 2015-2025.
• Institutional Planning and Effectiveness Com-mittee prepared a recommendation for this process and timeline that included clear linkages between the educational and facilities portions; membership for a Master Plan Task Force; strategies for includ-ing feedback from all District constituencies; and an outline of the desired content for the Master Plan.
District Governance Senate approved this recommen-dation in February 2014. The Institutional Planning and Effectiveness Committee monitored the work of the Master Plan Task Force throughout 2014 and partnered with it to brainstorm issues and serve as first readers of drafts before the drafts were circulated for District-wide review.
• Master Plan Task Force In spring 2014 a Master Plan Task Force was con-stituted with the following representatives:
• Twelve faculty to be appointed by the Ac-ademic Senate, preferably one from each Division;
• Seven managers to be appointed by the Superintendent/President;
• Four staff to be appointed by CSEA; and• Two students to be appointed by Student
Senate.
The constituent groups were asked to consider repre-sentation from the three District sites and from Ac-ademic, Administrative, and Student Services when appointing representatives to this group. Please refer to the Acknowledgments page of this document for a list of the task force members.
This task force provided direction and input throughout the development of this document during monthly meet-ings in spring 2014. In partnership with the Institutional Planning and Effectiveness Committee, this task force was assigned to:
• Monitor that the document was prepared us-ing the processes as outlined on the timeline;
• Participate in brainstorming during the development of the challenges and facilities recommendations;
• Serve as a liaison between the task force and their constituent groups;

College of the Sequoias MASTER PLAN 2015 – 2025 13
• Be the first readers of the document as sec-tions were drafted; and
• Advocate for the purposes and integration of the master plan in the District’s other plan-ning processes.
2. CONTENT-SPECIFIC MEETINGS
To provide an opportunity for content-specific dialogue, representatives of each academic program and student service met with an educational planning consultant to discuss the draft description of that program or service as well as the recommended growth projection. Please refer to the Acknowledgments page of this document for a list of the faculty, staff, and administrators who participated in these interviews.
3. COLLEGE-WIDE PARTICIPATION
Two processes were used to promote District-wide par-ticipation in the development of this document:
• A Master Plan website was established to inform the internal and external community about the planning process. Information posted on this site included committee membership, drafts of the doc-ument, meeting agendas and minutes, and Power-Point presentations.
When drafts of a section of the Master Plan had been reviewed by the Master Plan Task Force and the In-stitutional Planning and Effectiveness Committee and revised, the second draft of that section was distributed District-wide for review and comment. The Master Plan
Task Force used feedback from this District-wide review to prepare the subsequent drafts of the document.
• In 2014 two Open Forums, an Academic Sum-mit, and Fall Convocation were held to encourage District-wide participation in the development of the Master Plan. Audience members were encouraged to ask questions during these presentations and the PowerPoint presentations were posted on the Master Plan website following the meetings.
• Open Forum on February 10, 2014: Introduction to the College of the Sequoias Master Plan 2015-2025 process and timeline
• Open Forum on April 29, 2014: Update on the College of the Sequoias Master Plan 2015-2025 process and timeline
• Academic Senate Summit in May 3, 2014: Review and brainstorm the analysis of current and antic-ipated challenges and draft District Goals 2015-2025
• Fall Convocation in August 8, 2014: Introduce and provide feedback on the analysis of current and anticipated challenges and draft District Goals 2015-2025
Feedback from each of these events was incorporated into the Master Plan.

14 College of the Sequoias MASTER PLAN 2015 – 2025
EXECUTIVE SUMMARY
The College of the Sequoias Master Plan 2015-2025 is a long-term plan that identifies and analyzes the programs and services provided to the District’s students and communities. As such, this document is foundational for other components in the District’s integrated planning processes, all of which are developed to increase the District’s effectiveness in providing enriching programs and services for students and in increasing their suc-cess.
Chapter 1: Background describes the District’s geo-graphic location, adjacent community college districts, and a general overview of the District’s programs and services as well as the current local, state, and nation-al economic and higher education context. Located in the agriculturally rich San Joaquin Valley in Central California, this community college was established as Visalia Junior College in 1926. In fall 2013 COS served approximately 11,000 students as a single-college district with three locations: Visalia Campus, Hanford Educational Center, and Tulare College Center. Each site provides general education courses as well as at least one unique career technical education program. The economic conditions in the District’s communities remain depressed, but growth in both population and employment are projected for this region. College of the Sequoias is in sync with the current national and state dialogue on student success and places a high priority on the benchmarks related to student success as a way to measure the fulfillment of its mission.
Chapter 2: Profile of the District’s Communities and Students presents and analyzes internal and external scan data to assess the District’s effectiveness in ful-
filling its mission and to identify the challenges that the District currently faces or are likely to arise in the next decade. The population of Kings County is projected to increase 35% between 2010 and 2030 and in Tulare County by 42% in the same time period, which is an average increase of about 1.5% each year for the next 20 years. Although the current unemployment rates for this region are higher than the state and national rates, economic forecasts predict that employment opportuni-ties will increase in the next decade. Following student headcounts of almost 14,000 students in fall 2008 and fall 2009, the District’s student headcount reached a low of 11,052 students in fall 2013 due to reductions in state funding. Given these data on population growth and recent student enrollment, the District set an overall growth target for the term of this comprehensive master plan of 1.75% per year for each of the next ten years.
The proportion of College of the Sequoias students enrolled in a full-time load of 12 or more credit units is slightly higher than the statewide proportion, 35% and 31% respectively in fall 2013. The District’s students are relatively youthful, with 66% below 24 years of age, which is higher than the statewide 55%. A little over 70% of first-time students are the first in their families to attend postsecondary education. Thirty-eight percent of first-time students were ready for college-level English in 2012/13 and 12% were ready for college-level mathe-matics courses.
Based on the internal and external scans presented in this chapter, the District identified three challenges that it will be called upon to address in the coming decade.

College of the Sequoias MASTER PLAN 2015 – 2025 15
Chapter 3: District Goals responds to the challenges identified in the previous chapter and announces the District Goals for the next ten years.
The District Goals for the term of the College of the Sequoias Master Plan 2015-2025 are:
College of the Sequoias will increase student enrollment relative to population growth and educational and work-force development needs.
College of the Sequoias will improve the rate at which its students complete degrees, certificates, and transfer objectives.
College of the Sequoias will strategically tailor and implement academic programs and student services that match the needs of its unique student population and the demands of ongoing changes in the workforce development.
College of the Sequoias, Board of Trustees, adminis-tration, faculty, and staff will engage in best practices and staff development to sustain effective operational systems for institutional assessment and continuous improvement.
Following the District’s integrated planning model, these goals are intentionally broad enough to cover the ten-year term of this Master Plan and are the foundation for the District’s subsequent planning processes and decision-making, including resource allocations.
Chapter 4: Programs and Services represents a de-scriptive snapshot and brief analysis of each academic program and student service. Although the District anticipates that student headcount and enrollment will increase in the next decade overall contingent on funding, all programs and services will not grow at the same rate. The analysis of each academic program and student service in this chapter culminates in a growth projection for these programs and services as being slower than, at the same rate as, or faster than the pro-jected total college growth of 1.75% per year each year for next decade.
Chapter 5: Facilities Master Plan presents a summary of current facilities, including recent facility expansion, and calculates the District’s future facility space needs by analyzing space utilization and planning standards, current space inventory, and projected growth. Cur-rent facility square footage, and current and projected student headcounts, weekly student contact hours, and full-time equivalent students are all part of this calcu-lation. This chapter analyzes each campus individually in regard to current space inventory and projected needs, utilizing the projected growth rates of 3.0% for the Tulare campus, 3.25% for the Hanford cam-pus, and 1.21% (average) for the Visalia campus. The overall projected growth rate of 1.75% for the District was based on 30 years of historical enrollment growth patterns for the District. This chapter also addresses facilities conditions for the Visalia campus by analyz-ing the facilities condition indices of current buildings. Such indices are not analyzed at the Tulare and Hanford campuses, as those campuses were both built within the last five years. Other important components and
needs are also analyzed, such sustainability, safety, parking, technology, and future projects. Chapter 5 also contains campus footprints and recommendations. Though minimal needs of increased space at the Tulare and Visalia campuses are noted, the greatest need for increased space within the next decade will be at the Hanford campus. Pursuit of additional bond financing for all three campuses by the end of the decade is also recommended.

16 College of the Sequoias MASTER PLAN 2015 – 2025

College of the Sequoias MASTER PLAN 2015 – 2025 17
BACKGROUND
CHAPTER 1
SEQUOIAS COMMUNITY COLLEGE DISTRICT
Geographic Overview
Visalia Campus
Hanford Educational Center
Tulare College Center
NATIONAL, STATE, AND LOCAL CONTEXT
The Economy
Higher Education

18 College of the Sequoias MASTER PLAN 2015 – 2025
BACKGROUND
SEQUOIAS COMMUNITY COLLEGE DISTRICT
GEOGRAPHIC OVERVIEW
Located in the heart of the San Joaquin Valley in Central California, Sequoias Community College District (COS) rests at the foot of the Sierra Nevada mountain range. Founded in 1926, College of the Sequoias serves the residents of Tulare and Kings Counties as a center for higher education and vocational training.
College of the Sequoias is a single-college district that encompasses 2,893 square miles, with 80% of the District’s geographic boundaries in Tulare County, 19% in Kings County, and 1% in Fresno County. The District is located in the center of one of the most productive agricultural regions in the world. Many of California’s 200 commercially produced crops are grown in Tulare, Kings, and Fresno Counties, making agriculture the leading economic engine of the region.
The California Department of Finance projects that the population of Tulare and Kings County, which comprise 99% of the District’s service area, will grow over the next decade. Tulare County, with 443,066 residents in 2010, is projected to reach 575,294 residents by 2025, which is a 30% increase compared to the 2010 popula-tion. Kings County, with 152,656 residents in 2010, is projected to reach 192,147 residents by 2025, which is a 26% increase compared to the 2010 population. (dof.ca.gov)
Tulare County is a moderate-sized rural county of 4,839 square miles. About half of the county is comprised of public land, such as the Sequoia and Kings Canyon National Park and the Sequoia National Forest. The
remainder of the county is noted for being the second leading producer of agricultural commodities in the United States. The communities in Tulare County within the College of the Sequoias boundaries include, but are not limited to: Exeter, Farmersville, Lindsay, Goshen, Orosi, Three Rivers, Tulare, Visalia, and Woodlake. Visa-lia, the county seat, is the largest of these with 127,081 residents in 2012.
Kings County is a small rural county of 1,392 square miles comprised primarily of agricultural land. The com-munities in Kings County within the COS boundaries are Corcoran and Hanford. Hanford, the county seat, is the largest of these with 54,324 residents in 2012.
College of the Sequoias is part of the California Com-munity College system, the largest system of higher education in the United States, with 112 colleges organized into 72 districts. COS serves as one of the primary opportunities for public higher education in Tu-lare and Kings Counties. There are three districts which border the COS District. They are Kern Community College District, West Hills Community College District, and State Center Community College District. For com-parison, in the 2012-13 academic year, the two smallest districts in the adjacent area were West Hills Community College District, which served 10,070 students; and College of the Sequoias, which served 13,988 students. State Center Community College District served 47,419 students, and Kern Community College District served 34,792. (The 2012-13 Annual Student Count Report, datamart.cccco.edu)

College of the Sequoias MASTER PLAN 2015 – 2025 19
The closest public universities are CSU Fresno, approx-imately 50 miles from Visalia; CSU Bakersfield, approx-imately 78 miles from Visalia; and UC Merced, approxi-mately 100 miles from Visalia.
Originally, Visalia Junior College was established in 1926 as one department in the city high school. Its initial mission was to provide inexpensive, lower-division postsecondary education to local high school gradu-ates who intended to transfer to a four-year institution. As student interest in higher education increased over the next decade, Visalia Junior College grew. In 1938, a permanent campus was built in Visalia. The college continued to attract more students and the Sequoias Community College District was formed in 1949.
In the late 1990s, the Board of Trustees became aware that COS programs and services could no longer be ac-commodated primarily on the Visalia campus. To keep pace with its growing communities, expand student ac-cess across the District, and contribute to the economic development of Tulare and Kings Counties, the Board made important purchases to increase the capacity:• 500 acres of land to establish a campus in Tulare in
1998; • 180 acres of land to establish a campus in Hanford
in 2001; and• 17.2 acres of land adjacent to the Visalia campus in
three separate purchases since 2001.
The Board of Trustees directed each site to offer one or more unique career technical education program(s) as well as courses to fulfill general education requirements. The Board developed this schema to emphasize the
District-wide importance of career technical education and to provide each campus with the opportunity to share in the District’s successes in career technical ed-ucation. The status of each site is described below and in the Facilities Chapter of this College of the Sequoias Master Plan 2015-2025.
Today, COS offers a variety of transfer, degree, career technical education, community, and contract education programs that may culminate in one of 67 associate de-gree programs, 38 certificates of achievement programs (requiring 18 units or more), and 35 skills certificate programs (requiring 17.5 units or less). These programs articulate with both CSU and UC systems. In fall 2013, over 87 years after it opened, the number of students reached 11,052. Student headcount peaked at 13,988 students in the 2012-2013 academic year with 8,233 credit full time equivalent of students (FTES) and 478 non-credit FTES. (COS data warehouse and datamart.cccco.edu)
VISALIA CAMPUS
As with each District campus site, the Visalia campus offers a comprehensive array of liberal arts and sci-ence offerings on-campus and online that fulfill transfer requirements and/or lead to associate degrees and certificates in a variety of majors.
Career technical education programs that are head-quartered in Visalia include: Nursing and Allied Health, Business, and Consumer Family Studies. It is important to note that while some of these programs are primarily
housed at the Visalia campus, prerequisites for disci-pline courses that are included in the transfer patterns are also offered at other district sites. In addition to these anchor programs, the Visalia campus has special-ized facilities and equipment available to accommodate performances for athletics and the Fine Arts Program, which includes theatre and music.
Instructional programs in Visalia are complemented by a full range of student support services, including but not limited to library resources, matriculation, assess-ment, counseling, admissions and records, a bookstore, District police, a career and transfer center, disabled student programs and services, equal opportunity programs and services, food services, job placement, outreach, student financial aid services, health services, student activities, and tutorial services.
In addition, to the District campuses in Visalia, Tulare and Hanford, the District offers courses in high schools and other community centers as a strategy for providing higher education opportunities to the residents who live in less-heavily populated areas of the District, including Exeter, Three Rivers, Corcoran, and Woodlake. Stu-dents attending these off-site locations are supported through student support services located at each of the three campuses, depending on the proximity of the off-campus site.
Refer to the Facilities Chapter for an overview of current Visalia Campus facilities and planned changes to those facilities.

20 College of the Sequoias MASTER PLAN 2015 – 2025
HANFORD EDUCATIONAL CENTER
For many years College of the Sequoias provided stu-dent access in Kings county by offering courses on high school campuses and community centers in Hanford, which is 23 miles from the Visalia Campus. In 1992, the District leased a facility to establish the Hanford Edu-cational Center. In 2001, the City of Hanford, Hanford Joint Union High School, and College of the Sequoi-as entered into a tenants-in-common agreement to purchase 180 acres on 13th Avenue with plans to build a new high school, a permanent Hanford Educational Center, and a sports complex.
In 2006, the residents of Hanford approved Measure C, a $22 million general obligation bond, to build a permanent educational center in Hanford. This bond enabled College of the Sequoias to construct and equip the campus, which includes the Education Building, the Public Safety Building, and the upgrade to the chem-istry lab on the Sierra Pacific High School campus, in order to leverage expenditures and create a joint use facility. Also as part of the campus, the City of Hanford and COS were successful in an Economic Development Agency Grant, which contributed more than half of the funding for the Vocational Educational Building, which provides instructional space for CTE programs such as the Industrial Maintenance program and electrician training. The total instructional and administrative
space included for the Hanford campus is 55,891 square feet. The facility opened in fall 2010.
Today, the Hanford Educational Center offers basic skills and general education courses in addition to its sig-nature career technical education program, the Tulare/Kings Regional Public Safety Training Center. The Tu-lare/Kings Regional Public Safety Training Center offers the Commission on Peace Officer Standard and Training Basic Police Academy certificate, the fire course asso-ciated with the Associate of Science Fire Program, a firefighter academy, and advanced officer training for peace officers and firefighters. Refer to Chapter 4, the Programs and Services Chapter, for more details on the Police Science and Fire Technol-ogy programs.
Hanford Educational Center students have access to a full complement of student support services, includ-ing but not limited to library resources, matriculation, assessment, counseling, admissions and records, a bookstore, District police, a career and transfer cen-ter, disabled student programs and services, equal opportunity programs and services, food services, job placement, outreach, student financial aid services, health services, student activities, and tutorial services. These services are provided by personnel permanently assigned to this site or by personnel who rotate among the COS sites.
Refer to Chapter 5, the Facilities Chapter, for an over-view of current Hanford Educational Center facilities and planned changes to those facilities.

College of the Sequoias MASTER PLAN 2015 – 2025 21
TULARE COLLEGE CENTER
Similar to the evolution of the Hanford Educational Cen-ter, for many years prior to establishing a center in Tu-lare, College of the Sequoias expanded student access across the District by offering courses in high schools and community centers in this city, which is eight miles from the Visalia Campus. In addition, College of the Se-quoias operated a student farm on a property located at Linwood and Walnut. What had been on the outskirts of town when built eventually landed within city limits and was not an ideal place for agriculture education, without any ability to grow. In 1998, the District purchased the 500-acre site in Tulare to house the Center for Agri-culture Science and Technology and provide general education courses to the residents of southern Tulare County.
The Tulare College Center opened in January 2013 and is adjacent to Mission Oak High School. The facility cur-rently includes over 90,000 square feet of classrooms; laboratory space with a 12,000 square foot welding and construction shop; and extensive equine, livestock, farm, and horticulture facilities. These laboratories provide students with unique opportunities for hands-on experience related to their chosen agricultural program.
Today, the Tulare College Center offers basic skills and general education courses in addition to a number of signature career technical education programs related to agriculture. Refer to Chapter 4, the Programs and Services Chapter, for more details on the extensive array of agriculture programs.
Tulare College Center students have access to a full complement of student support services, including but not limited to library resources, matriculation, assess-ment, counseling, admissions and records, a bookstore, District police, a career and transfer center, disabled student programs and services, equal opportunity programs and services, food services, job placement, outreach, student financial aid services, health services, student activities, and tutorial services. These services are provided by personnel permanently assigned to this site or by personnel who rotate among the COS sites.
Refer to Chapter 5, the Facilities Chapter, for an over-view on current Tulare College Center facilities and planned changes to those facilities.

22 College of the Sequoias MASTER PLAN 2015 – 2025
BACKGROUND
NATIONAL, STATE, AND LOCAL CONTEXT
THE ECONOMY
The United States is slowly recovering from the most serious economic downturn since the 1930s. The Re-cession (2008-2010) has had a negative impact on every facet of the economy, marked by high unemployment rates, a depressed housing market, and low consumer spending. These economic indices are showing signs of improvement and UCLA economists predict that the unemployment rates will decrease, but that the econ-omy will remain below its pre-Great Recession growth rate. (uclaforecast.com)
The pace of the economic recovery is illustrated by gradual improvements in unemployment rates. The national unemployment rate reached 10% in October 2009, a significant jump from the October 2007 unem-ployment rate of 4.6%. The unemployment rate was steady at 9% or above from October 2009 to October 2011. Since October 2011, the rate has slowly but steadily decreased, reaching 6.7% in December 2013. The national unemployment rate continues to be 6.7% into spring 2014. This current unemployment rate is the lowest it has been since October 2008. (bls.gov)
The economic downturn in California has been especial-ly severe. For example, in December 2006 the state’s unemployment rate was 4.6%, and in January 2010 the rate nearly tripled, reaching 13.2%. California’s un-employment rate was then and continues to be higher than the national unemployment rate. In February 2014 the unemployment rate for California was 8.0%. Only three other states had higher unemployment rates. (bls.gov) The forecast is for California’s unemployment rate
to remain above 7% through 2015. (dof.ca.gov) If this forecast proves to be accurate, it will take seven years after the official end of the Recession in June 2009 be-fore employment in California returns to pre-Recession levels.
Similar to the economic recovery pattern in the state, the unemployment rates in both Kings and Tulare Counties have declined since 2011. In Kings County the unemployment rate of 17.3% in December 2010 dropped to 15.0% in February 2014. In Tulare County the unemployment rate of 17.9% in December 2010 dropped to 15.1% in February 2014. However, Kings and Tulare Counties’ unemployment rates are higher than the state and national rates. (bls.gov and labormar-ketinfo.edd.ca.gov) Refer to the Local Economic Trends section of Chapter 2 in this document for job market forecasts in these two counties.
HIGHER EDUCATION
Based on the belief that college-educated residents are necessary in order to advance its economic, political, and social success, California developed an impressive system of 112 community colleges. The colleges are as diverse as the regions and populations they serve. The largest higher education system in the United States, California community colleges served 2,079,229 stu-dents by headcount, with 1,041,782 full-time equivalent students taking credit courses and 65,659 full-time equivalent students taking non-credit courses in the 2012-2013 academic year. (datamart.cccco.edu) To place these numbers in perspective, 24% of all com-

College of the Sequoias MASTER PLAN 2015 – 2025 23
munity college students in the nation are enrolled at a California community college.
California community colleges are the most cost-effec-tive system of education in the state when compared to K-12 public schools and the UC and CSU systems. For 2012-2013, the state allocated $5,997 for each full-time student, compared to $8,365 a year per student for a K-12 system and $12,506 and $22,428, respectively, at the CSU and UC systems. (ccleague.org)
California’s community colleges today are called upon to continue providing quality higher education while also addressing five inter-related challenges:
INCREASE IN STUDENT DEMANDIn general, student demand for access to communi-ty college programs and services is likely to increase because of students’ interest in career training due to high unemployment rates and because of students’ interest in fulfilling transfer requirements at a community college due to reductions the sizes of freshman classes at CSUs and UCs.
EMPHASIS ON DEGREE AND CERTIFICATE COMPLETION Once the industrialized country with the highest per-centage of young adults with a college degree glob-ally, the United States now ranks 10th. College-age students are now likely to be less well-educated than their parents. The President’s American Graduation Initiative challenges the nation’s postsecondary educa-tion systems to award an additional five million degrees and certificates by 2020. Extrapolating that challenge to community colleges, each California community college
is asked to triple the number of degrees and certificates awarded by 2020. (cccvision2020.org)
This national challenge is especially acute in California because it ranks lower than many other states on resi-dents’ levels of higher education attainment. According to the US Census, 39% of the working adults in Califor-nia aged 25 to 64 have earned an associate degree or higher. According to the Georgetown University Center on Education and the Workforce, 61% of California’s jobs will require postsecondary education as soon as 2018. Taken together, these two data points indicate that the level of educational attainment of California residents is unlikely to meet projected workforce needs. Analysts at the Lumina Foundation project that if the current rate of degree completion continues, 45% of California’s working adults will have earned a college degree by 2025, far short of the 61% that is projected to be needed for the workforce. (luminafoundation.org)
CALIFORNIA ACHIEVEMENT GAP A study by the Institute for Higher Education Leadership and Policy at California State University in Sacramento identified ethnic differences in student achievement. Among the African-American and Hispanic students who attend community colleges, proportionately fewer African-American and Hispanic students (26% and 22% respectively) completed a degree or certificate within six years compared to White and Asian Pacific Islanders (37% and 35% respectively). Proportionately, twice as many white students transfer to a four-year university than Hispanic students. (csus.edu)
FISCAL CHALLENGEState allocations to the California community colleges declined $809 million, or 12%, since 2008-2009. In response to this decrease in state allocations, the colleges reduced programs and services for students. Between 2008-2009 and 2011-2012, the number of course sections decreased 24% and non-credit course sections decreased 38% statewide. As a result, enroll-ment decreased by more than 500,000 students over these years. (californiacommunitycolleges.cccco.edu) Although state apportionment for California community colleges increased for the past two years, the stability of this funding is uncertain.
REGULATORY CHANGESThe Student Success Task Force: In 2011 the Board of Governors charged a task force with studying national best practices and models in order to develop recom-mendations to improve student success in California community colleges. The final report of the Student Success Task Force advances 22 specific recommen-dations, 20 of which are currently being implemented through statutory change, regulatory change, and/or the adoption of best practices. (californiacommunitycol-leges.cccco.edu) Two of these changes are described as follows:
• Priority Registration: Beginning in fall 2014, students in specific categories will have registration priority over other students. (extranet.cccco.edu)
• The Student Success Act of 2012 (SB1456) imple-mented Student Success Task Force recommenda-

24 College of the Sequoias MASTER PLAN 2015 – 2025
tions by providing statutory authority to alter current laws such as the following:
• Matriculation: The bill calls for substantial changes to student support services, including the inclusion of the requirement for students to engage in orien-tation, assessment, and educational planning.
• The Student Success Scorecard: This system of accountability requires each college to measure outcomes, such as successful completion of de-grees, certificates, remedial programs, and career technical training programs. The data are reported by gender, age, and ethnicity and are available online for access by the community. (scorecard.cccco.edu)
• Minimum Academic Standards: The bill requires students to meet minimum academic standards in order to maintain fee waivers.
Student Transfer Achievement Reform Act: Based on research that California community college students routinely transfer to a state university with more than the required 60 semester units, the act outlines provisions for an associate degree for transfer. This legislation requires that community colleges and CSUs collabo-ratively develop transfer degrees that allow students to transfer into specific CSU programs without the CSU requiring additional coursework. Once students complete the 60 units required for this transfer degree, they are guaranteed admission into the California State University system as juniors. College of the Sequoias adopted the Transfer Model Curriculum prepared jointly
by the state Academic Senates for the California State University and the community colleges.
Course Repetition and Repeatability: On-going fiscal constraints in California triggered increased scrutiny of California community college programs and practices. To reduce funding to the community colleges and to provide greater student access to courses, regulatory changes were approved in 2012 that limit the number of times students may take the same course. This modifi-cation has had a profound impact on the visual and per-forming arts, physical education, dance, and kinesiolo-gy, where repeatability is now limited to courses that are required to finish a bachelor’s degree at a transferring state public university. (extranet.cccco.edu)
The pressures to do more with less funding, plus the number of recent regulatory changes creates part of the context in which the District is developing this College of the Sequoias Master Plan 2015-2025.

College of the Sequoias MASTER PLAN 2015 – 2025 25
PROFILE OF THE DISTRICT’S COMMUNITIES AND STUDENTS
Introduction
Regional population trends and demographics
Local economic trends
Enrollment trends
Student demographics
Student outcomes
Perceptions
Current and anticipated challenges
CHAPTER 2

26 College of the Sequoias MASTER PLAN 2015 – 2025
REGIONAL POPULATION TRENDS AND DEMOGRAPHICS
Data Set 1. Current and Projected COS Service Area Population
Data Set 2. Current and Projected COS Service Area Population by Age
Data Set 3. Current and Projected COS Service Area Population by Race/Ethnicity
Data Set 4. COS Service Area Language Spoken at Home by Residents Age 5 and Older
Data Set 5. COS Service Area Level of Educational Attainment for Adult Residents
LOCAL ECONOMIC TRENDS
Data Set 6. COS Service Area Median Household Income
Data Set 7. Employment Projections by Industry
Data Set 8. Employment Forecast for Tulare and Kings Counties
Data Set 9. Largest Growing Occupations by Required Entry-level Education
Data Set 10. National Earnings and Unemployment Rates by Educational Attainment
ENROLLMENT TRENDS
Data Set 11. Student Headcount and FTES
Data Set 12. Student Headcount by Site
Data Set 13. Course Enrollments by Site
Data Set 14. Efficiency by Discipline
Data Set 15. Student Headcount by Area of Residence
Data Set 16. Student Headcount by Number of Units
Data Set 17. Student Headcount by Method of Instruction
STUDENT DEMOGRAPHICS
Data Set 18. Student Headcount by Age and Site
Data Set 19. Comparison of District and Statewide Headcount by Age
Data Set 20. Student Headcount by Gender and Site
Data Set 21. Student Headcount by Race/Ethnicity and Site
Data Set 22. Comparison of District and Statewide Headcount by Race/Ethnicity
Data Set 23. Student Headcount by First Generation College Student Status
Data Set 24. Placement of First-time Students
PROFILE OF THE DISTRICT’S COMMUNITIES AND STUDENTS
INDEX OF DATA SETS

College of the Sequoias MASTER PLAN 2015 – 2025 27
STUDENT OUTCOMES
Data Set 25. Student Success Scorecard: Completion Rates
Data Set 26. Student Success Scorecard: Completion Rates by Age
Data Set 27. Student Success Scorecard: Completion and 30 Units Rates by Preparedness
Data Set 28. Student Success Scorecard: Basic Skills Rates
Data Set 29. Student Success Scorecard: Career Technical Education Rates
Data Set 30. Student Retention Rates in Credit Courses
Data Set 31. Student Successful Course Completion Rates in Credit Courses
Data Set 32. Students’ Successful Course Completion Rates by Race/Ethnicity
Data Set 33. Students’ Successful Course Completion Rates by Age
Data Set 34. Students’ Successful Course Completion Rates by Unit Load
Data Set 35. Student Degree Completion
Data Set 36. Student Certificate Completion
PERCEPTIONS
Data Set 37. Community Perceptions
Data Set 38. Community College Survey of Student Engagement
Data Set 39. Community College Faculty Survey of Student Engagement

28 College of the Sequoias MASTER PLAN 2015 – 2025
PROFILE OF THE DISTRICT’S COMMUNITIES AND STUDENTS
INTRODUCTIONThis chapter provides background information about the demographic and economic characteristics of the District’s service area and its students. These data are clustered in six sections:
• Regional Population Demographics: Current and projected demographic characteristics, such as population, age, race/ethnicity, and educational levels, and income;
• Local Economic Trends: Current and projected employment and industry growth patterns;
• Enrollment Trends: Patterns of student enrollment, such as student headcount by site and by method of instruction;
• Student Demographics: Characteristics of the District’s students, such as age, race/ethnicity, and educational goals;
• Student Outcomes: Measures of student achieve-ment within the District, such as persistence, successful course completion rates, and number of awards; and
• Perceptions: Survey results, such as a recent survey of community perceptions about the District and students’ perceptions about their level of en-gagement in the teaching/learning process.
The final section of this chapter, Current and Antic-ipated Challenges, presents an analysis of the data presented in Chapters 1 and 2 that identifies the chal-lenges that the District will be called upon to address in the coming decade. The data sets in Chapters 1 and 2 are extracted from a variety of resources including state agencies, local agencies, the COS data warehouse, and the COS Office of Research, Planning and Institutional Effectiveness. The specific resource for the information presented in a data set is cited at the bottom of each data set.

College of the Sequoias MASTER PLAN 2015 – 2025 29
PROFILE OF THE DISTRICT’S COMMUNITIES AND STUDENTS
REGIONAL POPULATION TRENDS AND DEMOGRAPHICS
Data Set 1. Current and Projected COS Service Area Population
2010 2020 2025 2030 % Growth from 2010 to 2030
Kings County 152,656 176,647 192,147 205,627 35%
Tulare County 443,066 526,718 575,294 630,303 42%
California 37,309,382 40,643,643 42,451,760 44,279,354 19%
Source: California Department of Finance
• The number of residents living in Kings County is projected to increase 35% between 2010 and 2030 and in Tulare County by 42% in the same time period.
• Each of these increases is an average increase of about 1.5% each year for the next 20 years, which is double the projection that the state population will increase 19% total, or 0.7% per year compounded, over the next 20 years. In other words, the COS Service Area population will grow much faster than the state population.

30 College of the Sequoias MASTER PLAN 2015 – 2025
Data Set 2. Current and Projected COS Service Area Population by Age
Population by Age Group - Tulare County
Age Group 2010 % of Total 2020 % of Total 2030 % of Total
Total (All ages) 443,066 100% 526,718 100% 630,303 100%
Preschool Age (0-4 years) 40,869 9% 45,172 9% 50,647 8%
School Age (5-17 years) 103,089 23% 113,781 22% 130,019 21%
College Age (18-24 years) 47,866 11% 59,092 11% 68,183 11%
Working Age (25-64 years) 209,219 47% 247,452 47% 295,904 47%
Young Retirees (65-74 years) 23,147 5% 36,480 7% 46,663 7%
Mature Retirees (75-84 years) 13,497 3% 17,565 3% 28,619 5%
Seniors (85 or more years) 5,379 1% 7,177 1% 10,268 2%
Population by Age Group - Kings County
Age Group 2010 % of Total 2020 % of Total 2030 % of Total
Total (All ages) 152,656 100% 176,647 100% 205,627 100%
Preschool Age (0-4 years) 12,745 8% 13,125 7% 13,686 7%
School Age (5-17 years) 29,497 19% 33,813 19% 37,141 18%
College Age (18-24 years) 17,680 12% 19,111 11% 22,949 11%
Working Age (25-64 years) 80,701 53% 91,240 52% 100,721 49%
Young Retirees (65-74 years) 6,865 4% 12,200 7% 18,451 9%
Mature Retirees (75-84 years) 3,820 3% 5,160 3% 9,716 5%
Seniors (85 or more years) 1,348 1% 1,998 1% 2,963 1%
Source: State of California, Department of Finance, Population Projections 2010-2060
• The distribution of the population by age over the next 20 years in Tulare and Kings Counties is projected to remain consistent for both School Age and College Age. School Age in Tulare County decreases by 2% and 1% in Kings County. College Age in Tulare County remains the same and decreases by 1% in Kings County.
• The proportion of the population age 65 and older is projected to increase over the next 20 years in Tulare County 9% to 14% and Kings County 8% to 15%.

College of the Sequoias MASTER PLAN 2015 – 2025 31
Data Set 3. Current and Projected COS Service Area Population by Race/Ethnicity
Tulare County Population
Population by Ethnicity 2010 % of Total 2020 % of Total 2030 % of Total% Change
2010 to 2030
American Indian 3,319 1% 4,013 1% 4,810 1% 45%
Asian 13,543 3% 18,327 3% 24,141 4% 78%
Black 5,505 1% 5,722 1% 5,737 1% 4%
Hispanic or Latino 269,012 61% 329,620 63% 397,435 63% 48%
Native Hawaiian and other Pacific Islander* 370 0% 201 0% 490 0% 32%
Multi-Race 5,767 1% 7,173 1% 8,631 1% 50%
White 145,549 33% 161,661 31% 189,058 30% 30%
Kings County Population
Population by Ethnicity 2010 % of Total 2020 % of Total 2030 % of Total% Change
2010 to 2030
American Indian 1,305 1% 1,484 1% 1,641 1% 26%
Asian 5,343 3% 5,689 3% 7,240 4% 36%
Black 10,686 7% 13,136 7% 12,733 6% 19%
Hispanic or Latino 77,595 51% 90,543 51% 108,557 53% 40%
Native Hawaiian and other Pacific Islander 216 0% 255 0% 171 0% -21%
Multi-Race 3,208 2% 4,239 2% 5,267 3% 64%
White 54,303 36% 61,302 35% 70,017 34% 29%
Source: Department of Finance, Population Projections 2010-2060 * Zero indicates less than 1 percent. Note: A large percentage change may have a small effect if the population is relatively small.
• In 2010 the majority of the population in both Tulare and Kings Counties identify themselves as Hispanic or Latino, 61% and 51% respectively.
• The distribution of population across race/ethnicity groups is projected to remain consistent over the next 20 years, other than a slight increase in residents who identify themselves as Hispanic or Latino and a slight decrease in residents who identify themselves as White.

32 College of the Sequoias MASTER PLAN 2015 – 2025
Data Set 4. COS Service Area Language Spoken at Home by Residents Age 5 and Older
Language Spoken at HomeCalifornia Tulare County Kings County
Estimate Percent Estimate Percent Estimate Percent
English only 19,651,209 56% 207,274 52% 80,161 58%
Language other than English 15,130,082 44% 193,438 48% 59,002 42%
Source: U.S. Census Bureau, 2008-2012 American Community Survey
• Forty-eight percent of the residents in Tulare County over the age of five speak a language other than English at home compared to 42% in Kings County and 44% statewide.
Data Set 5a. COS Service Area Level of Educational Attainment for Adult Residents
Educational AttainmentCalifornia Tulare County Kings County
Estimate Percent Estimate Percent Estimate Percent
Less than 9th grade 2,487,399 10% 51,789 21% 14,263 16%
9th to 12th grade, no diploma 2,090,094 9% 28,381 11% 12,198 13%
High school graduate (includes equivalency) 4,988,559 29% 59,653 24% 23,985 26%
Some college, no degree 5,345,201 22% 58,137 23% 23,075 25%
Associate degree 1,861,509 8% 19,691 8% 7,154 8%
Bachelor’s degree 4,667,570 20% 22,355 9% 8,459 9%
Graduate or professional degree 2,676,985 11% 11,014 4% 2,962 3%
Percent high school graduate or higher 81% 68% 71%
Percent bachelor’s degree or higher 31% 13% 12%
Source: U.S. Census Bureau, 2008-2012 American Community Survey
College of the Sequoias MASTER PLAN 2015 – 2025 33
• Thirty-two percent of the residents in Tulare County and 29% of the residents in Kings County who are age 25 and older have not graduated from high school compared to 19% statewide.
• The proportion of adults age 25 and older that have some college education is comparable in Tulare County, Kings County, and statewide, ranging from 22% to 25%. The proportion of adults that have earned an associate degree is 8% for Tulare County, Kings County, and statewide.
• The proportions of adults in Tulare County and Kings County that have earned a bachelor’s degree or higher (13% and 12% respectively) is significantly below the statewide rate of 31% for this level of educational attainment.
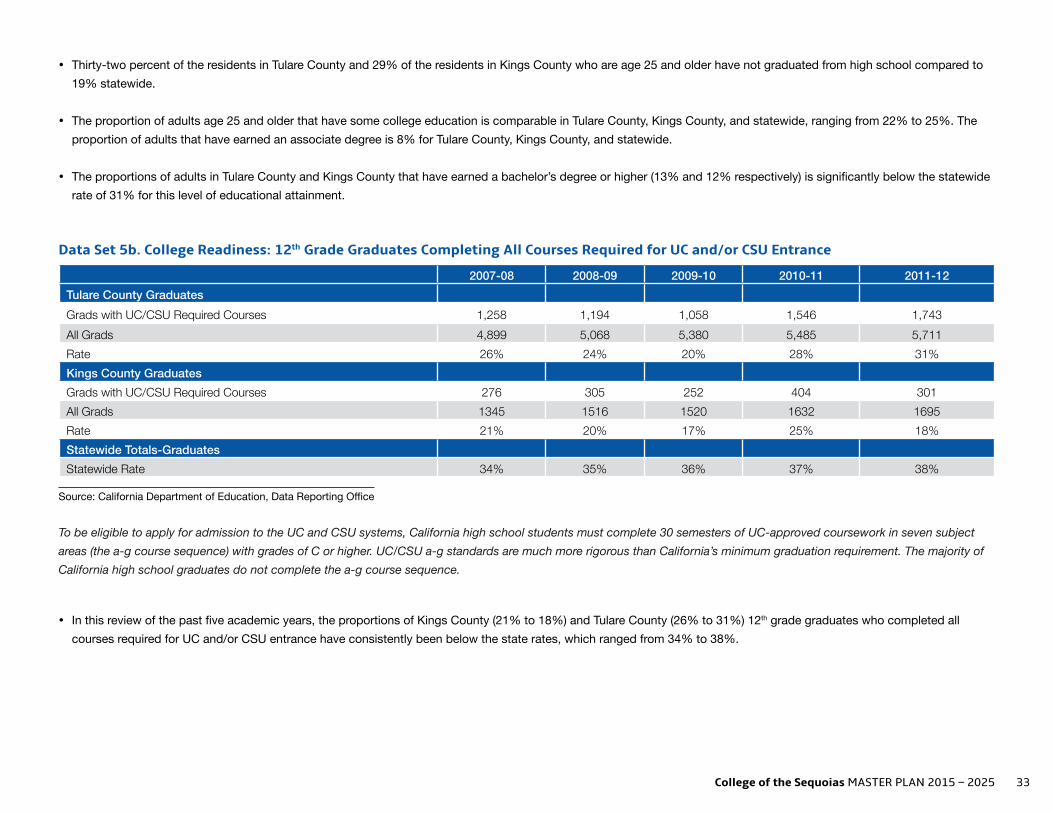
Data Set 5b. College Readiness: 12th Grade Graduates Completing All Courses Required for UC and/or CSU Entrance
2007-08 2008-09 2009-10 2010-11 2011-12Tulare County Graduates Grads with UC/CSU Required Courses 1,258 1,194 1,058 1,546 1,743All Grads 4,899 5,068 5,380 5,485 5,711Rate 26% 24% 20% 28% 31%Kings County Graduates Grads with UC/CSU Required Courses 276 305 252 404 301All Grads 1345 1516 1520 1632 1695Rate 21% 20% 17% 25% 18%Statewide Totals-Graduates Statewide Rate 34% 35% 36% 37% 38%
Source: California Department of Education, Data Reporting Office
To be eligible to apply for admission to the UC and CSU systems, California high school students must complete 30 semesters of UC-approved coursework in seven subject areas (the a-g course sequence) with grades of C or higher. UC/CSU a-g standards are much more rigorous than California’s minimum graduation requirement. The majority of California high school graduates do not complete the a-g course sequence.
• In this review of the past five academic years, the proportions of Kings County (21% to 18%) and Tulare County (26% to 31%) 12th grade graduates who completed all courses required for UC and/or CSU entrance have consistently been below the state rates, which ranged from 34% to 38%.

34 College of the Sequoias MASTER PLAN 2015 – 2025
PROFILE OF THE DISTRICT’S COMMUNITIES AND STUDENTS
LOCAL ECONOMIC TRENDS
Data Set 6a. COS Service Area Median Household Income
Median Income California Tulare County Kings County
Estimate Percent Estimate Percent Estimate PercentFamilies 8,550,034 100% 102,374 100% 31,787 100%
Less than $10,000 359,919 4.20% 7,212 7.20% 2,131 6.70%
$10,000 to $14,999 271,387 3.20% 5,344 6.80% 1,148 3.60%
$15,000 to $24,999 700,897 8.20% 13,142 13.60% 3,456 10.90%
$25,000 to $34,999 719,052 8.40% 13,132 12.80% 3,763 11.80%
$35,000 to $49,999 1,022,505 12.00% 14,876 15.30% 4,954 15.60%
$50,000 to $74,999 1,469,246 17.20% 19,298 18.30% 6,124 19.30%
$75,000 to $99,999 1,128,984 13.20% 10,974 10.00% 3,370 10.60%
$100,000 to $149,999 1,466,601 17.20% 12,098 10.30% 4,503 14.20%
$150,000 to $199,999 679,964 8.00% 3,858 3.50% 1,545 4.90%
$200,000 or more 731,479 8.60% 2,440 2.20% 793 2.50%
Median family income (dollars) 69,883 (X) 47,003 (X) 51,575 (X)
Mean family income (dollars) 94,829 (X) 62,533 (X) 67,193 (X)
Source: U.S. Census Bureau, 2008-2012 American Community Survey
• As measured by both median ($69,883) and mean ($94,829), the statewide family income is significantly higher than the median ($47,003) and mean ($62,533) family income levels for residents in Tulare County and Kings County (Median: $51,575, Mean: $67, 193).

College of the Sequoias MASTER PLAN 2015 – 2025 35
Data Set 6b. COS Service Area Family Poverty Levels
Percentage of Families Whose Income in the Past 12 Months is Below the Poverty Level California Tulare County Kings County
All families 11.50% 20.50% 17.10%With related children under 18 years 17.00% 28.80% 24.30%With related children under 5 years only 15.10% 28.20% 21.00%Married couple families 6.90% 13.90% 9.80%With related children under 18 years 10.00% 20.60% 14.10%With related children under 5 years only 6.80% 18.40% 6.40%
Families with female householder, no husband present 26.60% 40.60% 42.10%
With related children under 18 years 35.60% 48.10% 53.70%With related children under 5 years only 39.30% 47.70% 58.10%
Source: U.S. Census Bureau, 2008-2012 American Community Survey
• Both Tulare County 20.5% and Kings County 17.10% have a significantly greater proportion of families living below poverty level compared to the statewide rate of 11.5%.
36 College of the Sequoias MASTER PLAN 2015 – 2025
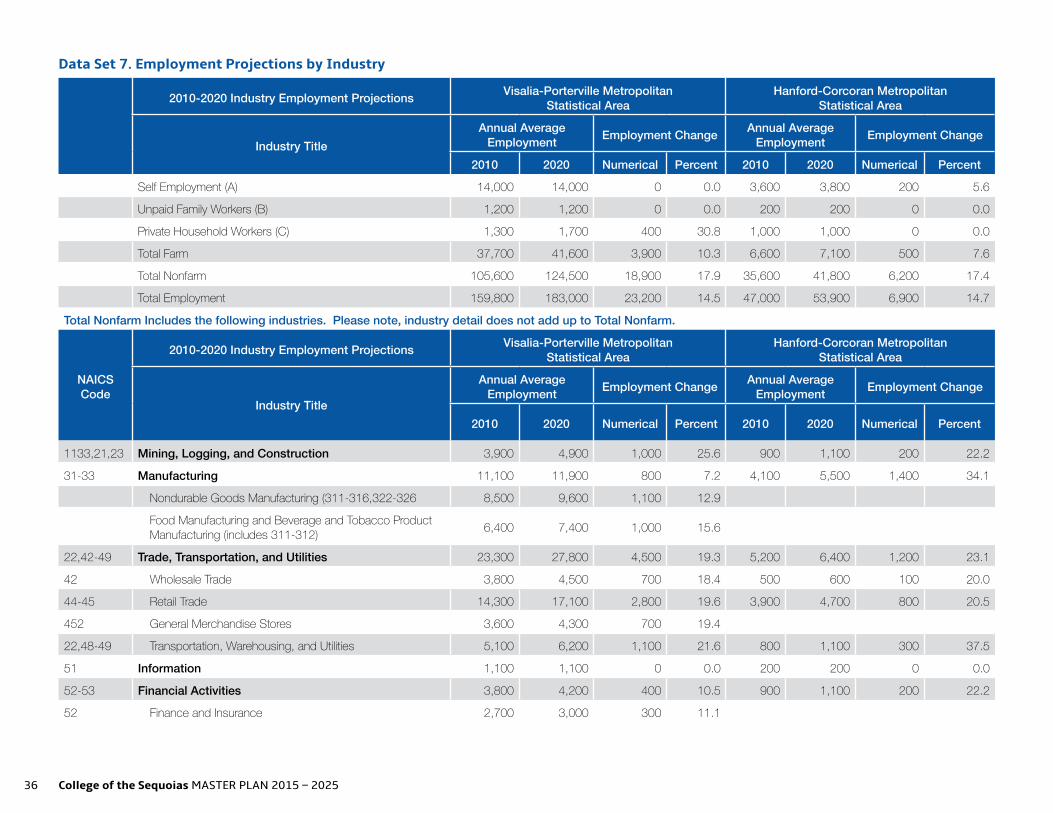
Data Set 7. Employment Projections by Industry
2010-2020 Industry Employment Projections Visalia-Porterville Metropolitan Statistical Area
Hanford-Corcoran Metropolitan Statistical Area
Industry TitleAnnual Average
Employment Employment Change Annual Average Employment Employment Change
2010 2020 Numerical Percent 2010 2020 Numerical Percent
Self Employment (A) 14,000 14,000 0 0.0 3,600 3,800 200 5.6
Unpaid Family Workers (B) 1,200 1,200 0 0.0 200 200 0 0.0
Private Household Workers (C) 1,300 1,700 400 30.8 1,000 1,000 0 0.0
Total Farm 37,700 41,600 3,900 10.3 6,600 7,100 500 7.6
Total Nonfarm 105,600 124,500 18,900 17.9 35,600 41,800 6,200 17.4
Total Employment 159,800 183,000 23,200 14.5 47,000 53,900 6,900 14.7
Total Nonfarm Includes the following industries. Please note, industry detail does not add up to Total Nonfarm.
NAICS Code
2010-2020 Industry Employment Projections Visalia-Porterville Metropolitan Statistical Area
Hanford-Corcoran Metropolitan Statistical Area
Industry Title
Annual Average Employment Employment Change Annual Average
Employment Employment Change
2010 2020 Numerical Percent 2010 2020 Numerical Percent
1133,21,23 Mining, Logging, and Construction 3,900 4,900 1,000 25.6 900 1,100 200 22.2
31-33 Manufacturing 11,100 11,900 800 7.2 4,100 5,500 1,400 34.1
Nondurable Goods Manufacturing (311-316,322-326 8,500 9,600 1,100 12.9
Food Manufacturing and Beverage and Tobacco Product Manufacturing (includes 311-312) 6,400 7,400 1,000 15.6
22,42-49 Trade, Transportation, and Utilities 23,300 27,800 4,500 19.3 5,200 6,400 1,200 23.1
42 Wholesale Trade 3,800 4,500 700 18.4 500 600 100 20.0
44-45 Retail Trade 14,300 17,100 2,800 19.6 3,900 4,700 800 20.5
452 General Merchandise Stores 3,600 4,300 700 19.4
22,48-49 Transportation, Warehousing, and Utilities 5,100 6,200 1,100 21.6 800 1,100 300 37.5
51 Information 1,100 1,100 0 0.0 200 200 0 0.0
52-53 Financial Activities 3,800 4,200 400 10.5 900 1,100 200 22.2
52 Finance and Insurance 2,700 3,000 300 11.1

College of the Sequoias MASTER PLAN 2015 – 2025 37
Data sources: U.S. Bureau of Labor Statistics’ Current Employment Statistics March 2011 benchmark and Quarterly Census of Employment and Wages (QCEW) industry employment. Note: Industry detail may not add up to totals due to independent rounding and suppression. NAICS: North American Industry Classification System (NAICS) is the standard used by Federal statistical agencies in classifying business establishments. (A) Self-employed persons work for profit or fees in their own business, profession, trade, or farm. Only the unincorporated self-employed are included in this category. The estimated and projected employment numbers include all workers who are primarily self-employed and wage and salary workers who hold a secondary job as a self-employed worker. (B) Unpaid family workers are those persons who work without pay for 15 or more hours per week on a farm or in a business operated by a member of the household to whom they are related by birth or marriage. (C) Private household workers are employed as domestic workers whose primary activities are to maintain the household. Industry employment is based on QCEW. (D) Temporary U.S. Census workers are included in the base and projected year employment numbers. • Fifteen percent employment growth is projected for both the Visalia-Porterville and Hanford-Corcoran metropolitan areas.
• Since this forecast focused on the more populated portions of both counties, it is not surprising that nonfarm jobs are projected to add the greatest number of jobs in both metropolitan areas.
• In the Visalia-Porterville metropolitan area the industries projected to add the greater number of jobs are trade, utilities and transportation, professional and business ser-vices, educational services, health care and social assistance, and government.
• In the Hanford-Corcoran metropolitan area the industries projected to add the greater number of jobs are manufacturing, retail trade, trade, utilities and transportation, edu-cational services, health care and social assistance, and government.
54-56 Professional and Business Services 8,700 12,100 3,400 39.1 1,700 2,000 300 17.6
61-62 Educational Services (Private), Health Care, and Social Assistance 10,800 13,900 3,100 28.7 4,500 5,500 1,000 22.2
71-72 Leisure and Hospitality 8,900 10,900 2,000 22.5 2,700 3,400 700 25.9
72 Accommodation and Food Services 8,100 10,000 1,900 23.5
722 Food Services and Drinking Places 7,500 9,400 1,900 25.3
81 Other Services (excludes 814-Private Household Workers) 3,000 3,600 600 20.0 500 600 100 20.0
Government 31,100 34,100 3,000 9.6 15,000 16,000 1,000 6.7
Federal Government (D) 1,500 1,300 -200 -13.3 1,200 1,300 100 8.3
State and Local Government 29,600 32,800 3,200 10.8 13,800 14,700 900 6.5
State Government 2,100 2,200 100 4.8 6,000 6,300 300 5.0
Local Government 27,500 30,600 3,100 11.3 7,800 8,400 600 7.7

38 College of the Sequoias MASTER PLAN 2015 – 2025
Data Set 8. Employment Forecast for Tulare and Kings Counties
Tulare County Employment Forecast (2013-2025)
Employment (thousands of jobs)
Total Wage Farm Construction Manufacturing Transportation
& Utilities
Wholesale & Retail Trade
Financial Activities
Professional Services Information Health &
Education Leisure Government
2013 146.2 34.9 4.6 11.5 5.9 19.8 3.9 10.1 0.9 11.0 9.8 30.6
2015 153.4 36.3 5.6 11.7 6.4 20.6 4.1 11.1 1.0 11.8 10.2 31.3
2017 158.5 37.2 6.1 11.7 6.8 21.1 4.3 11.8 1.0 12.3 10.7 31.9
2019 162.5 37.8 6.4 11.8 7.2 21.4 4.4 12.6 1.0 12.9 10.9 32.4
2021 165.7 38.2 6.6 11.8 7.5 21.8 4.4 13.1 1.0 13.4 11.0 32.9
2023 168.5 38.5 6.7 11.8 7.9 22.3 4.5 13.7 1.0 13.9 11.0 33.3
2025 171.3 38.8 6.7 11.9 8.2 22.7 4.5 14.3 1.0 14.3 11.1 33.7
Kings County Employment Forecast (2013-2025)
Employment (thousands of jobs)
Total Wage Farm Construction Manufacturing Transportation
& Utilities
Wholesale & Retail Trade
Financial Activities
Professional Services Information Health &
Education Leisure Government
2015 44.3 6.5 0.9 0.9 0.9 4.7 1.2 1.6 0.3 4.8 3.0 15.5
2017 45.8 6.7 0.9 0.9 0.9 4.8 1.2 1.7 0.3 4.9 3.2 16.1
2019 47.0 6.9 1.0 1.0 0.9 4.9 1.3 1.8 0.3 5.1 3.3 16.5
2021 47.9 6.8 1.0 1.0 1.0 4.9 1.3 1.8 0.3 5.3 3.4 17.0
2023 49.1 7.0 1.0 1.0 1.0 5.0 1.3 1.9 0.3 5.5 3.5 17.4
2025 50.3 7.3 1.0 1.0 1.0 5.1 1.4 1.9 0.3 5.6 3.6 17.9
Source: California Department of Transportation
• The largest number of jobs in both Tulare and Kings Counties are in farming and governmental agencies. This pattern is projected to continue over the coming decade.
• The two sectors of professional services and farm are projected to experience the most significant increase in the number of jobs in Tulare County over the next decade.
• The three sectors of farm, health and education, and government are projected to experience the most significant increase in the number of jobs in Kings County over the next decade.

College of the Sequoias MASTER PLAN 2015 – 2025 39
Data Set 9. Largest Growing Occupations by Required Entry-level Education (2010-2020)
Entry Level Education
Kings County Tulare County
Largest Growing (New & Replacement Jobs) Jobs Largest Growing (New & Replacement Jobs) Jobs
Bachelor’s Degree
Elementary School Teachers, Except Special Education 250 Elementary School Teachers, Except Special Education 920
Secondary School Teachers, Except Special Ed & CTE 170 Secondary School Teachers, Except Special Ed & CTE 580
Special Education Teachers 100 Kindergarten Teachers, Except Special Education 230
Probation Officers & Correctional Treat’t Specialist 90 Recreation Workers 210
Accountants and Auditors 70 Accountants and Auditors 160
Associate Degree
Registered Nurses 400 Registered Nurses 960
Agricultural & Food Science Technicians 120 General & Operations Mgrs 390
General & Operations Mgrs 110 Preschool Teachers, Except Special Education 140
Radiologic Technologists & Technicians 30 Forest & Conservation Technicians 110
Construction Managers 20 Construction Managers 60
Postsecond-ary Non-degree Award
Firefighters 270 Nursing Aides, Orderlies & and Attendants 310
Licensed Practical & Licensed Vocational Nurses 170 Licensed Practical & Licensed Vocational Nurses 260
Nursing Aides, Orderlies, & Attendants 140 Dental Assistants 160
First-Line Supervisors of Fire Fighting & Prevention Wkrs 70 Heating, Air Conditioning, and Refrigeration Mechanics and Installers 150
First-Line Supervisors of Production & Operat’g Wkrs 60 First-Line Supervisors of Production & Operating Wkrs 120
Some College Computer Support Specialists 40
High School Diploma or Equivalent
Correctional Officers/Jailers 700 Heavy and Tractor-Trailer Truck Drivers 980
Farmers, Ranchers, and Other Agricultural Managers 490 Teacher Assistants 820
Teacher Assistants 260 Office Clerks, General 800
Tractor-Trailer Truck Drivers 240 Customer Service Reps 730
Office Clerks General 240 Farmers, Ranchers, and Other Agricultural Managers 1,650
Less than High School
Cashiers 730 Retail Salespersons 2,230
Retail Salespersons 550 Cashiers 2,030
Combined Food Prep & Serving Workers Inc. Fast Food 470 Combined Food Prep & Serving Workers Inc. Fast Food 1,620
Waiters and Waitresses 280 Laborers and Freight, Stock, and Material Movers, Hand 1,540
Laborers and Freight, Stock, and Material Movers, Hand 250 Farmworkers and Laborers, Crop, Nursery & Greenhouse 11,780
Source: California Employment Development Division
• In both Kings and Tulare Counties, jobs that require little to no formal higher education are plentiful. However, higher levels of educational attainment are predictive of higher greater income and lower unemployment.

40 College of the Sequoias MASTER PLAN 2015 – 2025
Data Set 10. National Earnings and Unemployment Rates for Adults 25 and Older by Educational Attainment
Education AttainedUnemployment
Rate in 2013 Median Weekly
Earnings ($)
Doctoral Degree 2.2% $1,623
Professional Degree 2.3% $1,714
Master’s Degree 3.4% $1,329
Bachelor’s Degree 4.0% $1,108
Associate Degree 5.4% $777
Some College, No Degree 7.0% $727
High School Diploma 7.5% $651
Less Than a High School Diploma 11.0% $472
Source: U.S. Bureau of Labor Statistics, Current Population Survey Note: Data are for persons age 25 and over. Earnings are for full-time wage and salary workers.
• Nationally, adults age 25 and older with the lowest levels of educational attainment have the highest rates of unemployment (11%) and the lowest median weekly earnings ($472).
• The relatively lower level of educational attainment for adults in the COS service area no doubt contributes to this region’s overall lower median household income. (Refer to Data Set 5 and Data Set 6)

College of the Sequoias MASTER PLAN 2015 – 2025 41
PROFILE OF THE DISTRICT’S COMMUNITIES AND STUDENTS
ENROLLMENT TRENDS
Data Set 11a. Student Headcount
ENROLLMENT TRENDS
Data Set 11a. Student Headcount
Fall 2009 Fall 2013 % Change 2009 to 2013
District Total 13,964 11,052 -21%Visalia Campus 12,200 9,932 -19%Hanford Educational Ctr 745 1,394 187%Tulare College Center 550 1,457 264%Other Sites 2,299 775 -66%
Statewide 1,822,842 1,520,472 -17%Sources: COS Data Warehouse, COS Office of Research, Planning, and Institutional Effectiveness, and California Community Colleges Chancellor’s Office: datamart.cccco.edu
Notes: - The District Total is an unduplicated count of all students registered for a course past census. Each student is
counted only once in the District Total even if that student is enrolled in more than one course. However, since students may enroll in a course at more than one campus, the sum of the campus counts is greater than the District Total in this data set.
- These data include the student headcount for both credit and non-credit courses.- Other sites include various locations, such as high schools, community centers, and clinical locations.
• In this review of the past five fall semesters, student headcount reached a high of 13,964 in fall 2009 followed by decreases in each of the subsequent four fall semesters, reaching a low of
Fall 2009 Fall 2010 Fall 2011 Fall 2012 Fall 2013District Total 13,964 13,930 11,764 11,330 11,052Visalia Campus 12,200 12,119 10,645 10,357 9,932Hanford Campus 745 1,536 1,368 1,414 1,394Tulare/Farm Campus 550 662 638 541 1,457Other Sites 2,299 1,695 658 683 775
0
2,000
4,000
6,000
8,000
10,000
12,000
14,000
17
Fall 2009 Fall 2013 % Change 2009 to 2013
District Total 13,964 11,052 -21%
Visalia Campus 12,200 9,932 -19%
Hanford Educational Ctr 745 1,394 187%
Tulare College Center 550 1,457 264%
Other Sites 2,299 775 -66%
Statewide 1,822,842 1,520,472 -17%

42 College of the Sequoias MASTER PLAN 2015 – 2025
Sources: COS Data Warehouse, COS Office of Research, Planning, and Institutional Effectiveness, and California Community Colleges Chancellor’s Office: datamart.cccco.edu Notes: The District Total is an unduplicated count of all students registered for a course past census. Each student is counted only once in the District Total even if that student is enrolled in more than one course. However, since students may enroll in a course at more than one campus, the sum of the campus counts is greater than the District Total in this data set. These data include the student headcount for both credit and non-credit courses. Other sites include various locations, such as high schools, community centers, and clinical locations.
• In this review of the past five fall semesters, student headcount reached a high of 13,964 in fall 2009 followed by decreases in each of the subsequent four fall semesters, reaching a low of 11,052 in fall 2013. This decrease in student headcount reflects the District’s action to limit course offerings in response to the reduction in state apportionment.
• The student headcount within the District decreased 21% between fall 2009 and fall 2013, which is higher than the 17% decrease in student headcount statewide.
• Both Hanford Educational Center and Tulare College Center opened new facilities during this five-year period, in fall 2010 and spring 2013 respectively. As expected, the scheduling of courses at the new facilities and the reduction in offerings at other community sites shifted student headcount from these community sites to the Hanford Educational Center and Tulare College Center. Comparing fall 2009 to fall 2013 the two new facilities gained a total of 1,556 students and the other sites lost a total of 1,524 students during the same period.
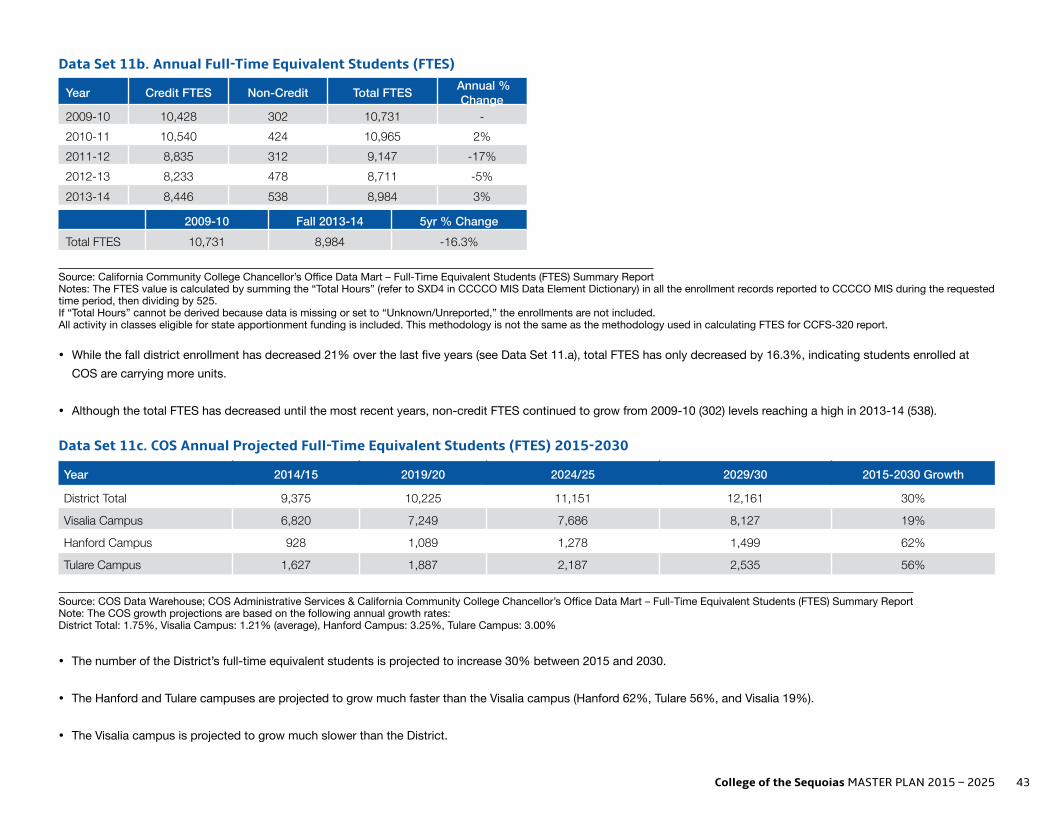
College of the Sequoias MASTER PLAN 2015 – 2025 43
Data Set 11b. Annual Full-Time Equivalent Students (FTES)
Year Credit FTES Non-Credit Total FTES Annual % Change
2009-10 10,428 302 10,731 -2010-11 10,540 424 10,965 2%2011-12 8,835 312 9,147 -17%2012-13 8,233 478 8,711 -5%2013-14 8,446 538 8,984 3%
2009-10 Fall 2013-14 5yr % ChangeTotal FTES 10,731 8,984 -16.3%
Source: California Community College Chancellor’s Office Data Mart – Full-Time Equivalent Students (FTES) Summary Report Notes: The FTES value is calculated by summing the “Total Hours” (refer to SXD4 in CCCCO MIS Data Element Dictionary) in all the enrollment records reported to CCCCO MIS during the requested time period, then dividing by 525. If “Total Hours” cannot be derived because data is missing or set to “Unknown/Unreported,” the enrollments are not included. All activity in classes eligible for state apportionment funding is included. This methodology is not the same as the methodology used in calculating FTES for CCFS-320 report.
• While the fall district enrollment has decreased 21% over the last five years (see Data Set 11.a), total FTES has only decreased by 16.3%, indicating students enrolled at COS are carrying more units.
• Although the total FTES has decreased until the most recent years, non-credit FTES continued to grow from 2009-10 (302) levels reaching a high in 2013-14 (538).
Data Set 11c. COS Annual Projected Full-Time Equivalent Students (FTES) 2015-2030
Year 2014/15 2019/20 2024/25 2029/30 2015-2030 Growth
District Total 9,375 10,225 11,151 12,161 30%
Visalia Campus 6,820 7,249 7,686 8,127 19%
Hanford Campus 928 1,089 1,278 1,499 62%
Tulare Campus 1,627 1,887 2,187 2,535 56%
Source: COS Data Warehouse; COS Administrative Services & California Community College Chancellor’s Office Data Mart – Full-Time Equivalent Students (FTES) Summary Report Note: The COS growth projections are based on the following annual growth rates: District Total: 1.75%, Visalia Campus: 1.21% (average), Hanford Campus: 3.25%, Tulare Campus: 3.00%
• The number of the District’s full-time equivalent students is projected to increase 30% between 2015 and 2030.
• The Hanford and Tulare campuses are projected to grow much faster than the Visalia campus (Hanford 62%, Tulare 56%, and Visalia 19%).
• The Visalia campus is projected to grow much slower than the District.

44 College of the Sequoias MASTER PLAN 2015 – 2025
Data Set 12. Student Headcount by Site
District Site of Students’ Courses Headcount
Visalia Campus Exclusively 7,642
Hanford Educational Center Exclusively 756
Tulare College Center Exclusively 415
Visalia Campus + Hanford Educational Center 559
Visalia Campus + Tulare College Center 897
Hanford Educational Center + Tulare College Center 29
Visalia Campus + Hanford Educational Center + Tulare College Center 45
Subtotal 10,343
Other Sites 436
District Total 10,779
Sources: COS Data Warehouse, EIS: Student Data Touchpoints, and COS Office of Research, Planning, and Institutional Effectiveness Notes: This is an unduplicated count of students; students are counted once regardless of the number of units in which they are enrolled. These data include the student headcount for both credit and non-credit courses. Other sites include various locations such as high schools, community centers, and clinical locations
• In fall 2013, over 1,500 students were enrolled in courses at more than one district campus/site.
897
Visalia Campus7,642 897
45
559 29
Tulare College Center
415
Hanford Educational Center
756

College of the Sequoias MASTER PLAN 2015 – 2025 45
Data Set 13. Course Enrollments by SiteData Set 13. Course Enrollments by Site
Fall 2009 Fall 2013% Change
Fall 2009 to Fall 2013
Average Enrollments per Headcount Fall
2009
Average Enrollments
per Headcount Fall 2013
District Total 49,950 35,386 -29% 3.58 3.20Visalia Campus 44,999 29,046 -36% 3.69 2.92
Hanford Educational Ctr 1,390 2,774 199% 1.87 1.99
Tulare College Center 965 2,613 271% 1.75 1.79
Other Sites 2,596 953 -63% 1.13 1.23Sources: COS Data Warehouse, COS Office of Research, Planning, and Institutional Effectiveness
Notes: - The number of enrollments is the duplicated student headcount. Students are counted once for each course in
which they are enrolled; a student enrolled in three courses is counted three times.- These data include student enrollments for both credit and non-credit courses.- The category of “Other Sites” include various locations, such as high schools, community centers and clinical
locations.
• In this summary of five fall semesters, the number of student enrollments reached a high of 50,489 in fall 2010 followed by decreases in each of the subsequent three fall semesters, reaching a low of 35,386 in fall 2013. This decrease in student enrollments reflects the District’s action to limit course offerings in response to reductions in state apportionment.
Fall 2009 Fall 2010 Fall 2011 Fall 2012 Fall 2013District Total 49,950 50,489 45,197 42,790 35,386Visalia Campus 44,999 44,968 40,443 38,181 29,046Hanford Campus 1,390 2,475 2,789 2,821 2,774Tulare/Farm Campus 965 1,168 1,132 895 2,613Other Sites 2,596 1,878 833 893 953
0
5,000
10,000
15,000
20,000
25,000
30,000
35,000
40,000
45,000
50,000
55,000
21
Fall 2009 Fall 2013 % Change Fall 2009
to Fall 2013
Average Enrollments per Headcount Fall 2009
Average Enrollments per
Headcount Fall 2013
District Total 49,950 35,386 -29% 3.58 3.20
Visalia Campus 44,999 29,046 -36% 3.69 2.92
Hanford Educational Ctr 1,390 2,774 199% 1.87 1.99
Tulare College Center 965 2,613 271% 1.75 1.79
Other Sites 2,596 953 -63% 1.13 1.23
Sources: COS Data Warehouse, COS Office of Research, Planning, and Institutional Effectiveness Notes: The number of enrollments is the duplicated student headcount. Students are counted once for each course in which they are enrolled; a student enrolled in three courses is counted three times. These data include student enrollments for both credit and non-credit courses. The category of “Other Sites” include various locations, such as high schools, community centers and clinical locations.

46 College of the Sequoias MASTER PLAN 2015 – 2025
• In this summary of five fall semesters, the number of student enrollments reached a high of 50,489 in fall 2010 followed by decreases in each of the subsequent three fall semesters, reaching a low of 35,386 in fall 2013. This decrease in student enrollments reflects the District’s action to limit course offerings in response to reductions in state apportionment.
• Although the student headcount decreased 21% between fall 2009 and fall 2013, the number of enrollments decreased 29%.
• The average number of enrollments per student district-wide decreased from 3.58 to 3.20. The decrease in the average number of enrollments per student occurred on the Visalia campus (from 3.69 enrollments per student in fall 2009 to 2.92 per student in fall 2013), while Hanford Educational Center, Tulare College Center, and other sites show a slight increase in the average number of enrollments per student.
Data Set 14. Efficiency by Discipline
Fall 2009 Fall 2010 Fall 2011 Fall 2012 Fall 2013Agriculture 413 419 371 393 340Business 480 494 495 476 430Consumer Family Studies 498 493 574 538 500Fine Arts 535 590 644 605 544Industry & Technology 466 465 455 377 364Language Art 433 435 427 395 379Math 595 617 612 621 630Nursing 278 285 286 266 232Physical Education 385 519 710 711 612Science 539 530 577 583 551Social Science 627 668 714 628 559Special Programs 560 684 562 623 599Student Services 547 358 497 484 677Learning Resource Center 164 131 163 161 388
Note: The figures include outlier data that was excluded in the department trend tables, specifically fall 2009 and fall 2010 COUN and fall 2009 ESL data. Efficiency Defined: The most common statewide measure of efficiency compares the number of hours faculty are with students in class each week (Weekly Student Contact Hours) with the number of equivalent full-time faculty (Full-Time Equivalent Faculty). The state recommendation for this ratio is 525, representing one faculty member teaching five three-unit classes per semester with 35 students in each class.
• In fall 2013, over half (57%) of the divisions had increased efficiency ratios (WSCH/FTEF) from the fall 2009 levels.
• In fall 2013, half (50%) of the divisions had an efficiency ratio greater than or equal to the state recommendation of 525.

College of the Sequoias MASTER PLAN 2015 – 2025 47
Data Set 15. Student Headcount by Area of Residence
• In fall 2013, half (50%) of the divisions had an efficiency ratio greater than or equal to the state recommendation of 525.
Data Set 15. Student Headcount by Area of Residence
Fall 2009Proportion of
Total Fall 2013Proportion of
TotalDistrict Total 13,964 100% 11,052 100%Visalia 6,238 45% 4,872 44%Hanford 1,101 8% 1,024 9%Tulare 2,019 14% 1,725 16%Exeter 607 4% 392 4%Woodlake 350 3% 288 3%Farmersville 331 2% 315 3%Lindsay 291 2% 251 2%Porterville 298 2% 244 2%Others 2,729 20% 1,941 18%
Sources: COS Data Warehouse and COS Office of Research, Planning, and Institutional Effectiveness
Notes:- Student headcount reflects the number of unique students enrolled; each student is counted once no matter how
many courses that student enrolled in for that semester.- These data include the student headcount for both credit and non-credit courses.- Area of resident is drawn from students’ self-reports.- The category of “Others” refers to the smaller areas in Tulare and Kings Counties.
Fall 2009 Fall 2010 Fall 2011 Fall 2012 Fall 2013District Total 13,964 13,930 11,764 11,330 11,052Visalia 6,238 6,009 5,129 4,995 4,872Hanford 1,101 1,295 1,138 1,085 1,024Tulare 2,019 2,022 1,804 1,680 1,725Exeter 607 592 472 462 392Woodlake 350 375 343 324 288Farmersville 331 330 310 318 315Lindsay 291 318 266 258 251Porterville 298 265 223 220 244Others 2,729 2,724 2,079 1,988 1,941
02,0004,0006,0008,000
10,00012,00014,00016,000
23
Fall 2009 Proportion of Total Fall 2013 Proportion of Total
District Total 13,964 100% 11,052 100%
Visalia 6,238 45% 4,872 44%
Hanford 1,101 8% 1,024 9%
Tulare 2,019 14% 1,725 16%
Exeter 607 4% 392 4%
Woodlake 350 3% 288 3%
Farmersville 331 2% 315 3%
Lindsay 291 2% 251 2%
Porterville 298 2% 244 2%
Others 2,729 20% 1,941 18%
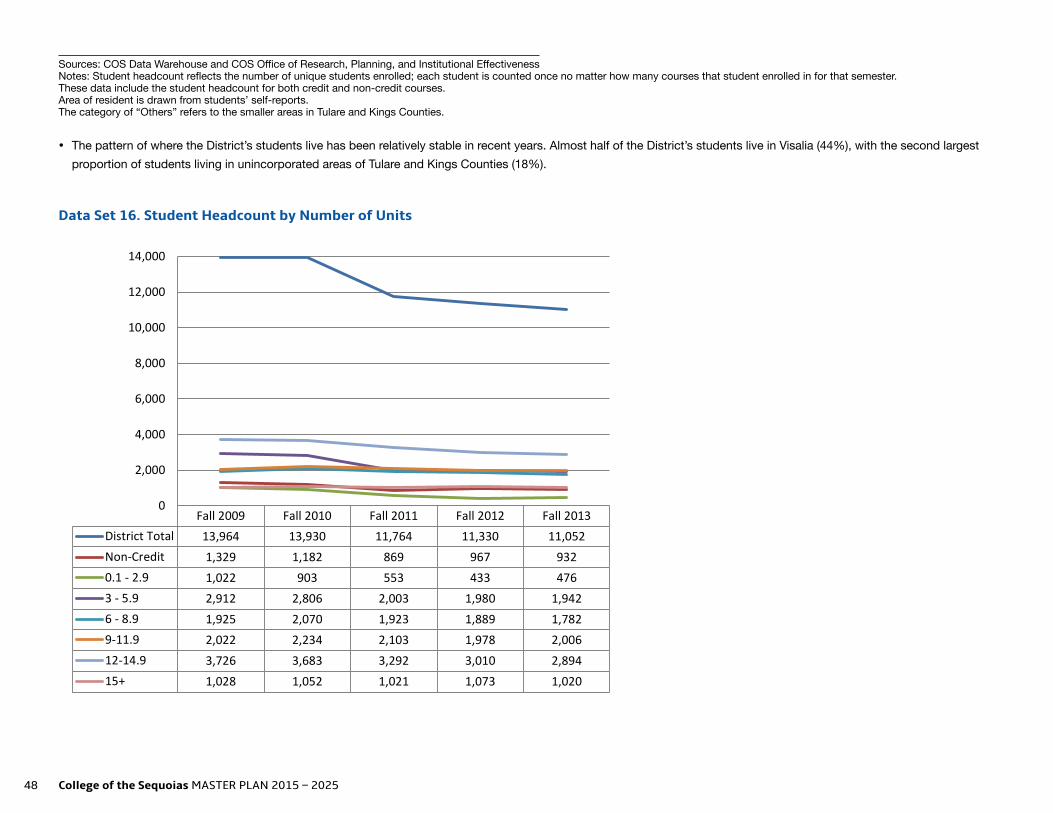
48 College of the Sequoias MASTER PLAN 2015 – 2025
Sources: COS Data Warehouse and COS Office of Research, Planning, and Institutional Effectiveness Notes: Student headcount reflects the number of unique students enrolled; each student is counted once no matter how many courses that student enrolled in for that semester. These data include the student headcount for both credit and non-credit courses. Area of resident is drawn from students’ self-reports. The category of “Others” refers to the smaller areas in Tulare and Kings Counties.
• The pattern of where the District’s students live has been relatively stable in recent years. Almost half of the District’s students live in Visalia (44%), with the second largest proportion of students living in unincorporated areas of Tulare and Kings Counties (18%).
Data Set 16. Student Headcount by Number of UnitsData Set 16. Student Headcount by Number of Units
COS % of Total Statewide % of TotalFall 2009 Fall 2013 Fall 2009 Fall 2013
Total Non-credit 10% 8% 11% 8%Total Credit 90% 92% 89% 92%
0.1-2.9 7% 4% 8% 5%3-5.9 21% 18% 23% 22%6-8.9 14% 16% 16% 18%9-11.9 14% 18% 13% 16%12-14.9 27% 26% 20% 22%15+ 7% 9% 8% 9%
Sources: COS Data Warehouse, COS Office of Research, Planning, and Institutional Effectiveness, and California Community Colleges Chancellor’s Office: datamart.cccco.edu
Note: Student headcount reflects the number of unique students enrolled; each student is counted once no matter how many courses that student enrolled in for that semester.
• The proportions of COS students enrolled in a full-time load of 12 or more credit units were comparable in fall 2009 and fall 2013 (34% and 35% respectively). These proportions of COS students with a full-time credit load were slightly higher than the statewide proportions in the same semesters of 28% and 31% respectively.
Fall 2009 Fall 2010 Fall 2011 Fall 2012 Fall 2013District Total 13,964 13,930 11,764 11,330 11,052Non-Credit 1,329 1,182 869 967 9320.1 - 2.9 1,022 903 553 433 4763 - 5.9 2,912 2,806 2,003 1,980 1,9426 - 8.9 1,925 2,070 1,923 1,889 1,7829-11.9 2,022 2,234 2,103 1,978 2,00612-14.9 3,726 3,683 3,292 3,010 2,89415+ 1,028 1,052 1,021 1,073 1,020
0
2,000
4,000
6,000
8,000
10,000
12,000
14,000
25

College of the Sequoias MASTER PLAN 2015 – 2025 49
COS % of Total Statewide % of Total
Fall 2009 Fall 2013 Fall 2009 Fall 2013
Total Non-credit 10% 8% 11% 8%
Total Credit 90% 92% 89% 92%
0.1-2.9 7% 4% 8% 5%
3-5.9 21% 18% 23% 22%
6-8.9 14% 16% 16% 18%
9-11.9 14% 18% 13% 16%
12-14.9 27% 26% 20% 22%
15+ 7% 9% 8% 9%
Sources: COS Data Warehouse, COS Office of Research, Planning, and Institutional Effectiveness, and California Community Colleges Chancellor’s Office: datamart.cccco.edu Note: Student headcount reflects the number of unique students enrolled; each student is counted once no matter how many courses that student enrolled in for that semester.
• The proportions of COS students enrolled in a full-time load of 12 or more credit units were comparable in fall 2009 and fall 2013 (34% and 35% respectively). These propor-tions of COS students with a full-time credit load were slightly higher than the statewide proportions in the same semesters of 28% and 31% respectively.
• The pattern of the proportions of COS students enrolled in 6 to 11.9 credit units increased slightly from 28% in fall 2009 to 34% in fall 2013, parallel to similar slight increas-es in the statewide proportions from 29% in fall 2009 to 34% in fall 2013.
• The pattern of the proportions of COS students enrolled in 5.9 or fewer credit units decreased slightly from 28% in fall 2009 to 22% in fall 2013, parallel to similar slight de-creases in the statewide proportions from 31% in fall 2009 to 27% in fall 2013.
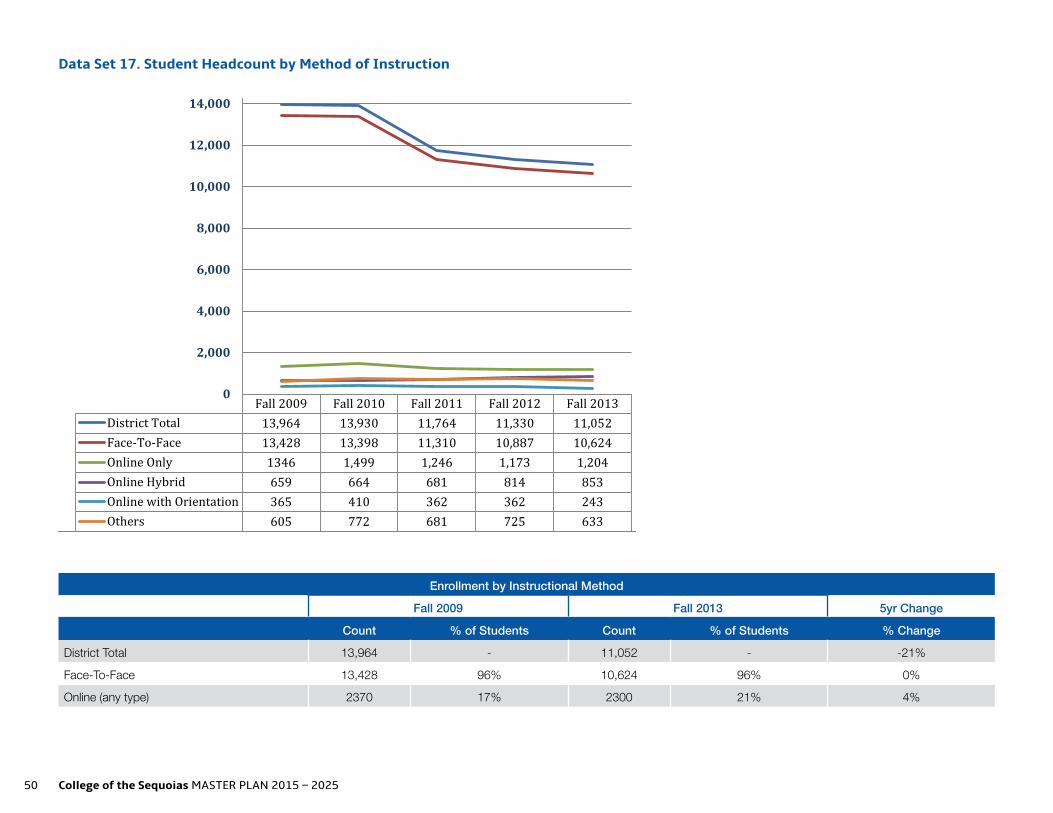
50 College of the Sequoias MASTER PLAN 2015 – 2025
Data Set 17. Student Headcount by Method of InstructionData Set 17. Student Headcount by Method of Instruction
Enrollment by Instructional MethodFall 2009 Fall 2013 5yr Change
Count% of
Students Count% of
Students % ChangeDistrict Total 13,964 - 11,052 - -21%Face-To-Face 13,428 96% 10,624 96% 0%Online (any type) 2370 17% 2300 21% 4%
Source: COS Data Warehouse and COS Office of Research, Planning and Institutional Effectiveness
Notes: - The District Total is an unduplicated count of all students registered for a course past census. Each student is
counted only once in this total even if enrolled in more than one course. However, since students may enroll in courses taught by more than one type of instructional method, the sum of the count by instructional method is greater than the District Total in this data set.
- The category “Online with Orientation” refers to a pilot project in which faculty and students meet once at the start of the semester for an on-campus orientation to the course and to the online teaching/learning environment.
- The category “Others” in this data set includes work experience, tutoring, directed study, field experience, independent study, hybrid video and other instructional activities.
Fall 2009 Fall 2010 Fall 2011 Fall 2012 Fall 2013District Total 13,964 13,930 11,764 11,330 11,052Face-To-Face 13,428 13,398 11,310 10,887 10,624Online Only 1346 1,499 1,246 1,173 1,204Online Hybrid 659 664 681 814 853Online with Orientation 365 410 362 362 243Others 605 772 681 725 633
0
2,000
4,000
6,000
8,000
10,000
12,000
14,000
27
Enrollment by Instructional Method
Fall 2009 Fall 2013 5yr Change
Count % of Students Count % of Students % Change
District Total 13,964 - 11,052 - -21%
Face-To-Face 13,428 96% 10,624 96% 0%
Online (any type) 2370 17% 2300 21% 4%

College of the Sequoias MASTER PLAN 2015 – 2025 51
Source: COS Data Warehouse and COS Office of Research, Planning and Institutional Effectiveness Notes: The District Total is an unduplicated count of all students registered for a course past census. Each student is counted only once in this total even if enrolled in more than one course. Howev-er, since students may enroll in courses taught by more than one type of instructional method, the sum of the count by instructional method is greater than the District Total in this data set. The category “Online with Orientation” refers to a pilot project in which faculty and students meet once at the start of the semester for an on-campus orientation to the course and to the online teaching/learning environment. The category “Others” in this data set includes work experience, tutoring, directed study, field experience, independent study, hybrid video and other instructional activities.
• The District offers almost all instruction through face-to-face methods.
• The proportion of students taking courses in all types of online courses has increased 4% between fall 2009 and fall 2013, though face-to-face enrollment remained un-changed (0%).

52 College of the Sequoias MASTER PLAN 2015 – 2025
PROFILE OF THE DISTRICT’S COMMUNITIES AND STUDENTS
STUDENT DEMOGRAPHICS
Data Set 18. Student Headcount by Age and Site
Fall 2009 Fall 2011 Fall 2013
# of Students
Proportion of Total Students
# of Students
Proportion of Total Students
# of Students
Proportion of Total Students
District Total
19 or less 4,310 31% 3,790 32% 3,238 29%
20-24 4,163 30% 4,038 34% 4,154 38%
25-29 1,788 13% 1,407 12% 1,389 13%
30-49 3,011 22% 2,141 18% 1,942 18%
50 and older 692 5% 377 3% 325 3%
District Total 13,964 100% 11,764 100% 11,052 100%
Visalia Campus
19 or less 3,807 31% 3,506 30% 3,003 26%
20-24 3,909 32% 3,769 34% 3,890 40%
25-29 1,546 13% 1,236 15% 1,197 15%
30-49 2,406 20% 1,826 19% 1,594 17%
50 and older 532 4% 305 2% 249 2%
Sub-total 12,200 100% 10,645 100% 9,933 100%
Hanford Educational Center
19 or less 227 30% 412 30% 359 26%
20-24 200 27% 466 34% 561 40%
25-29 117 16% 199 15% 214 15%
30-49 183 25% 261 19% 231 17%
50 and older 18 2% 30 2% 28 2%
Sub-total 745 100% 1,368 100% 1,393 100%

College of the Sequoias MASTER PLAN 2015 – 2025 53
Fall 2009 Fall 2011 Fall 2013
# of Students
Proportion of Total Students
# of Students
Proportion of Total Students
# of Students
Proportion of Total Students
Tulare College Center
19 or less 170 31% 280 44% 508 35%
20-24 190 35% 197 31% 525 36%
25-29 61 11% 57 9% 189 13%
30-49 97 18% 77 12% 206 14%
50 and older 32 6% 27 4% 29 2%
Sub-total 550 100% 638 100% 1,457 100%
Other Sites
19 or less 706 31% 78 12% 97 13%
20-24 400 17% 147 22% 180 23%
25-29 310 13% 112 17% 128 17%
30-49 720 31% 251 38% 300 39%
50 and older 163 7% 62 9% 66 9%
Sub-total 2,299 100% 658 100% 775 100%
Source: COS Data Warehouse and COS Office of Research, Planning and Institutional Effectiveness Notes: The District Total is an annual unduplicated count of all students registered for a course past census. Each student is counted only once in the District Total, even if that student is enrolled in more than one course. However, since students may enroll in courses at more than one campus, the sum of the campus counts is greater than the District Total in this data set. The category of “Other Sites’ includes various locations, such as high schools, community centers, and clinical locations. Ages are unknown for a small number of students; these data are in the totals and sub-totals but are not included as separate lines this data set.
• About two out of three of District students are age 24 or younger. In fall 2013, 66% to 71% of the students at each District location except “Other Sites” are in the youngest age cohorts.
• The largest proportion of students who attend classes at sites other than the three primary District locations settings is between 30 to 49 years old (fall 2013, 39%).
• District-wide, the proportions of students of younger than 19 and between the ages of 25-29 have been largely consistent. However, the proportions of students between ages 20 and 24 increased (from 30% in fall 2009 to 38% in fall 2013) and the proportions of students aged 50 and older decreased (from 5% in fall 2009 to 3% in fall 2013). The latter shift may be due to the reduction in the number of night sections offered.

54 College of the Sequoias MASTER PLAN 2015 – 2025
Data Set 19. Comparison of District and Statewide Headcount by Age
2012/13 District-Wide Statewide
< 20 years old 32% 24%
20 to 24 years old 35% 32%
25 to 39 years old 25% 27%
40+ years old 9% 17%
Source: California Community Colleges Chancellor’s Office: scorecard.cccco.edu
• District students on the average are younger than the statewide student population, with 67% of District students 24 years old or younger compared to 56% of students in that age cohort statewide in 2012-2013.
• As another measure of the relative youthfulness of the District’s students, the proportion of District students who are age 40 and older is only 9% compared to 17% of the students in the oldest cohort statewide.
Data Set 20. Student Headcount by Gender and SiteData Set 20. Student Headcount by Gender and Site
Enrollments by Gender - District TotalsDistrict Total 2008/09 2010/11 2012/13Totals 18,511 100% 18,243 100% 14,265 100%Female 10,119 55% 9,834 54% 7,788 55%Male 8,214 44% 8,294 45% 6,454 45%Unknown 178 1% 115 1% 23 0%
Enrollments by Gender - Visalia CampusVisalia Campus 2008/09 2010/11 2012/13Totals 14,565 100% 15,649 100% 12,968 100%Female 8,343 57% 8,830 56% 7,288 56%Male 6,153 42% 6,740 43% 5,662 44%Unknown 69 0% 79 1% 18 0%
Enrollments by Gender - Tulare CampusTulare Campus 2008/09 2010/11 2012/13Totals 780 100% 1,032 100% 1,404 100%Female 363 47% 449 44% 632 45%Male 413 53% 581 56% 772 55%Unknown 4 1% 2 0% 0 0%
Enrollments by Gender - Hanford CampusHanford Campus 2008/09 2010/11 2012/13Totals 951 100% 2,334 100% 2,109 100%
2008/09 2009/10 2010/11 2011/12 2012/13Totals 18,511 19,083 18,243 15,069 14,265Female 10,119 10,181 9,834 8,301 7,788Male 8,214 8,708 8,294 6,712 6,454Unknown 178 194 115 56 23
0
5,000
10,000
15,000
20,000
25,000
31

College of the Sequoias MASTER PLAN 2015 – 2025 55
Enrollments by Gender - District Totals 2008/09 2010/11 2012/13Totals 18,511 100% 18,243 100% 14,265 100%Female 10,119 55% 9,834 54% 7,788 55%Male 8,214 44% 8,294 45% 6,454 45%Unknown 178 1% 115 1% 23 0%Enrollments by Gender - Visalia Campus 2008/09 2010/11 2012/13Totals 14,565 100% 15,649 100% 12,968 100%Female 8,343 57% 8,830 56% 7,288 56%Male 6,153 42% 6,740 43% 5,662 44%Unknown 69 0% 79 1% 18 0%Enrollments by Gender - Tulare Campus 2008/09 2010/11 2012/13Totals 780 100% 1,032 100% 1,404 100%Female 363 47% 449 44% 632 45%Male 413 53% 581 56% 772 55%Unknown 4 1% 2 0% 0 0%Enrollments by Gender - Hanford Campus 2008/09 2010/11 2012/13Totals 951 100% 2,334 100% 2,109 100%Female 603 63% 976 42% 1,069 51%Male 343 36% 1,347 58% 1,039 49%Unknown 5 1% 11 0% 1 0%Enrollments by Gender - Other Sites 2008/09 2010/11 2012/13Totals 4,997 100% 2,761 100% 1,028 100%Female 2,445 49% 1,520 55% 564 55%Male 2,441 49% 1,212 44% 458 45%Unknown 111 2% 29 1% 6 1%
Source: COS Data Warehouse and COS Office of Research, Planning and Institutional Effectiveness Notes: The District Total is an annual unduplicated count of all students registered for a course past census. Each student is counted only once in the District Total even if that student is enrolled in more than one course. However, since students may enroll in courses at more than one campus, the sum of the campus counts is greater than the District Total in this data set. Other sites include various locations, such as high schools, community centers, and clinical locations.
• The proportions of males and females in the District student population have remained consistent across this five-year snapshot within the ranges of 54%-55% female stu-dents and 44%-45% male.
• However, the proportions of male and female students differ at the District’s three sites. In 2012-2013 the proportions of male and female students at Visalia campus were 44% and 56% respectively. However, those proportions were reversed for Hanford Educational Center and Tulare College Center, with both locations having more male than female students, 55% and 45% respectively. This difference is due to the differences in the genders of students attracted to the unique career technical educational pro-grams at each location. For example, the police academy moved to the Hanford Educational Center in 2010, which contributed to the reversal of male/female proportions.

56 College of the Sequoias MASTER PLAN 2015 – 2025
Data Set 21. Student Headcount by Site and Race/Ethnicity
Fall 2009 Fall 2011 Fall 2013 Change from 2009 to 2013
# of Students
% of Total Students
# of Students
% of Total Students
# of Students
% of Total Students # of Students
District Total
Alas/Nat. Amer. 77 1% 55 <1% 58 1% -19
Asian 582 4% 526 4% 442 4% -140
Black/Af.-Amer. 403 3% 363 3% 301 3% -102
Hispanic 7,155 51% 6,559 56% 6,411 58% -744
Non-res. Alien 26 <1% 13 <1% 15 <1% -11
Pac. Islander 40 <1% 22 <1% 11 <1% -29
Two or more 486 3% 501 4% 546 5% 60
White 4,697 34% 3,495 30% 2,984 27% -1,713
Unknown 498 4% 230 2% 284 3% -214
District Total 13,964 100% 11,764 100% 11,052 100% -2,912
Visalia Campus
Alas/Nat. Amer. 67 1% 45 <1% 51 1% -16
Asian 555 5% 498 5% 422 4% -133
Black/Af.-Amer. 362 3% 330 3% 282 3% -80
Hispanic 6,262 51% 5,905 55% 5,805 58% -457
Non-res. Alien 26 <1% 13 <1% 15 <1% -11
Pac. Islander 36 <1% 22 <1% 7 <1% -29
Two or more 449 4% 468 4% 511 5% 62
White 4,126 34% 3,174 30% 2,665 27% -1,461
Unknown 317 3% 190 2% 175 2% -142
Sub-total 12,200 100% 10,645 100% 9,933 100% -2,267
Hanford Educational Center
Alas/Nat. Amer. 4 1% 11 1% 11 1% 7
Asian 20 3% 54 4% 51 4% 31
Black/Af.-Amer. 27 4% 52 4% 29 2% 2
Hispanic 356 48% 718 52% 784 56% 428

College of the Sequoias MASTER PLAN 2015 – 2025 57
Fall 2009 Fall 2011 Fall 2013 Change from 2009 to 2013
# of Students
% of Total Students
# of Students
% of Total Students
# of Students
% of Total Students # of Students
Non-res. Alien 0 0% 0 0% 0 0% 0
Pac. Islander 2 <1% 0 0% 3 <1% 1
Two or more 18 2% 46 3% 67 5% 49
White 300 40% 468 34% 427 31% 127
Unknown 18 2% 19 1% 21 2% 3
Sub-total 745 100% 1,368 100% 1,393 100% 648
Tulare College Center
Alas/Nat. Amer. 2 <1% 3 <1% 8 1% 6
Asian 4 1% 7 1% 24 2% 20
Black/Af.-Amer. 7 1% 8 1% 38 3% 31
Hispanic 209 38% 263 41% 803 55% 594
Non-res. Alien 0 0% 0 0% 0 0% 0
Pac. Islander 0 0% 1 <1% 2 <1% 2
Two or more 24 4% 31 5% 64 4% 40
White 293 53% 320 50% 498 34% 205
Unknown 11 2% 5 1% 20 1% 9
Sub-total 550 100% 638 100% 1,457 100% 907
Other Sites
Alas/Nat. Amer. 14 1% 2 0% 1 0% -13
Asian 64 3% 39 6% 35 5% -29
Black/Af.-Amer. 53 2% 10 2% 12 2% -41
Hispanic 1,179 51% 348 53% 408 53% -771
Non-res. Alien 1 <1% 0 0% 1 <1% 0
Pac. Islander 8 <1% 1 <1% 0 0% -8
Two or more 53 2% 18 3% 20 3% -33
White 734 32% 196 30% 189 24% -545
Unknown 193 8% 44 7% 109 14% -84
Sub-total 2,299 100% 658 100% 775 100% -1,524

58 College of the Sequoias MASTER PLAN 2015 – 2025
Source: COS Data Warehouse and COS Office of Research, Planning and Institutional Effectiveness Notes: The District Total is an annual unduplicated count of all students registered for a course past census. Each student is counted only once in the District Total even if that student is enrolled in more than one course. However, since students may enroll in courses at more than one campus, the sum of the campus counts is greater than the District Total in this data set. Other sites include various locations, such as high schools, community centers, and clinical locations. Ages are unknown for a small number of students; these data are in the totals and sub-totals but are not included as separate lines this data set.
• In fall 2013 the two predominate racial/ethnic groups in the District student population were students who self-identify as Hispanic (58%) and those who self-identify as White (27%). The next largest proportions of students were those who self-identify as Two or More Races (5%) and Asian (4%).
• In the past five years, there has been a shift in the District’s student demographics. The proportions of students who self-identify as Hispanic increased from 51% in fall 2019 to 58% in fall 2013. Conversely, students declaring as White decreased from 34% in fall 2009 to 27% in fall 2013. The proportions of students in other racial/ethnic groups remained relatively consistent across these years.
• The same pattern of increases in the proportion of students who self-identify as Hispanic and decreases in those who self-identify as White is seen in the student demo-graphics at all District sites.

College of the Sequoias MASTER PLAN 2015 – 2025 59
Data Set 22. Comparison of District and State Headcount by Race/Ethnicity
2012/13
District-wide Statewide
African-American 3% 7%
American Indian/Alaska Native 1% 1%
Asian 4% 12%
Filipino 1% 3%
Hispanic 58% 38%
Pacific Islander 0% 1%
White 29% 30%
Two or More Races 3% 3%
Unknown Ethnicity 3% 6%
Source: California Community Colleges Chancellor’s Office: scorecard.cccco.edu
• In race/ethnicity demographics, the two predominant groups in both the District and statewide are students who self-identify as Hispanic (District: 58%, State: 38%) and White (District: 29%, State: 30%.)
• Compared to the statewide demographics, the District student population includes a higher proportion of Hispanic (58%) students and lower proportions of African-Ameri-can (3%) and Asian students (4%).
Data Set 23. Student Headcount by First-Generation College Student Status
2011/12 % of Total 2012/13 % of Total 2013/14 % of Total
District Total 3,277 3,078 3,064
First-Generation 2,322 71% 2,118 69% 2,022 66%
Not First-Generation 692 21% 666 22% 706 23%
Unknown 263 8% 294 10% 336 11%
Sources: COS Data Warehouse and COS Office of Research, Planning, and Institutional Effectiveness
• Close to 70% of first-time students who enroll in the District are also the first generation in their families to attend college. This is higher than the 2012 estimate from the Cal-ifornia Community Colleges Chancellor’s Office that 61% of first-time students were first-generation college students. (Source: Measuring the Education Level of California Community College Students’ Parents: Current Status and Preliminary Findings, April 11, 2014;
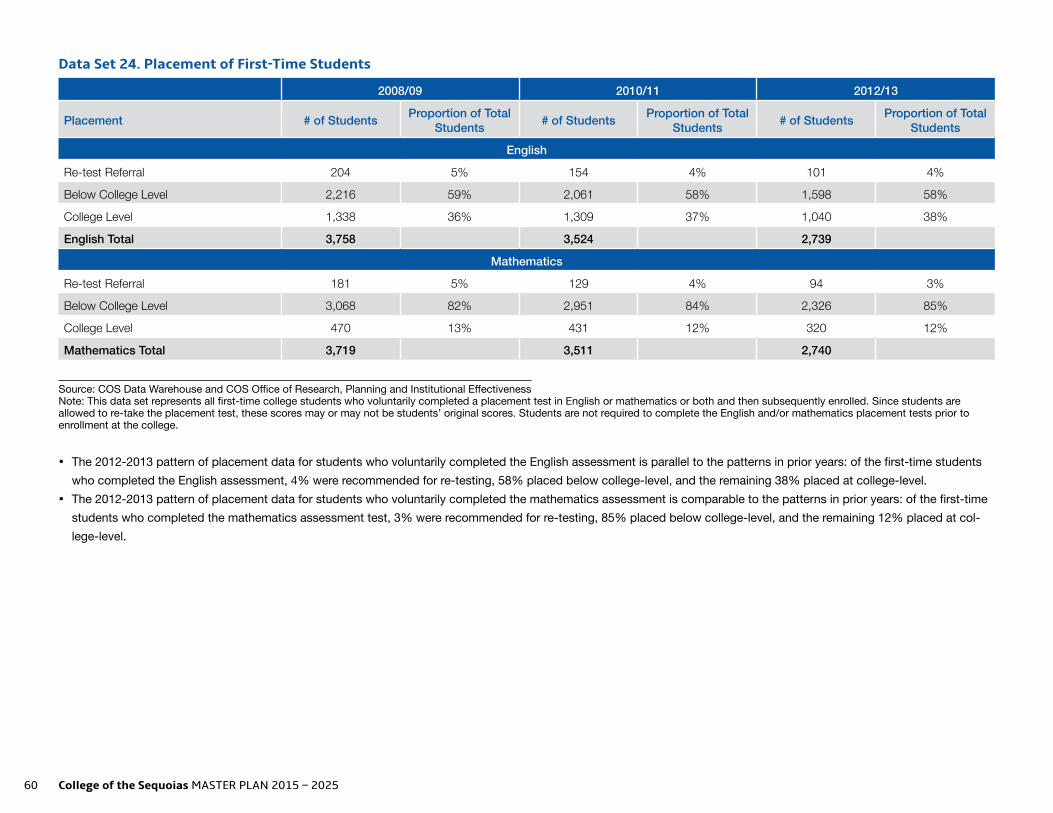
60 College of the Sequoias MASTER PLAN 2015 – 2025
Data Set 24. Placement of First-Time Students
2008/09 2010/11 2012/13
Placement # of Students Proportion of Total Students # of Students Proportion of Total
Students # of Students Proportion of Total Students
English
Re-test Referral 204 5% 154 4% 101 4%
Below College Level 2,216 59% 2,061 58% 1,598 58%
College Level 1,338 36% 1,309 37% 1,040 38%
English Total 3,758 3,524 2,739
Mathematics
Re-test Referral 181 5% 129 4% 94 3%
Below College Level 3,068 82% 2,951 84% 2,326 85%
College Level 470 13% 431 12% 320 12%
Mathematics Total 3,719 3,511 2,740
Source: COS Data Warehouse and COS Office of Research, Planning and Institutional Effectiveness Note: This data set represents all first-time college students who voluntarily completed a placement test in English or mathematics or both and then subsequently enrolled. Since students are allowed to re-take the placement test, these scores may or may not be students’ original scores. Students are not required to complete the English and/or mathematics placement tests prior to enrollment at the college.
• The 2012-2013 pattern of placement data for students who voluntarily completed the English assessment is parallel to the patterns in prior years: of the first-time students who completed the English assessment, 4% were recommended for re-testing, 58% placed below college-level, and the remaining 38% placed at college-level.
• The 2012-2013 pattern of placement data for students who voluntarily completed the mathematics assessment is comparable to the patterns in prior years: of the first-time students who completed the mathematics assessment test, 3% were recommended for re-testing, 85% placed below college-level, and the remaining 12% placed at col-lege-level.

College of the Sequoias MASTER PLAN 2015 – 2025 61
PROFILE OF THE DISTRICT’S COMMUNITIES AND STUDENTS
STUDENT OUTCOMES
Data Set 25. Student Success Scorecard: Completion Rates
2003/04 2005/06 2007/08
COS State COS State COS State
Count % % Count % % Count % %
Cohort Completion Rate Overall 1,626 43% 47% 1,593 45% 49% 2,052 43% 48%
Source: The California Community Colleges Student Success Scorecard, 2014 Note: “Completion Rate” is the percentage of degree and/or transfer-seeking students tracked for six years through 2012-2013 who completed a degree, certificate, or transfer-related outcomes.
• The completion rates for COS students are consistent over this multi-year snapshot, in the range of 43%-45%.
• The completion rates for COS students are consistently lower than students’ completion rates statewide (43% versus 47%, 45% versus 49%, and 43% versus 48%).

62 College of the Sequoias MASTER PLAN 2015 – 2025
Data Set 26. Student Success Scorecard: Completion Rates by Age
Cohort 2003/04 2005/06 2007/08
Completion COS State COS State COS State
Rates by Age Count % % Count % % Count % %
Younger than 20 1,286 44% 51% 1,313 48% 52% 1,709 45% 51%
Ages 20-24 127 42% 38% 122 32% 39% 146 30% 37%
Ages 25-39 135 36% 35% 114 36% 34% 135 34% 35%
Ages 40+ 78 44% 33% 44 39% 33% 62 48% 34%
Source: The California Community Colleges Student Success Scorecard, 2014 Note: “Completion Rate” is the percentage of degree and/or transfer-seeking students tracked for six years through 2012-13 who completed a degree, certificate, or transfer-related outcomes.
• The completion rates for COS students in the age 20-24 cohort have steadily decreased in this multi-year comparison, from a high of 42% to 30% in the most recent data. In addition, the completion rates for COS students in college-going years (younger than 20 and 20-24) are consistently below the completion rates for students of the same ages statewide.
• The completion rates for COS students over the age of 25 are comparable to or exceed the statewide completion rates for students in older age cohorts.
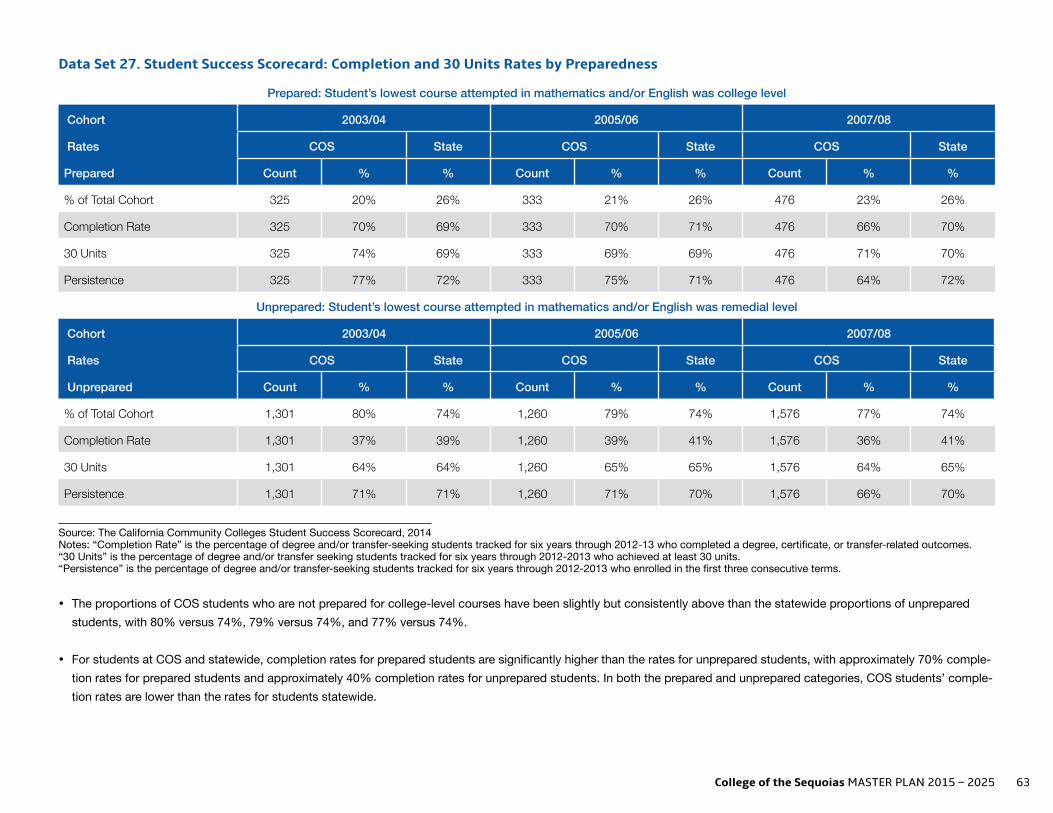
College of the Sequoias MASTER PLAN 2015 – 2025 63
Data Set 27. Student Success Scorecard: Completion and 30 Units Rates by Preparedness
Prepared: Student’s lowest course attempted in mathematics and/or English was college level
Cohort 2003/04 2005/06 2007/08
Rates COS State COS State COS State
Prepared Count % % Count % % Count % %
% of Total Cohort 325 20% 26% 333 21% 26% 476 23% 26%
Completion Rate 325 70% 69% 333 70% 71% 476 66% 70%
30 Units 325 74% 69% 333 69% 69% 476 71% 70%
Persistence 325 77% 72% 333 75% 71% 476 64% 72%
Unprepared: Student’s lowest course attempted in mathematics and/or English was remedial level
Cohort 2003/04 2005/06 2007/08
Rates COS State COS State COS State
Unprepared Count % % Count % % Count % %
% of Total Cohort 1,301 80% 74% 1,260 79% 74% 1,576 77% 74%
Completion Rate 1,301 37% 39% 1,260 39% 41% 1,576 36% 41%
30 Units 1,301 64% 64% 1,260 65% 65% 1,576 64% 65%
Persistence 1,301 71% 71% 1,260 71% 70% 1,576 66% 70%
Source: The California Community Colleges Student Success Scorecard, 2014 Notes: “Completion Rate” is the percentage of degree and/or transfer-seeking students tracked for six years through 2012-13 who completed a degree, certificate, or transfer-related outcomes. “30 Units” is the percentage of degree and/or transfer seeking students tracked for six years through 2012-2013 who achieved at least 30 units. “Persistence” is the percentage of degree and/or transfer-seeking students tracked for six years through 2012-2013 who enrolled in the first three consecutive terms.
• The proportions of COS students who are not prepared for college-level courses have been slightly but consistently above than the statewide proportions of unprepared students, with 80% versus 74%, 79% versus 74%, and 77% versus 74%.
• For students at COS and statewide, completion rates for prepared students are significantly higher than the rates for unprepared students, with approximately 70% comple-tion rates for prepared students and approximately 40% completion rates for unprepared students. In both the prepared and unprepared categories, COS students’ comple-tion rates are lower than the rates for students statewide.

64 College of the Sequoias MASTER PLAN 2015 – 2025
• Similar to the pattern of higher achievement levels for prepared students for both students at COS and statewide, the proportions of prepared students who have accumu-lated 30 units are higher than the 30 unit rates for unprepared students. The 30 unit rates for prepared students range from 69% to 74% and for unprepared students range from 64% to 65%. In both the prepared and unprepared categories, COS students’ 30 unit rates and persistence rates are comparable to those rates for students statewide.
• For unprepared students, at COS and statewide, there is a consistent and striking disparity, with the rate of students who have accumulated 30 units significantly higher than the completion rates. For example, in the cohort of students who entered the District in 2007-2008, 64% had completed 30 units at the end of six years but only 36% had completed a degree, certificate or transfer related outcomes.
Data Set 28. Student Success Scorecard: Basic Skills Rates
Cohort 2003/04 2005/06 2007/08
Improvement COS State COS State COS State
Rates Count % % Count % % Count % %
English 1,466 38% 41% 1,510 31% 42% 1,610 31% 44%
Mathematics 1,767 25% 28% 1,674 26% 29% 1,883 27% 31%
Source: The California Community Colleges Student Success Scorecard, 2014 Note: These percentages indicate the percentage of credit students tracked for six years through 2012-13 who started below transfer level in English or mathematics and completed a college-level course in the same discipline.
• COS students who begin below transfer level in English or mathematics are much less likely than students statewide to complete a college-level course in the same disci-pline within six years. In English, the statewide rates are 41% to 44% compared to rates of 31% to 38% for COS students. In mathematics, the statewide rates are 28% to 31% compared to rates of 25% to 27% for COS students.
Data Set 29. Student Success Scorecard: Career Technical Education Rates
Cohort Rates 2003/04 2005/06 2007/08
COS State COS State COS State
Count % % Count % % Count % %
CTE 955 63% 54% 964 77% 54% 1,279 53% 54%
Source: The California Community Colleges Student Success Scorecard, 2014 Note: “CTE Rate” is the percentage of students tracked for six years through 2012-13 who completed several courses classified as career technical education in a single discipline and completed a degree, certificate, or transferred.
• The rates of COS students completing a degree, certificate or transferring in a career technical education program (63% to 77%) has been higher than the statewide rates (54%) in prior years, but decreased significantly for the cohort of students who began in 2007/08 (53% to 54%) and the rate is now comparable to the statewide rate.

College of the Sequoias MASTER PLAN 2015 – 2025 65
Data Set 30. Student Retention Rates in Credit Courses
Fall 2009 Fall 2011 Fall 2013State Total 85% 85% 85%
District Total 88% 92% 88%
Successful Grades 35,783 32,604 30,093
All Grades 40,518 35,545 34,120
Face-To-Face 89% 92% 89%
Successful Grades 32,772 29,747 27,364
All Grades 36,824 32,264 30,699
Online Only 80% 86% 78%
Successful Grades 1,540 1,364 1,313
All Grades 1,916 1,588 1,689
Online Hybrid 79% 88% 80%
Successful Grades 592 659 773
All Grades 750 751 972
Online w/ Orientation 78% 83% 75%
Successful Grades 302 330 183
All Grades 385 398 243
Others 90% 93% 89%
Successful Grades 577 504 460
All Grades 643 544 517
Source: COS Data Warehouse, COS Office of Research, Planning, and Institutional Effectiveness and California Community Colleges Chancellor’s Office: datamart.cccco.edu Notes: “Retention Rate” is the ratio of all completed grades (A,B,C,D,F,CR,NC,P,NP,I) to all grade marks (A,B,C,D,F,W,CR,NC,P,NP,I) for credit courses. Plus/Minus grades are included in the ratio. The category “Online with Orientation” refers to a pilot project in which faculty and students meet once at the start of the semester for an on-campus orientation to the course and to the online-teaching/learning environment. The category “Others” in this data set includes work experience, tutoring, directed study, field experience, independent study, hybrid video, and other instructional activities.
• COS has an impressive rate of student retention, ranging from 88% to 92% in this snapshot. These rates are consistently higher than the statewide averages for these three fall semesters.
• The rates for student retention in face-to-face courses is higher than other methods of instruction, reaching 92% in fall 2011. Student retention rates in all types of online courses are lower than face-to-face methods.

66 College of the Sequoias MASTER PLAN 2015 – 2025
Data Set 31. Student Successful Course Completion Rates in Credit Courses
Fall 2009 Fall 2011 Fall 2013State Total 67% 69% 69%
District Total 67% 69% 68%
Successful Grades 26,976 24,663 23,362
All Grades 40,518 35,545 34,120
Face-To-Face 68% 70% 70%
Successful Grades 25,064 22,671 21,431
All Grades 36,824 32,264 30,699
Online Only 44% 59% 53%
Successful Grades 840 932 902
All Grades 1,916 1,588 1,689
Online Hybrid 57% 62% 58%
Successful Grades 425 465 559
All Grades 750 751 972
Online w/Orientation 39% 46% 41%
Successful Grades 152 182 100
All Grades 385 398 243
Others 77% 78% 72%
Successful Grades 495 422 370
All Grades 643 544 517
Sources: COS Data Warehouse, COS Office of Research, Planning, and Institutional Effectiveness, and California Community Colleges Chancellor’s Office: datamart.cccco.edu Notes: “Successful Course Completion Rate” is the ratio of successful grade marks (A,B,C,CR,P) to all grade marks (A,B,C,D,F,W,CR,NC,P,NP,I) for credit courses. Plus/Minus grades are included in the ratio. The category “Online with Orientation” refers to a pilot project in which faculty and students meet once at the start of the semester for an on-campus orientation to the course and to the online teaching/learning environment. The category “Others” in this data set includes work experience, tutoring, directed study, field experience, independent study, hybrid video, and other instructional activities. The District’s overall successful course completion rates (67% to 68%) are consistent across this five-year summary and are comparable to the statewide average (67% to 69%) for these three fall semesters.
• COS students’ successful course completion rates for face-to-face and online hybrid courses were relatively consistent across this period in the range of 68% to70% for face-to-face courses and 57% to 62% for online hybrid courses.
• Although there has been an improvement in the COS students’ successful course completion rates in online courses, increasing from 44% in fall 2009 to 53% in fall 2013, the disparity between the successful course completion rates in face-to-face versus online courses is an issue. COS students in face-to-face courses are significantly more successful in completing courses with a passing grade compared to students in online and online hybrid courses.
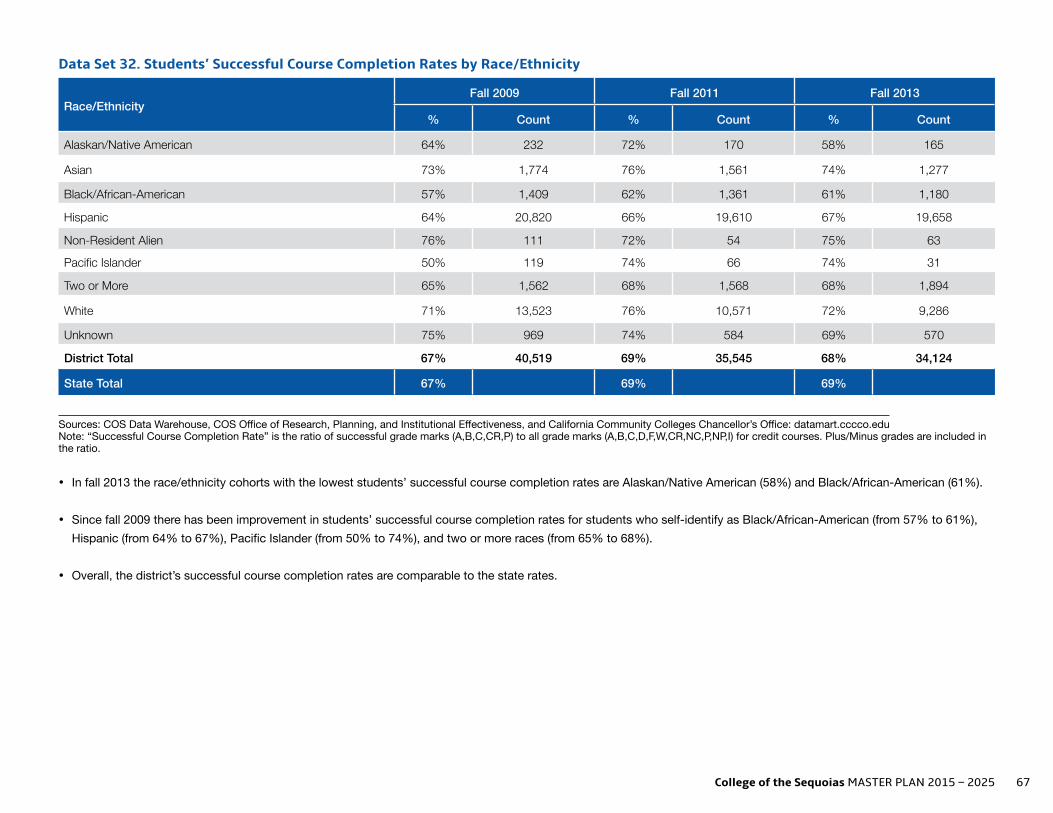
College of the Sequoias MASTER PLAN 2015 – 2025 67
Data Set 32. Students’ Successful Course Completion Rates by Race/Ethnicity
Race/EthnicityFall 2009 Fall 2011 Fall 2013
% Count % Count % Count
Alaskan/Native American 64% 232 72% 170 58% 165
Asian 73% 1,774 76% 1,561 74% 1,277
Black/African-American 57% 1,409 62% 1,361 61% 1,180
Hispanic 64% 20,820 66% 19,610 67% 19,658
Non-Resident Alien 76% 111 72% 54 75% 63
Pacific Islander 50% 119 74% 66 74% 31
Two or More 65% 1,562 68% 1,568 68% 1,894
White 71% 13,523 76% 10,571 72% 9,286
Unknown 75% 969 74% 584 69% 570
District Total 67% 40,519 69% 35,545 68% 34,124
State Total 67% 69% 69%
Sources: COS Data Warehouse, COS Office of Research, Planning, and Institutional Effectiveness, and California Community Colleges Chancellor’s Office: datamart.cccco.edu Note: “Successful Course Completion Rate” is the ratio of successful grade marks (A,B,C,CR,P) to all grade marks (A,B,C,D,F,W,CR,NC,P,NP,I) for credit courses. Plus/Minus grades are included in the ratio.
• In fall 2013 the race/ethnicity cohorts with the lowest students’ successful course completion rates are Alaskan/Native American (58%) and Black/African-American (61%).
• Since fall 2009 there has been improvement in students’ successful course completion rates for students who self-identify as Black/African-American (from 57% to 61%), Hispanic (from 64% to 67%), Pacific Islander (from 50% to 74%), and two or more races (from 65% to 68%).
• Overall, the district’s successful course completion rates are comparable to the state rates.

68 College of the Sequoias MASTER PLAN 2015 – 2025
Data Set 33. Students’ Successful Course Completion Rates by Age
AgeFall 2009 Fall 2011 Fall 2013
% Count % Count % Count
Under 20 64% 15,418 67% 13,740 67% 11,849
20-24 65% 13,219 68% 12,661 68% 13,714
25-49 72% 10,809 74% 8,367 71% 7,981
50 and Above 79% 1,073 77% 777 73% 580
District Totals 67% 40,519 69% 35,545 68% 34,124
State Totals 67% - 69% - 69% -
Under 20 66% - 69% - 69% -
20-24 65% - 66% - 68% -
25-49 72% - 72% - 73% -
50 and Above 78% - 77% - 76% -
Sources: COS Data Warehouse, COS Office of Research, Planning, and Institutional Effectiveness, and California Community Colleges Chancellor’s Office: datamart.cccco.edu Note: “Successful Course Completion Rate” is the ratio of successful grade marks (A,B,C,CR,P) to all grade marks (A,B,C,D,F,W,CR,NC,P,NP,I) for credit courses. Plus/Minus grades are included in the ratio.
• Students 25 and older have higher student successful course completion rates (fall 2013: 71% to 73%) compared to students younger than 25 (fall 2013: 67% to 68%), over this five-year period, the successful course completion rates increased 3% for students under 25 and declined 6% for students age 50 and older.

College of the Sequoias MASTER PLAN 2015 – 2025 69
Data Set 34. Students’ Successful Course Completion Rates by Unit Load
Student LoadFall 2009 Fall 2011 Fall 2013
% Count % Count % Count
Full-time 76% 21,143 78% 19,050 80% 17,379
Part-time 56% 19,376 59% 16,495 57% 16,745
District Total 67% 40,519 69% 35,545 68% 34,124
State Total 67% 69% 69%
Sources: COS Data Warehouse, COS Office of Research, Planning, and Institutional Effectiveness, and California Community Colleges Chancellor’s Office: datamart.cccco.edu Note: “Successful Course Completion Rate” is the ratio of successful grade marks (A,B,C,CR,P) to all grade marks (A,B,C,D,F,W,CR,NC,P,NP,I) for credit courses. Plus/Minus grades are included in the ratio. Full-time: Enrolled in 12 or more units, Part-time: Enrolled in fewer than 12 units
• Consistently over this five-year review, students who enroll in 12 or more units (76% to 80%) have higher student successful course completion rates compared to students who enroll in fewer than 12 units (56% to 57%).
• Full-time students’ successful course completion rates steadily increased from fall 2009 (76%) to fall 2013 (80%).

70 College of the Sequoias MASTER PLAN 2015 – 2025
Data Set 35a. Student Degree Completion
Distribution of Degrees and Certificates
Degree/Certificate 2008/09 2010/11 2012/13
State Totals Count % of All Awards Count % of All Awards Count % of All Awards
State Associate Total - 65% - 62% - 60%
State Cert. of Achievement - 20% - 25% - 26%
State Skill Certificate - 15% - 12% - 14%
District Totals
Associate Degrees 736 61% 1001 58% 987 65%
Certificate of Achievement 384 32% 208 12% 213 14%
Skill Certificates 77 6% 513 30% 315 21%
District Total Awards 1197 100% 1722 100% 1515 100%
Sources: COS Data Warehouse, COS Office of Research, Planning, and Institutional Effectiveness, and California Community Colleges Chancellor’s Office: datamart.cccco.edu Notes: Certificates of Achievement require 18 units or more units and are approved by the Chancellor’s Office. Skills Certificates require fewer than 18 units. This data set presents the number of awards granted in a year. Students may earn multiple awards in a year.
• Of all COS degrees and certificates awarded in 2012-2013, 65% were associate degrees. This is a higher proportion of associate degrees compared to previous years (58% to 61%) and significantly higher than the proportion of associate degrees compared to total degrees statewide (60%). In previous years, the proportions of associate de-grees awarded by COS were slightly below the proportions of associate degrees in statewide awards.
• Statewide, the proportions of certificates of achievement awarded increased from 20% to 26% between 2008-2009 and 2012-2013 while the proportions of certificates of achievement awarded by COS decreased from 32% to 14% in the same time period.

College of the Sequoias MASTER PLAN 2015 – 2025 71
Data Set 35b. Student Degree Completion by Race/Ethnicity
Distribution of Degrees by Race/Ethnicity
Associate Degrees 2008/09 2010/11 2012/13
Count % of Awards Count % of Awards Count % of Awards
District Total 736 100% 1,001 100% 987 100%
Alas/Nat. Amer 6 1% 8 1% 0 0%
Asian 44 6% 39 4% 56 6%
Black/Af.-Amer 22 3% 24 2% 19 2%
Hispanic 251 34% 391 39% 452 46%
Non-Resident Alien 0 0% 1 0% 0 0%
Pac. Islander 2 0% 3 0% 2 0%
Two or More 9 1% 53 5% 33 3%
White 260 35% 352 35% 331 34%
Unknown 142 19% 130 13% 94 10% Sources: COS Data Warehouse, COS Office of Research, Planning, and Institutional Effectiveness, and California Community Colleges Chancellor’s Office: datamart.cccco.edu
• Between 2008-2009 and 2012-2013 the number of associate degrees awarded by COS increased 34% during this same period that the overall student headcount declined 21%. (Refer to Data Set 11)

72 College of the Sequoias MASTER PLAN 2015 – 2025
Data Set 36a. Student Certificate Completion by Race/Ethnicity
Distribution of Certificates of Achievement by Race/Ethnicity
Cert. of Achievement 2008/09 2010/11 2012/13
Count % of Awards Count % of Awards Count % of Awards
District Total 384 100% 208 100% 213 100%
Alas/Nat. Amer 1 0% 0 0% 2 1%
Asian 11 3% 7 3% 5 2%
Black/Af.-Amer 11 3% 13 6% 3 1%
Hispanic 145 38% 103 50% 125 59%
Non-Resident Alien 0 0% 0 0% 0 0%
Pac. Islander 1 0% 0 0% 0 0%
Two or More 4 1% 6 3% 5 2%
White 131 34% 48 23% 64 30%
Unknown 80 21% 31 15% 9 4%
Sources: COS Data Warehouse, COS Office of Research, Planning, and Institutional Effectiveness, and California Community Colleges Chancellor’s Office: datamart.cccco.edu
• Of all awards earned by COS students, the proportions of certificates of achievement declined from 32% to 17% and the proportions of skill certificates increased from 6% to 26% between 2008-2009 and 2012-2013. (Refer to Data Set 36b)
• The total certificates of achievement declined 45% from 384 in 2008-2009 to 213 in 2012-2013, which is greater than the 21% decline in overall student headcount. (Refer to Data Set 11)
• The proportions of certificates of achievement earned by students who self-identify as Hispanic have steadily increased, from 38% of all COS awards in 2008-2009 to 59% of all COS awards in 2012-2013. The proportions of certificates of achievement earned by students who self-identify as White have been relatively consistent across these years.
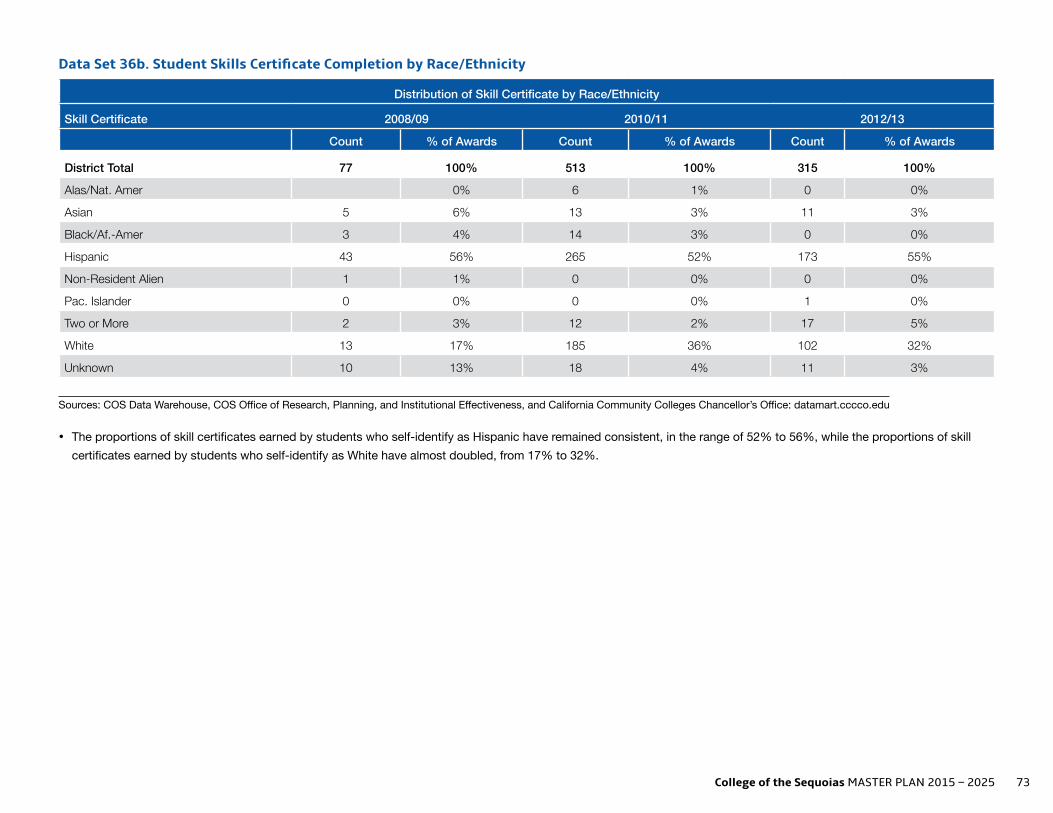
College of the Sequoias MASTER PLAN 2015 – 2025 73
Data Set 36b. Student Skills Certificate Completion by Race/Ethnicity
Distribution of Skill Certificate by Race/Ethnicity
Skill Certificate 2008/09 2010/11 2012/13
Count % of Awards Count % of Awards Count % of Awards
District Total 77 100% 513 100% 315 100%
Alas/Nat. Amer 0% 6 1% 0 0%
Asian 5 6% 13 3% 11 3%
Black/Af.-Amer 3 4% 14 3% 0 0%
Hispanic 43 56% 265 52% 173 55%
Non-Resident Alien 1 1% 0 0% 0 0%
Pac. Islander 0 0% 0 0% 1 0%
Two or More 2 3% 12 2% 17 5%
White 13 17% 185 36% 102 32%
Unknown 10 13% 18 4% 11 3%
Sources: COS Data Warehouse, COS Office of Research, Planning, and Institutional Effectiveness, and California Community Colleges Chancellor’s Office: datamart.cccco.edu
• The proportions of skill certificates earned by students who self-identify as Hispanic have remained consistent, in the range of 52% to 56%, while the proportions of skill certificates earned by students who self-identify as White have almost doubled, from 17% to 32%.

74 College of the Sequoias MASTER PLAN 2015 – 2025
PROFILE OF THE DISTRICT’S COMMUNITIES AND STUDENTS
PERCEPTIONS OF THE DISTRICT
Data Set 37. Community Perceptions
How would you rate the quality of education provided by the College of the Sequoias?
Source: Tulare Area Reauthorization Bond Election Survey, 2012 Note: These community perceptions were gathered in 2012 when 400 community members (registered voters) were interviewed over six days to ascertain their perceptions of the District prior to a bond election. A telephone survey of 400 likely voters (those having voted in November 2008, or registered after November 2008 and voted in November 2010, or registered after November 2010) in the District was conducted between June 01, 2012, through June 06, 2012. Surveys were conducted during the weekdays in the evenings. The average length of the survey was about 10.1 minutes. Margin of error for this sample is +/- 4.85%.
• A strong majority (74%) of the community members who participated in this survey rated the quality of education as “good” or “excellent.”
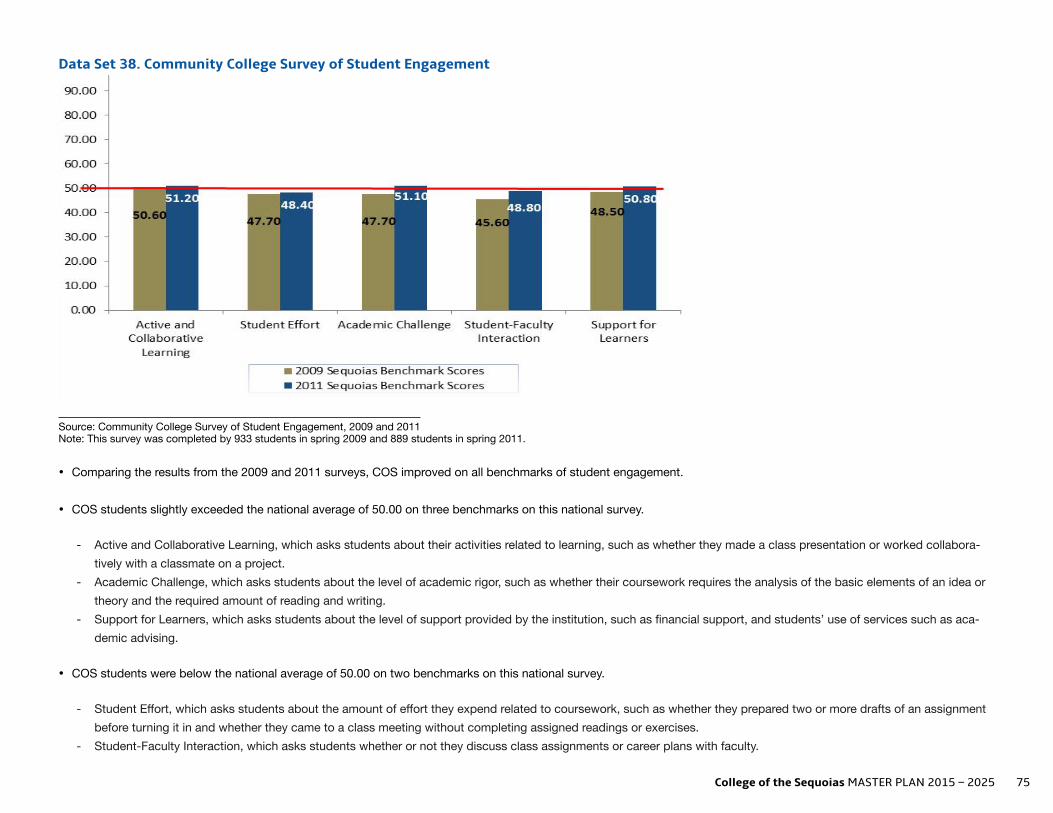
College of the Sequoias MASTER PLAN 2015 – 2025 75
Data Set 38. Community College Survey of Student Engagement
Source: Community College Survey of Student Engagement, 2009 and 2011 Note: This survey was completed by 933 students in spring 2009 and 889 students in spring 2011.
• Comparing the results from the 2009 and 2011 surveys, COS improved on all benchmarks of student engagement.
• COS students slightly exceeded the national average of 50.00 on three benchmarks on this national survey.
- Active and Collaborative Learning, which asks students about their activities related to learning, such as whether they made a class presentation or worked collabora-tively with a classmate on a project.
- Academic Challenge, which asks students about the level of academic rigor, such as whether their coursework requires the analysis of the basic elements of an idea or theory and the required amount of reading and writing.
- Support for Learners, which asks students about the level of support provided by the institution, such as financial support, and students’ use of services such as aca-demic advising.
• COS students were below the national average of 50.00 on two benchmarks on this national survey.
- Student Effort, which asks students about the amount of effort they expend related to coursework, such as whether they prepared two or more drafts of an assignment before turning it in and whether they came to a class meeting without completing assigned readings or exercises.
- Student-Faculty Interaction, which asks students whether or not they discuss class assignments or career plans with faculty.

76 College of the Sequoias MASTER PLAN 2015 – 2025
Data Set 39. Community College Faculty Survey of Student Engagement
Do students ask questions in class or contribute to class discussions? Do students make class presentations? Do students work with other students on
projects during class?
Response Full-time Part-time Full-time Part-time Full-time Part-time
Very Often 56% 48% 9% 16% 26% 35%
Often 28% 34% 21% 22% 30% 33%
Sometimes 14% 17% 37% 41% 30% 16%
Never 0 0 28% 22% 7% 14%
Don’t Know 2% 0 5% 0 7% 2%
Source: Community College Faculty Survey of Student Engagement, 2011 Note: This survey is a companion to the Community College Survey of Student Engagement and was completed by 107 faculty members in spring 2011.
• This sample of three questions from the Community College Faculty Survey of Student Engagement focuses on the area of Academic and Collaborative Learning. Over 80% of full-time and part-time faculty report that in their perceptions, students “often” or “very often” participate during class by asking questions or making comments.
• Thirty percent of the full-time faculty requires students to make class presentations “often” or “very often” compared to 38% of the part-time faculty.
• Both part-time and full-time faculty creates venues for students to work with other students on projects during class (“often” or “very often”).

College of the Sequoias MASTER PLAN 2015 – 2025 77
PROFILE OF THE DISTRICT’S COMMUNITIES AND STUDENTS
CURRENT AND ANTICIPATED CHALLENGES
The purposes of the first two chapters of this master plan are to identify the District’s benefits and success-es as well as to analyze the District’s effectiveness in meeting its mission.
The COS mission is:
College of the Sequoias is a comprehensive com-munity college district focused on student learning that leads to productive work, lifelong learning and community involvement.
College of the Sequoias affirms that our mission is to help our diverse student population achieve its transfer and/or occupational objectives and to advance the economic growth and global competi-tiveness of business and industry within our region.
College of the Sequoias is committed to supporting students’ mastery of basic skills and to providing access to programs and services that foster stu-dent success.
Using this mission statement as the benchmark, these chapters provide evidence of some of the District’s successes and benefits.
• The District’s geographic region is projected to increase in population and that projection includes sustained growth in residents of college-going ages. (Data Set 1 and Data Set 2)
• Employment growth is projected for the District’s geographic region. (Data Set 7, Data Set 8, and Data Set 9)
• District students are younger than the statewide student population, with 65% of the District’s stu-dents age 24 years old or younger at all three Dis-trict sites, compared to 56% of students in that age cohort statewide. (Data Set 18 and Data Set 19)
• College of the Sequoias has an impressive rate of student retention, ranging from 88% to 92% in a five-year summary. These retention rates are con-sistently higher than the statewide averages for the same semesters. (Data Set 30)
• The rates at which COS students earn passing grades are consistent across a five-year summary and are comparable to the statewide average for the same semesters. (Data Set 31)
• The successful course completion rates for COS college-age students (age 20-24) increased from 65% in fall 2009 to 68% in fall 2013. (Data Set 33)
• The successful course completion rates for COS full-time students increased from 76% in fall 2009 to 80% in fall 2013. (Data Set 34)
In order to identify its current and anticipated challeng-es, the District analyzed the information in these two chapters by:

78 College of the Sequoias MASTER PLAN 2015 – 2025
• Comparing its current status to its mission (internal scans) in order to identify current challenges and
• Studying projected demographics, legislative, and economic changes (external scans) in order to an-ticipate the challenges that the District will be called upon to address in the coming decade.
Based on this analysis, the District identified the follow-ing current and anticipated challenges:
CHALLENGE #1: To fulfill its mission, College of the Sequoias must accommodate the anticipated increases in student demand at all District campuses.
Student demand is projected to increase in the next 10 years. Based on data in the previous chapters, the District projects that enrollment will grow at the rate of 1.75% per year each year in the coming decade. This projection of the overall college growth projection is based on the following demographic projections and recent history.
• Student demand is projected to increase because the populations in the communities served by the District are projected to increase. Between 2010 and 2025 Kings County is projected to increase 26% (35% by 2030) and Tulare County is projected to increase 30% (42% by 2030). (Data Set 1) However, the impacts of these projected increases in total population are offset to some extent by the low college-going rates of local high school gradu-ates. The population increases are projected to be evenly distributed across the age cohorts, with the
college-age population on both counties projected to remain consistent. (Data Set 2)
• Student demand is projected to increase because the District was required by reductions in state funding in recent years to limit student access to higher educa-tion. As a result, the number of students served by District decreased 21% between fall 2009 and fall 2013. (Date Set 11.) In alignment with the reduction in student headcount, the number of course enrollments decreased 29% between fall 2009 and fall 2013. (Data Set 13) The District has begun to address these unmet student needs as evidenced by the increase in FTES earned in 2013-2014 (8711 FTES in 2012-2013; 9480 FTES in 2013-2014). However, student demand/enrollment decreases as the economy improves.
• Student demand is projected to increase because the District opened two facilities that are geographi-cally separated from the Visalia campus. This action was taken in order to expand student access to the District’s programs and services. Each of the two new sites, Hanford Educational Center that opened in fall 2010 and Tulare College Center that opened in spring 2013, offer unique career technical educa-tion programs as well as general education courses. However, these additions promise to contribute to ad-dressing student needs, contingent on the District’s ability to increase programs and staffing for these sites. (Chapter 1)
• Student demand is projected to increase because jobs requiring postsecondary education are project-ed to increase. Adults with the lowest educational attainment have the highest rates of unemployment. (Data Set 10) This trend is likely to continue if econ-omists are correct in projecting that the education level required for employment will increase in the next
decade. One such forecast from the Lumina Foun-dation project states that if the current rate of degree completion continues, 45% of California’s working adults will have earned a college degree by 2025, far short of the 61% that is projected to be needed for the workforce. (Chapter 1)
CHALLENGE #2: To fulfill its mission, College of the Sequoias must improve the rate at which its students complete degrees, certificates, and transfer objectives.
Students’ completion of degrees, certificates, and trans-fer requirements as a strategy to meet workforce needs is a focus of national, state, and local attention. At the national level, economists project that the majority of tomorrow’s jobs will require postsecondary education. The projection for California is that by 2020, 61% of the jobs will require postsecondary education: 32% will require some college, a career technical certificate, or an associate degree; 23% will require a bachelor’s degree; and 12% will require a master’s degree. To meet this need and to offset the decline in the educational attainment of U.S. citizens, the President’s American Graduation Initiative set a target for each community college to triple the number of degrees and certificates awarded by 2020. (Chapter 1)
On the Student Success Scorecard the metric of com-pletion rate is calculated as the percentage of degree and/or transfer-seeking students tracked for six years through 2012-2013 who completed a degree, certificate, or transfer related outcomes. These Student Success Scorecard data indicate that completion rates for COS students over the past five years have been consistently below students’ completion rates statewide. (Data Set 25)

College of the Sequoias MASTER PLAN 2015 – 2025 79
Although below students’ completion rates statewide, in recent years the number of degrees awarded by COS increased. Between 2008-2009 and 2012-2013 COS awarded 34% more associate degrees during the same period that the overall student headcount declined 21%. (Data Set 11 and Data Set 35) Although the increase in the number of associate degrees awarded by COS is impressive, this completion rate is unlikely to meet current and projected workforce needs and is below the statewide rates for completion of degrees, certificates, and transfer requirements. (Chapter 1 and Data Set 25)
In order to meet this challenge of increasing the rate of students’ completion of degrees and certificates, COS will need to dedicate attention to the viability of its ca-reer technical education programs as well as to multiple benchmarks of students’ matriculation, highlighted by the following specific issues. CAREER TECHNICAL EDUCATION PROGRAMSIn order to increase students’ successful completion of degrees, certificates, and transfer requirements, the District must ensure that the links between program completion and employment are visible and authentic for both employers and students. The District expanded students’ access to higher education opportunities by building facilities that are geographically separated and that feature unique career technical educational programs. Increased enrollment at each location is evidence of students’ positive respons-es to these opportunities. (Chapter 2 and Data Set 18) This expansion of access to higher education is well timed because employment growth is projected in a range of industry sectors in the next decade.
Since higher levels of educational attainment are pre-dictive of higher income and lower unemployment, in
order to fulfill its mission, the District is committed to its role in contributing to the economic growth of the region by training students to become skilled employees and entrepreneurs. (Chapter 2 and Data Set 10)
STUDENTS’ READINESS FOR COLLEGE The low level of students’ preparedness for college-lev-el coursework may be a factor in the District’s lower completion rates. Of the degree- and transfer-seek-ing COS students who voluntarily completed course placement tests in 2012/13, 58% were not prepared for college-level coursework in English and 85% were not prepared for college-level coursework in mathematics. (Data Set 24) Using the Student Success Scorecard data, the proportions of COS students who are not prepared for college-level courses have been slightly but consistently above the proportions of unprepared students statewide, with 80% versus 74%, 79% versus 74%, and 77% versus 74%. Although prepared stu-dents have higher completion rates than unprepared students, COS students’ completion rates for both prepared and unprepared students are slightly lower than the completion rates for students statewide. (Data Set 27)
STUDENTS’ TRANSITION FROM BASIC SKILLS TO COLLEGE-LEVEL COURSEWORKThe Student Success Scorecard data on basic skills reinforces the idea that students’ level of preparedness for college-level coursework may be a factor in the District’s lower completion rates. On this metric, COS students are much less likely than students statewide to begin below transfer level in English or mathematics and complete a college-level course in the same discipline within six years. In English, the statewide rates are 41% to 44% compared to rates of 31% to 38% for COS students. In mathematics, the statewide rates are 28%
to 31% compared to rates of 25% to 27% for COS students. (Data Set 28)
STUDENTS’ TRANSITION FROM SOME COLLEGE CREDIT TO DEGREE/CERTIFICATE COMPLETION/TRANSFERThe Student Success Scorecard data on students who continue their education after achieving 30 units indi-cates another area of concern for COS.
Although a significant proportion of both prepared and unprepared COS students complete 30 units, the challenge for COS is to improve the rate at which students move from reaching the 30-unit benchmark to the completion of degrees, certificates, and/or transfer requirements. For example, in the cohort of unprepared students who entered the District in 2007-2008, 64% had completed 30 units at the end of six years but only 36% completed a degree, certificate, or transfer-related outcomes. (Data Set 27)
Similar patterns are found in the data on persistence. In the Student Success Scorecard, persistence is defined as the percentage of degree and/or transfer-seeking students tracked for six years through 2012-2013 who enrolled in the first three consecutive terms. Like the 30-unit benchmark, this metric is considered a momentum point in students’ matriculation because research shows that students with sustained enrollment are more likely to succeed. COS students’ persistence rate was higher than the statewide rates for prepared students who entered in 2003-2004 and 2005-2006 but lower than the statewide rates for prepared students who entered in 2007-2008. The persistence rates of COS unprepared students (66%) have been comparable to the statewide persistence rates for unprepared students (70%) across the same time periods except for the cohort of 2007-2008. (Data Set 27)

80 College of the Sequoias MASTER PLAN 2015 – 2025
Taken together, these two measures indicate that COS students are likely to enroll in three or four consecutive semesters and accumulate 30 units, but then fail to suf-ficiently pursue their education to complete degree and transfer requirements.
STUDENTS’ NUMBER OF UNITS PER SEMESTERIn fall 2013, approximately 65% of COS students took fewer than 12 units per semester. (Data Set 16) The good news is that this proportion of full-time to part-time students at COS is slightly higher than the statewide proportions, in which 69% were part-time in fall 2013. The bad news is that the majority of COS students are part-time and part-time students have lower successful course completion rates than full-time students, 57% compared to 80% in fall 2013. (Data Set 16 and Data Set 34)
STUDENTS’ SUCCESSFUL COMPLETION OF DISTANCE EDUCATION COURSESAlthough there has been an improvement in students’ successful course completion rates in COS online courses, increasing from 44% in fall 2009 to 53% in fall 2013, only about half of COS students successfully complete the distance education courses in which they enroll. (Data Set 31)
CHALLENGE #3: To fulfill its mission, College of the Sequoias must strategically tailor its academic programs and student services to the unique demographics of its communities.
In order to provide meaningful support to its students, the District must tailor both academic programs and student services to meet the unique demographic vari-ables that characterize its students and communities.
These multiple and interacting demographic variables are summarized below.
Forty-two to forty-eight percent of the residents in Tulare and Kings Counties over the age of five speak a language other than English at home. (Data Set 4)
• The level of educational attainment for adult resi-dents within the District’s geographic boundaries is low compared to statewide levels. Of the adult residents in Tulare County and Kings County, 32% and 29% respectively have not graduated from high school compared to 19% statewide. The propor-tions of adults who have some college and an associate degree in these two counties are compa-rable to the statewide statistics, but the proportions of adult residents who have earned a bachelor’s degree or higher (13% in Tulare County and 12% in Kings County) is significantly below the statewide rate of 31% for this level of educational attainment. (Data Set 5)
• Close to 70% of first-time students who enroll in the District are also the first generation in their fam-ilies to attend college. This is higher than the 2012 estimate from the California Community Colleges Chancellor’s Office that 61% of first-time students were first generation college students. (Data Set 23)
• Consistent with the link between levels of educa-tional attainment and employment, the unemploy-ment rate in the District’s communities of 15% as of March 2014 is higher than state and national rates. (Chapter 1 and Data Set 10)
• The income for many residents within the District’s geographic boundaries is below poverty level. Both Tulare (20.5%) and Kings Counties (17.1%) have a
greater proportion of families living below poverty level compared to the statewide rate of 11.5%. (Data Set 6)
Combined, these demographic variables portray a complex student profile in which as many as half of COS students have few role models who achieved high levels of educational attainment, combined with living in households with unemployment and poverty. When parents have little/no postsecondary education, they often cannot serve as effective role models to guide their children’s academic success and they may not fully understand the benefits and language of postsecondary education. A corresponding factor is that these COS students live in households with high unemployment rates and poverty, which may necessitate them dedicat-ing time and energy to their families through part-time employment and/or increased household responsibili-ties. These factors combine and interact, serving as sig-nificant barriers to students’ pursuit of their educational goals, which thereby limits students’ abilities to break the cycle of under-education and poverty. (Data Set 5, Data Set 6, Data Set 10)
Economic concerns within the family and the possible necessity to work part-time may contribute to the high portion of COS students who enroll in fewer than 12 units per semester. In fall 2013, 65% of COS students were enrolled in 11.9 or fewer units. This is a concern for student success in two ways: (1) fewer units per semester are linked to lower likelihood of completing degrees, certificates, and transfer requirements, and (2) the number of units per semester is correlated with stu-dents’ successful course completion rates. Overall part-time students have lower successful course completion rates than full-time students, 57% compared to 80% in fall 2013. (Data Set 16 and Data Set 34)

College of the Sequoias MASTER PLAN 2015 – 2025 81
CHALLENGE #4: To fulfill its mission, College of the Sequoias must sustain and improve operational structures and systems for institutional assessment and continuous improvement.
Based on discussions, comments, and feedback gath-ered at the May 3, 2014, Academic Senate Summit, which was attended by more than 80 participants/con-tributors representing the COS faculty, staff, students, Board, and community members, an additional chal-lenge was identified. Since 2013, the District has under-gone a major transformation in its governance, planning, decision-making, and resource allocation structures. In order to further increase its institutional effectiveness, the District must sustain and improve its operational structures and systems. The next step is for the District to develop District Goals that describe how it intends to address the identified current and anticipated challenges.

82 College of the Sequoias MASTER PLAN 2015 – 2025

College of the Sequoias MASTER PLAN 2015 – 2025 83
DISTRICT GOALS
MISSION STATEMENT
DISTRICT GOALS
District Goal 1
District Goal 2
District Goal 3
District Goal 4
CHAPTER 3

84 College of the Sequoias MASTER PLAN 2015 – 2025
DISTRICT GOALS
MISSION STATEMENT
College of the Sequoias is a comprehensive community college district focused on student learning that leads to productive work, lifelong learning and community involvement.
College of the Sequoias affirms that our mission is to help our diverse student population achieve its transfer and/or occupational objectives and to advance the eco-nomic growth and global competitiveness of business and industry within our region.
College of the Sequoias is committed to supporting stu-dents’ mastery of basic skills and to providing access to programs and services that foster student success.
DISTRICT GOALS 2015-2025
DISTRICT GOAL I. College of the Sequoias will increase student enrollment relative to population growth and educational and work-force development needs.
DISTRICT GOAL II. College of the Sequoias will improve the rate at which its students complete degrees, certificates, and transfer objectives.
DISTRICT GOAL III. College of the Sequoias will strategically tailor and im-plement academic programs and student services that match the unique needs of its student population and the demands of ongoing changes in workforce develop-ment.
DISTRICT GOAL IV. College of the Sequoias Board of Trustees, adminis-tration, faculty, and staff will engage in best practices and staff development to sustain effective operational systems for institutional assessment and continuous improvement.

College of the Sequoias MASTER PLAN 2015 – 2025 85
OVERVIEW
This Master Plan is based on an analysis of the current programs and services and how well the institution has performed in fulfilling our Mission. It is also based on an analysis of the District’s position in the state, and cam-pus and community members’ input, perceptions and vision for the future. The analysis in the previous chapter highlighted four primary challenges the institution needs to address in order to fulfill its mission.
CHALLENGE #1: College of the Sequoias must accommodate the antici-pated increases in student demand.
CHALLENGE #2: College of the Sequoias must improve the rate at which its students complete degrees, certificates, and transfer objectives.
CHALLENGE #3: College of the Sequoias must strategically tailor its academic programs and student services to the unique demographics of its communities.
CHALLENGE #4: College of the Sequoias must sustain and improve oper-ational structures and systems for institutional assess-ment and continuous improvement.
The District’s Institutional Goals have been developed in response to these challenges. These are intended to serve as a guide for the District’s strategic planning, decision-making, and use of resources for the next ten years.

86 College of the Sequoias MASTER PLAN 2015 – 2025
DISTRICT GOALS
DISTRICT GOALS
The four District Goals were initially developed through various District meetings in spring 2014. Although these goals are numbered, the numbers do not convey a priority status; each goal is of equal priority.
I. College of the Sequoias will increase student enrollment relative to population growth and educational and workforce development needs. The Sequoias Community College District has a rich tradition of serving the educational and workforce develop-ment needs of the region. The District has kept pace with demands for increased student enrollment through mod-ernization of facilities, expanding course and program offerings, and, most recently, the addition of two new educa-tional centers for increased student access to higher education. The District-wide support for the institution is best evidenced by the passage by local voters of three facilities bonds to continue regional investment in College of the Sequoias. College of the Sequoias is now a three-campus District with centers in Hanford and Tulare. The District has modernized older facilities and constructed new facilities on all three campuses. An Enrollment Management Team has been implemented as part of the annual systems for effective operations. The District has demonstrated consistent effectiveness in accommodating and sustaining increased enrollment to ensure that the college plays a vital role in the educational and economic development of the region. To maintain this standing, the District places effective management of increased student enrollment among its priorities.
II. College of the Sequoias will improve the rate at which its students complete degrees, certificates, and transfer objectives.
The low number of students who complete degrees and certificates is a top concern at state and national levels. President Obama’s call for an increase of five million degrees and certificates by 2020 is in response to a decline in levels of higher education attainment in the United States compared to other large industrialized nations. To meet this challenge, each college would need to increase the number of degrees and certificates awarded by 12% per year for each of the next 10 years. This national agenda to increase completion rates is aligned with the majority of the District’s students, who report that their educational goal is to earn an associate degree.
A high percentage of students entering the District are assessed and placed in basic skills English, reading, and mathematics. However, only a small percentage of the District’s basic skills students successfully complete the next higher level course in the sequence. This goal shows the District’s commitment to developing and implementing strategies that will result in quantifiable gains in student achievement at all levels.

College of the Sequoias MASTER PLAN 2015 – 2025 87
III. College of the Sequoias will strategically tailor and implement academic programs and student services that match the unique needs of its student population and the demands of ongoing changes in the workforce.
Seventy percent of all College of the Sequoias students are the first in their family to attend college, and this is a challenge for the District. Student achievement data also demonstrates that high percentages of students need more effective approaches to strengthening prerequisite skills in the areas of English and math. These are just two examples of many facts that illustrate the District must be strategic in its implementation of programs and services based on the data describing student demographics and specific barriers to student success. Continuous im-provement through repurposing of existing resources will be important for improved efficiency and effectiveness. Similarly, the District must continue ongoing efforts to meet workforce development needs. These needs will shift several times over the next ten years and the District must build delivery and support systems with the capacity to be flexible in the expansion and contraction of programs and services. This goal shows the District’s commitment to developing and implementing strategies that will meet the unique needs of students and the demands of ongoing changes in the workforce.
IV. College of the Sequoias Board of Trustees, administration, faculty, and staff will engage in practices and staff development to sustain effective operational systems for institutional assessment and continuous improvement.
In 2013, the District underwent significant transformation in its structures and systems for governance and de-cision-making, integrated planning, resources allocation, and improving student achievement and institutional efficiency and effectiveness. This transformation served to change the fundamental culture of the District through a collective commitment to open, honest communication, transparency in decision-making, and collaborative but efficient processes. A software renewal metaphor was adopted called “COS 2.0” and served as the driving theme for the sustainability of this positive change.
In addition to clearly documented roles, responsibilities, processes and systems, the District institutionalized ac-tivities such as district-wide information forums and summits as important tools in the culture of collaboration. In order for the District to meet this goal there must be continued assessment and refinement of the processes in COS 2.0 and an ongoing commitment to data-driven decision-making for continuous improvement. This goal shows the District’s commitment to a culture of collaboration, self-assessment, and continuous improvement.

88 College of the Sequoias MASTER PLAN 2015 – 2025

College of the Sequoias MASTER PLAN 2015 – 2025 89
PROGRAMS AND SERVICES
ACADEMIC PROGRAMS
STUDENT SERVICES
SUMMARY OF GROWTH PROJECTIONS FOR ACADEMIC PROGRAMS
CHAPTER 4

90 College of the Sequoias MASTER PLAN 2015 – 2025
PROGRAMS AND SERVICES
OVERVIEWThe educational plan portion of the College of the Sequoias 2015-2025 Comprehensive Master Plan is data-driven, using an analysis of the programs and services currently offered to students as well as external scan data as the foundation to plan the District’s future.
The analysis of programs and services presented in this chapter is comprised of three components for each COS academic program and student service:
• Description, • Data, and • Growth projection.
The first two components – Description and Data – describe the programs and services currently offered to stu-dents. The Description is a narrative that summarizes the role of that program or service in a student’s matriculation through the college. The student services’ Data sections present student use data. The academic programs’ Data sections present two types of data:
• Efficiency of academic programs: these data elements are those that are used statewide to assess academic programs, such as the number of weekly student contact hours.
• Student success: these data elements reflect the percentage of students who complete a course with a pass-ing grade at the end of the semester. The analysis in this chapter compares each academic discipline’s rate of successful course completion with the statewide average of successful course completion for that discipline.
The operational definitions of these data elements are included at the end of the Academic Programs section of this chapter.
The growth projection for each program and service is derived from an analysis of the potential of that specific pro-gram or service to keep pace with the overall college growth rate. Based on the data in the Chapter 2, COS projects that the District’s credit enrollment will grow at the rate of 1.75% per year each year in the coming decade.
Obviously all components of the District will need to grow in order to serve greater numbers of students, but all will not grow at the same rate as the overall college enrollment. Therefore, in the following growth projections, each academic discipline and student service is rated as growing slower than, at the same rate as, or faster than the projected overall District growth rate of 1.75% per year each year for ten years.

College of the Sequoias MASTER PLAN 2015 – 2025 91
PROGRAMS AND SERVICES
ACADEMIC PROGRAMS
AGRICULTURE DIVISION
The primary functions of the Agriculture Division are to:
• Provide the theoretical foundation and hands-on skills and training that students need to transfer or directly enter the labor force in order to succeed in careers related to agriculture;
• Serve as a resource for the local community to educate and enhance knowledge of the agriculture and related industries.
The Agriculture Division offers six associate degrees, nine certificates of achievement, and six skills certificates. The certificates of achievement provide the major course work for an associate degree in those disciplines.
“Agriculture” includes both theoretical and applied courses in general agricultural sciences, such as soil science, environmental conservation, and entomology that help a student understand regulatory issues and state require-ments in production agriculture. “Agriculture Management” prepares students with an educational foundation to enter agribusiness-related careers such as sales and services, finance, marketing, manufacturing, public relations, management, and advertising. “Agriculture Technology” provides students with both theoretical and applied courses in the operation, repair, and maintenance of agricultural equipment. “Animal Science” is designed for students interested in working with food animal production as well as equine industry. The curriculum combines practical experience with technical knowledge for the management and produc-tion of livestock, such as beef cattle, horses, goats, sheep, and swine. “Dairy Science” gives students interested in dairy production and management the theoretical and applied founda-tion to pursue careers as a herdsman, sales representative, or technician and gives them the foundation to pursue advanced careers in dairy management and nutrition. “Ornamental Horticulture” includes theoretical and applied courses in science, technology, and business to prepare students for positions in nursery production, landscape management, landscape design, and floral design.
“Plant Science” provides students with theoretical and applied courses in the science of agricultural plant produc-tion and management that lead to careers such as a pest control advisor, farm management, and plant protection.

92 College of the Sequoias MASTER PLAN 2015 – 2025
“Veterinary Assistant” gives students the knowledge and skills to provide health care to animals and professional support to veterinarians through understanding of animal care, anatomy and physiology, parasitology, small animal handling, and general office practices.
Efficiency and Success – Agriculture Division
Efficiency
Successful Course CompletionStatewide
Successful Course Completion
(WSCH/FTEF)
Average: Fall 2009- Fall 2013
2025 TargetAverage:
2025 TargetAverage:
Fall 2009- Fall 2013 Fall 2009- 2013
AG 383 383 76% 76% 74%
AGMT 354 370 73% 75% 73%
AGTC 209 215 81% 80% 77%
ASCI 378 400 80% 80% 79%
DSCI 320 320 82% 82% 80%
OH 286 290 74% 74% 73%
PLSI 435 435 78% 73% 73%
VT 410 385 65% 65% 76%
ANALYSISAll of the disciplines in the Agriculture Division demonstrate efficiency levels below the 525 standard for lecture courses, which is to be expected given that these courses include extensive hands-on laboratory experiences where a limited number of students can be safely accommodated. In some disciplines, enrollment is a challenge due to the cyclic nature of the agriculture industry, which challenges recruitment strategies and enrollment. The stu-dent successful course completion rate is comparable to the statewide averages for all disciplines except Veterinary Technician. However, recent data show that basic skills are a challenge within many of the disciplines within the Agriculture pathway. Past work with the Basic Skills Initiative has shown that cohorted programs with embedded basic skills and career/industry connections provide greater opportunities for success. District efforts in equity and student success must be applied to this population of student within this Division.

College of the Sequoias MASTER PLAN 2015 – 2025 93
GROWTH PROJECTIONSAll of the disciplines in the Agriculture Division are projected to grow at the same rate as the District growth, much of which can be accomplished through student recruitment and by balancing larger enrollment in introductory courses with smaller enrollment in advanced courses. The programs that are staffed entirely with adjunct faculty will grow at a lower rate due to the challenge of offering programs at times most convenient to the student population.
CHALLENGESThe primary challenges for the disciplines in the Agriculture Division are to: • Maintain growth of enrollment across multiple and varied disciplines;• Maintain currency with ever-changing technology; • Improve the rates at which students successfully complete certificates; and• Support the varied laboratories required by a diverse agriculture program.
BUSINESS DIVISION
The primary purposes of the disciplines in the Business Division are to prepare students for entry into the job mar-ket in business settings, to update the skills of those currently employed, and/or to prepare students for transfer to baccalaureate institutions. The placement of students in internships is a focus of this division. The Business Division offers five associate degrees and seven certificates of achievement.
“Accounting” includes both theoretical and applied courses in the systematic recording, analysis, explanation, and interpretation of financial transactions of a business.
“Business” includes both theoretical and applied courses for students in the practices and products of commerce.
“Computer” includes both theoretical courses and hands-on experiences in the use of computers to evaluate and to solve business issues.
“Paralegal” prepares students to successfully perform a variety of tasks to support lawyers, including maintaining and organizing files, conducting legal research, and drafting documents
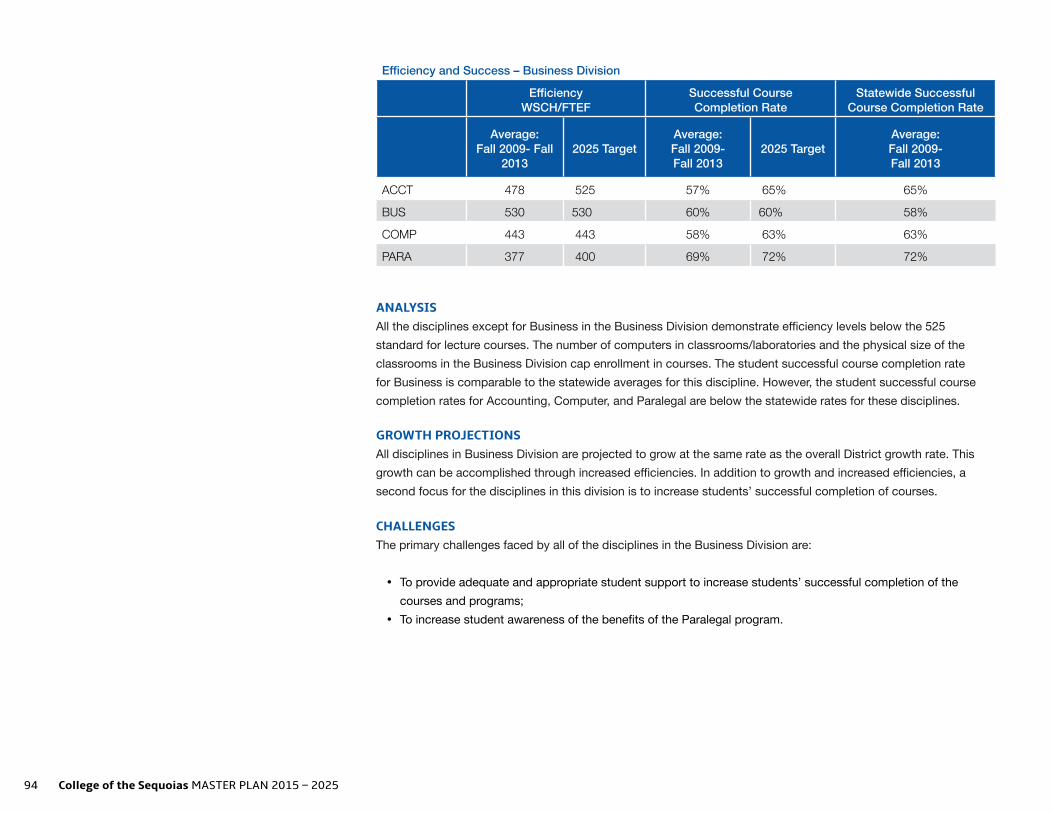
94 College of the Sequoias MASTER PLAN 2015 – 2025
Efficiency and Success – Business Division
EfficiencyWSCH/FTEF
Successful Course Completion Rate
Statewide Successful Course Completion Rate
Average:
Fall 2009- Fall 2013
2025 TargetAverage: Fall 2009- Fall 2013
2025 TargetAverage: Fall 2009- Fall 2013
ACCT 478 525 57% 65% 65%
BUS 530 530 60% 60% 58%
COMP 443 443 58% 63% 63%
PARA 377 400 69% 72% 72%
ANALYSISAll the disciplines except for Business in the Business Division demonstrate efficiency levels below the 525 standard for lecture courses. The number of computers in classrooms/laboratories and the physical size of the classrooms in the Business Division cap enrollment in courses. The student successful course completion rate for Business is comparable to the statewide averages for this discipline. However, the student successful course completion rates for Accounting, Computer, and Paralegal are below the statewide rates for these disciplines.
GROWTH PROJECTIONSAll disciplines in Business Division are projected to grow at the same rate as the overall District growth rate. This growth can be accomplished through increased efficiencies. In addition to growth and increased efficiencies, a second focus for the disciplines in this division is to increase students’ successful completion of courses.
CHALLENGESThe primary challenges faced by all of the disciplines in the Business Division are:
• To provide adequate and appropriate student support to increase students’ successful completion of the courses and programs;
• To increase student awareness of the benefits of the Paralegal program.

College of the Sequoias MASTER PLAN 2015 – 2025 95
CONSUMER/FAMILY STUDIES The primary purposes of the disciplines in the Consumer/Family Studies Division are to train students for entry into the job market, to update the skills of those currently employed, and/or to prepare students for transfer to baccalaureate institutions for further education in child development, education, nutrition and foods, fashion mer-chandising, and design. The Consumer/Family Studies Division offers four associate degrees, five certificates of achievement, and four skills certificates. The certificates of achievement provide the major coursework for associate degrees in those disciplines.
“Consumer Family Studies” is a single course on lifespan development that supports other degree and certificate programs. “Child Development” includes theoretical and applied courses in working with children from infancy to third grade.
“Culinary” includes theoretical and applied courses in the study of selecting, preparing, and cooking food.
“Education” includes two theoretical and applied transfer courses designed to introduce students to careers in teaching.
“Fashion” includes theoretical and applied courses for students interested in fashion design and/or merchandising.
“Nutrition” offers theoretical and applied courses for students interested in the study of how food is assimilated into and used by the body.
Efficiency and Success – Consumer and Family Studies Division
Efficiency(WSCH/FTEF)
Successful Course Completion
Statewide Successful Course Completion
Average: Fall
2009- Fall 2013
2025 TargetAverage:
2025 TargetAverage:
Fall 2009- Fall 2013 Fall 2009-2013
CFS 563 525 67% 72% 72%
CHLD 497 480 74% 74% 72%
CULN* 371 376 90% 75% 71%
EDUC 381 350 61% 73% 73%
FASH 622 530 61% 71% 71%
NUTR 588 530 70% 71% 71% *Fewer than five terms of data
96 College of the Sequoias MASTER PLAN 2015 – 2025
ANALYSIS“Consumer Family Studies” Efficiency for this lecture course is above the statewide benchmark for lecture courses. Students’ successful course completion rate is below the statewide average for this discipline.
“Child Development” Efficiency is below the statewide benchmark for lecture courses and students’ successful course completion rate is slightly above the statewide average for this discipline.
“Culinary” Efficiency is below the 525 standard for lecture courses, which is to be expected because the kitchen limits class size to 20 students. Students’ successful course completion rate is significantly above the statewide average for this discipline.
“Education” Efficiency is below the statewide benchmark for these lecture courses and students’ successful course completion rate is below the statewide average for this discipline.
“Fashion” Efficiency is strong for these lecture and laboratory courses. Students’ successful course completion rate is below the statewide average for this discipline.
“Nutrition” Efficiency is slightly above the statewide benchmark for lecture courses and students’ successful course completion rate is comparable to the statewide average for this discipline.
GROWTH PROJECTIONS Three disciplines in the Consumer and Family Studies Division are projected to grow at the same rate as the overall District growth rate: Child Development, Fashion, and Nutrition. For Child Development, this growth can be accom-plished through increased efficiencies. Three disciplines in the Consumer and Family Studies Division are projected to grow slower than the overall District growth rate: Consumer Family Studies, Culinary, and Education. In addition to growth and increased efficiencies, a second focus for the following disciplines is to increase students’ successful completion of courses: Consumer Family Studies, Education, and Fashion.
CHALLENGESThe primary challenges for the Consumer Family Studies, Education, and Fashion disciplines are:• To develop and implement strategies to improve students’ successful course completion rates; • To develop skills certificates in design and merchandising to allow student matriculation pathways from skills to
achievement certificates and then technical associate degrees; • To expand course offerings to other District sites; and • To develop and offer an additional skills certificate in Sanitation and Safety.
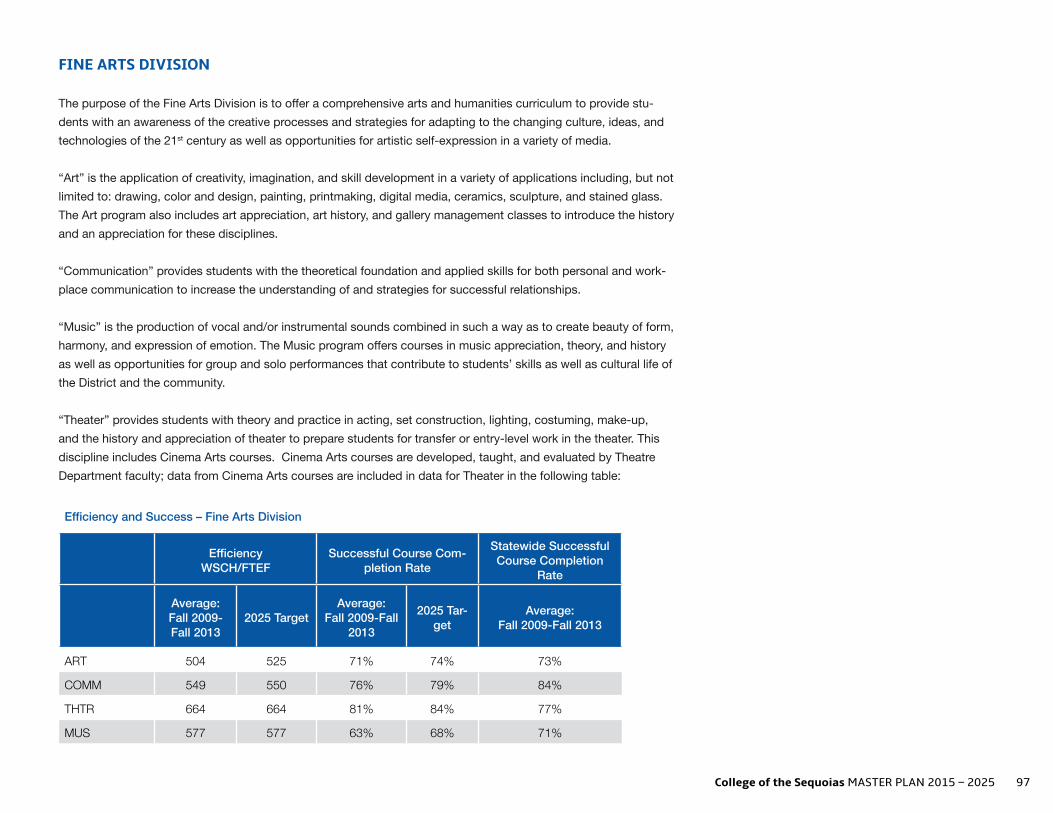
College of the Sequoias MASTER PLAN 2015 – 2025 97
FINE ARTS DIVISION
The purpose of the Fine Arts Division is to offer a comprehensive arts and humanities curriculum to provide stu-dents with an awareness of the creative processes and strategies for adapting to the changing culture, ideas, and technologies of the 21st century as well as opportunities for artistic self-expression in a variety of media.
“Art” is the application of creativity, imagination, and skill development in a variety of applications including, but not limited to: drawing, color and design, painting, printmaking, digital media, ceramics, sculpture, and stained glass. The Art program also includes art appreciation, art history, and gallery management classes to introduce the history and an appreciation for these disciplines.
“Communication” provides students with the theoretical foundation and applied skills for both personal and work-place communication to increase the understanding of and strategies for successful relationships.
“Music” is the production of vocal and/or instrumental sounds combined in such a way as to create beauty of form, harmony, and expression of emotion. The Music program offers courses in music appreciation, theory, and history as well as opportunities for group and solo performances that contribute to students’ skills as well as cultural life of the District and the community.
“Theater” provides students with theory and practice in acting, set construction, lighting, costuming, make-up, and the history and appreciation of theater to prepare students for transfer or entry-level work in the theater. This discipline includes Cinema Arts courses. Cinema Arts courses are developed, taught, and evaluated by Theatre Department faculty; data from Cinema Arts courses are included in data for Theater in the following table:
Efficiency and Success – Fine Arts Division
EfficiencyWSCH/FTEF
Successful Course Com-pletion Rate
Statewide Successful Course Completion
Rate
Average:Fall 2009-Fall 2013
2025 TargetAverage:
Fall 2009-Fall 2013
2025 Tar-get
Average:Fall 2009-Fall 2013
ART 504 525 71% 74% 73%
COMM 549 550 76% 79% 84%
THTR 664 664 81% 84% 77%
MUS 577 577 63% 68% 71%

98 College of the Sequoias MASTER PLAN 2015 – 2025
ANALYSIS“Art” Efficiency is close to the state benchmark for 525 for lecture courses. Students’ successful course completion rate is comparable to the statewide average for this discipline.
“Communication” Efficiency is above the state benchmark for 525 for lecture courses. Students’ successful course completion rate is significantly lower than the statewide average for this discipline.
“Music” Although efficiency is above the state benchmark for 525 for lecture courses, students’ successful course completion rate is below the statewide average for this discipline.
“Theater” Efficiency is well above the state benchmark for 525 for lecture courses. Students’ successful course completion rate is higher than the statewide average for this discipline.
GROWTH PROJECTIONSArt and Music are projected to grow slower than the District’s overall growth rate. Communications and Theater are projected to grow at the same pace as the District’s growth in enrollment.
CHALLENGESGiven recent changes in state regulations and policies, all of the disciplines in the Fine Arts Division are challenged to:• Strengthen and expand student involvement in the community and arts organizations;• Develop and implement strategies to improve students’ successful course completion rates.

College of the Sequoias MASTER PLAN 2015 – 2025 99
INDUSTRY AND TECHNOLOGY DIVISION
The Industry and Technology Division provides: • Students with up-to-date education and training to gain entry-level skills, upgrade their skills, or prepare for
transfer; and • Local businesses and industries with educated, trained, and competent personnel to advance the economic
growth and global competitiveness of the region.
The Industry and Technology Division offers a total of nine associate degrees, eight certificates of achievement and twenty-two skills certificates in the following disciplines: “Architecture” offers training in the process and the product of planning, designing, and constructing physical struc-tures. The curriculum includes four clusters of transferrable courses: design, visual communication, theory and history, and construction. “Automotive” offers a comprehensive array of automotive technology courses designed to give students the skills and knowledge required to perform diagnosis, service, and repair of automotive systems in an automotive shop environment. “Construction Technology” provides students with the opportunity to acquire fundamental knowledge and skills needed for a career in building construction and associated businesses. “Drafting Technology” offers training in the drawing techniques needed to represent two- and three-dimensional buildings and objects. The courses include instruction in tactile and digital drafting techniques. “Electrician Training” offers training in the principles of electricity, circuitry, and power distribution, electrical build-ing, and safety codes. This sequence of state-approved courses is required of any person who wants to work as an electrician trainee and prepares students for the certification test mandated by law for any person performing work as an electrician.
“Electronics” is a single survey course for non-electronics majors.
“Environment Control Technology” prepares students for careers in heating and air conditioning industries.
“Graphic Design” is the study of how to combine words, symbols, and images using computer software to create visual representations of ideas, messages, and animation.

100 College of the Sequoias MASTER PLAN 2015 – 2025
“Industry and Technology” includes programs of study related to industrial maintenance, programmable logic controllers, and automation. This discipline includes training in water and wastewater treatment, which prepares students for entry-level opportunities.
“Information Technology” prepares students to become computer service technicians by introducing them to the skills needed to repair computers and to create and repair networks.
“Manufacturing” prepares students for careers in metalworking and follows the National Institute for Metalworking Skills standards.
“Welding” is a fabrication or sculptural process that joins materials, usually metals. When students complete a series of courses, they are eligible for American Welding Society Certification.
Efficiency and Success – Industry and Technology Division
EfficiencyWSCH/FTEF
Successful Course Comple-tion Rate
Statewide Successful Course Completion Rate
Average:Fall 2009-Fall
20132025 Target
Average:Fall 2009-Fall
20132025 Target Average:
Fall 2009-Fall 2013
ARCH 310 315 62% 65% 74%
AUTO 386 386 69% 71% 74%
CT 311 330 73% 75% 84%
DRFT 321 325 54% 62% 83%
ECT 446 446 71% 74% 77%
ELEC 470 470 80% 82% 82%
ET* 388 390 83% 85% 96%
GD 318 320 71% 72% 72%
IT 468 468 82% 80% 65%
ITEC 483 483 76% 78% 79%
MANU*^ 100% 77% 77%
WELD 278 290 78% 78% 77% *Fewer than five terms of data ^ Does not generate WSCH

College of the Sequoias MASTER PLAN 2015 – 2025 101
ANALYSISThe efficiency ratings of the disciplines in the Industry and Technology Division are lower than the state benchmark of 525, which is to be expected given that these courses include extensive hands-on laboratory experiences and a limited number of students can be safely accommodated in these settings. Students’ successful course com-pletion rates for most all of the programs in this division are below the statewide averages for the same disciplines. The only disciplines with successful course completion rates that exceed the statewide averages are Information Technology, Manufacturing, and Welding. Student success rates are a challenge in multiple disciplines. Some of the success challenges revolve around the deficiencies that students have with basic skills and problem solving, which are required in these highly technical fields. The challenge is to develop and implement strategies to in-tegrate instruction in basic skills with content-specific instruction in a way that enhances success. Secondarily, students often choose programs in the Industry and Technology department as they have been led to believe the coursework is less rigorous. Research has shown that cohort programs with embedded basic skills and career/industry connections provide greater opportunities for success. District efforts in equity and student success must be applied to this population of student.
GROWTH PROJECTIONSSeven disciplines are projected to grow slower than the District’s overall growth rate due to the size of available facilities, amount of available current equipment, and/or limited job market needs: Architecture, Automotive, Con-struction Technology, Electronics, Graphic Design, Manufacturing, and Information Technology. Four disciplines are projected to keep pace with the District’s overall growth rate contingent on available facilities and/or continued job market demands: Environment Control Technology, Electrical Training, Industrial Maintenance, and Welding.
CHALLENGESThe primary challenges of the Industry and Technology Division are:
• To provide sufficient and appropriate facilities to house all Industry and Technology programs; • To develop and implement strategies to integrate instruction in basic skills with content-specific instruction;• To develop and implement strategies to integrate instruction in basic skills with content-specific instruction in a
way that enhances success; and • To increase Career guidance in the programs within Industry and Technology to help students understand the
rigor and commitment necessary to achieve the career pathways within these disciplines.

102 College of the Sequoias MASTER PLAN 2015 – 2025
LANGUAGE ARTS DIVISION
The Language Arts Division is committed to enriching the lives of students through enhancing their language and thinking skills. The Language Arts Division offers four associate degrees (American Sign Language, English, Jour-nalism, and Spanish), two certificates of achievement (writing consultancy and Spanish interpretation), and three skills certificates (English as a Second Language: Beginning, Intermediate, and Advanced).
“American Sign Language” is the predominant sign language of deaf communities. ASL courses focus on effective communication and introduce hearing students to the deaf community and culture. “English” courses focus on the development of composition, critical thinking, and critical reading skills. Offered at the developmental and transfer-levels, these courses provide students with intensive instruction and practice in the composition, reading, revision, and editing of academic essays and literary analysis. “English as a Second Language” courses provide foundational speaking, reading, and writing skills in English that address the needs of immigrants, refugees, multilingual, and international students for literacy skills that are essen-tial for successful postsecondary education and employment.
“Journalism” is the academic study of reporting the news in multiple formats including print, online, and visual me-dia. Student participation in the journalism program includes an opportunity to contribute and develop leadership in the District’s student newspaper.
“Linguistics” is the study of the nature, structure, and acquisition of human language. Linguistics offers a single course that addresses how language acquisition intersects with K-12 pedagogy.
“Portuguese” courses provide an introduction to understanding, speaking, reading, and writing Portuguese, which is one of two foreign languages offered by the District.
“Spanish” courses provide an introduction to understanding, speaking, reading, and writing Spanish, which is one of two foreign languages offered by the District.

College of the Sequoias MASTER PLAN 2015 – 2025 103
Efficiency and Success – Language Arts Division
EfficiencyWSCH/FTEF
Successful Course Comple-tion Rate
Statewide Successful Course Completion Rate
Average:Fall 2009-Fall
20132025 Target
Average:Fall 2009-Fall
20132025 Target Average:
Fall 2009-Fall 2013
ASL 488 450 82% 80% 74%
ENGL 390 380 61% 64% 67%
ESL^ 375 76% 75% 75%
JOUR 416 400 66% 69% 69%
LING* 406 425 70% 70% 66%
PORT 444 435 72% 70% 62%
SPAN 425 435 79% 75% 68%
*Less than five terms of data ^FTEF value very small in fall 2009
ANALYSISAll disciplines in the Language Arts Division are below the state efficiency benchmark of 525. This lower efficiency is to be expected in three disciplines in this Division due to limited enrollment: English composition classes are capped at 25 students and all other English courses are capped at 30 students; Spanish courses are capped at 29 students; and English as a Second Language courses are capped at 27-30 students. Students’ successful course completion rates meet or exceed the statewide averages for these five disciplines: American Sign Language, English as a Second Language, Linguistics, Portuguese, and Spanish. The success rates for English and Journalism are below the statewide averages for these disciplines. Targets for success rates take into account increased rigor in assess-ment moving forward.
GROWTH PROJECTIONSEnglish is projected to grow faster than the District’s overall growth rate due to the current unmet demand for these courses and the implementation of English 251(pre-transfer level) as a prerequisite for many social science courses. Four disciplines in the Language Arts Division are projected to keep pace with the District’s overall growth rate: American Sign Language, English as a Second Language, Linguistics, and Spanish. Both Journalism and Portuguese are projected to grow slower than the District’s overall growth rate.
CHALLENGESThe primary challenges for the disciplines in the Language Arts Division are to:
• Extend offerings to Hanford Education Center and Tulare College Center; • Increase the rate at which students successfully complete English courses.

104 College of the Sequoias MASTER PLAN 2015 – 2025
LEARNING RESOURCE CENTER
The primary purposes of the Learning Resource Center are to:
• Develop and maintain a collection of current print, multimedia, and electronic sources and materials that sup-port curricula;
• Ensure student, faculty, and staff access to those materials both on all campuses and through remote access by maintaining electronic databases, an online catalog, and circulation system;
• Provide students with the information competency skills of finding and evaluating information through class-room presentations and Library courses; and
• Assist students in developing and strengthening the knowledge and skills they need to reach their academic goals.
The three components of the Learning Resource Center are:
• The “Computer Commons” is an open-access student computer laboratory with access to Blackboard, the Internet, and Microsoft Office products needed to complete homework assignments. There are 94 computers at Visalia Campus, 16 computers at Hanford Educational Center, and 36 computers at Tulare College Center.
• The “Library” collection of print materials, which includes 55,064 at Visalia Campus, 639 at Hanford Education-al Center, and 869 at Tulare College Center, can be accessed from any site through inter-library loans. Stu-dents across the District are served by the Library online collection that includes over 13,000 eBooks as well as videos and over 20 databases that provide access to thousands of magazine, journal and newspaper articles, and online reference books. Reference librarians at each District location provide students with one-on-one help in locating materials and completing assignments. The COS Library website provides links to materials and formats for citing resources, a research planner, and an opportunity to email questions to a librarian.
• “Tutorial Services” provides students with support of course content and study strategies in basic skills as well as a wide range of transfer courses clustered into these categories:
- Tutorial Center: A place for small-group tutoring from trained peer tutors in almost all subjects. - Learning Skills Lab: A part of the Disability Resource Center, the lab offers classes in applied study skills
(open to all COS students), and provides assistance to COS students with verified disabilities and helps them improve their study skills.
- Math Center: The Math Center is staffed by both full-time and adjunct members of the Mathematics De-partment as well as trained tutors. Students who are enrolled in a math course can get quality tutoring in the Math Center, which will help them succeed in their courses and increase their understanding of mathematical concepts.
- Writing Center: A place for writers in any discipline, at any level of experience to come for useful, practi-cal feedback on any stage of their writing from trained peer writing consultants, supervisors, and faculty.

College of the Sequoias MASTER PLAN 2015 – 2025 105
Efficiency and Success – Library Division
EfficiencyWSCH/FTEF
Successful Course Completion Rate
Statewide Successful Course Completion Rate
Average:Fall 2009-Fall
20132025 Target
Average:Fall 2009-Fall
20132025 Target Average:
Fall 2009-Fall 2013
LIBR NA* 75% 75% 66%
*LIBR courses do not generate WSCH, therefore no Efficiency ratio
Learning Resources
2008-09 2009-10 2010-11 2011-12 2012-13
Writing Center (ENGL 400)
Student Count 647 1,106 1,280 1,429 1,362
Hours Logged 2,629 3,714 3,558 4,986 3,541
Math/Tutorial Center (MATH 400 + LIB 425)
Student Count 927 1,387 1,788 1,826 1,810
Hours Logged 9,460 12,839 20,811 22,701 17,653
ANALYSISStudent use of the Learning Resource Center building does correlate with the FTES of the college (data set 11b in Chapter 2). Data for tutorial services do not show clear trends in hour usage, making it difficult to anticipate need. This could be due to hours, availability, and/or budget fluctuations in individual tutoring service areas. The student count for tutorial services mostly trends upward leading us to prepare for growth in this area. GROWTH PROJECTIONThe Learning Resource Center is projected to grow at the same rate as the overall District growth rate.
CHALLENGESChallenges for the Learning Resource Center are:
• Assess the unmet need for overall LRC services at site locations;• Standardize data to analyze and evaluate areas providing different services in one department; and• Increase faculty and students’ awareness of the available services.

106 College of the Sequoias MASTER PLAN 2015 – 2025
MATHEMATICS AND ENGINEERING DIVISION
The Mathematics and Engineering Division includes three disciplines: mathematics, engineering, and computer science. The Mathematics and Engineering Division offers two associate degrees.
“Computer Science” is the systematic study of the feasibility, structure, expression, and mechanization of the algo-rithms that underlie the acquisition, representation, processing, storage, communication of, and access to informa-tion. The District offers two introductory computer sciences courses as support for the engineering program.
“Mathematics” is the abstract deductive study of structure and pattern that is the foundation of science and technology. The mathematics department’s mission is to provide a foundation for liberal arts education and the sciences by providing students with a broad range of courses taught through several delivery options, including traditional lecture, hybrid, online, and simulcast courses. Mathematics courses are offered at the basic skills level and the transfer, general education level. Mathematics courses are prerequisites to other majors as well as many career technical education programs.
“Engineering” is the application of scientific, mathematical, economic, social, and practical knowledge in order to design, build, maintain, and improve structures, machines, devices, systems, materials, and processes. Engineer-ing courses are designed to prepare students for transfer to university engineering programs by providing the lower division courses typically required for this major.
Efficiency and Success – Math and Engineering Division
EfficiencyWSCH/FTEF
Successful Course Comple-tion Rate
Statewide Successful Course Completion Rate
Average:Fall 2009-Fall
20132025 Target
Average:Fall 2009-Fall
20132025 Target Average:
Fall 2009-Fall 2013
CSCI 265 300 70% 70% 63%
ENGR 303 320 84% 84% 73%
MATH 619 625 51% 55% 55%

College of the Sequoias MASTER PLAN 2015 – 2025 107
ANALYSISEfficiency for engineering and computer science is significantly below the state benchmark of 525 and the student successful course completion rate is higher than the statewide average for engineering. Both of these results can be attributed to the prerequisite that students complete calculus courses prior to enrolling in engineering courses. Efficiency for mathematics is above the state benchmark of 525 and the student successful course completion rate for mathematics is slightly below the statewide average for this discipline.
GROWTH PROJECTIONSMathematics is projected to grow faster than the District overall growth rate, Engineering is projected to grow at the same rate, and Computer Science is projected to grow slower.
CHALLENGESThe primary challenges for Mathematics are:• To keep current on innovative methods to improve student success; • To provide the needed courses at all three District sites.
The primary challenges for the disciplines of Engineering and Computer Science are:• To increase student awareness and enrollment; • To expand student support programs, such as PASEO (Promoting Achievement and Scholarship with Enrich-
ment Opportunities), SURGE (Science Undergraduate Research Group Experience), and MESA (Mathematics Engineering Science Achievement).

108 College of the Sequoias MASTER PLAN 2015 – 2025
NURSING/ALLIED HEALTH DIVISION
The primary purpose of the disciplines in the Allied Health Division is to train beginning practitioners to effectively meet clients’ health care needs in a variety of settings. The programs prepare students for entry-level occupations as well as transfer to baccalaureate institutions.
“Emergency Medical Technician” consists of one five-unit course that includes both theory and clinical skill practice that prepares students with the knowledge and skills required to safely practice as an entry-level Emergency Medi-cal Technician. Successful completion of this course culminates in a certificate of completion that may be used for job entry or as a prerequisite to the Fire Academy and other career technical education programs. Students who complete the certificate may apply to take the National Registry of Emergency Medical Technician exam.
“Registered Nursing” consists of 43 units of theory and clinical practice, which prepares students to practice safe, competent, compassionate, ethical, and quality care as a registered nurse. Upon successful completion of this as-sociate degree, students may take the National Council Licensure Examination for state licensure and may pursue job entry and/or transfer to a baccalaureate institution. The nursing program is accredited by the California Board of Registered Nursing.
“Nursing Assistant” consists of one six-unit course that includes both theory and clinical skill practice that prepares students with the knowledge and skills required to safely practice as an entry-level nursing assistant. Successful completion of this course culminates in a skills certificate that may be used for job entry and/or as a prerequisite for taking the Certified Nursing Assistant Examination.
“Pharmacy Technician” includes both theoretical and externship courses to prepare students with the knowledge and skills required to safely practice as an entry-level pharmacy technician. Successful completion of the courses required for the 10-unit skills certificate may be used for job entry and/or as a prerequisite for taking the Pharmacy Technician Certification Examination (PTCE). “Physical Therapist Assistant” prepares students to provide competent, caring, and quality physical therapy under the supervision of a physical therapist. Upon successful completion of this associate degree (43.5 units), students may take the Physical Therapist Assistant Examination and the California Law Examination. The program is accred-ited by the Commission on Accreditation of Physical Therapy Education.

College of the Sequoias MASTER PLAN 2015 – 2025 109
Efficiency and Success – Nursing/Allied Health Division
Efficiency WSCH/FTEF Successful Course Completion Rate Statewide Successful Course Completion Rate
Average:Fall 2009-Fall 2013 2025 Target Average:
Fall 2009-Fall 2013 2025 Target Average:Fall 2009-Fall 2013
EMT* 816 600 43% 72% 72%
NURS 228 228 95% 92% 91%
NURS 260 (Nursing Assistant) Embedded in NURS N/A N/A N/A N/A N/A
PT 528 525 78% 78% 78%
PTA* 270 270 97% 94% 93%
*Less than five terms of data
ANALYSISEfficiency is exceptionally high for the Emergency Medical Technician course, but the student successful course completion rate is exceptionally low. Low efficiency levels for the Nursing and Physical Therapist Assistant pro-grams are to be expected given the mandated student-faculty ratio for clinical courses in these disciplines. The student successful course completion rates are on par with the statewide averages for Nursing, Pharmacy Techni-cian, and Physical Therapist Assistant.
GROWTH PROJECTIONSAll disciplines in this division are projected to grow more slowly than the overall District growth rate due to limita-tions of available clinical sites.
CHALLENGESThe primary challenges faced by all of the programs in the Allied Health Division are:
• To provide adequate and appropriate student support to increase students’ successful completion of the courses and programs;
• To maintain currency in fields that is rapidly and consistently changing.

110 College of the Sequoias MASTER PLAN 2015 – 2025
PHYSICAL EDUCATION/ATHLETICS DIVISION
The Physical Education/Athletics Division provides activity/exercise courses, information on healthy lifestyle and choices, and opportunities for students to make a personal commitment to a healthier, happier, and longer life. The Physical Education/Athletics Division offers four associate degrees.
“Dance” is the discipline of moving rhythmically usually to music, using prescribed or improvised steps and ges-tures. This program examines dance choreography and performance in diverse dance styles and offers students dance skill development and performance opportunities.
“Health and Wellness” is a discipline that explores many facets of health, including principles and practices of per-sonal health, concepts of prevention and treatment of disease, maintenance of a healthy lifestyle, and nutrition.
“Intercollegiate Athletics” consists of 17 organized sports and is committed to the success of student-athletes through participation, retention, and matriculation with athletics representing the vehicle to impact life success.
“Kinesiology” is the scientific study of human movement including physiological, mechanical, and psychological mechanisms. “Physical Education Activity” courses provide students with training and practice in non-competitive physical activ-ities, such as aerobics, swimming, and yoga. This program’s mission is to develop students’ physical skills, critical thinking, and to foster students’ values, principles, ethics, and healthy lifestyles.
“Sports Medicine” refers generically to a broad field of health care related to physical activity and sports with unique specializations including performance enhancement, such as strength and conditioning training and exer-cise physiology, and injury care and management, such as athletic training. Through this program students have the opportunity to study prevention and treatment of disease and injuries related to exercise and sports as well as cardio-vascular fitness, muscle strength, flexibility, and body composition.

College of the Sequoias MASTER PLAN 2015 – 2025 111
Efficiency and Success – Physical Education Division
EfficiencyWSCH/FTEF
Successful Course Comple-tion Rate
Statewide Successful Course Completion Rate
Average:Fall 2009-Fall
20132025 Target
Average:Fall 2009-Fall
20132025 Target Average:
Fall 2009-Fall 2013
DANC 686 690 83% 85% 72%
HW 1053 990 64% 70% 69%
IA 408 450 91% 91% 90%
KINE* 360 400 70% 74% 74%
PEAC** 571 525 84% 85% 77%
SMED*** 472 472 82% 82% 76%
*Only one term of data is available ** PEAC was previously referred to as PE. Figures combined. Only 4 terms of data were used *** Figures combined from both SPLP SMED and PE SMED
ANALYSISThree of the disciplines in Physical Education/Athletics Division are above the state efficiency benchmark, including dance, health and wellness, and physical education activities. All disciplines in the division meet or exceed the statewide average of students’ successful course completion rates for these disciplines, except Health and Well-ness and Kinesiology.
GROWTH PROJECTIONSAlmost all disciplines in the Physical Education/Athletics Division are projected to grow at the same rate as the Dis-trict’s overall growth rate: Dance, Health and Wellness, Kinesiology, Physical Education Activity, and Sports Medi-cine. For many of these disciplines, growth is attainable within existing resources by increasing efficiency, such as class sizes. Intercollegiate Athletics is projected to grow slower than the District’s overall growth rate because it is unlikely that additional intercollegiate sports will be added.
CHALLENGESThe primary challenges for the Physical Education/Athletics Division are:
• To meet the need to expand offerings to Hanford Education Center and Tulare College Center; • To increase students’ successful course completion rates of Health and Wellness and Kinesiology.

112 College of the Sequoias MASTER PLAN 2015 – 2025
SCIENCE DIVISION
The Science Division provides a wide range of courses that are program/major specific, transfer level, general education; pre-vocational, and courses provided as community service with a focus on the process and product of scientific inquiry. The courses are designed to develop basic skills, knowledge levels, and critical thinking abilities in order to provide a foundation for future education in science majors. The Science Division offers five associate degrees.
“Physical Anthropology” introduces the concepts, methods of inquiry and scientific explanations for biological evolution and their application to human species, including genetics, evolutionary theory, human variation and adaptations, comparative primate anatomy and behavior, and the fossil record. The District offers one transferrable general education lecture course in physical anthropology. “Astronomy” is the study of the formation, composition, interactions, and evolution of the universe as a whole and the celestial objects comprising it, such as planets, stars, nebulae, galaxies, and black holes. The District offers one transferrable general education course in astronomy.
“Biology” is the study of life and living organisms, including their structure, function, growth, origin, evolution, and distribution. The largest department in the Division, the Biology Department offers a variety of courses for non-ma-jors and majors alike. An associate degree in biology prepares students for further study, and in some cases, for entry-level employment. Most biology courses meet four-year university transfer and community college associate degree requirements. Biology courses are required for students majoring in allied health fields such as nursing, dental hygiene, physical therapy, and sports medicine.
“Earth Science” emphasizes the application of the scientific method to the study of Earth systems. Topics include: geology (minerals, rocks, earthquakes, volcanoes, rivers, glaciers, the fossil record), oceanography (ocean compo-sition, currents, tides, coastlines), meteorology (atmospheric composition, weather, storms), and astronomy (phases of the moon, eclipses, the solar system).
“Chemistry” is the study of the composition, structure, properties, and reactions of physical matter. The Chemistry Department offers a variety of courses: an associate degree in chemistry for students who wish to transfer with a major in chemistry, introductory courses for students who wish to enter various allied health fields, and a basic chemistry course for students who need to acquire basic skills as preparation for completing a college-level chem-istry course.

College of the Sequoias MASTER PLAN 2015 – 2025 113
“Geography” (physical) is the study of the earth, including the distribution and interconnectedness of natural phe-nomena. The Geography Department offers one transfer general education course in physical geography.
“Geology” is the study of solid earth, the rocks of which it is composed, and the processes by which they change. The Geology Department offers transfer and general education courses, some of which include laboratories and field trips. An associate degree in geology prepares students for further study.
“Meteorology” is the study of the structure and processes of the earth’s atmosphere. The District offers one trans-ferrable general education course in meteorology.
“Natural Science” uses scientific methodology to identify the rules that govern the natural world. The District offers one transferrable general education course in natural science.
“Physical Science” is the study of the physics, chemistry, astronomy, and geology of nature. The District offers one transferrable general education course in physical science.
“Physics” is the study of the fundamentals of the natural world and includes classical mechanics, thermodynam-ics, electricity and magnetism, waves, relativity, and quantum mechanics. The Physics Department offers a variety of transfer-level courses. A three-semester calculus-based physics sequence is offered for students majoring in physics, engineering, or mathematics. A two-semester algebra/trigonometry-based physics sequence is offered for biological science and computer science majors. An associate degree in physics prepares students for further study and transfer.

114 College of the Sequoias MASTER PLAN 2015 – 2025
Efficiency and Success – Science Division
EfficiencyWSCH/FTEF
Successful Course Comple-tion Rate
Statewide Successful Course Completion Rate
Average:Fall 2009-Fall
20132025 Target
Average:Fall 2009-Fall
20132025 Target Average:
Fall 2009-Fall 2013
ANTH* 980 980 74% 74% 67%
ASTR 762 762 51% 60% 65%
BIOL 585 585 70% 70% 66%
CHEM 471 480 56% 62% 67%
ESCI 494 494 92% 92% 66%
GEOG** 657 657 81% 81% 65%
GEOL 483 490 77% 77% 68%
MET*** 735 735 76% 76% 64%
NSCI 330 350 88% 88% 64%
PHYS 323 350 75% 75% 70%
PSCI*** 490 490 66% 66% 64%
*Includes ANTH 011 and ANTH 012 (physical Anthropology) only **Includes GEOG 001 and GEOG 011L (physical Geography) only ***Fewer than five terms of data
ANALYSISFive of the disciplines in the Science Division exceed the state benchmark for efficiency (525): Anthropology (physical), Astronomy, Biology, Geography (physical), and Meteorology. Three of the disciplines are slightly below the state benchmark: Chemistry, Geology, and Physical Science. Two of the disciplines are significantly below the state benchmark: Natural Science and Physics. All disciplines in the Science Division have successful course com-pletion rates greater than the statewide averages in those disciplines, except Astronomy and Chemistry.
GROWTH PROJECTIONSContingent on the availability of laboratory space, both Biology and Chemistry are projected to grow faster than the District’s overall growth rate. All remaining disciplines in this division are projected to grow at the same rate as the District: Anthropology (physical), Astronomy, Geography (physical), Meteorology, Natural Science, Physical Science, and Physics.

College of the Sequoias MASTER PLAN 2015 – 2025 115
CHALLENGESThe challenges for the Science Division include developing strategies:
• To support faculty currency in the ever changing field of science; • To expand course offerings and services to both the Hanford Education Center and Tulare College Center.
SOCIAL SCIENCE DIVISION
The Social Science Division is dedicated to helping students develop their intellectual, personal, and civic poten-tial through the study of the human condition. Social scientists use various methods to make decisions including reasons, emotions, and the scientific method. The Social Science Division offers seven associate degrees and one certificate of achievement.
“Administration of Justice” examines the structure, function, laws, procedures, and decision-making processes of the police, courts, and correctional agencies that constitute the criminal justice system. The courses in this disci-pline prepare students for transfer to four-year institutions as well as advanced technical training that includes basic peace officer and correctional academies. The basic police academy is described in this document under Police Science. “Anthropology” includes cultural and archaeology anthropology. Cultural anthropology studies and compares human culture focusing on a set of central issues: how people make a living and organize themselves; how they communicate; how they make distinctions among themselves; and the effect of social inequalities, culture change, and globalization. Archaeology contributes to knowledge of the human past, including the history and interdisci-plinary nature of archaeological research; dating techniques; methods of survey, excavation, analysis, and interpre-tation; cultural resource management; professional ethics; and selected cultural sequences. The District offers two transferrable general education lecture courses in anthropology: introduction to cultural anthropology and introduc-tion to archaeology. “Economics” examines the production, distribution, and consumption of goods and services through the study of economic theories that explain how the choices made by individuals, firms, and governments impact scarce resources. “Ethnic Studies” uses an interdisciplinary approach covering periods of social, cultural, and historical developments of various ethnic groups. Topics include: motives for migration, immigration, assimilation, social mobility, social change, contributions, and conflicts as well as the creation of a modern multicultural society.

116 College of the Sequoias MASTER PLAN 2015 – 2025
“Geography” (cultural) is the study of the earth, including the distribution and interconnectedness of cultural phe-nomena. The Geography Department offers one transfer general education course in cultural geography.
“History” is the study of the context of all human activity, with an emphasis on using that knowledge to foster stu-dents’ understanding of today’s society and their place in it. “Human Services” is a career technical education program that prepares students for entry-level paraprofessional positions in social services agencies and/or for transfer to four-year institutions. “Philosophy” is the study of the fundamental nature of reality, knowledge, and values through a critical analysis of assumptions or beliefs. Religious studies encompass the nature, function, origin, history, and tenets of the various religions.
“Political Science” is the study of the processes, principles, and structures of government and political institutions and includes an analysis of issues that governments face in developing policies in the current domestic and global context. “Psychology” is the scientific study of mental processes and behavior. The District offers a wide range of psycholo-gy courses.
“Social Science” consists of two courses, statistics and street law, both of which complement all social sciences programs.
“Sociology” is the study of human social behavior, groups, and the influence of environment on behavior.

College of the Sequoias MASTER PLAN 2015 – 2025 117
Efficiency and Success – Social Science Division
EfficiencyWSCH/FTEF
Successful Course Comple-tion Rate
Statewide Successful Course Completion Rate
Average:Fall 2009-Fall
20132025 Target
Average:Fall 2009-Fall
20132025 Target Average:
Fall 2009-Fall 2013
AJ* 583 583 67% 70% 80%
ANTH** 849 849 62% 65% 70%
ECON 583 583 65% 65% 64%
ETHN 699 699 68% 68% 66%
GEOG*** 716 716 67% 67% 65%
HIST 589 589 57% 60% 62%
HSRV 428 490 53% 60% 73%
PHIL 514 525 63% 65% 65%
POLS 675 680 56% 60% 64%
PSY 628 650 71% 71% 67%
SOC 425 525 72% 72% 66%
SSCI**** 390 450 66% 66% 66% *Does not include Police Science courses **Includes ANTH 010 (cultural) only ***Includes GEOG 002 (cultural) only ****Fewer than five terms of data
ANALYSISAll of the disciplines in the Social Science Division are comparable to or exceed the state benchmark for efficiency (525) except Human Services and Sociology. The successful student course completion rates for five disciplines in the Social Science Division are below the statewide success rates: Administration of Justice, Anthropology (cultural), History, Human Services, Philosophy, and Political Science. The remaining seven disciplines in the Social Science Division meet or exceed the statewide student successful course completion rate for those disciplines. In spring 2013 the Social Science Division added an English prerequisite to many courses, which has resulted in improved rates of successful course completion.

118 College of the Sequoias MASTER PLAN 2015 – 2025
GROWTH PROJECTIONSPsychology, Philosophy, and Social Science (Statistics) are projected to grow faster than the District’s overall growth rate. All other disciplines in this Division are projected to grow at the same rate as the District: Administra-tion of Justice, Anthropology (cultural), Economics, Ethnic Studies, Geography (cultural), History, Human Services, Political Science, and Sociology.
CHALLENGESThe challenges for the Social Science Division include:
• Developing and implementing instructional strategies to successfully engage students in large lecture sections;• Expanding course offerings to the Hanford Educational Center and the Tulare College Center to support pro-
gram completion and transfer from those sites; • Maintain increased efficiency (FTES/FTEF) for all courses; and • Identify strategies that will improve online course success and completion.
FIRE TECHNOLOGY, POLICE SCIENCE, AND WORK EXPERIENCE The purpose of the “Fire Technology” program is to provide a cost-effective, professional and technical education and training program to prepare students for entry-level or higher employment opportunities in the fire service field. The program includes three components: firefighter 1 and 2 academies, six core courses, and nine fire officer courses. Students who successfully complete the firefighter 1 and firefighter 2 academy courses are eligible to take certification tests in firefighting. Students who complete the fire academy and the six core courses along with general degree requirements are awarded an associate degree in fire technology.
The program complies with the regulations of and is accredited by California State Fire Training, a division of the State Fire Marshal’s Office. The Fire Technology program offers one associate degree, one certificate of achieve-ment, and one skills certificate.
The purpose of the “Police Science” program is to provide the highest quality possible in basic and in-service train-ing courses for law enforcement and corrections personnel who protect and serve local communities. The course content and required instructional hours meet or exceed the California Commission on Peace Officers’ Standards and Training and the Standards and Training for Corrections mandates.

College of the Sequoias MASTER PLAN 2015 – 2025 119
The purpose of the “Work Experience” program is to provide students with the opportunity to develop skills and knowledge by integrating classroom study with planned, supervised work experience. Three primary benefits of this program are:
• Expose students to situations beyond classroom activities by offering learning in a real world setting;• Validate or revise students’ career choice; and• Offer the opportunity for students to build a network of mentors and/or potential employers.
These courses document students’ experiences related to their careers outside of the classroom and earn units that transfer as elective credit. Courses may be linked to specific occupations or may be general work experience. Students may enroll in a total of four semesters, earning a maximum of four units each semester. Work experience courses are offered in most of the District’s disciplines.
Efficiency and Success – Special Programs Division
EfficiencyWSCH/FTEF Successful Course Completion Rate Statewide Successful Course
Completion Rate
Average:Fall 2009-Fall 2013 2025 Target Average:
Fall 2009-Fall 2013 2025 Target Average:Fall 2009-Fall 2013
FIRE 344 344 79% 79% 87%
PS* 220 220 90% 90% 66%
WEXP* 347 300 78% 73% 73%
*Fewer than five terms of data
ANALYSISFire Technology, Police Science, and Work Experience programs are all below the state benchmark of 525 in effi-ciency. This is to be expected in Fire Technology and Police Science courses because the mandated student-to-in-structor ratio limits enrollment in both applied and lecture courses in these disciplines. Although the student suc-cessful course completion rate for Fire Technology is below the statewide average for this discipline, fall data are not a fair representation of student success in this program because the basic fire academy is only offered in spring semester at COS. Fall data includes only prerequisite courses where success rates are lower, thereby not creating a fair comparison. The data presented for Work Experience only represents sections of general work experience, (WEXP 191 and WEXP 192). Data for vocationally specific sections of Work Experience, (WEXP 193,194,195, and 196) have been distributed to related departments or divisions and are not included here. Because of the nature of work experience

120 College of the Sequoias MASTER PLAN 2015 – 2025
courses, WSCH, as a measure of efficiency, may not be the best calculation for program evaluation. Work Experi-ence is outside the standard parameters of academic departments. In Work Experience courses, students are able to enroll in variable units (1-4) depending on the number of hours they will complete. WSCH will appear low if a ma-jority of students are participating in 1-2 unit sections. The student successful course completion rates for Police Science and Work Experience courses are significantly above the statewide averages for similar programs.
GROWTH PROJECTIONSFire Technology: Projected to grow at the same rate as the District contingent on local workforce demands
Police Science: Projected to grow at the same rate as the District contingent on local workforce demands
Work Experience: Projected to grow at the same rate as the District
CHALLENGESThe primary challenges of the Fire Technology and Police Science programs are:
• To make students aware of the career opportunities in these fields;• To maintain the currency of the curriculum given changes in state regulations.
The primary challenge of the Work Experience program is: • To increase both student and employers’ awareness of the benefits offered by this program.

College of the Sequoias MASTER PLAN 2015 – 2025 121
OPERATIONAL DEFINITIONS FOR ACADEMIC DIVISIONS PLANNING TABLES
Efficiency - (WSCH/FTEF)This table reflects the ratio of WSCH / FTEF. Please reference the WSCH and FTEF tables to better understand the productivity values. The statewide goal for this ratio is 525.
A course-level example: WSCH = 3 hours x 35 students = 105 divided by .20 teaching load = 525 productivity.
Weekly Student Contact Hours (WSCH) Weekly Student Contact Hours refers to the total number of student contact hours generated in an active class (sec-tion) regardless of the accounting method used.
WSCH = (equivalent weekly contact hours * all enrollments)
For example, if a lecture class with 25 students meets three hours per week, the WSCH for the class is 75. All con-tact hours accounting methods are incorporated into this figure (daily, actual, and weekly)
Full-Time Equivalent Faculty (FTEF) Full-time equivalent generated by full time faculty and adjunct faculty (including administrative educators).
The typical or normal faculty workload is 15 instructional/lecture hours per semester, or 1.0 Full-Time Equivalent Faculty (FTEF). Thus, a three hour lecture course will generate 1/5 of a Full-Time Equivalent Faculty load, or .2 FTEF
Successful Course Completion Rate(Letter grades A, B, C, CR, or P / all grades issued). Plus and minus grades are included.
Statewide Successful Course Completion(Letter grades A, B, C, CR, or P / all grades issued). Plus and minus grades are included.
Note: Statewide success rates are grouped by the TOPS Codes associated within each Department.

122 College of the Sequoias MASTER PLAN 2015 – 2025
PROGRAMS AND SERVICES
STUDENT SERVICES PROGRAMS
ADMISSIONS AND RECORDS
The principle functions of Admissions and Records are:
• To provide for efficient and orderly processes of applications, admissions, registration, program changes, grade reporting, degree and enrollment verification, official transcripts, general education certification, transcript eval-uation, and residency issues;
• To develop, implement and support Admissions and Records services in accordance with all applicable laws, regulations, and policies.
The Admissions and Records Office is staffed during regular business hours at all three District sites. Students may access information and forms online as well as complete certain tasks, such as registering and making payments.
Official Transcripts, Applications, and Awards Processed
2008/09 2009/10 2010/11 2011/12 2012/13
Transcript Production Total 12,171 11,674 12,498 11,592 11,677
Paper 12,171 11,658 11,839 10,796 10,185
Electronic 0 16 659 796 1,492
Incoming Transcript Total 2,401 2,446 2,371 ,2255 1,942
Paper 2,401 2,305 2,155 1,993 1,589
Electronic 0 1 138 174 250
Student not in Banner 0 140 78 88 103
Applications Processed Total 20,999 23,576 22,938 17,050 15,739
Fall 13,816 15,084 15,134 10,876 10,126
Spring 7,183 8,492 7,804 6,174 5,613
Awards Processed Total 1,198 1,635 1,724 1,427 1,549
Associate Degrees 737 852 1,001 901 988
Certificate of Achievement 384 278 208 210 229
Skills Certificate 77 505 515 316 332
College of the Sequoias MASTER PLAN 2015 – 2025 123
ANALYSISAlthough the number of transcripts produced electronically doubled between 2012 and 2013, the percentage of those produced electronically is relatively low, with 13% of the transcripts produced electronically in the most recent year. Similarly, the receipt of transcripts electronically has steadily increased in the past three years, but con-stitutes only 14% of the total incoming transcripts.
GROWTH PROJECTIONAdmissions and Records services are projected to grow at the same pace as the District enrollment, 1.75%.
CHALLENGESAdmissions and Records anticipates an increase in demand for services associated with applications, transcripts, and awards issued. Specific challenges in these areas are:
• How to reduce the handling of paper;• How to increase students’ reliance on services provided online.
ASSESSMENT
The primary purposes of Assessment services are to:
• Provide students and counselors with basic skills assessment data to be used for accurate placement in En-glish, English-as-a-Second-Language, and mathematics courses;
• Monitor and evaluate assessment instruments and procedures for validity, reliability, and sensitivity to cultural differences.
Assessment services are available at Visalia campus on a walk-in basis during regular business hours and by appointment at the Hanford Educational Center and the Tulare College Center. Students may access information about the assessments and review materials for English and mathematics tests on the Assessment website.

124 College of the Sequoias MASTER PLAN 2015 – 2025
Assessments Administered by Academic Year
Location of Assessment 2008/09 2009/10 2010/11 2011/12 2012/13
COS Campus (any) 4,327 5,192 4,311 4,010 4,119
At High Schools 1,840 2,077 2,062 1,796 1,688
Ability to Benefit 315 303 183 77 6
Mathematics Competency 216 132 121 71 29
Total 6,698 7,704 6,677 5,954 5,842
ANALYSISThe number of students completing placement tests on campus and at high schools has fluctuated with the District’s enrollment over this five-year snapshot. There is a decline in the numbers of students taking the Ability to Benefit assessment because the Ability to Benefit testing option for establishing federal financial aid eligibility was eliminated effective June 2012. There is a decline in the numbers of students taking the mathematics compe-tency examination because students entering the District in fall 2009 and beyond can no longer use assessment test results to demonstrate competency in mathematics. The associate degree requirement is now completion of Intermediate Algebra or an equivalent course with Elementary Algebra as a prerequisite.
GROWTH PROJECTIONAssessment services are projected to grow at the same pace as the District enrollment, 1.75%.
CHALLENGESThe primary challenges for Assessment services are:
• Ensuring evaluations of the assessment instruments in a timely manner;• Keeping abreast of changing state regulations on assessment; and• Establishing new procedures as needed in concert with the state’s implementation of a centralized assessment
system.
COUNSELING
The principle functions of Counseling are to:
• Empower, educate, and advise students on how to achieve their academic, vocational, and personal goals by development of student educational plans and/or referrals to campus and community resources;

College of the Sequoias MASTER PLAN 2015 – 2025 125
• Support transfer by developing, maintaining, and disseminating general education/breadth, major preparation, course-to-course, and system-wide transferrable articulation agreements with the California State University, University of California, California Independent Colleges and Universities, and out-of-state colleges and univer-sities.
Counseling services are available by appointment and on a drop-in basis at all three District sites during regular business hours and during selected evening times. The counseling web page provides students with an online opportunity to submit questions to a counselor; these questions are answered daily.
Number of Counseling Appointments
2008/09 2009/10 2010/11 2011/12 2012/13
Visalia Campus Total 14,727 15,671 15,558 20,783 17,791
General 10,313 12,017 10,998 14,777 10,383
Extended Opportunity Programs & Services 3,326 2,867 3,202 3,017 3,073
Disability Resource Center Not tracked Not tracked Not tracked 1,008 1,244
Upward Bound Not tracked Not tracked Not tracked Not tracked 676
First Year Experience & Student Support Services 1,088 787 1,358 1,585 2,251
Athletic Not tracked Not tracked Not tracked 396 164
Hanford Educational Center Total 936 1,159 1,265 1,372 1,388
General 936 1,159 1,265 1,372 1,388
Tulare College Center Total NA NA NA NA 604
General NA NA NA NA 604
Notes: These data present the number of appointments, not the number of students served; students may have had more than one appointment in a year. Tulare College Center opened in spring 2013.

126 College of the Sequoias MASTER PLAN 2015 – 2025
Student Services Course Success and Efficiency
CoursesEfficiency Successful Course
Completion
Statewide Successful
Course Completion(WSCH/FTEF)
Average: Fall 2009- Fall
20132025 Target
Average:2025 Target
Average:
Fall 2009- Fall 2013
Fall 2009 - Fall 2013
Counseling 529 530 67% 70% 73%
Human Development 193 300 67% 70% 74% Note: Enrollment is low in these courses because student participation in these grant-funded programs is limited.
Transfer Volume (number of transfers)
Transfer Institution 2009/10 2010/11 2011/12 2012/13
UC 26 37 50 44
CSU 276 420 469 377
In-State-Private 320 275 241 261
Out-of-State 129 125 147 164
Total 751 857 907 846 Note: The methodology for counting transfers varies between the types of institutions.
Number of ID Approved Courses
ApprovedConditionally
Approved In Progress Submitted
C-ID Courses* 76 30 41 15 Note: C-ID: Course Identification Numbering System, a statewide system developed to address the need for common course numbering in California community colleges, is the assignment of the same C-ID number to transfer courses that have been judged to be comparable following a peer review of the course outlines.
ANALYSISThe number of counseling appointments for special groups increased in the past couple of years. The efficiency of Human Development courses is low for a lecture class. The successful course completion rates for both Counsel-ing and Human Development courses are below the statewide rates for these disciplines. The number of students

College of the Sequoias MASTER PLAN 2015 – 2025 127
who transfer has increased over the last four years, from 751 in 2009-2010 to 846 in 2012-2013, with the greatest increase seen in the number of students transferring to CSU. (Counseling maintains record of all transfer students.)
GROWTH PROJECTIONCounseling services are projected to grow at the same pace as the District enrollment, 1.75%.
CHALLENGESThe challenges for counseling in the next decade are:
• How to provide the needed services across the District’s three sites during the day and evening hours;• How to improve students’ success in Guidance and Human Development courses; and• How to establish a Career/Transfer Center.
DISABILITY RESOURCE CENTER
The principle function of the Disability Resource Center is to provide services and academic accommodations to students with disabilities to mitigate educational limitations affiliated with students’ disabling conditions so that they have equal access to educational information, thereby allowing them to reach their potential.
Disability Resource Center services are available by appointment and on a drop-in basis at Visalia campus during regular business hours and by appointment at the Hanford Educational Center and the Tulare College Center. The High Tech Center is located at the Visalia campus and is open during regular business hours. The Disability Resource Center web page provides students with information regarding services and accommodations, alternate media, assessment/testing services, the High Tech Center, Learning Skills Lab, and office and contact information.

128 College of the Sequoias MASTER PLAN 2015 – 2025
Disability Resource Center – Students, Visits, and Services Provided
2011/12 2012/13 Change
Disabled Student Duplicate Count
First Contact (eligibility determination) 1,529 1,331 -13%
Enrolled 692 777 12%
Primary Disabilities 1,529 1,331 -13%
Secondary Disabilities 368 285 -23%
Counseling Appointments 1,008 1,244 23%
Authorized Accommodation Forms Issued 1,000 909 -10%
Test Accommodations 1,663 2,069 24%
Interpreting Services 28 18 -36%
Learning Skills Lab
Student Count Total 343 342 0%
Disabled 178 193 8%
Non-Disabled 165 149 -10%
Positive Attendance Hours 20,233 19,008 -6%
Learning Disabilities Assessments Completed 48 26 -46%
Alternate Media
Requests Submitted/Students 250/88 272/106 9%/20%
Requests Filled 31 49 58%
Contacts with Students who Received Alternate Media Service 404 219 -43%
High Tech Center Students Served 31 23 -26%
Intakes Conducted 404 394 -3%
Total Service Contacts 26,821 25,054 -7%

College of the Sequoias MASTER PLAN 2015 – 2025 129
Learning Skills Course Success Rate
Efficiency (WSCH/FTEF)
Successful Course Completion
Statewide Successful Course Completion
Average: Fall 2009- Fall 2013
2025 TargetAverage:
2025 TargetAverage:
Fall 2009- Fall 2013 Fall 2009-2013
Learning Skills NA NA 59% 65% 72%
ANALYSISOverall the total number of service contacts decreased almost 7% over the past two years. The number of coun-seling appointments increased 2% between 2011-2012 and 2012-2013. The fall-to-spring persistence of students using services of the Disability Resource Center is slightly higher than the persistence of students in the First-year Experience program. The successful course completion rate for Learning Skills courses is below the statewide rates for these disciplines.
GROWTH PROJECTIONDisability Resource services are projected to grow at the same pace as the District enrollment, 1.75%.
CHALLENGESThe challenges for the Disability Resource Center are to:• Provide the needed services efficiently and effectively across all three District sites; • Develop and implement strategies to process potential students with disabilities in a timely manner; and• Improve students’ successful completion of Learning Skills courses.

130 College of the Sequoias MASTER PLAN 2015 – 2025
DISTRICT POLICE
The primary purpose of the District Police is to provide a safe environment in which the District’s diverse student population can learn and achieve their transfer and/or occupational goals.
District Police Staffing Schedule
Sunday Monday Tuesday Wednesday Thursday Friday Saturday
Chief 7am-5pm 7am-5pm 7am-5pm 7am-5pm 7am-5pm
Visalia Day 6am-2pm 6am-2pm 6am-2pm 6am-2pm 6am-2pm
Visalia Night 2pm-10pm 2pm-10pm 2pm-10pm 2pm-10pm 2pm-10pm
Wknd/Tul Day 8am-6pm 8am-8pm 8am-8pm 8am-6pm
Tulare PM 1pm-11pm 1pm-11pm 1pm-11pm 1pm-11pm
Hanford PM 1pm-11pm 1pm-11pm 1pm-11pm 1pm-11pm
Hanford Day (PT) 8am-4pm 8am-4pm 8am-4pm
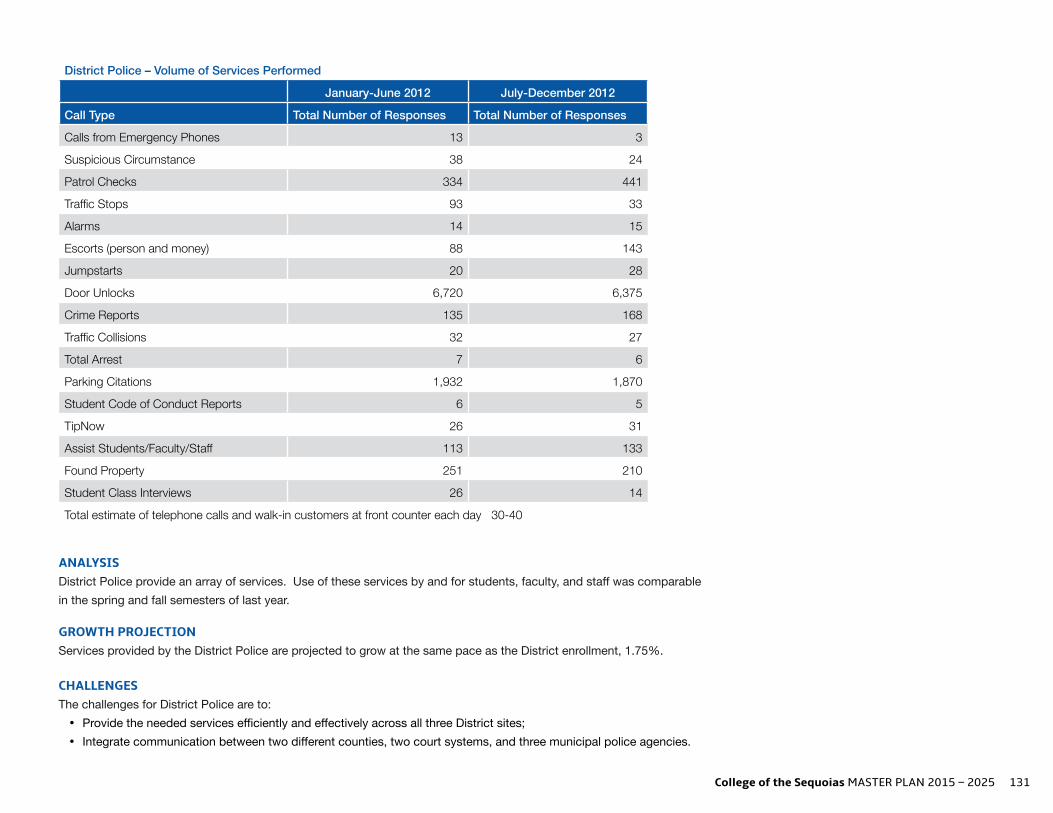
College of the Sequoias MASTER PLAN 2015 – 2025 131
District Police – Volume of Services Performed
January-June 2012 July-December 2012
Call Type Total Number of Responses Total Number of Responses
Calls from Emergency Phones 13 3
Suspicious Circumstance 38 24
Patrol Checks 334 441
Traffic Stops 93 33
Alarms 14 15
Escorts (person and money) 88 143
Jumpstarts 20 28
Door Unlocks 6,720 6,375
Crime Reports 135 168
Traffic Collisions 32 27
Total Arrest 7 6
Parking Citations 1,932 1,870
Student Code of Conduct Reports 6 5
TipNow 26 31
Assist Students/Faculty/Staff 113 133
Found Property 251 210
Student Class Interviews 26 14
Total estimate of telephone calls and walk-in customers at front counter each day 30-40
ANALYSISDistrict Police provide an array of services. Use of these services by and for students, faculty, and staff was comparable in the spring and fall semesters of last year. GROWTH PROJECTIONServices provided by the District Police are projected to grow at the same pace as the District enrollment, 1.75%.
CHALLENGESThe challenges for District Police are to:• Provide the needed services efficiently and effectively across all three District sites; • Integrate communication between two different counties, two court systems, and three municipal police agencies.

132 College of the Sequoias MASTER PLAN 2015 – 2025
EXTENDED OPPORTUNITY PROGRAMS AND SERVICES
The primary functions of the Extended Opportunity Programs and Services are to:• Recruit and successfully retain college students of educationally and socioeconomically challenged backgrounds from Kings and Tulare Counties; • Prepare students to transfer to a four-year university or complete an associate degree or vocational certificate in order to acquire the career-related skills needed to attain
rewarding employment.
The Extended Opportunity Programs and Services also provide additional support for families that receive Temporary Assistance for Needy Families as authorized by the Co-operative Agencies Resources for Education and the California Work Opportunity and Responsibility to Kids Act programs.
The Extended Opportunity Programs and Services office is open at the Visalia campus during regular business hours for appointments as well as drop-in requests. At the Hanford Educational Center and the Tulare College Center most requests are met by the cross-trained student services staff working in the student services areas and if need-ed appointments are made with counselors who visit the campuses on a routine basis. The Extended Opportunity Programs and Services web page provides students with information regarding services as well as an online application.
EOPS Applicants by Status
New Applicants Applicants Admitted Pending Ineligible
2012-2013 1,399 625 483 291
2013-2014 1,447 655 536 256
EOPS Students Served
Students Type Fall 2012 Spring 2013 2012/13 Total Fall 2013 Spring 2014 2013/14 Total
New EOPS Students 341 284 625 446 209 655
Continuing EOPS Students 412 495 907 440 554 994
Total EOPS Students 753 779 1,532 886 763 1,649
ANALYSISForty percent of the new applicants to this program were admitted in 2013-2014. Sixty percent of the students served were continuing students. Although the unduplicated student headcount decreased from 2012-2013 and 2013-2014, the number of students served by this program increased.
GROWTH PROJECTIONThe number of students that can be supported by the Extended Opportunity Programs and Services program and associated programs is contingent on state funding.

College of the Sequoias MASTER PLAN 2015 – 2025 133
CHALLENGESThe challenges for Extended Opportunity Programs and Services are to:• Provide the needed services efficiently and effectively across all three District sites; • Implement a timeline and other strategies to meet the challenge is based on fluctuating funding for categorical programs.
FINANCIAL AID
The primary functions of the Financial Aid program are to:• Provide equal access and opportunity for all eligible students to receive financial and educational support to promote their academic success; • Ensure the District’s compliance with current local, state, and federal regulations governing student financial aid.
Financial Aid representatives are available during regular business hours at all three District sites. Students may access information and forms online as well as track financial aid applications and financial aid payments.
Financial Aid Applicants and Recipients
Year # SFA Applicants # SFA Recipients Total Expenditures # Board of Governors Fee Waivers Board of Governors Expenditures
2002/03 9,617 7,088 $ 12,523,824 6,833 $ 1,277,183
2003/04 9,869 8,028 $ 13,766,661 7,119 $ 2,020,126
2004/05 9,998 8,207 $ 14,140,159 7,191 $ 3,033,936
2005/06 10,695 7,273 $ 13,605,525 6,643 $ 2,967,653
2006/07 11,171 7,634 $ 12,763,508 6,600 $ 2,593,383
2007/08 11,098 7,075 $ 15,410,002 7,023 $ 2,462,740
2008/09 13,380 8,253 $ 19,208,059 8,231 $ 2,908,320
2009/10 15,193 9,703 $ 26,146,461 9,620 $ 4,438,317
2010/11 17,173 10,058 $ 29,438,051 10,016 $ 4,478,656
2011/12 16,830 9,541 $ 28,997,343 9,502 $ 5,837,339
2012/13 10,610 9,209 $ 29,336,994 9,458 $ 7,555,914
2013/14 17,120 9,884 $ 30,884,134 9,837 $ 8,094,183
ANALYSISThe number of financial aid applicants has increased steadily over the past decade and the amount of financial aid paid to students has doubled. The number of financial aid recipients increased 20% between 2004-2005 and 2013-2014.

134 College of the Sequoias MASTER PLAN 2015 – 2025
GROWTH PROJECTIONThe demand for Financial Aid services is projected to grow at the same pace as the District enrollment, 1.75%.
CHALLENGESThe challenge for Financial Aid is to:• Provide the needed services efficiently and effectively at all three District sites.
STUDENT ACTIVITIES AND AFFAIRS
The primary purpose of the Student Activities and Affairs Office is to provide opportunities for students to enhance their educational experience, to grow personally, and to develop leadership skills through co-curricular learning activities. Students are encouraged to participate in and influence the District’s social and political environment through participation on the Student Senate and student clubs.
Student Senate Participation
Shared Governance/Student Representation 2010/11 2011/12 2012/13 2013/14
College-Wide Committees Student Reps 41 33 39 36
Student Senators/Academic Divisions 13 13 13 13
Student Senate Officers 9 9 9 9
Club Charters 50 33 43 45
Leadership Courses - Student Enrollment 66 52 48 70
Inter-Club Council Committee (reps from clubs) 50 33 43 39
Events Hosted or Participated 21 20 34 22
# Conferences/# Participants 3/32 3/49 3/43 3/47

College of the Sequoias MASTER PLAN 2015 – 2025 135
Services Provided by Student Activities and Affairs
Services 2010/11 2011/12 2012/13 2013/14
Process Student ID Cards (new & replacement) 7,506 7,346 5,311 4,268
Process Activity Benefits Stickers 5,463 5,765 5,918 5,807
Process Transit Stickers 3,367 6,234 7,091 * 7,683*
Student Driver Request Form 66 68 58 59
Process Activity Date Requests - Master Calendar 325 322 394 329
Hall Lockers 112 141 122 203
# Students in Commencement Ceremony/ % of Participants to Total # of Students Awarded Degrees 357/41% 354/40% 428/46% 465/46%
Who’s Who Awards 36 34 62 74
# of Grads Eligible for Honors Designation/# Attended Honors Reception
231/No Honors Reception 228/43 226/47 260/58
Honors Cords - processed 77 71 102 123
* This number includes summer school. There was no summer school in 2011 and 2012; summer school was reinstated in 2013.
ANALYSISThe Student Activities and Affairs Office provides a wide range of services to all students and ensures student involvement in District governance through the Student Senate. Over the last four years, eight of ten services provided by the Student Activities and Affairs Office have increased the number of students served.
GROWTH PROJECTIONServices provided by Student Activities and Affairs are projected to grow at the same pace as the District enrollment, 1.75%.
CHALLENGESThe challenge for the Student Activities and Affairs is to:• Provide student representation and involvement, efficiently and effectively, at all three District sites.
STUDENT HEALTH SERVICES
The primary function of Student Health Services is to assist the District’s diverse student population in achieving and maintaining optimal physical and emotional/mental health so that they can achieve their educational and career goals. The services provided are focused in these areas:
• Prevention of stress and illness and promotion of physical and mental health;

136 College of the Sequoias MASTER PLAN 2015 – 2025
• Life-coping skills;• Communicable disease education and prevention; and• Community service involvement.
The Student Health Services Office is staffed during regular business hours at the Visalia campus. Student health services at Hanford and Tulare are staffed on a part-time ba-sis and also provide student access to a nurse by telephone. The Student Health Services web page provides students with access to information about the available services and office schedule.
Health Services Provided
Service Visalia CampusHanford Educational Ctr Tulare College Ctr
2011/12 2012/13 2013/14 2013/14 2013/14
Over-the-counter Medicine 3,602 3,150 1,842 Not Available Not Available
Nursing 2,163 677 590 73 85
Planned Parenthood 426 286 313 Not Applicable Not Applicable
Mental Health Counseling 960 867 575 Not Applicable Not Applicable
Health Events N/A 457 691 Not Applicable Not Applicable
Flu Immunizations 704 543 684 Not Applicable Not Applicable
Blood Drives 30 Drives Total/1,245 Units Donated Not Applicable Not Applicable
Total Appointments or Attended Events 7,855 5,523 4,004 73 85
Note: The number of students tallied for health events is under-reported because many students received information but did not sign an attendance sheet.
ANALYSISThe number of nursing visits has decreased significantly over the past three years due to reductions in the number of hours that the office is open and a reduction in staffing.
GROWTH PROJECTIONStudent Health Services are projected to grow at the same pace as the District enrollment, 1.75%.
CHALLENGESThe challenges for the Student Health Center are to:• Provide the needed services efficiently and effectively at all three District sites;• Ensure that students are aware of the available services.

College of the Sequoias MASTER PLAN 2015 – 2025 137
VETERAN SERVICES
The primary function of the Veteran Services Office is to: • Assist student veterans in their transition to college by providing services that address their academic, social, and physical needs;• Assist active duty personnel and veterans’ dependents in reaching their educational goals; and• Provide access to resources especially for veterans.
Veteran Services is available by appointment and on a drop-in basis at the Visalia campus during regular business hours.
Veteran Benefit Services Provided
Benefit Received 2008/09 2009/10 2010/11 2011/12 2012/13
Process Applications and Certifications for GI Bill 204 205 152 113 116
Reserve Educational Assistance Program 13 10 11 6 5
Vocational Rehabilitation 16 25 16 11 9
GI Bill – Selected Reserve 18 17 16 12 11
Dependent Assistance 46 62 60 34 43
Post 9/11 GI Bill - 52 129 177 199
Assist with Processing BOGS Waiver 84 98 91 60 54
Veterans Served 297 371 384 353 383
Total Served 381 469 475 413 437
Note: The Veteran’s Services Office serves dependents of Veterans that are not counted as veteran students, but are entitled to the benefits.
ANALYSISOver the past five years, the number of veterans receiving services has increased from 297 in 2008-2009 to 387 in 2012-2013. The GI bill is the service used most often by students.
GROWTH PROJECTIONVeteran’s Services are projected to grow at the same pace as the District enrollment, 1.75%.
CHALLENGESThe challenge for Veteran’s Services is to:• Provide the needed services efficiently and effectively at each of the three District sites.
138 College of the Sequoias MASTER PLAN 2015 – 2025
WELCOME CENTER
The primary purposes of the Welcome Center are to:• Serve as the call center for the District;• Compile, update, and maintain all information related to District policies, student services resources, and referrals to special programs;• Provide students and visitors with materials and technology to complete steps as outlined by the Student Success and Support Program; • Assist and train students in developing skills to navigate the District’s integrated software program, email system, and course management system independently; and• Implement other strategies as needed to ease the transition process for new students.
The four components of the Welcome Center are:
• Resource Services and Referrals: The Welcome Center maintains current information about special programs, campus and community events, student success work-shops, Board policies, and administrative directives that affect students, staff, and visitors. This information is readily available to students and campus visitors and assis-tance and referrals are provided as needed.
• Orientation: The orientation program facilitates new students’ transition to college by connecting them to resources that describe the District’s educational opportunities, services, and expectations for students.
• Outreach: This program increases visibility, strengthens internal and external partnerships, and ensures accurate information is disseminated throughout the District’s communities.
• HireCOS is a job system designed to serve the needs of College of the Sequoias students. COS students registered for class may use this website to find employment, internships, and job-related resources. Employers may use this site to post jobs for students at College of the Sequoias. The system is free to use and all services are available 24 hours a day, seven days a week.
Services comparable to those provided at the Welcome Center at the Visalia campus are provided at the Hub at the Hanford Educational Center. Students at Tulare College Center can access many of these services electronically through a student kiosk.

College of the Sequoias MASTER PLAN 2015 – 2025 139
Orientation and Admissions Workshop Participants
Orientation In-Person Online Total Participants
2011/12 1,235 2,135 3,370
2012/13 925 2,554 3,479
STEPS Participation Registered at Event Registered after Event Total Participants
2013/14 1,359 197 1,556
Workshop Events Schools Visited Total Workshops Total Workshop Participants
2013/14 22 36 1,235
ANALYSISThe number of students who completed orientation online increased in the past two years.
GROWTH PROJECTIONServices provided by Outreach are projected to grow at the same pace as the District enrollment, 1.75%.
CHALLENGESThe challenges for the Welcome Center are to: • Increase faculty and students’ awareness of the available services;• Provide the needed services efficiently and effectively at each of the three District sites; and • Find a more appropriate home for HireCOS so that it is a more useful resource for students seeking employment and for employers looking for qualified staff.

140 College of the Sequoias MASTER PLAN 2015 – 2025

College of the Sequoias MASTER PLAN 2015 – 2025 141
FACILITIES PLAN
CHAPTER 5
TULARE COLLEGE CENTER
HANFORD EDUCATIONAL CENTER
VISALIA CAMPUS

142 College of the Sequoias MASTER PLAN 2015 – 2025
College of the Sequoias serves the communities of Corcoran, Exeter, Hanford, Farmersville, Lindsay, Orosi, Three Rivers, Tulare, Woodlake, and Visalia, as well as major portions of both Tulare and Kings Counties. The District’s master plan is to continue serving these communities through three campus/center sites: Han-ford, Tulare, and Visalia. The development of a facilities master plan provides analysis of the District’s effective-ness in meeting its mission and goals. The mission and goals are helpful to restate here as the foundation of the facilities master plan:
MISSION STATEMENT
College of the Sequoias is a comprehensive community college district focused on student learning that leads to productive work, lifelong learning and community involvement.
College of the Sequoias affirms that our mission is to help our diverse student population achieve its transfer and/or occupational objectives and to advance the eco-nomic growth and global competitiveness of business and industry within our region.
College of the Sequoias is committed to supporting stu-dents’ mastery of basic skills and to providing access to programs and services that foster student success.
FACILITIES PLAN
FACILITIES MASTER PLAN
DISTRICT GOAL I. College of the Sequoias will increase student enrollment relative to population growth and educational and work-force development needs.
DISTRICT GOAL II. College of the Sequoias will improve the rate at which its students complete degrees, certificates, and transfer objectives.
DISTRICT GOAL III. College of the Sequoias will strategically tailor and im-plement academic programs and student services that match the needs of its unique student population and the demands of ongoing changes in workforce develop-ment.
DISTRICT GOAL IV. College of the Sequoias Board of Trustees, administra-tion, faculty, and staff will engage in best practices and staff development to sustain and improve operational structures and systems for institutional assessment and continuous improvement.
In order to increase student enrollment, improve rates at which students complete their objectives, and tailor academic programs to meet student needs, the District must have facilities and campuses that promote these goals.

College of the Sequoias MASTER PLAN 2015 – 2025 143
The College of the Sequoias Community College District experienced significant facilities expansion in recent years with the building of the new Hanford campus, the new Tulare campus, and the renovations to the Visalia campus. The expansion and construction were pri-marily made possible from the passage of three series of bonds: College of the Sequoias – Hanford Campus Improvement District No. 1, Measure C 2006 for $22 million, College of the Sequoias – Visalia Area Improve-ment District No. 2, Measure I 2008 General Obligation Bonds for $28 million, and College of the Sequoias – Tulare Area Improvement District No. 3, Measure J 2008 General Obligation Bonds for $60 million (of which only $41.5 million was issued). These bond funds were matched with state construction funds totaling $74,775,000 since 2006, which helped to expand the scope of facilities construction and renovation. At this time, all bond funds have been expended, except for small remaining contingency funds and some interest earned.
The District also receives annual State Scheduled Maintenance funds to maintain the District facilities, with the exception of fiscal years 2010, 2011, 2012, and 2013, during which the state did not provide scheduled maintenance funds due to budget restrictions. In fiscal year 2014 the District received $109,000 for which the District provided an equal match to fund the needed scheduled maintenance projects, and in fiscal year 2015 the District received over $1 million for both scheduled maintenance and instructional equipment, of which neither component required a District match.
The Board of Trustees approves facility projects annu-ally, as outlined in the District’s five-year construction plan, which is then submitted to the state for funding consideration.
This facilities master plan will describe in detail the Tulare College Center facilities master plan overview, the Hanford Educational Center facilities master plan overview, and the Visalia campus facilities master plan overview. It will explain where we are as a District and what we have planned for the next few years regarding facilities projects, access, facility inventory, and sustain-ability.
CALCULATING SPACE NEEDS
Facilities inventory is tracked through the California Community Colleges Facilities Space Inventory da-tabase (FUSION) and includes descriptive data on buildings and rooms for each campus. This information is essential for developing the annual Five Year Capital Outlay Plan, planning for capital outlay construction projects, projecting future facility needs, and analyzing space utilization.
SPACE UTILIZATION AND PLANNING STANDARDS
Enrollment and program forecasts are applied to a set of standards for each type of space to project space capacity requirements of a college district. Following Title 5 and Chancellor’s Office standards for space utili-zation and applying those standards to the total number of students served; counted as weekly student contact hours (WSCH) creates total capacity requirements ex-
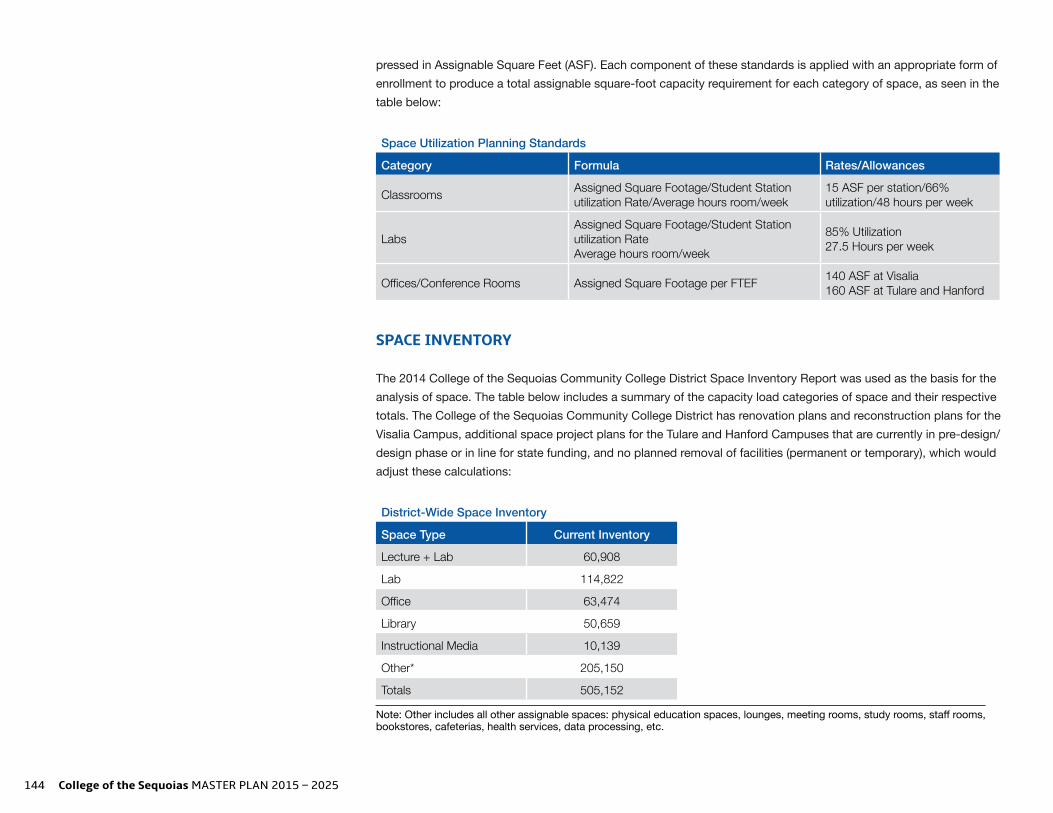
144 College of the Sequoias MASTER PLAN 2015 – 2025
pressed in Assignable Square Feet (ASF). Each component of these standards is applied with an appropriate form of enrollment to produce a total assignable square-foot capacity requirement for each category of space, as seen in the table below:
Space Utilization Planning Standards
Category Formula Rates/Allowances
Classrooms Assigned Square Footage/Student Station utilization Rate/Average hours room/week
15 ASF per station/66% utilization/48 hours per week
LabsAssigned Square Footage/Student Station utilization RateAverage hours room/week
85% Utilization27.5 Hours per week
Offices/Conference Rooms Assigned Square Footage per FTEF 140 ASF at Visalia160 ASF at Tulare and Hanford
SPACE INVENTORY
The 2014 College of the Sequoias Community College District Space Inventory Report was used as the basis for the analysis of space. The table below includes a summary of the capacity load categories of space and their respective totals. The College of the Sequoias Community College District has renovation plans and reconstruction plans for the Visalia Campus, additional space project plans for the Tulare and Hanford Campuses that are currently in pre-design/design phase or in line for state funding, and no planned removal of facilities (permanent or temporary), which would adjust these calculations:
District-Wide Space Inventory
Space Type Current Inventory
Lecture + Lab 60,908
Lab 114,822
Office 63,474
Library 50,659
Instructional Media 10,139
Other* 205,150
Totals 505,152
Note: Other includes all other assignable spaces: physical education spaces, lounges, meeting rooms, study rooms, staff rooms, bookstores, cafeterias, health services, data processing, etc.

College of the Sequoias MASTER PLAN 2015 – 2025 145
PROJECTED HEADCOUNT, WSCH, AND FTES
The table below summarizes the master plan forecast for Headcount, WSCH, and FTES.
District-Wide Enrollment Projections
2014 (college data)
2024 SCCD projections
Headcount (Fall) 10,861 12,919
WSCH (Fall) 140,625 159,587
FTES (Fall) 4,474 5,319
FTES (Annual) 9,478 11,151
SPACE NEEDS ANALYSIS
Using previous data and calculating both prescribed State Space Standards (for lecture, lab, office, library, and in-structional media) and Non-Space State Standards (all “other” as described above), the table below provides a net assessment for Assignable Square Feet (ASF) for all campus facilities to meet the needs in the baseline year.
District-Wide Space Inventory Needs
Space Type 2013-14 Space Inventory
2013-14 Additional Space Needs
2024-25 Additional Space Needs
Lecture 60,908 0 0
Lab 114,822 1,443 4,461
Office 63,474 1,157 4,898
Library 50,659 3,440 4,697
Instructional Media 10,139 9,957 9,883
Other 205,150 3,065 14,988
Totals 505,152 19,062 38,926
TECHNOLOGY NEEDS ANALYSIS
The technology available at each campus consists of desktop computers in student computer labs, desktop com-puters for faculty and staff use, and laptops for mobile computing needs. Each campus enjoys a wired network ca-pable of 1-gigabit speeds and wireless access throughout most buildings, which also allows video to the desktop. Exterior wireless “hotspots” are available in various places on each campus.

146 College of the Sequoias MASTER PLAN 2015 – 2025
The District has ensured that all campus facilities are technologically supported. All of the classrooms and meeting rooms are equipped with sufficient technology to be classified as smart classrooms. In addition, each campus has rooms that have simulcast equipment for instructional purposes to the other sites. Some older buildings at the Visalia campus need technology infra-structure upgrades, and are identified and described in the Visalia campus section below.
The District has established ongoing General Fund budgets for all necessary technology repair and re-placement, which includes a four-year refresh cycle for all student desktops and laptops, and a five to six-year refresh cycle for all staff desktops and laptops.
DEPARTMENTS
The Facilities Department is primarily responsible for grounds, maintenance, and custodial activities. It also serves as the lead department for any safety concerns reported, and conducts regularly scheduled safety meetings within the department regarding appropriate responses to facility safety issues.
The COS Police Department is primarily responsible for ensuring a safe and secure environment for all students and employees of the college, as well as for the security of real and personal property of the district. The COS Police Department works collaboratively with local agencies.
The Facilities Dean and the Police Chief co-chair the Fa-cilities Safety Council, which meets regularly to address facility safety issues on the three campuses.
SUMMARY
The findings in the facilities Planning Data section high-light that, overall the College of the Sequoias Communi-ty College District will not require a substantial amount of additional space in the master plan horizon of 2025. There will be a need for increased space at the Hanford campus by 2025, and the Visalia campus will need to continue to direct overflow students to the Tulare and Hanford campuses as planned. It is anticipated that no new bond issuances will be authorized in the next seven years, but sometime between 2022 and 2023, the District will want to begin pursuing additional bond issuances for all three campuses to address space and inventory needs during the 2025-2035 decade.

College of the Sequoias MASTER PLAN 2015 – 2025 147
FACILITIES PLAN
TULARE COLLEGE CENTER - FACILITIES MASTER PLAN
HUNSACKER AVENUE / ROAD 132
BARD
SLEY
BOU
LEVA
RD /
AVEN
UE 2
24
1
23
4 5
6
7
9
10
11 15
16
17
14
8
12
13Bldg.C
Bldg.B
Bldg.A
18
19
202125
2228
2724
26
23
Emergency Phone
MAIN CAMPUS1 Building A2 Building B3 Central Plant4 Building C5 Maintenance & Operations6 Small Animal Lab
FARM ANIMAL COMPLEX7 Heifer Pen and Shade Structure8 Beef Barn9 Two-Stall Stud Barn10 Artificial Insemination Lab11 Equine/Mare Barn12 Swine Barn13 Sheep Barn14 Multi-Specie Show Facility15 Hay Barn16 Covered Round Pen17 Covered Hot Walker
ORNAMENTALHORTICULTURE COMPLEX18 Plant Science Tool Storage19 Cashier/Control Building20 Outdoor Display Area21 Landscape Tools Storage22 Potting Building & Soil23 Storage Facility24 Annuals Greenhouse25 Perennials Greenhouse26 Indoor Plants Greenhouse27 Propagation Greenhouse28 Shade building
4999 E. Bardsley Ave. • Tulare, CA 93274 • www.cos.edu
The Tulare College Center is located on 495 acres near the City of Tulare. The full service campus is an educational facility that serves approximately 1,580 Full-Time Equivalent Students (732 face-to-face FTES, and 848 online/off-site FTES) and offers degrees and certificates in Agricultural Business Management, Agricultural Science, Agricul-tural Technology, Animal Science, Architecture, Dairy Science, Drafting, Graphic Design, Landscape Management, Ornamental Horticulture, Plant Science, Veterinary Technician, and Welding. The new campus opened in January 2013.

148 College of the Sequoias MASTER PLAN 2015 – 2025
Facilities on the Tulare campus include 27 buildings comprised of 172,146 Gross Square Feet (GSF) and 123,905 Assignable Square Feet (ASF). The marquee programs for this location are Agriculture and Architec-ture.
These certificate and degree programs are housed in Phases I and III of the Tulare College Center. Phase I facilities include the Instructional Building B, which houses classrooms and labs, and the Student Services Building A, which houses the library, bookstore, cafete-ria, and instructional and administrative support facilities and offices. Phase I also includes Building C, which is dedicated to Equipment Repair and Welding Instruction-al areas and offices.
Phase III constitutes Livestock, Equine, and Horticul-ture facilities. The Livestock facilities include the Swine unit with a farrowing house and market pens, the Beef unit with pasture access, the Sheep unit with pasture access, the Dairy unit with related labs, an Artificial Insemination Lab for all species, and a multi-species show barn. Equine facilities include an open arena, a hot walker and round pen, and equine and stud barns. The Horticulture facilities include a retail nursery, shade houses and greenhouses, and equipment storage.
The Tulare College Center farms about 320 acres, creating a source of revenue to support the agriculture education program. The master plan for the college campus consists of 120 acres of land designated for current and future expansion of instructional buildings. Of the 120 acres designated for the campus, approxi-mately 10 acres houses the Animal Science and Tech-nology Center and Horticulture Science and Technology buildings and facilities.
In Tulare, the Educational Master Plan includes:
• General Education courses: Critical for those students whose goal is to transfer or earn an AA/AS degree. General education courses at Tulare currently enable a student to meet the transfer requirements for CSU and IGETC. Currently the largest majors at the Tulare College Center are for students in transfer studies in such areas as sci-ence, mathematics, and social science. The cam-pus is equipped with four multiuse laboratories for teaching chemistry, biology, anatomy, physiology, and other science courses, and attracts numerous nursing and physical therapy assistant students to these courses.
• Agriculture Education: The Agriculture instructional facilities are state-of-the-art facilities and utilize generous space and extensive specialized equip-ment. The campus has a complete nursery opera-tion consisting of greenhouses, shade house, and ornamental laboratory space. The Animal Science and Technology Center houses equine, beef, sheep, swine, and dairy facilities, complete with a large pavilion for hosting animal events.
• Architecture Education: The Architecture and Industrial Design programs are well known through-out the state of California, and boast excellently qualified faculty and numerous regional, state, and national awards for student design.
• Once a state facilities bond is passed, the campus will commence Phase II construction to bring the remainder of the industrial technology programs from the Visalia Campus. The Tulare College Center will then house the majority of Career Technical

College of the Sequoias MASTER PLAN 2015 – 2025 149
Education instruction for the District, including au-tomotive, construction, electrical, information tech-nology, environmental control technology, industrial maintenance, and electronics on the campus.
SPACE INVENTORY – TULARE COLLEGE CENTERThe 2013-14 College of the Sequoias Space Inventory Report was used as the basis for the analysis of space. Following Title 5 and Chancellor’s Office standards for space utilization and applying those standards to the total number of students creates total capacity require-ments expressed in Assignable Square Feet. The table below includes a summary of the capacity load cate-gories of space and their respective totals. The Tulare College Center has no additional space projects that are currently in design or in construction and no planned removal of facilities (permanent or temporary), which would adjust these calculations:
Tulare Campus Space Inventory
Space Type Current Inventory
Lecture 6,810
Lab 35,549
Office 8,376
Library 11,514
Instructional Media 3,799
Other 57,857
Totals 123,905
PROJECTED HEADCOUNT, WSCH, AND FTESThe table below summarizes the master plan forecast for Headcount, WSCH, and FTES.
Tulare Campus Enrollment Projections
2014 Tulare College Center
2024 Projections TCC
Headcount (Fall) 1,532 2,058
WSCH (Fall) 24,411 32,806
FTES (Fall) 749 1,006
FTES (Annual) 1,627 2,187
Using previous data and calculating both prescribed State Space Standards and Non-Space State Stan-dards, the table below provides a net assessment for Assignable Square Feet (ASF) for the Tulare College Center facilities to meet the needs in the baseline year.
Tulare Campus Space Needs
Space Type2013-14 Space
Inventory2013-14 Additional
Space Needs2024-25 Additional
Space Needs
Lecture 6,810 0 0
Lab 35,549 0 0
Office 8,376 0 2,122
Library 11,514 0 0
Instructional Media 3,799 0 128
Other 57,857 0 6,228
Totals 123,905 0 8,478

150 College of the Sequoias MASTER PLAN 2015 – 2025
FUTURE FACILITIES PLANSPhase II of the construction plan is dependent upon statewide bond fund availability, which the District an-ticipates in 2017 (following November 2016 state bond election). Phase II will house Automotive, Construction Technology, Electronics, Environmental Technology, Industrial Maintenance, and Informational Technolo-gy programs, currently housed at the Visalia campus. The project cost is estimated at $36.5 million. When these programs move to the Tulare campus, a variety of general education courses will also increase to meet the demand, and will be housed in the current Phase I instructional buildings. These will include written communication, oral communication/analytical think-ing, natural science, humanities, and social/behavioral science. Phase II is currently a Final Project Proposal at the Chancellor’s Office for California Community Colleges, and College of the Sequoias administration file the necessary annual updates to keep this FPP at a priority level for the state.
The Tulare College Center has “Center Status” with the State of California, and anticipates growth of ap-proximately 3% annually. When Phase II is complete and the remaining programs are moved to the Tulare College Center, the Center is planned to reach an FTES of over 2,100 (including online and off-site FTES). It is anticipated that facility space and classrooms will be sufficient, after completion of Phase II, for the student population through 2025. Space inventory calculations project a need for additional office space and addition-al “other” space; however, the District has not moved administrative positions to the campus as it is not yet a “college” status, and the current space available is deemed to be sufficient for the next 10 years.
SUSTAINABILITYBuildings A and B were constructed to LEED Certified status and the buildings are 27% more energy efficient than Title 24 standards.
A possible solar project is planned for the Tulare College Center in the next three years. This project would add ground-mounted solar panels that would either track with the sun or have a fixed angle, depending on which type has the better overall economics. This solar field would cover between four and seven acres and would be located north and east of the maintenance and operations building. The project would not infringe on planned instructional facility space, nor on planned agri-cultural crop and planting space. See Exhibit 1 (refer to page 175) for an aerial photo of the proposed place-ment. This potential project and location has received a CEQA waiver, and is entering the Request for Proposal stage. If the District moves forward with this project, construction would commence in 2015.
The Tulare Campus Center was built with 50 electric charging stations which utilize special designations for those favorable parking slots. These charging stations are well ahead of the local trend, and even ahead of cur-rent need, but the District anticipates growing utilization over the next decade.
The Tulare College Center plans to farm several acres for instructional purposes, and almost 320 acres are farmed for agricultural revenue-generating purposes. The instructional acreage is utilized to test different varieties of row crops for drought-resistance, and also to test for different water resource efficient irrigation methods.

College of the Sequoias MASTER PLAN 2015 – 2025 151
SAFETYThe Tulare College Center has seven “Code Blue Phones” installed throughout the campus. These are well-lit (24 hours per day) emergency phones. When anyone picks up the phone, the District Police emergen-cy line is dialed, and assistance will be dispatched im-mediately. The Tulare campus also has an alarm system throughout the campus, and 24-hour coverage through District Police and Matson Alarm. When District Police are present, the alarm system is monitored. When District Police are not present, Matson Alarm is notified immediately of any break-ins or compromises, and then contacts the police.
PARKINGParking at the Tulare College Center is deemed more than sufficient for the next decade through 2025. Park-ing is easily accessible and the parking areas are well maintained. Parking and access traffic flow is sensible and well-designed. Tulare has 949 parking stalls, 50 of these stalls have recharging stations available for elec-tric vehicles and currently display signage for electric vehicles or carpools. The District will consider in the next few years whether to remove some of this signage, as currently majority of these 50 stalls are not utilized.
With a fall unduplicated headcount of 1,487, the parking ratio is 1.57:1. The District’s target ratio is under 4.5:1, thus the Tulare campus can accommodate large growth in student enrollment with sufficient parking.
SUMMARY AND RECOMMENDATIONSA top priority for the Tulare College Center is the com-pletion of Phase II, which will house many industrial and technology programs currently located at the Visalia campus. Funding for Phase II is tenuous, being depen-dent upon passage of a state facilities bond. Eligibility
for state funding for this project is variable from year to year. When the state bond funds become available, if the District qualifies for 50% state funding instead of the 100% state funding planned, the District may be able to sell additional local bonds under the current Tulare Area Measure J authorization (with another $18 million autho-rized), when housing assessment values rise enough to allow for additional bond issuance.
It is recommended that District administration continue to communicate with the Agriculture Division regarding needed revisions or expansions of agricultural facilities to better serve the agriculture instructional needs. Any revisions or expansions would be dependent upon available resources.

152 College of the Sequoias MASTER PLAN 2015 – 2025
FACILITIES PLAN
HANFORD EDUCATIONAL CENTER FACILITIES MASTER PLAN
Emergency Phone
Emergency Phone
North
The College of the Sequoias Hanford Educational Center has provided residents of Kings County greater access to education. On November 7, 2006, Hanford voters approved the Measure C bond to build a permanent educational center in Hanford. The bond supported acquiring, constructing, and equipping buildings, sites, libraries, class-rooms, science, and computer labs to prepare students for university transfer, skilled jobs, and public safety pro-grams. Funds from the Hanford Campus Improvement District were used to build the permanent center (Phase I) in Hanford, which opened in fall 2010. Facilities on the Hanford campus include five buildings on 180 acres of jointly

College of the Sequoias MASTER PLAN 2015 – 2025 153
owned land that also houses Hanford High School District-Sierra Pacific High School and City of Hanford athletics facilities. The campus presently is comprised of 55,891 Gross Square Feet (GSF) and 35,359 Assign-able Square Feet (ASF). The marquee programs for this location are Police and Fire Academies.
The Hanford campus offers transfer degrees, basic skills classes, and career and technical education courses. In addition, programs and courses are offered for em-ployed workers and others who are looking to upgrade skills for employment/advancement opportunities. Students are also able to complete the general educa-tion requirements for transfer and AA/AS degrees. With excellent transportation services offered through transit passes with Kings Area Regional Transportation (KART), many of the College’s students have opportunities to at-tend college that might not exist without transportation. The Hanford Educational Center also assists economic development of the area.
The Hanford Educational Center’s primary role is to serve as a gateway center, providing students access to initial basic skills and general education courses, as well as skills training opportunities. The two anchor Career Technical Education programs at the Hanford Educational Center are the Fire and Police Academies comprising the Tulare/Kings Regional Public Safety Training Center. The Public Safety Training Center for the police and fire programs is a new state-of-the-art facility. The Public Safety Training Department provides degrees and certificates in basic training courses for ci-vilians and advanced training courses for peace officers and firefighters.
Currently the District offers two Basic Police Acade-my Cohorts per year at the Hanford campus. The Fire Technology Program trains students in the Basic Fire Academy. In the Hanford Educational Center, all classes are offered in one location. Prerequisites and advanced courses are offered year-round, with the fire academy offered in the spring semester.
The Hanford campus opened with over 575 Full-Time Equivalent students (FTES), and is now generating 954 annual FTES. The growth has been partially due to a natural shift of enrollment from the Visalia campus to the Hanford and Tulare College Centers, which in turn relieves the pressure on the Visalia campus to absorb expected growth district-wide. The campus was built to house 1,500 annual FTES, and with an assumed 3.25% growth rate per year, will reach approximately 1,275 FTES by 2025. This growth will create a need for addi-tional classroom and lab space within the next decade. This need is addressed in the Hanford Center Status Needs Assessment, with intentions to build additional academic facilities commencing in 2021 and occupancy in fall 2025.
Hanford facilities center house services for students including the Health Center, Disability Resource Center (DSPS Disabled Services Programs and Services), Veterans’ Services, and Career Counseling/Work Study offered on a rotating basis. Additional state-of-the-art educational facilities include wet labs for science class-es, an adequate gym facility, Student Services Divi-sion, a library, a bookstore, and technology-equipped classrooms.
• In Hanford, the Educational Master Plan includes: General education courses: Critical for those students whose goal is to transfer or earn an AA/AS degree. General education courses at Hanford currently enable a student to meet the transfer requirements for CSU and IGETC.
• Public Safety Training (Police and Fire): The Police and Fire Academies are currently housed in state-of-the-art facilities and utilize extensive specialized equipment.
• Administration of Justice: The Administration of Justice Program is closely related to Public Safety training and courses are offered in Hanford.
• Industrial Maintenance Technology: This is an an-chor program for vocational training opportunities at the Hanford Center for Kings County.
• Electrician Training • Agriculture Business Management Certificate
Program
Other facility spaces include allocations for Financial Aid, Counseling, a Transfer & Career Center, and ac-cessibility for Disabled Students. The campus provides space for clubs and student government, a Health Center, a Business Office, a bookstore, and a full-ser-vice library. The dedicated library space functions as a resource center for students and houses copiers and computers for student use for research and registration purposes.

154 College of the Sequoias MASTER PLAN 2015 – 2025
SPACE INVENTORY – HANFORD CAMPUSThe 2013-14 College of the Sequoias Space Inventory Report was used as the basis for the analysis of space. Following Title 5 and Chancellor’s Office standards for space utilization and applying those standards to the total number of students creates total capacity require-ments expressed in Assignable Square Feet. The table below includes a summary of the capacity load catego-ries of space and their respective totals. The Hanford Educational Center has no additional space projects that are currently in design or in construction and no planned removal of facilities (permanent or temporary), which would adjust these calculations:
Hanford Campus Space Inventory
Space Type Current Inventory
Lecture 9,583
Lab 7,451
Office 3,613
Library 958
Instructional Media 1,940
Other 11,814
Totals 35,359
PROJECTED HEADCOUNT, WSCH, AND FTESThe table below summarizes the master plan forecast for Headcount, WSCH, and FTES.
Hanford Campus Enrollment Projection
2014 Hanford Educational Center
2024 HEC Projections
Headcount (Fall) 1,421 1,957
WSCH (Fall) 13,920 19,166
FTES (Fall) 459 654
FTES (Annual) 928 1,278
Using previous data and calculating both prescribed State Space Standards and Non-Space State Standards, the table below provides a net assessment for Assign-able Square Feet (ASF) for the Hanford Educational Center facilities to meet the needs in the baseline year.
Hanford Campus Space Assessment
Space Type2013-14 Space
Inventory2013-14 Additional
Space Needs2024-25 Additional
Space Needs
Lecture 9,583 0 *0
Lab 7,451 1,443 4,461
Office 3,613 1,157 2,776
Library 958 3,440 4,697
Instructional Media 1,940 27 354
Other 11,814 3,065 8,760
Totals 35,359 9,131 21,048
Note: According to the prescribed state space standards, the Hanford Campus does not currently have a need for additional lecture space, and will likewise not need additional lecture space in 2024-25. This is because the state expects lecture rooms to be used in afternoons and evenings as well as mornings and mid-day, and the Hanford Campus will need to extend class offerings to afternoons and evenings even further than currently offered in order to qualify for state funding for additional lecture space.

College of the Sequoias MASTER PLAN 2015 – 2025 155
FUTURE FACILITIES PLANSProjected student growth will create demand for additional facility space and this will be scheduled as a second phase. A tentative planning schedule for the construction of the Phase II and site build-out is presented in Exhibit 2 (refer to page 176), and Exhibit 3 (refer to page 177) details ASF space allocations by designated programs for Phase II. It is anticipated that Phase II on-site infrastructure and building construction costs will be funded equally (50/50 matching funds) with local and state capital outlay monies.
A ten-year tentative capital outlay budget for Phase II is provided as Exhibit 4 (refer to page 178). The ten-year funding projection proposes that the state and local capital outlay funds required for the Phase II infrastruc-ture, facilities, and group II equipment costs would be $20,712,647. Of this amount, the state and local match proposed would be 50 percent each, with that cost being $10,356,323. The new facilities for Phase II will provide additional needed facility space. The total capi-tal outlay and support costs for Phase II are provided as Exhibit 5 (refer to page 179).
The Hanford campus does not currently have center status with the Chancellor’s Office. The application process commenced in 2011 and was completed and submitted in July 2014. The District will know if the status is approved shortly after the District Master Plan is completed in January 2015. The District feels the Hanford campus is in a strong position to receive center status. Center status, combined with a projection of over 1,000 FTES for the Hanford campus in the next few years, will help ensure adequate resources for the continued growth of the center.
Once the Hanford Educational Center has received state approval as a recognized center, the District anticipates possible future funding from the state, in combination with local matching funds, for the construction of the Phase II expansion of the Hanford Educational Center. This will be necessary to meet ongoing and future com-munity needs and enrollment demands in the northeast Kings County portion of the District’s service area. This long-range funding request will be dependent upon growth and the identification of supportable need, in ac-cordance with state capital outlay funding requirements, and availability of state funds. Any future facilities ex-pansion at the existing Hanford Educational Center will be funded from a combination of the following sources:
1. Future local bond measure funds2. District capital projects funds3. State capital outlay funds
SUSTAINABILITYThe Hanford campus was built with ten electric charging stations that utilize special designations for those favor-able parking slots. These charging stations are ahead of local trends, and even ahead of current need, but the District anticipates growing utilization over the next decade.
The Hanford campus is on a metered water system, which allows the District staff to monitor water usage and adjust in accordance with state guidance and to decrease water usage if necessary due to the current drought.
SAFETYThe Hanford campus has two “Code Blue Phones” installed on the campus. These are well-lit (24 hours per day) emergency phones. When anyone picks up the phone, the District Police emergency line is dialed and

156 College of the Sequoias MASTER PLAN 2015 – 2025
assistance will be dispatched immediately. The Han-ford campus also has an alarm system throughout the campus and 24-hour coverage through District Police and Matson Alarm. When District Police are present, the alarm system is monitored. When District Police are not present, Matson Alarm is notified immediately of any break-ins or compromises, and then contacts the police.
PARKINGHanford has 415 parking stalls. With a fall unduplicated head count of 1,407, the ratio is 3.39:1. The District’s target ratio is under 4.5:1. Hanford parking is consid-ered sufficient and in good condition in 2015. The back parking lot has a new slurry seal applied in summer 2014. The front drive/parking lot will have a new slurry seal applied in the next year or two.
If Hanford unduplicated headcount grows to 1,957, the ratio will then be over 4.5:1. As such, the District will need to address addition of parking stalls in approxi-mately seven or eight years. The Hanford site facility plans were designed to allow for additional parking immediately west of the current main parking lot. When necessary, the District will fund the expansion of the parking lot using District capital projects funds.
SUMMARY AND RECOMMENDATIONSThe Hanford Educational Center, being newly designed and constructed, is well suited to meet the District mission and goals for education of students. Recom-mendations for additions, renovations, or improvements are minimal:
• It is recommended that Phase II be constructed for occupancy in 2025, which will expand capacity for instructional programs.
• It is recommended that the District create a plan for accommodating increased food service needs in the next decade. Currently, due to the fact the Hanford campus opened as a very small campus, food and snack options consist only of vending ma-chines in the food service area. The District should explore options for expanding the on-campus food service area into a small café serving cold foods from the District food services program, or possibly creating an outdoor food courtyard that could be serviced by food vendors and be desirable as a seating and gathering space for students.
• Future parking expansion should be addressed in the next decade to be available by approximately 2025.

College of the Sequoias MASTER PLAN 2015 – 2025 157
001 Sequoia
004Moro
005Tule
006Buckeye
007Cedar
008Giant Forest
072Porter Field House
(Gymnasium)
011Potwisha
015
AltaPeak
016Blue Oak
018 Kern
019Ponderosa
020GeneralGrant
024Monache
Tennis Courts
Track
SoftballDiamond
Softball Complex
BaseballDiamond
Pool
026Sawtooth
027Sycamore
029Kaweah
030Live Oak
031CSUF Admin Office
032Bunker
038BaseballStorage
TrashStorage
036Utility Plant
039FoodCourt
040Coffee House
041San Joaquin
Parking 1
Parking 6
Parking 6
Parking 4
Parking 4Parking 4
MOONEY BOULEVARD
SHADY AVENUE
WOODLAND AVENUE
NOBL
E
MEA
DOW
LAN
E
Parking 3
Park
ing
2
Park
ing
Parking 8
048CSUF/COS Center
University PrepHigh School
050
051Yokut
052Sierra
053Wolverton
054Lodgepole
056John Muir
071Hospital
Rock
055Central Plant
420-429
401-419
201-266
101-112 3-17
Boardroom 1I
Giant Statue
Room 1 326-328
710-744
IM101-IM216
PC 7-14
FS 1-6
320A-T
801-817
Upstairs 150-157
P101-P112
M101-M117
500-569
SEQUOA
SIERRA
SEQUOA
MORO
TULE
ALTAPK
MNACHE
VOAK1 VOAK2
LODGPL
SYCMOR
GIANTKERN
SANJQN
YOKUT
PFHOUS
PNDRSA
SAWTTH
KAWEAH
BCKEYELIVOAK
CEDAR
GRANT
JMUIR
PTWSHA
Parking 9
Parking 5
OUTDOORSTAGE AREA
Parking 7
HOSPRK
034
Valley Oak 1
035Valley Oak 2
The College of the Sequoias provided for facility expansion to the additional two campuses (Tulare and Hanford) for two reasons. First, according to the last Educational Master Plan, the physical plant in Visalia could not accommo-date expected growth, and planned growth is limited. Second, the voters of the Hanford and Tulare Communities voted to build permanent facilities in their part of the College District service area to provide higher education to residents of their area.
FACILITIES PLAN
VISALIA CAMPUS FACILITIES MASTER PLAN

158 College of the Sequoias MASTER PLAN 2015 – 2025
Facilities on the Visalia campus include 38 buildings on 70.6 acres. The Visalia campus presently is com-prised of 477,488 Gross Square Feet (GSF) and 345,888 Assignable Square Feet (ASF). The marquee Career Technical Education programs for this location are Nurs-ing and Allied Health. The campus itself is land-locked, with the exception of some small parcels in the south-east block that could be acquired by purchase or im-minent domain. As a result, facility capacity expansion and parking capacity expansion would require multi-sto-ry construction and would be planned accordingly. The need for this type of expansion is not projected within the next decade.
2008 Measure I for Visalia Area Improvement District No. 2 provided $28 million in facility improvements. Bond proceeds were used for an upgrade to the Kern Building, a remodel of and additional equipment for the Tule Building, expansion of the parking lots on the campus (including purchasing the homes on addition-al property), computer technology and lease costs, additional equipment for the nursing program, emer-gency and safety systems, expansion of the Energy Management System, coverage of additional costs for parking lot renovations, John Muir building renovations, resurfacing the track and adding Astroturf to the field, gymnasium amenities, deferred maintenance costs, and theater upgrades and renovation.
In Visalia, the Educational Master Plan includes:
• General education courses: Critical for those students whose goal is to transfer or earn an AA/AS degree. General education courses at Visalia currently enable a student to meet the transfer requirements for CSU and IGETC, resulting in high transfer rates.
• Nursing and Allied Health Programs: The nursing program is currently housed in a state-of-the-art fa-cility built in 2010, and utilizes generous specialized equipment. Allied Health includes physical therapy assistant training and has recently expanded this program, boasting some of the most well-qualified faculty in the Central Valley.
• Theater, Music and Performing Arts: Performing arts programs are housed at the Visalia campus and include vocal and instrumental music, the-ater, and a new pep band. The theatre building is regularly used for music and performing arts pro-ductions. The programs have gained widespread esteem in Tulare County.
• Athletics and Sports Medicine: The Visalia campus houses all of the District’s athletics programs. The various sports facilities are well-maintained and the District sports teams are very competitive through-out the state. The Division of Physical Education and Athletics includes dance, fitness, health and wellness, and sports medicine/athletic training. Facilities include a new gymnasium, newly renovat-ed and equipped weight room, dance studio, and sports facilities.
• Numerous other Career Technical Education Pro-grams, such as industry and technology, business, paralegal, and consumer and family studies.
The Visalia college campus is considerably older than the other two campuses, and as such, it is beneficial to analyze the age and condition of each building (smaller storage and concessions excluded):
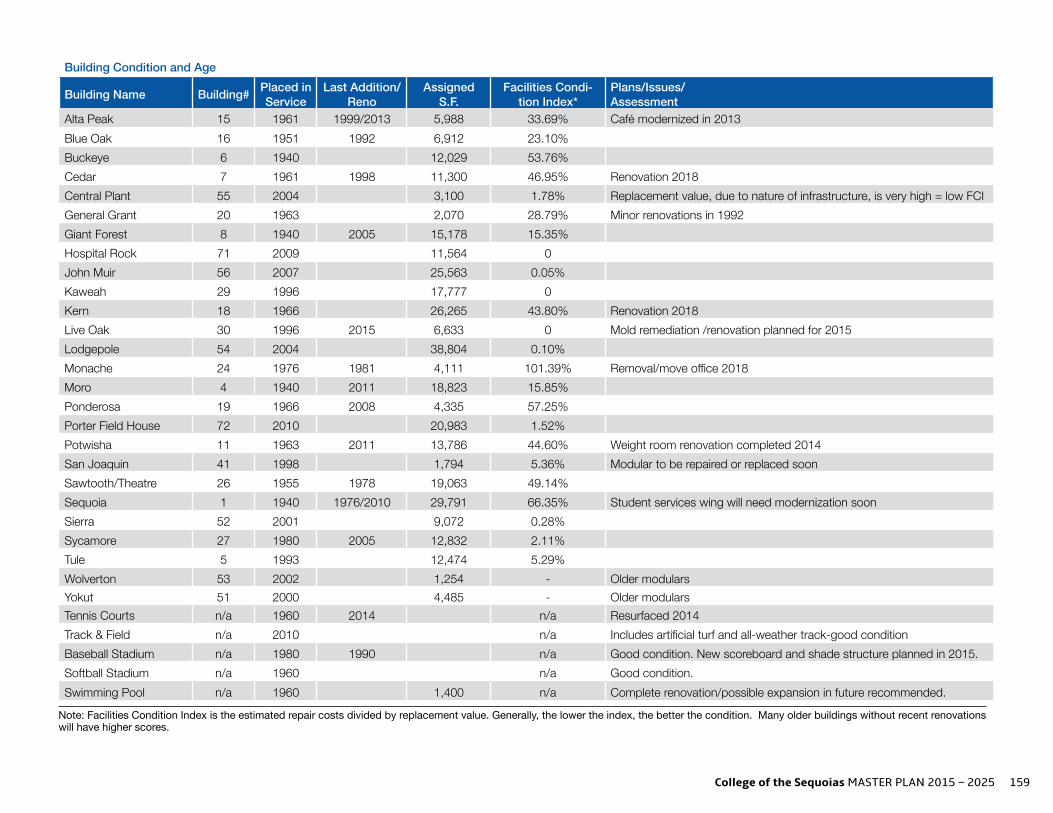
College of the Sequoias MASTER PLAN 2015 – 2025 159
Building Condition and Age
Building Name Building# Placed in Service
Last Addition/Reno
Assigned S.F.
Facilities Condi-tion Index*
Plans/Issues/Assessment
Alta Peak 15 1961 1999/2013 5,988 33.69% Café modernized in 2013Blue Oak 16 1951 1992 6,912 23.10%Buckeye 6 1940 12,029 53.76%Cedar 7 1961 1998 11,300 46.95% Renovation 2018Central Plant 55 2004 3,100 1.78% Replacement value, due to nature of infrastructure, is very high = low FCIGeneral Grant 20 1963 2,070 28.79% Minor renovations in 1992Giant Forest 8 1940 2005 15,178 15.35%Hospital Rock 71 2009 11,564 0John Muir 56 2007 25,563 0.05%Kaweah 29 1996 17,777 0Kern 18 1966 26,265 43.80% Renovation 2018Live Oak 30 1996 2015 6,633 0 Mold remediation /renovation planned for 2015Lodgepole 54 2004 38,804 0.10%Monache 24 1976 1981 4,111 101.39% Removal/move office 2018Moro 4 1940 2011 18,823 15.85%Ponderosa 19 1966 2008 4,335 57.25%Porter Field House 72 2010 20,983 1.52%Potwisha 11 1963 2011 13,786 44.60% Weight room renovation completed 2014San Joaquin 41 1998 1,794 5.36% Modular to be repaired or replaced soonSawtooth/Theatre 26 1955 1978 19,063 49.14%Sequoia 1 1940 1976/2010 29,791 66.35% Student services wing will need modernization soonSierra 52 2001 9,072 0.28%Sycamore 27 1980 2005 12,832 2.11%Tule 5 1993 12,474 5.29%Wolverton 53 2002 1,254 - Older modularsYokut 51 2000 4,485 - Older modularsTennis Courts n/a 1960 2014 n/a Resurfaced 2014Track & Field n/a 2010 n/a Includes artificial turf and all-weather track-good conditionBaseball Stadium n/a 1980 1990 n/a Good condition. New scoreboard and shade structure planned in 2015.Softball Stadium n/a 1960 n/a Good condition.Swimming Pool n/a 1960 1,400 n/a Complete renovation/possible expansion in future recommended.
Note: Facilities Condition Index is the estimated repair costs divided by replacement value. Generally, the lower the index, the better the condition. Many older buildings without recent renovations will have higher scores.

160 College of the Sequoias MASTER PLAN 2015 – 2025
SPACE INVENTORY – VISALIA CAMPUSThe Visalia campus is designated a college with the State of California, and anticipates growth of approxi-mately 1.21% annually. Note that the 1.21% planned growth is less than the 1.75% projected growth for the District as a whole, as the District plans to grow the Hanford and Tulare campuses at a faster pace, thus steering some students and programs to the other campus sites. The Visalia campus is planned to reach an FTES of approximately 7,686 and an unduplicated fall enrollment of 10,692 by 2025. It is anticipated that facility space and classrooms will be sufficient for the student population through 2025. The reconstruction of facility space to house the District basic skills programs will only enhance the facility capacity during the decade. The new basic skills building is planned as soon as state bond funds are available, and is anticipated to begin the design phase of construction in 2017 (following Novem-ber 2016 state bond election).
The 2013-14 College of the Sequoias Space Inventory Report was used as the basis for the analysis of space. Following Title 5 and Chancellor’s Office standards for space utilization and applying those standards to the total number of students creates total capacity require-ments expressed in Assignable Square Feet. The table below includes a summary of the capacity load catego-ries of space and their respective totals.
Visalia Campus Space Inventory
Space Type Current Inventory
Lecture 44,031
Lab 71,822
Office 51,485
Library 39,145
Instructional Media 4,400
Other 135,505
Totals 345,888
Projected Headcount, WSCH, and FTES
The table below summarizes the master plan forecast for Headcount, WSCH, and FTES.
Visalia Campus Enrollment Projections
2014 (college data)
2024 COS Projections
Headcount (Fall) 9,485 10,692
WSCH (Fall) 102,294 115,293
FTES (Fall) 3,320 3,672
FTES (Annual) 6,820 7,686
Using previous data and calculating both prescribed State Space Standards and Non-Space State Stan-dards, the table below provides a net assessment for Assignable Square Feet (ASF) for the Visalia campus facilities to meet the needs in the baseline year.

College of the Sequoias MASTER PLAN 2015 – 2025 161
Visalia Campus Space Assessment
Space Type 2013-14 Space Inventory
2013-14 Additional Space Needs
2024-25 Additional Space Needs
Lecture 44,031 0 0
Lab 71,822 0 0
Office 51,485 0 0
Library 39,145 0 0
Instructional Media 4,400 9,931 9,400
Other 135,005 0 0
Totals 345,888 9,931 9,400
FUTURE PROJECTS:Kern Building: The District is planning to remodel and modernize the Kern building, consisting of 41,766 Gross Square Feet of faculty offices, classrooms, classroom labs, information technology, and non-assignable spac-es. The building spaces will be adjusted to accommo-date changes to program needs. The building, due to its age, currently lacks the ability to facilitate state-of-the-art instructional programs, and is not capable of supporting new educational delivery systems and teach-ing methods currently utilized by various programs. The project is in the Initial Project Proposal stage and will include modern infrastructure and technology changes in connection to each space remodeled. To support this technology, the building’s computer server room will be expanded. All hazardous materials will be abated, and a code-compliant elevator will be installed. The project budget is estimated at $16.1 million and is expected to be 100% state funded, contingent upon a successful state educational bond passing in November 2016.
Basic Skills Center: The District is planning con-struction of a new building for basic skills educational
Visalia campus (Southwest parking lot), and would uti-lize three or four of the four quadrants in the parking lot. Parking Lot 7 was deemed the best option due to its proximity to the site electrical transformers. See Exhibit 6 (refer to page 180) for an aerial photo of the proposed placement. This potential project location has received a CEQA waiver. If the District decides to move forward with this project, construction would take place in 2015.
Cedar Building/Maintenance and Operations Renova-tion: This project consists of renovating 11,350 As-signable Square Feet in the then-vacant Cedar building (Industrial Shop) into a functional and efficient Mainte-nance and Operations facility. This project will allow the department to consolidate its staff, equipment, and ma-terials in a central, but out of the way location and oper-ate in a much more efficient manner. Under the current schedule, the project would be completed in 2020 and would be funded entirely with state money. The current academic programs in the existing facility, which include Automotive, Construction Technology and Computer Repair, are slated to move to the Tulare College Center as part of another state- funded project.
SUSTAINABILITYA 69 KWH solar field was added to the roof of the Hos-pital Rock facility when it was constructed. A second possible solar project for the campus is mentioned above. In addition, the District will pursue electric charging stations when the need is deemed sufficient; most likely within the next decade. It is anticipated that electric charging stations would be funded through a partnership with an automotive or energy generating agency. The District also anticipates the need to add meters to the ground water wells/pumps in the next decade. This will be dictated by state legislation, as needed for water conservation measurement purposes.
programs. This project proposes to construct a much needed Basic Skills Center in the footprint of the current Buckeye/Industrial Education building. The vocation-al programs within the Buckeye building are slated to move to the Tulare College Center, leaving the 74 year-old, 20,000 gross square foot facility vacant. Basic Skills is a major initiative being implemented at the District and this project will allow many more students, including disabled students, to increase their skills in English as a Second Language (ESL), Math, English and other Language Arts; an Educational Master Plan goal. The project budget is estimated at $15.6 million and is proposed to be 100% state funded contingent upon a successful state educational bond passing in November 2016.
Solar: A possible one megawatt solar project is planned for the Visalia campus in the next three years; however, dependent upon responses to the Request for Propos-als; a portion of this solar project may be built at the Visalia campus. This project would add parking shelters with solar panels that have a fixed angle. This solar project would be constructed in Parking Lot 7 at the

162 College of the Sequoias MASTER PLAN 2015 – 2025
SAFETYThe Visalia campus has 14 “Code Blue Phones” installed throughout the campus. These are well-lit (24 hours per day) emergency phones. When anyone picks up the phone, the District Police emergency line is dialed, and assistance will be dispatched immedi-ately. The Visalia campus also has an alarm system throughout the campus, and 24-hour coverage through District Police and Matson Alarm. When District Police are present, the alarm system is monitored. When District Police are not present, Matson Alarm is notified immediately of any break-ins or compromises, and then contacts the police.
PARKING:Parking availability at the Visalia campus is currently sufficient, having undergone a large addition in 2011, which added 555 parking spaces in Parking Lot 7, and having constructed Parking Lot 9 in 2009, the addition-al parking lot across Woodland Avenue, which added 228 parking spaces. Visalia has 2,448 stalls available. Subtracting 136 staff stalls and eight 20-minute stalls, the campus has 2,304 stalls for the 9,468 unduplicated students, which equals a ratio of 4.11:1. The District goal is a ratio of 4.5:1 or less. It is noted that the Dis-trict only intends slow growth for the Visalia campus, but additional parking will likely need to be addressed in the next decade. The conditions of all current Visalia campus parking lots are considered good at this point in time, with adequate resurfacing and routine mainte-nance planned as needed.
Of additional note is the successful partnership with the Tulare County Agency of Governments to provide unlim-ited-use bus passes to District students, which allows students to travel between the three campuses, or to
and from their home, for a very nominal cost. With this transportation option, the District has been successful in lowering the number of cars parked on campus, low-ering the need for parking stalls, and in lowering overall gas emissions in the District communities.
Of continued concern to students is the accessibility of the parking to classrooms, and the traffic flow/vehicular circulation in Parking Lot 7 (Southwest side of campus). There is also possible concern regarding the traffic flow/vehicular circulation in Parking Lot 4 (Northeast side of campus):
• The accessibility is considered adequate, and could not be easily changed. As a result, the District does not plan to move any buildings to create easier access from parking lots.
• Regarding the vehicular circulation in Parking Lot 7, the District administration agrees that the flow of traffic is not ideal. This issue will be contemplated in the next decade with the assistance of a consul-tant as part of an in-depth facility study.
• The vehicular circulation in Parking Lot 4 could be improved. The long range plan is to either restruc-ture the parking lot for better traffic flow, if parking is deemed sufficient, or to add a parking structure at such time as deemed absolutely necessary due to growing enrollments. The parking structure would be planned in Parking Lot 4. Funding would require passage of a local bond, which will be a challenge for this community. This issue will be contemplated in the next decade as part of an in-depth facility study.
SUMMARYThere are plans to renovate the Kern building and the Cedar building (Maintenance and Operations building) in future years. There are plans to build a new Basic Skills Center building in upcoming years. There are also possible plans for a solar project at the Visalia campus. All of these projects are in initial or final plan stages at the Chancellor’s Office (solar RFP has been issued).
Recommendations:
• The condition of the swimming pool may need to be addressed in this next decade, but there are no specific plans at this time. Funding a swimming pool renovation is not possible without the support of a local bond measure. A study under the new educational master plan and facilities master plan is recommended to provide direction.
• The layout of the parking lots at the Visalia campus and parking capacity may need to be addressed in this next decade, but there are no specific plans at this time. The Visalia campus will need to build a multi-story parking structure to meet future park-ing demand, but funding a parking structure is not possible without the support of a local bond measure. A study under the new educational master plan and facilities master plan is recommended to provide direction.
• The San Joaquin two modulars will most likely be re-placed, but it is anticipated that this would be part of a larger growth facility project, occurring after 2025. When an additional building is needed on the Visalia campus, the Yokut/CSUF/San Joaquin area would be the most likely location.
• Though the Sawtooth/Theatre building is functioning well, it will need modernization sometime after 2020 for aesthetic purposes.

College of the Sequoias MASTER PLAN 2015 – 2025 163
• Similarly, the Sequoia building has undergone exten-sive modernization on the North wing. The South wing (student services section) will need moderniza-tion efforts in the next decade.
• The Blue Oak building is aging, but currently serving its purpose for office space well. If the Cedar build-ing/maintenance & operations renovation is com-pleted as planned in the next few years, this building could be renovated or repurposed for another use.
• The General Grant building is vacated and slated to be demolished as part of the Basic Skills project.
• Electric charging stations are recommended within the next decade.
All other facilities are in good condition and well maintained, being either newly built or fairly recently renovated, and provide updated infrastructure (electri-cal, mechanical, phone, plumbing, sewer) technology, laboratory resources, roofing, ADA access, and HVAC systems.
OFF-CAMPUS AND LEASED FACILITIESIn 2015, the District will vacate the 20,882 square foot building it has leased for its Business, Industry, and Community Services (BICS) educational program, along with other vocational for-credit industry or technol-ogy-related programs. The BICS program, which provides educational opportunities for secondary edu-cation students, adult students, and local business and industry, will be primarily relocated to the Tulare College Center. District administration has organized an alter-nate plan for housing each program in various manners on the three District campuses.
The District does not currently rent any other outside facilities; however, the District does hold classes at various high school, adult school, or vocational school
sites as deemed beneficial through partnerships with surrounding educational and governmental agencies.
SUMMARYThe findings in this Facilities Master Plan highlight that, overall, the College of the Sequoias Community College District does not require a substantial amount of additional space for the master plan horizon of 2025. While there are program needs that have been identified in certain areas of the three campuses, these needs can for the most part be accommodated through planned renovations or repurposing of existing space. With the future addition of the Phase II construction project at the Tulare College Center, and the other Phase II con-struction project at the Hanford Educational Center, the largest identified needs for additional space will be met. The District also notes a need to address parking ca-pacity at the Hanford Educational Center and the Visalia campus in the next decade. The largest future facility plans for the District are contingent upon the state passing an educational facilities bond, hopefully in the next two years. When passed, the facility and construc-tion plans identified can be implemented. As a result, the District is well situated to address the enrollment and program forecasts in this Educational and Facilities Master Plan.

164 College of the Sequoias MASTER PLAN 2015 – 2025
Exhibit 1: Aerial Photo of the proposed Placement for Possible Ground-mounted Solar Panel Project at Tulare College Center.
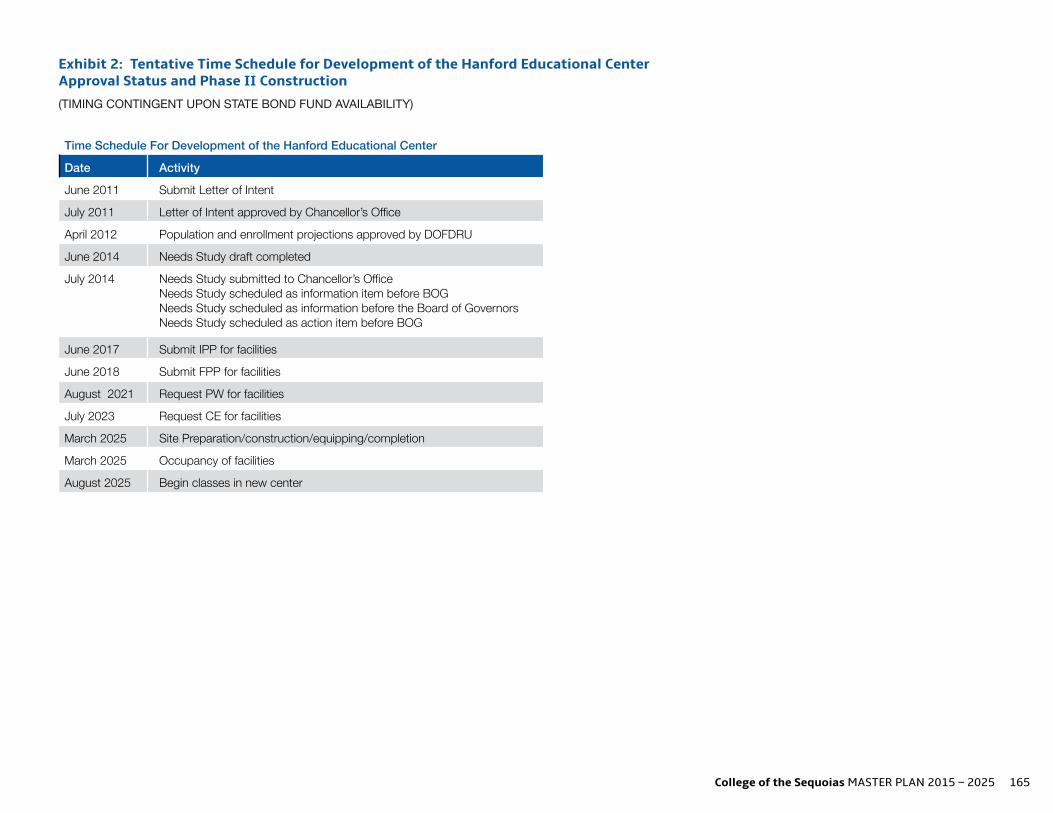
College of the Sequoias MASTER PLAN 2015 – 2025 165
Exhibit 2: Tentative Time Schedule for Development of the Hanford Educational Center Approval Status and Phase II Construction
(TIMING CONTINGENT UPON STATE BOND FUND AVAILABILITY)
Time Schedule For Development of the Hanford Educational Center
Date Activity
June 2011 Submit Letter of Intent
July 2011 Letter of Intent approved by Chancellor’s Office
April 2012 Population and enrollment projections approved by DOFDRU
June 2014 Needs Study draft completed
July 2014 Needs Study submitted to Chancellor’s Office Needs Study scheduled as information item before BOGNeeds Study scheduled as information before the Board of GovernorsNeeds Study scheduled as action item before BOG
June 2017 Submit IPP for facilities
June 2018 Submit FPP for facilities
August 2021 Request PW for facilities
July 2023 Request CE for facilities
March 2025 Site Preparation/construction/equipping/completion
March 2025 Occupancy of facilities
August 2025 Begin classes in new center

166 College of the Sequoias MASTER PLAN 2015 – 2025
Exhibit 3: ASF Space Allocation by Program for Hanford Educational Center Phase II Construction
COLLEGE OF THE SEQUOIAS Hanford Education Center Planning
Space Program (ASF) Activity
Type Phase II
Interdisciplinary Lecture 6,000
Interdisciplinary and Science Labs 9,500
Tutorial Lab (30 stations) 1,000
Distance Learning Lab (30 stations) 1,000
Office/Administration/Faculty/Student Services 5,300
Conference/Meeting 2,000
Data Processing 200
25,000

College of the Sequoias MASTER PLAN 2015 – 2025 167
Exhibit 4: Ten-Year Tentative Capital Outlay Cost Schedule for Phase II
HANFORD EDUCATIONAL CENTERTen-Year Tentative Capital Outlay Cost Schedule For Phase II
Cost ASF Funds Source 2019/20 2020/21 2021/22 2022/23 2023/24 2024/25 2025/26
P/W - Phase II Onsite Infrastructure and Facilities 1,538,000 25,000 State & Local 1,538,000
Phase II Onsite Infrastructure and Facilities Construction 17,466,000 25,000 State & Local 17,466,000
Equipment Phase II Facilities 1,708,000 25,000 State & Local 1,708,000
Occupancy Fall Term 2025
Exhibit 5: Sequoias CCD Hanford Education Center Projected Capital Outlay and Support Costs
Hanford Education Center Projected Capital Outlay and Support Costs
Projected Capital Outlay Projected Support Cost Increases Anticipate District Budget Increase
Project Type State Funded District Funded Total FTE Staffing Personnel Cost Operations Total
Phase II On-site Infrastructure and Academic Facilities $10.356m $10.356m $20.712m 36 $2.9m $0.4m $3.3m $3.3m from
2025-2026 budget
M = millions Notes: District budget projections are based upon growth projections approved by Department of Finance. District budget projections did not include cost of living adjustments. All calculations expressed in current 2014 dollars. FTE = full time equivalent staff positions (faculty and staff)

168 College of the Sequoias MASTER PLAN 2015 – 2025
Exhibit 6: Aerial Photo of the Proposed Placement for Possible Solar Panel Parking Carport Project at Visalia Campus.


170 College of the Sequoias MASTER PLAN 2015 – 2025
Sequoias CommunityCollege District
College of the Sequoias
Visalia Campus - 915 S. Mooney Blvd., Visalia, CA 93277
Hanford Educational Center - 925 13th Ave., Hanford, CA 93230
Tulare College Center - 4999 East Bardsley Avenue, Tulare, CA 93274