Master Dissertation - PAUWES CoP
97
Master Dissertation Submitted in partial fulfillment of the requirements for the Master degree in WATER POLICY Presented by Harold OGWAL Defended on 03/09/2019 Before the Following Committee: Chair Achite Mohammed Prof University of Chlef Supervisor Peter Mbabazi Mbabazize Dr University of Rwanda External Examiner Samir Maliki Prof University of Tlemcen Internal Examiner Chewki Ziani-Cherif Prof PAUWES THE RIGHT OF USE AND ECONOMICS OF IRRIGATION WATER IN UGANDA: A COMPARATIVE ANALYSIS OF SMALL SCALE IRRIGATION SCHEMES IN EASTERN, NORTHERN AND WESTERN UGANDA PAN-AFRICAN UNIVERSITY INSTITUTE FOR WATER AND ENERGY SCIENCES (Including CLIMATE CHANGE)
Transcript of Master Dissertation - PAUWES CoP

Master Dissertation
Submitted in partial fulfillment of the requirements for the Master degree in
WATER POLICY
Presented by
Harold OGWAL
Defended on 03/09/2019 Before the Following Committee:
Chair Achite Mohammed Prof University of Chlef
Supervisor Peter Mbabazi Mbabazize Dr University of Rwanda
External Examiner Samir Maliki Prof University of Tlemcen
Internal Examiner Chewki Ziani-Cherif Prof PAUWES
THE RIGHT OF USE AND ECONOMICS OF IRRIGATION WATER IN
UGANDA: A COMPARATIVE ANALYSIS OF SMALL SCALE IRRIGATION
SCHEMES IN EASTERN, NORTHERN AND WESTERN UGANDA
PAN-AFRICAN UNIVERSITY
INSTITUTE FOR WATER AND ENERGY SCIENCES (Including CLIMATE CHANGE)

i
DECLARATION
I, OGWAL Harold, hereby declare that this thesis represents my personal work, realized to the
best of my knowledge. I also declare that all information, material and results from other works
presented here, have been fully cited and referenced in accordance with the academic rules and
ethics.
Signature: Date: 01/10/2019
Ogwal Harold
Reg No: Pauwes17/MWP15
SUPERVISOR’S DECLARATION
This research project is submitted for examination with my approval as the University
Supervisor.
Signature: Date: 01/10/2019
Dr. Mbabazi Mbabazize (PhD)
SUPERVISOR
PAUWES, TLEMCEN

ii
DEDICATION
I dedicate this thesis to my daughter; Atarah Hope Atapi. I know you were affected in every way
imaginable by this pursuit. I love you so much and I believe the efforts that have brought me this
far will sustain and ensure you reap the benefits of the sacrifices made.

iii
ACKNOWLEDGEMENTS
I would like to extend my indebtedness and render my appreciation for the intensive efforts and
sustenance of several Institutions and individuals. For this reason, my gratefulness extends to the
following;
Pan African University Institute of Water and Energy Sciences through the leadership of Prof.
Abdellatif Zerga and special thanks to PAUWES research team,
Ministry of Water and Environment through the leadership of the Permanent Secretary, the
Training department and the Commissioner Water for Production for granting me an opportunity
to conduct my study as I learn in Water for Production department and all staff in the Water for
Production Regional Centers – East, North and South in your different capacities not forgetting
the Managers, Engineers, Agronomists, Sociologists, Environmentalists, Surveyors, Drivers,
fellow interns and support staff,
Dr. Peter Mbabazi Mbabazize for the supervisory support and mentorship during this thesis
work,
SSIS farmers who sacrificed their valuable time to respond to my questions,
PAUWES 4th cohort students with special thanks to Thomas Kavoh, John Twesige, Evelyn
Kabasingwa, Patrick Mudahemuka, Janvier Kamundala and Frank Prosperous Gatawa, Yunus
Alokere for your guidance and support with relevant literature,
My wife Sharon Auma, my parents; and brothers; I love you so much and thanks for everything,
My Church (Otimai PAG-Lira) and all my spiritual mentors and family and lastly the Almighty
God; my creator, my solid pillar, my foundation of inspiration, knowledge, wisdom and
understanding
iv
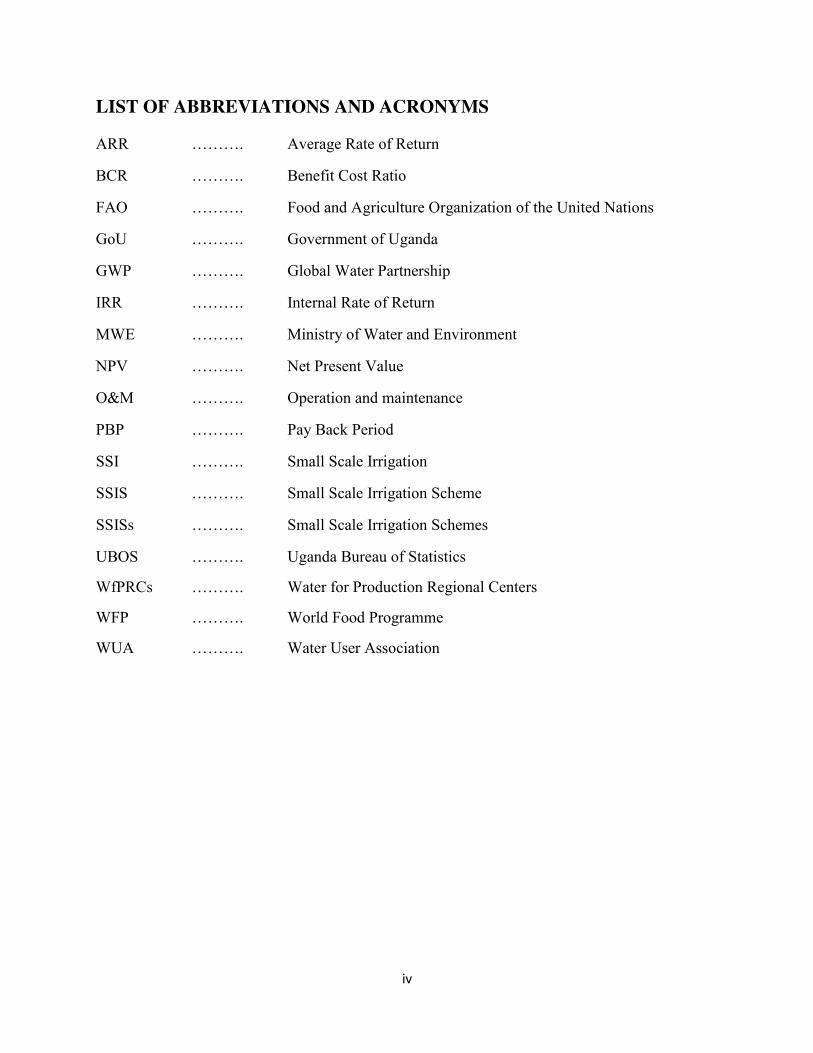
LIST OF ABBREVIATIONS AND ACRONYMS
ARR ………. Average Rate of Return
BCR ………. Benefit Cost Ratio
FAO ………. Food and Agriculture Organization of the United Nations
GoU ………. Government of Uganda
GWP ………. Global Water Partnership
IRR ………. Internal Rate of Return
MWE ………. Ministry of Water and Environment
NPV ………. Net Present Value
O&M ………. Operation and maintenance
PBP ………. Pay Back Period
SSI ………. Small Scale Irrigation
SSIS ………. Small Scale Irrigation Scheme
SSISs ………. Small Scale Irrigation Schemes
UBOS ………. Uganda Bureau of Statistics
WfPRCs ………. Water for Production Regional Centers
WFP ………. World Food Programme
WUA ………. Water User Association

v
TABLE OF CONTENTS
DECLARATION .................................................................................................................................. i
DEDICATION .....................................................................................................................................ii
ACKNOWLEDGEMENTS ................................................................................................................... iii
LIST OF ABBREVIATIONS AND ACRONYMS ..................................................................................... iv
LIST OF TABLES .............................................................................................................................. viii
LIST OF FIGURES .............................................................................................................................. ix
DEFINITION OF OPERATIONAL TERMS ............................................................................................. x
ABSTRACT ........................................................................................................................................ xi
1 GENERAL INTRODUCTION ....................................................................................................... 1
1.1 Background to and motivation for the study ......................................................................... 1
1.1.1 Historical background of Uganda‟s Irrigation Sector ............................................... 1
1.1.2 The economic viability of Uganda‟s Small scale Irrigation Systems ....................... 1
1.1.3 The feasibility of water markets in Uganda .............................................................. 2
1.1.4 Water rights in Uganda ............................................................................................. 3
1.2 Statement of the Problem ................................................................................................. 4
1.3 Research Objectives ......................................................................................................... 6
1.3.1 Main objective .......................................................................................................... 6
1.3.2 Specific objectives .................................................................................................... 6
1.3.3 Research Questions ................................................................................................... 6
1.4 Justification ...................................................................................................................... 6
1.5 Scope of the study ............................................................................................................ 7
1.5.1 Content Scope ........................................................................................................... 7
1.5.2 Time scope ................................................................................................................ 7
1.6 Organization of the study ................................................................................................. 7
2 LITERATURE REVIEW ................................................................................................................ 8
2.1 Irrigation water rights ....................................................................................................... 8
2.2 Key economic definitions, concepts and issues ............................................................. 14
vi
2.3 Economic analysis of small scale irrigation projects ..................................................... 15
2.4 Financial analysis of small scale irrigation projects....................................................... 16
2.5 Data requirements for conducting financial analysis of small scale irrigation projects. 16
2.5.1 Investment Costs ..................................................................................................... 16
2.5.2 Costs associated with farm inputs ........................................................................... 17
2.5.3 Scheme production and marketing data .................................................................. 17
2.5.4 Operational Costs .................................................................................................... 17
2.5.5 Net Income Flow Analysis...................................................................................... 17
3 RESEARCH METHODOLOGY ................................................................................................... 19
3.1 Introduction .................................................................................................................... 19
3.2 Research design .............................................................................................................. 19
3.3 Study population ............................................................................................................ 19
3.4 Sampling Procedure and Sample Size ............................................................................ 19
3.5 Source of data collection ................................................................................................ 20
3.5.1 Primary data ............................................................................................................ 21
3.5.2 Secondary data........................................................................................................ 22
3.6 Data processing and analysis.......................................................................................... 23
3.7 Model Specification ....................................................................................................... 24
3.8 Model justification ......................................................................................................... 25
3.9 Ethical Considerations.................................................................................................... 25
3.10 Limitations ..................................................................................................................... 26
4 RESULTS AND DISCUSSIONS .................................................................................................. 28
4.1 Demographic Characteristics of Respondents................................................................ 28
4.2 Regression analysis results to determine the profitability of using irrigation water ...... 32
4.2.1 Profitability analysis Bumusse SSIS ....................................................................... 32

vii
4.2.2 Profitability analysis for watermelon and tomato crops in Andibo and Bukatabira
SSISs 34
4.3 Sustainability of small-scale irrigation schemes in Uganda........................................... 36
4.3.1 Economic analysis of sustainability of small-scale irrigation schemes in Uganda 36
4.3.2 Tobit regression analysis of sustainability of small-scale irrigation schemes ........ 37
4.4 Factors influencing productivity of irrigation water in Uganda. .................................... 39
4.5 Factors Influencing Farmers‟ Willingness to Pay for Irrigation Water ......................... 40
4.6 Implications of water user rights and costs on adoption of irrigation in Uganda .......... 42
5 CONLUSION AND RECOMMENDATIONS ............................................................................... 44
5.1 Conclusion ...................................................................................................................... 44
5.2 Recommendations .......................................................................................................... 47
5.2.1 To government ........................................................................................................ 47
5.2.2 To Scheme Management Committees .................................................................... 48
6 REFERENCES ........................................................................................................................... 49
7 APPENDIX ............................................................................................................................... 53
7.1 Appendix A: Questionnaires, Interview guide and Observation Checklist ................... 53
7.1.1 Model/Individual Farmer Questionnaire................................................................. 53
7.1.2 Farmer Group questionnaire ................................................................................... 63
7.1.3 Interview Guide for Scheme Management Committees ......................................... 72
7.1.4 Observation checklist .............................................................................................. 75
7.2 Appendix B: Photo plates ............................................................................................... 76
7.3 Appendix C: SSIS Data .................................................................................................. 80
8 ANNEX .................................................................................................................................... 84
8.1 Research and Internship offer letter ............................................................................... 84
8.2 Thesis Budget Report ..................................................................................................... 85

viii
LIST OF TABLES
Table 1: Number and Percentage of Agricultural Households that reported Presence of Irrigation
on the holding by Region ................................................................................................................ 2
Table 2: Area Irrigated according to Method of Irrigation ............................................................. 5
Table 3: Category and number of respondents sampled and interviewed .................................... 20
Table 4: Demographic Characteristics of Respondents ................................................................ 28
Table 5: Profitability analysis of Bumusse SSIS .......................................................................... 33
Table 6: A comparative status of NPV, BCR, ARR, and PBP of four crops grown at Bumusse
SSIS............................................................................................................................................... 33
Table 7: Economics Analysis of Profitability at Bukatabira and Andibo SSISs .......................... 35
Table 8: Economic Analysis of sustainability of small-scale irrigation scheme .......................... 37
Table 9: Tobit regression analysis of sustainability of small-scale irrigation schemes ................ 38
Table 10: Factors influencing productivity of irrigation water in Uganda ................................... 40
Table 11: Factors Influencing Farmers‟ Willingness to Pay for Irrigation Water ........................ 42
Table 12: Tobit estimate of implications of water user rights and costs on adoption of irrigation
in Uganda ...................................................................................................................................... 43
Table 13: Enterprises and gross returns for first and second harvests at PUNO SSIS ................. 47
Table 14: Detailed production at Andibo SSIS............................................................................. 80
Table 15: Membership, sex distribution and gross return for selected SSISs .............................. 80
Table 16: Production details for selected farmer groups at Bukatabira SSIS ............................... 81
Table 17: Production details per crop at Bumusse SSIS............................................................... 81
Table 18: Detailed production for farmer group at Owameri SSIS .............................................. 81
Table 19: Production costs incurred in producing 1 acre of each crop enterprise and 0.5 acre of
watermelon at Bumusse SSIS ....................................................................................................... 83
Table 20: Research budget expenditure ........................................................................................ 85

ix
LIST OF FIGURES
Figure 1: Map of Uganda showing selected SSISs ....................................................................... 22
Figure 2: Distribution of respondents by gender .......................................................................... 29
Figure 3: Distribution of respondents by age ................................................................................ 30
Figure 4: Distribution of respondents by level of education......................................................... 31
Figure 5: Distribution of respondents by marital status ................................................................ 31
Figure 6: Distribution of respondents by family size.................................................................... 32

x
DEFINITION OF OPERATIONAL TERMS
Irrigation Water
Irrigation water is the water applied at controlled amounts and at needed intervals to plants
during periods of no or little precipitation. However for the purpose of this study, Irrigation
Water shall mean the overall amount of water extracted or diverted from the natural environment
for the purpose of supporting crop life in periods of no or inadequate rainfall including water lost
during storage and or conveyance.
The Right of Use of Irrigation Water
Water right is a legal right to abstract or divert and use a quantified amount of water from the
natural environment (Miller, K. A. (1987). However for the purpose of this study, the right of use
of irrigation water shall mean the right to use a specified quantity of water from a stream, river,
lake, a swamp or a pond, groundwater from a natural spring or a well and a reservoir made by
impeding a river.
Economics of Irrigation Water
„Economics is the study of how men and society end up choosing, with or without the use of
money, to employ scarce productive resources which could have alternative uses, to produce
various commodities and distribute them for consumption, now or in the future, among various
people and groups in society‟ (Samuelson,1970). However for the purpose of this study,
economics shall mean the increased benefit that a farmer could receive from using irrigation
water in form of money and other fringe benefits such as food security, education, health and
enhanced home living standards compared to dependence on rain-fed agriculture.

xi
ABSTRACT
This study was conducted on the right of use and economics of irrigation water for small-scale
irrigation schemes in Eastern, Northern and Western parts of Uganda to examine the extent to
which irrigation is accessible to farmers and the economic returns from irrigation water. The
specific objectives were to examine the profitability of using irrigation water in Uganda, to
assess the sustainability of small-scale irrigation schemes in Uganda, to identify the factors
influencing productivity of irrigation water in Uganda, to identify the factors influencing
farmers‟ willingness to pay for Irrigation water and to determine the implications of water user
rights and costs on adoption of irrigation in Uganda. This study used a cross sectional research
design in which data from respondents were collected at a single point at a time whereby both
purposive and cross-sectional data collection approaches were adopted. A systematic random
sampling procedure was used to select the desired sample size from the study area. Purposive
and simple random sampling was employed for key informant personnel who are stakeholders
Data were analyzed using both SPSS and STATA software. The results indicated that the net
returns per year from two sites namely Bukatabira and Andibo SSISs are 121,306,920 and
34,730,684 shillings for tomato and watermelon respectively at ukatabira SSIS while at ndibo
SSIS the net returns are 50,416,800 and 200,802,000 shillings for tomato and water melon
respectively. This means tomato is more profitable in Bukatabira SSIS than watermelon while
watermelon is more profitable at Andibo SSIS than tomato. Sprinkler and drip irrigation were
found to be more water-saving, cost effective and efficient compared to other methods of
irrigation for example surface or furrow irrigation systems. The values of BCR clearly indicate
that tomato crop is most suitable at Bukatabira SSIS while watermelon is most suitable at
Andibo SSIS with the current production systems. The analysis also revealed that investment in
five crops grown at Bumusse SSIS is not economically viable. Out of the eleven explanatory
variables, four such as education level, off farm income, credit access and rainfall reliability
were statistically and significant at 1% level to influence the farmers‟ willingness to pay for
irrigation water in study area. The results also indicated that the water user rights and costs have
positive implications on adoption of irrigation water in Uganda and significantly contributed to
different factors such as price of water for irrigation, extension services, access to agricultural
information, off farm production, cooperative membership, training opportunities, personal
savings, contribution for operation and maintenance and high agricultural productivity.

1
1 GENERAL INTRODUCTION
1.1 Background to and motivation for the study
This study investigated the economic viability of Uganda‟s small scale irrigation schemes and
the feasibility of water markets in Uganda.
1.1.1 Historical background of Uganda’s Irrigation Sector
In Uganda, unlike other East African countries specifically Kenya and Tanzania, the adoption
and development of irrigation was first observed in Karamoja sub region in 1948 where a
significant public investment was directed towards the construction of flood diversion structures
and round bunds to enclose floods in the fields and ensure infiltration (Carruthers, 1970). In 1952
much more complicated irrigation system comprising of dams and channels was developed in
Agoro in northern Uganda in 1952 (Adams and Anderson, 1988). However the most significant
development in irrigation was seen with the construction of the Mubuku irrigation project on
Lake George Flats that started in 1960 although by 1970, the scheme had not yet achieved its
commercial viability.
The first Private scheme establishment was at Kakira sugar estate in Busoga in 1956 where 100
acres were irrigated using sprinkler and 50 acres using furrows although with time sprinkler
irrigation proved more efficient due to the uneven topography thereby abandoning furrow
irrigation method in 1958 (Carruthers, 1970).
1.1.2 The economic viability of Uganda’s Small scale Irrigation Systems
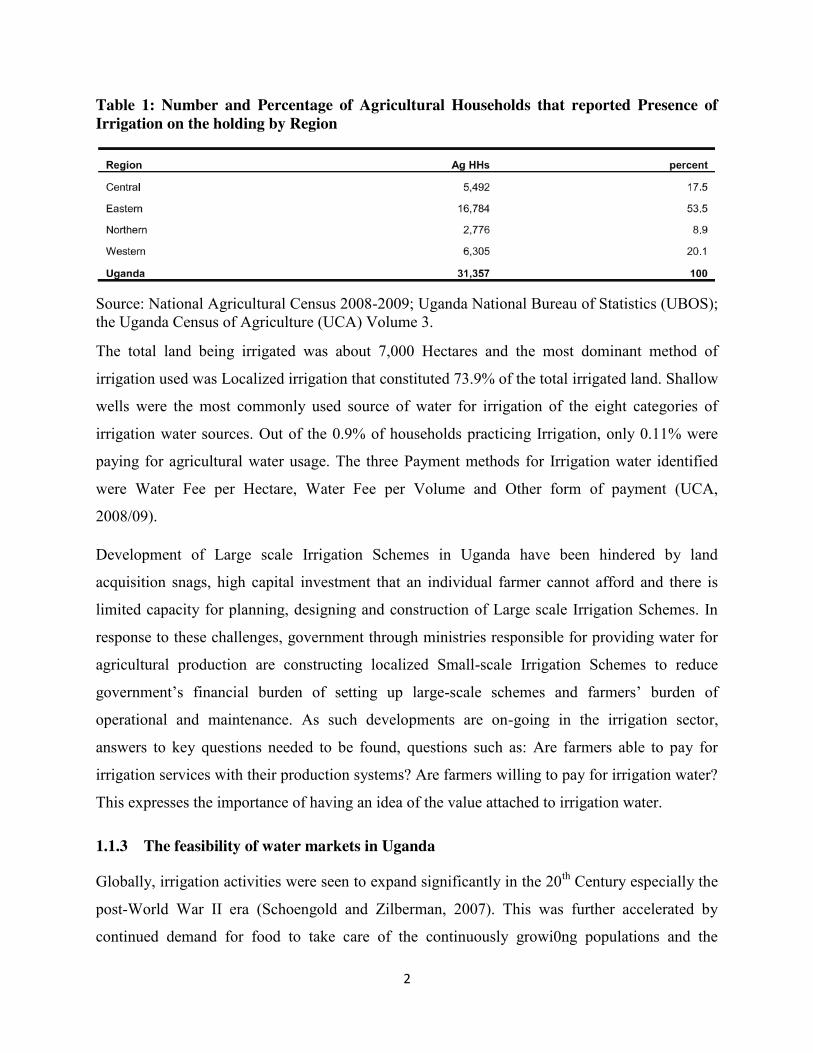
Considering the last comprehensive National Agricultural Census conducted between 2008 and
2009 by Uganda National Bureau of Statistics (UBOS); the Uganda Census of Agriculture
(UCA) Volume 3 reported that Irrigation was being practiced by only 0.9% of the approximately
3.600.000 Agricultural Households that responded implying that agriculture was predominantly
rain-fed. Eastern region registered the highest number of Agricultural Households with 53.5% of
all households surveyed.
2
Table 1: Number and Percentage of Agricultural Households that reported Presence of Irrigation on the holding by Region
Source: National Agricultural Census 2008-2009; Uganda National Bureau of Statistics (UBOS); the Uganda Census of Agriculture (UCA) Volume 3.
The total land being irrigated was about 7,000 Hectares and the most dominant method of
irrigation used was Localized irrigation that constituted 73.9% of the total irrigated land. Shallow
wells were the most commonly used source of water for irrigation of the eight categories of
irrigation water sources. Out of the 0.9% of households practicing Irrigation, only 0.11% were
paying for agricultural water usage. The three Payment methods for Irrigation water identified
were Water Fee per Hectare, Water Fee per Volume and Other form of payment (UCA,
2008/09).
Development of Large scale Irrigation Schemes in Uganda have been hindered by land
acquisition snags, high capital investment that an individual farmer cannot afford and there is
limited capacity for planning, designing and construction of Large scale Irrigation Schemes. In
response to these challenges, government through ministries responsible for providing water for
agricultural production are constructing localized Small-scale Irrigation Schemes to reduce
government‟s financial burden of setting up large-scale schemes and farmers‟ burden of
operational and maintenance. As such developments are on-going in the irrigation sector,
answers to key questions needed to be found, questions such as: Are farmers able to pay for
irrigation services with their production systems? Are farmers willing to pay for irrigation water?
This expresses the importance of having an idea of the value attached to irrigation water.
1.1.3 The feasibility of water markets in Uganda
Globally, irrigation activities were seen to expand significantly in the 20th Century especially the
post-World War II era (Schoengold and Zilberman, 2007). This was further accelerated by
continued demand for food to take care of the continuously growi0ng populations and the

3
increasing competition for water among valuable economic sectors combined with the
implications of global climatic change on irrigation observed through changes in hydrology
(Turral et. al). Due to this growing demand for quality irrigation water, user rights must be
defined to accommodate the interest of crop producers while considering the economic value of
the water.
The first Dublin guiding principle recognizes water as a finite and vulnerable resource while the
fourth Dublin guiding Principle describes water as an economic good (GWP, 2018). In addition,
FAO is aware of the importance of water in agricultural and food production. According to FAO,
globally, irrigation continues to be the main water user despite the increases in water use by
other sectors hence agriculture is responsible for about 70 percent of all freshwater withdrawals
worldwide (FAO, 2018). This therefore calls for sustainable management of the water resource
considering its vital socioeconomic importance.
1.1.4 Water rights in Uganda
According to the National Objectives and Directive Principles 13 and 21 of State Policy (1995),
the state shall: “take all practical measures to promote a good water management system at all
levels” and “protect important natural resources, including land, water, wetlands, minerals, oil,
fauna and flora on behalf of the people of Uganda”
The Water Action Plan (1995) is a framework that outlines policy options and guidelines for the
protection and development of Uganda's water resources as well as recommends a structure for
their management. The Uganda Water Action Plan (WAP) adopted and operationalized the
guiding principles for water resources management as they emanated from the Dublin-Rio de
Janeiro (UNCED) process and Agenda 21's Chapter 18 on freshwater resources. The W AP
adopted these guiding principles recognizing: (i) freshwater as a finite and vulnerable resource,
essential to sustain life, development and the environment, (ii) management of water resources,
at the lowest appropriate levels, (iii) the role of Government as an enabler and in a participatory,
demand-driven approach to development, (iv) the recognition of water as a social and economic
good, (v) the integration of water and land use management, (vi) the essential role of women in
the provision, management and safe-guarding of water" (vii)-the important role of the private
sector in water management.

4
The National Water Policy (1999) in respect to water for agricultural production is intended to
promote the development and efficient use of water in Agriculture in order to increase
productivity and mitigate effects of adverse climatic variations on rain-fed agriculture, with full
participation, ownership and management responsibility of users.
The Water Act (1998), Cap. 152.; provides for the use, protection and management of water
resources and water supply in Uganda. The water act lays out procedures for acquiring water
permits for specific water usage of water resources in the country. A fixed charge or fee
determined by Minister or Director in charge must be paid by the applicant of the water permit
depending on the source and amount of water to be abstracted. The fixed fee or charge shall be in
accordance with pricing policies established by the water action plan or other policy as may be
determined by the government. The water permit holder has the legal rights to use water in
accordance with the terms of reference stipulated. In the event that the holder of the permit fails
to comply, the permit is cancelled with procedures stated in the act. Water permits have been
issued for private commercial farmers, construction companies, industries, among other users.
The Water Statute (1995) provide for the use, protection and management of water resources.
The objective of the Statute in relation to Agricultural productivity is to allow for the orderly
development and use of water resources for watering of stock, irrigation and agriculture in ways
which minimize harmful effect to the environment.
The National Environment Management Policy (1994) and Statute (1995) take account of the
key policy objective on water resources conservation and management; to sustainably manage
and develop 'the water resources in a coordinated and integrated manner so as to provide water of
acceptable quality for all social and economic needs.
1.2 Statement of the Problem
Effects of global climate change on crop production is alarming; in the year 2010, drought
accounted for 38% loss in beans production and 36% loss in maize production while in 2014,
Uganda registered Uganda shillings 2.8 trillion loss of Gross Domestic Product (GDP)
equivalent to 8% and 87% loss to agro-based industries (Mwaura et al 2014). Despite the low
agricultural crop production being realized in most parts of Uganda as a result of relying on rain-
fed agriculture, farmers have shown laxity in adopting irrigation yet the country has a huge

5
irrigation potential that is evident with numerous fresh surface water sources consisting of lakes,
rivers and swamps covering over 15% of her total surface area; on the contrary the ratio of
cultivated area under irrigation to the irrigation potential is only 0.5%.
Table 2: Area Irrigated according to Method of Irrigation
Area (Ha) Irrigated according to Method of Irrigation. (Source: National Agricultural Census 2008-2009; Uganda National Bureau of Statistics (UBOS); the Uganda Census of Agriculture (UCA) Volume 3).
This has resulted into low crop production, low and unstable incomes and consumption of farmer
households, food insecurity and vulnerability to weather and climate events.
Uganda‟s Vision 2040 drafted primarily to achieve a transformed Ugandan society from a
peasant to a modern and prosperous country within 30 years is emphasizing commercialization
of agriculture by encouraging adoption and use of cost effective technologies such as drip
irrigation indicated in the National Irrigation Policy to maximize production and achieve
efficiency and long-term environmental sustainability, social and economic benefits for
Ugandans from water. On the other hand, this water is only free for citizens who occupy or are
residents on lands where there is water and they must use this water for domestic use, fighting
fire or irrigating a subsistence garden only and not for any commercial purpose (The Water Act,
Cap. 152.). The Act requires farmers interested in small scale irrigation systems to quantify and
pay for irrigation water amounts sufficient for production.
To better understand this gap in adoption of irrigation, this study intended to answer the
following questions: To what extent has water rights and costs hindered the farmers from
actively undertaking irrigation? Does the revenue from small scale irrigated agriculture outweigh
the overall cost of production by farmers? To what extent are the established irrigation
schemes/facilities sustainable? These were answered by undertaking a comparative analysis of
existing irrigation projects in Eastern, Northern and Western Uganda that have demonstrated

6
differences in the level of adoption in order to assist authorities responsible for small-scale
irrigation water pricing and establishment of small-scale irrigation schemes to better plan and
implement irrigation projects.
1.3 Research Objectives
1.3.1 Main objective The main objective of this study was to examine the right of use and economics of irrigation
water using a comparative analysis of small scale irrigation systems in Eastern, Northern and
Western Uganda.
1.3.2 Specific objectives
More specific objectives of the study were to:
1. Examine the profitability of using irrigation water in Uganda.
2. Examine the sustainability of small-scale irrigation schemes in Uganda.
3. Investigate factors influencing productivity of irrigation water in Uganda.
4. Determine farmers‟ willingness to pay for Irrigation water in Uganda.
5. Assess the implications of water user rights and costs on adoption of irrigation in
Uganda.
1.3.3 Research Questions
1. Is using irrigation water profitable in Uganda?
2. Are small-scale irrigation schemes sustainable in Uganda?
3. What factors influence agricultural productivity in Uganda?
4. How much are Ugandan farmers willing to pay for irrigation water?
5. To what extent has water use rights and costs hindered adoption of irrigation in Uganda?
1.4 Justification
Water has attracted economic debates at global and local atmospheres arising from its global
scarcity making it a valuable resource. Irrigation sector being the world‟s major user of water has
experienced challenges in some parts of the world especially developing countries about water
wastage with regard to poor technology in irrigation water application, pollution of nearby
surface water bodies and underground water sources, low return on irrigated agriculture due to
poor crop selection and farming techniques rendering irrigation unprofitable.

7
Access to irrigation water enhances production by increasing crop yields, cultivated area,
cropping intensity and crop diversification therefore providing the opportunity for year round
cropping. These result to improved incomes and consumption by farmers through increased
income from crop production, increased family consumption of the food produced; stabilization
of family income from net agricultural production and reduced food prices due to availability of
food produced. Irrigation water increases and stabilizes on-farm and off farm employment
opportunities thereby increasing rural wage rate.
Considering food security and vulnerability, irrigation water enhances food availability by
increasing the opportunity to produce and retain food for home consumption thereby reducing
the level of consumption deficit; irrigation also reduces the risk of crop failure and seasonality
effects of production. Other benefits include reduction in rural-urban migration, increased
resource for health and education and reduced indebtedness thereby improving overall resource
base (Hussain and Hanjra 2003). These benefits are in the frame of achieving Uganda‟s Vision
2040.
1.5 Scope of the study
1.5.1 Content Scope This study was carried out on small scale irrigation schemes constructed by Ministry of Water
and Environment specifically Water for Production department through its regional centers East,
North and West. 16 SSIS that possessed differences in land sizes, types of irrigation, types of
enterprises and water sources were chosen for study.
1.5.2 Time scope The study was conducted during the rainy season in most parts of the country; this was due to the
timing of the study but the data collected were showing results of revenue generated from
farming activities carried out in the dry season.
1.6 Organization of the study This study is presented in five chapters; chapter one provides general introduction including
background and motivation of the study, chapter two presents literature review on the right of
use and economics of irrigation water uses, chapter three presents the methodology that was used
in the study, chapter four presents discussions of the findings, chapter five provides a summary
of the findings.

8
2 LITERATURE REVIEW
This chapter comprises of three sections; section 1 gives the global, continental and regional
scenarios of irrigation water use rights, section 2 provides key economic definitions, concepts,
issues and definitions, section 3 highlights on different techniques used in estimating irrigation
water productivity and value.
2.1 Irrigation water rights
Water right is the legal right to abstract or divert and use or store a quantified amount of water
from a natural source or the legal right to use water in a natural source. Water right is different
from the “right to water” - a presumed human right which is demanded to be existent in one way
or the other as a right in itself or as a supplementary aspect of the “right to food” created by
article 11 of the International Covenant on Economic, Social and Cultural Rights which
stipulates that everyone has a right to an adequate standard of living for himself and his family
including adequate food, clothing and housing. “Right to water” was developed in General
Comment 15.
Property rights can be defined as “the claims, entitlements and related obligations among people
regarding the use and disposition of a scarce resource" (Furubotn and Pejovich 1972). Bromley
(1992:4) points out that “Rights have no meaning without correlated duties on aspiring users to
refrain from use.” This means that property rights are not a relationship between a person and a
thing, but are social relationships between people with relation to some object (the property).
Particularly in the case of water, rights also have corresponding duties that apply to the rights
holder usually to use the water and dispose of wastes in a certain manner, and often to provide
money, labor, or other resources to maintain the water supply.
Water rights being one of the many forms of property rights need to be secured. Property rights
are important since in most treatments of property rights, these types of rights are contrasted with
open access situations in which anyone has unrestricted use of the resource. There are no specific
rights assigned to anyone and no one can be excluded from using the resource. It is the lack of
rules in open access that is seen as contributing to the “tragedy of the commons,” wherein
resources degrade because of lack of control over their use or incentives for investing in its
provision (Bromley 1992). Hence effective property rights need to be secured for the following
reasons;

9
Efficiency: Property rights are required to provide incentives to invest in a resource. For water,
this repeatedly means developing and maintaining water infrastructure such as wells and or
irrigation canal.
Environmental protection: Property rights provide incentive to protect the resource, and
without property rights that are enforced, resources often become degraded.
Equity: Distribution of the resource in terms of equality of access, particularly for meeting basic
needs, or in terms of distribution of rights in proportion to investment that people make or both.
Establishing effective property rights is costly, in cases where a resource is abundant, there is
little incentive or need to define rights over it, but with increasing demands and scarcity, there is
pressure to define rights (Alchian and Demsetz, 1973).
As with other types of property rights, water rights can be broadly classified as public, common,
or private property, according to who holds the rights, and particularly, the decision-making
rights of allocation, which lie at the heart of water rights (Pradhan, Rajendra & Meinzen-Dick,
Ruth. 2003; Paul 2003).
Water legislation offers a variety of exemptions for activities that would otherwise call for a
water right. This may be done by reference to the quantity of water used, the nature of activity,
or both.
In Saskatchewan Province (Canada) the exemption comes from the dimension of the plot to be
irrigated.
In Spain for example, such uses are termed as “common uses” and these include the use for
drinking, bathing, livestock watering and other domestic purposes.
In Wales and England an exemption for water withdrawals up to 20 cubic metres per day was
suggested yet this lacked a pronounced theoretical account for exempting such uses from
recognized water rights systems. The legislature makes judgment by taking into account the
increased financial and administrative liability of making such uses be part of the formal
framework, their value to different users and their overall effect on the water resources balance.
In many parts of the world, water is allocated using a “queuing” system (Easter & William,
1986). Two commonest types of queuing systems are prior appropriation system and riparian

10
rights system. Prior appropriation system is centered on the principle of “first in time, first in
right”. Priority in is given to the first person to abstract or divert water for beneficial use.
Riparian rights system gives property-owners with land adjacent to the water source rights to use
that water. (Tiwari et al., 2000).
There are economic restrictions to the public acquisition of water rights in a trading system when
cultural and social objectives are required. The small farmers are time and again victimized as
they encounter complications in obtaining shares and trading them. In such circumstances,
regulatory procedures to safeguard the smallholders' rights may be required. (Howe 1996).
In the western states of United States of merica, the “prior appropriation” principle applies.
Water rights are still created by operation of law; although mostly created on the basis of legal
instruments issued by the state agencies responsible for water resources management. Such
instruments are variously termed in legislation as “consents”, “concessions”, “authorizations”,
“licenses” and “permissions”.
These water rights are established on the notion of the hydrologic cycle; water in its natural state
is in constant motion, therefore water rights cannot be given or controlled in isolation to other
activities involving watercourses. This makes the flow of water along a water course to be an
important component of a water right therefore the need for maintaining a minimum flow of
water in the river or canal system for sustaining downstream users to avoid exploitative
situations especially where large landowners could dominate the water rights and in periods of
drought.
In Mexico, water users are granted rights for water use and use of irrigation infrastructures
through Water Users‟ ssociations (WU s). Water users needed to be provided with certainty in
user rights by forming a Public Registry of Water Rights and allow transmission of the rights
amongst users of the same basin or amongst those who use water from the same source or
aquifer (Klozen, 1998).
In Chile‟s tradable water rights systems, a right-holder can transfer that water to others through
sale or lease.
In New Zealand, the National Water Act provides for fixing quota system for water abstraction
for irrigation purposes. For instance, within the Riet River and the tributary; the Modder River

11
downstream of the Krugersdrift dam, the Act outlines the necessity for restricting up to 35% of
the full quantity of water delivered from the Krugersdrift dam (National Water Resources
Department, New Zealand).
In Ukraine water is a public asset where the state institutions have the right over them. The
Water Code of Ukraine controls the normative structure of water rights. The procedure for
getting water rights is complex, costly and bureaucratic. 12 different documents matched by
different institutions have to be presented by water users prior to getting a license (Pavlov,
2004). This is extremely difficult for small farmers to manage since each document has to be
paid for. Therefore farmers form associations to use one „water right‟ license in a bid to
minimise costs. Water rights are issued for periods up to 25 years according to the Water Code
but in practice the period is however only 1 to 3 years. In this kind of situation farmers fail to
make long-term strategies and investments in irrigation systems.
In Indonesia, no particular model of water resources distribution is entirely applied in the
country. Traditional law controls in certain locations and statutory law prevails in others. Natural
resources are governed by the State in public trust for the people according to Article 33 of the
Basic Constitution. Water allocation precedence starts with drinking water, followed by
agriculture, and lastly energy according to Law No. 11 (1974). Indonesian Water Law of
February 2004 makes a distinction between basic or non-commercial usage rights and
commercial exploitation; this law also highlights unusual consideration on the water rights for
'traditional communities'.
In China specifically Tejinin province, quota system for water allocation is well-defined and
apportioned based on crop water requirements per unit of agriculture area. The agreement of
rational irrigation quota for crops allotted for the eight river basins and regions in the province
are centered on estimates of effective rainfall, run-off, potential water deficits and crop water
requirements.
The diversity of water law is further increased in many places in Africa because each of these
types of law especially state, customary, and religious may themselves be plural. In most African
customary water law, water is considered as a community property and private ownership of
water is not recognized (WFP, 2001).

12
Rights are often grouped into two broad categories: use rights of access and withdrawal, and
decision-making rights to regulate and control water uses and users, including the rights to
exclude others, manage the resource, or alienate it by transferring it to others (Schlager and
Ostrom 1992).
While the exact definitions of these rights vary from place to place, there are several common
elements in water law in Africa:
1. The state generally claims some kind of ultimate “ownership” rights over water, which
may not be felt at all at the local level, or it may require that individuals or groups who
want to use or develop a water source need to get some kind of permission from the state.
2. There are widespread notions that anyone is entitled to water for “primary uses,” which
are usually interpreted as basic domestic needs, as well as household gardens, but may
include other productive livelihood needs. Islamic law has formalized this as a “right to
thirst” for people and animals.
3. Although there are individual use rights in Africa, private water allocation rights are not
widespread. There are some sources such as wells or small springs which are considered
private, in which the right holder has the right to allocate water from that source.
In Egypt, there is no charge for irrigation water in the Nile Valley and Delta (Hamdy et al., 1995;
Attia, 1997). Farmers on traditional, below-grade tertiary canals (mesqas) must lift water about 1
to 2 metres at their expense, but the water is free, and no funds are collected for operating and
maintaining the main delivery system (Ward, 1993; Nassar et al., 1996). There are no restrictions
on the volume of water entering drainage canals (Ward, 1993) and farmers are not charged the
variable cost of providing drainage services (Okonjo-Iweala & Fuleihan, 1993).
In Nigeria, „the Water Resources Decree of 1993 vests in the Federal Government the right to the
use and control of all surface and groundwater and all water in any water-course affecting more
than one State, for the purpose of promoting the planning, development and use of the country‟s
water resources; coordinating the distribution, use and management of water resources; and
ensuring the application of appropriate standards for the investigation, use, control, protection,
management kind administration of water resources‟ (Kuruk, P., 2005). Under section 2 of the
Water Resources Decree, any person may (i) take water without charge for his domestic purpose
or for watering his livestock from any water course to which the public has free access; or (ii)
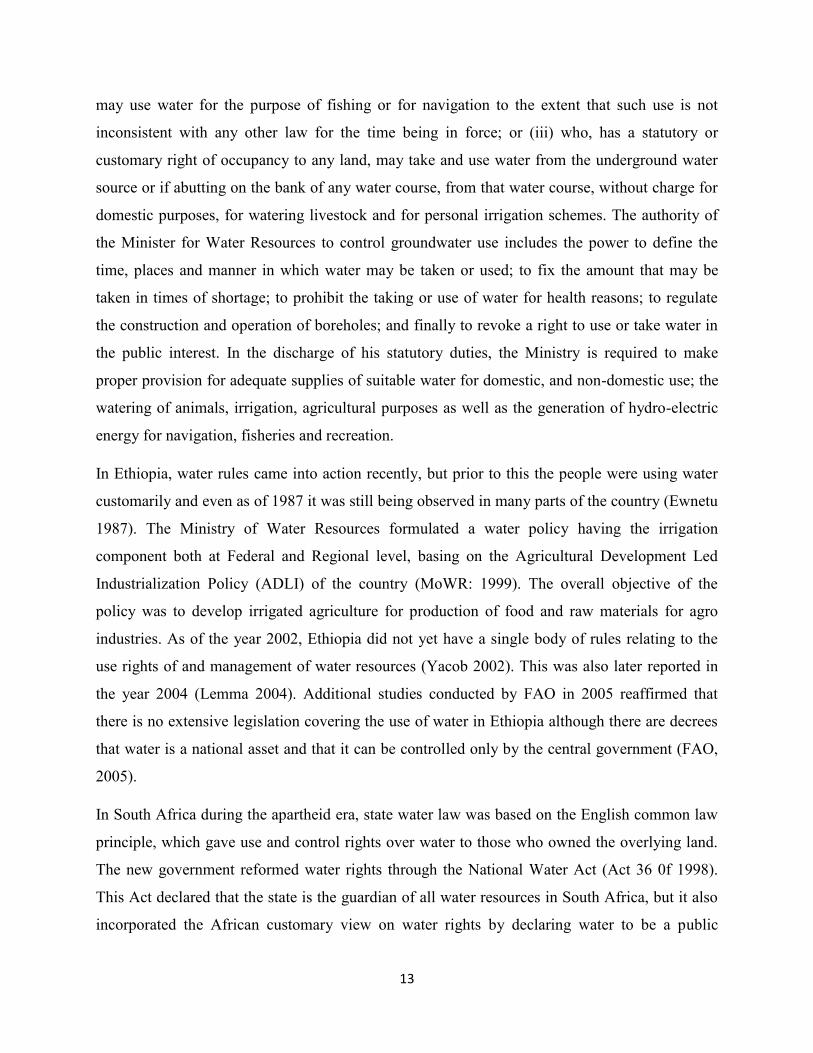
13
may use water for the purpose of fishing or for navigation to the extent that such use is not
inconsistent with any other law for the time being in force; or (iii) who, has a statutory or
customary right of occupancy to any land, may take and use water from the underground water
source or if abutting on the bank of any water course, from that water course, without charge for
domestic purposes, for watering livestock and for personal irrigation schemes. The authority of
the Minister for Water Resources to control groundwater use includes the power to define the
time, places and manner in which water may be taken or used; to fix the amount that may be
taken in times of shortage; to prohibit the taking or use of water for health reasons; to regulate
the construction and operation of boreholes; and finally to revoke a right to use or take water in
the public interest. In the discharge of his statutory duties, the Ministry is required to make
proper provision for adequate supplies of suitable water for domestic, and non-domestic use; the
watering of animals, irrigation, agricultural purposes as well as the generation of hydro-electric
energy for navigation, fisheries and recreation.
In Ethiopia, water rules came into action recently, but prior to this the people were using water
customarily and even as of 1987 it was still being observed in many parts of the country (Ewnetu
1987). The Ministry of Water Resources formulated a water policy having the irrigation
component both at Federal and Regional level, basing on the Agricultural Development Led
Industrialization Policy (ADLI) of the country (MoWR: 1999). The overall objective of the
policy was to develop irrigated agriculture for production of food and raw materials for agro
industries. As of the year 2002, Ethiopia did not yet have a single body of rules relating to the
use rights of and management of water resources (Yacob 2002). This was also later reported in
the year 2004 (Lemma 2004). Additional studies conducted by FAO in 2005 reaffirmed that
there is no extensive legislation covering the use of water in Ethiopia although there are decrees
that water is a national asset and that it can be controlled only by the central government (FAO,
2005).
In South Africa during the apartheid era, state water law was based on the English common law
principle, which gave use and control rights over water to those who owned the overlying land.
The new government reformed water rights through the National Water Act (Act 36 0f 1998).
This Act declared that the state is the guardian of all water resources in South Africa, but it also
incorporated the African customary view on water rights by declaring water to be a public

14
resource that belongs to the whole nation and needs to be available for common use by all South
African citizens. All water required for basic human needs like drinking is guaranteed as a right
(RSA 1998; Perret 2002). Under this act, people cannot own water but can be granted water use
rights through a licensing system, which require users to pay for it. The money generated from
water use charges is used for water service and management costs (Farolfi 2004,Tewari 2002)
In Zimbabwe‟s water reform of 1990s, it was declared all the water to be the property of state.
People can get water rights through acquiring water permits, which gives them legal license to
use but not own water. Water permits are issued in consideration of the needs of the applicant
and the expected benefits of the proposed water use (Latham 2000, Mtisi and Nicol, 2003).
In Mozambique, the Water Act of 1991 regards water as a public good. People cannot have
private ownership of water sources but can obtain rights to use water by acquiring a water license
(Vaz and Pereira, 2000). Water licenses are granted for a period of 5 years and are renewable.
The use of water for primary needs like small irrigation, domestic use, watering the livestock, is
free.
In Botswana, people do not need to acquire water rights if they are using the water for domestic
purposes or for watering livestock. However, people are required to obtain water rights if using
the water for irrigation or commercial purposes.
According to the Ugandan National Irrigation Policy, a lot of complexities exist in land user
rights. These are in the form of land access, security of land rights, dammed water and wetland
use limitations are the most common unsolved issues. Exclusive water user rights for irrigation
or hydropower dams have been a limitation in reaping benefits of integrated water resources
management and use could have led to a rapid irrigated agricultural development. Therefore
these national water and land user rights together with riparian water sharing agreements have
affected the desirability for investment in irrigated agricultural development.
2.2 Key economic definitions, concepts and issues
Willingness to pay: Willingness to pay for irrigation water is defined as the maximum amount of
money a farmer is willing to pay for water used in irrigating a farm. The method of determining
a farmers‟ willingness to pay for irrigation water is detailed in the questionnaire. Willingness to

15
pay survey results are presented graphically to show the values‟ distribution for a range of
collected responses.
Expressed willingness to pay: Maximum amount that a farmer expresses that he or she is willing
to pay for irrigation service, typically registered in monetary units per season/year, in response to
a specific question
Economic benefit: Increased benefit that a farmer could receive from a proposed project
compared to his or her present situation. In the case of an irrigation project, it indicates the
attributed benefit of the irrigation water service in monetary units, versus the current rain fed
agricultural production.
Economic analysis: Shows the economic feasibility of a project, from the perspective of the
farmer as well as that of the country.
Financial analysis: Illustrates whether the project will be profitable or not, from the viewpoint
of the water utility that will implement and operate the irrigation system.
Economic benefit: Increased benefit that a farmer could receive from a proposed project
compared to his or her present situation.
Demographic study: The study of the project‟s target population (farmers) to identify and
determine distinct features that would affect project feasibility.
Demand study: In the context of an irrigation project, this study determines the demand for an
irrigation service in terms of number of users, size of plots/farms and market availability. A
future demand projection for an irrigation project should be considered.
2.3 Economic analysis of small scale irrigation projects
Performing economic benefit analysis involves evaluating numerous well-defined benefits
comprising of health benefits, educational benefits, quality of life improvements, entertainment
and communication values added, increases in productivity and security benefits. The economic
value of each category of benefit can be estimated using different methodologies as explained in
the subsequent chapter.

16
2.4 Financial analysis of small scale irrigation projects
This section explains the financial analysis methods used for small scale irrigation projects.
Financial analysis is the method of calculating the revenues and costs related to the operation of
small scale irrigation systems. This evaluates the entire project feasibility starting from the
investment value of the project. Financial analysis measures financial costs and benefits to the
investor and or to the project. Financial analysis considers investment cost of the small scale
irrigation infrastructure, along with the operating cost of the project in addition to the revenues
resulting from tariffs on water sales.
By means of financial analysis, revenue streams and costs can be evaluated over the life of the
small scale irrigation project. Revenues comprise of sale of farm produce. Costs include farmers‟
payments made to the small scale irrigation service provider/management committee/WUA for
the use of water for irrigation, operation and maintenance of small scale irrigation system; other
costs include; rent of land, cost of farm inputs, cost of agronomic services and labor.
The main objective of financial analysis is to evaluate project viability. This is done by
evaluating one of the several investment recovery indicators namely; average rate of return
(ARR), benefit cost ratio (BCR), return on equity (ROE), payback period (PBP) and net present
value (NPV) of the project‟s net revenues. A predetermined hurdle rate(s) is necessary to come
up with a clear investment analysis. If the project‟s financial performance is greater than or
equals the hurdle rate then the investor consider the project feasible. If the project‟s financial
performance is less than the hurdle rate then the investor does not consider the project feasible.
Nonetheless, support for non-feasible investments may be offered through capital subsidies.
Subsidies should be assigned alongside investment costs so as not to cover operating costs.
Development experts consider subsidies acceptable when a project‟s economic benefit is greater
than the subsidy demanded.
2.5 Data requirements for conducting financial analysis of small scale irrigation
projects
2.5.1 Investment Costs Investment costs take into account all costs essential to constructing and financing the small
scale irrigation system. These costs consist of land and other infrastructure purchases for

17
example access roads, offices and water reservoirs; the design cost of the irrigation system; the
cost of materials, such as pumps, tanks and pipes among others and labor costs for construction.
2.5.2 Costs associated with farm inputs
These consist of cost of renting/buying farmland/plot, cost of farm inputs such as
seeds/seedlings, fertilizer, agrochemicals, water used; cost of providing farm labor, cost of
hiring/buying machinery, storage costs, marketing costs and cost of agronomic services among
others.
2.5.3 Scheme production and marketing data
To perform financial analysis, farm production data should be collected and analyzed together
with corresponding market size and prices. The production data consist of farm output projected
over a given time period (year).
2.5.4 Operational Costs
The operational costs include the total costs related to the maintenance and operation of the
irrigation system. These costs include the purchase of broken/damaged/worn out parts, cost of
water itself; cost of providing energy for pumping water, administrative costs and general
expenses, insurance and estimated taxes.
EBIT (earnings before interest and taxes) is an important indicator that consists of revenues
equivalent to EBITDA (earnings before interest, taxes, depreciation and amortization) revenues,
less the amortization and depreciation of fixed assets of the project. Depreciation and
amortization installments entail a contribution to a fund essential to replace assets at the end of
the system‟s useful life. Depreciation is a vital expense that the company must cover to uphold
long-term sustainability. If the scheme does not generate adequate incomes to cover its interest
disbursements, then it will require a government subsidy or refinancing of the project‟s debt
structure. Net earnings take into account all the project‟s expenses, including taxes.
2.5.5 Net Income Flow Analysis
Net income flow statement represents the results of the anticipated revenues and expenditures,
including revenue collections, costs associated with investment in infrastructure (payment of
interest and capital), cost of operation, and taxes.

18
Therefore, the net income flow analysis requires calculation of EBIT and evaluation of the
interest and taxes, in case they are applicable to the irrigation project. This analysis applies the
calculation to obtain net incomes for each year of the irrigation project implementation period.
Subsequently earnings and costs vary with the production and sale of farm products and with the
market fluctuation in terms of demand over each project year. Net earnings include all related
costs and takes into account any subsidy applied to the project‟s investment cost.
19
3 RESEARCH METHODOLOGY
3.1 Introduction
The net economic contribution of irrigation water to the value of agricultural production is
termed as productivity. The cost of provision and the net value of irrigation water is of great
importance to the farmers and the proprietors of the irrigation schemes. Income distribution
theory emphasizes that each factor of production should receive a share of production income
equivalent to the contribution made by each factor, therefore the value of a resource used in
production should be within the farmers‟ ability to pay ( ronfenbrenner, 2007)). For instance,
effecting cost recovery plans for irrigation projects greatly depends on the realistic estimates of
the productivity of irrigation water which gives vital evidence on the ability of farmers to pay for
irrigation services hence sustainability. This chapter provides the methodology used in the study.
3.2 Research design
In this study, a social survey was conducted whereby a cross-sectional research design was used
in which data from respondents were collected at a single point at a time; both purposive and
cross-sectional data collection approach were adopted. The population of interest constituted of
farmers growing vegetables in SSISs. A systematic random sampling procedure was then used to
select the desired sample size from the study area. The area of study was purposively chosen
because the area is among the few areas where SSISs are found.
3.3 Study population
The respondents were farmers in capacities of individual/model farmers and farmer groups who
have been actively engaged in farming activities in SSISs for a minimum period of 6 months.
The farmers comprised of male and female youths, adults and elders. Farmer group sizes ranged
between 10 and 330 members
3.4 Sampling Procedure and Sample Size
The multistage sampling technique was employed in this study. The first stage was the purposive
selection of small-scale irrigation schemes in Eastern, Northern and Western Uganda where
MWE has established WfPRCs that are in charge of these SSISs. In the second stage,
respondents were randomly selected to make a desired sample size. Data was collected with the
20
use of structured questionnaires to obtain information on farmers‟ socio-economic variables,
farm size (ha), cost of inputs, output and value of output for the previous farming seasons.
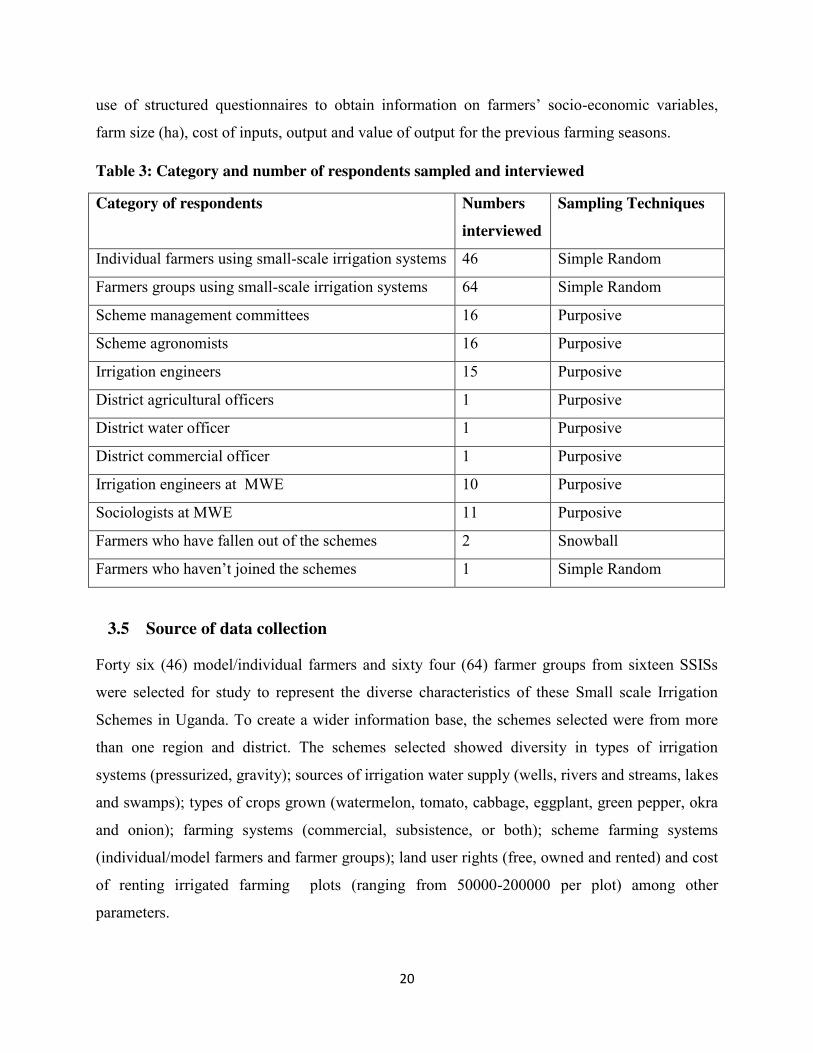
Table 3: Category and number of respondents sampled and interviewed
Category of respondents Numbers
interviewed
Sampling Techniques
Individual farmers using small-scale irrigation systems 46 Simple Random
Farmers groups using small-scale irrigation systems 64 Simple Random
Scheme management committees 16 Purposive
Scheme agronomists 16 Purposive
Irrigation engineers 15 Purposive
District agricultural officers 1 Purposive
District water officer 1 Purposive
District commercial officer 1 Purposive
Irrigation engineers at MWE 10 Purposive
Sociologists at MWE 11 Purposive
Farmers who have fallen out of the schemes 2 Snowball
Farmers who haven‟t joined the schemes 1 Simple Random
3.5 Source of data collection
Forty six (46) model/individual farmers and sixty four (64) farmer groups from sixteen SSISs
were selected for study to represent the diverse characteristics of these Small scale Irrigation
Schemes in Uganda. To create a wider information base, the schemes selected were from more
than one region and district. The schemes selected showed diversity in types of irrigation
systems (pressurized, gravity); sources of irrigation water supply (wells, rivers and streams, lakes
and swamps); types of crops grown (watermelon, tomato, cabbage, eggplant, green pepper, okra
and onion); farming systems (commercial, subsistence, or both); scheme farming systems
(individual/model farmers and farmer groups); land user rights (free, owned and rented) and cost
of renting irrigated farming plots (ranging from 50000-200000 per plot) among other
parameters.

21
Surveys were conducted in the sixteen functional irrigation schemes (sites). The purposes of
these surveys were to evaluate the social, economic and technical statuses at individual plot and
scheme levels, these helped in computing economic statistics. Individual farmers were
interviewed in each of the selected schemes; focused group discussions were conducted for
scheme management committees and key informant interviews for irrigation engineers,
sociologists and agronomists attached to the selected sites to obtain vital and general information
about each of the schemes. Well-structured questionnaires were used to interview the farmers.
The information captured in the individual farmer questionnaire included household
characteristics, plot sizes, enterprises chosen, agricultural inputs used, monetary returns from
farming, irrigation water management, cropping systems, other sources of income, and sources
of credit, market access and challenges being faced in the scheme. The farmer group
questionnaire had group size, sex distribution, enterprises chosen, returns from farming and
group registration as the main areas of interest.
3.5.1 Primary data
3.5.1.1 Questionnaires
These were employed to capture data from two farmer sections; individual/model farmers and
farmer groups. The individual/model farmer questionnaire was more comprehensive compared to
the one of the farmer group.
3.5.1.2 Interviews
These were conducted for key informant persons such as scheme agronomists, scheme
sociologists, district agricultural officer, district water officer, district commercial officer,
Environmental officers and Irrigation Engineers at MWE.
3.5.1.3 Focused group discussions
These were conducted for scheme management committee members to ascertain the mode of
operation of their various schemes and also for farmer groups‟ representatives.
3.5.1.4 Observations
Key observations were made on the components of the irrigation schemes, water meter readings,
type of crops grown, topography and the general environment.
3.5.1.5 Photography
This provided empirical evidence/information obtained in the field for interpretation by the
researcher and consumption by the general public.

22
3.5.2 Secondary data
Secondary data obtained was from unpublished data sources that were collected from individuals
and public offices.
Figure 1: Map of Uganda showing selected SSISs

23
3.6 Data processing and analysis
Data collected were analyzed using descriptive statistics, gross margin analysis and quantitative
methods. Descriptive statistics such as mean, frequency, percentage count and standard deviation
were used to analyze socio-economic characteristics of respondents in the study area.
Gross margin was used to analyze the profitability level of SSISs. For this analysis; the net profit
was obtained by:
Net Profit = (Gross returns – Cost of production) ……………...……………………………… (i)
For this analysis the initial cost of the project was not considered.
Net Present Value was used to analyze the sustainability and viability of SSISs; this is given by
the following expression: (∑ ( ) ) ………...…………………………….. (ii) Where; NPV = Net Present Value
t = time in years
r = R/100
R = interest or discount rate
N = number of periods or years
Or;
NPV = - C0 + +
( ) + ( ) +
( ) …………………………………………...…… (iii) Where; -C0 = Initial investment
C = Cash flow
r = Discount rate
t = Time
Ordinary Least Square (OLS) regression analysis was carried out to determine the factors
influencing productivity of crops grown in schemes and factors influencing farmers‟ willing to
pay water for irrigation as well as the implications of water rights and costs on the adoption of
water irrigation system in the study area. In order to draw conclusion, data collected from the

24
primary source and the analysis of quantitative data were done with the aid of two softwares
namely SPSS version 20 and STATA version 13.0.
3.7 Model Specification
The production function analysis was used in four functional forms from which the lead equation
was chosen based on the values of the coefficient of multiple determination (R2) as well as the
signs and significance of the regression parameters. This was stated explicitly as;
Y=f(X1, X2, X3, X4…………………………………………………………, u) ………...….. (iv)
Where;
Y = Total output of crop grown (Kg)
X1 = Land size (ha)
X2 = Labour source (man/hour)
X3 = Family size (number)
X4 = Gender (1=male, 0=female)
X5 = Age (years)
X6 = Education level (years)
X7 = Fertilizers (kg)
X8 = Irrigation system (1=yes, 0=no)
X9 = Volume of water (m3)
X10 = off farm income (1=yes, 2=0)
X11 = Price of produce (1=high, 0=low)
X12 = Distance to Market (km)
X13 = Agricultural credit (1=yes, 0=no)
X14 = Farming experience (years)
X15 = Extension Service (1=yes, 0=no)
X16 = Cooperative membership (1=yes, 0=no)
U = Error term
Profitability was estimated using gross margin analysis, which is the difference between total
revenue (TR) and the total variable cost (TVC). This is illustrated as;
GM=TR-TVC

25
Where;
GM =Gross margin
TR = Total Revenue =P.Q (P=Price, Q=Quantity)
TVC = Total Variable Cost
3.8 Model justification
Different models have been proposed in econometrics for estimating adoption processes. The
most common include the linear probability, Tobit, Probit and Logit regression. The application
of regression methods depends largely on the measurement scale of the outcome variables and
the validity of the model assumptions. The outcome variables include continuous scale, binary
measure or ordered category. In this study to determine the relationship between independent and
dependent variables, two models namely Probit and Tobit regression analysis have been
commonly used. Probit and Tobit models are mostly used when dependant variable is categorical
and the continuous variable is either continuous or categorical.
Probit regression is used to model the association between response variables and a set of
explanatory variables. It can be used where the researcher wish to study effect of explanatory
variables on all levels of the ordered categorical outcome. Therefore, this study adopted the
method due to the said purpose of the researcher. Tobit model gives a quantitative measure of the
extent of adoption. These two model models give the effect of the various factors on the use as
well as the predicted probabilities of the use.
The Probit model is often used in adoption studies that aim at identifying factors underlying
adoption. These models (Tobit and Probit regression model) are more powerful, convenient and
flexible and are often chosen if the predictor variables are a mix of continuous and categorical
variables, which is the case in this study.
3.9 Ethical Considerations
The researcher made efforts to adhere to ethical standards. Permission to carry out the study was
obtained from the University. Further permission was obtained from Ministry of Water and
Environment and the various WFPRC managers before going to the field for data collection (see

26
annex 1). The researcher was ethically sound hence protected the participants from any physical
and psychological harm and treat respondents with respect and dignity.
Another critical issue was that respondents were granted informed consent before they
participated in the study. Therefore, prior to the research, the researcher clarified to the farmers
the nature of the study. Participation in the study was therefore voluntary and based on informed
consent
The authors quoted in the study were acknowledged
Findings were presented in a generalized manner
3.10 Limitations
Communication barrier: Most of the data collection was done in rural communities. Language
barrier was a huge problem since; majority of the farmers in the rural areas do not comprehend
English. Additionally, there are many tribes in Uganda with discrete languages which the
researcher is not conversant with. To overcome this challenge, the researcher hired two research
assistants who are university students and knew the major languages spoken in western, eastern
and northern parts of Uganda; they translated the languages during interviews and while
administering questionnaires.
The researcher faced a challenge of long distances traveled to locate SSISs in all regions of
Uganda. Some SSISs were located as far as 600km from Kampala; having poor road networks
(hard-to-reach areas) with no public means of transport available. To overcome this challenge, a
great deal of transport facilitation was required which was not available at the time of data
collection. Therefore, the researcher had to improvise from other sources.
Unfriendly weather affected and delayed the research. The research was carried out in the rainy
season in most parts of Uganda, this made it hard to move to the field due to bad roads, and
sometimes the targeted population were inaccessible since most of them would be occupied in
farms outside the irrigation schemes
The researcher had not receive the research grant by the time the surveys were being conducted;
being a research that was dependent on primary data and the fact that the survey required the
largest share of the budget; the survey was halted for some time as the researcher was mobilizing
resources; this also med to delays in commencement of the research process since there was hope
of receiving the research grant.
27
Tribal conflict was another factor that hindered the researcher. Data collection in Karamoja sub-
region was hindered by the tribal conflict between the Karamojong and Iteso tribes. This made
data collection in Napak district impossible and as a result resources planned for that side was
not properly utilized
Due to the difficulty in acquiring permit and permission; the data obtained belonged to SSISs
designed and implemented MWE only
Individual/model farmer data was obtained only from Eastern region

28
4 RESULTS AND DISCUSSIONS
4.1 Demographic Characteristics of Respondents This part presents the demographic characteristics of the study population. The responses were
analyzed using descriptive and inferential statistics as presented in table 4.
Table 4: Demographic Characteristics of Respondents
S/n Variables Frequency Percentage (%)
1 Gender Male 35 76.09
Female 11 23.91
Total 46 100
2 Age > 30 3 6.52
30-40 16 34.78
41-50 12 26.09
51 and above 15 32.61
Total 46 100
3 Education level adult education 1 2.17
Attended O-level 9 19.56
Attended primary 17 36.95
Completed O-level 5 10.88
Completed primary 5 10.88
Degree 1 2.17
Diploma 5 10.88
Institution 1 2.17
Master's 1 2.17
Not attended school 1 2.17
Total 46 100
4 Marital status Single 1 2.18

29
Married 41 89.13
Widowed 4 8.69
Total 46 100
5 Family size 5 and less 5 10.87
Between 6 and 8 15 32.61
Between 9 and 12 18 39.13
13 and above 8 17.39
Total 46 100
According to the data shown in table 4; out of the 46 respondents who participated in the study,
the majority (76.09%) were males while (23.91%) were females. This finding could be an
indication that most of the farmers using agricultural best practices and technology were males.
The low number of women involved in SSI farming activities may hinder the productivity,
profitability and sustainability of SSISs in the study area.
Figure 2: Distribution of respondents by gender
It is evident from the data shown in table 4 that the majority of the farmers (34.78%) were aged
between 30-40 years, followed by the farmers aged 51 years and above represented by (32.61%),
76.09
23.91
Distribution of respondents by gender
Male Female

30
then the class ranging between 41-50 years (26.09%) while the least class was of 30 years and
below with 6.52%. The findings reveal that respondents comprises of farmers who are young and
middle aged. These are the age groups that understand innovation and contribute significantly
because they are still productive. Therefore, farmers in the study area are well versed with
modern farming technologies and this can influence positively the success of this economic
activity.
Figure 3: Distribution of respondents by age
The results in table 4 also indicated that, majority (36.95%) of the farmers have attended primary
level of education followed by those that attended O-Level (19.56%), the respondents who
completed primary and secondary are 10.88% and 10.88% respectively. The farmers who did not
attended school represent (2.17%). Generally, the results pointed out that the majority of farmers
have attained basic education. This means that the majority of farmers in the study area can
easily understand various methods, innovations and new technologies in farming systems; this
can greatly influence positively on productivity, profitability and sustainability of irrigation
infrastructures.
0
5
10
15
20
25
30
35
40
> 30 30-40 41-50 51 and above
Distribution of respondents by age
Frequency Percentage (%)

31
Figure 4: Distribution of respondents by level of education The results in able 4 showed that majority (89.13%) of the farmers were married followed by
widowed class with (8.69%) and the least class was that of single farmers represented by 2.18%.
This is possible because many times young and unmarried people usually do not engage in the
agricultural sector; another reason is that the old and elderly people are the main owners of land
and have information and experience in agriculture. The restrictive factor for the young and
widowed class is the limited access to agricultural bank credit and land.
Figure 5: Distribution of respondents by marital status
05
10152025303540
Distribution of of respondents by level of eduction
Frequency Percentage (%)
2.18
89.13
8.69
0
10
20
30
40
50
60
70
80
90
100
Single Married Widowed
Distribution of respondents by marital status
Frequency Percentage (%)

32
The results in able 4 also revealed that majority of the farmers (39.13%) had family members
ranging between 9-12 followed by the class ranging between 6-8 members (32.61) then, the class
ranging from 13 and above (17.39) while the least class is of five and less members represented
by (10.87%).This result indicated that most of the farmers use family labor in many of their
agricultural best practices such as planting, weeding, pest and diseases control and mulching. In
other words, the higher the number of household members, the larger the labor force which many
times is the limiting factor for productivity, profitability and sustainability of irrigation water in
study area and other developing countries.
Figure 6: Distribution of respondents by family size
4.2 Regression analysis results to determine the profitability of using irrigation water
4.2.1 Profitability analysis Bumusse SSIS
The overall maximum production (gross margin) for the crops grown at Bumusse SSIS was
found to be on tomato crop with a gross margin of 14099000 shillings while the highest net
income generated per size of plot cultivated was found to be on watermelon crop as presented in
table 5.
10.87
32.61
39.13
17.39
0
5
10
15
20
25
30
35
40
45
5 and less Between 6 and 8 Between 9 and 12 13 and above
Distribution of respondents by family size
Frequency Percentage (%)

33
The discounted NPV for four out of the five crops grown at Bumusse SSIS with positive net
income per year were -404374335, -565114335, -508930335 and -526414335 shillings for
tomato, green pepper, cabbage and watermelon respectively. With these results, it was seen that
all crops did not do well at Bumusse SSIS with the current production patterns exhibited by
different crops hence the negative NPVs. This means that the overall production system should
be revised in order to achieve returns on investment and make contributions to food security,
household incomes and nutrition.
Table 5: Profitability analysis of Bumusse SSIS
Crop Acreage Planted
Gross Margin per Season/Shs.
Total Production cost per Season/Shs.
Net Farm Income per Season/Shs.
Net Farm Income per Year/Shs.
Tomato 5.5 14099000 11275000 2824000 8472000
Onion 4 4244450 5124000 (879550) (2638650)
Cabbage 1 2211400 1130000 1081400 3244200
Green pepper 1 1363000 1218000 145000 435000
Water melon 0.5 1400000 610000 790000 2370000
Since the NPVs are less than zero, the adaptation approach of the project can be rejected. A
lower and or negative NPV indicates inefficiency in production and economic approach.
Table 6: A comparative status of NPV, BCR, ARR, and PBP of four crops grown at Bumusse SSIS
Particulars Tomatoes Green pepper Cabbage Watermelon
NPV (Shs.) -404,374,335 -565,114,335 -508,930,335 -526,414,335
BCR 0.29 0.01 0.11 0.08
PBP (years) 67.7 1319.1 176.8 242.1
ARR (%) 1.47 0.56 0.07 0.41
From the results summarized in table 6, the BCR for the crops grown were found to be 0.29 for
tomato, 0.01 for green pepper, 0.11 for cabbage and 0.08 for watermelon while investment in
onion did not yield any positive returns. The ratios for the four crops were less than one (1); this

34
showed that investment in these crops was not economically viable with the prevailing
conditions on the scheme. If factors such as soil conditions (fertility), pest and disease control
and farmers commitment are improved leaving other factors such as quality farm inputs and
water availability constant, then the yields per unit of land will improve.
According to the results from the study, if only one enterprise (crop) is chosen for the entire
scheme, the project costs could be fully recovered in 31 years from tomato, 110 years from green
pepper, 14.7 years from cabbage and 10 years from watermelon. This means that water melon is
more profitable if grown on the entire scheme land followed by cabbage then tomato and lastly
green pepper. The results also showed that the Average Rate of Return for the project were 1.47
for tomato, 0.56 for green pepper, 0.07 for cabbage and 0.41 for watermelon.
4.2.2 Profitability analysis for watermelon and tomato crops in Andibo and Bukatabira SSISs
The schemes are similar in the sense that both schemes have irrigable land equal to seven (7)
acres and the highest values in gross margin were realized in watermelon and tomato crops. The
cost of production was calculated based on the production cost at Bumusse SSIS shown in
appendix 3.
The analysis results in table 7 indicated that the net returns per year from the two SSISs are
121,306,920 and 34,730,684 shillings for tomato and watermelon respectively at Bukatabira
SSIS while at Andibo SSIS the returns are 50,416,800 and 200,802,000 shillings for tomato and
water melon respectively. With these results, it is evident that tomato does well at Bukatabira
SSIS while watermelon does well at Andibo SSIS. By comparing crops net farm income per site,
tomato generated 3.5 times net return per year than watermelon at Bukatabira SSIS while at
Andibo SSIS, watermelon generate 4 times net return per year than tomato. This means that
tomato is more profitable at Bukatabira SSIS and watermelon is more profitable at Andibo SSIS.
Looking at the highest production per crop per plot (0.5 acres) for the two (2) schemes,
2,225,400 and 8,880,000 shillings was generated from tomato and watermelon respectively at
Andibo SSIS while 1,698,000 and 5,869,000 shillings was generated from watermelon and
tomato respectively at Bukatabira SSIS (see appendix C). This implies that if maximum
production per plot is maintained and scaled out to the entire scheme specifically for tomato at
Bukatabira SSIS and watermelon at Andibo SSIS; these will significantly contribute to food
security, household incomes and nutrition in the study area.

35
Table 7: Economics Analysis of Profitability at Bukatabira and Andibo SSISs
Crop. Area
(acres) grown
Gross
return per season (shillings)
Gross return
for 7 acres per season (shillings)
Gross return
for 7 acres per year (shillings)
Productio
n cost per year for 7 acres (shillings)
Net return per year
Bukatabira
Tomato 2.5 19566300 54785640 164356920 43,050,000 121,306,920
Water melon 1.9 5460300 20116895 60350684 25,620,000 34,730,684
Andibo
Tomato 0.5 2225400 31,155,600 93466800 43,050,000 50,416,800
Water melon 1.5 16173000 75,474,000 226422000 25,620,000 200,802,000
From the scheme data collected, the number of farmers differed from one site to another. In line
with gender, at Bukatabira SSIS, the number of males equals the number of females. This means
that men and women supplement each other in the agriculture sector and this should be the best
approach for increasing household income as well as ensuring food security and household
nutrition. At Andibo SSIS, out of the 85 farmers at the scheme 65.8% were men while 34.2%
were female. This revealed that men dominate the agriculture sector since men are
predominantly household heads unlike women. According to the net farm income earned by each
farmer, at Bukatabira SSIS one farmers should gain 1,732,956 shillings from tomato compared to
496,153 shillings from watermelon. At Andibo SSIS one farmer should gain 593,139 shillings
from tomato compared to 2,362,376.5 shillings from watermelon. Generally, farmers in Andibo
SSIS earned much more than farmers at Bukatabira SSIS in both crops despite being more in
numbers due to the maximized production from each crop per unit area.
In the same frame of total number of farmers per scheme, most of the schemes have high number
of farmers hence the net margin per farmer is so low which is a demotivating factor to
participating farmers (see appendix C); for instance in Owameri SSIS where there are 330
registered farmers in a group benefiting from 12,547,500 shillings gross return from a season‟s
production (see appendix 4)

36
4.3 Sustainability of small-scale irrigation schemes in Uganda
4.3.1 Economic analysis of sustainability of small-scale irrigation schemes in Uganda
Net present value analysis should be used in any study supporting government decisions to
initiate, renew, or expand projects or programs that would result in a series of measurable
benefits or costs extending from one to more years into the future. This study was done
considering that the design period (lifespan) of the SSISs, which is 20 years. This analysis is
done on two (2) SSISs namely Andibo and Bukatabira located in the Northern and Eastern parts
of Uganda respectively.
The values of NPV, BCR, PBP and ARR are depicted in table 8. It is evident that investment in
irrigation water was remunerative. Net Present Value (NPV) of future returns was discounted
using the initial investment cost and the net returns generated from harvests. The discounted
NPV at Bukatabira SSIS was 1,905,395,295 for tomato and 173,870,575 shillings for
watermelon crops while at Andibo SSIS, the NPV were 358,336,000 and 3,366,040,000 shillings
for tomato and watermelon crops respectively. The high NPV of 1,905,395,295 shillings and
BCR of 4.6 for tomato at Bukatabira SSIS and NPV of 3,366,040,000 shillings and BCR of 6.2
for watermelon at Andibo SSIS indicated that it was worth investing in irrigation water. BCR
clearly indicates that tomato crop is the most efficient at Bukatabira SSIS while watermelon is
most efficient at Andibo SSIS.
Considering the initial costs of investment and the net annual returns generated, the project will
have a payback period of 4.3 and 14.9 years when tomato and watermelon crops respectively are
encouraged at Bukatabira SSIS and a payback period of 3.2 and 12.9 years when watermelon
and tomato crops respectively are encouraged at Andibo SSIS. This means that, the higher the
net farm income generated per year, the shorter the time taken to break even (PBP). This is
evident at Andibo site where a higher net farm income was generated particularly from
watermelon. At both sites, there are high values of NPV because of the high returns from
production of tomato and watermelon. This therefore indicated that investments in tomato and
watermelon at Bukatabira and Andibo SSISs respectively were economically viable and
sustainable using irrigation water; hence the initial investment costs will fully be recovered
before the 20 year project design period elapsing irrespective of the crop grown and the scheme.

37
The average rate of return expresses the profits arising from a project as a percentage of the
initial capital cost. To determine the discounted Average Rate of Return (ARR), the values were
discounted considering the difference between the initial project cost and the discounted returns
from harvests of each crop. The ARR values at Bukatabira SSIS were 23.3% and 6.7% for
tomato and watermelon respectively while at Andibo SSIS the ARR values were 30.8% and
7.7% for watermelon and tomato respectively. The values realized were greater than one (1)
percent for both crops at the two sites. By principle, the project with the highest ARR value is
considered as the best and that particular option is taken up first by an investor. For this study, all
the two crops should be encouraged because the NPV, BCR, ARR, and PBP are very significant
at both sites for the anticipated success of the project.
Table 8: Economic Analysis of sustainability of small-scale irrigation scheme
Particulars Bukatabira Andibo
Tomatoes Watermelon Tomatoes Watermelon
NPV (Shs.) 1,905,395,295 173,870,575 358,336,000 3,366,040,000
BCR 4.6 1.3 1.5 6.2
PBP 4.3 14.9 12.9 3.2
ARR (%) 23.3 6.7 7.7 30.8
4.3.2 Tobit regression analysis of sustainability of small-scale irrigation schemes
The sustainability of SSISs in Uganda especially in study area depends on several factors. Some
of factors are affordable system, reliable water supply, enough water availability, access to
investment funds, labor availability, availability of extension services, security, quality of inputs,
conducive land policy, and benefit on farmer‟s investments. Table 9 summarizes the main
factors affecting the sustainability of small-scale irrigation schemes in Uganda.

38
Table 9: Tobit regression analysis of sustainability of small-scale irrigation schemes
Variables Coefficient Std. Err. P>t Affordable system 6.453 2.133 0.001 Reliable water supply -2.636 0.919 0.007 Enough water availability 0.697 0.248 0.015 Access to investment funds 0.401 0.546 0.0081 Labor availability 1.940 0.602 0.000 Availability of extension services 0.516 0.575 0.049 Security 0.983 0.410 0.087 Quality of inputs 0.021 0.117 0.000 Conducive land and water policy 0.388 1.512 0.197
enefit on farmer‟s investments 0.289 4.685 0.000
Constant -1,058 0.528 0.002 Number of obs = 46 Prob > chi2 = 0.0000 Log likelihood = -951.91224 R2 = 0.815
In the study area, sustainability of small-scale irrigation was used as the dependent variable
while factors contributing to sustainability of SSI were used as independent variables in the Tobit
regression model. This was used to identify the factors that contribute to sustainability of small-
scale irrigation after employing a field survey in the study area. 46 observations in our data set
were used in the analysis of this study, with a p-value of 0.0000 and R2 of 0.815. This tells us
that our model as a whole fitted significantly at 100%. The results indicated that many factors
such as affordable system, labor availability, Security, enough water availability, availability of
extension services, access to investment funds, conducive land and water policy and benefit on
farmer investments have significantly contributed to the sustainability of small-scale irrigation in
the study area at 1% level.
These factors therefore affect productivity of irrigation water. This positive influence suggests
that when one factor increases, the sustainability of the irrigation schemes in study area also
increases. This means that a one-unit increases in quality of inputs should increase the
sustainability of small-scale irrigation schemes by 0.021%. It is usually expected that a unit
increase in the Security of infrastructures should increase sustainability of small-scale irrigation
by 0. 983%. This also implies that a 1% increase in affordable system, reliable water supply,
enough water availability, access to investment funds, and labor availability should increase the
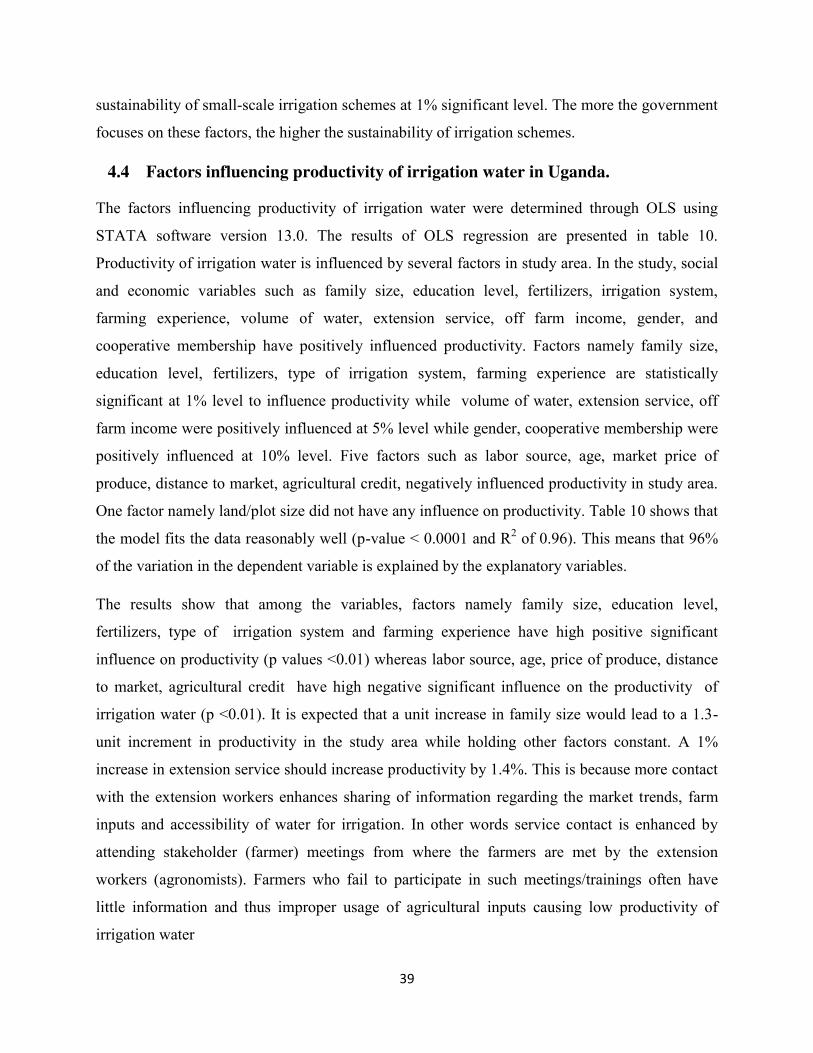
39
sustainability of small-scale irrigation schemes at 1% significant level. The more the government
focuses on these factors, the higher the sustainability of irrigation schemes.
4.4 Factors influencing productivity of irrigation water in Uganda.
The factors influencing productivity of irrigation water were determined through OLS using
STATA software version 13.0. The results of OLS regression are presented in table 10.
Productivity of irrigation water is influenced by several factors in study area. In the study, social
and economic variables such as family size, education level, fertilizers, irrigation system,
farming experience, volume of water, extension service, off farm income, gender, and
cooperative membership have positively influenced productivity. Factors namely family size,
education level, fertilizers, type of irrigation system, farming experience are statistically
significant at 1% level to influence productivity while volume of water, extension service, off
farm income were positively influenced at 5% level while gender, cooperative membership were
positively influenced at 10% level. Five factors such as labor source, age, market price of
produce, distance to market, agricultural credit, negatively influenced productivity in study area.
One factor namely land/plot size did not have any influence on productivity. Table 10 shows that
the model fits the data reasonably well (p-value < 0.0001 and R2 of 0.96). This means that 96%
of the variation in the dependent variable is explained by the explanatory variables.
The results show that among the variables, factors namely family size, education level,
fertilizers, type of irrigation system and farming experience have high positive significant
influence on productivity (p values <0.01) whereas labor source, age, price of produce, distance
to market, agricultural credit have high negative significant influence on the productivity of
irrigation water (p <0.01). It is expected that a unit increase in family size would lead to a 1.3-
unit increment in productivity in the study area while holding other factors constant. A 1%
increase in extension service should increase productivity by 1.4%. This is because more contact
with the extension workers enhances sharing of information regarding the market trends, farm
inputs and accessibility of water for irrigation. In other words service contact is enhanced by
attending stakeholder (farmer) meetings from where the farmers are met by the extension
workers (agronomists). Farmers who fail to participate in such meetings/trainings often have
little information and thus improper usage of agricultural inputs causing low productivity of
irrigation water

40
A 1-year increase in farming experience should increase productivity by 0.32%. This is because
the more years a farmer takes in farming, the higher the knowledge and experience in different
agricultural practices hence, high reduction of production challenges for example irrigation
system failures and crop pests and diseases. Factors such as age, price of produce, distance to
market, agricultural credit, negatively influenced productivity. It is expected that a 1-kilometer
increase in distance to the market reduces productivity by 0.14%. This shows that accessibility to
market is a key factor in determining the level of uptake of SSI and agricultural productivity. For
a unit reduction in price of produce, there is a 0.3% reduction in agricultural productivity in the
study area holding other factors constant.
Table 10: Factors influencing productivity of irrigation water in Uganda
Variables Coefficient Standard Errors P-value
Land size/plot 0.649 0.319 0.684 Labor source -0.447 0.305 0.057 Family size 1.295 0.211 0.000 Gender 0.178 0.055 0.086 Age -0.621 0.176 0.073 Education level 0.162 0.232 0.005 Fertilizers 0.191 0.077 0.001 Type of irrigation system 0.774 0.267 0.000 Volume of water used 0.999 0.09 0.013 Off farm income 0.749 0.361 0.052 Market price of produce -0.298 0.583 0.000 Distance to Market -0.138 0.137 0.077 Access to agricultural credit -0.697 0.213 0.000 Farming experience 0.319 0.304 0.000 Extension Service 1.421 0.113 0.035 Cooperative membership 0.224 0.306 0.081 Constant 0.774 1.402 0.000 Number of obs = 46 R2 = 0.9606 F( 16, 39) = 44.22 Adj R2 = 0.9389
4.5 Factors Influencing Farmers’ Willingness to Pay for Irrigation Water
The results of the regression are presented in table 11. The results indicate that 73.72% of the
variation in the dependent variable (Farmers‟ Willingness to Pay for Irrigation Water) is
explained by the explanatory variables. The overall significance and fitness of the model is

41
indicated by the F value, which in this case is 83.35 and is significant at 1% level, indicating that
the explanatory variables reliably and statistically predict the dependent variable.
Out of the eleven explanatory variables, four such as rate of rainfall, education level, off farm
income and access to credit were statistically significant at 1% level to influence the farmers‟
willingness to pay for irrigation water in study area. This implies that 1% increase in credit
access by farmers increases the farmers‟ willingness to pay for irrigation water by 0.074%. The
results also indicated that the off farm income was statistically significant to influence farmers‟
willingness to pay for irrigation water at 1% level. This explains that households that earned off-
farm income were willing to pay more compared to those that do not earn off-farm income.
s expected, access to credit also positively and significantly influenced farmers‟ willingness to
pay for irrigation water. This could be due to the possibility that part of the accessed credit
offered was used to pay for irrigation water, among other inputs thereby increasing agricultural
production and eventually productivity of irrigation water. Education level on best management
of irrigation water and application system positively influenced farmers‟ willingness to pay for
irrigation water; farmers with high education level understand more agricultural best practices
and better management and use of irrigation water system. This class of educated farmers were
found to be more willing to pay more compared to those who are not educated hence are not
willing to pay for irrigation water.
Five factors such as age, household size, land size, rate of rain fall, and cost of inputs cost were
found to have a negative relationship with farmers‟ willingness to pay for irrigation water. For
example rate of rainfall was found to be negative and statistically significant at 1% level to
influence farmers‟ willingness to pay for irrigation water. This implies that 1% increase in rate of
rainfall should reduce the farmers‟ willingness to pay for irrigation water by 0.97%. While a 1%,
increase in household size should reduce the farmers‟ willingness to pay for irrigation water by
0.013%; this may result from the extra cost of taking care of the additional person in the
household.

42
Table 11: Factors Influencing Farmers’ Willingness to Pay for Irrigation Water
Variables Coefficient
Standard Errors P value
Age -0.076 0.024 0.014 Gender 0.036 0.044 0.414 Household size -0.013 0.009 0.066 Education level 0.056 0.037 0.009 Off farm income 0.119 0.082 0.002 Access to credit 0.074 0.043 0.000 Land size -0.694 0.206 0.071 Rate of rain fall -0.967 0.296 0.000 Money gained from harvest 0.391 0.676 0.067 Money paid per season 0.035 0.028 1.923 Cost of Inputs -0.766 0.322 0.921 Constant 1.802 0.508 0.000 Number of observations = 46 Prob>F = 0.0000 F (11,34) = 83.35 R2 = 0.7372
4.6 Implications of water user rights and costs on adoption of irrigation in Uganda
The results in table 12 indicated that the water user rights and costs have positive implications on
adoption of irrigation water in Uganda and has got significant influence on other factors such as
price of irrigation water, extension services, access to agricultural information, off farm
production, cooperative membership, training opportunities, personal savings, contribution for
operation and maintenance and high agricultural productivity. This implies that 1% increase in
water user rights and costs through off farm production should increase adoption of irrigation in
Uganda by 0.34%. It implies also that one unit increase in water user rights and costs through
Cooperative membership should increase adoption of irrigation in Uganda by 0, 93%. It implies
also that 1% increase in water user rights and costs through access to agricultural information,
and extension services should increase adoption of irrigation in Uganda by 0.23 and 1.46%
respectively.

43
Table 12: Tobit estimate of implications of water user rights and costs on adoption of irrigation in Uganda
Variables Coefficient Standard Error P>|t| Volume of water supplied -0.245 7.743 0.109 Price of water for irrigation 0.728 0.220 0.000 Extension services 1.461 2.925 0.008 Training opportunities 1.527 4.571 0.020 Access to agricultural information 0.230 0.748 0.000 Off farm production 0.338 0.555 0.000 Contribution rate on maintenance 0.497 1.000 0.059 Personal savings 0.412 0.493 0.011 Cooperative membership 0.932 0.682 0.000 Soil fertility test -0.694 3.735 0.481 High agricultural productivity 1.325 2.077 0.078 Constant 1.031 0.831 0.000 Number of obs. 46 LR chi2(11) 114.33 Prob > chi2 0.00 Pseudo R2 0.09 Log likelihood -1267.24

44
5 CONLUSION AND RECOMMENDATIONS
5.1 Conclusion
The results from the 46 respondents who participated in this research study indicated that the
majority (76.09%) were males while (23.91%) were female. The findings could be an indication
that most of the farmers using agricultural best practices and technology were males. The low
number of women involved in SSI farming activities may hinder the productivity, profitability
and sustainability of SSISs in the study area.
Also, majority of the farmers (34.78%) were aged between 30-40 years, followed by the farmers
aged of 51 years and above represented by (32.61%), then the class ranging between 41-50 years
(26.09%) while the least class was of 30 years and below with 6.52%. The findings reveal that
respondents comprises of farmers who are young and middle aged. These are the age groups that
understand innovation and contribute significantly because they are still productive. Therefore,
farmers in the study area are well versed with modern farming technologies, which can influence
positively the success of SSI projects.
The results also indicated that majority (36.95%) of the farmers have attended primary level of
education followed by those that attended O-Level (19.56%), the respondents who completed
primary and secondary are 10.88% and 10.88% respectively. The farmers who did not attended
school represent (2.17%). This means that majority of the farmers in study area can easily
understand various methods, innovations and new technologies in farming systems; this can
greatly influence positively on productivity, profitability and sustainability of irrigation
infrastructures.
The results in table 4 also showed that majority (89.13%) of the farmers were married followed
by widowed class with (8.69%) and the least class was that of single farmers represented by
2.18%; the same results also revealed that majority of the farmers (39.13%) have family
members ranging between 9-12 followed by the class ranging between 6-8 members (32.61)
then, the class ranging from 13 and above (17.39) while the least class is of five and less
members represented by (10. 87%).This result indicates that most of the married farmers use
family labor in many of the agricultural best practices such as planting, weeding, pest and
diseases control and mulching. In other words, the higher the number of households members,

45
the larger the labor force which many times is the limiting factor for productivity, profitability
and sustainability of irrigation water; the restrictive factor for the young and widowed class is the
limited access to agricultural bank credit and land.
The net benefit per year and the values of NPV, BCR, ARR and PBP clearly indicate that the
investment in five crops at Bumusse is not economically viable.
The results indicated that the net returns per year from two SSISs namely Bukatabira and
Andibo are 121,306,920 and 34,730,684 shillings for tomato and watermelon respectively at
ukatabira SSIS while at ndibo the returns are 50,416,800 and 200,802,000 shillings for
tomato and water melon respectively. With these results, it is evident that tomato does well at
Bukatabira SSIS while watermelon does well at Andibo SSIS. By comparing net returns per crop
per site, tomato generated 3.5 times than watermelon at Bukatabira SSIS while at Andibo SSIS
watermelon generate 4 times than tomato. According to the net farm income earned by each
farmer, at Bukatabira SSIS one farmers should earn 1,732,956 shillings from tomato compared to
496,153 shillings from watermelon while at Andibo SSIS one farmer should earn 593,139
shillings from tomato compared to 2,362,376.5 shillings from watermelon. Generally, farmers in
Andibo SSIS earned much more than farmers at Bukatabira SSIS in both crops despite being
more in numbers due to the maximized production from each crop per unit area of land.
The high NPV of 1,905,395,295 shillings and BCR of 4.6 for tomato at Bukatabira SSIS and
NPV of 3,366,040,000 shillings and BCR of 6.2 for watermelon at Andibo SSIS indicated that it
was worth investing in irrigation water. The ARR values for Bukatabira SSIS were 23.3% and
6.7% for tomato and watermelon respectively while at Andibo SSIS the ARR values were 30.8%
and 7.7% for watermelon and tomato respectively. The projects will have a payback period of
4.3 and 14.9 years when tomato and watermelon crops respectively are encouraged at Bukatabira
SSIS and a payback period of 3.2 and 12.9 years when watermelon and tomato crops
respectively are encouraged at Andibo SSIS. These high values of ARR and short PBP are an
indication that the projects are sustainable.
Factors such as affordable system, labor availability, quality of inputs used, benefit on farmer
investments and access to investment funds have significantly contributed to the sustainability of
SSISs in the study area.

46
Factors such as family size, education level, fertilizers, type of irrigation system and farming
experience have high positive significant influence on productivity whereas labor source, age,
price of produce, distance to market, agricultural credit have high negative significant influence
on the productivity of irrigation water
Rate of rainfall, education level, off farm income and access to credit have a positive influence
the farmers‟ willingness to pay for irrigation water in study area while age, household size, land
size, rate of rain fall, and cost of inputs cost were found to have a negative relationship with
farmers‟ willingness to pay for irrigation water. .
Water user rights and costs have positive implications on adoption of SSI in Uganda and has got
significant influence on other factors such as price of irrigation water, extension services, access
to agricultural information, off farm production, cooperative membership, training opportunities,
personal savings, contribution for operation and maintenance and high agricultural productivity.
The field findings from Puno SSIS on the two (2) harvests so far made indicated that the second
harvest made tripled the first harvest; there was a 204.5% overall increase in gross return from
different enterprises in the second harvest as compared to the first. This is an indication that the
farmers are adopting better methods of farming with the guidance of the agronomist on the best
crop varieties as well as the market forces depending on seasonality factors. Another factor for
this increase is the fact that group farming has been discouraged hence individual/model farming
approach; this has eased farmer follow-ups, farming plot monitoring and management. This
result therefore is an indication that the project is improving with time and all efforts should be
gathered until the expected production per unit of land is obtained.

47
Table 13: Enterprises and gross returns for first and second harvests at PUNO SSIS
Gross Returns (Shs.)
S/n. Enterprise First Harvest Second Harvest
1 Egg plants 2049300 7123300
2 Onions 297100 1194000
3 Cabbage 1002000 630000
4 Water melons 420000 1437000
5 Tomatoes 75000 1501500
TOTAL 3903400 11885800
5.2 Recommendations
5.2.1 To government
According to the data from the 46 respondents that participated in this research study, the
majority were males in study area. Here female farmers should be encouraged and
supported to participate in agricultural activities in order to increase and improve their
incomes.
According to the values of NPV, ARR, BCR and PBP in the study area, production of
tomato should be encouraged at Bukatabira SSI where it is most cost effective to produce
while watermelon is should be encourage at Andibo SSI.
The production system at Bumusse SSI should be revised to realize the return on
investment within the project design period
Affordable SSI systems, quality farm inputs and investment funds should be easily
accessible to prospective farmers.
The factors that influence the farmers‟ willingness to pay for irrigation water in study
area should be encouraged in order to have enough water for irrigation as well as to
increase agricultural productivity in scheme area.
Government should ensure that SSISs set up are supported to achieve maximum
production before commissioning to farmers (beneficiaries)

48
Government should ensure the availability of affordable irrigation systems, investment
funds and quality farm inputs for farmers to realize benefits on investments
Government should ensure that there is available and stable market for agricultural
products
Government should make affordable the price of irrigation water
Government should ensure adequate extension services and agricultural information
access
Government should ensure an enabling environment for formation and operation of
farmer cooperatives.
5.2.2 To Scheme Management Committees
SSISs should focus on crops with greater production advantages
The number of farmers per scheme should be sustainable in relation to benefit per farmer

49
6 REFERENCES
Armen, A. A., & Harold, D. (1973). The Property Right Paradigm, The Tasks of Economic History. The Journal of Economic History, Vol. 33, No. 1, (Mar., 1973), pp. 16-27. Retrieved from: http://links.jstor.org/sici?sici=0022-0507%28197303%2933%3A1%3C16%3ATPRP%3E2.0.CO%3B2-A
Attia, B.B. (1997). A framework for the development of Egypt’s national water policy, in: Proceedings of the Expert Consultation on National Water Policy Reform in the Near East (Cairo, FAO).
Bromley, D. (1992). The commons, property, and common-property regimes. Pages 3-16. Institute for Self-Governance Press, San Fancisco.
Carruthers, I. D. (1970). East African Geographical Review, Volume 1970, Issue 8, Apr 1970, p. 11 - 22
Easter, K. W. (1986). Irrigation, Investment, Technology, and Management Strategies
for Development. Boulder, CO: Westview Press. Eirik, G. F., & Svetozar, P. (1972). Property Rights and Economic Theory: A Survey
of Recent Literature Journal of Economic Literature, Vol. 10, No. 4. (Dec., 1972), pp. 1137-1162. Retrieved from: http://links.jstor.org/sici?sici=0022-0515%28197212%2910%3A4%3C1137%3APRAETA%3E2.0.CO%3B2-V
Ewnetu, . (1987). “Water Law of Ethiopia.” Submitted in Partial Fulfillment of the Requirement for the Degree of Bachelor of Law. Addis Ababa University. Addis Ababa.
FAO. (2018). Land and Water, Water Management, Scheme Water Management. Retrieved from: http://www.fao.org/land-water/water/water-management/en/
FAO (2005). FAO’s Information System on Water and Agriculture: Land and Water Development Division.
FAO. (2003). Agriculture, Food and Water, Rome, Annex One.
Farolfi, S. (2004). Action research for the development of a negotiation support tool towards
decentralised water management in South Africa. Working Paper: 2004-01. University of Pretoria, South Africa.
Gerald, T. O. M. (1999). Efficiency in Irrigation: The Conjunctive Use of Surface and Ground
water Resources, Enhanced irrigation efficiency (A World Bank Symposium). Pg. 97/98
GWP. (2018). Dublin-Rio Principles. Retrieved from: https://www.gwp.org/contentassets/05190d0c938f47d1b254d6606ec6bb04/dublin-rio-principles.pdf
Hamdy, A., Abu -Zeid, M., & Lacirignola, C. (1995). Water crisis in the Mediterranean:
agricultural water demand management, Water International, 20, pp., 176 - 187.
Howe, C. H. (1996). Sharing Water Fairly, Our Planet, 8: 15-17

50
Hugh, T., Mark, S., & Jean, M. F. (2010). Investing in irrigation: Reviewing the past and looking to the future. Agricultural Water Management, 97(4), 551–560.
Hussain, I., & Hanjra, A.M. (2003). Does irrigation water matter for rural poverty alleviation? Evidence from South and South- East Asia, Water policy 5(5/6):429-442.
Karina, S., & David, Z. (2007). The Economics of Water, Irrigation, and
Development. Agricultural Development: Farmers, Farm Production and Farm Markets, Chapter 58, Pg. 2933–2977.
Kloezen, W. H. (1998). Water Markets between Mexican Water User Associations, Water Policy, 1:437-455.
Kuruk, P. (2005). Customary Water Laws and Practices. Nigeria.
Latham, J. (2000). Towards an understanding of local level adaptive management: Matching the biosphere with the sociosphere. Paper presented at the 1st WARFSA/ WaterNet Symposium: Sustainable use of Water Resources, 1-2 November 2000, Maputo.
Lemma, D. (2004). “Smallholders’ Irrigation Practices and Issues of Community
Management: The Case of Two Irrigation Systems in Eastern Oromia, Ethiopia.” M Thesis. Addis Ababa University.
Miller, K. A. (1987). The right to use versus the right to sell: Spillover effects and constraints on
the water
rights of irrigation organization members. Water Resources Research, 23(12), 2166–2174. doi:10.1029/wr023i012p02166
Ministry of Water Resources (1999). Ethiopian Water Resources Management Policy. The Federal Democratic Republic of Ethiopia. BERHANENA SELAM PRINTING ENTERPRISE.
Mtisi, S., & Nicol, A. (2003). Caught in the act: New stakeholders, decentralisation and water
management processes in Zimbabwe. Sustainable Livelihood in Southern Africa. Research Paper No. 14. Institute of Development Studies, Brighton, UK.
Nassar, S., Sands, F.B., Omran, M.A. & Krenz, R. (1996). Crop production responses to the
agricultural policy reforms. Egypt‟s griculture in a Reform Era, Ames, Iowa State University Press.
Okonjo-Iweala, N., & Fuleihan, Y. (1993). Structural adjustment and Egyptian agriculture:
some
preliminary indications of the impact of economic reforms, in: M.A. Faris & M.H. Khan (Eds) Sustainable Agriculture in Egypt, London, Lynne Rienner.
Paul, M. O. (2003). Defining property rights for water marketing. Paper presented at the World Water Congress, International Water Resources Association, Madrid.
Pavlov, S.S. (2004). “Analysis of the irrigation management institutions in North Crimea Canal
System, Ukraine” MSc thesis, Wageningen University, 126 p.
51
Perret, S. R. (2002). Water policies and smallholding irrigation schemes in South Africa: A
history and new institutional challenges. Water Policy, 4 (3), 283-300.
Petra, J.G.J. H. (2005). Failure and Reform of Existing Incentives in the Irrigation Sector
in the Ukraine. Agriculture and Rural Development (The World Bank Group). LEI-Wagenigen University and Research
Pradhan, R., & Meinzen-Dick, R. (2003). Which Rights are Right? Water Rights, Culture, and Underlying Values. Water Nepal.
Republic of South Africa, RSA. (1998). The National Water Act. Act Number 36 of 1998.
Republic of Uganda. (2007). Uganda Vision 2040
Republic of Uganda. (2017). National Irrigation Policy. Ministry of Agriculture, Animal Industry and Fisheries and Ministry of Water and Environment
Republic of Uganda. (1998). The National Water Act. Act Number 36 of 1998
Republic of Uganda, (1999). The National Water Policy. Uganda, Ministry of Water, Lands and Environment
Republic of Uganda, (1995). The Constitution.
Republic of Uganda, (1995). The Uganda Water Action Plan (WAP)
Republic of Uganda, (1995). The Water Statute
Republic of Uganda, (1994). National Environment Management Policy
Republic of Uganda, (1995). National Environment Management Statute
Roerink, G.J., & O.I. Zhovtonog (2005) “Towards Sustainable Irrigated Agriculture in Crimea, Ukraine: A Plan for the Future - Technical Report”, Wageningen, lterra.
Meinzen-Dick, R., & Leticia, N. (2005). Understanding legal pluralism in water rights: Lessons from frica and sia presented at the International workshop on „ frican Water Laws: Plural Legislative Frameworks for Rural Water Management in frica‟, 26-28 January 2005, Johannesburg, South Africa.
Schlager, E., & Ostrom, E. (1992). Property-Rights Regimes and Natural Resources: A Conceptual Analysis. Land Economics 68(2), 249-62.
Trading Economics: Uganda, Agricultural land (percentage of land area). https://tradingeconomics.com/uganda/agricultural-land-percent-of-land-area-wb-data.htm Accessed on 6th April 2019
Tiwari, D. D. (2002). An analysis of evolution of water rights in South African society: An
account of three hundred years. Working Paper. University of Natal, Durban, South Africa.
Tiwari, D. D., & Ariel (2000). Role and use of economic incentives in irrigated
agriculture (English). Washington, DC: World Bank. Retrieved from: http://documents.worldbank.org/curated/en/688561468779666802/Role-and-use-of-economic-incentives-in-irrigated-agriculture

52
UBOS. (2010). Uganda Census of Agriculture 2008/09, Volume III; Agricultural Household and Holding Characteristics Report pages 116-139.
Vaz, Á. C., & Pereira, A. L. (2000). The Incomati and Limpopo international river basins: A
view from downstream. Water Policy, 2 (1-2), 99-112.
WFP. (2001). Water tenure, natural resource management and sustainable livelihood. Natural Resource Management No. 5. International Land Coalition Resource Centre, Rome, Italy.
William, M. A., & David, M. A. (1988). Irrigation before Development: Indigenous and Induced Change in Agricultural Water Management in East Africa. African Affairs, 87(349), 519–535.
Ward, P. N. (1993). Systems of agricultural production in the Delta. The Agriculture of Egypt, Oxford, Oxford University Press.

53
7 APPENDIX
7.1 Appendix A: Questionnaires, Interview guide and Observation Checklist
7.1.1 Model/Individual Farmer Questionnaire
THE RIGHT OF USE AND ECONOMICS OF IRRIGATION WATER IN UGANDA: A
COMPARATIVE ANALYSIS OF SMALL SCALE IRRIGATION SCHEMES IN
EASTERN, NORTHERN AND WESTERN UGANDA
DATE: ………………………
SCHEME NAME: …………………………………..
QUESTIONNAIRE NUMBER: ……………………
Introduction
The study is being conducted by OGWAL Harold who is a student at Pan African University
Institute of Water and Energy Sciences (including Climate Change). The main objective of the
study is to determine right of use and economics of irrigation water for small scale irrigation
schemes. You were chosen as one of the participants for this study. All answers which you will
provide will be used only for study purposes and will be treated confidential. The data obtained
from this study will be presented in summary form and will not identify any person. I will
appreciate your endeavor to answering all questions to the best of your abilities and knowledge.
You can ignore some questions or leave the survey if you so wish.
Interview start time: ……………….. End time: …………………

54
SECTION A: SOCIO-DEMOGRAPHIC
Name/First Name: ………………….………………………………………………… (optional)
District: …………..……… County: ……….……………… Sub-county: ……….…...…………..
Parish: ……………………. Village: ….…………………... ge: ………………………………..
Plot/ lock number: ……………….……….. ……... Plot/Block size: ………...…………………..
Level of education: …………………………………………………………………………...........
Gender: Male Female
Marital status: Single Married Widowed Divorced
Are you the: Household head Spouse
Family size: …………………..
Telephone: …………………… (optional)
SECTION B: PROFITABILITY (INCOME AND EXPENDITURE OF FARMERS) QUESTION 1. During what seasons of the year is your field grown?
(Please tick only one)
The rainy season only
Dry season and rainy season
Dry season only
QUESTION 2: What is the main crop grown in your field during the rainy season?
(Please tick only one)
Onions
Rice
Tomato
Sorghum
Millet
Cabbage
Others (please specify)………………………..

55
QUESTION 3: How many times on average do you irrigate your field during the rainy season?
(Please tick only one)
Drip (all the time)
Once per day
Once every two days
Once every three days
I do not irrigate my field during rainy season
Others (please specify)………………………..
QUESTION 4: How many liters of water do you use on average each time you irrigate your
field during rainy season?
………………………………………………………………………………………………………
QUESTION 5: What is the main crop grown in your field during the dry season?
(Please tick only one)
Onions
Rice
Tomato
Sorghum
Millet
Cabbage
Others (please specify)………………………..
QUESTION 6: How many times on average did you irrigate your field during the dry season?
(Please tick only one)
Drip (all the time)
Once per day
Once every two days
Once every three days
Others (please specify)………………………..
QUESTION 7: How many liters of water do you use on average each time you irrigate your
field during dry season?
………………………………………………………………………………………………………

56
QUESTION 8: How do you quantify and pay for irrigation water?
(Please tick only one)
Volumetric metering
Non-volumetric
Standard Ministry of Water and Environment permit rate
Do not pay for water used
Others (Please specify): ……………………………………………………………………
Month Jan Feb March April May June July August Sept Oct Nov Dec
Amount
QUESTION 9: What do you do with the crops produced?
(Please tick only one)
Sale
Domestic Use (home food)
Domestic Use and Sale
Other: ………………………………………………………………………………………
QUESTION 10: How much money do you earn on average from your crop?
Month Jan Feb March April May June July August Sept Oct Nov Dec
Income
QUESTION 11: Do you have other sources of income other than agriculture?
Yes
No
QUESTION 12: If yes, list them and state how much money you earn on average.
Month Jan Feb March April May June July August Sept Oct Nov Dec

57
QUESTION 13: How did you acquire this cropping plot/block?
(Please tick only one)
Purchase
Inheritance/gift
Rented
Others (specify): ……………………………………………………………………………
QUESTION 14: If rented, how much do you pay per season/year?
………………………………………................................................................................................
QUESTION 15: Do you employ family labor?
Yes
No
QUESTION 16: If not, what is the average cost of labor per year?
………………………………………………………………………………………………………
QUESTION 17: What other production expenses except for water, land and labor do you
encounter on a monthly basis?
Month Jan Feb March April May June July August Sept Oct Nov Dec
SECTION C: SUSTAINABILITY OF IRRIGATION SCHEMES
QUESTION 18: How much do you spend/contribute on average per year towards repair and
maintenance of the irrigation system?
………………………………………………………………………………………………………
58
QUESTION 19: What is the main source of money you contribute for repair and maintenance of
the irrigation system?
(Please tick only one)
Personal Savings from farming on the scheme
Bank loan
Microfinance/SACCO
VSLA
Borrowing money from friends or family
Others (Please specify) ……………………………………………………………………
QUESTION 20: Other than for farming, do you borrow money? How much and for what
purpose? ……………………………………………………………………………………………
QUESTION 21: Do you belong to any farmer‟s cooperative or savings scheme?
Yes
No
QUESTION 22: If no, please state why?
………………………………………………………………………………………………………
QUESTION 23: What fraction from returns on irrigated agriculture do you save for the future?
…...…………………………………………………………………………………………
QUESTION 24: How long have you been in the scheme?………………………………………....
SECTION D: FACTORS AFFECTING PRODUCTIVITY OF IRRIGATION WATER
QUESTION 25: Have you been trained on agronomic practices?
Yes
No
QUESTION 26: If yes, which topics did you cover? (Please outline briefly)
………………………………………………………………………………………………………
………………………………………………………………………………………………………
(Soil & water conservation, and irrigation water management: Value addition: Fertilizer Application: Disease and Pest control)

59
QUESTION 27: If no, do you wish to enroll for such trainings?
Yes
No
QUESTION 28: If no, why? (Please outline the reasons briefly)
………………………………………………………………………………………………………
………………………………………………………………………………………………………
………………………………………………………………………………………………………
QUESTION 29: Do you consult the agronomist from time to time on the progress of farm
activities?
Yes
No
QUESTION 30: If no, why? (Please outline the reasons briefly)
………………………………………………………………………………………………………
………………………………………………………………………………………………………
QUESTION 31: What irrigation technique(s) do you use for irrigation of your plot/block?
(Please tick appropriately)
Surface/gravity
Sprinkler
Drip
Center pivot
Sub-surface
Other (Please specify)
QUESTION 32: Do you always have enough irrigation water on your plot/block whenever
needed?
Yes
No
QUESTION 33: If no, what do you do to ensure that you meet the crop water requirements?
………………………………………………………………………………………………………
QUESTION 34: Do you have access to ready market for your produce?
Yes
No

60
QUESTION 35: What challenges have you encountered being part of the scheme?
………………………………………………………………………………………………………
………………………………………………………………………………………………………
QUESTION 36: Have you ever done soil testing on your plot/block?
Yes
No
QUESTION 37: Do you have any support from partners?
Yes
No
QUESTION 38: If yes, please elaborate.
………………………………………………………………………………………………………
………………………………………………………………………………………………………
QUESTION 39: Do you use fertilizers on your plot/block?
Yes
No
QUESTION 40: If yes, which ones do you use and how much do you apply?
Type of
fertilizer
Name
Quantity applied
per year (Kgs)
Unit cost
Organic
Inorganic
QUESTION 41: If no, why? ........………………………………………………………………….
………………………………………………………………………………………………………
SECTION E: FARMERS’ WILLINGNESS TO PAY FOR IRRIGATION WATER
QUESTION 42: How do you rate rainfall in this area?
Reliable Average Unreliable

61
QUESTION 43: Do you think irrigation increases crop output compared to rain fed agriculture?
Yes
No
QUESTION 44: Have you ever been advised about irrigation farming?
Yes
No
QUESTION 45: If yes, by whom?
………………………………………………………………………………………………………
……………………………………………………………………………………………………
QUESTION 46: Apart from the scheme, do you have anywhere else to grow your crops?
Yes
No
46: b. How big? …………………………………………………………………………………….
QUESTION 47: After the establishment of the irrigation scheme; operation and maintenance
should be handled by you (the farmers) to ensure steady supply of irrigation water. Therefore to
optimize long and short- term benefits from irrigation water, you and other households that
farm at the scheme are expected to contribute money per person per plot per year. If you were
requested to pay Ugx. 100000/=, would you be willing to pay?
Yes
No
QUESTION 48: If yes; the interviewer keeps increasing the bid until the respondent says no.
Then the maximum willingness to pay is deduced as Ugx……...……… per person per plot/block
per year. If no, the interviewer keeps decreasing the bid until the respondent says yes. Then the
maximum willingness to pay is elicited as Ugx……...……… per person per plot/block per year.
QUESTION 49: If the willingness to pay response is zero; state why? ...........................................
………................................................................................................................................................

62
QUESTION 50: In your own opinion, do you think paying for operation and maintenance of
irrigation water supply should be the responsibility of the farmers?
Yes
No
QUESTION 51: If yes, what method do you think this community will be willing to use to pay
for irrigation water if asked?
Volumetric
Non-volumetric
*Non volumetric
Per plot size
Per crop
QUESTION 52: If no, why? .............................................................................................................
………………………………………………………………………………………………………
Thank you very much for your participation in this study.
Researcher: OGWAL Harold; 0772-004059; [email protected]
Research supervisor: Peter Mbabazi Mbabazize (PhD); 0780-298805;

63
7.1.2 Farmer Group questionnaire
THE RIGHT OF USE AND ECONOMICS OF IRRIGATION WATER IN UGANDA: A COMPARATIVE ANALYSIS OF SMALL SCALE IRRIGATION SCHEMES IN
EASTERN, NORTHERN AND WESTERN UGANDA
DATE: ………………………
SCHEME NAME: …………………………………..
QUESTIONNAIRE NUMBER: ……………………
Introduction
The study is being conducted by OGWAL Harold who is a student at Pan African University
Institute of Water and Energy Sciences (including Climate Change). The main objective of the
study is to determine right of use and economics of irrigation water for small scale irrigation
schemes. Your farmer group was chosen as one of the groups for this study. All answers which
you will provide will be used only for study purposes and will be treated confidential. The data
obtained from this study will be presented in summary form and will not identify any person(s). I
will appreciate your endeavor to answering all questions to the best of your abilities and
knowledge. You can ignore some questions or leave the survey if you so wish.
Interview start time: ……………….. End time: …………………
SECTION A: SOCIO-DEMOGRAPHIC
Group Name: ………………….…………………………………………………...… (optional)
District: …………..……… County: ……….……………… Sub-county: ……….…...…………..
Parish: ……………………. Village: ….…………………...
Plot/ lock number: ……………….……….. ……... Plot/ lock size: ………...…………………..
Group size: …………………………………………………………………………........................
Gender composition: Male Female
Telephone: ………………………………………………………………….………… (optional)

64
SECTION B: PROFITABILITY (INCOME AND EXPENDITURE OF FARMERS)
QUESTION 1. During what seasons of the year is your field grown?
(Please tick only one)
The rainy season only
Dry season and rainy season
Dry season only
QUESTION 2: What is the main crop grown in your field during the rainy season?
(Please tick only one)
Onions
Rice
Tomato
Sorghum
Millet
Cabbage
Others (please specify)………………………..
QUESTION 3: How many times on average do you irrigate your field during the rainy season?
(Please tick only one)
Drip (all the time)
Once per day
Once every two days
Once every three days
I do not irrigate my field during rainy season
Others (please specify)………………………..
QUESTION 4: How many liters of water do you use on average each time you irrigate your
field during rainy season?
………………………………………………………………………………………………………

65
QUESTION 5: What is the main crop grown in your field during the dry season?
(Please tick only one)
Onions
Rice
Tomato
Sorghum
Millet
Cabbage
Others (please specify)………………………..
QUESTION 6: How many times on average did you irrigate your field during the dry season?
………………………………………………………………………………………………………
(Please tick only one)
Drip (all the time)
Once per day
Once every two days
Once every three days
Others (please specify)………………………..
QUESTION 7: How many liters of water do you use on average each time you irrigate your
field during dry season?
………………………………………………………………………………………………………
QUESTION 8: How do you quantify and pay for irrigation water?
(Please tick only one)
Volumetric metering
Non-volumetric
Standard Ministry of Water and Environment permit rate
Do not pay for water used
Others (Please specify): ……………………………………………………………………

66
QUESTION 9: What do you do with the crops produced?
(Please tick only one)
Sale
Domestic Use (home food)
Domestic Use and Sale
Other: ………………………………………………………………………………………
QUESTION 10: How much money do you earn on average from your crop?
………………………………………………………………………………………………………
QUESTION 11: How did you acquire this cropping plot/block?
(Please tick only one)
Purchase
Inheritance/gift
Rented
Others (specify): ……………………………………………………………………………
QUESTION 12: If rented, how much do you pay per season/year?
………………………………………................................................................................................
QUESTION 13: Do you employ family labor?
Yes
No
QUESTION 14: If not, what is the average cost of labor per year?
………………………………………………………………………………………………………
QUESTION 15: What other production expenses except for water, land and labor do you
encounter on a monthly basis?
………………………………………………………………………………………………………
………………………………………………………………………………………………………

67
SECTION C: SUSTAINABILITY OF IRRIGATION SCHEMES
QUESTION 16: How much do you spend/contribute on average per year towards repair and
maintenance of the irrigation system?
………………………………………………………………………………………………………
QUESTION 17: What is the main source of money you contribute for repair and maintenance of
the irrigation system?
(Please tick only one)
Savings from farming on the scheme
Bank loan
Microfinance/SACCO
VSLA
Borrowing money from friends or family
Others (Please specify) ……………………………………………………………………
QUESTION 18: Other than for farming, do you borrow money? How much and for what
purpose? ……………………………………………………………………………………………
QUESTION 19: Is your group registered as a farmer‟s cooperative or savings scheme?
Yes
No
QUESTION 20: If no, please state why?
………………………………………………………………………………………………………
QUESTION 21: What fraction of returns from irrigated agriculture does your group save for the
future? ….........…………………………………………………………………………………
QUESTION 22: How long have you been in the scheme? ……………………………………....
SECTION D: FACTORS AFFECTING PRODUCTIVITY OF IRRIGATION WATER
QUESTION 23: Have you been trained on agronomic practices?
Yes
No

68
QUESTION 24: If yes, which topics did you cover? (Please outline briefly)
………………………………………………………………………………………………………
………………………………………………………………………………………………………
(Soil & water conservation, and irrigation water management: Value addition: Fertilizer Application: Disease and Pest control)
QUESTION 25: If no, do you wish to enroll for such trainings?
Yes
No
QUESTION 26: If no, why? (Please outline the reasons briefly)
………………………………………………………………………………………………………
………………………………………………………………………………………………………
………………………………………………………………………………………………………
QUESTION 27: Do you consult the agronomist from time to time on the progress of farm
activities?
Yes
No
QUESTION 28: If no, why? (Please outline the reasons briefly)
………………………………………………………………………………………………………
………………………………………………………………………………………………………
QUESTION 29: What irrigation technique(s) do you use for irrigation of your plot/block?
(Please tick appropriately)
Surface/gravity
Sprinkler
Drip
Center pivot
Sub-surface
Other (Please specify)
QUESTION 30: Do you always have enough irrigation water on your plot/block whenever
needed?
Yes
No

69
QUESTION 31: If no, what do you do to ensure that you meet the crop water requirements?
………………………………………………………………………………………………………
………………………………………………………………………………………………………
QUESTION 32: Do you have access to ready market for your produce?
Yes
No
QUESTION 33: What challenges have you encountered being part of the scheme?
………………………………………………………………………………………………………
………………………………………………………………………………………………………
QUESTION 34: Have you ever done soil testing on your plot/block?
Yes
No
QUESTION 35: Do you have any support from partners?
Yes
No
QUESTION 36: If yes, please elaborate.
………………………………………………………………………………………………………
………………………………………………………………………………………………………
QUESTION 37: Do you use fertilizers on your plot/block?
Yes
No
QUESTION 38: If yes, which ones do you use and how much do you apply?
Type of
fertilizer
Name
Quantity applied
per year (Kgs)
Unit cost
Organic
Inorganic
QUESTION 39: If no, why? ........………………………………………………………………….
70
SECTION E: FARMERS’ WILLINGNESS TO PAY FOR IRRIGATION WATER
QUESTION 40: How do you rate rainfall in this area?
Reliable
Average
Unreliable
QUESTION 41: Do you think irrigation increases crop output compared to rain fed agriculture?
Yes
No
QUESTION 42: After the establishment of the scheme; operation and maintenance should be
handled by you (the farmers) to ensure steady supply of irrigation water. Therefore to
optimize long and short- term benefits from irrigation water, you and other farmer groups that
farm at the scheme are expected to contribute money per group per plot per year. If you were
requested to pay Ugx 100000/=, would you be willing to pay it?
Yes
No
QUESTION 43: If yes; the interviewer keeps increasing the bid until the respondent says no.
Then the maximum willingness to pay is deduced as Ugx……...……… per group per plot/block
per year. If no, the interviewer keeps decreasing the bid until the respondent says yes. Then the
maximum willingness to pay is elicited as Ugx……...……… per group per plot/block per year.
QUESTION 44: If the willingness to pay response is zero; state why? ...........................................
………................................................................................................................................................
QUESTION 45: Do you think paying for operation and maintenance of irrigation water supply
should be the responsibility of the farmer groups?
Yes
No

71
QUESTION 46: If yes, what method would you be willing to use for paying for irrigation water
if asked?
Volumetric
Non-volumetric
*Non volumetric
Per plot size
Per crop
QUESTION 47: If no, why? .............................................................................................................
………………………………………………………………………………………………………
Thank you very much for your participation in this study.
Researcher: OGWAL Harold; 0772-004059; [email protected]
Research supervisor: Peter Mbabazi Mbabazize (PhD); 0780-298805;

72
7.1.3 Interview Guide for Scheme Management Committees
THE RIGHT OF USE AND ECONOMICS OF IRRIGATION WATER IN UGANDA: A COMPARATIVE ANALYSIS OF SMALL SCALE IRRIGATION SCHEMES IN
EASTERN, NORTHERN AND WESTERN UGANDA
DATE: ………………………
SCHEME NAME: …………………………………..
1. Who owns this irrigation system?
(Please tick only one)
Government
Individual
Group
Others (please specify)
2. How much did the irrigation system cost?
………………………………………………………………………………………………………
3. What was the main source of funding for establishing the irrigation system?
(Please tick only one)
Government
Personal Savings
Bank loan/Microfinance
Contribution of the Farmers‟ group
Others (please specify)
If the system is still to be cleared off the debts (loans and borrowings); Qn. 4, if not go to Qn. 7
4. What was the agreed duration of repayment? …………………………………………………...
………………………………………………………………………………………………………
5. Is the repayment schedule moving on smoothly?
Yes
No

73
6. If no, what are the factors affecting these repayments? …………………………………………
………………………………………………………………………………………………………
………………………………………………………………………………………………………
7. How did you decide the size of your irrigation system?
Technician/Engineer
We decided as a group
Others (please specify) …………………………………………………………………
8. How often does your irrigation system fail on average during the year?
………………………………………………………………………………………………………
9. Which parts of the irrigation system usually breaks down? (list all).
………………………………………………………………………………………………………
………………………………………………………………………………………………………
10. Who pays for the irrigation system repair when it breaks down? (tick all that apply).
Individual owner
Farmers group
Government
System is on warranty (please specify warranty duration in months)……………………...
Others (please specify) ……………………………………………………………………
11. Do you operate a scheme revolving fund?
Yes
No
12. What are the main challenges facing the scheme?
………………………………………………………………………………………………
………………………………………………………………………………………………
………………………………………………………………………………………………
………………………………………………………………………………………………
13. Do you organize farmers‟ trainings?
Yes
No

74
14. Is your Scheme affiliated to a financial institution e.g. SACCO?
Yes
No
15. Do you offer organized marketing e.g. farmer cooperatives?
Yes
No
16. Do you practice soil and water conservation practices around the scheme e.g. tree
planting, trenching, cover cropping etc.
Yes
No
17. If yes, list them.
………………………………………………………………………………………………
………………………………………………………………………………………………
………………………………………………………………………………………………
………………………………………………………………………………………………
18. How much water is used per season/year?
................................................................................................................................................
19. When did farming commence on the scheme?
………………………………………………………………...…………………………….
20. What is the lifespan of the scheme equipment? …………………………………...………
21. How much are the annual revenues from scheme farmers‟ remittances?
……………………………………………………………………………...…….…………
22. How much are the annual Expenses for the scheme?
................................................................................................................................................
23. How much is the annual budget for O&M?
.....................……………………………………………………...…………………………
24. How much is saved every year by the scheme towards replacement of the irrigation
system components? …………………………..………………………………………
75
7.1.4 Observation checklist
THE RIGHT OF USE AND ECONOMICS OF IRRIGATION WATER IN UGANDA: A COMPARATIVE ANALYSIS OF SMALL SCALE IRRIGATION SCHEMES IN
EASTERN, NORTHERN AND WESTERN UGANDA
DATE: ………………………
SCHEME NAME: …………………………………..
1. Source of irrigation water
2. Types of reservoir
3. Size of reservoir
4. Source of power for pumping into the reservoir and or irrigating
5. Method of irrigation
6. Most common crops
7. Nearby farms not part of the irrigation scheme
8. Soil and water conservation practices
9. Modes of transportation in the area
10. Ownership of a telephone
11. Farmers‟ achievements as a result of being part of the irrigation Scheme
12. Any business or infrastructural development that has sprouted as a result of the scheme

76
7.2 Appendix B: Photo plates
With MWE engineers at Nyamitanga SSIS in Mbarara district
With the secretary for Kyerero Model Farmers group in Nyamihanga SSIS, Rukiga district.
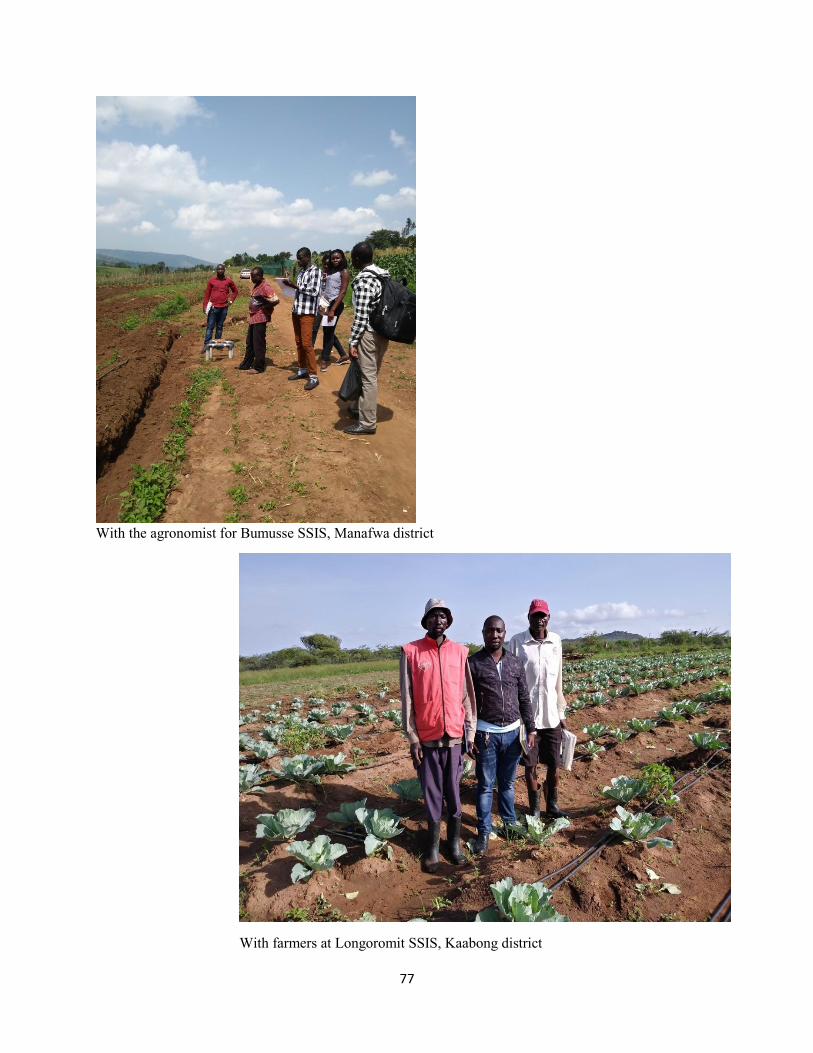
77
With the agronomist for Bumusse SSIS, Manafwa district
With farmers at Longoromit SSIS, Kaabong district

78
With the agronomist and farmers at Akado-Kulo SSIS, Abim District
With the farmers and agronomist at Puno SSIS, Abim district

79
With the chairperson farm management committee and sociologist in Natoto SSIS, Pallisa district

80
7.3 Appendix C: SSIS Data
Table 14: Detailed production at Andibo SSIS
S/n. Group name Enterprise Membership Sex Plot size
(acres)
Gross
returns/Shs. M F
1 Bed kurieko Egg plants 12 10 2 0.25 694,700/=
2 Dikiri ene tego Tomatoes 12 9 3 0.5 2,225,400/=
3 Dikiri kelo bero Okra
12
7
5
0.25
1,167,000/= Egg plants 0.25
Green pepper 0.25
4 Kumungu copire Okra 13 8 5 0.25 1,625,000/=
5 Obama Watermelon 12 9 3 0.5 6,391,000/=
6 Can cewuwa Watermelon 12 7 5 0.5 8,880,000/=
7 Bidongu Watermelon 12 6 6 0.5 902,000/=
Total 85 56 29 3.25 21,885,100/=
Table 15: Membership, sex distribution and gross return for selected SSISs Scheme Membership Sex ratio Gross return
Nyamuhanga 32 18 Female; 14 Male 4,200,000/=
Natoto 36 17 Female; 19 Male 22,707,100/=
Bumusse 43 6 Female; 37 Male 23,317,850/=
Puno 10 5 Female; 5 Male 15,609,200/= (3,903,400/=; 11,695,800/=)
Bukatabira 70 35 Female; 35 Male 27,810,500/=
AKISIM 41 31 Female; 10 Male 7,251,000 /= (6,097,000/=; 1,154,000/=)
OWAMERI 330 226 Female; 104 Male 12,547,000/=
AWACH 65 35 Female; 30 Male 11,539,600/=
ANDIBO 85 29 Female; 56 Male 21,885,100/=
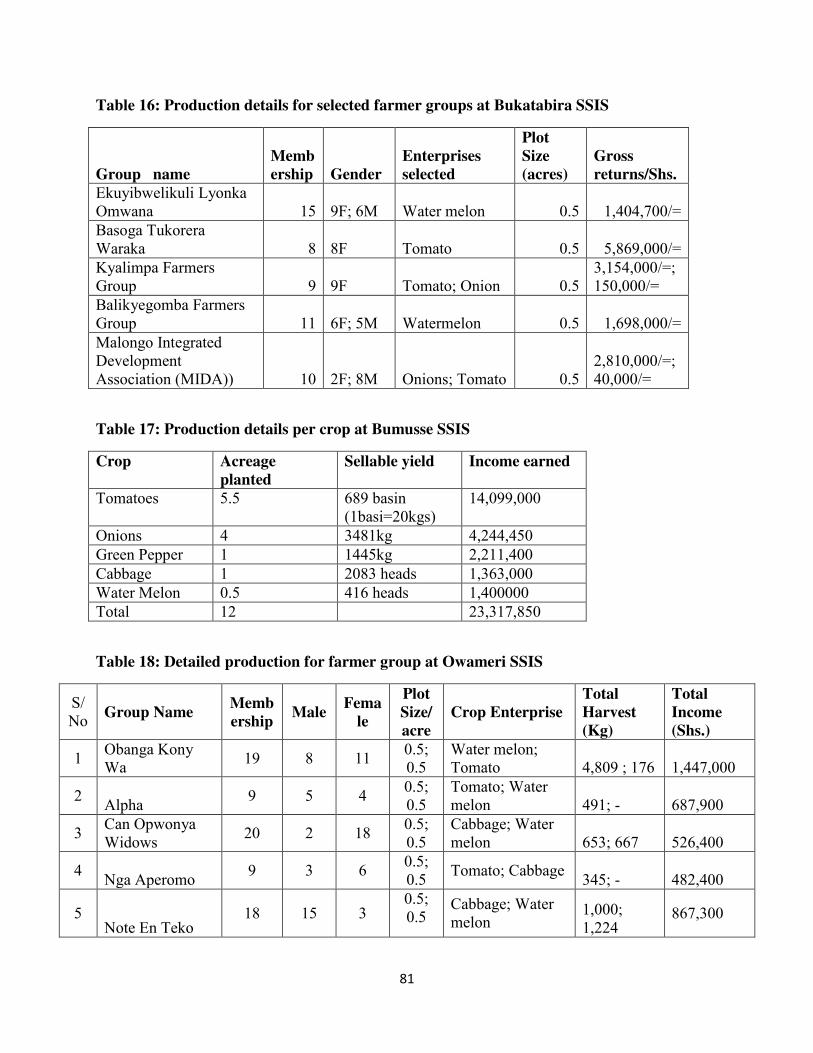
81
Table 16: Production details for selected farmer groups at Bukatabira SSIS
Table 17: Production details per crop at Bumusse SSIS
Crop Acreage planted
Sellable yield Income earned
Tomatoes 5.5 689 basin (1basi=20kgs)
14,099,000
Onions 4 3481kg 4,244,450 Green Pepper 1 1445kg 2,211,400 Cabbage 1 2083 heads 1,363,000 Water Melon 0.5 416 heads 1,400000 Total 12 23,317,850
Table 18: Detailed production for farmer group at Owameri SSIS
S/No
Group Name Membership
Male Fema
le
Plot Size/ acre
Crop Enterprise Total Harvest (Kg)
Total Income (Shs.)
1 Obanga Kony Wa
19 8 11 0.5; 0.5
Water melon; Tomato
4,809 ; 176
1,447,000
2 Alpha
9 5 4 0.5; 0.5
Tomato; Water melon
491; -
687,900
3 Can Opwonya Widows
20 2 18 0.5; 0.5
Cabbage; Water melon 653; 667
526,400
4 Nga Aperomo
9 3 6 0.5; 0.5
Tomato; Cabbage 345; -
482,400
5 Note En Teko
18 15 3 0.5; 0.5
Cabbage; Water melon
1,000; 1,224
867,300
Group name Membership Gender
Enterprises selected
Plot Size (acres)
Gross returns/Shs.
Ekuyibwelikuli Lyonka Omwana 15 9F; 6M Water melon 0.5 1,404,700/= Basoga Tukorera Waraka 8 8F Tomato 0.5 5,869,000/= Kyalimpa Farmers Group 9 9F Tomato; Onion 0.5
3,154,000/=; 150,000/=
Balikyegomba Farmers Group 11 6F; 5M Watermelon 0.5 1,698,000/= Malongo Integrated Development Association (MIDA)) 10 2F; 8M Onions; Tomato 0.5
2,810,000/=; 40,000/=

82
6 Par Pidiki
15 4 11 0.5; 0.5
Water Melon; Green Pepper
3,908; 587
3,228,600
7 Bed Igen Angata B
16 4 12 0.5; 0.5
Tomato; Green Pepper
54; 43
225,000
8 Ongom Citrus 12 3 9 0.5; 0.5
Water melon; Green Pepper
923; 100
627,000
9 Kica Arwot
13 3 10 0.5; 0.5
Water melon; Cabbage
658; -
197,500
10 Obanga Mito Mar
20 5 15 0.5; 0.5
Tomato; Green Pepper
304; 68
664,000
11 Ocan Oyele
19 4 15 0.5; 0.5
Cabbage; Water melon
718; 629
610,900
12 Acan pe Kun
18 5 13 0.5; 0.5
Water melon; Onions
1,221; 20
518,500
13 Obanga Amio Youth Group
14 7 7 0.5; 0.5
Water melon; Tomato
300; 25
157,500
14 Can Omia Aryek 16 5 11 0.5; 0.5
Water melon; Cabbage
545; -
218,000
15 Note En Mar 15 5 10 0.5; 0.5
Water melon; Cabbage
1,618; -
647,000
16 Bed Igen Teiconga
18 3 15 0.5; 0.5
Cabbage; Water melon
443; 683
539,000
17 Mar Obanga 18 4 14 0.5; 0.5
Water melon, Green Pepper
-; 30
105,000
18 Orib Tam 13 4 9 0.5; 0.5 Tomato; Cabbage
-; 1,014
608,500
19 Orib Can 13 3 10 0.5; 0.5
Cabbage; Tomato -; 13
20,000
20 Pe Ibedabeda 17 3 14 0.5; 0.5
Cabbage; Tomato 165; -
99,000
21 Rwot Amio 18 9 9 0.5
Water melon 178
71,000
TOTAL 330 104 226 20 12,547,500

83
Table 19: Production costs incurred in producing 1 acre of each crop enterprise and 0.5 acre of watermelon at Bumusse SSIS
PARTICULARS Tomatoes Onions Cabbage Green pepper Watermelon
Quantity
Actual cost Quantity
Actual cost Quantity
Actual cost Quantity
Actual cost Quantity
Actual cost
Seed 50g 600000 1.25kg 180000 100g 100000 50g 50000 250g 160000
Fungicides 0 0
0 0 0 0 0 0 0 Cobox/ nordox 0 2kg 20000 0 0 0 0 2 kg 20000 Mistress 6kg 360000 0 0 3kg 180000 3kg 18000 1 60000 Pearl 0
1l 65000 0 0 1l 65000 1l 65000
Kingmill 4kg 160000 0
2kg 80000 6kg 240000 0 0 easy grow 0 0 0 0 0 0 0 0 1kg 25000
Pesticides Dudu Accelamectine 2l 90000 1 45000 1l 45000 2l 45000 1l 45000 Cypermthrine 2l 100000 1 50000 1l 50000 1l 50000 0 0 Dimenthoate 1l 40000 0 0 0 0 0 0 0 0 Lava 0.5 25000 0 0 0 0 0.5 25000
Fertilizers Farm yard Manure 2 trips 250000 2 trips 250000 2 trips 250000 2.5 trips 300000 1trip 15000 NPK/ CAN 50kg 125000 50kg 85000 50kg 125000 50kg 125000 25kg 60000 Land preparation and nursery management I acre 150000 I acre 150000 I acre 150000 I acre 150000
0.5 acres 100000
Transplanting and weeding weeding 1acre 150000 1acre 250000 1acre 150000 1acre 150000
0.5 acres 60000
2050000 1281000 1130000 1218000 610000

84
8 ANNEX
8.1 Research and Internship offer letter

85
8.2 Thesis Budget Report
Table 20: Research budget expenditure
S/n. Item Description Total Amount(USD) 1 Flight Ticket and local Transportation 896 2 Field transportation 850 3 Enumerators (research Assistants) 600 4 Internet Data and Airtime 358 5 Printing 296 Total 3000