Massachusetts Technical Reference Manual - National Grid · This Massachusetts Technical Reference...
285
Massachusetts Technical Reference Manual for Estimating Savings from Energy Efficiency Measures 2010 Program Year – Report Version August 2011
Transcript of Massachusetts Technical Reference Manual - National Grid · This Massachusetts Technical Reference...
Massachusetts
Technical Reference Manual for Estimating Savings from Energy Efficiency Measures
2010 Program Year – Report Version
August 2011

Massachusetts Technical Reference Manual
Massachusetts Technical Reference Manual
August 2011 3
Table of Contents
TABLE OF CONTENTS ..................................................................................................................................... 3
INTRODUCTION................................................................................................................................................ 6
MEASURE CHARACTERIZATION STRUCTURE ......................................................................................... 7
IMPACT FACTORS FOR CALCULATING ADJUSTED GROSS AND NET SAVINGS ............................. 10
TYPES OF IMPACT FACTORS .............................................................................................................................. 10 STANDARD NET–TO–GROSS FORMULAS ............................................................................................................ 12
RESIDENTIAL ELECTRIC EFFICIENCY MEASURES............................................................................... 15
LIGHTING – CFL BULBS (MARKDOWN) ............................................................................................................. 16 LIGHTING – CFL BULBS ................................................................................................................................... 18 LIGHTING – CFL INDOOR FIXTURES .................................................................................................................. 21 LIGHTING – OUTDOOR FIXTURES ...................................................................................................................... 23 LIGHTING – TORCHIERES .................................................................................................................................. 25 LIGHTING – LIGHT–EMITTING DIODE LIGHTS .................................................................................................... 27 PROCESS – COMPUTER MONITORS..................................................................................................................... 29 PROCESS – DESKTOP COMPUTERS ..................................................................................................................... 31 PROCESS – ROOM AIR CLEANER ....................................................................................................................... 33 PROCESS – SMART STRIPS ................................................................................................................................. 35 PROCESS – TELEVISIONS ................................................................................................................................... 37 REFRIGERATION – REFRIGERATORS (LOST OPPORTUNITY) ................................................................................. 39 REFRIGERATION – REFRIGERATORS (RETROFIT) ................................................................................................ 41 REFRIGERATION – FREEZERS (LOST OPPORTUNITY) ........................................................................................... 44 REFRIGERATION – FREEZERS (RETROFIT) .......................................................................................................... 46 REFRIGERATION – REFRIGERATOR/FREEZER RECYCLING ................................................................................... 48 REFRIGERATION – APPLIANCE REMOVAL .......................................................................................................... 50 REFRIGERATION – BASIC EDUCATIONAL MEASURES .......................................................................................... 52 HVAC – CENTRAL AIR CONDITIONING ............................................................................................................. 54 HVAC – AIR SOURCE HEAT PUMP .................................................................................................................... 56 HVAC – DUCTLESS MINI SPLIT HEAT PUMP ..................................................................................................... 58 HVAC – CENTRAL AC QUALITY INSTALLATION VERIFICATION (QIV)............................................................... 60 HVAC – HEAT PUMP QUALITY INSTALLATION VERIFICATION (QIV) ................................................................. 62 HVAC – CENTRAL AC DIGITAL CHECK-UP/TUNE–UP ....................................................................................... 64 HVAC – HEAT PUMP DIGITAL CHECK-UP/TUNE-UP........................................................................................... 66 HVAC – DUCT SEALING................................................................................................................................... 68 HVAC – DOWN SIZE ½ TON ............................................................................................................................. 70 HVAC – RIGHT SIZING ..................................................................................................................................... 72 HVAC – EARLY REPLACEMENT OF CENTRAL AC OR HEAT PUMP UNIT.............................................................. 74 HVAC – QUALITY INSTALLATION WITH DUCT SEALING .................................................................................... 76 HVAC – WARM AIR FURNACE ELECTRONICALLY COMMUTATED MOTOR (ECM) .............................................. 78 HVAC – BRUSHLESS FURNACE FAN MOTOR ..................................................................................................... 80 HVAC – ROOM AC (LOST OPPORTUNITY) ........................................................................................................ 82 HVAC – WINDOW AC REPLACEMENT (RETROFIT) ............................................................................................ 84 HVAC – ELECTRIC WEATHERIZATION .............................................................................................................. 86 HVAC – OIL WEATHERIZATION ....................................................................................................................... 88 HVAC – HEATING SYSTEM REPLACEMENT (OIL) .............................................................................................. 90 HVAC/HOT WATER – ENERGY STAR® HOMES HEATING, COOLING, AND DHW MEASURES........................... 92 HOT WATER – DOMESTIC HOT WATER MEASURES (ELECTRIC).......................................................................... 94 HOT WATER – DOMESTIC HOT WATER MEASURES (OIL AND GAS) .................................................................... 96 HOT WATER – DISHWASHERS ........................................................................................................................... 98
Massachusetts Technical Reference Manual
August 2011 4
HOT WATER – POOL PUMP.............................................................................................................................. 100 HOT WATER – WATERBED MATTRESS REPLACEMENT ..................................................................................... 102 MASSSAVE – VENDOR MEASURES................................................................................................................. 104 MULTIFAMILY – INSULATION (WALLS, ROOF, FLOOR) ..................................................................................... 107 MULTIFAMILY – DHW (SHOWERHEADS AND AERATORS) ................................................................................ 109 MULTIFAMILY – DHW (TANK AND PIPE WRAP) .............................................................................................. 111 MULTIFAMILY – THERMOSTATS ...................................................................................................................... 113 MULTIFAMILY – HEAT PUMP TUNE-UP ........................................................................................................... 115 MULTIFAMILY – AIR SEALING......................................................................................................................... 117 MULTIFAMILY – REFRIGERATORS AND FREEZERS ............................................................................................ 119 MULTIFAMILY – FIXTURES AND CFLS ............................................................................................................ 121 BEHAVIOR – OPOWER ELECTRIC .................................................................................................................. 123
COMMERCIAL AND INDUSTRIAL ELECTRIC EFFICIENCY MEASURES.......................................... 125
LIGHTING – ADVANCED LIGHTING DESIGN (PERFORMANCE LIGHTING) ............................................................ 126 LIGHTING – LIGHTING SYSTEMS...................................................................................................................... 129 LIGHTING – LIGHTING CONTROLS ................................................................................................................... 133 LIGHTING – FREEZER/COOLER LEDS .............................................................................................................. 136 HVAC – SINGLE-PACKAGE AND SPLIT SYSTEM UNITARY AIR CONDITIONERS.................................................. 138 HVAC – SINGLE PACKAGE OR SPLIT SYSTEM HEAT PUMP SYSTEMS ................................................................ 141 HVAC – DUAL ENTHALPY ECONOMIZER CONTROLS (DEEC).......................................................................... 144 HVAC – DEMAND CONTROL VENTILATION (DCV) ......................................................................................... 146 HVAC – ECM FAN MOTORS .......................................................................................................................... 148 HVAC – ENERGY MANAGEMENT SYSTEM ...................................................................................................... 150 HVAC – HIGH EFFICIENCY CHILLER............................................................................................................... 152 HVAC – HOTEL OCCUPANCY SENSORS........................................................................................................... 155 HVAC – PROGRAMMABLE THERMOSTATS ...................................................................................................... 157 REFRIGERATION – DOOR HEATER CONTROLS .................................................................................................. 159 REFRIGERATION – NOVELTY COOLER SHUTOFF ............................................................................................... 161 REFRIGERATION – ECM EVAPORATOR FAN MOTORS FOR WALK–IN COOLERS AND FREEZERS .......................... 163 REFRIGERATION – CASE MOTOR REPLACEMENT .............................................................................................. 165 REFRIGERATION – EVAPORATOR FAN CONTROLS ............................................................................................ 167 REFRIGERATION – VENDING MISERS ............................................................................................................... 169 COMPRESSED AIR – HIGH EFFICIENCY AIR COMPRESSORS ............................................................................... 171 COMPRESSED AIR – REFRIGERATED AIR DRYERS ............................................................................................ 173 MOTORS/DRIVES – PREMIUM EFFICIENCY MOTORS ......................................................................................... 175 MOTORS/DRIVES – VARIABLE FREQUENCY DRIVES ......................................................................................... 177 CUSTOM MEASURES ....................................................................................................................................... 180
RESIDENTIAL NATURAL GAS EFFICIENCY MEASURES ..................................................................... 183
HVAC – BOILER (FORCED HOT WATER)......................................................................................................... 184 HVAC – BOILER RESET CONTROLS (RETROFIT ONLY) ..................................................................................... 186 HVAC – EARLY REPLACEMENT BOILER.......................................................................................................... 188 HVAC – PROGRAMMABLE THERMOSTATS ...................................................................................................... 190 HVAC – FURNACE (FORCED HOT AIR) WITH ECM.......................................................................................... 192 HVAC – HEAT RECOVERY VENTILATOR ......................................................................................................... 194 HVAC – STAND ALONE STORAGE WATER HEATER ......................................................................................... 196 HVAC – GAS HEATING SYSTEM REPLACEMENT (LOW INCOME) ...................................................................... 198 HVAC – GAS WEATHERIZATION (LOW INCOME) ............................................................................................. 200 HVAC – GAS INSULATION.............................................................................................................................. 202 HVAC – GAS AIR SEALING ............................................................................................................................ 204 HVAC/HOT WATER – INTEGRATED WATER HEATER/CONDENSING BOILER ..................................................... 206 HVAC/HOT WATER – INTEGRATED WATER HEATER/NON-CONDENSING BOILER............................................. 208 HOT WATER – CONDENSING WATER HEATER.................................................................................................. 210 HOT WATER – INDIRECT WATER HEATER ....................................................................................................... 212 HOT WATER – TANKLESS WATER HEATERS .................................................................................................... 214
Massachusetts Technical Reference Manual
August 2011 5
BEHAVIOR – OPOWER GAS ........................................................................................................................... 216
COMMERCIAL AND INDUSTRIAL NATURAL GAS EFFICIENCY MEASURES.................................. 219
HVAC – PROGRAMMABLE THERMOSTAT ........................................................................................................ 220 HVAC – BOILER RESET CONTROLS (RETROFIT ONLY) ..................................................................................... 222 HVAC – CONDENSING UNIT HEATER.............................................................................................................. 224 HVAC – GAS-FIRED LOW INTENSITY INFRARED HEATING............................................................................... 226 HVAC – HIGH EFFICIENCY NATURAL GAS BOILER ......................................................................................... 228 HVAC – HIGH EFFICIENCY NATURAL GAS WARM AIR FURNACE .................................................................... 231 HVAC/HOT WATER – COMBINED HIGH EFFICIENCY BOILER AND WATER HEATER .......................................... 234 HOT WATER – CONDENSING STAND-ALONE WATER HEATER .......................................................................... 236 HOT WATER – PRE-RINSE SPRAY VALVE ........................................................................................................ 238 HOT WATER – REPAIR/REPLACE MALFUNCTIONING STEAM TRAP.................................................................... 240 HOT WATER – LOW FLOW SHOWER HEADS ..................................................................................................... 242 HOT WATER – FAUCET AERATOR ................................................................................................................... 244 HOT WATER – HIGH EFFICIENCY INDIRECT WATER HEATER ............................................................................ 246 HOT WATER – HIGH EFFICIENCY TANKLESS WATER HEATER .......................................................................... 248 HOT WATER – HIGH EFFICIENCY FREE STANDING WATER HEATER.................................................................. 250 FOOD SERVICE – COMMERCIAL GAS-FIRED OVEN ........................................................................................... 252 FOOD SERVICE – COMMERCIAL GAS-FIRED GRIDDLE ...................................................................................... 254 FOOD SERVICE – COMMERCIAL FRYER ............................................................................................................ 256 FOOD SERVICE – COMMERCIAL GAS-FIRED STEAMER...................................................................................... 258 CUSTOM MEASURES ....................................................................................................................................... 260
APPENDICES .................................................................................................................................................. 263
APPENDIX A: COMMON LOOKUP TABLES ........................................................................................................ 264 APPENDIX B: NET TO GROSS IMPACT FACTORS................................................................................................ 271 APPENDIX C: ACRONYMS ............................................................................................................................... 279 APPENDIX D: GLOSSARY ................................................................................................................................ 280
Massachusetts Technical Reference Manual
August 2011 6
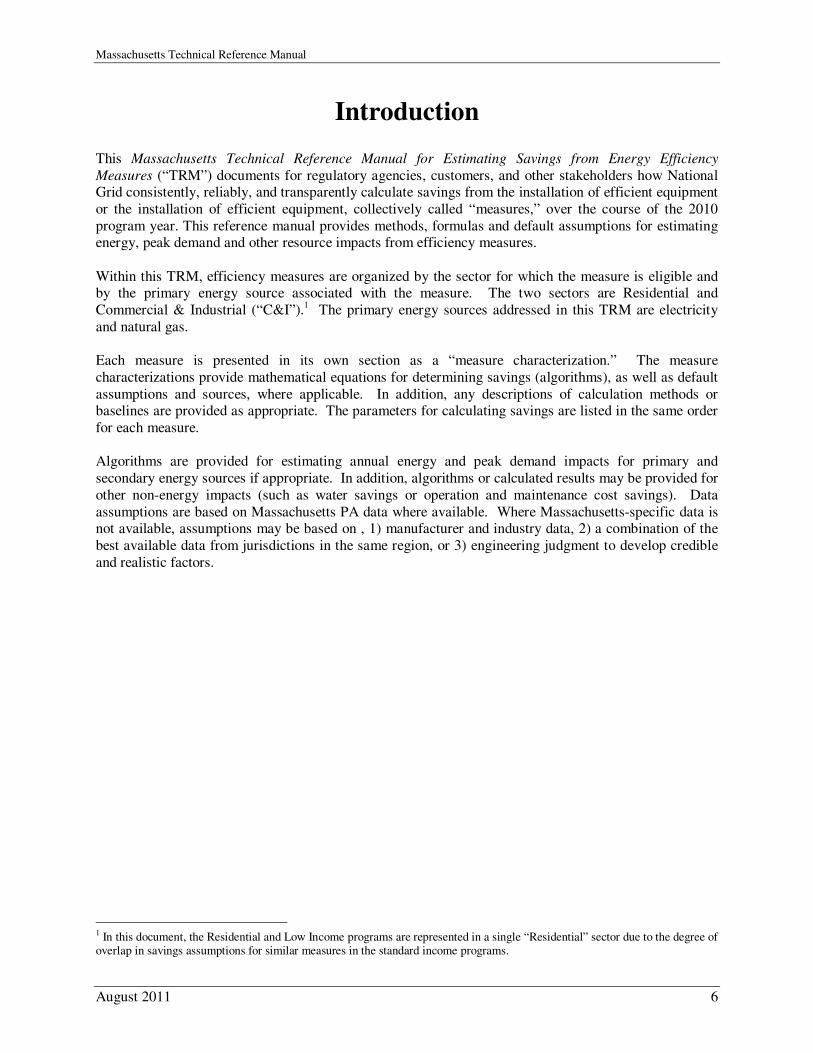
Introduction
This Massachusetts Technical Reference Manual for Estimating Savings from Energy Efficiency
Measures (“TRM”) documents for regulatory agencies, customers, and other stakeholders how National Grid consistently, reliably, and transparently calculate savings from the installation of efficient equipment
or the installation of efficient equipment, collectively called “measures,” over the course of the 2010
program year. This reference manual provides methods, formulas and default assumptions for estimating energy, peak demand and other resource impacts from efficiency measures.
Within this TRM, efficiency measures are organized by the sector for which the measure is eligible and by the primary energy source associated with the measure. The two sectors are Residential and
Commercial & Industrial (“C&I”).1 The primary energy sources addressed in this TRM are electricity
and natural gas.
Each measure is presented in its own section as a “measure characterization.” The measure
characterizations provide mathematical equations for determining savings (algorithms), as well as default
assumptions and sources, where applicable. In addition, any descriptions of calculation methods or baselines are provided as appropriate. The parameters for calculating savings are listed in the same order
for each measure.
Algorithms are provided for estimating annual energy and peak demand impacts for primary and
secondary energy sources if appropriate. In addition, algorithms or calculated results may be provided for
other non-energy impacts (such as water savings or operation and maintenance cost savings). Data
assumptions are based on Massachusetts PA data where available. Where Massachusetts-specific data is not available, assumptions may be based on , 1) manufacturer and industry data, 2) a combination of the
best available data from jurisdictions in the same region, or 3) engineering judgment to develop credible
and realistic factors.
1 In this document, the Residential and Low Income programs are represented in a single “Residential” sector due to the degree of overlap in savings assumptions for similar measures in the standard income programs.
Massachusetts Technical Reference Manual
August 2011 7
Measure Characterization Structure
This section describes the common entries or inputs that make up each measure characterization. A
formatted template follows the descriptions of each section of the measure characterization.
Measure Name
A single device or behavior may be analyzed as a range of measures depending on a variety of factors
which largely translate to where it is and who is using it. Such factors include hours of use, location, and
baseline (equipment replaced or behavior modified). For example, the same screw-in compact
fluorescent lamp will produce different savings if installed in an emergency room waiting area than if installed in a bedside lamp.
Measure Overview
This section will include a plain text description of the efficient and baseline technology and the benefit(s)
of its installation, as well as subfields of supporting information including:
Description: <Description of the energy efficiency measure>
Primary Energy Impact: <Electric or Natural Gas>
Secondary Energy Impact: <e.g., Natural Gas, Propane, Oil, Electric, None> Non-Energy Impact: <e.g., Water Resource, O&M, Non-Resource, None>
Sector: <Residential, Low Income or Commercial and Industrial>
Market: <Lost Opportunity, Retrofit and/or Products and Services> End-Use: <Per PARIS database definition – see list below>
Program: <Per PA definition>
The PARIS database includes the following possible End-Uses:
Lighting Compressed Air Demand Response
HVAC Behavior Photovoltaic Panels Motors /Drives Insulation Process
Refrigeration Combined Heat and Power
Hot Water Solar Hot Water
Notes
This is an optional section for additional notes regarding anticipated changes going forward. For example, this section would not if there were upcoming statewide evaluations affecting the measure, or
any plans for development of statewide tool for calculating measure savings.
Algorithms for Calculating Primary Energy Impacts
This section will describe the method for calculating the primary energy savings in appropriate units, i.e.,
kWh for electric energy savings or MMBtu for natural gas energy savings. The savings algorithm will be provided in a form similar to the following:
HourskWkWh ×∆=∆
Massachusetts Technical Reference Manual
August 2011 8
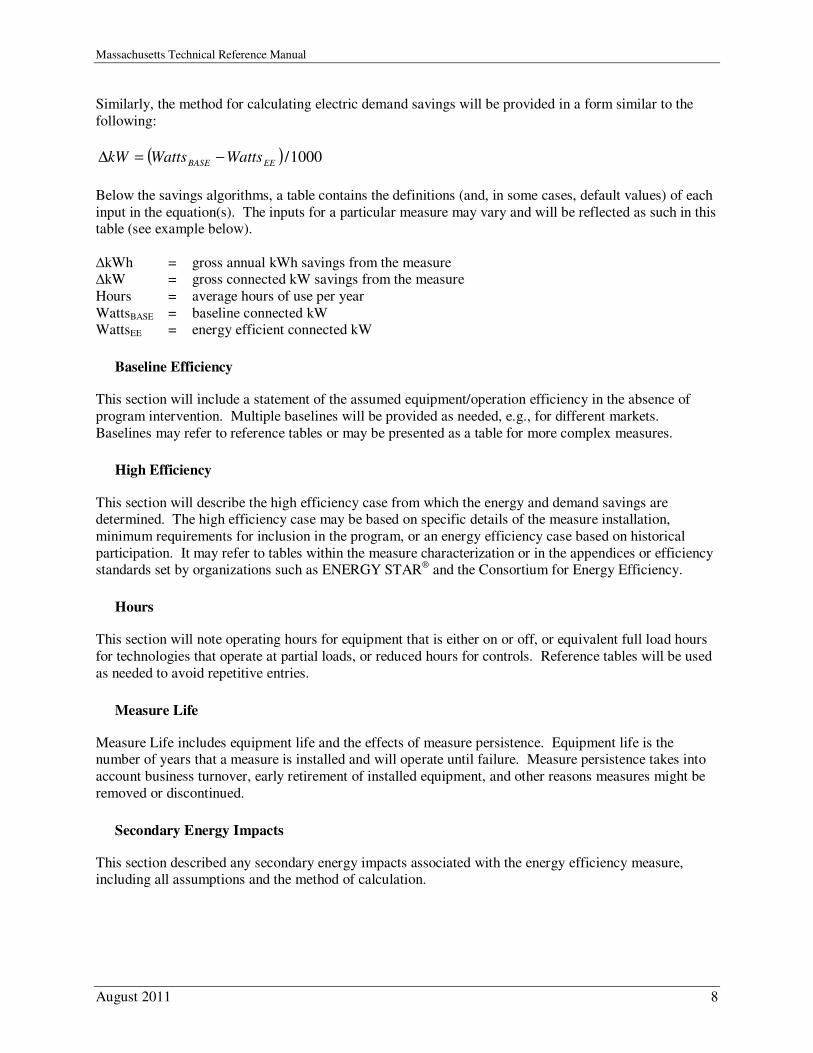
Similarly, the method for calculating electric demand savings will be provided in a form similar to the
following:
( ) 1000/EEBASE WattsWattskW −=∆
Below the savings algorithms, a table contains the definitions (and, in some cases, default values) of each
input in the equation(s). The inputs for a particular measure may vary and will be reflected as such in this table (see example below).
∆kWh = gross annual kWh savings from the measure ∆kW = gross connected kW savings from the measure
Hours = average hours of use per year
WattsBASE = baseline connected kW WattsEE = energy efficient connected kW
Baseline Efficiency
This section will include a statement of the assumed equipment/operation efficiency in the absence of
program intervention. Multiple baselines will be provided as needed, e.g., for different markets.
Baselines may refer to reference tables or may be presented as a table for more complex measures.
High Efficiency
This section will describe the high efficiency case from which the energy and demand savings are determined. The high efficiency case may be based on specific details of the measure installation,
minimum requirements for inclusion in the program, or an energy efficiency case based on historical
participation. It may refer to tables within the measure characterization or in the appendices or efficiency standards set by organizations such as ENERGY STAR
® and the Consortium for Energy Efficiency.
Hours
This section will note operating hours for equipment that is either on or off, or equivalent full load hours
for technologies that operate at partial loads, or reduced hours for controls. Reference tables will be used
as needed to avoid repetitive entries.
Measure Life
Measure Life includes equipment life and the effects of measure persistence. Equipment life is the number of years that a measure is installed and will operate until failure. Measure persistence takes into
account business turnover, early retirement of installed equipment, and other reasons measures might be
removed or discontinued.
Secondary Energy Impacts
This section described any secondary energy impacts associated with the energy efficiency measure, including all assumptions and the method of calculation.
Massachusetts Technical Reference Manual
August 2011 9
Non-Energy Impacts
This section describes any non-energy impacts associated with the energy efficiency measure, including all assumptions and the method of calculation.
Impact Factors for Calculating Adjusted Gross Savings
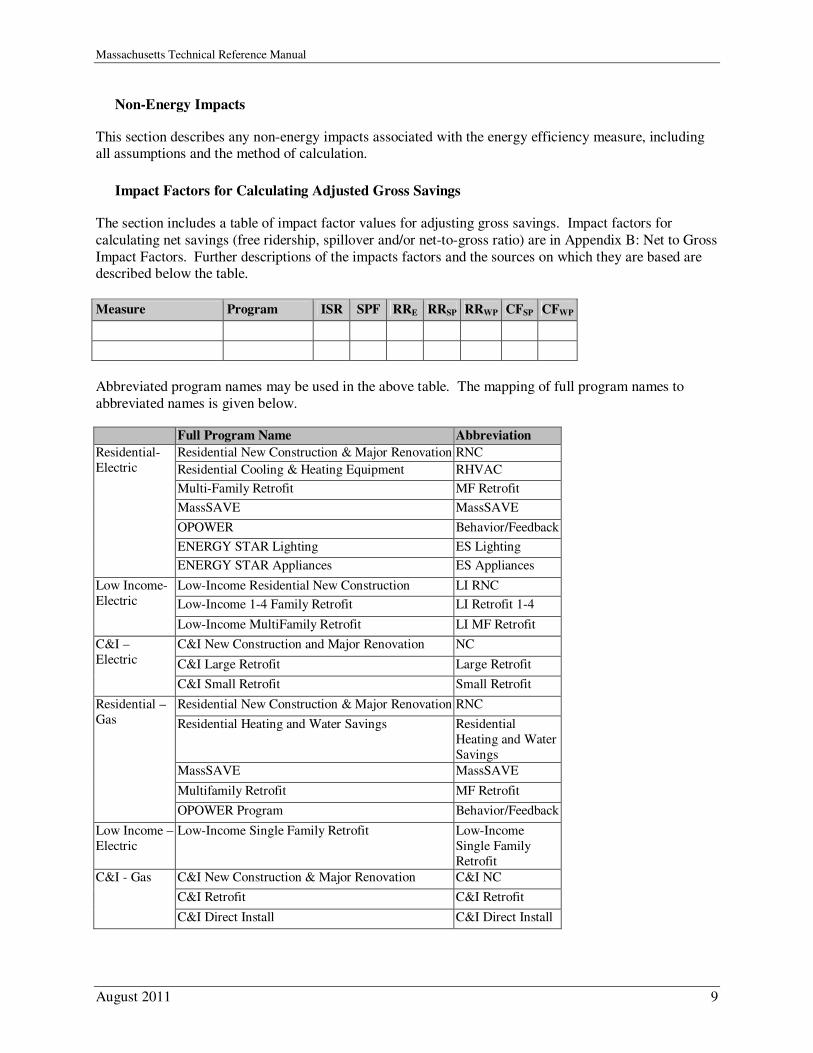
The section includes a table of impact factor values for adjusting gross savings. Impact factors for
calculating net savings (free ridership, spillover and/or net-to-gross ratio) are in Appendix B: Net to Gross
Impact Factors. Further descriptions of the impacts factors and the sources on which they are based are described below the table.
Measure Program ISR SPF RRE RRSP RRWP CFSP CFWP
Abbreviated program names may be used in the above table. The mapping of full program names to
abbreviated names is given below.
Full Program Name Abbreviation
Residential New Construction & Major Renovation RNC
Residential Cooling & Heating Equipment RHVAC
Multi-Family Retrofit MF Retrofit
MassSAVE MassSAVE
OPOWER Behavior/Feedback
ENERGY STAR Lighting ES Lighting
Residential-
Electric
ENERGY STAR Appliances ES Appliances
Low-Income Residential New Construction LI RNC
Low-Income 1-4 Family Retrofit LI Retrofit 1-4
Low Income-
Electric
Low-Income MultiFamily Retrofit LI MF Retrofit
C&I New Construction and Major Renovation NC
C&I Large Retrofit Large Retrofit
C&I –
Electric
C&I Small Retrofit Small Retrofit
Residential New Construction & Major Renovation RNC
Residential Heating and Water Savings Residential
Heating and Water
Savings
MassSAVE MassSAVE
Multifamily Retrofit MF Retrofit
Residential –
Gas
OPOWER Program Behavior/Feedback
Low Income –
Electric
Low-Income Single Family Retrofit Low-Income
Single Family
Retrofit
C&I New Construction & Major Renovation C&I NC
C&I Retrofit C&I Retrofit
C&I - Gas
C&I Direct Install C&I Direct Install
Massachusetts Technical Reference Manual
August 2011 10
Impact Factors for Calculating Adjusted Gross and
Net Savings
National Grid uses the algorithms in the Measure Characterization sections to calculate the gross savings for energy efficiency measures. Impact factors are then applied to make various adjustments to the gross
savings estimate to account for the performance of individual measures or energy efficiency programs as
a whole in achieving energy reductions as assessed through evaluation studies. Impacts factors address both the technical performance of energy efficiency measures and programs, accounting for the measured
energy and demand reductions realized compared to the gross estimated reductions, as well as the
programs’ effect on the market for energy efficient products and services.
This section describes the types of impact factors used to make such adjustments, and how those impacts
are applies to gross savings estimates. Definitions of the impact factors and other terms are also provided
in the Glossary (see Appendix D: Glossary).
Types of Impact Factors
The impact factors used to adjust savings fall into one of two categories:
Impact factors used to adjust gross savings:
• In-Service Rate (“ISR”)
• Savings Persistence Factor (“SPF”)
• Realization Rate (“RR”)
• Summer and Winter Peak Demand Coincidence Factors (“CF”).
Impact factors used to calculate net savings:
• Free-Ridership (“FR”) and Spillover (“SO”) Rates
• Net-to-Gross Ratios (“NTG”).
The in-service rate is the actual portion of efficient units that are installed. For example, efficient lamps may have an in-service rate less than 1.00 since some lamps are purchased as replacement units and are
not immediately installed. The ISR is 1.00 for most measures.
The savings persistence factor is the portion of first-year energy or demand savings expected to persist over the life of the energy efficiency measure. The SPF is developed by conducting surveys of installed
equipment several years after installation to determine the actual operational capability of the equipment.
The SPF is 1.00 for most measures.
In contrast to savings persistence, measure persistence takes into account business turnover, early
retirement of installed equipment, and other reasons the installed equipment might be removed or
discontinued. Measure persistence is generally incorporated as part of the measure life, and therefore is not included as a separate impact factor.
The realization rate is used to adjust the gross savings (as calculated by the savings algorithms) based on impact evaluation studies. The realization rate is equal to the ratio of measure savings developed from an
Massachusetts Technical Reference Manual
August 2011 11
impact evaluation to the estimated measure savings derived from the savings algorithms. The realization
rate does not include the effects of any other impact factors. Depending on the impact evaluation study, there may be separate realization rates for energy (kWh), peak demand (kW), or fossil fuel energy
(MMBtu).
A coincidence factor adjusts the connected load kW savings derived from the savings algorithm. A coincidence factor represents the fraction of the connected load reduction expected to occur at the same
time as a particular system peak period. The coincidence factor includes both coincidence and diversity
factors combined into one number, thus there is no need for a separate diversity factor in this TRM.
Coincidence factors are provided for the on-peak periods as defined by the ISO New England for the
Forward Capacity Market (“FCM”), and are calculated consistently with the FCM methodology. Electric demand reduction during the ISO New England peak periods is defined as follows:
� Summer On-Peak: average demand reduction from 1:00-5:00 PM on non-holiday weekdays in June
July, and August � Winter On-Peak: average demand reduction from 5:00-7:00 PM on non-holiday weekdays in December
and January
A free-rider is a customer who participates in an energy efficiency program (and gets an incentive) but
who would have installed some or all of the same measure(s) on their own, with no change in timing of
the installation, if the program had not been available. The free-ridership rate is the percentage of savings attributable to participants who would have installed the measures in the absence of program
intervention.
The spillover rate is the percentage of savings attributable to a measure or program, but additional to the gross (tracked) savings of a program. Spillover includes the effects of 1) participants in the program who
install additional energy efficient measures outside of the program as a result of participating in the
program, and 2) non-participants who install or influence the installation of energy efficient measures as a result of being aware of the program. These two components are the participant spillover (SOP) and
non-participant spillover (SONP).
The net savings value is the final value of savings that is attributable to a measure or program. Net savings differs from gross savings because it includes the effects of the free-ridership and/or spillover
rates.
The net-to-gross ratio is the ratio of net savings to the gross savings adjusted by any impact factors (i.e.,
the “adjusted” gross savings). Depending on the evaluation study, the NTG ratio may be determined from
the free-ridership and spillover rates, if available, or it may be a distinct value with no separate specification of FR and SO values.
Massachusetts Technical Reference Manual
August 2011 12
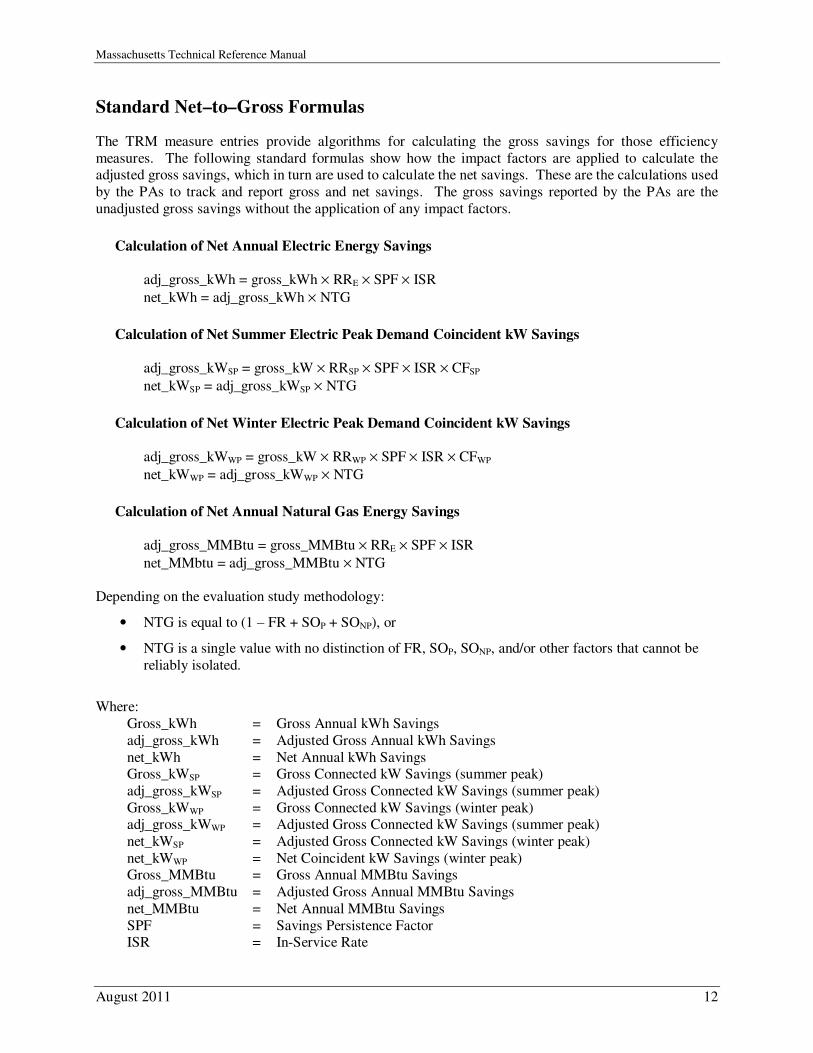
Standard Net–to–Gross Formulas
The TRM measure entries provide algorithms for calculating the gross savings for those efficiency
measures. The following standard formulas show how the impact factors are applied to calculate the adjusted gross savings, which in turn are used to calculate the net savings. These are the calculations used
by the PAs to track and report gross and net savings. The gross savings reported by the PAs are the
unadjusted gross savings without the application of any impact factors.
Calculation of Net Annual Electric Energy Savings
adj_gross_kWh = gross_kWh × RRE × SPF × ISR
net_kWh = adj_gross_kWh × NTG
Calculation of Net Summer Electric Peak Demand Coincident kW Savings
adj_gross_kWSP = gross_kW × RRSP × SPF × ISR × CFSP
net_kWSP = adj_gross_kWSP × NTG
Calculation of Net Winter Electric Peak Demand Coincident kW Savings
adj_gross_kWWP = gross_kW × RRWP × SPF × ISR × CFWP
net_kWWP = adj_gross_kWWP × NTG
Calculation of Net Annual Natural Gas Energy Savings
adj_gross_MMBtu = gross_MMBtu × RRE × SPF × ISR
net_MMbtu = adj_gross_MMBtu × NTG
Depending on the evaluation study methodology:
• NTG is equal to (1 – FR + SOP + SONP), or
• NTG is a single value with no distinction of FR, SOP, SONP, and/or other factors that cannot be
reliably isolated.
Where:
Gross_kWh = Gross Annual kWh Savings
adj_gross_kWh = Adjusted Gross Annual kWh Savings
net_kWh = Net Annual kWh Savings Gross_kWSP = Gross Connected kW Savings (summer peak)
adj_gross_kWSP = Adjusted Gross Connected kW Savings (summer peak)
Gross_kWWP = Gross Connected kW Savings (winter peak) adj_gross_kWWP = Adjusted Gross Connected kW Savings (summer peak)
net_kWSP = Adjusted Gross Connected kW Savings (winter peak)
net_kWWP = Net Coincident kW Savings (winter peak) Gross_MMBtu = Gross Annual MMBtu Savings
adj_gross_MMBtu = Adjusted Gross Annual MMBtu Savings
net_MMBtu = Net Annual MMBtu Savings
SPF = Savings Persistence Factor ISR = In-Service Rate
Massachusetts Technical Reference Manual
August 2011 13
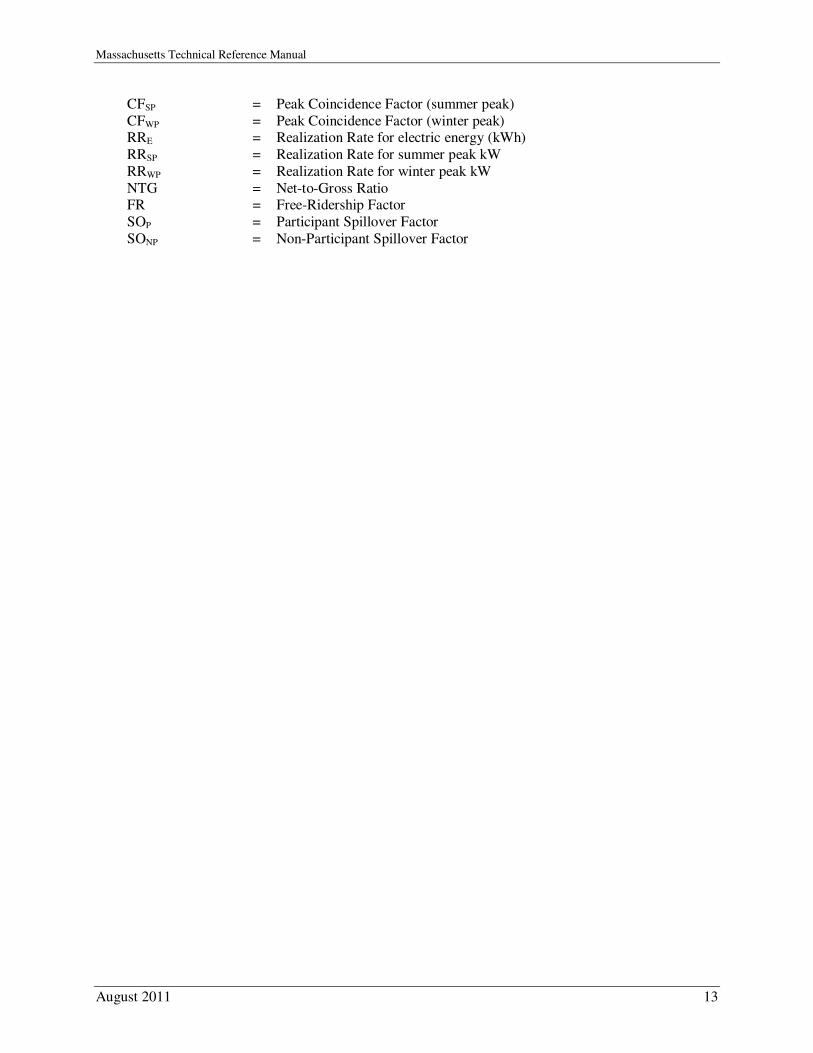
CFSP = Peak Coincidence Factor (summer peak)
CFWP = Peak Coincidence Factor (winter peak) RRE = Realization Rate for electric energy (kWh)
RRSP = Realization Rate for summer peak kW
RRWP = Realization Rate for winter peak kW
NTG = Net-to-Gross Ratio FR = Free-Ridership Factor
SOP = Participant Spillover Factor
SONP = Non-Participant Spillover Factor

Massachusetts Technical Reference Manual Residential Electric Efficiency Measures
August 2011 15
Residential Electric Efficiency Measures
Massachusetts Technical Reference Manual Residential Electric Efficiency Measures
August 2011 16
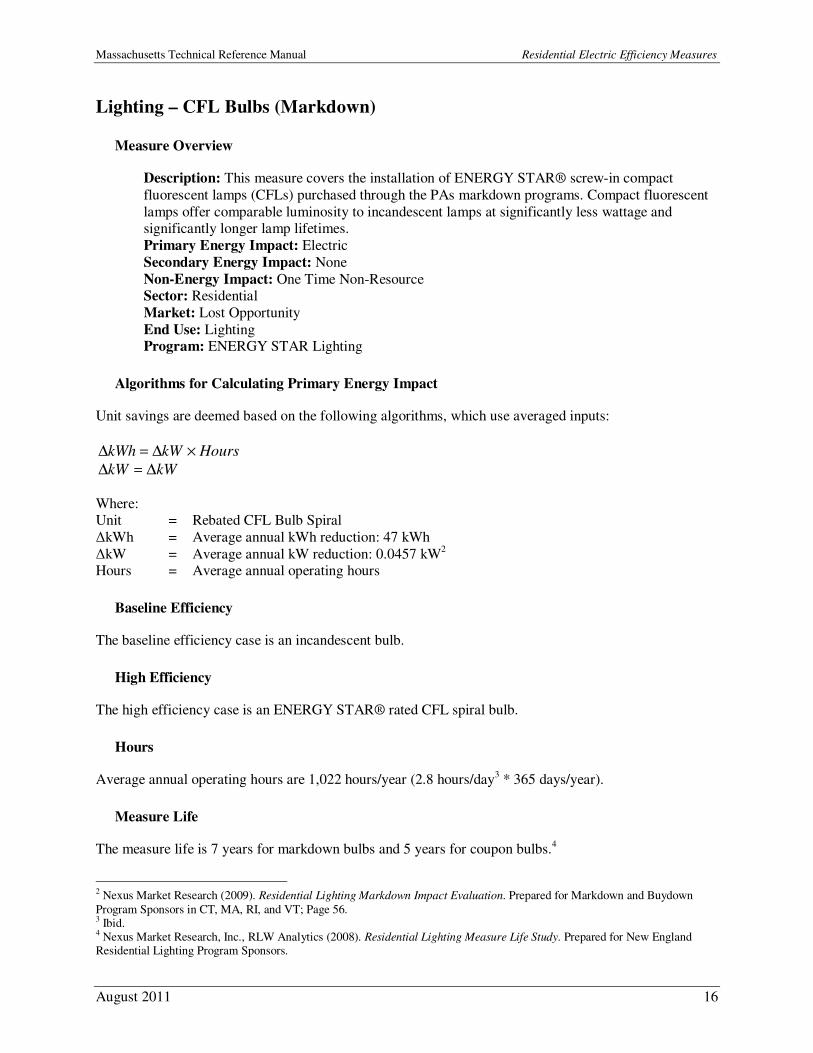
Lighting – CFL Bulbs (Markdown)
Measure Overview
Description: This measure covers the installation of ENERGY STAR® screw-in compact
fluorescent lamps (CFLs) purchased through the PAs markdown programs. Compact fluorescent
lamps offer comparable luminosity to incandescent lamps at significantly less wattage and significantly longer lamp lifetimes.
Primary Energy Impact: Electric
Secondary Energy Impact: None
Non-Energy Impact: One Time Non-Resource Sector: Residential
Market: Lost Opportunity
End Use: Lighting Program: ENERGY STAR Lighting
Algorithms for Calculating Primary Energy Impact
Unit savings are deemed based on the following algorithms, which use averaged inputs:
HourskWkWh ×∆=∆
kWkW ∆=∆
Where: Unit = Rebated CFL Bulb Spiral
∆kWh = Average annual kWh reduction: 47 kWh
∆kW = Average annual kW reduction: 0.0457 kW2
Hours = Average annual operating hours
Baseline Efficiency
The baseline efficiency case is an incandescent bulb.
High Efficiency
The high efficiency case is an ENERGY STAR® rated CFL spiral bulb.
Hours
Average annual operating hours are 1,022 hours/year (2.8 hours/day3 * 365 days/year).
Measure Life
The measure life is 7 years for markdown bulbs and 5 years for coupon bulbs.4
2 Nexus Market Research (2009). Residential Lighting Markdown Impact Evaluation. Prepared for Markdown and Buydown
Program Sponsors in CT, MA, RI, and VT; Page 56. 3 Ibid. 4 Nexus Market Research, Inc., RLW Analytics (2008). Residential Lighting Measure Life Study. Prepared for New England Residential Lighting Program Sponsors.
Massachusetts Technical Reference Manual Residential Electric Efficiency Measures
August 2011 17
Secondary Energy Impacts
There are no secondary energy impacts for this measure.
Non-Energy Impacts
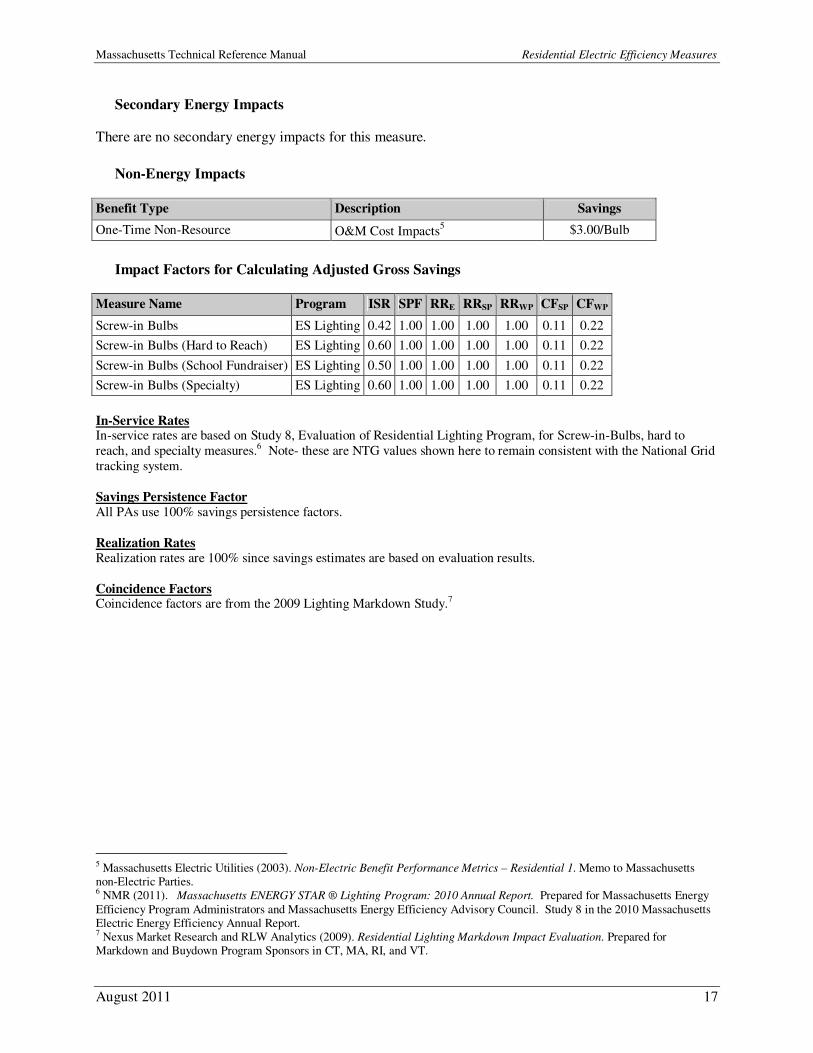
Benefit Type Description Savings
One-Time Non-Resource O&M Cost Impacts5 $3.00/Bulb
Impact Factors for Calculating Adjusted Gross Savings
Measure Name Program ISR SPF RRE RRSP RRWP CFSP CFWP
Screw-in Bulbs ES Lighting 0.42 1.00 1.00 1.00 1.00 0.11 0.22
Screw-in Bulbs (Hard to Reach) ES Lighting 0.60 1.00 1.00 1.00 1.00 0.11 0.22
Screw-in Bulbs (School Fundraiser) ES Lighting 0.50 1.00 1.00 1.00 1.00 0.11 0.22
Screw-in Bulbs (Specialty) ES Lighting 0.60 1.00 1.00 1.00 1.00 0.11 0.22
In-Service Rates In-service rates are based on Study 8, Evaluation of Residential Lighting Program, for Screw-in-Bulbs, hard to
reach, and specialty measures.6 Note- these are NTG values shown here to remain consistent with the National Grid
tracking system.
Savings Persistence Factor All PAs use 100% savings persistence factors.
Realization Rates Realization rates are 100% since savings estimates are based on evaluation results.
Coincidence Factors Coincidence factors are from the 2009 Lighting Markdown Study.7
5 Massachusetts Electric Utilities (2003). Non-Electric Benefit Performance Metrics – Residential 1. Memo to Massachusetts non-Electric Parties. 6 NMR (2011). Massachusetts ENERGY STAR ® Lighting Program: 2010 Annual Report. Prepared for Massachusetts Energy
Efficiency Program Administrators and Massachusetts Energy Efficiency Advisory Council. Study 8 in the 2010 Massachusetts Electric Energy Efficiency Annual Report. 7 Nexus Market Research and RLW Analytics (2009). Residential Lighting Markdown Impact Evaluation. Prepared for Markdown and Buydown Program Sponsors in CT, MA, RI, and VT.
Massachusetts Technical Reference Manual Residential Electric Efficiency Measures
August 2011 18
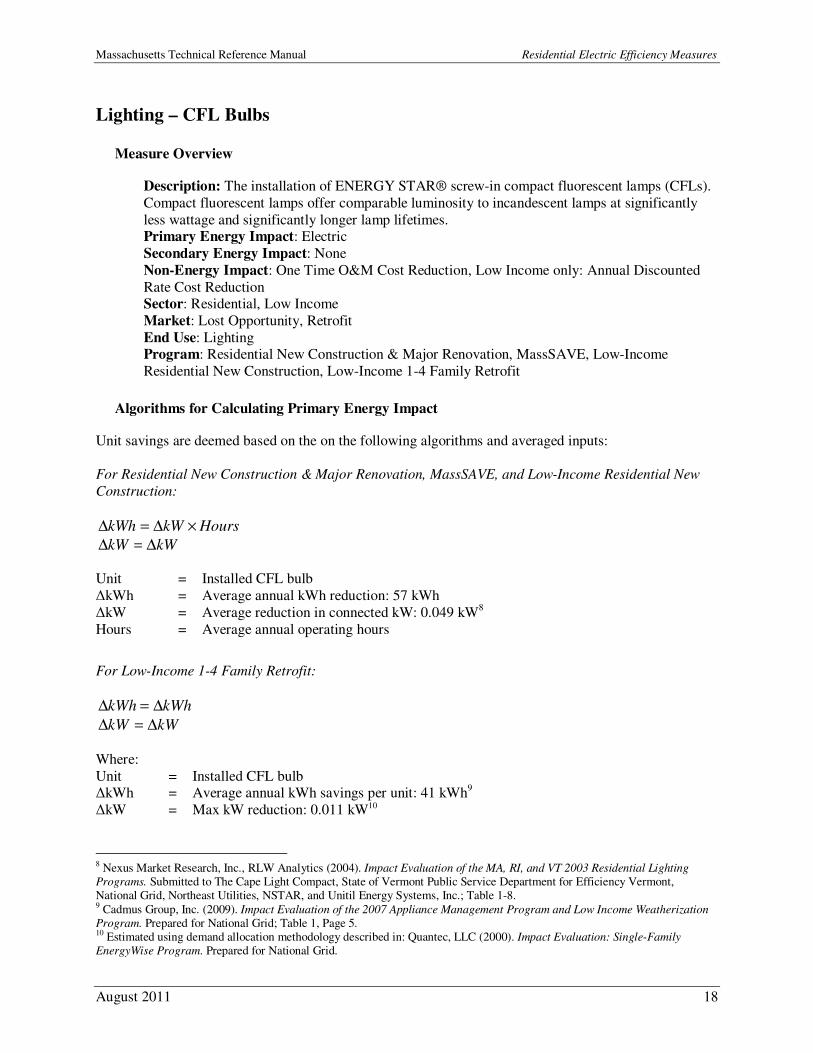
Lighting – CFL Bulbs
Measure Overview
Description: The installation of ENERGY STAR® screw-in compact fluorescent lamps (CFLs).
Compact fluorescent lamps offer comparable luminosity to incandescent lamps at significantly
less wattage and significantly longer lamp lifetimes. Primary Energy Impact: Electric
Secondary Energy Impact: None
Non-Energy Impact: One Time O&M Cost Reduction, Low Income only: Annual Discounted
Rate Cost Reduction Sector: Residential, Low Income
Market: Lost Opportunity, Retrofit
End Use: Lighting Program: Residential New Construction & Major Renovation, MassSAVE, Low-Income
Residential New Construction, Low-Income 1-4 Family Retrofit
Algorithms for Calculating Primary Energy Impact
Unit savings are deemed based on the on the following algorithms and averaged inputs:
For Residential New Construction & Major Renovation, MassSAVE, and Low-Income Residential New
Construction:
HourskWkWh ×∆=∆
kWkW ∆=∆
Unit = Installed CFL bulb
∆kWh = Average annual kWh reduction: 57 kWh
∆kW = Average reduction in connected kW: 0.049 kW8
Hours = Average annual operating hours
For Low-Income 1-4 Family Retrofit:
kWhkWh ∆=∆
kWkW ∆=∆
Where:
Unit = Installed CFL bulb ∆kWh = Average annual kWh savings per unit: 41 kWh
9
∆kW = Max kW reduction: 0.011 kW10
8 Nexus Market Research, Inc., RLW Analytics (2004). Impact Evaluation of the MA, RI, and VT 2003 Residential Lighting
Programs. Submitted to The Cape Light Compact, State of Vermont Public Service Department for Efficiency Vermont, National Grid, Northeast Utilities, NSTAR, and Unitil Energy Systems, Inc.; Table 1-8. 9 Cadmus Group, Inc. (2009). Impact Evaluation of the 2007 Appliance Management Program and Low Income Weatherization
Program. Prepared for National Grid; Table 1, Page 5. 10 Estimated using demand allocation methodology described in: Quantec, LLC (2000). Impact Evaluation: Single-Family
EnergyWise Program. Prepared for National Grid.
Massachusetts Technical Reference Manual Residential Electric Efficiency Measures
August 2011 19
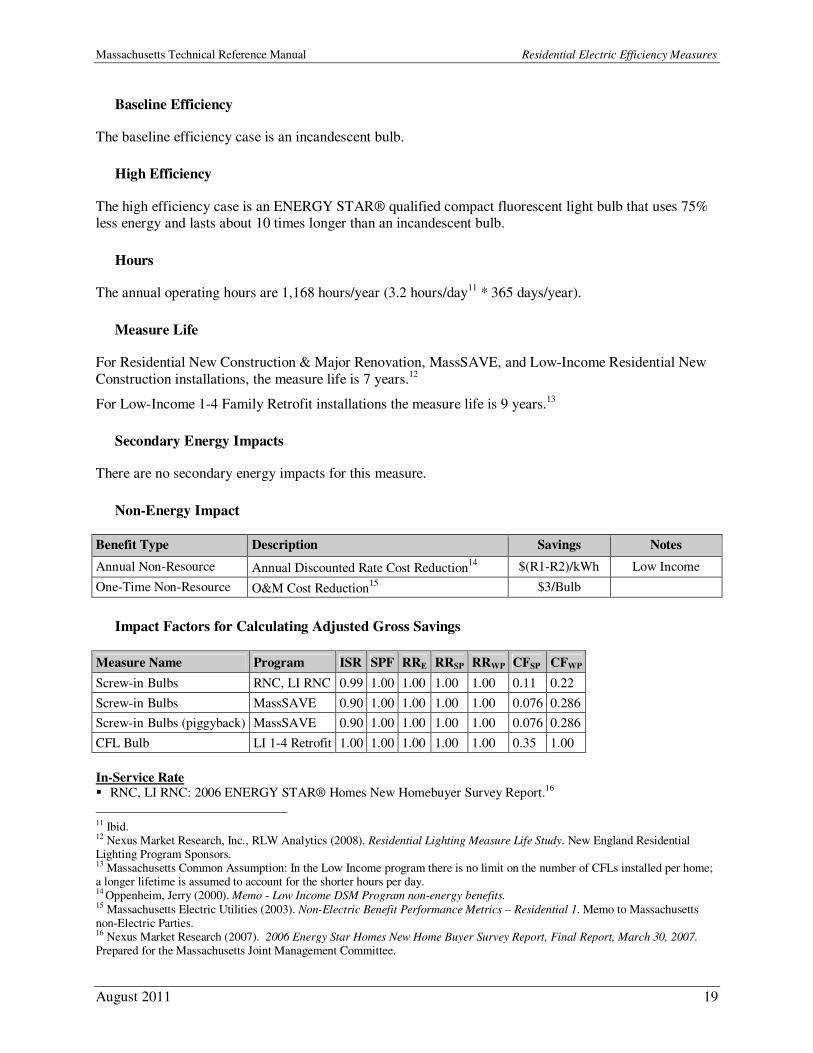
Baseline Efficiency
The baseline efficiency case is an incandescent bulb.
High Efficiency
The high efficiency case is an ENERGY STAR® qualified compact fluorescent light bulb that uses 75% less energy and lasts about 10 times longer than an incandescent bulb.
Hours
The annual operating hours are 1,168 hours/year (3.2 hours/day11
* 365 days/year).
Measure Life
For Residential New Construction & Major Renovation, MassSAVE, and Low-Income Residential New
Construction installations, the measure life is 7 years.12
For Low-Income 1-4 Family Retrofit installations the measure life is 9 years.13
Secondary Energy Impacts
There are no secondary energy impacts for this measure.
Non-Energy Impact
Benefit Type Description Savings Notes
Annual Non-Resource Annual Discounted Rate Cost Reduction14
$(R1-R2)/kWh Low Income
One-Time Non-Resource O&M Cost Reduction15
$3/Bulb
Impact Factors for Calculating Adjusted Gross Savings
Measure Name Program ISR SPF RRE RRSP RRWP CFSP CFWP
Screw-in Bulbs RNC, LI RNC 0.99 1.00 1.00 1.00 1.00 0.11 0.22
Screw-in Bulbs MassSAVE 0.90 1.00 1.00 1.00 1.00 0.076 0.286
Screw-in Bulbs (piggyback) MassSAVE 0.90 1.00 1.00 1.00 1.00 0.076 0.286
CFL Bulb LI 1-4 Retrofit 1.00 1.00 1.00 1.00 1.00 0.35 1.00
In-Service Rate � RNC, LI RNC: 2006 ENERGY STAR® Homes New Homebuyer Survey Report.16
11 Ibid. 12 Nexus Market Research, Inc., RLW Analytics (2008). Residential Lighting Measure Life Study. New England Residential Lighting Program Sponsors. 13 Massachusetts Common Assumption: In the Low Income program there is no limit on the number of CFLs installed per home; a longer lifetime is assumed to account for the shorter hours per day. 14 Oppenheim, Jerry (2000). Memo - Low Income DSM Program non-energy benefits. 15 Massachusetts Electric Utilities (2003). Non-Electric Benefit Performance Metrics – Residential 1. Memo to Massachusetts non-Electric Parties. 16 Nexus Market Research (2007). 2006 Energy Star Homes New Home Buyer Survey Report, Final Report, March 30, 2007. Prepared for the Massachusetts Joint Management Committee.
Massachusetts Technical Reference Manual Residential Electric Efficiency Measures
August 2011 20
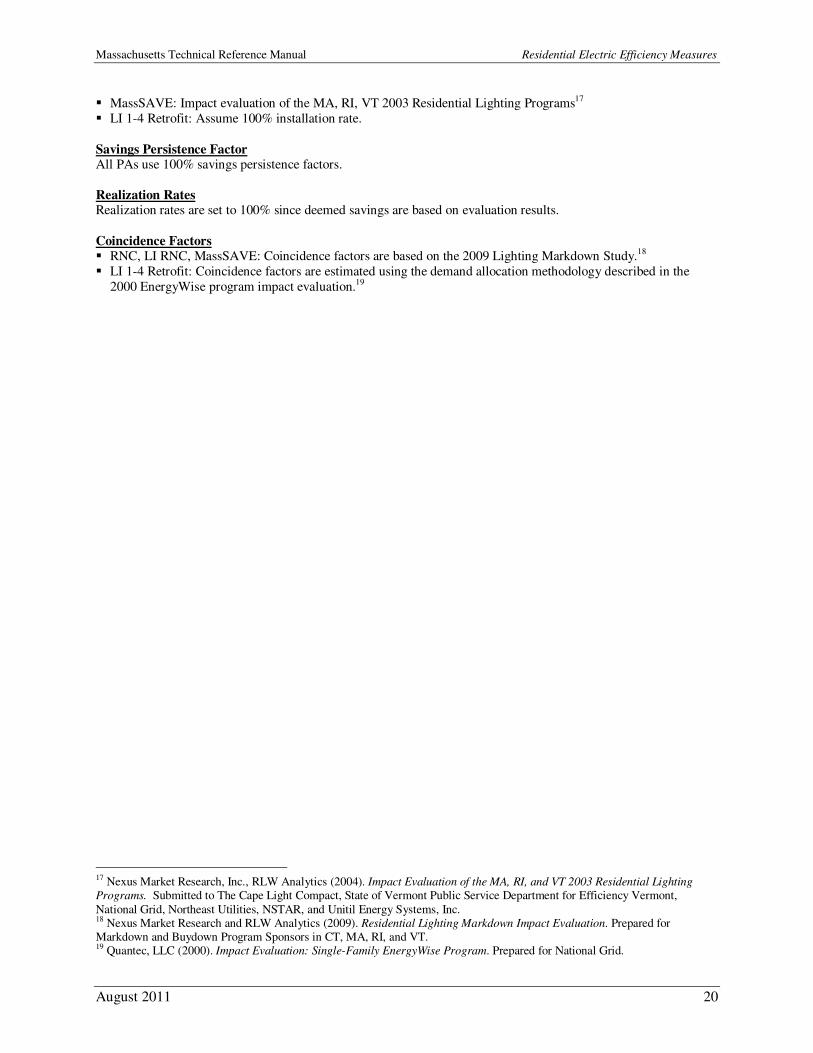
� MassSAVE: Impact evaluation of the MA, RI, VT 2003 Residential Lighting Programs17
� LI 1-4 Retrofit: Assume 100% installation rate.
Savings Persistence Factor All PAs use 100% savings persistence factors.
Realization Rates Realization rates are set to 100% since deemed savings are based on evaluation results.
Coincidence Factors � RNC, LI RNC, MassSAVE: Coincidence factors are based on the 2009 Lighting Markdown Study.18
� LI 1-4 Retrofit: Coincidence factors are estimated using the demand allocation methodology described in the
2000 EnergyWise program impact evaluation.19
17 Nexus Market Research, Inc., RLW Analytics (2004). Impact Evaluation of the MA, RI, and VT 2003 Residential Lighting
Programs. Submitted to The Cape Light Compact, State of Vermont Public Service Department for Efficiency Vermont,
National Grid, Northeast Utilities, NSTAR, and Unitil Energy Systems, Inc. 18 Nexus Market Research and RLW Analytics (2009). Residential Lighting Markdown Impact Evaluation. Prepared for Markdown and Buydown Program Sponsors in CT, MA, RI, and VT. 19 Quantec, LLC (2000). Impact Evaluation: Single-Family EnergyWise Program. Prepared for National Grid.
Massachusetts Technical Reference Manual Residential Electric Efficiency Measures
August 2011 21
Lighting – CFL Indoor Fixtures
Measure Overview
Description: The installation of ENERGY STAR® compact fluorescent (CFL) indoor fixtures.
Compact fluorescent fixtures offer comparable luminosity to incandescent fixtures at significantly
less wattage and significantly longer lifetimes. Hardwired fluorescent fixtures offer comparable luminosity to incandescent fixtures at significantly lower wattage and offer significantly longer
lifespan.
Primary Energy Impact: Electric
Secondary Energy Impact: None Non-Energy Impact: One-Time O&M Cost Reduction, Annual Discounted Rate Cost Reduction
(Low Income only)
Sector: Low Income, Residential Market: Lost Opportunity, Retrofit
End Use: Lighting
Program: ENERGY STAR Lighting, Residential New Construction & Major Renovation, Low-Income Residential New Construction,
Algorithms for Calculating Primary Energy Impact
Unit savings are deemed based on study results:
HourskWkWh ×∆=∆
kWkW ∆=∆
Where:
Unit = Rebated indoor fixture
∆kWh = Average annual kWh reduction: 44 kWh
∆kW = Average reduction in connected kW: 0.049 kW20
Hours = Average annual operating hours
Baseline Efficiency
The baseline efficiency case is an incandescent, screw-based fixture with an incandescent lamp.
High Efficiency
The high efficiency case is an ENERGY STAR® qualified compact fluorescent light fixture wired for
exclusive use with pin-based CFLs.
Hours
The average annual operating hours are 912.5 hours/year (2.5 hours/day21
* 365 days/year).
20 Nexus Market Research, Inc., RLW Analytics (2004) Impact Evaluation of the MA, RI, and VT 2003 Residential Lighting
Programs. Submitted to The Cape Light Compact, State of Vermont Public Service Department for Efficiency Vermont, National Grid, Northeast Utilities, NSTAR, and Unitil Energy Systems, Inc.; Page 11, Table 1-8.
Massachusetts Technical Reference Manual Residential Electric Efficiency Measures
August 2011 22
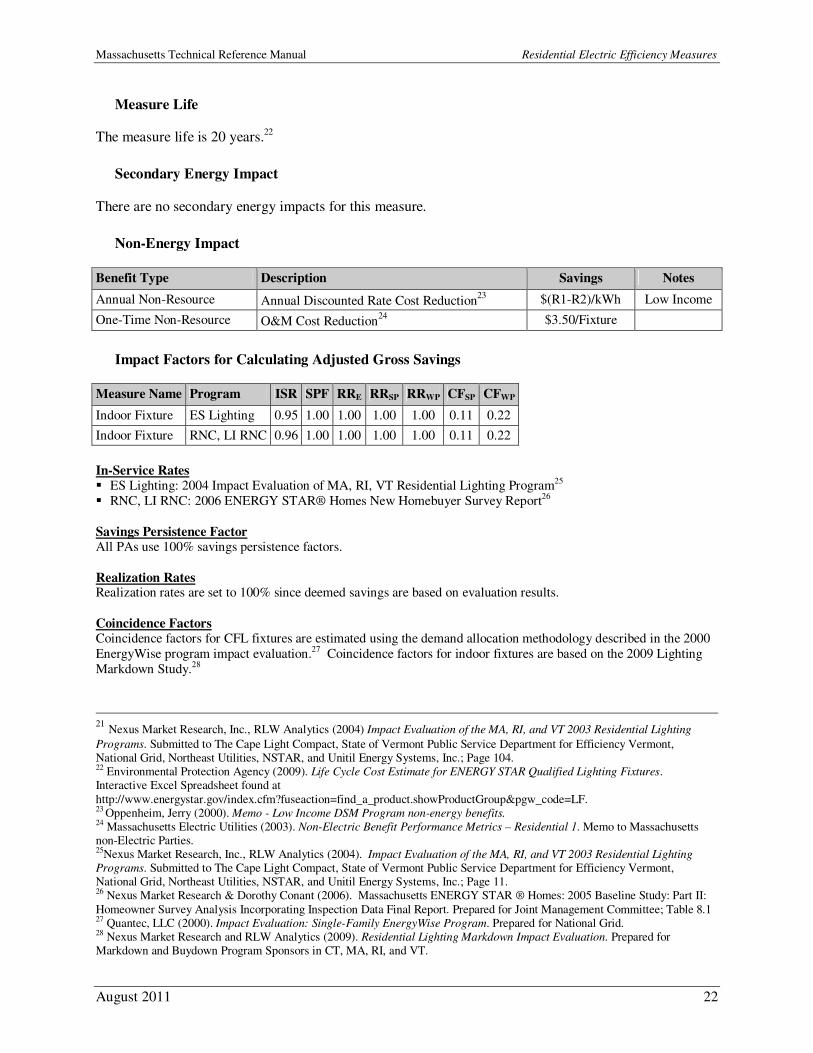
Measure Life
The measure life is 20 years.22
Secondary Energy Impact
There are no secondary energy impacts for this measure.
Non-Energy Impact
Benefit Type Description Savings Notes
Annual Non-Resource Annual Discounted Rate Cost Reduction23
$(R1-R2)/kWh Low Income
One-Time Non-Resource O&M Cost Reduction24
$3.50/Fixture
Impact Factors for Calculating Adjusted Gross Savings
Measure Name Program ISR SPF RRE RRSP RRWP CFSP CFWP
Indoor Fixture ES Lighting 0.95 1.00 1.00 1.00 1.00 0.11 0.22
Indoor Fixture RNC, LI RNC 0.96 1.00 1.00 1.00 1.00 0.11 0.22
In-Service Rates � ES Lighting: 2004 Impact Evaluation of MA, RI, VT Residential Lighting Program25
� RNC, LI RNC: 2006 ENERGY STAR® Homes New Homebuyer Survey Report26
Savings Persistence Factor All PAs use 100% savings persistence factors.
Realization Rates Realization rates are set to 100% since deemed savings are based on evaluation results.
Coincidence Factors Coincidence factors for CFL fixtures are estimated using the demand allocation methodology described in the 2000
EnergyWise program impact evaluation.27 Coincidence factors for indoor fixtures are based on the 2009 Lighting
Markdown Study.28
21
Nexus Market Research, Inc., RLW Analytics (2004) Impact Evaluation of the MA, RI, and VT 2003 Residential Lighting
Programs. Submitted to The Cape Light Compact, State of Vermont Public Service Department for Efficiency Vermont, National Grid, Northeast Utilities, NSTAR, and Unitil Energy Systems, Inc.; Page 104. 22 Environmental Protection Agency (2009). Life Cycle Cost Estimate for ENERGY STAR Qualified Lighting Fixtures. Interactive Excel Spreadsheet found at
http://www.energystar.gov/index.cfm?fuseaction=find_a_product.showProductGroup&pgw_code=LF. 23 Oppenheim, Jerry (2000). Memo - Low Income DSM Program non-energy benefits. 24 Massachusetts Electric Utilities (2003). Non-Electric Benefit Performance Metrics – Residential 1. Memo to Massachusetts non-Electric Parties. 25Nexus Market Research, Inc., RLW Analytics (2004). Impact Evaluation of the MA, RI, and VT 2003 Residential Lighting
Programs. Submitted to The Cape Light Compact, State of Vermont Public Service Department for Efficiency Vermont, National Grid, Northeast Utilities, NSTAR, and Unitil Energy Systems, Inc.; Page 11. 26 Nexus Market Research & Dorothy Conant (2006). Massachusetts ENERGY STAR ® Homes: 2005 Baseline Study: Part II:
Homeowner Survey Analysis Incorporating Inspection Data Final Report. Prepared for Joint Management Committee; Table 8.1 27 Quantec, LLC (2000). Impact Evaluation: Single-Family EnergyWise Program. Prepared for National Grid. 28 Nexus Market Research and RLW Analytics (2009). Residential Lighting Markdown Impact Evaluation. Prepared for Markdown and Buydown Program Sponsors in CT, MA, RI, and VT.
Massachusetts Technical Reference Manual Residential Electric Efficiency Measures
August 2011 23
Lighting – Outdoor Fixtures
Measure Overview
Description: The installation of hardwired ENERGY STAR® fluorescent outdoor fixtures with
pin-based bulbs. Savings for this measure are attributable to high efficiency outdoor lighting
fixtures and are treated similarly to indoor fixtures. Primary Energy Impact: Electric
Secondary Energy Impact: None
Non-Energy Impact: One-time Non-Resource
Sector: Residential Market: Lost Opportunity, Retrofit
End Use: Lighting
Program: ENERGY STAR Lighting
Algorithms for Calculating Primary Energy Impact
Unit savings are deemed based on the following algorithms which use averaged inputs:
HourskWkWh ×∆=∆
kWkW ∆=∆
Where:
Unit = Rebated outdoor fixture ∆kWh = Average annual kWh reduction: 156 kWh
∆kW = Average connected kW reduction: 0.095 kW29
Hours = Average annual operating hours
Baseline Efficiency
The baseline efficiency case is an incandescent, screw-based fixture with an incandescent bulb.
High Efficiency
The high efficiency case is an ENERGY STAR® fixture wired for exclusive use with a pin based CFL bulb.
Hours
The average annual operating hours are 1,642.5 hours/year (4.5 hours per day30
* 365 days per year).
29 Nexus Market Research, Inc., RLW Analytics (2004). Impact Evaluation of the MA, RI, and VT 2003 Residential Lighting
Programs. Submitted to The Cape Light Compact, State of Vermont Public Service Department for Efficiency Vermont,
National Grid, Northeast Utilities, NSTAR, and Unitil Energy Systems, Inc.; Table 1-8. 30 Nexus Market Research, Inc., RLW Analytics (2004). Impact Evaluation of the MA, RI, and VT 2003 Residential Lighting
Programs. Submitted to The Cape Light Compact, State of Vermont Public Service Department for Efficiency Vermont, National Grid, Northeast Utilities, NSTAR, and Unitil Energy Systems, Inc.; Page 104
Massachusetts Technical Reference Manual Residential Electric Efficiency Measures
August 2011 24
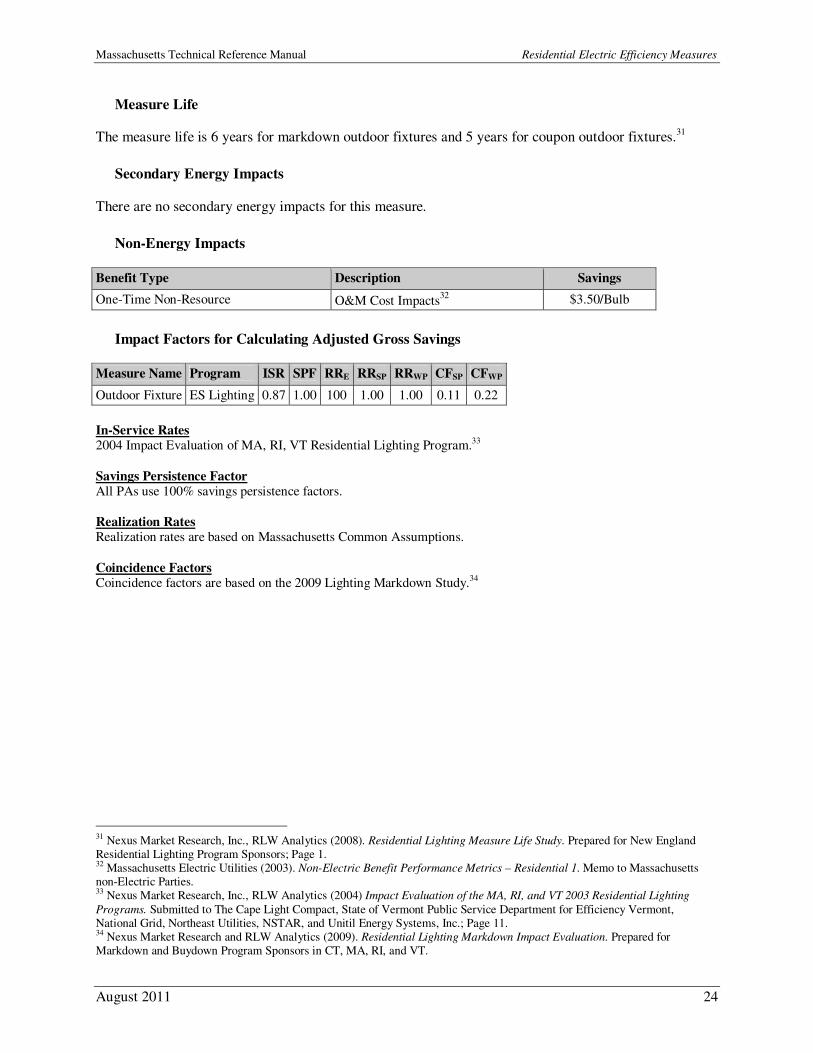
Measure Life
The measure life is 6 years for markdown outdoor fixtures and 5 years for coupon outdoor fixtures.31
Secondary Energy Impacts
There are no secondary energy impacts for this measure.
Non-Energy Impacts
Benefit Type Description Savings
One-Time Non-Resource O&M Cost Impacts32
$3.50/Bulb
Impact Factors for Calculating Adjusted Gross Savings
Measure Name Program ISR SPF RRE RRSP RRWP CFSP CFWP
Outdoor Fixture ES Lighting 0.87 1.00 100 1.00 1.00 0.11 0.22
In-Service Rates 2004 Impact Evaluation of MA, RI, VT Residential Lighting Program.33
Savings Persistence Factor All PAs use 100% savings persistence factors.
Realization Rates Realization rates are based on Massachusetts Common Assumptions.
Coincidence Factors Coincidence factors are based on the 2009 Lighting Markdown Study.34
31 Nexus Market Research, Inc., RLW Analytics (2008). Residential Lighting Measure Life Study. Prepared for New England Residential Lighting Program Sponsors; Page 1. 32 Massachusetts Electric Utilities (2003). Non-Electric Benefit Performance Metrics – Residential 1. Memo to Massachusetts non-Electric Parties. 33 Nexus Market Research, Inc., RLW Analytics (2004) Impact Evaluation of the MA, RI, and VT 2003 Residential Lighting
Programs. Submitted to The Cape Light Compact, State of Vermont Public Service Department for Efficiency Vermont, National Grid, Northeast Utilities, NSTAR, and Unitil Energy Systems, Inc.; Page 11. 34 Nexus Market Research and RLW Analytics (2009). Residential Lighting Markdown Impact Evaluation. Prepared for Markdown and Buydown Program Sponsors in CT, MA, RI, and VT.
Massachusetts Technical Reference Manual Residential Electric Efficiency Measures
August 2011 25
Lighting – Torchieres
Measure Overview
Description: The installation of high-efficiency ENERGY STAR® torchieres. High efficiency
torchieres use fluorescent in place of halogen or incandescent bulbs to provide comparable
luminosity at significantly reduced wattage. Primary Energy Impact: Electric
Secondary Energy Impact: None
Non-Energy Impact: Annual Discounted Rate Cost Reduction (Low Income only)
Sector: Residential, Low Income Market: Lost Opportunity, Retrofit
End Use: Lighting
Program: ENERGY STAR Lighting
Algorithms for Calculating Primary Energy Impact
Unit savings are based on the following algorithms which use averaged inputs:
HourskWkWh ×∆=∆
kWkW ∆=∆
Where:
Unit = Rebated ENERGY STAR® Torchiere ∆kWh = Average annual kWh reduction: 106 kWh
∆kW = Average connected kW reduction: 0.088 kW35
Hours = Average annual operating hours
Baseline Efficiency
The baseline efficiency case is a halogen (or incandescent) torchiere fixture.
High Efficiency
The high efficiency case is a fluorescent torchiere fixture.
Hours
The average annual operating hours are 1,204.5 hours/year (3.3 hours/day36
* 365 days/year).
Measure Life
The measure life is 8 years.37
35 Nexus Market Research, Inc., RLW Analytics (2004) Impact Evaluation of the MA, RI, and VT 2003 Residential Lighting
Programs. Submitted to The Cape Light Compact, State of Vermont Public Service Department for Efficiency Vermont,
National Grid, Northeast Utilities, NSTAR, and Unitil Energy Systems, Inc.; Table 1-8. 36 Nexus Market Research, Inc., RLW Analytics (2004) Impact Evaluation of the Massachusetts, Rhode Island, and Vermont
2003 Residential Lighting Programs. Submitted to The Cape Light Compact, State of Vermont Public Service Department for Efficiency Vermont, National Grid, Northeast Utilities, NSTAR, and Unitil Energy Systems, Inc.; Page 104
Massachusetts Technical Reference Manual Residential Electric Efficiency Measures
August 2011 26
Secondary-Energy Impacts
There are no secondary energy impacts for this measure.
Non-Energy Impacts
There are no non-energy impacts for this measure.
Impact Factors for Calculating Adjusted Gross Savings
Measure Name Program ISR SPF RRE RRSP RRWP CFSP CFWP
Torchieres ES Lighting 0.83 1.00 1.00 1.00 1.00 0.11 0.22
In-Service Rates 2004 Impact Evaluation of MA, RI, VT Residential Lighting Program38
Savings Persistence Factor All PAs use 100% savings persistence factors.
Realization Rates Realization rates are based on Staff Assumptions.
Coincidence Factors Coincidence factors are based on the 2009 Lighting Markdown Study.39
37
Ibid. 38Nexus Market Research, Inc., RLW Analytics (2004). Impact Evaluation of the MA, RI, and VT 2003 Residential Lighting
Programs. Submitted to The Cape Light Compact, State of Vermont Public Service Department for Efficiency Vermont Service Department for Efficiency Vermont, National Grid, Northeast Utilities, NSTAR, and Unitil Energy Systems, Inc.; Page 11. 39 Nexus Market Research and RLW Analytics (2009). Residential Lighting Markdown Impact Evaluation. Prepared for Markdown and Buydown Program Sponsors in CT, MA, RI, and VT.
Massachusetts Technical Reference Manual Residential Electric Efficiency Measures
August 2011 27
Lighting – Light–Emitting Diode Lights
Measure Overview
Description: The installation of Light-Emitting Diode (LED) screw-in bulbs. LEDs offer
comparable luminosity to incandescent bulbs at significantly less wattage and significantly longer
lamp lifetimes. Primary Energy Impact: Electric
Secondary Energy Impact: None
Non-Energy Impact: Annual Discounted Rate Cost Reduction (Low Income only)
Sector: Residential Market: Lost Opportunity
End Use: Lighting
Program: ENERGY STAR Lighting, Residential New Construction & Major Renovation, Low-Income Residential New Construction
Algorithms for Calculating Primary Energy Impact
Unit savings are based on the following algorithms which use averaged inputs:
( ) HourskWkWkWh LEDBASE ×−=∆
kWkW ∆=∆
Where: Unit = Rebated LED lamp or fixture
∆kWh = Average annual energy savings: 48 kWh40
∆kW = Average connected kW reduction: 0.013 kW41
kWBASE = Average connected kW of baseline bulb kWLED = Average connected kW of LED bulb
Hours = Average annual operating hours
Baseline Efficiency
The baseline efficiency case is a 65-watt incandescent bulb in a screw-based socket or fluorescent under
cabinet light.
High Efficiency
The high efficiency case is an 18-watt LED downlight.
Hours
The average annual operating hours are 1,022 hours/year (2.8 hours/day42
* 365 days/year).
40 Homes: Energy Star. LED Light Bulbs for Consumers.
http://www.energystar.gov/index.cfm?fuseaction=find_a_product.showProductGroup&pgw_code=ILB. Accessed on 10/15/10. 41 Estimated using demand allocation methodology described in: Quantec, LLC (2000). Impact Evaluation: Single-Family
EnergyWise Program. Prepared for National Grid. 42 Nexus Market Research (2009). Residential Lighting Markdown Impact Evaluation. Prepared for Markdown and Buydown Program Sponsors in CT, MA, RI, and VT; Page 6.
Massachusetts Technical Reference Manual Residential Electric Efficiency Measures
August 2011 28
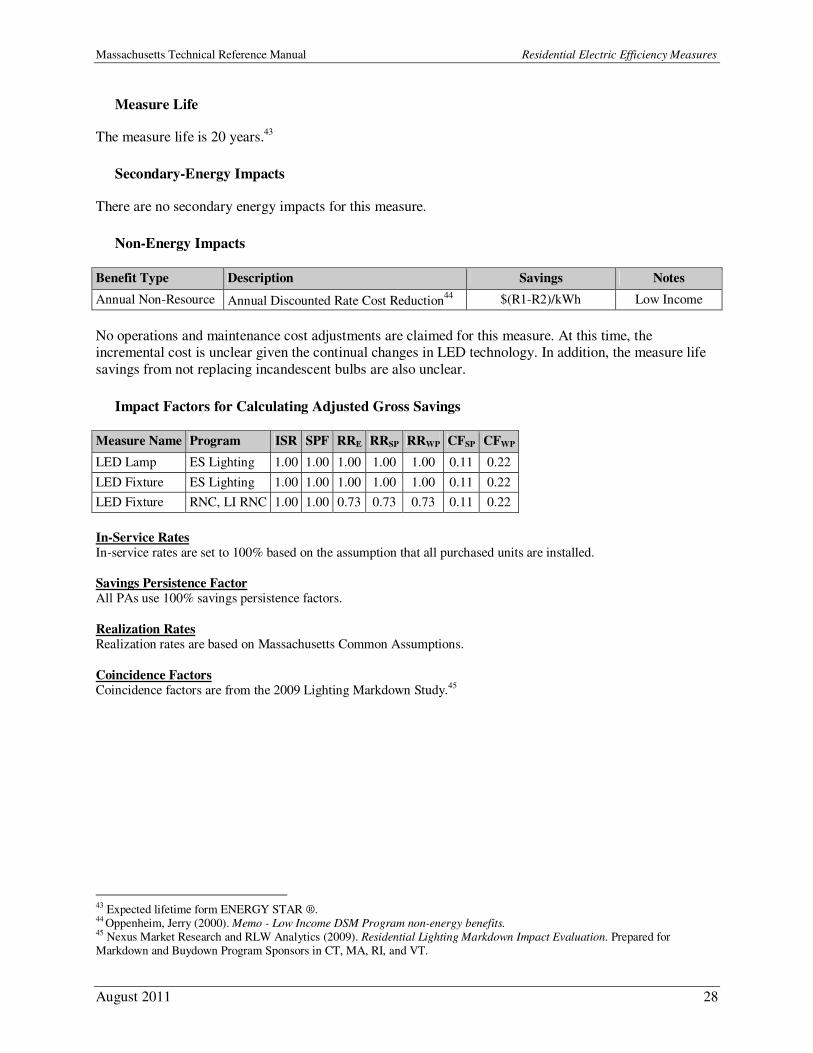
Measure Life
The measure life is 20 years.43
Secondary-Energy Impacts
There are no secondary energy impacts for this measure.
Non-Energy Impacts
Benefit Type Description Savings Notes
Annual Non-Resource Annual Discounted Rate Cost Reduction44
$(R1-R2)/kWh Low Income
No operations and maintenance cost adjustments are claimed for this measure. At this time, the incremental cost is unclear given the continual changes in LED technology. In addition, the measure life
savings from not replacing incandescent bulbs are also unclear.
Impact Factors for Calculating Adjusted Gross Savings
Measure Name Program ISR SPF RRE RRSP RRWP CFSP CFWP
LED Lamp ES Lighting 1.00 1.00 1.00 1.00 1.00 0.11 0.22
LED Fixture ES Lighting 1.00 1.00 1.00 1.00 1.00 0.11 0.22
LED Fixture RNC, LI RNC 1.00 1.00 0.73 0.73 0.73 0.11 0.22
In-Service Rates In-service rates are set to 100% based on the assumption that all purchased units are installed.
Savings Persistence Factor All PAs use 100% savings persistence factors.
Realization Rates Realization rates are based on Massachusetts Common Assumptions.
Coincidence Factors Coincidence factors are from the 2009 Lighting Markdown Study.45
43 Expected lifetime form ENERGY STAR ®. 44 Oppenheim, Jerry (2000). Memo - Low Income DSM Program non-energy benefits. 45 Nexus Market Research and RLW Analytics (2009). Residential Lighting Markdown Impact Evaluation. Prepared for Markdown and Buydown Program Sponsors in CT, MA, RI, and VT.
Massachusetts Technical Reference Manual Residential Electric Efficiency Measures
August 2011 29
Process – Computer Monitors
Measure Overview
Description: Rebates for ENERGY STAR® Computer Monitors
Primary Energy Impact: Electric
Secondary Energy Impact: None Non-Energy Impact: None
Sector: Residential
Market: Lost Opportunity
End Use: Process Program: ENERGY STAR Appliances
Algorithms for Calculating Primary Energy Impact
Unit savings are deemed based on study results:
kWhkWh ∆=∆
kWkW ∆=∆
Where:
Unit = Rebated ENERGY STAR® computer monitor ∆kWh = Average annual kWh savings per unit: 35 kWh
46
∆kW = Average annual kW savings per unit: 0.010 kW47
Baseline Efficiency
The baseline efficiency case is a conventional computer monitor.
High Efficiency
The high efficiency case is an ENERGY STAR® rated LCD monitor.
Hours
Not applicable.
Measure Life
The measure life is 6 years.48
46 Deemed savings developed based on assumptions in CEE (2008). Consumer Electronics Program Guide: Information on
Voluntary Approaches for the Promotion of Energy Efficient Consumer Electronics - Products and Practices; Page 9, Table 1. 47 Estimated using demand allocation methodology described in: Quantec, LLC (2000). Impact Evaluation: Single-Family
EnergyWise Program. Prepared for National Grid. 48 CEE (2008). Consumer Electronics Program Guide: Information on Voluntary Approaches for the Promotion of Energy
Efficient Consumer Electronics - Products and Practices.
Massachusetts Technical Reference Manual Residential Electric Efficiency Measures
August 2011 30
Secondary Energy Impacts
There are no secondary energy impacts for this measure.
Non-Energy Impacts
There are no non-energy impacts for this measure.
Impact Factors for Calculating Adjusted Gross Savings
Measure Name Program ISR SPF RRE RRSP RRWP CFSP CFWP
Computer Monitors ES Appliances 1.00 1.00 1.00 1.00 1.00 0.35 1.00
In-Service Rates In-service rates are set to 100% based on the assumption that all purchased units are installed.
Savings Persistence Factor All PAs use 100% savings persistence factors.
Realization Rates Realization rates are based on Massachusetts Common Assumptions.
Coincidence Factors Coincidence factors are based on Massachusetts Common Assumptions.

Massachusetts Technical Reference Manual Residential Electric Efficiency Measures
August 2011 31
Process – Desktop Computers
Measure Overview
Description: Rebates for ENERGY STAR® Desktop Computers
Primary Energy Impact: Electric
Secondary Energy Impact: None Non-Energy Impact: None
Sector: Residential
Market: Lost Opportunity
End Use: Process Program: ENERGY STAR Appliances
Algorithms for Calculating Primary Energy Impact
Unit savings are based on engineering estimate of delta kW between computers that are idle, in sleep
mode, or off:
kWhkWh ∆=∆
kWkW ∆=∆
Where: Unit = Rebated ENERGY STAR® desktop computer
∆kWh = Average annual kWh reduction per unit: 76 kWh49
∆kW = Average kW savings per unit: 0.01 kW50
Baseline Efficiency
The baseline efficiency case is a conventional desktop computer.
High Efficiency
The high efficiency case is an ENERGY STAR® rated desktop computer.
Hours
The operational hours include: 3,322 annual idle hours, 399 annual sleep hours, and 5,039 annual off hours.
51
Measure Life
The measure life is 4 years.52
49 Environmental Protection Agency (2010). Life Cycle Cost Estimate for ENERGY STAR Office Equipment. Interactive Excel
Spreadsheet found at www.energystar.gov/ia/business/bulk_purchasing/bpsavings_calc/Calc_office_eq.xls. 50 Ibid. 51 Ibid. 52 Ibid.
Massachusetts Technical Reference Manual Residential Electric Efficiency Measures
August 2011 32
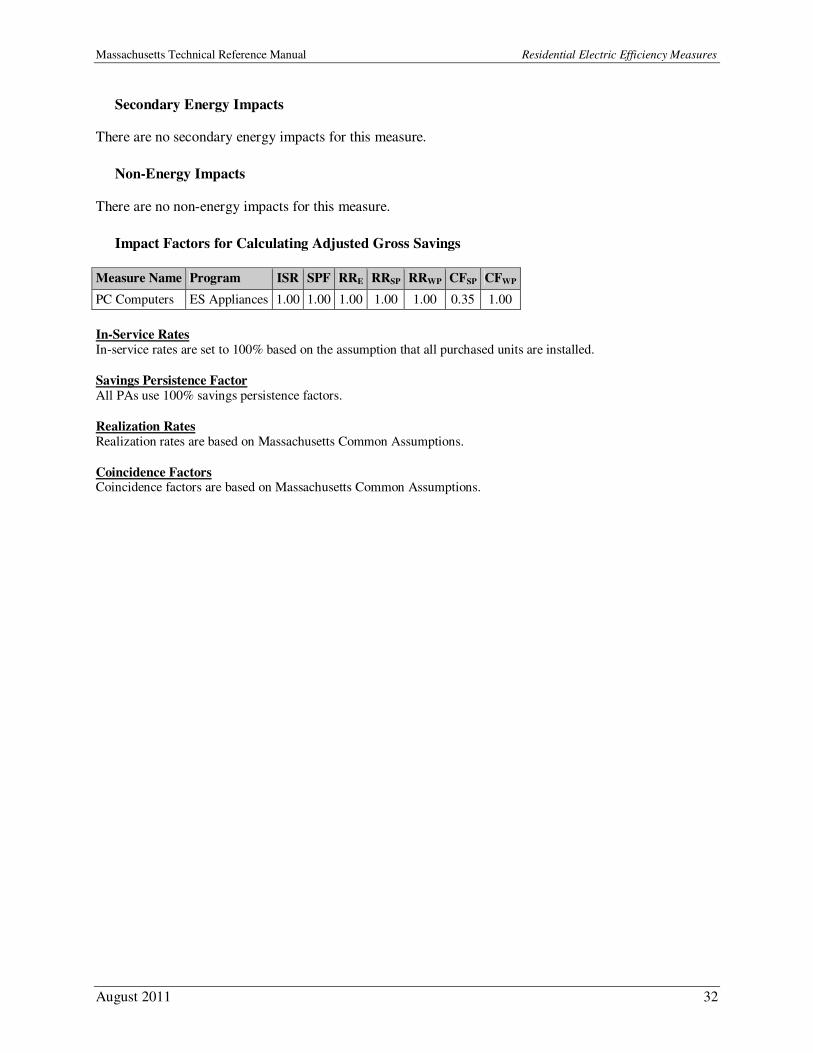
Secondary Energy Impacts
There are no secondary energy impacts for this measure.
Non-Energy Impacts
There are no non-energy impacts for this measure.
Impact Factors for Calculating Adjusted Gross Savings
Measure Name Program ISR SPF RRE RRSP RRWP CFSP CFWP
PC Computers ES Appliances 1.00 1.00 1.00 1.00 1.00 0.35 1.00
In-Service Rates In-service rates are set to 100% based on the assumption that all purchased units are installed.
Savings Persistence Factor All PAs use 100% savings persistence factors.
Realization Rates Realization rates are based on Massachusetts Common Assumptions.
Coincidence Factors Coincidence factors are based on Massachusetts Common Assumptions.
Massachusetts Technical Reference Manual Residential Electric Efficiency Measures
August 2011 33
Process – Room Air Cleaner
Measure Overview
Description: Rebates provided for the purchase of an ENERGY STAR® qualified room air
cleaner. ENERGY STAR® air cleaners are 40% more energy-efficient than standard models.
Primary Energy Impact: Electric Secondary Energy Impact: None
Non-Energy Impact: None
Sector: Residential
Market: Lost Opportunity End Use: Process
Program: ENERGY STAR Appliances
Algorithms for Calculating Primary Energy Impact
Unit savings are deemed and based on the following algorithms which use averaged inputs:
kWhkWh ∆=∆
HourskWhkW /∆=∆
Where:
Unit = Rebated room air cleaner
∆kWh = Average annual kWh savings per unit: 268 kWh53
∆kW = Average connected load reduction: 0.032 kW
54
Hours = Annual operating hours
Baseline Efficiency
The baseline efficiency case is a conventional unit with clean air delivery rate (CADR) of 51-100.
High Efficiency
The high efficiency case is an ENERGY STAR® qualified air cleaner with a CADR of 51-100.
Hours
The savings are based on 8,760 operating hours per year.
Measure Life
The measure life is 9 years.55
53 Environmental Protection Agency (2009). Life Cycle Cost Estimate for ENERGY STAR Room Air Cleaner. Interactive Excel Spreadsheet found at www.energystar.gov/ia/business/bulk_purchasing/bpsavings_calc/CalculatorRoomAirCleaner.xls 54 Ibid. 55 Ibid.

Massachusetts Technical Reference Manual Residential Electric Efficiency Measures
August 2011 34
Secondary Energy Impacts
There are no secondary energy impacts for this measure.
Non-Energy Impacts
There are no non-energy impacts for this measure.
Impact Factors for Calculating Adjusted Gross Savings
Measure Name Program ISR SPF RRE RRSP RRWP CFSP CFWP
Room Air Cleaner ES Appliances 1.00 1.00 1.00 1.00 1.00 0.85 1.00
In-Service Rates All installations have 100% in service rate since all PAs programs include verification of equipment installations.
Savings Persistence Factor All PAs use 100% savings persistence factors.
Realization Rates Realization rates are based on Massachusetts Common Assumptions.
Coincidence Factors Coincidence factors are based on Massachusetts Common Assumptions.
Massachusetts Technical Reference Manual Residential Electric Efficiency Measures
August 2011 35
Process – Smart Strips
Measure Overview
Description: Switches off plug load using current sensors and switching devices which turn
off plug load when electrical current drops below threshold low levels. Smart Strips can be
used on electrical home appliances or in the workplace. Primary Energy Impact: Electric Secondary Energy Impact: None
Non-Energy Impact: Annual Discounted Rate Cost Reduction (Low Income only)
Sector: Residential, Low Income Market: Lost Opportunity, Retrofit
End Use: Process
Program: ENERGY STAR Appliances
Algorithms for Calculating Primary Energy Impact
Unit savings are deemed based on study results:
kWhkWh ∆=∆
kWkW ∆=∆
Unit = Rebated smart strip ∆kWh = Average annual kWh savings per unit: 75 kWh
56
∆kW = Max kW savings per unit: 0.060 kW
Baseline Efficiency
The baseline efficiency case is no power strip and leaving peripherals on or using a power surge protector.
High Efficiency
The high efficiency case is a Smart Strip Energy Efficient Power Bar.
Hours
The savings are based on 8,760 hours per year.
Measure Life
The measure life is 5 years.57
Secondary-Energy Impacts
There are no secondary energy impacts for this measure.
56 ECOS 2008 Entertainment Center and DVDs. 57 Massachusetts Common Assumptions.
Massachusetts Technical Reference Manual Residential Electric Efficiency Measures
August 2011 36
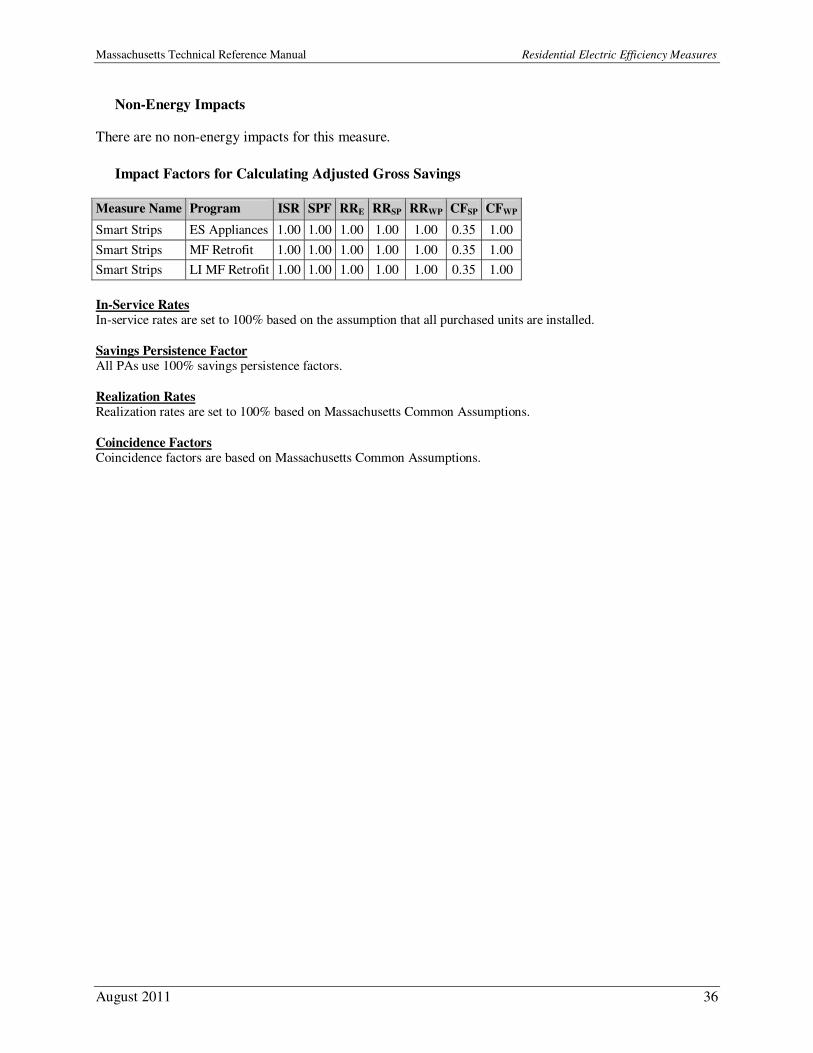
Non-Energy Impacts
There are no non-energy impacts for this measure.
Impact Factors for Calculating Adjusted Gross Savings
Measure Name Program ISR SPF RRE RRSP RRWP CFSP CFWP
Smart Strips ES Appliances 1.00 1.00 1.00 1.00 1.00 0.35 1.00
Smart Strips MF Retrofit 1.00 1.00 1.00 1.00 1.00 0.35 1.00
Smart Strips LI MF Retrofit 1.00 1.00 1.00 1.00 1.00 0.35 1.00
In-Service Rates In-service rates are set to 100% based on the assumption that all purchased units are installed.
Savings Persistence Factor All PAs use 100% savings persistence factors.
Realization Rates Realization rates are set to 100% based on Massachusetts Common Assumptions.
Coincidence Factors Coincidence factors are based on Massachusetts Common Assumptions.
Massachusetts Technical Reference Manual Residential Electric Efficiency Measures
August 2011 37
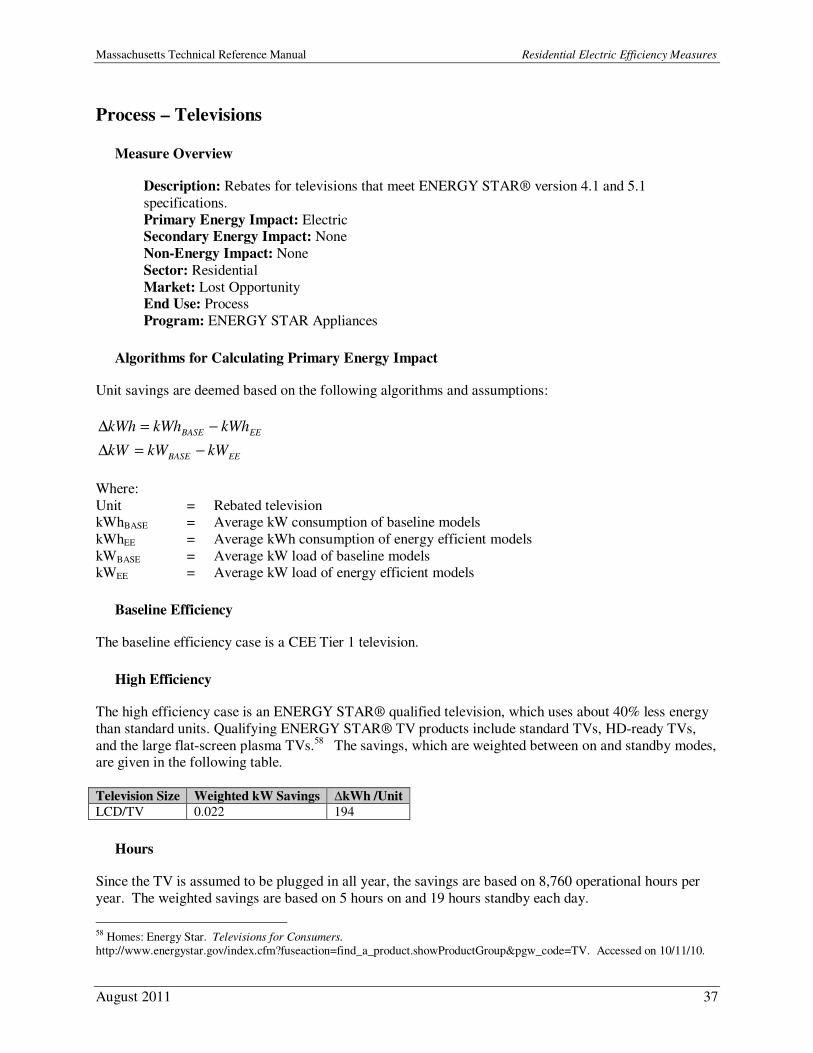
Process – Televisions
Measure Overview
Description: Rebates for televisions that meet ENERGY STAR® version 4.1 and 5.1
specifications.
Primary Energy Impact: Electric Secondary Energy Impact: None
Non-Energy Impact: None
Sector: Residential
Market: Lost Opportunity End Use: Process
Program: ENERGY STAR Appliances
Algorithms for Calculating Primary Energy Impact
Unit savings are deemed based on the following algorithms and assumptions:
EEBASE kWhkWhkWh −=∆
EEBASE kWkWkW −=∆
Where:
Unit = Rebated television kWhBASE = Average kW consumption of baseline models
kWhEE = Average kWh consumption of energy efficient models
kWBASE = Average kW load of baseline models kWEE = Average kW load of energy efficient models
Baseline Efficiency
The baseline efficiency case is a CEE Tier 1 television.
High Efficiency
The high efficiency case is an ENERGY STAR® qualified television, which uses about 40% less energy
than standard units. Qualifying ENERGY STAR® TV products include standard TVs, HD-ready TVs,
and the large flat-screen plasma TVs.58
The savings, which are weighted between on and standby modes, are given in the following table.
Television Size Weighted kW Savings ∆kWh /Unit
LCD/TV 0.022 194
Hours
Since the TV is assumed to be plugged in all year, the savings are based on 8,760 operational hours per
year. The weighted savings are based on 5 hours on and 19 hours standby each day.
58 Homes: Energy Star. Televisions for Consumers.
http://www.energystar.gov/index.cfm?fuseaction=find_a_product.showProductGroup&pgw_code=TV. Accessed on 10/11/10.

Massachusetts Technical Reference Manual Residential Electric Efficiency Measures
August 2011 38
Measure Life
The measure life is 6 years.59
Secondary Energy Impacts
There are no secondary energy impacts for this measure.
Non-Energy Impact
There are no non-energy impacts for this measure.
Impact Factors for Calculating Adjusted Gross Savings
Measure Name Program ISR SPF RRE RRSP RRWP CFSP CFWP
LCD/TV ES Appliances 1.00 1.00 1.00 1.00 1.00 0.50 0.85
In-Service Rates In-service rates are set to 100% based on the assumption that all purchased units are installed.
Savings Persistence Factor All PAs use 100% savings persistence factors.
Realization Rates Realization rates are based on Massachusetts Common Assumptions.
Coincidence Factors Coincidence factors are based on Massachusetts Common Assumptions.
59 Environmental Protection Agency (2008). Life Cycle Cost Estimate for ENERGY STAR Television. Interactive Excel Spreadsheet found at www.energystar.gov/ia/business/bulk_purchasing/bpsavings_calc/Calc_Televisions_Bulk.xls
Massachusetts Technical Reference Manual Residential Electric Efficiency Measures
August 2011 39
Refrigeration – Refrigerators (Lost Opportunity)
Measure Overview
Description: Rebates for purchase of ENERGY STAR® qualified refrigerators. ENERGY
STAR® qualified refrigerators use at least 20% less energy than new, non-qualified models.
Primary Energy Impact: Electric Secondary Energy Impact: None
Non-Energy Impact: Annual Discounted Rate Cost Reduction (Low Income only)
Sector: Residential, Low Income
Market: Lost Opportunity End Use: Refrigeration
Program: ENERGY STAR Appliances, Residential New Construction & Major Renovation,
Low-Income Residential New Construction
Algorithms for Calculating Primary Energy Impact
Unit savings are based on the following algorithms which use averaged inputs:
ESBASE kWhkWhkWh ∆−∆=∆
kWkW ∆=∆
Where: Unit = Installed ENERGY STAR® refrigerator
∆kWh = Annual savings over non-ES refrigerators averaged by model type: 107 kWh60
∆kW = Average kW reduction over non-ES refrigerator: 0.014 kW61
Baseline Efficiency
The baseline efficiency case is a residential refrigerator that meets the Federal minimum standard for energy efficiency.
High Efficiency
The high efficiency case is an ENERGY STAR® residential refrigerator that uses 20% less energy than
models not labeled with the ENERGY STAR® logo.
Hours
Not applicable.
60 Environmental Protection Agency (2009). Life Cycle Cost Estimate for ENERGY STAR Residential Refrigerator. Interactive Excel Spreadsheet found at
www.energystar.gov/.../business/bulk_purchasing/bpsavings_calc/Consumer_Residential_Refrig_Sav_Calc.xls; average of savings form all refrigerator models. 61 Estimated using demand allocation methodology described in: Quantec, LLC (2000). Impact Evaluation: Single-Family
EnergyWise Program. Prepared for National Grid.
Massachusetts Technical Reference Manual Residential Electric Efficiency Measures
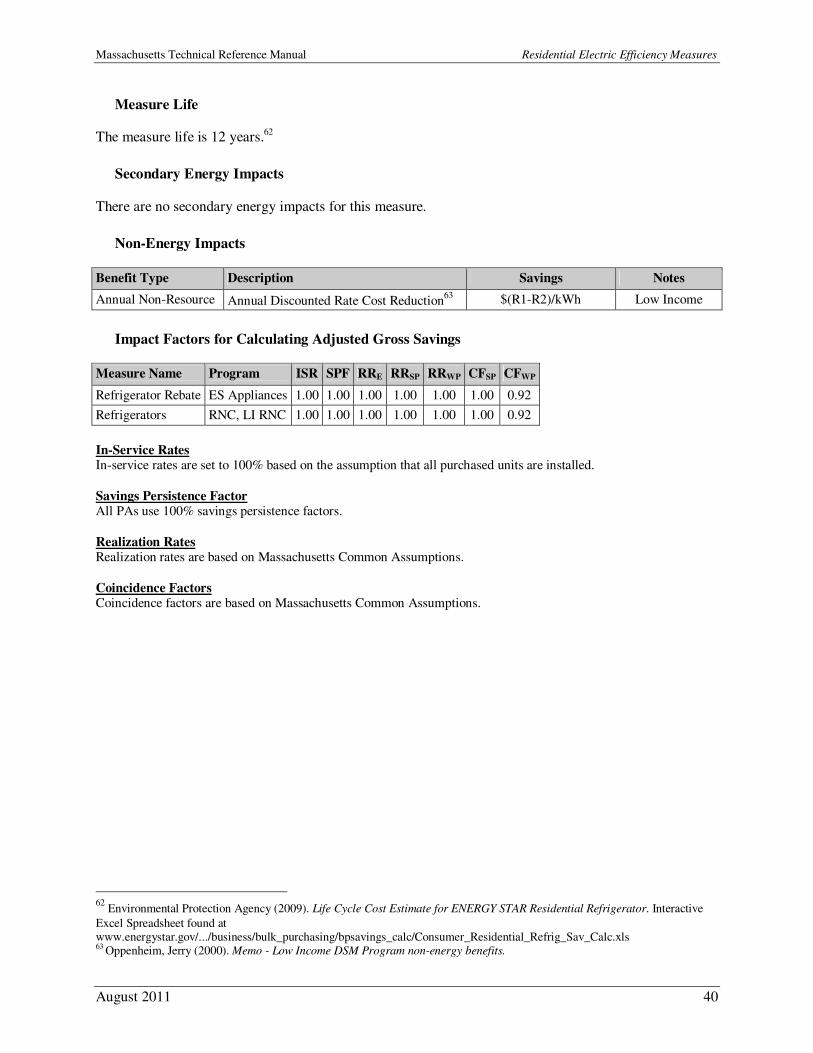
August 2011 40
Measure Life
The measure life is 12 years.62
Secondary Energy Impacts
There are no secondary energy impacts for this measure.
Non-Energy Impacts
Benefit Type Description Savings Notes
Annual Non-Resource Annual Discounted Rate Cost Reduction63
$(R1-R2)/kWh Low Income
Impact Factors for Calculating Adjusted Gross Savings
Measure Name Program ISR SPF RRE RRSP RRWP CFSP CFWP
Refrigerator Rebate ES Appliances 1.00 1.00 1.00 1.00 1.00 1.00 0.92
Refrigerators RNC, LI RNC 1.00 1.00 1.00 1.00 1.00 1.00 0.92
In-Service Rates In-service rates are set to 100% based on the assumption that all purchased units are installed.
Savings Persistence Factor All PAs use 100% savings persistence factors.
Realization Rates Realization rates are based on Massachusetts Common Assumptions.
Coincidence Factors Coincidence factors are based on Massachusetts Common Assumptions.
62
Environmental Protection Agency (2009). Life Cycle Cost Estimate for ENERGY STAR Residential Refrigerator. Interactive
Excel Spreadsheet found at www.energystar.gov/.../business/bulk_purchasing/bpsavings_calc/Consumer_Residential_Refrig_Sav_Calc.xls 63 Oppenheim, Jerry (2000). Memo - Low Income DSM Program non-energy benefits.
Massachusetts Technical Reference Manual Residential Electric Efficiency Measures
August 2011 41
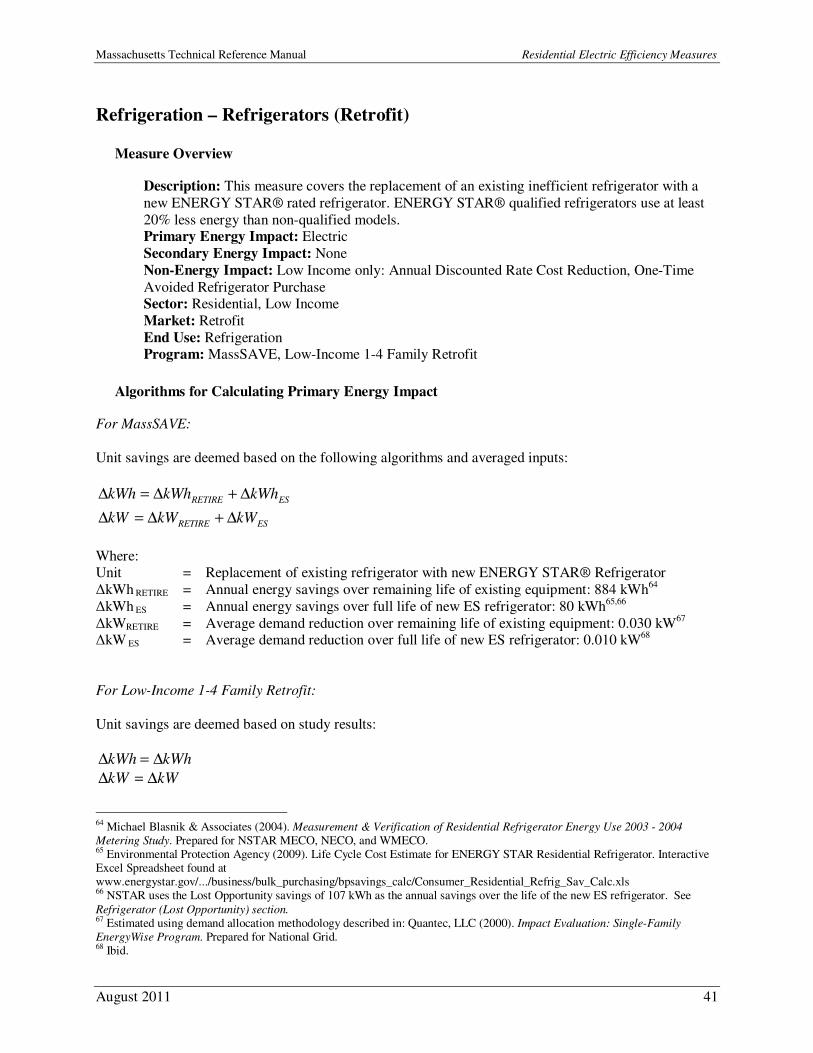
Refrigeration – Refrigerators (Retrofit)
Measure Overview
Description: This measure covers the replacement of an existing inefficient refrigerator with a
new ENERGY STAR® rated refrigerator. ENERGY STAR® qualified refrigerators use at least
20% less energy than non-qualified models. Primary Energy Impact: Electric
Secondary Energy Impact: None
Non-Energy Impact: Low Income only: Annual Discounted Rate Cost Reduction, One-Time
Avoided Refrigerator Purchase Sector: Residential, Low Income
Market: Retrofit
End Use: Refrigeration Program: MassSAVE, Low-Income 1-4 Family Retrofit
Algorithms for Calculating Primary Energy Impact
For MassSAVE:
Unit savings are deemed based on the following algorithms and averaged inputs:
ESRETIRE kWhkWhkWh ∆+∆=∆
ESRETIRE kWkWkW ∆+∆=∆
Where: Unit = Replacement of existing refrigerator with new ENERGY STAR® Refrigerator
∆kWh RETIRE = Annual energy savings over remaining life of existing equipment: 884 kWh64
∆kWh ES = Annual energy savings over full life of new ES refrigerator: 80 kWh65,66
∆kWRETIRE = Average demand reduction over remaining life of existing equipment: 0.030 kW67
∆kW ES = Average demand reduction over full life of new ES refrigerator: 0.010 kW
68
For Low-Income 1-4 Family Retrofit:
Unit savings are deemed based on study results:
kWhkWh ∆=∆
kWkW ∆=∆
64 Michael Blasnik & Associates (2004). Measurement & Verification of Residential Refrigerator Energy Use 2003 - 2004
Metering Study. Prepared for NSTAR MECO, NECO, and WMECO. 65 Environmental Protection Agency (2009). Life Cycle Cost Estimate for ENERGY STAR Residential Refrigerator. Interactive Excel Spreadsheet found at www.energystar.gov/.../business/bulk_purchasing/bpsavings_calc/Consumer_Residential_Refrig_Sav_Calc.xls 66 NSTAR uses the Lost Opportunity savings of 107 kWh as the annual savings over the life of the new ES refrigerator. See
Refrigerator (Lost Opportunity) section. 67 Estimated using demand allocation methodology described in: Quantec, LLC (2000). Impact Evaluation: Single-Family
EnergyWise Program. Prepared for National Grid. 68 Ibid.

Massachusetts Technical Reference Manual Residential Electric Efficiency Measures
August 2011 42
Where: Unit = Removal of existing refrigerator and installation of new efficient refrigerator
∆kWh = Average annual kWh savings per unit: 1,122 kWh69
∆kW = Max kW Reduction: 0.148 kW70
Baseline Efficiency
For MassSAVE:
The baseline efficiency case is an existing refrigerator for savings over the remaining life of existing
equipment. The baseline efficiency case is a full-sized refrigerator (7.75 cubic feet) that meets the
Federal minimum standard for energy efficiency for savings for the full life.71
For Low-Income 1-4 Family Retrofit:
The baseline efficiency case for both the replaced and baseline new refrigerator is an existing refrigerator.
It is assumed that low-income customers would otherwise replace their refrigerators with a used inefficient unit.
High Efficiency
The high efficiency case is an ENERGY STAR® rated refrigerator that meets the ENERGY STAR®
criteria for full-sized refrigerators (7.75 cubic feet), using at least 20% less energy than models meeting
the minimum Federal government standard.
Hours
Savings are based on 8,760 operating hours per year.
Measure Life
For MassSAVE the remaining life of the existing refrigerator is 1 year, and the measure life for the new
refrigerator is 12 years. 72
For Low-Income 1-4 Family Retrofit the measure life is 19 years.73
Secondary Energy Impacts
There are no secondary energy impacts for this measure.
69 Cadmus Group, Inc. (2009). Impact Evaluation of the 2007 Appliance Management Program and Low Income Weatherization
Program. Prepared for National Grid; Page 5, Table 1. 70 Estimated using demand allocation methodology described in: Quantec, LLC (2000). Impact Evaluation: Single-Family
EnergyWise Program. Prepared for National Grid. 71 Home: ENERGY STAR (2008). ENERGY STAR Refrigerators & Freezers Key Product Criteria. http://www.energystar.gov/index.cfm?c=refrig.pr_crit_refrigerators. Accessed 10/11/10. 72
Environmental Protection Agency (2009). Life Cycle Cost Estimate for ENERGY STAR Residential Refrigerator. Interactive
Excel Spreadsheet found at www.energystar.gov/.../business/bulk_purchasing/bpsavings_calc/Consumer_Residential_Refrig_Sav_Calc.xls. 73 Massachusetts Common Assumption.
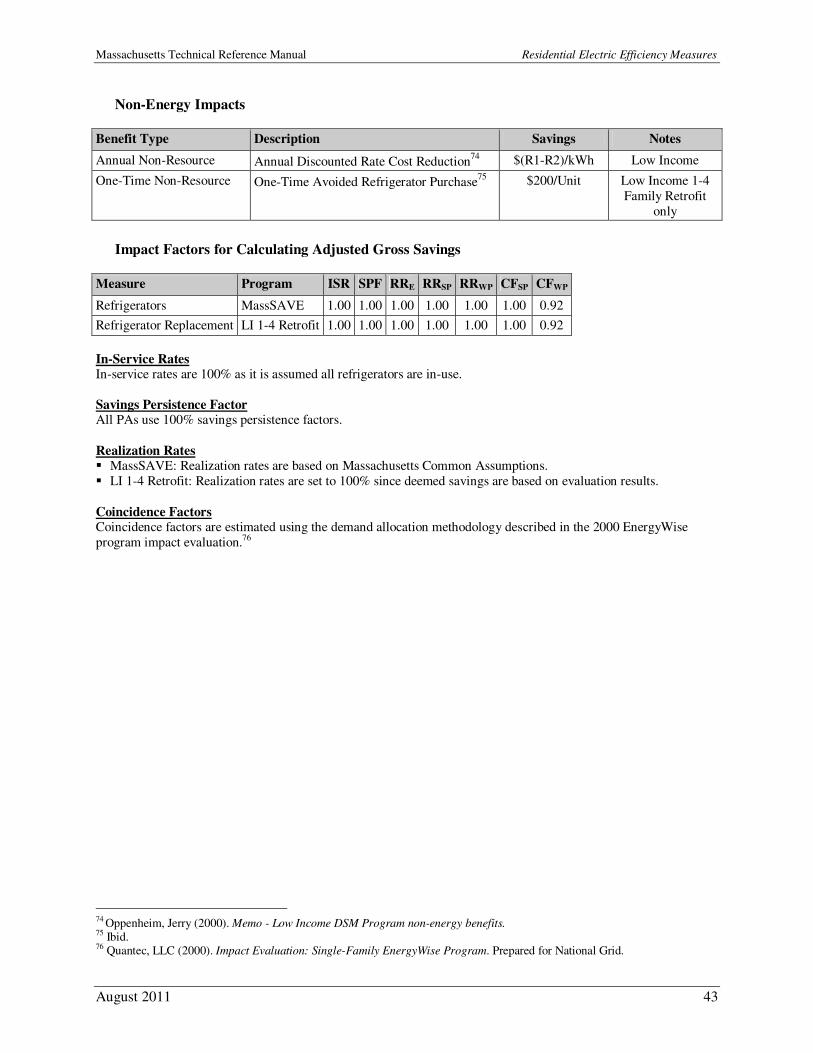
Massachusetts Technical Reference Manual Residential Electric Efficiency Measures
August 2011 43
Non-Energy Impacts
Benefit Type Description Savings Notes
Annual Non-Resource Annual Discounted Rate Cost Reduction74
$(R1-R2)/kWh Low Income
One-Time Non-Resource One-Time Avoided Refrigerator Purchase75
$200/Unit Low Income 1-4
Family Retrofit
only
Impact Factors for Calculating Adjusted Gross Savings
Measure Program ISR SPF RRE RRSP RRWP CFSP CFWP
Refrigerators MassSAVE 1.00 1.00 1.00 1.00 1.00 1.00 0.92
Refrigerator Replacement LI 1-4 Retrofit 1.00 1.00 1.00 1.00 1.00 1.00 0.92
In-Service Rates In-service rates are 100% as it is assumed all refrigerators are in-use.
Savings Persistence Factor All PAs use 100% savings persistence factors.
Realization Rates � MassSAVE: Realization rates are based on Massachusetts Common Assumptions.
� LI 1-4 Retrofit: Realization rates are set to 100% since deemed savings are based on evaluation results.
Coincidence Factors Coincidence factors are estimated using the demand allocation methodology described in the 2000 EnergyWise
program impact evaluation.76
74 Oppenheim, Jerry (2000). Memo - Low Income DSM Program non-energy benefits. 75 Ibid. 76 Quantec, LLC (2000). Impact Evaluation: Single-Family EnergyWise Program. Prepared for National Grid.
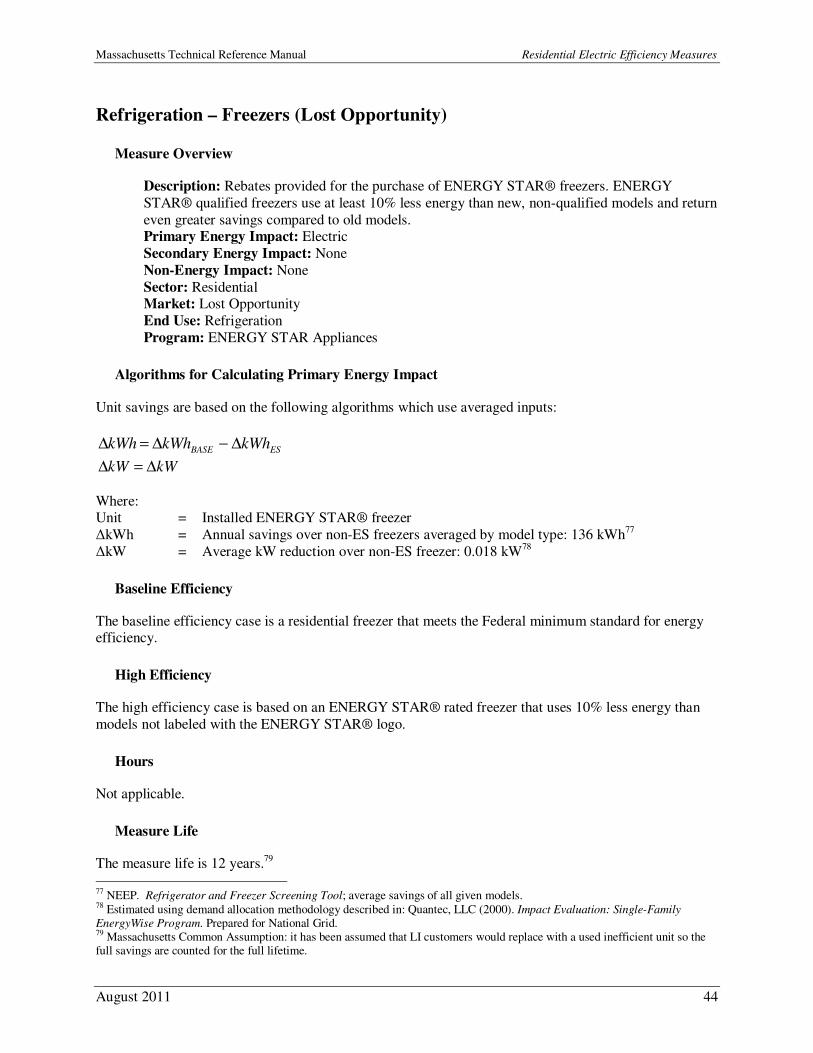
Massachusetts Technical Reference Manual Residential Electric Efficiency Measures
August 2011 44
Refrigeration – Freezers (Lost Opportunity)
Measure Overview
Description: Rebates provided for the purchase of ENERGY STAR® freezers. ENERGY
STAR® qualified freezers use at least 10% less energy than new, non-qualified models and return
even greater savings compared to old models. Primary Energy Impact: Electric
Secondary Energy Impact: None
Non-Energy Impact: None
Sector: Residential Market: Lost Opportunity
End Use: Refrigeration
Program: ENERGY STAR Appliances
Algorithms for Calculating Primary Energy Impact
Unit savings are based on the following algorithms which use averaged inputs:
ESBASE kWhkWhkWh ∆−∆=∆
kWkW ∆=∆
Where: Unit = Installed ENERGY STAR® freezer
∆kWh = Annual savings over non-ES freezers averaged by model type: 136 kWh77
∆kW = Average kW reduction over non-ES freezer: 0.018 kW78
Baseline Efficiency
The baseline efficiency case is a residential freezer that meets the Federal minimum standard for energy efficiency.
High Efficiency
The high efficiency case is based on an ENERGY STAR® rated freezer that uses 10% less energy than
models not labeled with the ENERGY STAR® logo.
Hours
Not applicable.
Measure Life
The measure life is 12 years.79
77 NEEP. Refrigerator and Freezer Screening Tool; average savings of all given models. 78 Estimated using demand allocation methodology described in: Quantec, LLC (2000). Impact Evaluation: Single-Family
EnergyWise Program. Prepared for National Grid. 79 Massachusetts Common Assumption: it has been assumed that LI customers would replace with a used inefficient unit so the full savings are counted for the full lifetime.

Massachusetts Technical Reference Manual Residential Electric Efficiency Measures
August 2011 45
Secondary Energy Impacts
There are no secondary energy impacts for this measure.
Non-Energy Impact
There are no non-energy impacts for this measure.
Impact Factors for Calculating Adjusted Gross Savings
Measure Name Program ISR SPF RRE RRSP RRWP CFSP CFWP
Freezer Rebate ES Appliances 1.00 1.00 1.00 1.00 1.00 1.00 0.92
In-Service Rates In-service rates are set to 100% based on the assumption that all purchased units are installed.
Savings Persistence Factor All PAs use 100% savings persistence factors.
Realization Rates Realization rates are based on Massachusetts Common Assumptions.
Coincidence Factors Coincidence factors are based on Massachusetts Common Assumptions.

Massachusetts Technical Reference Manual Residential Electric Efficiency Measures
August 2011 46
Refrigeration – Freezers (Retrofit)
Measure Overview
Description: This measure covers the replacement of an existing inefficient freezer with a new
energy efficient model.
Primary Energy Impact: Electric Secondary Energy Impact: None
Non-Energy Impact: Low Income only: Annual Discounted Rate Cost Reduction, One-Time
Avoided Refrigerator Purchase
Sector: Low Income Market: Retrofit
End Use: Refrigeration
Program: Low-Income 1-4 Family Retrofit
Algorithms for Calculating Primary Energy Impact
Unit savings are deemed based on study results:
kWhkWh ∆=∆
kWkW ∆=∆
Where:
Unit = Removal of existing freezer and installation of new efficient freezer
∆kWh = Average annual kWh savings per unit: 637 kWh80
∆kW = Max kW Reduction: 0.084 kW81
Baseline Efficiency
The baseline efficiency case for both the replaced and baseline new freezer is represented by the existing
freezer. It is assumed that low-income customers would replace their freezers with a used inefficient unit.
High Efficiency
The high efficiency case is a new high efficiency freezer.
Hours
Not applicable.
Measure Life
The measure life is 19 years.82
80 Cadmus Group, Inc. (2009). Impact Evaluation of the 2007 Appliance Management Program and Low Income Weatherization
Program. Prepared for National Grid; Page 5, Table 1. 81 Estimated using demand allocation methodology described in: Quantec, LLC (2000). Impact Evaluation: Single-Family
EnergyWise Program. Prepared for National Grid.
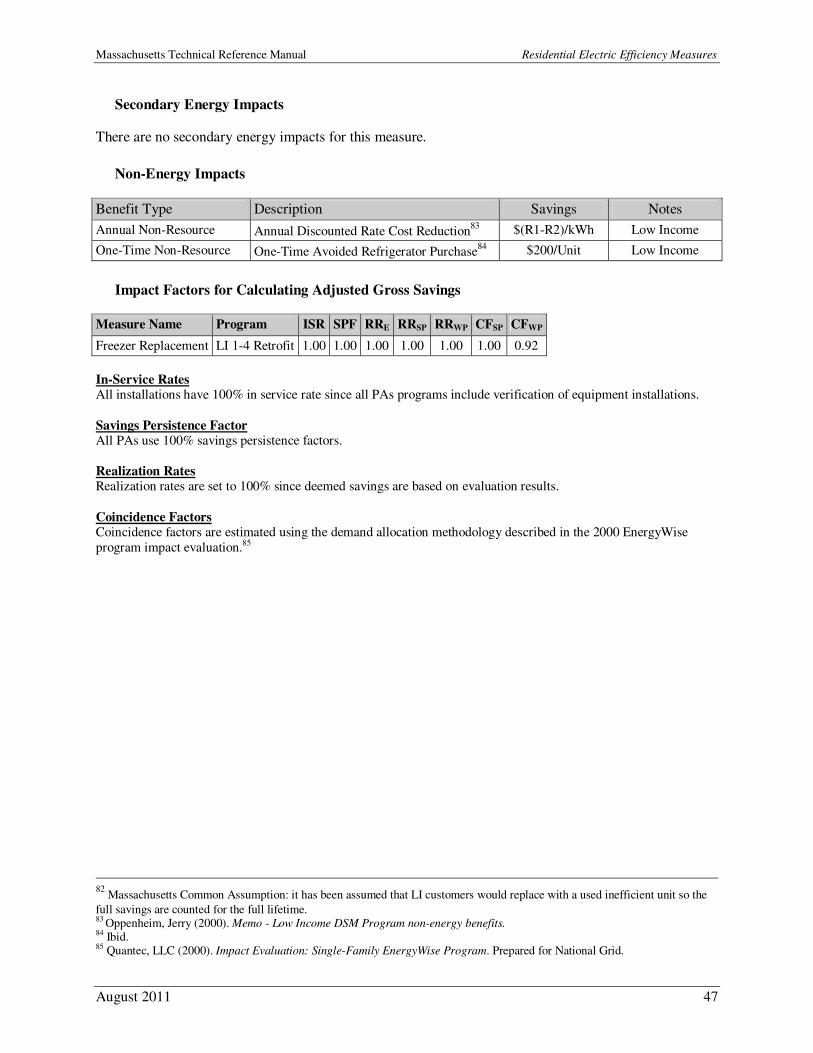
Massachusetts Technical Reference Manual Residential Electric Efficiency Measures
August 2011 47
Secondary Energy Impacts
There are no secondary energy impacts for this measure.
Non-Energy Impacts
Benefit Type Description Savings Notes
Annual Non-Resource Annual Discounted Rate Cost Reduction83
$(R1-R2)/kWh Low Income
One-Time Non-Resource One-Time Avoided Refrigerator Purchase84
$200/Unit Low Income
Impact Factors for Calculating Adjusted Gross Savings
Measure Name Program ISR SPF RRE RRSP RRWP CFSP CFWP
Freezer Replacement LI 1-4 Retrofit 1.00 1.00 1.00 1.00 1.00 1.00 0.92
In-Service Rates All installations have 100% in service rate since all PAs programs include verification of equipment installations.
Savings Persistence Factor All PAs use 100% savings persistence factors.
Realization Rates Realization rates are set to 100% since deemed savings are based on evaluation results.
Coincidence Factors Coincidence factors are estimated using the demand allocation methodology described in the 2000 EnergyWise
program impact evaluation.85
82
Massachusetts Common Assumption: it has been assumed that LI customers would replace with a used inefficient unit so the
full savings are counted for the full lifetime. 83 Oppenheim, Jerry (2000). Memo - Low Income DSM Program non-energy benefits. 84 Ibid. 85 Quantec, LLC (2000). Impact Evaluation: Single-Family EnergyWise Program. Prepared for National Grid.
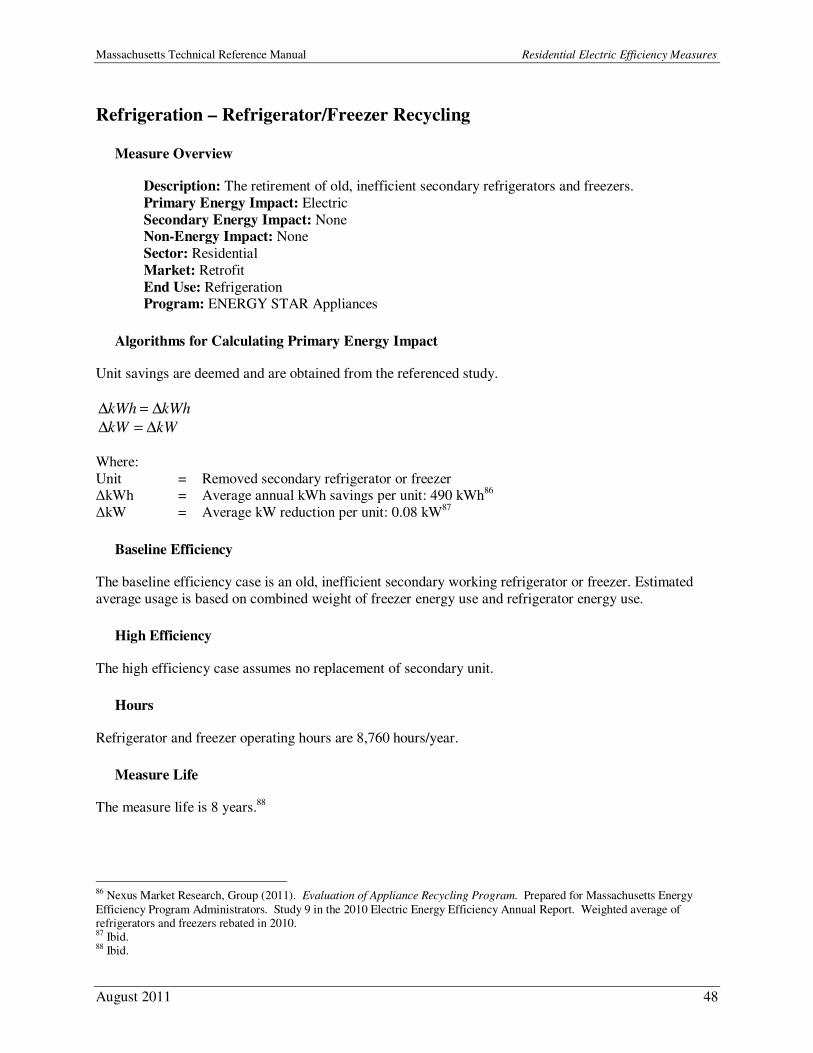
Massachusetts Technical Reference Manual Residential Electric Efficiency Measures
August 2011 48
Refrigeration – Refrigerator/Freezer Recycling
Measure Overview
Description: The retirement of old, inefficient secondary refrigerators and freezers.
Primary Energy Impact: Electric
Secondary Energy Impact: None Non-Energy Impact: None
Sector: Residential
Market: Retrofit
End Use: Refrigeration Program: ENERGY STAR Appliances
Algorithms for Calculating Primary Energy Impact
Unit savings are deemed and are obtained from the referenced study.
kWhkWh ∆=∆
kWkW ∆=∆
Where:
Unit = Removed secondary refrigerator or freezer ∆kWh = Average annual kWh savings per unit: 490 kWh
86
∆kW = Average kW reduction per unit: 0.08 kW87
Baseline Efficiency
The baseline efficiency case is an old, inefficient secondary working refrigerator or freezer. Estimated
average usage is based on combined weight of freezer energy use and refrigerator energy use.
High Efficiency
The high efficiency case assumes no replacement of secondary unit.
Hours
Refrigerator and freezer operating hours are 8,760 hours/year.
Measure Life
The measure life is 8 years.88
86 Nexus Market Research, Group (2011). Evaluation of Appliance Recycling Program. Prepared for Massachusetts Energy
Efficiency Program Administrators. Study 9 in the 2010 Electric Energy Efficiency Annual Report. Weighted average of refrigerators and freezers rebated in 2010. 87 Ibid. 88 Ibid.
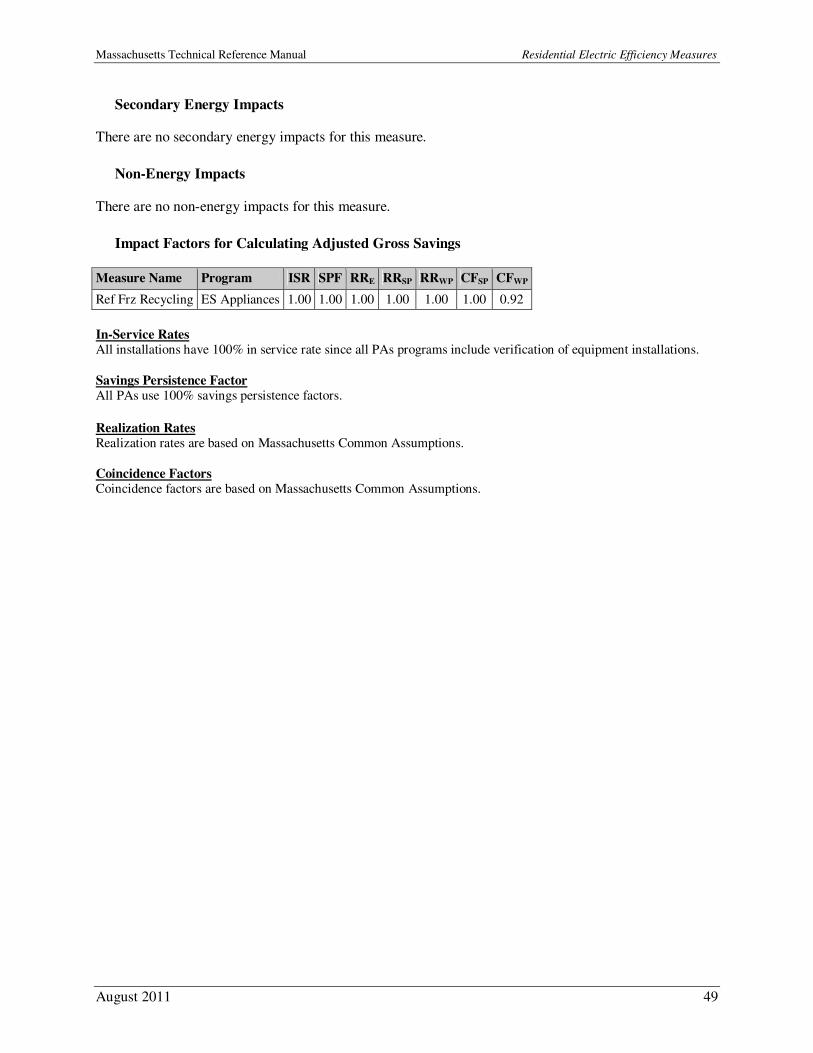
Massachusetts Technical Reference Manual Residential Electric Efficiency Measures
August 2011 49
Secondary Energy Impacts
There are no secondary energy impacts for this measure.
Non-Energy Impacts
There are no non-energy impacts for this measure.
Impact Factors for Calculating Adjusted Gross Savings
Measure Name Program ISR SPF RRE RRSP RRWP CFSP CFWP
Ref Frz Recycling ES Appliances 1.00 1.00 1.00 1.00 1.00 1.00 0.92
In-Service Rates All installations have 100% in service rate since all PAs programs include verification of equipment installations.
Savings Persistence Factor All PAs use 100% savings persistence factors.
Realization Rates Realization rates are based on Massachusetts Common Assumptions.
Coincidence Factors Coincidence factors are based on Massachusetts Common Assumptions.
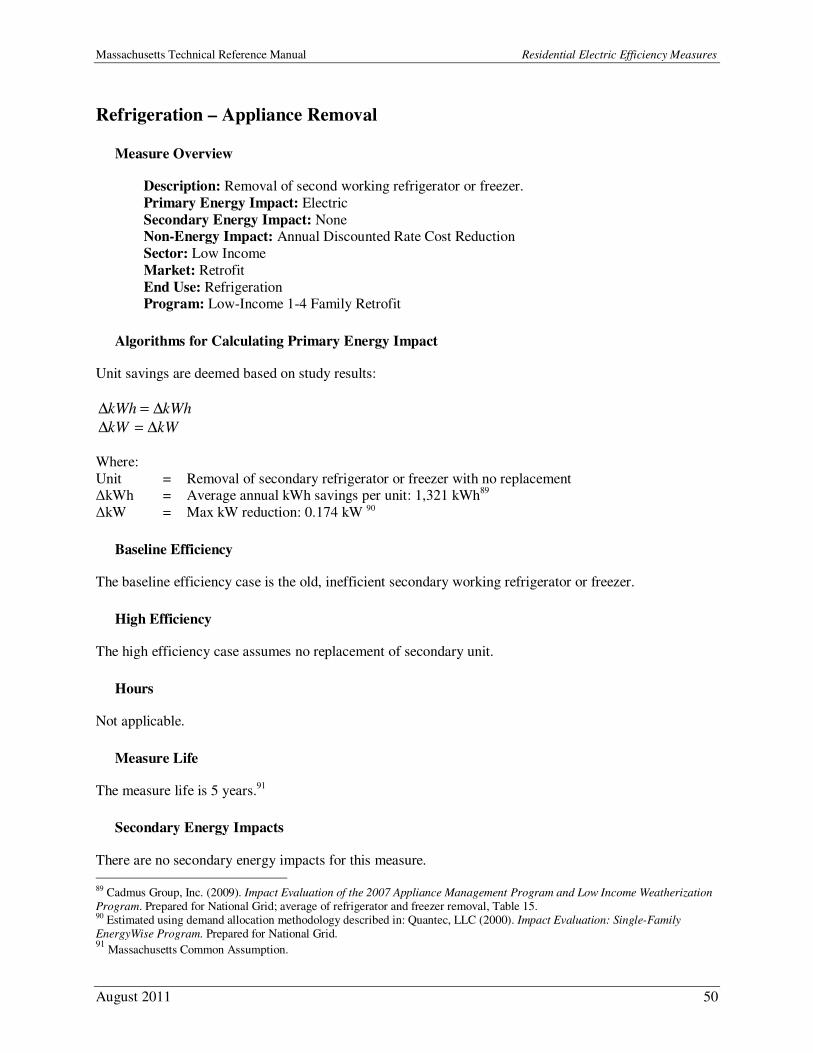
Massachusetts Technical Reference Manual Residential Electric Efficiency Measures
August 2011 50
Refrigeration – Appliance Removal
Measure Overview
Description: Removal of second working refrigerator or freezer.
Primary Energy Impact: Electric
Secondary Energy Impact: None Non-Energy Impact: Annual Discounted Rate Cost Reduction
Sector: Low Income
Market: Retrofit
End Use: Refrigeration Program: Low-Income 1-4 Family Retrofit
Algorithms for Calculating Primary Energy Impact
Unit savings are deemed based on study results:
kWhkWh ∆=∆
kWkW ∆=∆
Where:
Unit = Removal of secondary refrigerator or freezer with no replacement ∆kWh = Average annual kWh savings per unit: 1,321 kWh
89
∆kW = Max kW reduction: 0.174 kW 90
Baseline Efficiency
The baseline efficiency case is the old, inefficient secondary working refrigerator or freezer.
High Efficiency
The high efficiency case assumes no replacement of secondary unit.
Hours
Not applicable.
Measure Life
The measure life is 5 years.91
Secondary Energy Impacts
There are no secondary energy impacts for this measure.
89 Cadmus Group, Inc. (2009). Impact Evaluation of the 2007 Appliance Management Program and Low Income Weatherization
Program. Prepared for National Grid; average of refrigerator and freezer removal, Table 15. 90 Estimated using demand allocation methodology described in: Quantec, LLC (2000). Impact Evaluation: Single-Family
EnergyWise Program. Prepared for National Grid. 91
Massachusetts Common Assumption.
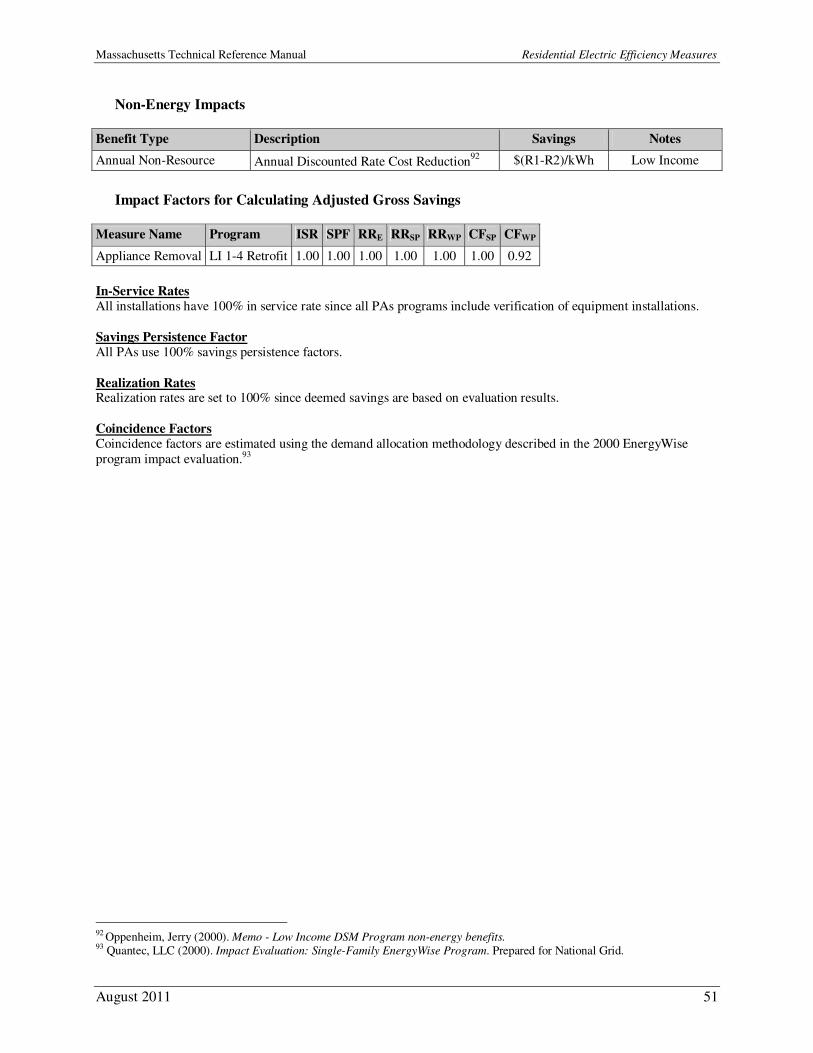
Massachusetts Technical Reference Manual Residential Electric Efficiency Measures
August 2011 51
Non-Energy Impacts
Benefit Type Description Savings Notes
Annual Non-Resource Annual Discounted Rate Cost Reduction92
$(R1-R2)/kWh Low Income
Impact Factors for Calculating Adjusted Gross Savings
Measure Name Program ISR SPF RRE RRSP RRWP CFSP CFWP
Appliance Removal LI 1-4 Retrofit 1.00 1.00 1.00 1.00 1.00 1.00 0.92
In-Service Rates All installations have 100% in service rate since all PAs programs include verification of equipment installations.
Savings Persistence Factor All PAs use 100% savings persistence factors.
Realization Rates Realization rates are set to 100% since deemed savings are based on evaluation results.
Coincidence Factors Coincidence factors are estimated using the demand allocation methodology described in the 2000 EnergyWise
program impact evaluation.93
92 Oppenheim, Jerry (2000). Memo - Low Income DSM Program non-energy benefits. 93 Quantec, LLC (2000). Impact Evaluation: Single-Family EnergyWise Program. Prepared for National Grid.
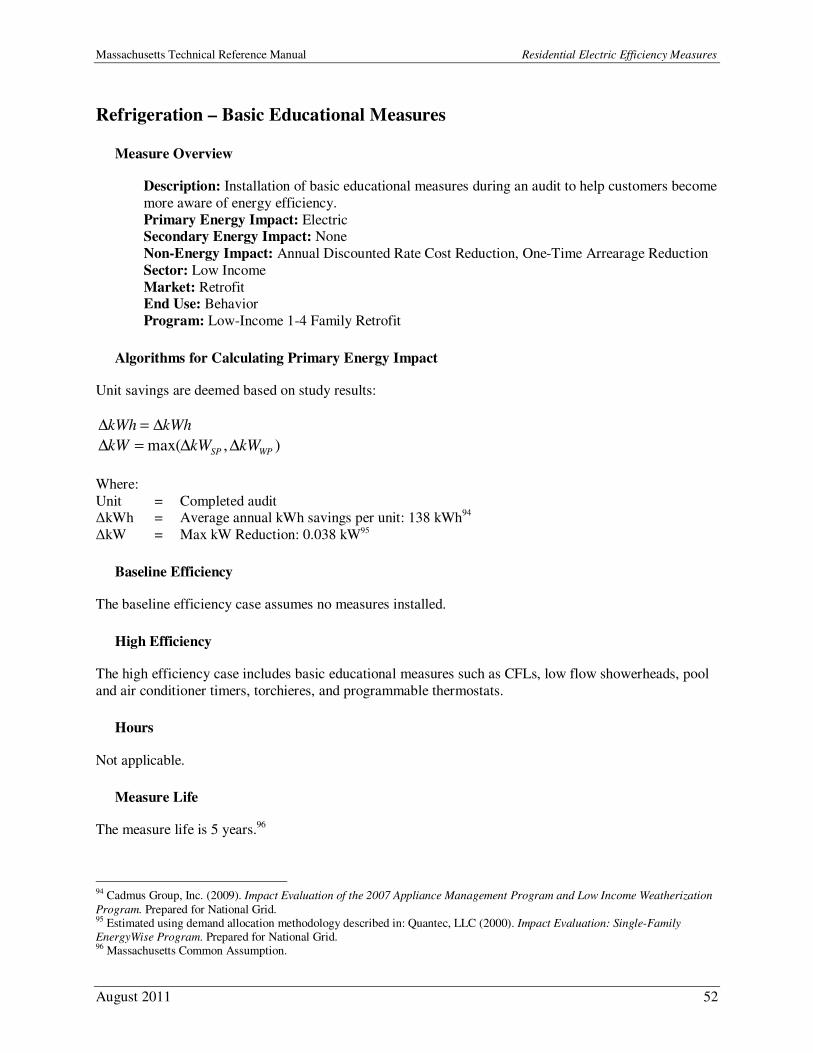
Massachusetts Technical Reference Manual Residential Electric Efficiency Measures
August 2011 52
Refrigeration – Basic Educational Measures
Measure Overview
Description: Installation of basic educational measures during an audit to help customers become
more aware of energy efficiency.
Primary Energy Impact: Electric Secondary Energy Impact: None
Non-Energy Impact: Annual Discounted Rate Cost Reduction, One-Time Arrearage Reduction
Sector: Low Income
Market: Retrofit End Use: Behavior
Program: Low-Income 1-4 Family Retrofit
Algorithms for Calculating Primary Energy Impact
Unit savings are deemed based on study results:
kWhkWh ∆=∆
),max( WPSP kWkWkW ∆∆=∆
Where:
Unit = Completed audit ∆kWh = Average annual kWh savings per unit: 138 kWh
94
∆kW = Max kW Reduction: 0.038 kW95
Baseline Efficiency
The baseline efficiency case assumes no measures installed.
High Efficiency
The high efficiency case includes basic educational measures such as CFLs, low flow showerheads, pool
and air conditioner timers, torchieres, and programmable thermostats.
Hours
Not applicable.
Measure Life
The measure life is 5 years.96
94 Cadmus Group, Inc. (2009). Impact Evaluation of the 2007 Appliance Management Program and Low Income Weatherization
Program. Prepared for National Grid. 95 Estimated using demand allocation methodology described in: Quantec, LLC (2000). Impact Evaluation: Single-Family
EnergyWise Program. Prepared for National Grid. 96 Massachusetts Common Assumption.
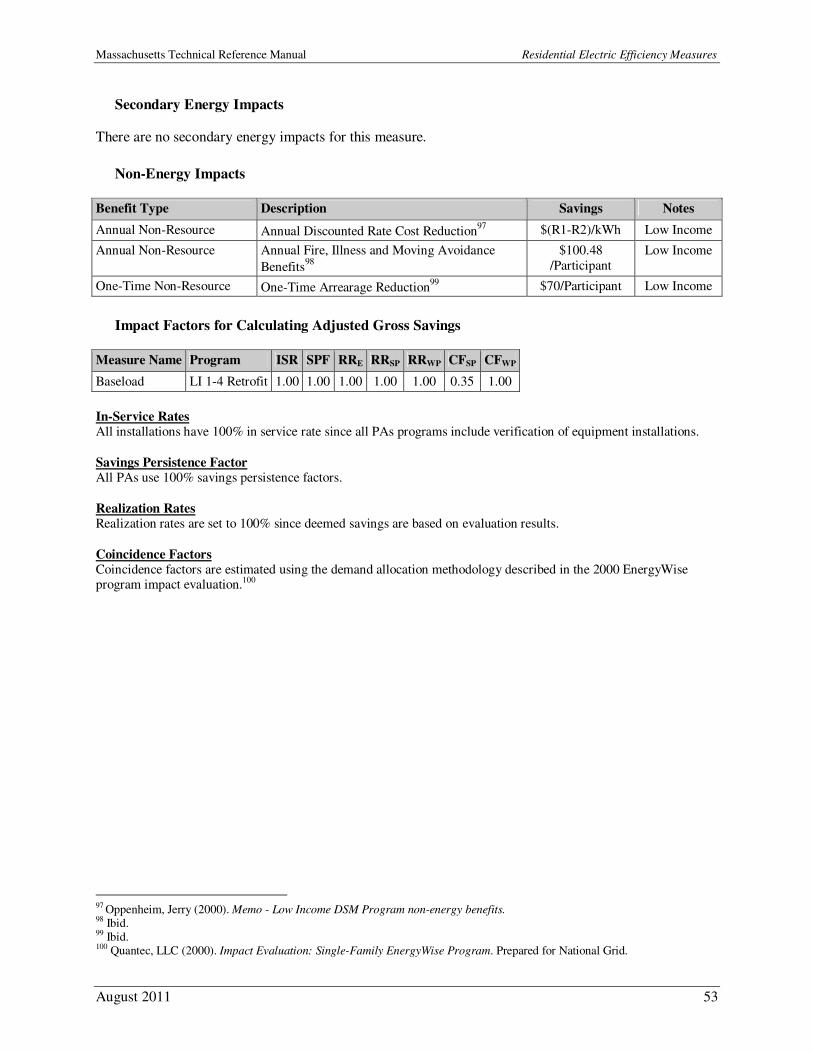
Massachusetts Technical Reference Manual Residential Electric Efficiency Measures
August 2011 53
Secondary Energy Impacts
There are no secondary energy impacts for this measure.
Non-Energy Impacts
Benefit Type Description Savings Notes
Annual Non-Resource Annual Discounted Rate Cost Reduction97
$(R1-R2)/kWh Low Income
Annual Non-Resource Annual Fire, Illness and Moving Avoidance
Benefits98
$100.48
/Participant
Low Income
One-Time Non-Resource One-Time Arrearage Reduction99
$70/Participant Low Income
Impact Factors for Calculating Adjusted Gross Savings
Measure Name Program ISR SPF RRE RRSP RRWP CFSP CFWP
Baseload LI 1-4 Retrofit 1.00 1.00 1.00 1.00 1.00 0.35 1.00
In-Service Rates All installations have 100% in service rate since all PAs programs include verification of equipment installations.
Savings Persistence Factor All PAs use 100% savings persistence factors.
Realization Rates Realization rates are set to 100% since deemed savings are based on evaluation results.
Coincidence Factors Coincidence factors are estimated using the demand allocation methodology described in the 2000 EnergyWise program impact evaluation.100
97 Oppenheim, Jerry (2000). Memo - Low Income DSM Program non-energy benefits. 98 Ibid. 99 Ibid. 100 Quantec, LLC (2000). Impact Evaluation: Single-Family EnergyWise Program. Prepared for National Grid.
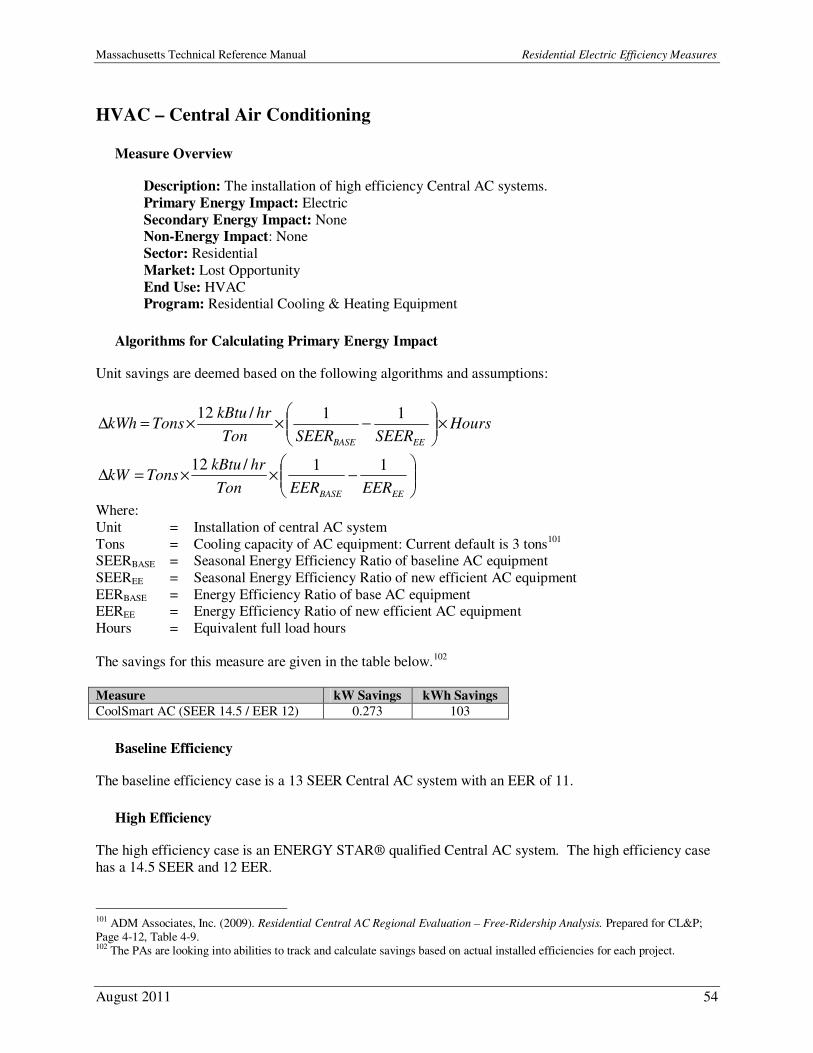
Massachusetts Technical Reference Manual Residential Electric Efficiency Measures
August 2011 54
HVAC – Central Air Conditioning
Measure Overview
Description: The installation of high efficiency Central AC systems.
Primary Energy Impact: Electric
Secondary Energy Impact: None Non-Energy Impact: None
Sector: Residential
Market: Lost Opportunity
End Use: HVAC Program: Residential Cooling & Heating Equipment
Algorithms for Calculating Primary Energy Impact
Unit savings are deemed based on the following algorithms and assumptions:
HoursSEERSEERTon
hrkBtuTonskWh
EEBASE
×
−××=∆
11/12
−××=∆
EEBASE EEREERTon
hrkBtuTonskW
11/12
Where:
Unit = Installation of central AC system
Tons = Cooling capacity of AC equipment: Current default is 3 tons101
SEERBASE = Seasonal Energy Efficiency Ratio of baseline AC equipment
SEEREE = Seasonal Energy Efficiency Ratio of new efficient AC equipment
EERBASE = Energy Efficiency Ratio of base AC equipment EEREE = Energy Efficiency Ratio of new efficient AC equipment
Hours = Equivalent full load hours
The savings for this measure are given in the table below.
102
Measure kW Savings kWh Savings
CoolSmart AC (SEER 14.5 / EER 12) 0.273 103
Baseline Efficiency
The baseline efficiency case is a 13 SEER Central AC system with an EER of 11.
High Efficiency
The high efficiency case is an ENERGY STAR® qualified Central AC system. The high efficiency case
has a 14.5 SEER and 12 EER.
101 ADM Associates, Inc. (2009). Residential Central AC Regional Evaluation – Free-Ridership Analysis. Prepared for CL&P; Page 4-12, Table 4-9. 102 The PAs are looking into abilities to track and calculate savings based on actual installed efficiencies for each project.
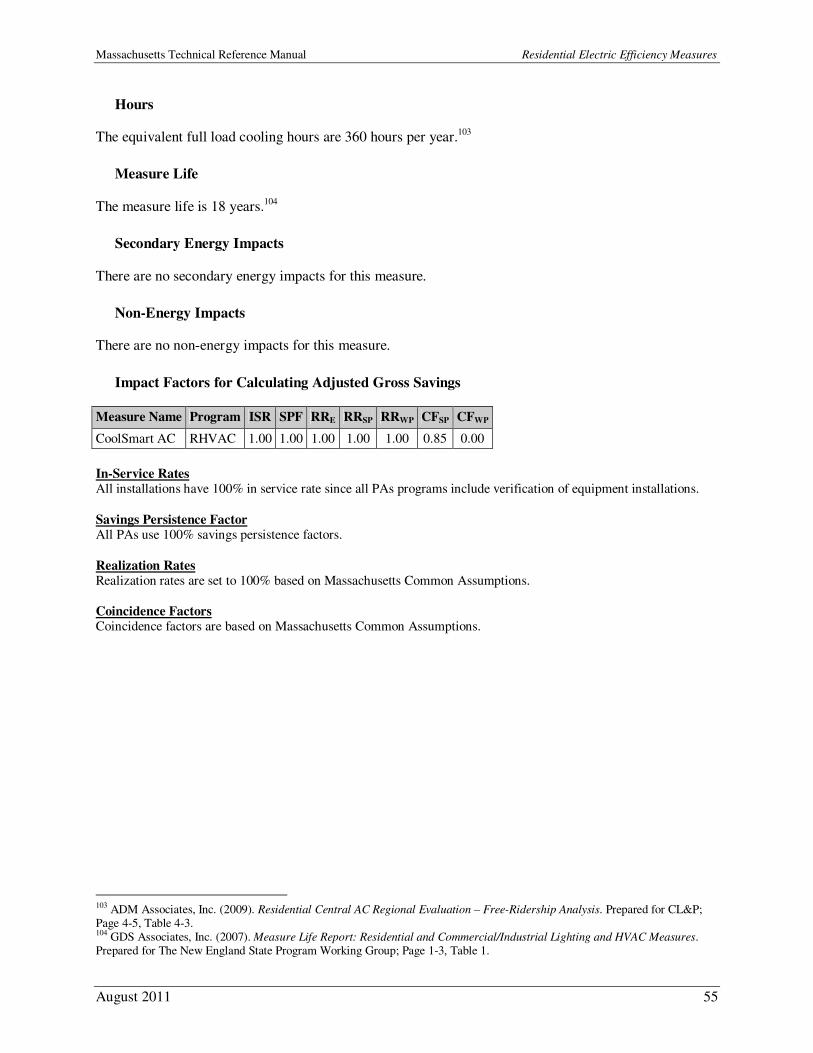
Massachusetts Technical Reference Manual Residential Electric Efficiency Measures
August 2011 55
Hours
The equivalent full load cooling hours are 360 hours per year.103
Measure Life
The measure life is 18 years.104
Secondary Energy Impacts
There are no secondary energy impacts for this measure.
Non-Energy Impacts
There are no non-energy impacts for this measure.
Impact Factors for Calculating Adjusted Gross Savings
Measure Name Program ISR SPF RRE RRSP RRWP CFSP CFWP
CoolSmart AC RHVAC 1.00 1.00 1.00 1.00 1.00 0.85 0.00
In-Service Rates All installations have 100% in service rate since all PAs programs include verification of equipment installations.
Savings Persistence Factor All PAs use 100% savings persistence factors.
Realization Rates Realization rates are set to 100% based on Massachusetts Common Assumptions.
Coincidence Factors Coincidence factors are based on Massachusetts Common Assumptions.
103 ADM Associates, Inc. (2009). Residential Central AC Regional Evaluation – Free-Ridership Analysis. Prepared for CL&P; Page 4-5, Table 4-3. 104 GDS Associates, Inc. (2007). Measure Life Report: Residential and Commercial/Industrial Lighting and HVAC Measures. Prepared for The New England State Program Working Group; Page 1-3, Table 1.
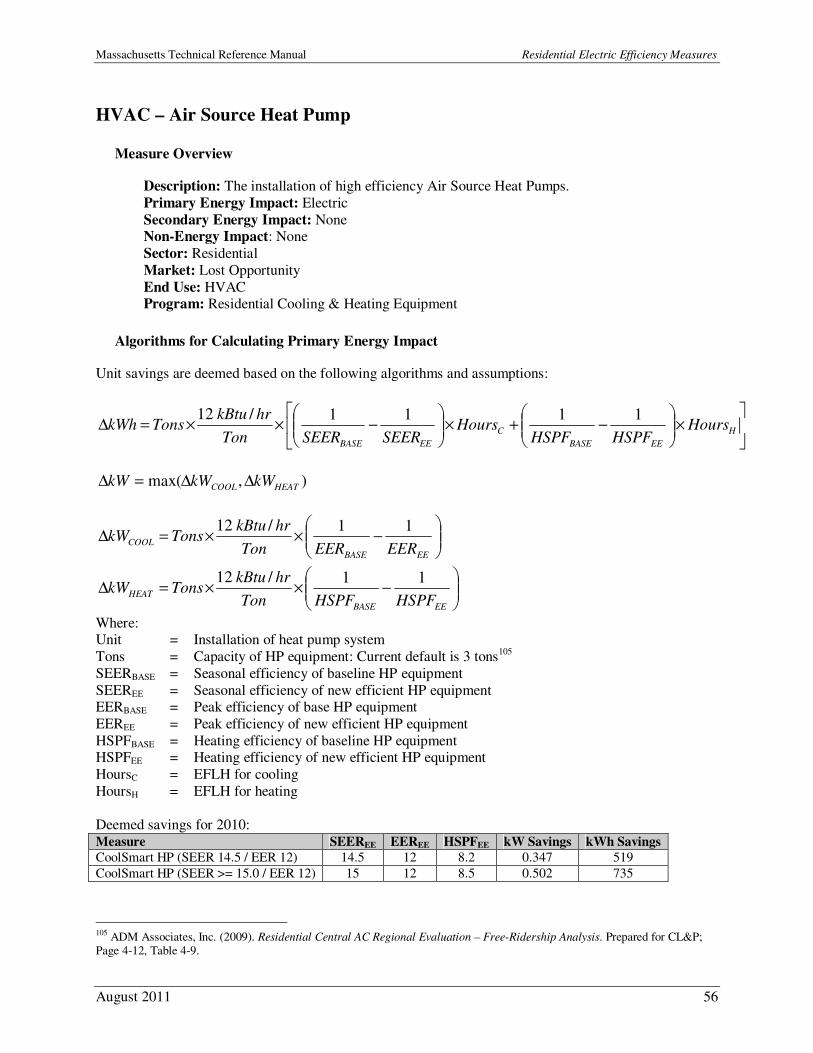
Massachusetts Technical Reference Manual Residential Electric Efficiency Measures
August 2011 56
HVAC – Air Source Heat Pump
Measure Overview
Description: The installation of high efficiency Air Source Heat Pumps.
Primary Energy Impact: Electric
Secondary Energy Impact: None Non-Energy Impact: None
Sector: Residential
Market: Lost Opportunity
End Use: HVAC Program: Residential Cooling & Heating Equipment
Algorithms for Calculating Primary Energy Impact
Unit savings are deemed based on the following algorithms and assumptions:
×
−+×
−××=∆ H
EEBASE
C
EEBASE
HoursHSPFHSPF
HoursSEERSEERTon
hrkBtuTonskWh
1111/12
),max( HEATCOOL kWkWkW ∆∆=∆
−××=∆
EEBASE
COOLEEREERTon
hrkBtuTonskW
11/12
−××=∆
EEBASE
HEATHSPFHSPFTon
hrkBtuTonskW
11/12
Where: Unit = Installation of heat pump system
Tons = Capacity of HP equipment: Current default is 3 tons105
SEERBASE = Seasonal efficiency of baseline HP equipment
SEEREE = Seasonal efficiency of new efficient HP equipment EERBASE = Peak efficiency of base HP equipment
EEREE = Peak efficiency of new efficient HP equipment
HSPFBASE = Heating efficiency of baseline HP equipment HSPFEE = Heating efficiency of new efficient HP equipment
HoursC = EFLH for cooling
HoursH = EFLH for heating
Deemed savings for 2010: Measure SEEREE EEREE HSPFEE kW Savings kWh Savings
CoolSmart HP (SEER 14.5 / EER 12) 14.5 12 8.2 0.347 519
CoolSmart HP (SEER >= 15.0 / EER 12) 15 12 8.5 0.502 735
105 ADM Associates, Inc. (2009). Residential Central AC Regional Evaluation – Free-Ridership Analysis. Prepared for CL&P; Page 4-12, Table 4-9.
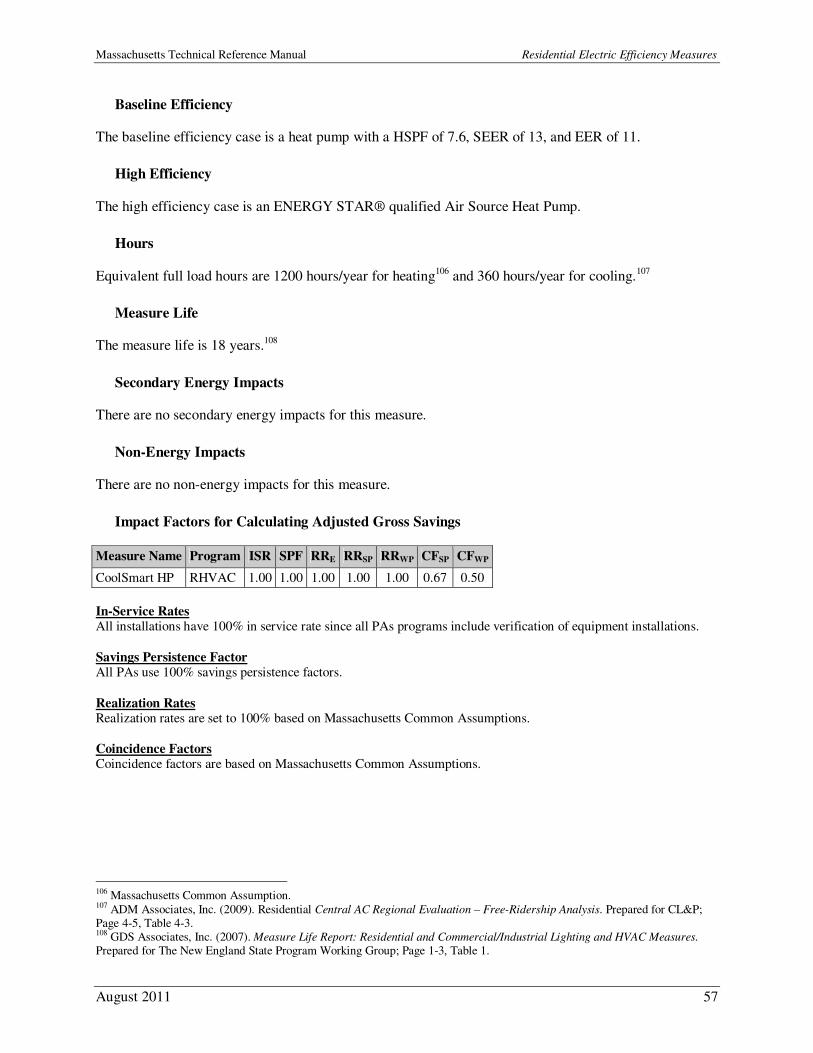
Massachusetts Technical Reference Manual Residential Electric Efficiency Measures
August 2011 57
Baseline Efficiency
The baseline efficiency case is a heat pump with a HSPF of 7.6, SEER of 13, and EER of 11.
High Efficiency
The high efficiency case is an ENERGY STAR® qualified Air Source Heat Pump.
Hours
Equivalent full load hours are 1200 hours/year for heating106
and 360 hours/year for cooling.107
Measure Life
The measure life is 18 years.108
Secondary Energy Impacts
There are no secondary energy impacts for this measure.
Non-Energy Impacts
There are no non-energy impacts for this measure.
Impact Factors for Calculating Adjusted Gross Savings
Measure Name Program ISR SPF RRE RRSP RRWP CFSP CFWP
CoolSmart HP RHVAC 1.00 1.00 1.00 1.00 1.00 0.67 0.50
In-Service Rates All installations have 100% in service rate since all PAs programs include verification of equipment installations.
Savings Persistence Factor All PAs use 100% savings persistence factors.
Realization Rates Realization rates are set to 100% based on Massachusetts Common Assumptions.
Coincidence Factors Coincidence factors are based on Massachusetts Common Assumptions.
106 Massachusetts Common Assumption. 107 ADM Associates, Inc. (2009). Residential Central AC Regional Evaluation – Free-Ridership Analysis. Prepared for CL&P; Page 4-5, Table 4-3. 108 GDS Associates, Inc. (2007). Measure Life Report: Residential and Commercial/Industrial Lighting and HVAC Measures.
Prepared for The New England State Program Working Group; Page 1-3, Table 1.
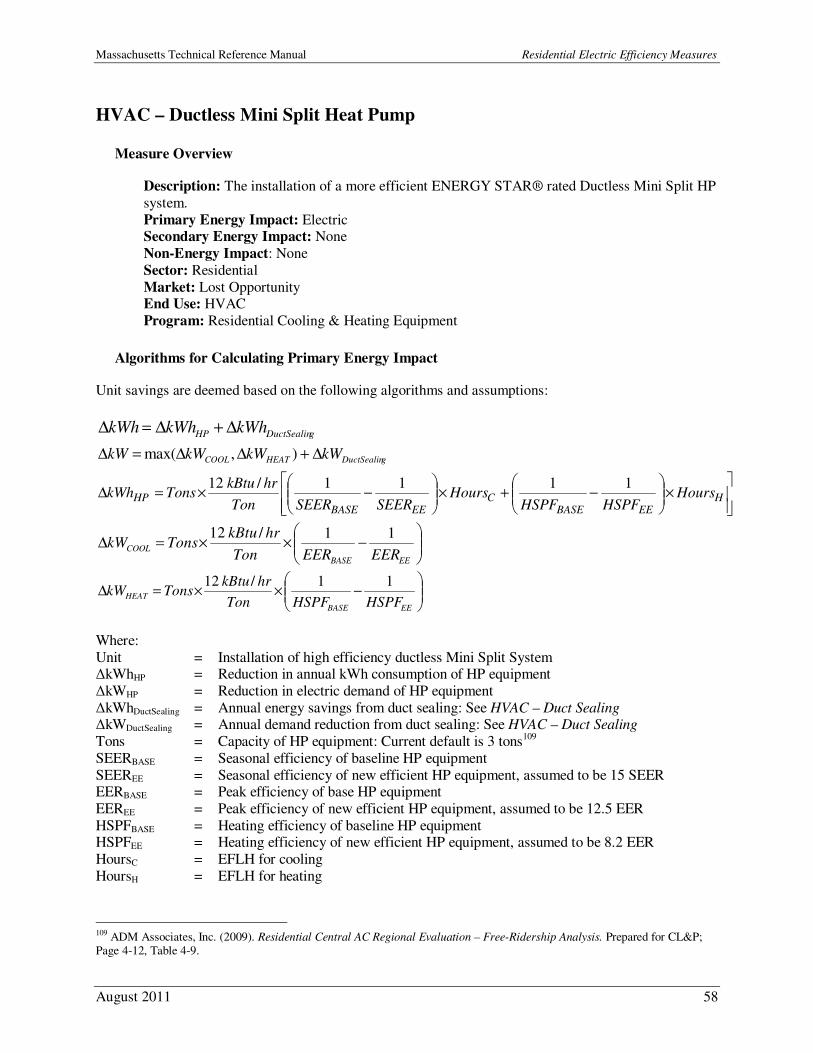
Massachusetts Technical Reference Manual Residential Electric Efficiency Measures
August 2011 58
HVAC – Ductless Mini Split Heat Pump
Measure Overview
Description: The installation of a more efficient ENERGY STAR® rated Ductless Mini Split HP
system.
Primary Energy Impact: Electric Secondary Energy Impact: None
Non-Energy Impact: None
Sector: Residential
Market: Lost Opportunity End Use: HVAC
Program: Residential Cooling & Heating Equipment
Algorithms for Calculating Primary Energy Impact
Unit savings are deemed based on the following algorithms and assumptions:
gDuctSealinHP kWhkWhkWh ∆+∆=∆
gDuctSealinHEATCOOL kWkWkWkW ∆+∆∆=∆ ),max(
×
−+×
−×=∆ H
EEBASEC
EEBASEHP Hours
HSPFHSPFHours
SEERSEERTon
hrkBtuTonskWh
1111/12
−××=∆
EEBASE
COOLEEREERTon
hrkBtuTonskW
11/12
−××=∆
EEBASE
HEATHSPFHSPFTon
hrkBtuTonskW
11/12
Where:
Unit = Installation of high efficiency ductless Mini Split System ∆kWhHP = Reduction in annual kWh consumption of HP equipment
∆kWHP = Reduction in electric demand of HP equipment
∆kWhDuctSealing = Annual energy savings from duct sealing: See HVAC – Duct Sealing ∆kWDuctSealing = Annual demand reduction from duct sealing: See HVAC – Duct Sealing
Tons = Capacity of HP equipment: Current default is 3 tons109
SEERBASE = Seasonal efficiency of baseline HP equipment
SEEREE = Seasonal efficiency of new efficient HP equipment, assumed to be 15 SEER EERBASE = Peak efficiency of base HP equipment
EEREE = Peak efficiency of new efficient HP equipment, assumed to be 12.5 EER
HSPFBASE = Heating efficiency of baseline HP equipment HSPFEE = Heating efficiency of new efficient HP equipment, assumed to be 8.2 EER
HoursC = EFLH for cooling
HoursH = EFLH for heating
109 ADM Associates, Inc. (2009). Residential Central AC Regional Evaluation – Free-Ridership Analysis. Prepared for CL&P; Page 4-12, Table 4-9.
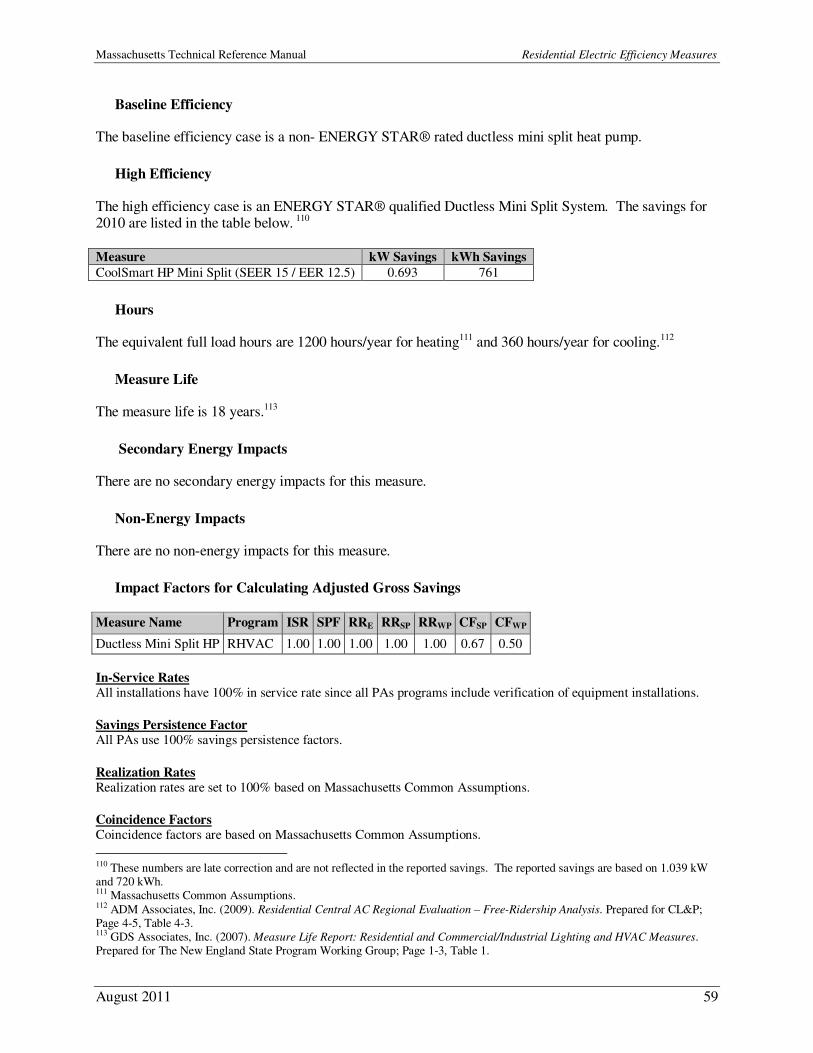
Massachusetts Technical Reference Manual Residential Electric Efficiency Measures
August 2011 59
Baseline Efficiency
The baseline efficiency case is a non- ENERGY STAR® rated ductless mini split heat pump.
High Efficiency
The high efficiency case is an ENERGY STAR® qualified Ductless Mini Split System. The savings for 2010 are listed in the table below. 110
Measure kW Savings kWh Savings
CoolSmart HP Mini Split (SEER 15 / EER 12.5) 0.693 761
Hours
The equivalent full load hours are 1200 hours/year for heating111 and 360 hours/year for cooling.112
Measure Life
The measure life is 18 years.113
Secondary Energy Impacts
There are no secondary energy impacts for this measure.
Non-Energy Impacts
There are no non-energy impacts for this measure.
Impact Factors for Calculating Adjusted Gross Savings
Measure Name Program ISR SPF RRE RRSP RRWP CFSP CFWP
Ductless Mini Split HP RHVAC 1.00 1.00 1.00 1.00 1.00 0.67 0.50
In-Service Rates All installations have 100% in service rate since all PAs programs include verification of equipment installations.
Savings Persistence Factor All PAs use 100% savings persistence factors.
Realization Rates Realization rates are set to 100% based on Massachusetts Common Assumptions.
Coincidence Factors Coincidence factors are based on Massachusetts Common Assumptions.
110 These numbers are late correction and are not reflected in the reported savings. The reported savings are based on 1.039 kW and 720 kWh. 111 Massachusetts Common Assumptions. 112 ADM Associates, Inc. (2009). Residential Central AC Regional Evaluation – Free-Ridership Analysis. Prepared for CL&P; Page 4-5, Table 4-3. 113 GDS Associates, Inc. (2007). Measure Life Report: Residential and Commercial/Industrial Lighting and HVAC Measures. Prepared for The New England State Program Working Group; Page 1-3, Table 1.
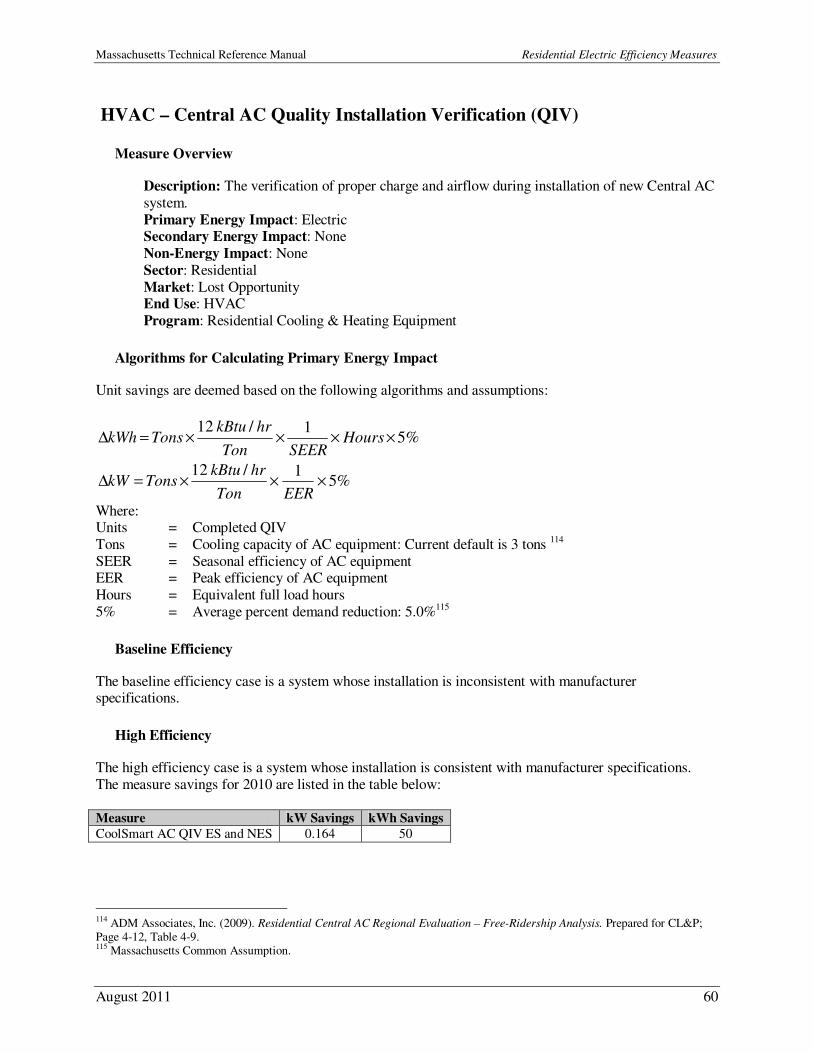
Massachusetts Technical Reference Manual Residential Electric Efficiency Measures
August 2011 60
HVAC – Central AC Quality Installation Verification (QIV)
Measure Overview
Description: The verification of proper charge and airflow during installation of new Central AC
system.
Primary Energy Impact: Electric Secondary Energy Impact: None
Non-Energy Impact: None
Sector: Residential
Market: Lost Opportunity End Use: HVAC
Program: Residential Cooling & Heating Equipment
Algorithms for Calculating Primary Energy Impact
Unit savings are deemed based on the following algorithms and assumptions:
%51/12
××××=∆ HoursSEERTon
hrkBtuTonskWh
%51/12
×××=∆
EERTon
hrkBtuTonskW
Where: Units = Completed QIV
Tons = Cooling capacity of AC equipment: Current default is 3 tons 114
SEER = Seasonal efficiency of AC equipment EER = Peak efficiency of AC equipment
Hours = Equivalent full load hours
5% = Average percent demand reduction: 5.0%115
Baseline Efficiency
The baseline efficiency case is a system whose installation is inconsistent with manufacturer specifications.
High Efficiency
The high efficiency case is a system whose installation is consistent with manufacturer specifications.
The measure savings for 2010 are listed in the table below:
Measure kW Savings kWh Savings
CoolSmart AC QIV ES and NES 0.164 50
114 ADM Associates, Inc. (2009). Residential Central AC Regional Evaluation – Free-Ridership Analysis. Prepared for CL&P; Page 4-12, Table 4-9. 115 Massachusetts Common Assumption.
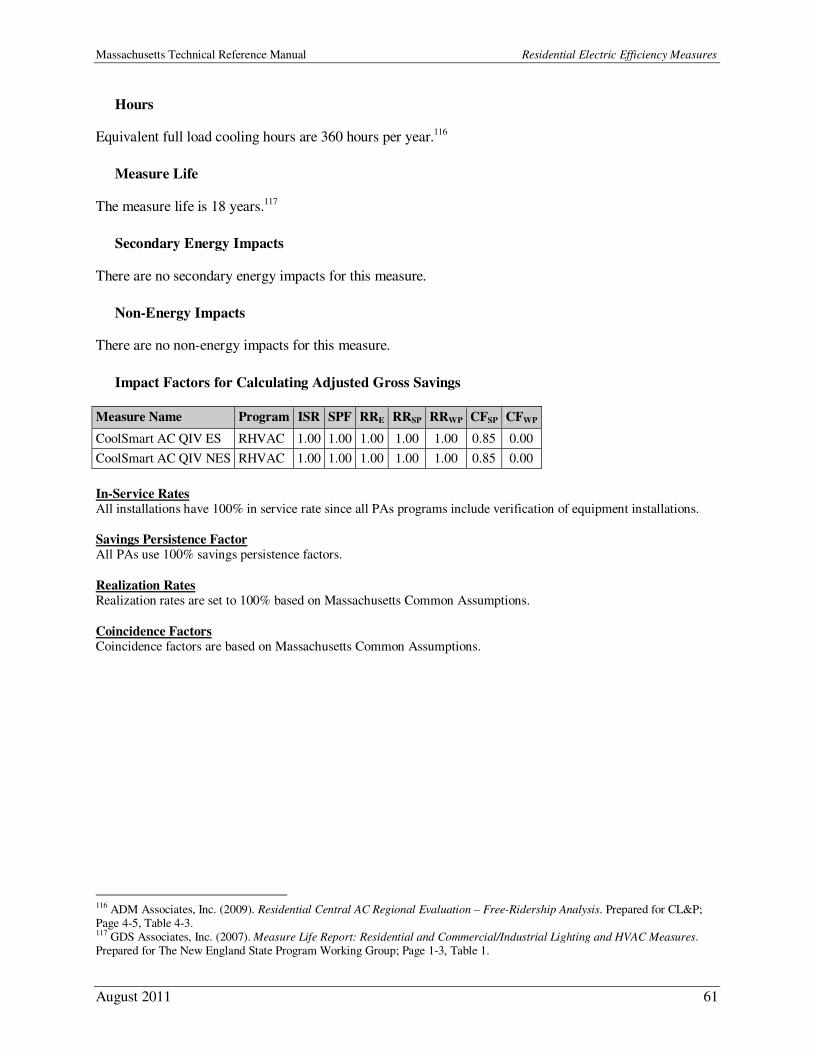
Massachusetts Technical Reference Manual Residential Electric Efficiency Measures
August 2011 61
Hours
Equivalent full load cooling hours are 360 hours per year.116
Measure Life
The measure life is 18 years.117
Secondary Energy Impacts
There are no secondary energy impacts for this measure.
Non-Energy Impacts
There are no non-energy impacts for this measure.
Impact Factors for Calculating Adjusted Gross Savings
Measure Name Program ISR SPF RRE RRSP RRWP CFSP CFWP
CoolSmart AC QIV ES RHVAC 1.00 1.00 1.00 1.00 1.00 0.85 0.00
CoolSmart AC QIV NES RHVAC 1.00 1.00 1.00 1.00 1.00 0.85 0.00
In-Service Rates All installations have 100% in service rate since all PAs programs include verification of equipment installations.
Savings Persistence Factor All PAs use 100% savings persistence factors.
Realization Rates Realization rates are set to 100% based on Massachusetts Common Assumptions.
Coincidence Factors Coincidence factors are based on Massachusetts Common Assumptions.
116 ADM Associates, Inc. (2009). Residential Central AC Regional Evaluation – Free-Ridership Analysis. Prepared for CL&P; Page 4-5, Table 4-3. 117 GDS Associates, Inc. (2007). Measure Life Report: Residential and Commercial/Industrial Lighting and HVAC Measures. Prepared for The New England State Program Working Group; Page 1-3, Table 1.
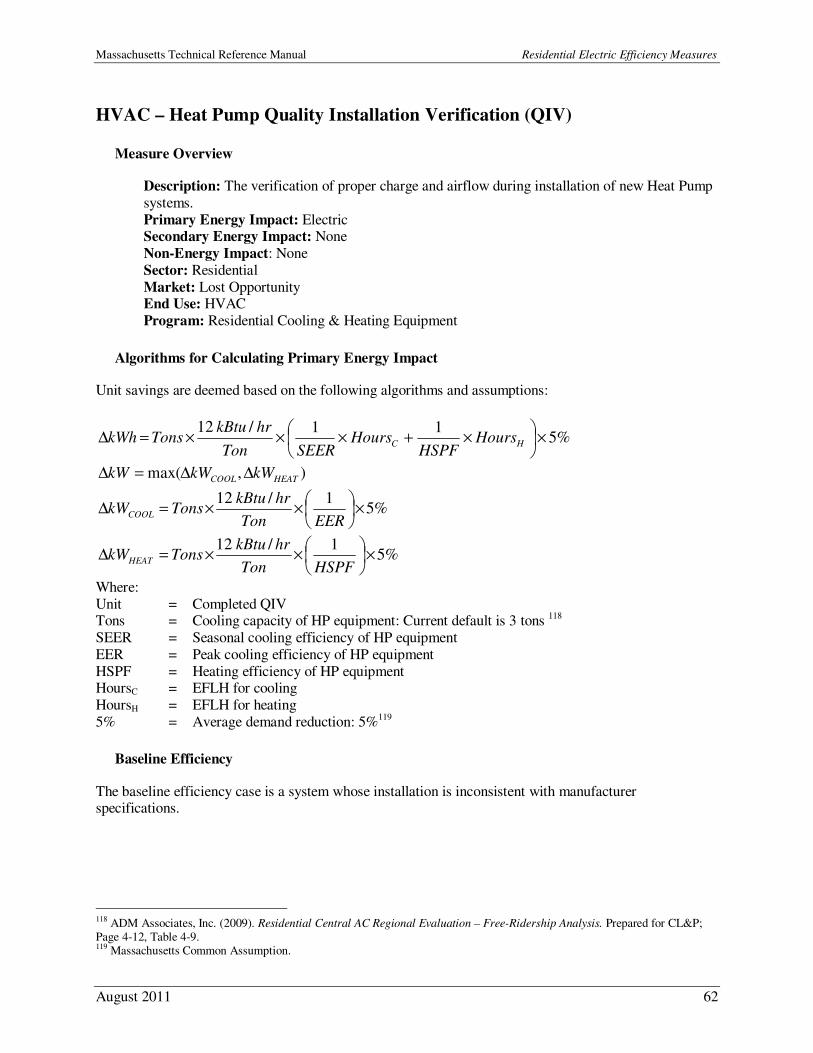
Massachusetts Technical Reference Manual Residential Electric Efficiency Measures
August 2011 62
HVAC – Heat Pump Quality Installation Verification (QIV)
Measure Overview
Description: The verification of proper charge and airflow during installation of new Heat Pump
systems.
Primary Energy Impact: Electric Secondary Energy Impact: None
Non-Energy Impact: None
Sector: Residential
Market: Lost Opportunity End Use: HVAC
Program: Residential Cooling & Heating Equipment
Algorithms for Calculating Primary Energy Impact
Unit savings are deemed based on the following algorithms and assumptions:
%511/12
×
×+×××=∆ HC Hours
HSPFHours
SEERTon
hrkBtuTonskWh
),max( HEATCOOL kWkWkW ∆∆=∆
%51/12
×
××=∆
EERTon
hrkBtuTonskWCOOL
%51/12
×
××=∆
HSPFTon
hrkBtuTonskWHEAT
Where:
Unit = Completed QIV Tons = Cooling capacity of HP equipment: Current default is 3 tons 118
SEER = Seasonal cooling efficiency of HP equipment
EER = Peak cooling efficiency of HP equipment
HSPF = Heating efficiency of HP equipment HoursC = EFLH for cooling
HoursH = EFLH for heating
5% = Average demand reduction: 5%119
Baseline Efficiency
The baseline efficiency case is a system whose installation is inconsistent with manufacturer specifications.
118 ADM Associates, Inc. (2009). Residential Central AC Regional Evaluation – Free-Ridership Analysis. Prepared for CL&P; Page 4-12, Table 4-9. 119 Massachusetts Common Assumption.
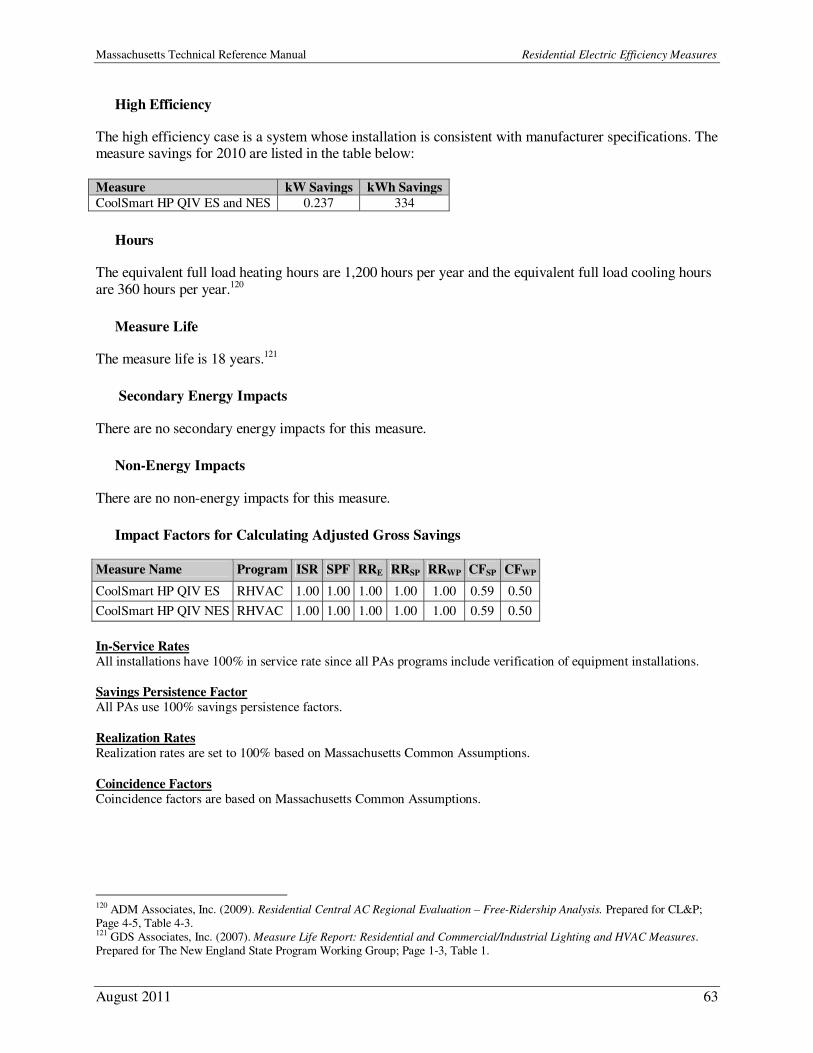
Massachusetts Technical Reference Manual Residential Electric Efficiency Measures
August 2011 63
High Efficiency
The high efficiency case is a system whose installation is consistent with manufacturer specifications. The measure savings for 2010 are listed in the table below:
Measure kW Savings kWh Savings
CoolSmart HP QIV ES and NES 0.237 334
Hours
The equivalent full load heating hours are 1,200 hours per year and the equivalent full load cooling hours
are 360 hours per year.120
Measure Life
The measure life is 18 years.121
Secondary Energy Impacts
There are no secondary energy impacts for this measure.
Non-Energy Impacts
There are no non-energy impacts for this measure.
Impact Factors for Calculating Adjusted Gross Savings
Measure Name Program ISR SPF RRE RRSP RRWP CFSP CFWP
CoolSmart HP QIV ES RHVAC 1.00 1.00 1.00 1.00 1.00 0.59 0.50
CoolSmart HP QIV NES RHVAC 1.00 1.00 1.00 1.00 1.00 0.59 0.50
In-Service Rates All installations have 100% in service rate since all PAs programs include verification of equipment installations.
Savings Persistence Factor All PAs use 100% savings persistence factors.
Realization Rates Realization rates are set to 100% based on Massachusetts Common Assumptions.
Coincidence Factors Coincidence factors are based on Massachusetts Common Assumptions.
120 ADM Associates, Inc. (2009). Residential Central AC Regional Evaluation – Free-Ridership Analysis. Prepared for CL&P; Page 4-5, Table 4-3. 121 GDS Associates, Inc. (2007). Measure Life Report: Residential and Commercial/Industrial Lighting and HVAC Measures. Prepared for The New England State Program Working Group; Page 1-3, Table 1.
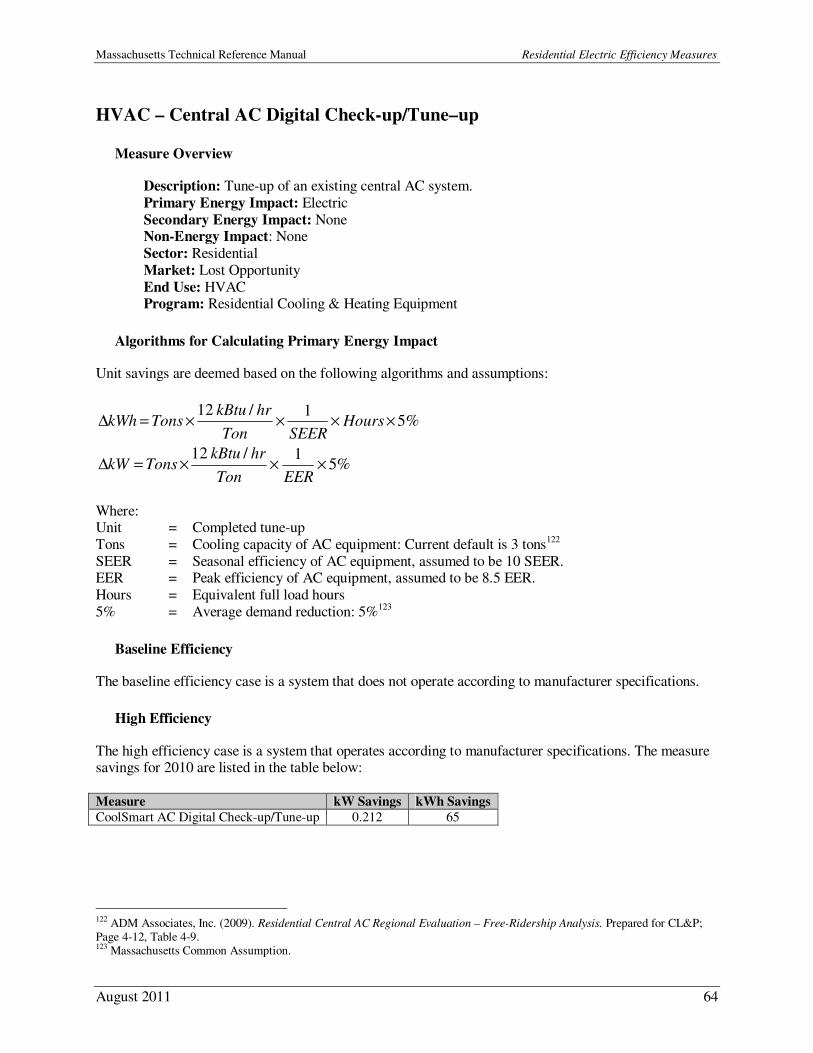
Massachusetts Technical Reference Manual Residential Electric Efficiency Measures
August 2011 64
HVAC – Central AC Digital Check-up/Tune–up
Measure Overview
Description: Tune-up of an existing central AC system.
Primary Energy Impact: Electric
Secondary Energy Impact: None Non-Energy Impact: None
Sector: Residential
Market: Lost Opportunity
End Use: HVAC Program: Residential Cooling & Heating Equipment
Algorithms for Calculating Primary Energy Impact
Unit savings are deemed based on the following algorithms and assumptions:
%51/12
××××=∆ HoursSEERTon
hrkBtuTonskWh
%51/12
×××=∆
EERTon
hrkBtuTonskW
Where: Unit = Completed tune-up
Tons = Cooling capacity of AC equipment: Current default is 3 tons122
SEER = Seasonal efficiency of AC equipment, assumed to be 10 SEER. EER = Peak efficiency of AC equipment, assumed to be 8.5 EER.
Hours = Equivalent full load hours
5% = Average demand reduction: 5%123
Baseline Efficiency
The baseline efficiency case is a system that does not operate according to manufacturer specifications.
High Efficiency
The high efficiency case is a system that operates according to manufacturer specifications. The measure savings for 2010 are listed in the table below:
Measure kW Savings kWh Savings
CoolSmart AC Digital Check-up/Tune-up 0.212 65
122 ADM Associates, Inc. (2009). Residential Central AC Regional Evaluation – Free-Ridership Analysis. Prepared for CL&P; Page 4-12, Table 4-9. 123 Massachusetts Common Assumption.
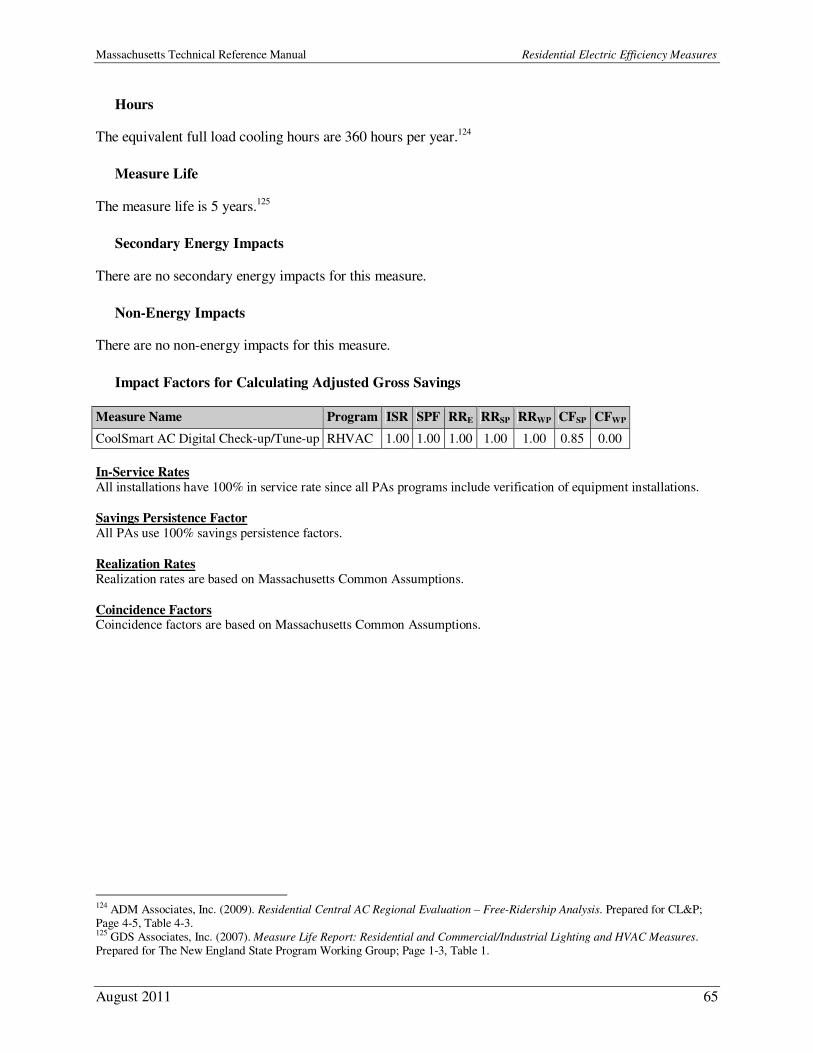
Massachusetts Technical Reference Manual Residential Electric Efficiency Measures
August 2011 65
Hours
The equivalent full load cooling hours are 360 hours per year.124
Measure Life
The measure life is 5 years.125
Secondary Energy Impacts
There are no secondary energy impacts for this measure.
Non-Energy Impacts
There are no non-energy impacts for this measure.
Impact Factors for Calculating Adjusted Gross Savings
Measure Name Program ISR SPF RRE RRSP RRWP CFSP CFWP
CoolSmart AC Digital Check-up/Tune-up RHVAC 1.00 1.00 1.00 1.00 1.00 0.85 0.00
In-Service Rates All installations have 100% in service rate since all PAs programs include verification of equipment installations.
Savings Persistence Factor All PAs use 100% savings persistence factors.
Realization Rates Realization rates are based on Massachusetts Common Assumptions.
Coincidence Factors Coincidence factors are based on Massachusetts Common Assumptions.
124 ADM Associates, Inc. (2009). Residential Central AC Regional Evaluation – Free-Ridership Analysis. Prepared for CL&P; Page 4-5, Table 4-3. 125 GDS Associates, Inc. (2007). Measure Life Report: Residential and Commercial/Industrial Lighting and HVAC Measures. Prepared for The New England State Program Working Group; Page 1-3, Table 1.
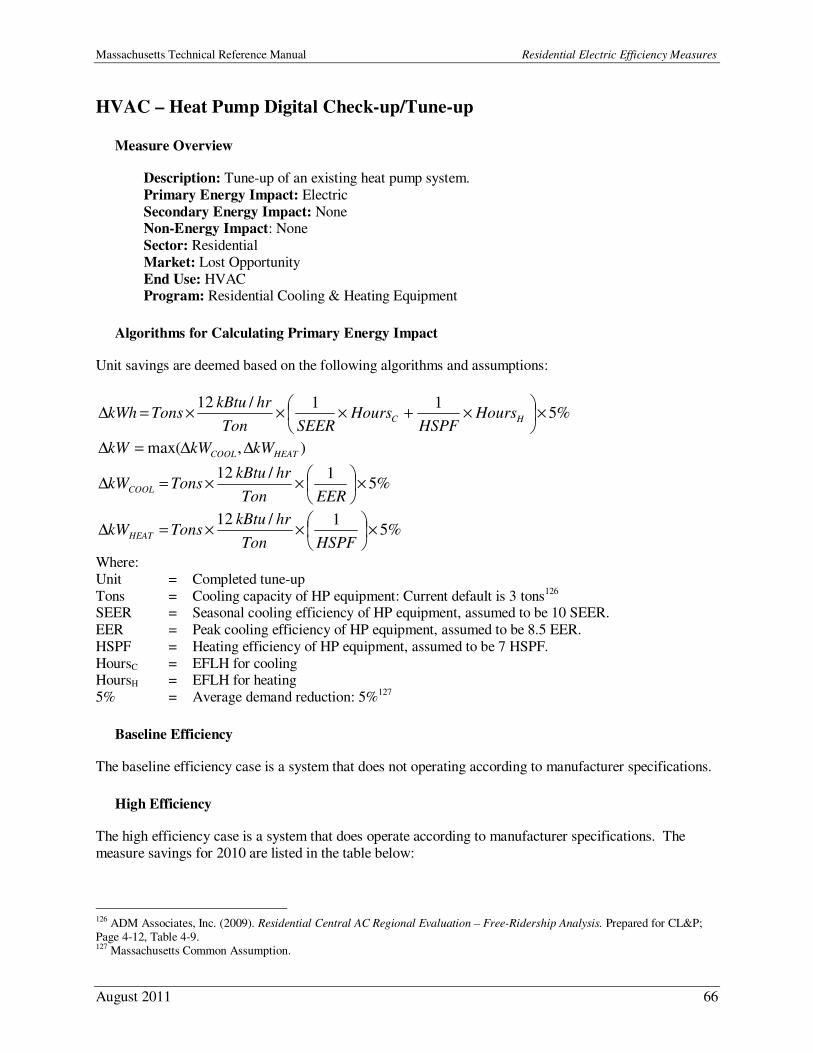
Massachusetts Technical Reference Manual Residential Electric Efficiency Measures
August 2011 66
HVAC – Heat Pump Digital Check-up/Tune-up
Measure Overview
Description: Tune-up of an existing heat pump system.
Primary Energy Impact: Electric
Secondary Energy Impact: None Non-Energy Impact: None
Sector: Residential
Market: Lost Opportunity
End Use: HVAC Program: Residential Cooling & Heating Equipment
Algorithms for Calculating Primary Energy Impact
Unit savings are deemed based on the following algorithms and assumptions:
%511/12
×
×+×××=∆ HC Hours
HSPFHours
SEERTon
hrkBtuTonskWh
),max( HEATCOOL kWkWkW ∆∆=∆
%51/12
×
××=∆
EERTon
hrkBtuTonskWCOOL
%51/12
×
××=∆
HSPFTon
hrkBtuTonskWHEAT
Where:
Unit = Completed tune-up
Tons = Cooling capacity of HP equipment: Current default is 3 tons126 SEER = Seasonal cooling efficiency of HP equipment, assumed to be 10 SEER.
EER = Peak cooling efficiency of HP equipment, assumed to be 8.5 EER.
HSPF = Heating efficiency of HP equipment, assumed to be 7 HSPF.
HoursC = EFLH for cooling HoursH = EFLH for heating
5% = Average demand reduction: 5%127
Baseline Efficiency
The baseline efficiency case is a system that does not operating according to manufacturer specifications.
High Efficiency
The high efficiency case is a system that does operate according to manufacturer specifications. The
measure savings for 2010 are listed in the table below:
126 ADM Associates, Inc. (2009). Residential Central AC Regional Evaluation – Free-Ridership Analysis. Prepared for CL&P; Page 4-12, Table 4-9. 127 Massachusetts Common Assumption.
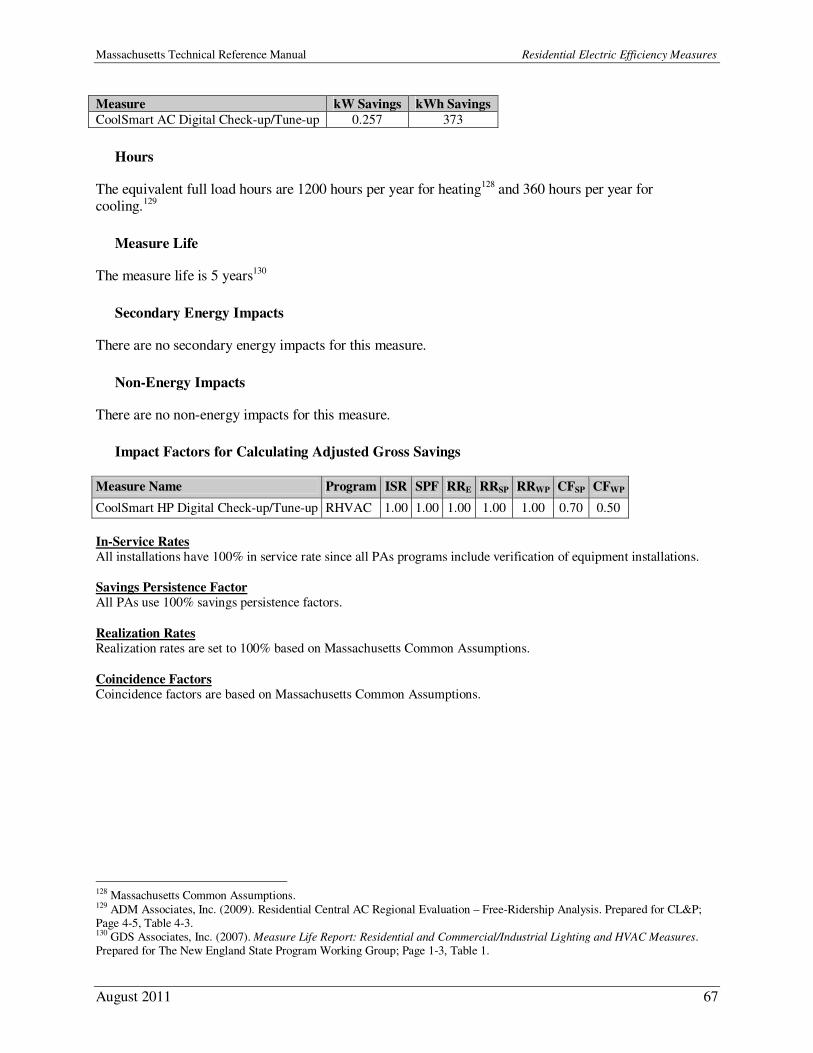
Massachusetts Technical Reference Manual Residential Electric Efficiency Measures
August 2011 67
Measure kW Savings kWh Savings
CoolSmart AC Digital Check-up/Tune-up 0.257 373
Hours
The equivalent full load hours are 1200 hours per year for heating128 and 360 hours per year for
cooling.129
Measure Life
The measure life is 5 years130
Secondary Energy Impacts
There are no secondary energy impacts for this measure.
Non-Energy Impacts
There are no non-energy impacts for this measure.
Impact Factors for Calculating Adjusted Gross Savings
Measure Name Program ISR SPF RRE RRSP RRWP CFSP CFWP
CoolSmart HP Digital Check-up/Tune-up RHVAC 1.00 1.00 1.00 1.00 1.00 0.70 0.50
In-Service Rates All installations have 100% in service rate since all PAs programs include verification of equipment installations.
Savings Persistence Factor All PAs use 100% savings persistence factors.
Realization Rates Realization rates are set to 100% based on Massachusetts Common Assumptions.
Coincidence Factors Coincidence factors are based on Massachusetts Common Assumptions.
128 Massachusetts Common Assumptions. 129 ADM Associates, Inc. (2009). Residential Central AC Regional Evaluation – Free-Ridership Analysis. Prepared for CL&P; Page 4-5, Table 4-3. 130 GDS Associates, Inc. (2007). Measure Life Report: Residential and Commercial/Industrial Lighting and HVAC Measures. Prepared for The New England State Program Working Group; Page 1-3, Table 1.
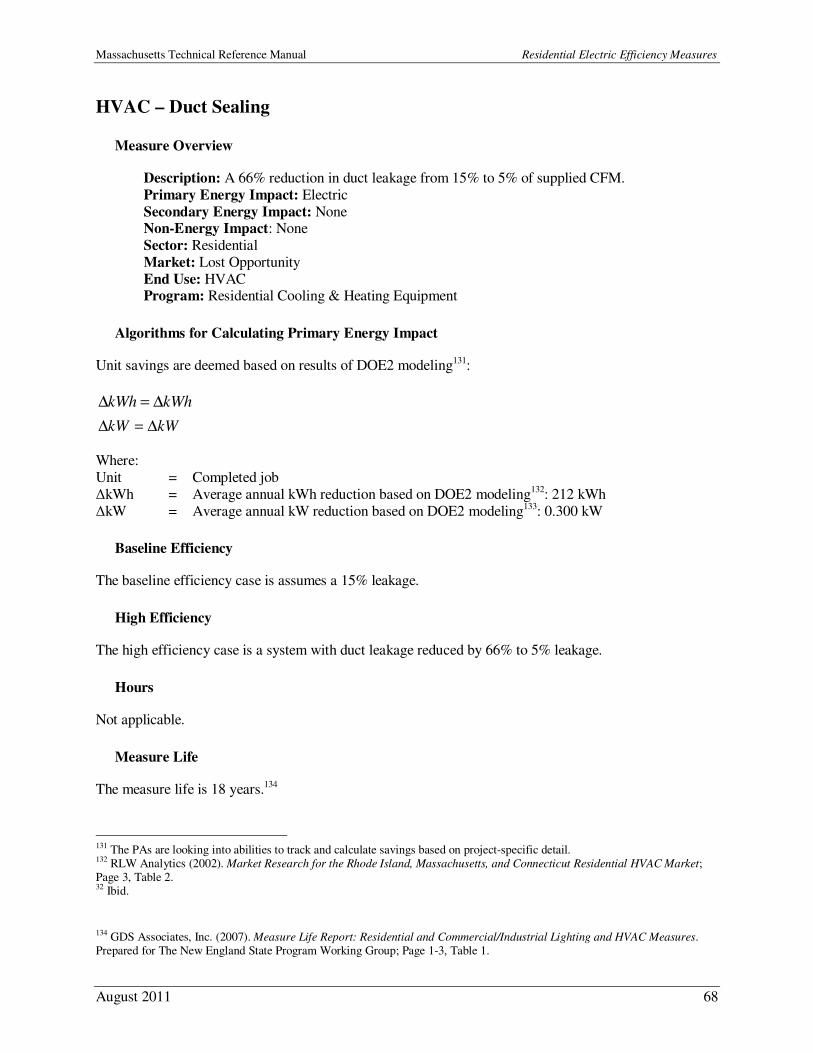
Massachusetts Technical Reference Manual Residential Electric Efficiency Measures
August 2011 68
HVAC – Duct Sealing
Measure Overview
Description: A 66% reduction in duct leakage from 15% to 5% of supplied CFM.
Primary Energy Impact: Electric
Secondary Energy Impact: None Non-Energy Impact: None
Sector: Residential
Market: Lost Opportunity
End Use: HVAC Program: Residential Cooling & Heating Equipment
Algorithms for Calculating Primary Energy Impact
Unit savings are deemed based on results of DOE2 modeling131:
kWhkWh ∆=∆
kWkW ∆=∆
Where:
Unit = Completed job
∆kWh = Average annual kWh reduction based on DOE2 modeling132: 212 kWh
∆kW = Average annual kW reduction based on DOE2 modeling133: 0.300 kW
Baseline Efficiency
The baseline efficiency case is assumes a 15% leakage.
High Efficiency
The high efficiency case is a system with duct leakage reduced by 66% to 5% leakage.
Hours
Not applicable.
Measure Life
The measure life is 18 years.134
131 The PAs are looking into abilities to track and calculate savings based on project-specific detail. 132 RLW Analytics (2002). Market Research for the Rhode Island, Massachusetts, and Connecticut Residential HVAC Market; Page 3, Table 2. 32 Ibid.
134 GDS Associates, Inc. (2007). Measure Life Report: Residential and Commercial/Industrial Lighting and HVAC Measures. Prepared for The New England State Program Working Group; Page 1-3, Table 1.
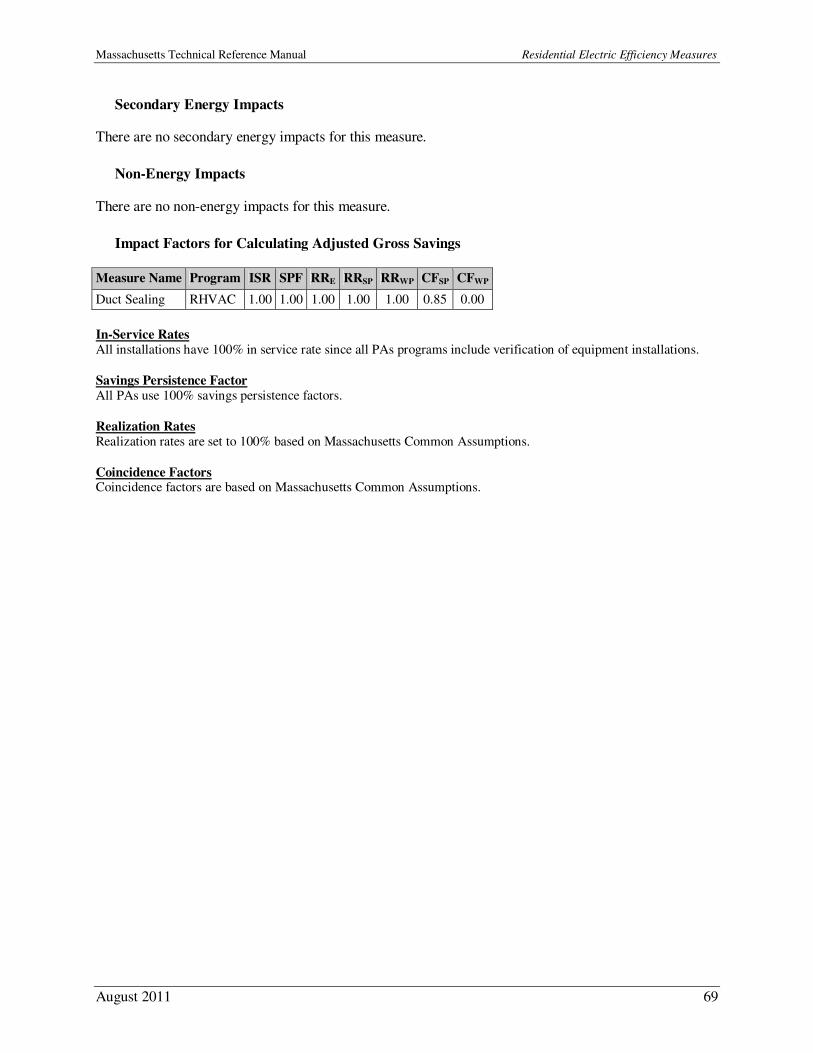
Massachusetts Technical Reference Manual Residential Electric Efficiency Measures
August 2011 69
Secondary Energy Impacts
There are no secondary energy impacts for this measure.
Non-Energy Impacts
There are no non-energy impacts for this measure.
Impact Factors for Calculating Adjusted Gross Savings
Measure Name Program ISR SPF RRE RRSP RRWP CFSP CFWP
Duct Sealing RHVAC 1.00 1.00 1.00 1.00 1.00 0.85 0.00
In-Service Rates All installations have 100% in service rate since all PAs programs include verification of equipment installations.
Savings Persistence Factor All PAs use 100% savings persistence factors.
Realization Rates Realization rates are set to 100% based on Massachusetts Common Assumptions.
Coincidence Factors Coincidence factors are based on Massachusetts Common Assumptions.
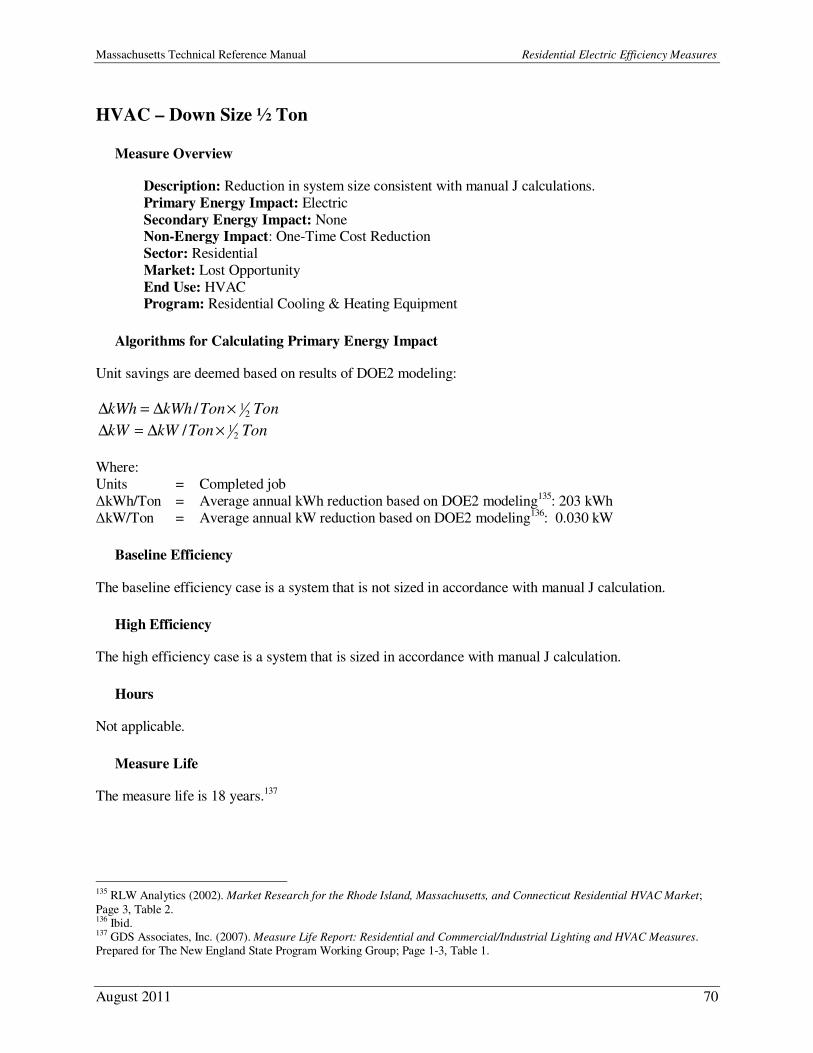
Massachusetts Technical Reference Manual Residential Electric Efficiency Measures
August 2011 70
HVAC – Down Size ½ Ton
Measure Overview
Description: Reduction in system size consistent with manual J calculations.
Primary Energy Impact: Electric
Secondary Energy Impact: None Non-Energy Impact: One-Time Cost Reduction
Sector: Residential
Market: Lost Opportunity
End Use: HVAC Program: Residential Cooling & Heating Equipment
Algorithms for Calculating Primary Energy Impact
Unit savings are deemed based on results of DOE2 modeling:
TonTonkWhkWh 21/ ×∆=∆
TonTonkWkW 21/ ×∆=∆
Where:
Units = Completed job
∆kWh/Ton = Average annual kWh reduction based on DOE2 modeling135: 203 kWh
∆kW/Ton = Average annual kW reduction based on DOE2 modeling136: 0.030 kW
Baseline Efficiency
The baseline efficiency case is a system that is not sized in accordance with manual J calculation.
High Efficiency
The high efficiency case is a system that is sized in accordance with manual J calculation.
Hours
Not applicable.
Measure Life
The measure life is 18 years.137
135 RLW Analytics (2002). Market Research for the Rhode Island, Massachusetts, and Connecticut Residential HVAC Market;
Page 3, Table 2. 136 Ibid. 137 GDS Associates, Inc. (2007). Measure Life Report: Residential and Commercial/Industrial Lighting and HVAC Measures. Prepared for The New England State Program Working Group; Page 1-3, Table 1.
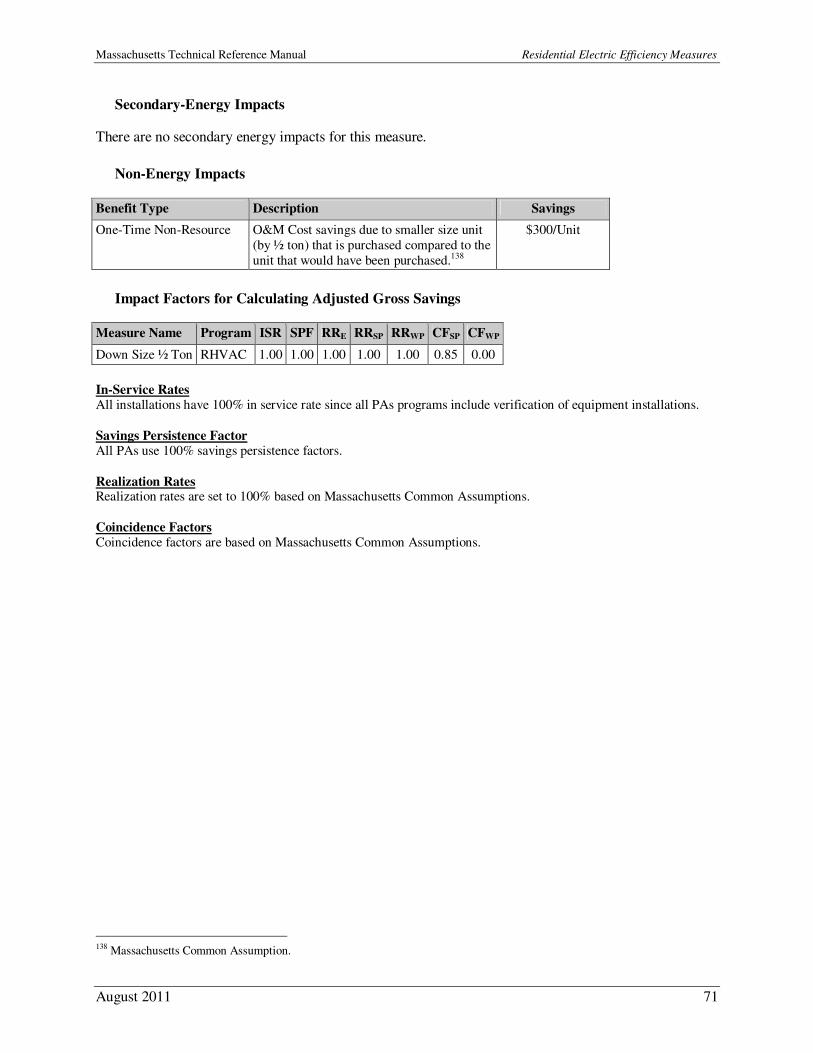
Massachusetts Technical Reference Manual Residential Electric Efficiency Measures
August 2011 71
Secondary-Energy Impacts
There are no secondary energy impacts for this measure.
Non-Energy Impacts
Benefit Type Description Savings
One-Time Non-Resource O&M Cost savings due to smaller size unit
(by ½ ton) that is purchased compared to the
unit that would have been purchased.138
$300/Unit
Impact Factors for Calculating Adjusted Gross Savings
Measure Name Program ISR SPF RRE RRSP RRWP CFSP CFWP
Down Size ½ Ton RHVAC 1.00 1.00 1.00 1.00 1.00 0.85 0.00
In-Service Rates All installations have 100% in service rate since all PAs programs include verification of equipment installations.
Savings Persistence Factor All PAs use 100% savings persistence factors.
Realization Rates Realization rates are set to 100% based on Massachusetts Common Assumptions.
Coincidence Factors Coincidence factors are based on Massachusetts Common Assumptions.
138 Massachusetts Common Assumption.
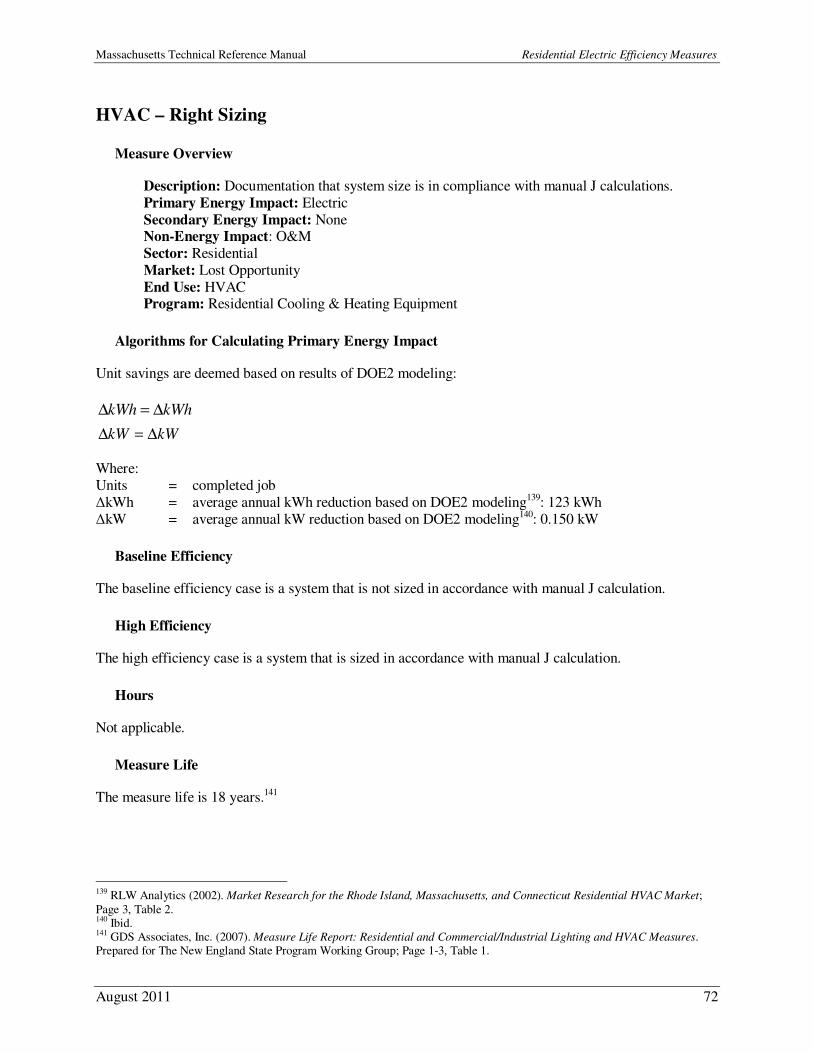
Massachusetts Technical Reference Manual Residential Electric Efficiency Measures
August 2011 72
HVAC – Right Sizing
Measure Overview
Description: Documentation that system size is in compliance with manual J calculations.
Primary Energy Impact: Electric
Secondary Energy Impact: None Non-Energy Impact: O&M
Sector: Residential
Market: Lost Opportunity
End Use: HVAC Program: Residential Cooling & Heating Equipment
Algorithms for Calculating Primary Energy Impact
Unit savings are deemed based on results of DOE2 modeling:
kWhkWh ∆=∆
kWkW ∆=∆
Where:
Units = completed job
∆kWh = average annual kWh reduction based on DOE2 modeling139: 123 kWh
∆kW = average annual kW reduction based on DOE2 modeling140: 0.150 kW
Baseline Efficiency
The baseline efficiency case is a system that is not sized in accordance with manual J calculation.
High Efficiency
The high efficiency case is a system that is sized in accordance with manual J calculation.
Hours
Not applicable.
Measure Life
The measure life is 18 years.141
139 RLW Analytics (2002). Market Research for the Rhode Island, Massachusetts, and Connecticut Residential HVAC Market;
Page 3, Table 2. 140 Ibid. 141 GDS Associates, Inc. (2007). Measure Life Report: Residential and Commercial/Industrial Lighting and HVAC Measures. Prepared for The New England State Program Working Group; Page 1-3, Table 1.
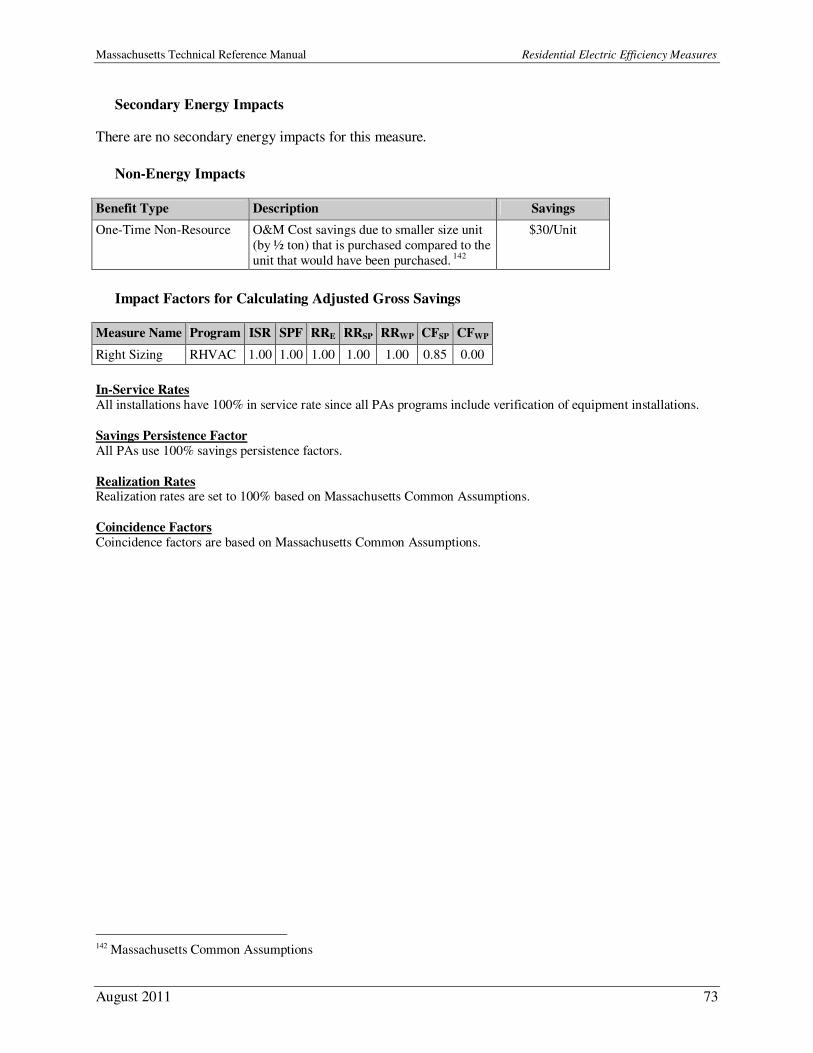
Massachusetts Technical Reference Manual Residential Electric Efficiency Measures
August 2011 73
Secondary Energy Impacts
There are no secondary energy impacts for this measure.
Non-Energy Impacts
Benefit Type Description Savings
One-Time Non-Resource O&M Cost savings due to smaller size unit
(by ½ ton) that is purchased compared to the
unit that would have been purchased. 142
$30/Unit
Impact Factors for Calculating Adjusted Gross Savings
Measure Name Program ISR SPF RRE RRSP RRWP CFSP CFWP
Right Sizing RHVAC 1.00 1.00 1.00 1.00 1.00 0.85 0.00
In-Service Rates All installations have 100% in service rate since all PAs programs include verification of equipment installations.
Savings Persistence Factor All PAs use 100% savings persistence factors.
Realization Rates Realization rates are set to 100% based on Massachusetts Common Assumptions.
Coincidence Factors Coincidence factors are based on Massachusetts Common Assumptions.
142 Massachusetts Common Assumptions
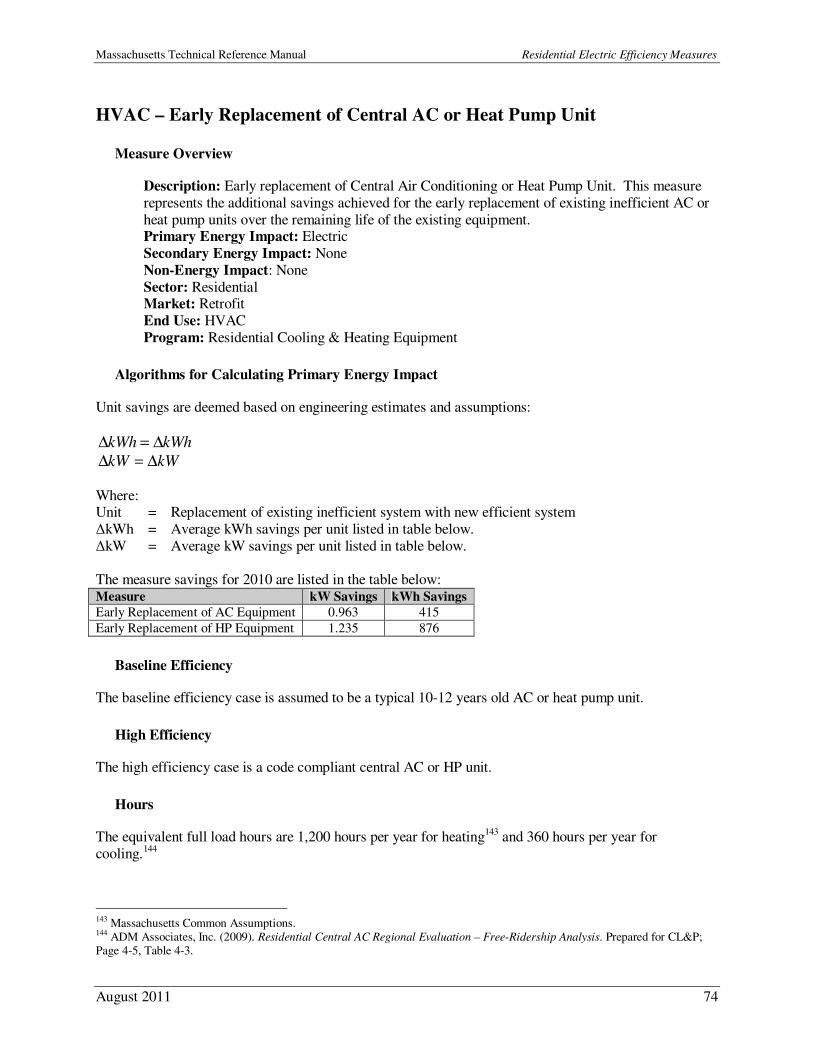
Massachusetts Technical Reference Manual Residential Electric Efficiency Measures
August 2011 74
HVAC – Early Replacement of Central AC or Heat Pump Unit
Measure Overview
Description: Early replacement of Central Air Conditioning or Heat Pump Unit. This measure
represents the additional savings achieved for the early replacement of existing inefficient AC or
heat pump units over the remaining life of the existing equipment. Primary Energy Impact: Electric
Secondary Energy Impact: None
Non-Energy Impact: None
Sector: Residential Market: Retrofit
End Use: HVAC
Program: Residential Cooling & Heating Equipment
Algorithms for Calculating Primary Energy Impact
Unit savings are deemed based on engineering estimates and assumptions:
kWhkWh ∆=∆
kWkW ∆=∆
Where: Unit = Replacement of existing inefficient system with new efficient system
∆kWh = Average kWh savings per unit listed in table below.
∆kW = Average kW savings per unit listed in table below.
The measure savings for 2010 are listed in the table below: Measure kW Savings kWh Savings
Early Replacement of AC Equipment 0.963 415
Early Replacement of HP Equipment 1.235 876
Baseline Efficiency
The baseline efficiency case is assumed to be a typical 10-12 years old AC or heat pump unit.
High Efficiency
The high efficiency case is a code compliant central AC or HP unit.
Hours
The equivalent full load hours are 1,200 hours per year for heating143 and 360 hours per year for
cooling.144
143 Massachusetts Common Assumptions. 144 ADM Associates, Inc. (2009). Residential Central AC Regional Evaluation – Free-Ridership Analysis. Prepared for CL&P; Page 4-5, Table 4-3.
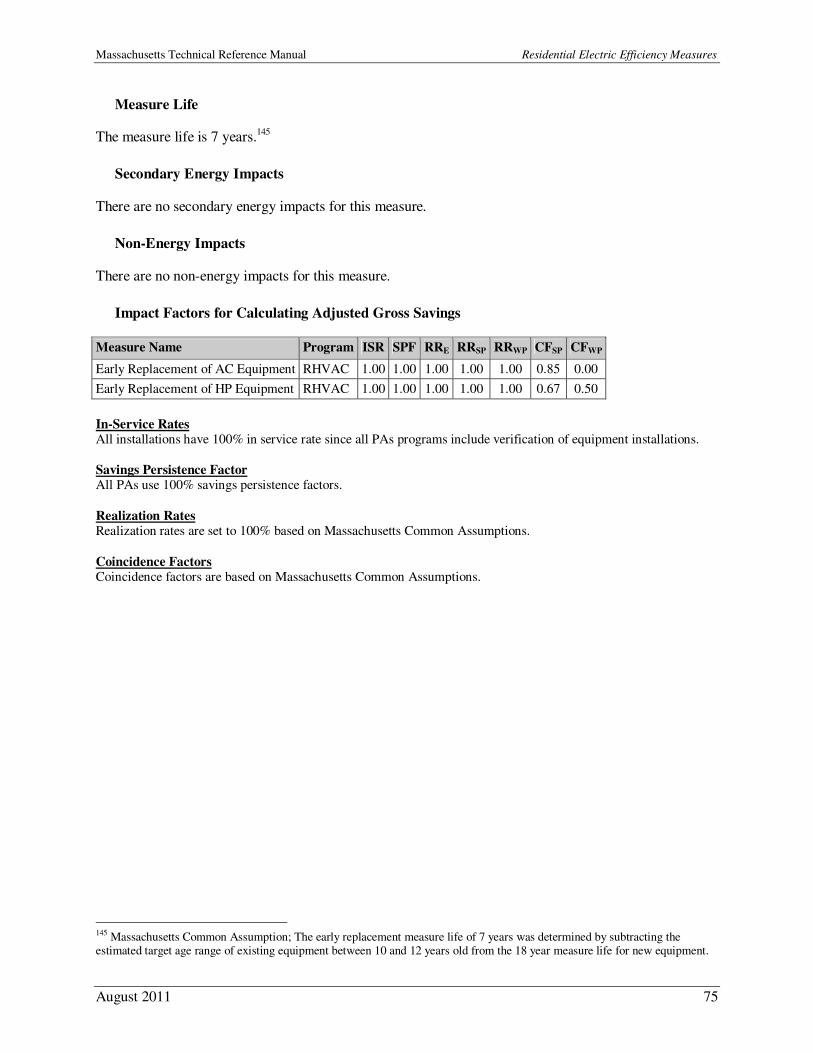
Massachusetts Technical Reference Manual Residential Electric Efficiency Measures
August 2011 75
Measure Life
The measure life is 7 years.145
Secondary Energy Impacts
There are no secondary energy impacts for this measure.
Non-Energy Impacts
There are no non-energy impacts for this measure.
Impact Factors for Calculating Adjusted Gross Savings
Measure Name Program ISR SPF RRE RRSP RRWP CFSP CFWP
Early Replacement of AC Equipment RHVAC 1.00 1.00 1.00 1.00 1.00 0.85 0.00
Early Replacement of HP Equipment RHVAC 1.00 1.00 1.00 1.00 1.00 0.67 0.50
In-Service Rates All installations have 100% in service rate since all PAs programs include verification of equipment installations.
Savings Persistence Factor All PAs use 100% savings persistence factors.
Realization Rates Realization rates are set to 100% based on Massachusetts Common Assumptions.
Coincidence Factors Coincidence factors are based on Massachusetts Common Assumptions.
145 Massachusetts Common Assumption; The early replacement measure life of 7 years was determined by subtracting the estimated target age range of existing equipment between 10 and 12 years old from the 18 year measure life for new equipment.
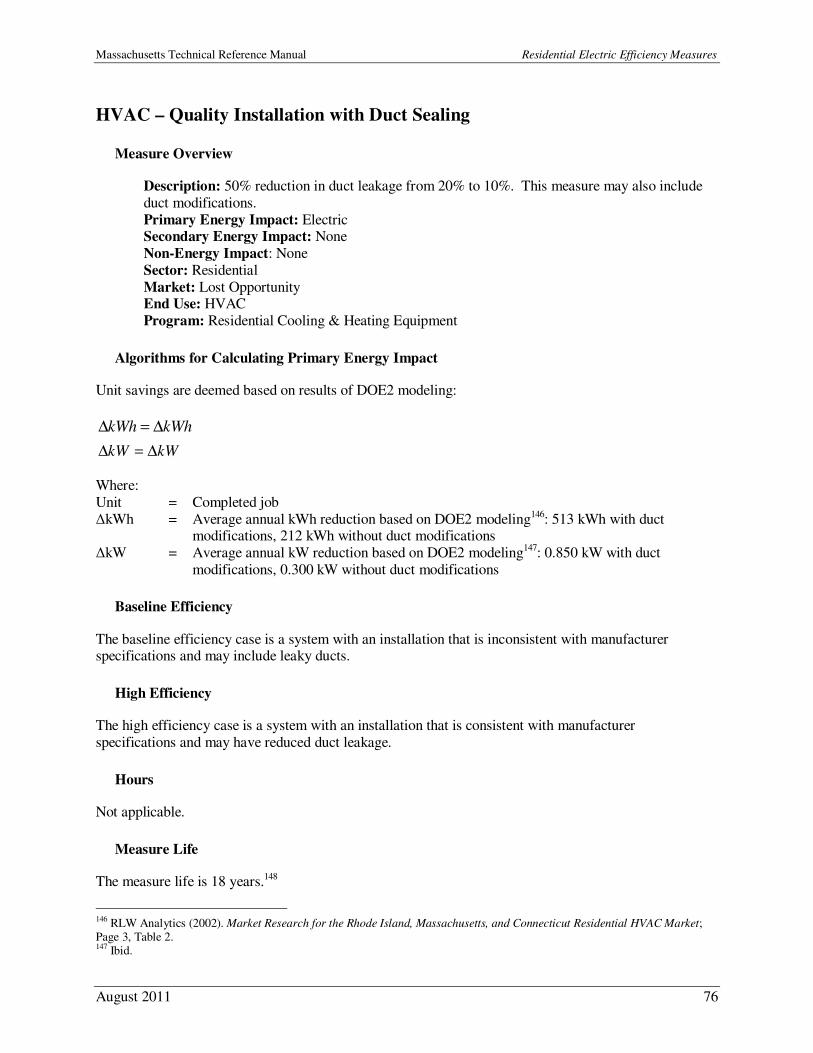
Massachusetts Technical Reference Manual Residential Electric Efficiency Measures
August 2011 76
HVAC – Quality Installation with Duct Sealing
Measure Overview
Description: 50% reduction in duct leakage from 20% to 10%. This measure may also include
duct modifications.
Primary Energy Impact: Electric Secondary Energy Impact: None
Non-Energy Impact: None
Sector: Residential
Market: Lost Opportunity End Use: HVAC
Program: Residential Cooling & Heating Equipment
Algorithms for Calculating Primary Energy Impact
Unit savings are deemed based on results of DOE2 modeling:
kWhkWh ∆=∆
kWkW ∆=∆
Where:
Unit = Completed job
∆kWh = Average annual kWh reduction based on DOE2 modeling146: 513 kWh with duct modifications, 212 kWh without duct modifications
∆kW = Average annual kW reduction based on DOE2 modeling147: 0.850 kW with duct
modifications, 0.300 kW without duct modifications
Baseline Efficiency
The baseline efficiency case is a system with an installation that is inconsistent with manufacturer specifications and may include leaky ducts.
High Efficiency
The high efficiency case is a system with an installation that is consistent with manufacturer
specifications and may have reduced duct leakage.
Hours
Not applicable.
Measure Life
The measure life is 18 years.148
146 RLW Analytics (2002). Market Research for the Rhode Island, Massachusetts, and Connecticut Residential HVAC Market; Page 3, Table 2. 147 Ibid.
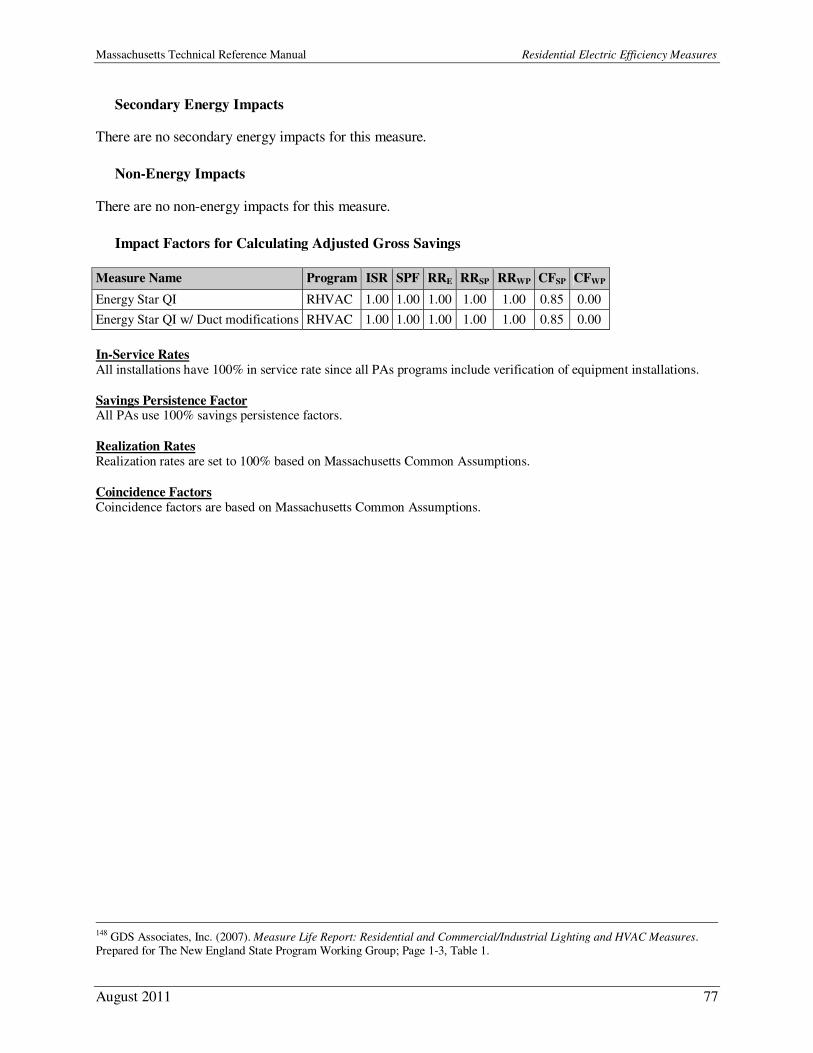
Massachusetts Technical Reference Manual Residential Electric Efficiency Measures
August 2011 77
Secondary Energy Impacts
There are no secondary energy impacts for this measure.
Non-Energy Impacts
There are no non-energy impacts for this measure.
Impact Factors for Calculating Adjusted Gross Savings
Measure Name Program ISR SPF RRE RRSP RRWP CFSP CFWP
Energy Star QI RHVAC 1.00 1.00 1.00 1.00 1.00 0.85 0.00
Energy Star QI w/ Duct modifications RHVAC 1.00 1.00 1.00 1.00 1.00 0.85 0.00
In-Service Rates All installations have 100% in service rate since all PAs programs include verification of equipment installations.
Savings Persistence Factor All PAs use 100% savings persistence factors.
Realization Rates Realization rates are set to 100% based on Massachusetts Common Assumptions.
Coincidence Factors Coincidence factors are based on Massachusetts Common Assumptions.
148 GDS Associates, Inc. (2007). Measure Life Report: Residential and Commercial/Industrial Lighting and HVAC Measures. Prepared for The New England State Program Working Group; Page 1-3, Table 1.
Massachusetts Technical Reference Manual Residential Electric Efficiency Measures
August 2011 78
HVAC – Warm Air Furnace Electronically Commutated Motor (ECM)
Measure Overview
Description: Installation of an electronically commutated variable speed air supply motor.
Primary Energy Impact: Electric
Secondary Energy Impact: NG – Res Heating Non-Energy Impact: None
Sector: Residential
Market: Lost Opportunity
End Use: HVAC Program: Residential Cooling & Heating Equipment
Algorithms for Calculating Primary Energy Impact
Unit savings are deemed based on the following algorithms and assumptions:
kWhkWh ∆=∆
kWkW ∆=∆
Where:
Unit = Installation of ECM ∆kWh = Gross annual kWh savings from the measure: 600 kWh149
∆kW = Gross connected kW savings from the measure: 0.116 kW150
Baseline Efficiency
The baseline efficiency case is the installation of a furnace with a standard efficiency steady state motor.
High Efficiency
The high efficiency case is the installation of a furnace with an electronically commutated motor.
Hours
Not applicable.
Measure Life
The measure life is 18 years.151
Secondary Energy Impacts
This is the increased heating load as a result of a more efficient motor.
149 Sachs, Harvey (2003). Energy Savings form Efficient Furnace Air Handlers in Massachusetts. 150 Estimated using demand allocation methodology described in: Quantec, LLC (2000). Impact Evaluation: Single-Family
EnergyWise Program. Prepared for National Grid. 151 Sachs, Harvey (2003). Energy Savings form Efficient Furnace Air Handlers in Massachusetts.
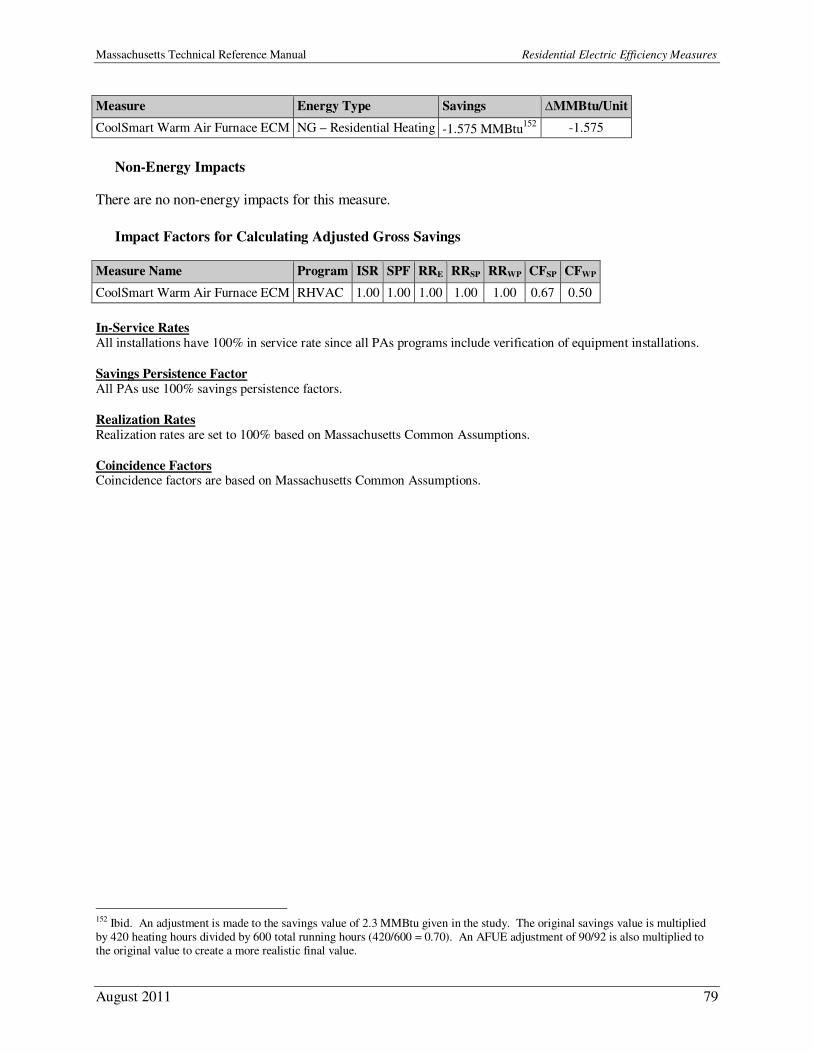
Massachusetts Technical Reference Manual Residential Electric Efficiency Measures
August 2011 79
Measure Energy Type Savings ∆MMBtu/Unit
CoolSmart Warm Air Furnace ECM NG – Residential Heating -1.575 MMBtu152
-1.575
Non-Energy Impacts
There are no non-energy impacts for this measure.
Impact Factors for Calculating Adjusted Gross Savings
Measure Name Program ISR SPF RRE RRSP RRWP CFSP CFWP
CoolSmart Warm Air Furnace ECM RHVAC 1.00 1.00 1.00 1.00 1.00 0.67 0.50
In-Service Rates All installations have 100% in service rate since all PAs programs include verification of equipment installations.
Savings Persistence Factor All PAs use 100% savings persistence factors.
Realization Rates Realization rates are set to 100% based on Massachusetts Common Assumptions.
Coincidence Factors Coincidence factors are based on Massachusetts Common Assumptions.
152 Ibid. An adjustment is made to the savings value of 2.3 MMBtu given in the study. The original savings value is multiplied by 420 heating hours divided by 600 total running hours (420/600 = 0.70). An AFUE adjustment of 90/92 is also multiplied to the original value to create a more realistic final value.
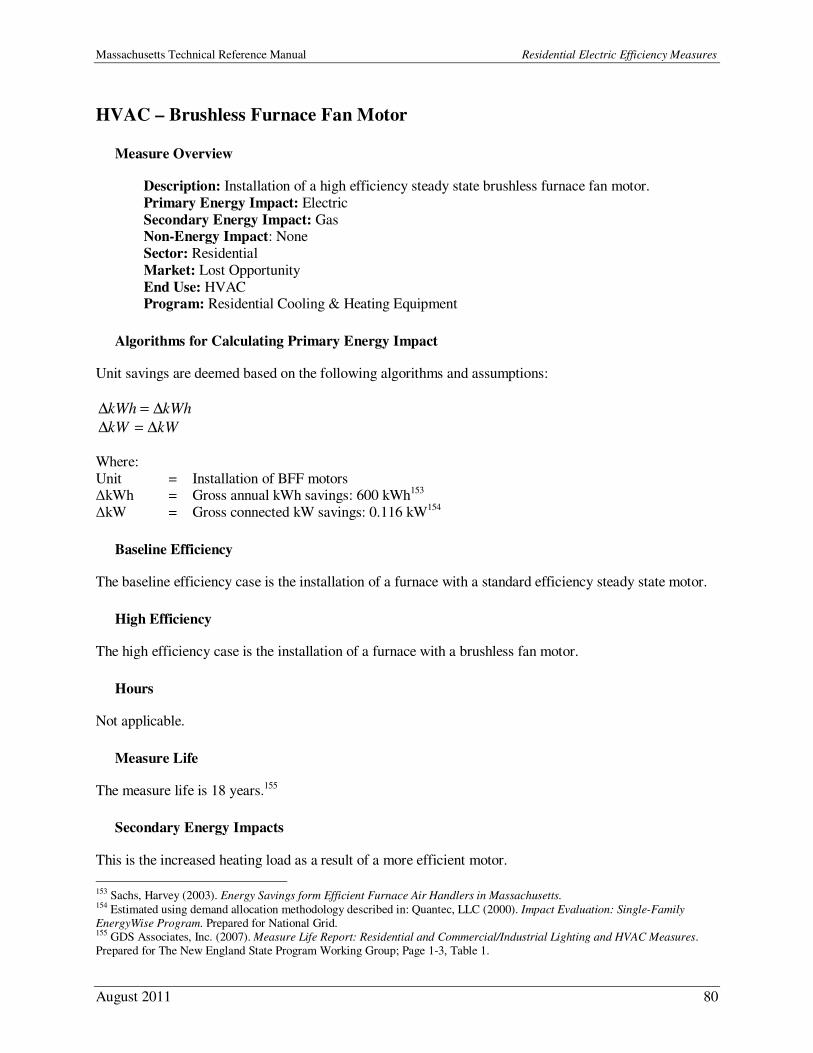
Massachusetts Technical Reference Manual Residential Electric Efficiency Measures
August 2011 80
HVAC – Brushless Furnace Fan Motor
Measure Overview
Description: Installation of a high efficiency steady state brushless furnace fan motor.
Primary Energy Impact: Electric
Secondary Energy Impact: Gas Non-Energy Impact: None
Sector: Residential
Market: Lost Opportunity
End Use: HVAC Program: Residential Cooling & Heating Equipment
Algorithms for Calculating Primary Energy Impact
Unit savings are deemed based on the following algorithms and assumptions:
kWhkWh ∆=∆
kWkW ∆=∆
Where:
Unit = Installation of BFF motors ∆kWh = Gross annual kWh savings: 600 kWh153
∆kW = Gross connected kW savings: 0.116 kW154
Baseline Efficiency
The baseline efficiency case is the installation of a furnace with a standard efficiency steady state motor.
High Efficiency
The high efficiency case is the installation of a furnace with a brushless fan motor.
Hours
Not applicable.
Measure Life
The measure life is 18 years.155
Secondary Energy Impacts
This is the increased heating load as a result of a more efficient motor.
153 Sachs, Harvey (2003). Energy Savings form Efficient Furnace Air Handlers in Massachusetts. 154 Estimated using demand allocation methodology described in: Quantec, LLC (2000). Impact Evaluation: Single-Family
EnergyWise Program. Prepared for National Grid. 155 GDS Associates, Inc. (2007). Measure Life Report: Residential and Commercial/Industrial Lighting and HVAC Measures. Prepared for The New England State Program Working Group; Page 1-3, Table 1.
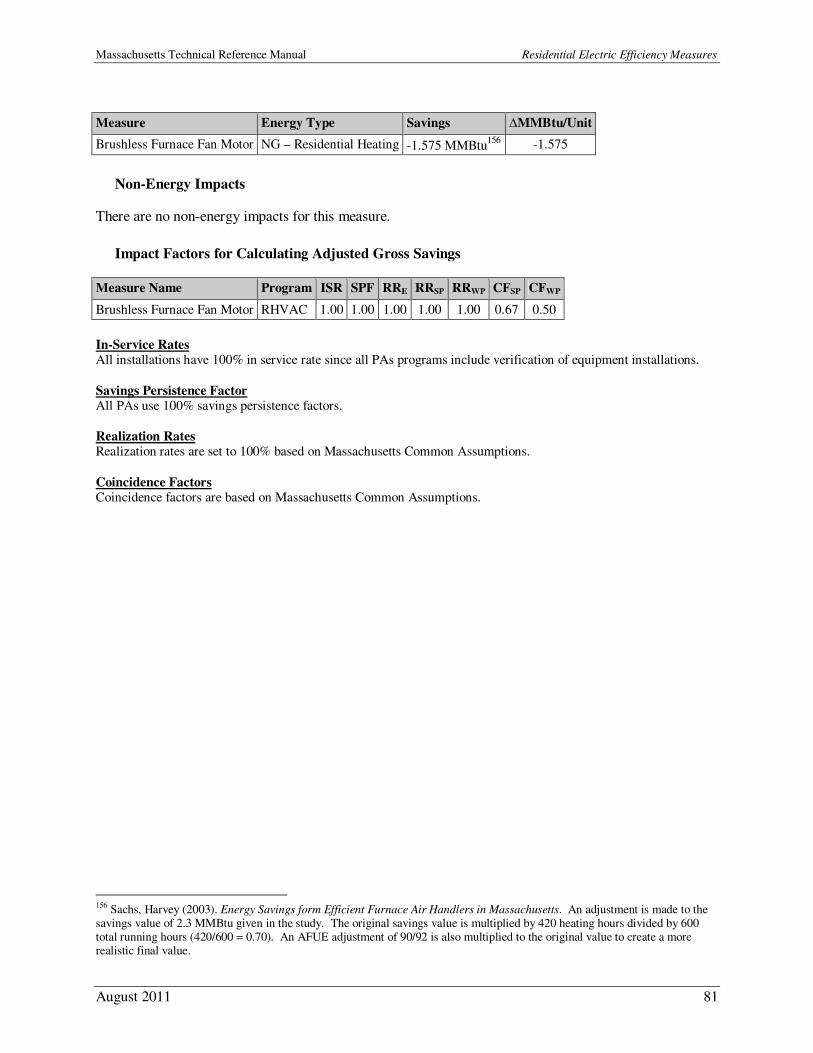
Massachusetts Technical Reference Manual Residential Electric Efficiency Measures
August 2011 81
Measure Energy Type Savings ∆MMBtu/Unit
Brushless Furnace Fan Motor NG – Residential Heating -1.575 MMBtu156
-1.575
Non-Energy Impacts
There are no non-energy impacts for this measure.
Impact Factors for Calculating Adjusted Gross Savings
Measure Name Program ISR SPF RRE RRSP RRWP CFSP CFWP
Brushless Furnace Fan Motor RHVAC 1.00 1.00 1.00 1.00 1.00 0.67 0.50
In-Service Rates All installations have 100% in service rate since all PAs programs include verification of equipment installations.
Savings Persistence Factor All PAs use 100% savings persistence factors.
Realization Rates Realization rates are set to 100% based on Massachusetts Common Assumptions.
Coincidence Factors Coincidence factors are based on Massachusetts Common Assumptions.
156 Sachs, Harvey (2003). Energy Savings form Efficient Furnace Air Handlers in Massachusetts. An adjustment is made to the savings value of 2.3 MMBtu given in the study. The original savings value is multiplied by 420 heating hours divided by 600 total running hours (420/600 = 0.70). An AFUE adjustment of 90/92 is also multiplied to the original value to create a more realistic final value.
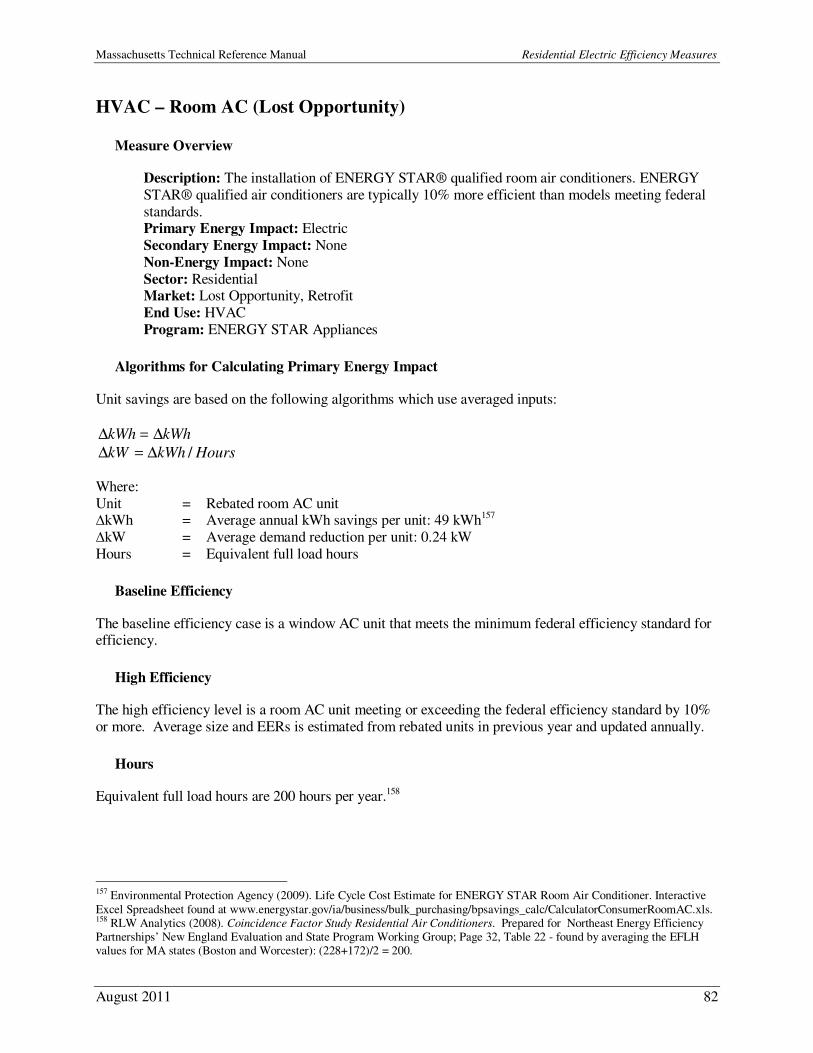
Massachusetts Technical Reference Manual Residential Electric Efficiency Measures
August 2011 82
HVAC – Room AC (Lost Opportunity)
Measure Overview
Description: The installation of ENERGY STAR® qualified room air conditioners. ENERGY
STAR® qualified air conditioners are typically 10% more efficient than models meeting federal
standards. Primary Energy Impact: Electric
Secondary Energy Impact: None
Non-Energy Impact: None
Sector: Residential Market: Lost Opportunity, Retrofit
End Use: HVAC
Program: ENERGY STAR Appliances
Algorithms for Calculating Primary Energy Impact
Unit savings are based on the following algorithms which use averaged inputs:
kWhkWh ∆=∆
HourskWhkW /∆=∆
Where:
Unit = Rebated room AC unit ∆kWh = Average annual kWh savings per unit: 49 kWh157
∆kW = Average demand reduction per unit: 0.24 kW
Hours = Equivalent full load hours
Baseline Efficiency
The baseline efficiency case is a window AC unit that meets the minimum federal efficiency standard for efficiency.
High Efficiency
The high efficiency level is a room AC unit meeting or exceeding the federal efficiency standard by 10%
or more. Average size and EERs is estimated from rebated units in previous year and updated annually.
Hours
Equivalent full load hours are 200 hours per year.158
157 Environmental Protection Agency (2009). Life Cycle Cost Estimate for ENERGY STAR Room Air Conditioner. Interactive
Excel Spreadsheet found at www.energystar.gov/ia/business/bulk_purchasing/bpsavings_calc/CalculatorConsumerRoomAC.xls. 158 RLW Analytics (2008). Coincidence Factor Study Residential Air Conditioners. Prepared for Northeast Energy Efficiency Partnerships’ New England Evaluation and State Program Working Group; Page 32, Table 22 - found by averaging the EFLH values for MA states (Boston and Worcester): (228+172)/2 = 200.
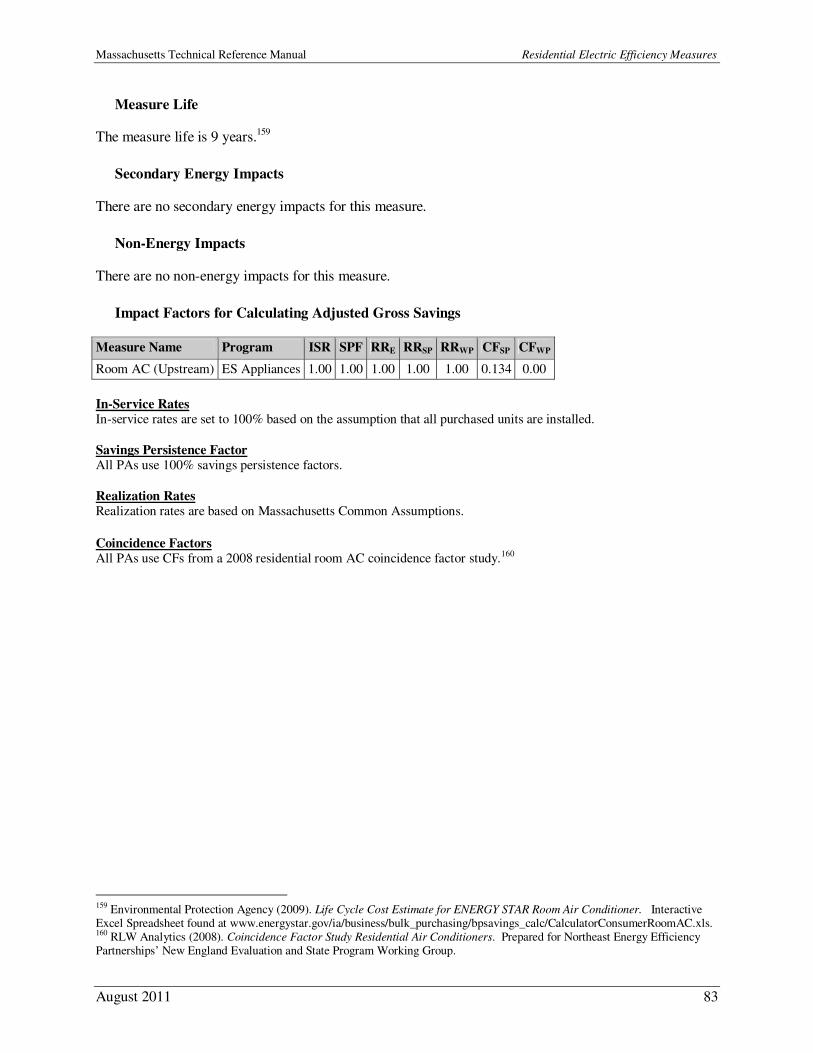
Massachusetts Technical Reference Manual Residential Electric Efficiency Measures
August 2011 83
Measure Life
The measure life is 9 years.159
Secondary Energy Impacts
There are no secondary energy impacts for this measure.
Non-Energy Impacts
There are no non-energy impacts for this measure.
Impact Factors for Calculating Adjusted Gross Savings
Measure Name Program ISR SPF RRE RRSP RRWP CFSP CFWP
Room AC (Upstream) ES Appliances 1.00 1.00 1.00 1.00 1.00 0.134 0.00
In-Service Rates In-service rates are set to 100% based on the assumption that all purchased units are installed.
Savings Persistence Factor All PAs use 100% savings persistence factors.
Realization Rates Realization rates are based on Massachusetts Common Assumptions.
Coincidence Factors All PAs use CFs from a 2008 residential room AC coincidence factor study.160
159 Environmental Protection Agency (2009). Life Cycle Cost Estimate for ENERGY STAR Room Air Conditioner. Interactive Excel Spreadsheet found at www.energystar.gov/ia/business/bulk_purchasing/bpsavings_calc/CalculatorConsumerRoomAC.xls. 160 RLW Analytics (2008). Coincidence Factor Study Residential Air Conditioners. Prepared for Northeast Energy Efficiency Partnerships’ New England Evaluation and State Program Working Group.
Massachusetts Technical Reference Manual Residential Electric Efficiency Measures
August 2011 84
HVAC – Window AC Replacement (Retrofit)
Measure Overview
Description: Replacement of existing inefficient room air conditioners with more efficient
models. This is only offered as a measure when an AC timer would not reduce usage during the
peak period. Primary Energy Impact: Electric
Secondary Energy Impact: None
Non-Energy Impact: Annual Discounted Rate Cost Reduction, Annual Participant Benefit
Sector: Low Income Market: Retrofit
End Use: HVAC
Program: Low-Income 1-4 Family Retrofit
Algorithms for Calculating Primary Energy Impact
Unit savings are deemed based on study results:
kWhkWh ∆=∆
kWkW ∆=∆
Where:
Unit = Removal of existing window AC unit and installation of new efficient window AC unit
∆kWh = Average annual kWh savings per unit: 100 kWh161
∆kW = Max load kW reduction: 0.214 kW162
Baseline Efficiency
The baseline efficiency case is the existing air conditioning unit.
High Efficiency
The high efficiency case is the high efficiency room air conditioning unit.
Hours
Not applicable.
Measure Life
The measure life is 12 years.163
161 Quantec, LLC (2005). Evaluation of National Grid’s 2003 Appliance Management Program: Room Air Conditioning
Metering and Non-Energy Benefits Study. Prepared for National Grid. 162 Estimated using demand allocation methodology described in: Quantec, LLC (2000). Impact Evaluation: Single-Family
EnergyWise Program. Prepared for National Grid. 163 Environmental Protection Agency (2009). Life Cycle Cost Estimate for ENERGY STAR Room Air Conditioner. Interactive Excel Spreadsheet found at www.energystar.gov/ia/business/bulk_purchasing/bpsavings_calc/CalculatorConsumerRoomAC.xls.
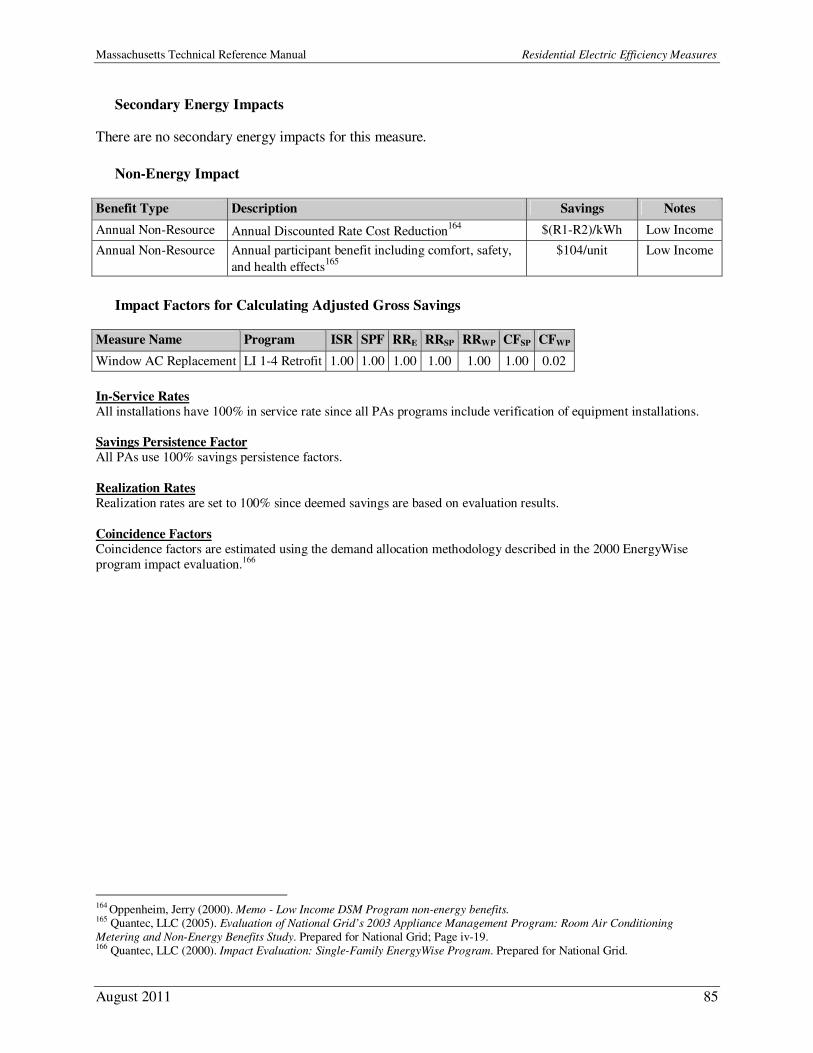
Massachusetts Technical Reference Manual Residential Electric Efficiency Measures
August 2011 85
Secondary Energy Impacts
There are no secondary energy impacts for this measure.
Non-Energy Impact
Benefit Type Description Savings Notes
Annual Non-Resource Annual Discounted Rate Cost Reduction164
$(R1-R2)/kWh Low Income
Annual Non-Resource Annual participant benefit including comfort, safety,
and health effects165
$104/unit Low Income
Impact Factors for Calculating Adjusted Gross Savings
Measure Name Program ISR SPF RRE RRSP RRWP CFSP CFWP
Window AC Replacement LI 1-4 Retrofit 1.00 1.00 1.00 1.00 1.00 1.00 0.02
In-Service Rates All installations have 100% in service rate since all PAs programs include verification of equipment installations.
Savings Persistence Factor All PAs use 100% savings persistence factors.
Realization Rates Realization rates are set to 100% since deemed savings are based on evaluation results.
Coincidence Factors Coincidence factors are estimated using the demand allocation methodology described in the 2000 EnergyWise
program impact evaluation.166
164 Oppenheim, Jerry (2000). Memo - Low Income DSM Program non-energy benefits. 165 Quantec, LLC (2005). Evaluation of National Grid’s 2003 Appliance Management Program: Room Air Conditioning
Metering and Non-Energy Benefits Study. Prepared for National Grid; Page iv-19. 166 Quantec, LLC (2000). Impact Evaluation: Single-Family EnergyWise Program. Prepared for National Grid.

Massachusetts Technical Reference Manual Residential Electric Efficiency Measures
August 2011 86
HVAC – Electric Weatherization
Measure Overview
Description: Installation of weatherization measures such as air sealing and insulation in
electrically heated homes.
Primary Energy Impact: Electric Secondary Energy Impact: None
Non-Energy Impact: Annual Discounted Rate Cost Reduction, One-Time Arrearage Reduction,
Annual Fire, Illness and Moving Avoidance Benefits, One-Time Property Value Benefit
Sector: Low Income Market: Retrofit
End Use: HVAC
Program: Low-Income 1-4 Family Retrofit
Algorithms for Calculating Primary Energy Impact
Unit savings are deemed based on study results:
kWhkWh ∆=∆
kWkW ∆=∆
Where:
Unit = Electrically-heated household with weatherization measures installed
∆kWh = Average annual kWh reduction: 374 kWh167
∆kW = Average annual kW reduction: 0.047 kW168
Baseline Efficiency
The baseline efficiency case is any existing home shell measures.
High Efficiency
The high efficiency case includes increased weatherization insulation levels.
Hours
Not applicable.
Measure Life
The measure life is 20 years.169
167 Cadmus Group, Inc. (2009). Impact Evaluation of the 2007 Appliance Management Program and Low Income Weatherization
Program. Prepared for National Grid; Table 1. 168 Estimated using demand allocation methodology described in: Quantec, LLC (2000). Impact Evaluation: Single-Family
EnergyWise Program. Prepared for National Grid. 169 Massachusetts Common Assumption.
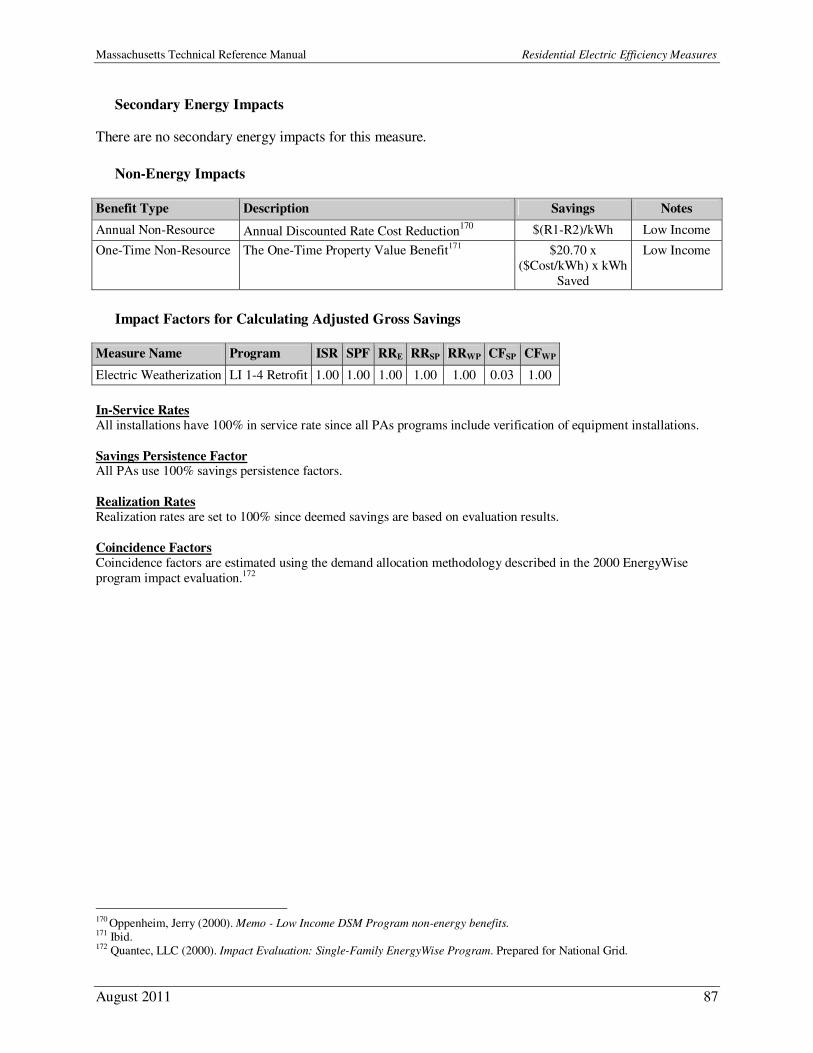
Massachusetts Technical Reference Manual Residential Electric Efficiency Measures
August 2011 87
Secondary Energy Impacts
There are no secondary energy impacts for this measure.
Non-Energy Impacts
Benefit Type Description Savings Notes
Annual Non-Resource Annual Discounted Rate Cost Reduction170
$(R1-R2)/kWh Low Income
One-Time Non-Resource The One-Time Property Value Benefit171 $20.70 x
($Cost/kWh) x kWh
Saved
Low Income
Impact Factors for Calculating Adjusted Gross Savings
Measure Name Program ISR SPF RRE RRSP RRWP CFSP CFWP
Electric Weatherization LI 1-4 Retrofit 1.00 1.00 1.00 1.00 1.00 0.03 1.00
In-Service Rates All installations have 100% in service rate since all PAs programs include verification of equipment installations.
Savings Persistence Factor All PAs use 100% savings persistence factors.
Realization Rates Realization rates are set to 100% since deemed savings are based on evaluation results.
Coincidence Factors Coincidence factors are estimated using the demand allocation methodology described in the 2000 EnergyWise
program impact evaluation.172
170 Oppenheim, Jerry (2000). Memo - Low Income DSM Program non-energy benefits. 171 Ibid. 172 Quantec, LLC (2000). Impact Evaluation: Single-Family EnergyWise Program. Prepared for National Grid.
Massachusetts Technical Reference Manual Residential Electric Efficiency Measures
August 2011 88
HVAC – Oil Weatherization
Measure Overview
Description: Installation of weatherization measures such as air sealing and insulation in oil
heated homes. Electric savings are achieved from reduced fan run time for heating and cooling
systems. Primary Energy Impact: Oil
Secondary Energy Impact: Electric
Non-Energy Impact: Annual Discounted Rate Cost Reduction, One-Time Arrearage Reduction,
Annual Fire, Illness and Moving Avoidance Benefits, One-Time Property Value Benefit Sector: Low Income
Market: Retrofit
End Use: HVAC Program: Low-Income 1-4 Family Retrofit
Algorithms for Calculating Primary Energy Impact
Unit savings are deemed based on study results:
kWhkWh ∆=∆
kWkW ∆=∆
Where:
Unit = Oil heated household with weatherization measures installed
∆kWh = Average annual kWh reduction: 70 kWh173 ∆kW = Average annual kW reduction: 0.009 kW174
Baseline Efficiency
The baseline efficiency case is any existing home shell measures.
High Efficiency
The high efficiency case includes increased weatherization insulation levels.
Hours
Not applicable.
Measure Life
The measure life is 20 years.175
173 Cadmus Group, Inc. (2009). Impact Evaluation of the 2007 Appliance Management Program and Low Income Weatherization
Program. Prepared for National Grid. 174 Estimated using demand allocation methodology described in: Quantec, LLC (2000). Impact Evaluation: Single-Family
EnergyWise Program. Prepared for National Grid. 175 GDS Associates, Inc. (2007). Measure Life Report: Residential and Commercial/Industrial Lighting and HVAC Measures. Prepared for The New England State Program Working Group; Page A-2.
Massachusetts Technical Reference Manual Residential Electric Efficiency Measures
August 2011 89
Secondary Energy Impacts
Measure Energy Type Savings176
∆MMBtu/Unit
Oil Weatherization Oil 98 gallons/home 13.7
Non-Energy Impacts
Benefit Type Description Savings Notes
Annual Non-Resource Annual Discounted Rate Cost
Reduction177
$(R1-R2)/kWh Low Income
One-Time Non-Resource The One-Time Property Value Benefit
(Electric)178
$20.70 x ($Cost/kWh)
x kWh Saved
Low Income
One-Time Non-Resource The One-Time Property Value Benefit
(Oil)179
$20.70 x ($Cost/gal
Oil) x gal Oil Saved
Low Income
Impact Factors for Calculating Adjusted Gross Savings
Measure Name Program ISR SPF RRE RRSP RRWP CFSP CFWP
Oil Weatherization LI 1-4 Retrofit 1.00 1.00 1.00 1.00 1.00 0.03 1.00
In-Service Rates All installations have 100% in service rate since all PAs programs include verification of equipment installations.
Savings Persistence Factor All PAs use 100% savings persistence factors.
Realization Rates Realization rates are set to 100% since deemed savings are based on evaluation results.
Coincidence Factors Coincidence factors are estimated using the demand allocation methodology described in the 2000 EnergyWise
program impact evaluation.180
176 Cadmus Group, Inc. (2009). Impact Evaluation of the 2007 Appliance Management Program and Low Income Weatherization
Program. Prepared for National Grid. 177 Oppenheim, Jerry (2000). Memo - Low Income DSM Program non-energy benefits. 178 Ibid. 179 Ibid. 180 Quantec, LLC (2000). Impact Evaluation: Single-Family EnergyWise Program. Prepared for National Grid.
Massachusetts Technical Reference Manual Residential Electric Efficiency Measures
August 2011 90
HVAC – Heating System Replacement (Oil)
Measure Overview
Description: Replacement of existing oil heating system with a new high efficiency system.
Electric savings can be attributed to reduced fan run time and reduced usage of electric space
heaters. Primary Energy Impact: Oil
Secondary Energy Impact: Electric
Non-Energy Impact: Annual Discounted Rate Cost Reduction, One-Time Arrearage Reduction,
Annual Fire, Illness and Moving Avoidance Benefits, One-Time Property Value Benefit Sector: Low Income
Market: Retrofit
End Use: HVAC Program: Low-Income 1-4 Family Retrofit
Algorithms for Calculating Primary Energy Impact
Unit savings are deemed based on study results:
kWhkWh ∆=∆
kWkW ∆=∆
Where:
Unit = Installation of new high efficiency oil heating system
∆kWh = Average annual kWh savings per unit: 194 kWh181 ∆kW = Average annual kW reduction per unit: 0.024 kW182
Baseline Efficiency
The baseline efficiency case is the existing inefficient heating equipment.
High Efficiency
The high efficiency case is the new efficient heating equipment.
Hours
Not applicable.
Measure Life
The measure life is 18 years.183
181 Cadmus Group, Inc. (2009). Impact Evaluation of the 2007 Appliance Management Program and Low Income Weatherization
Program. Prepared for National Grid. 182 Estimated using demand allocation methodology described in: Quantec, LLC (2000). Impact Evaluation: Single-Family
EnergyWise Program. Prepared for National Grid. 183 Environmental Protection Agency (2009). Life Cycle Cost Estimate for ENERGY STAR Furnace. Interactive Excel Spreadsheet found at www.energystar.gov/ia/business/bulk_purchasing/bpsavings_calc/Calc_Furnaces.xls.
Massachusetts Technical Reference Manual Residential Electric Efficiency Measures
August 2011 91
Secondary Energy Impacts
Measure Energy Type Savings ∆MMBtu/Unit
Heating System Replacement (Oil) Oil 87 Gallons/home184
12.2
Non-Energy Impacts
Benefit Type Description Savings185
Notes
Annual Non-
Resource
Annual Discounted Rate Cost Reduction $(R1-R2)/kWh Low
Income
One-Time Non-
Resource
One-Time Property Value Benefit (Electric) $20.70 x $Cost/kWh x kWh
Saved
Low
Income
One-Time Non-Resource
One-Time Property Value Benefit (Oil) $20.70 x $Cost/gal Oil x gal Oil Saved
Low Income
Impact Factors for Calculating Adjusted Gross Savings
Measure Name Program ISR SPF RRE RRSP RRWP CFSP CFWP
Heating System Replacement (Oil) LI 1-4 Retrofit 1.00 1.00 1.00 1.00 1.00 0.03 1.00
In-Service Rates All installations have 100% in service rate since all PAs programs include verification of equipment installations.
Savings Persistence Factor All PAs use 100% savings persistence factors.
Realization Rates Realization rates are set to 100% since deemed savings are based on evaluation results.
Coincidence Factors Coincidence factors are estimated using the demand allocation methodology described in the 2000 EnergyWise
program impact evaluation.186
184 Cadmus Group, Inc. (2009). Impact Evaluation of the 2007 Appliance Management Program and Low Income Weatherization
Program. Prepared for National Grid. 185 Oppenheim, Jerry (2000). Memo - Low Income DSM Program non-energy benefits. 186 Quantec, LLC (2000). Impact Evaluation: Single-Family EnergyWise Program. Prepared for National Grid.
Massachusetts Technical Reference Manual Residential Electric Efficiency Measures
August 2011 92
HVAC/Hot Water – ENERGY STAR® Homes Heating, Cooling, and DHW
Measures
Measure Overview
Description: To capture lost opportunities, encourage the construction of energy-efficient homes,
and drive the market to one in which new homes are moving towards net-zero energy.
Primary Energy Impact: Electric Secondary Energy Impact: Natural Gas, Oil, Propane
Non-Energy Impact: Annual Discounted Rate Cost Reduction (Low Income only)
Sector: Residential, Low Income
Market: Lost Opportunity End Use: HVAC, Hot Water
Program: Residential New Construction & Major Renovation, Low-Income Residential New
Construction
Algorithms for Calculating Primary Energy Impact
As part of the ENERGY STAR® certification process, projected energy use is calculated for each home completed through the program and a geometrically matching baseline home (User Defined Reference
Home) using Beacon, an ICF International proprietary DOE-2 based building energy simulation tool. The
difference between the projected energy consumption of these two homes represents the energy savings produced by the certified home. This process is used to calculate electric demand as well as electric and
fossil fuel energy savings due to heating, cooling, and water heating for all homes, both single family and
multifamily. This process is documented in “Energy/Demand Savings Calculation and Reporting
Methodology for the Massachusetts ENERGY STAR® Homes Program.”187
Baseline Efficiency
The User Defined Reference Home was revised for 2006 as a result of the baseline study completed in
2006.188
High Efficiency
The high efficiency case is represented by the specific energy characteristics of each “as-built” home
completed through the program.
Hours
Not applicable.
187 ICF (2008). Energy/Demand Savings Calculation and Reporting Methodology for the Massachusetts ENERGY STAR ®
Homes Program. Prepared for Joint Management Committee. 188 Nexus Market Research & Dorothy Conant (2006). Massachusetts ENERGY STAR ® Homes: 2005 Baseline Study: Part I: Inspection Data Analysis Final Report. Prepared for Joint Management Committee. AND Nexus Market Research & Dorothy Conant (2006). Massachusetts ENERGY STAR ® Homes: 2005 Baseline Study: Part II: Homeowner Survey Analysis Incorporating Inspection Data Final Report. Prepared for Joint Management Committee.
Massachusetts Technical Reference Manual Residential Electric Efficiency Measures
August 2011 93
Measure Life
Measure Type Measure Life (years)189
Cooling 25
Heating 25
Water Heating 15
Secondary Energy Impacts
Gas, Oil and Propane savings for heating and water heating measures are custom calculating using the
same methodology described for the electric energy and demand savings.
Non-Energy Impacts
Benefit Type Description Savings Notes
Annual Non-Resource Annual Discounted Rate Cost Reduction190
$(R1-R2)/kWh Low Income
One-Time Non-Resource One Time Arrearage Reduction191
$35/Participant Low Income
heating measures
only
Impact Factors for Calculating Adjusted Gross Savings
Measure Name Program ISR SPF RRE RRSP RRWP CFSP CFWP
ES Homes – Cooling RNC, LI RNC 1.00 1.00 1.00 1.00 1.00 custom custom
ES Homes – Heating RNC, LI RNC 1.00 1.00 1.00 1.00 1.00 custom custom
ES Homes – Water Heating RNC, LI RNC 1.00 1.00 1.00 1.00 1.00 custom custom
In-Service Rates All installations have 100% in service rate since all PA programs include verification of equipment installations.
Savings Persistence Factor All PAs use 100% savings persistence factors.
Realization Rates Realization rates are 100% because energy and demand savings are custom calculated based on project specific
detail.
Coincidence Factors Coincidence factors are custom calculated based on project-specific detail.
189 Massachusetts Common Assumption. 190 Oppenheim, Jerry (2000). Memo - Low Income DSM Program non-energy benefits. 191 Ibid.
Massachusetts Technical Reference Manual Residential Electric Efficiency Measures
August 2011 94
Hot Water – Domestic Hot Water Measures (Electric)
Measure Overview
Description: Installation of domestic hot water (DHW) measures including low flow
showerheads, faucet aerators, and tank and pipe wraps in homes with electric water heating.
Primary Energy Impact: Electric Secondary Energy Impact: None
Non-Energy Impact: Residential Water, Annual Discounted Rate Cost Reduction
Sector: Low Income
Market: Retrofit End Use: Hot Water
Program: Low-Income 1-4 Family Retrofit,
Algorithms for Calculating Primary Energy Impact
Unit savings are deemed based on study results:
kWhkWh ∆=∆
kWkW ∆=∆
Where: Unit = Household with hot water efficiency measures installed
∆kWh = Average annual kWh savings per unit: 134 kWh192
∆kW = Average annual kW reduction per unit: 0.017 kW193
Baseline Efficiency
The baseline efficiency case is the existing hot water equipment.
High Efficiency
The high efficiency case includes low flow showerheads and faucet aerators as well as tank and pipe wraps.
Hours
Not applicable.
Measure Life
The measure life is 7 years.194
192 Cadmus Group, Inc. (2009). Impact Evaluation of the 2007 Appliance Management Program and Low Income Weatherization
Program. Prepared for National Grid. 193 Estimated using demand allocation methodology described in: Quantec, LLC (2000). Impact Evaluation: Single-Family
EnergyWise Program. Prepared for National Grid. 194 Massachusetts Common Assumption.
Massachusetts Technical Reference Manual Residential Electric Efficiency Measures
August 2011 95
Secondary Energy Impacts
There are no secondary energy impacts for this measure.
Non-Energy Impacts
Benefit Type Description Savings Notes
Residential Water Residential water savings per participant 8,785 Gallons/Participant
Annual Non-Resource Annual Discounted Rate Cost Reduction195
$(R1-R2)/kWh Low Income
Impact Factors for Calculating Adjusted Gross Savings
Measure Name Program ISR SPF RRE RRSP RRWP CFSP CFWP
DHW Measures (Electric) LI 1-4 Retrofit 1.00 1.00 1.00 1.00 1.00 0.75 1.00
In-Service Rates All installations have 100% in service rate since all PAs programs include verification of equipment installations.
Savings Persistence Factor All PAs use 100% savings persistence factors.
Realization Rates Realization rates are set to 100% since deemed savings are based on evaluation results.
Coincidence Factors Coincidence factors are estimated using the demand allocation methodology described in the 2000 EnergyWise
program impact evaluation.196
195 Oppenheim, Jerry (2000). Memo - Low Income DSM Program non-energy benefits. 196 Quantec, LLC (2000). Impact Evaluation: Single-Family EnergyWise Program. Prepared for National Grid.
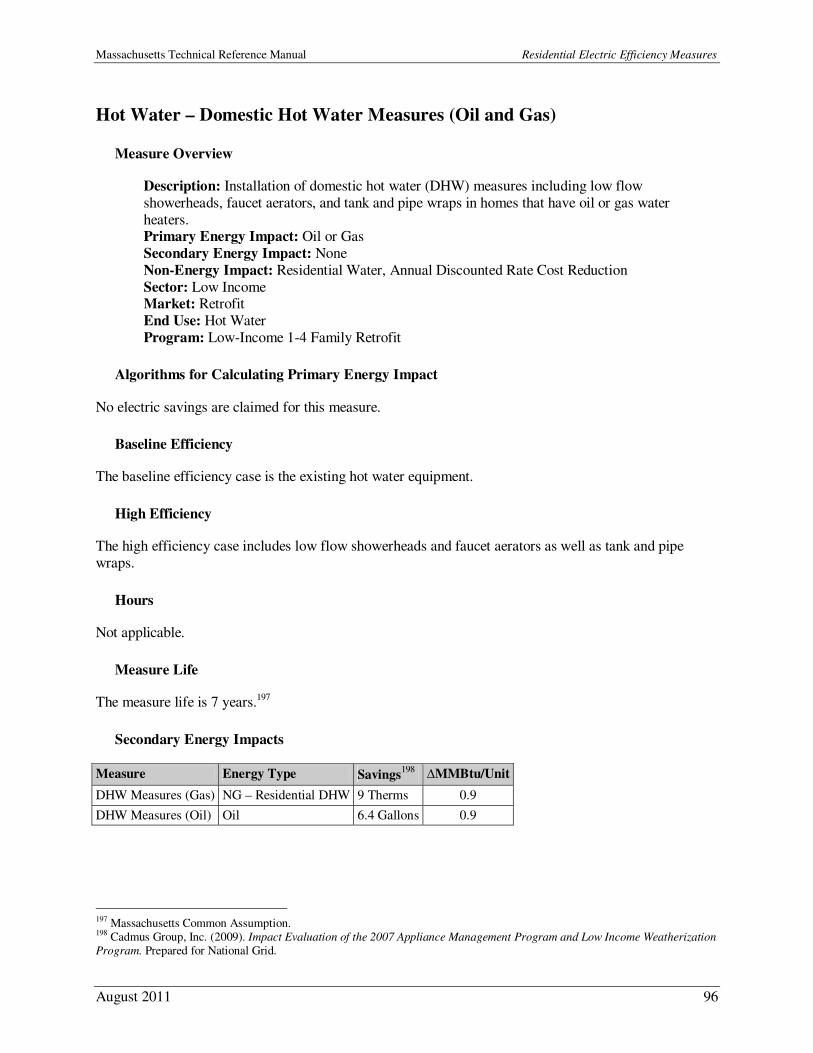
Massachusetts Technical Reference Manual Residential Electric Efficiency Measures
August 2011 96
Hot Water – Domestic Hot Water Measures (Oil and Gas)
Measure Overview
Description: Installation of domestic hot water (DHW) measures including low flow
showerheads, faucet aerators, and tank and pipe wraps in homes that have oil or gas water
heaters. Primary Energy Impact: Oil or Gas
Secondary Energy Impact: None
Non-Energy Impact: Residential Water, Annual Discounted Rate Cost Reduction
Sector: Low Income Market: Retrofit
End Use: Hot Water
Program: Low-Income 1-4 Family Retrofit
Algorithms for Calculating Primary Energy Impact
No electric savings are claimed for this measure.
Baseline Efficiency
The baseline efficiency case is the existing hot water equipment.
High Efficiency
The high efficiency case includes low flow showerheads and faucet aerators as well as tank and pipe
wraps.
Hours
Not applicable.
Measure Life
The measure life is 7 years.197
Secondary Energy Impacts
Measure Energy Type Savings198
∆MMBtu/Unit
DHW Measures (Gas) NG – Residential DHW 9 Therms 0.9
DHW Measures (Oil) Oil 6.4 Gallons 0.9
197 Massachusetts Common Assumption. 198 Cadmus Group, Inc. (2009). Impact Evaluation of the 2007 Appliance Management Program and Low Income Weatherization
Program. Prepared for National Grid.
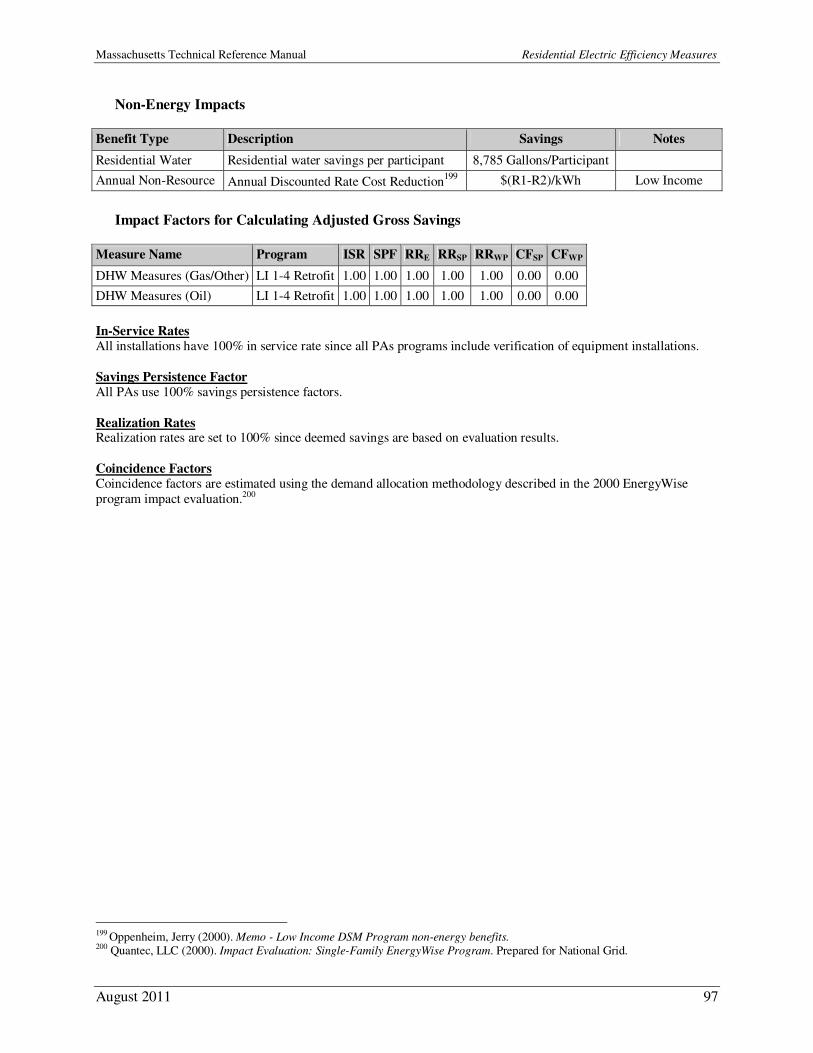
Massachusetts Technical Reference Manual Residential Electric Efficiency Measures
August 2011 97
Non-Energy Impacts
Benefit Type Description Savings Notes
Residential Water Residential water savings per participant 8,785 Gallons/Participant
Annual Non-Resource Annual Discounted Rate Cost Reduction199
$(R1-R2)/kWh Low Income
Impact Factors for Calculating Adjusted Gross Savings
Measure Name Program ISR SPF RRE RRSP RRWP CFSP CFWP
DHW Measures (Gas/Other) LI 1-4 Retrofit 1.00 1.00 1.00 1.00 1.00 0.00 0.00
DHW Measures (Oil) LI 1-4 Retrofit 1.00 1.00 1.00 1.00 1.00 0.00 0.00
In-Service Rates All installations have 100% in service rate since all PAs programs include verification of equipment installations.
Savings Persistence Factor All PAs use 100% savings persistence factors.
Realization Rates Realization rates are set to 100% since deemed savings are based on evaluation results.
Coincidence Factors Coincidence factors are estimated using the demand allocation methodology described in the 2000 EnergyWise
program impact evaluation.200
199 Oppenheim, Jerry (2000). Memo - Low Income DSM Program non-energy benefits. 200 Quantec, LLC (2000). Impact Evaluation: Single-Family EnergyWise Program. Prepared for National Grid.
Massachusetts Technical Reference Manual Residential Electric Efficiency Measures
August 2011 98
Hot Water – Dishwashers
Measure Overview
Description: Installation of ENERGY STAR® qualified dishwashers in residential homes during new
construction or major renovation. ENERGY STAR® dishwashers are on average, 10% more energy-
efficient than non-qualified models.
Primary Energy Impact: Electric
Secondary Energy Impact: Natural Gas, Oil, Propane
Non-Energy Impact: Water Savings, Low Income only: Annual Discounted Rate Cost Reduction
Sector: Residential
Market: Lost Opportunity
End Use: Hot Water Program: Residential New Construction & Major Renovation, Low-Income Residential New Construction
Algorithms for Calculating Primary Energy Impact
Unit savings are deemed based on the following algorithms and assumptions:
EEBASE kWhkWhkWh −=∆
kWkW ∆=∆
Where:
Unit = Installation of ENERGY® dishwasher
∆kWh = National Grid gross average annual kWh savings per unit201: 28 kWh for RNC, 25 kWh for LI RNC
∆kW = Average annual kW savings per unit202: 0.003 kW
kWhBASE = Average unit energy consumption for non-qualified product
kWhEE = Average unit energy consumption for ENERGY STAR® qualified product
Baseline Efficiency
The baseline efficiency case is a conventional standard sized non-ENERGY STAR® qualified model
meeting Federal Standards energy performance metric criteria effective January 1, 2010 for dishwashers
with maximum energy consumption of less than or equal to 355 kWh/year and maximum water consumption of 6.5 gallons of water/cycle.203
High Efficiency
The high efficiency case is an ENERGY STAR® qualified standard sized dishwasher meeting the energy
performance metric criteria effective July 1, 2011 for dishwashers with maximum energy consumption of
greater than or equal to 307 kWh/year and maximum water consumption of 5.0 gallons/cycle.
201 Source for these values is the 9/7/09 version of the energystar.gov appliance calculator using 1/1/10 Federal Standard for
baseline consumption. 202 Ibid. 203 Home: ENERGY STAR (2010). Dishwasher Key Product Criteria. http://www.energystar.gov/index.cfm?c=dishwash.pr_crit_dishwashers. Accessed on 10/20/10.
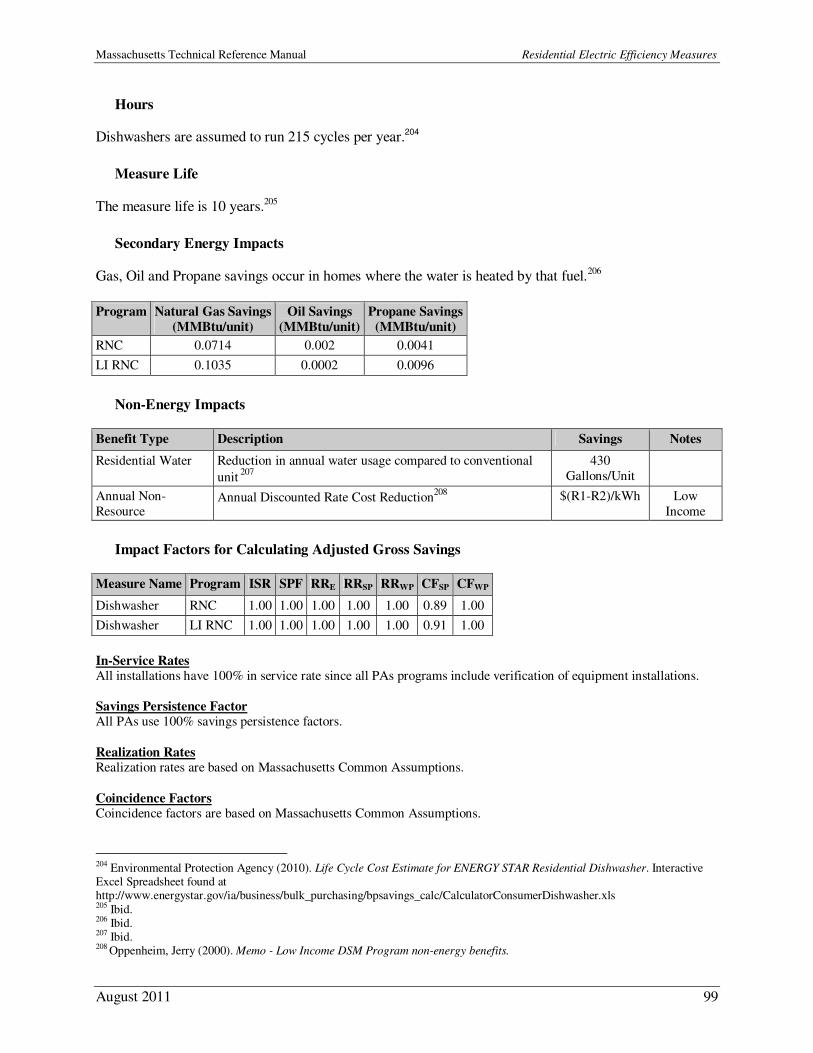
Massachusetts Technical Reference Manual Residential Electric Efficiency Measures
August 2011 99
Hours
Dishwashers are assumed to run 215 cycles per year.204
Measure Life
The measure life is 10 years.205
Secondary Energy Impacts
Gas, Oil and Propane savings occur in homes where the water is heated by that fuel.206
Program Natural Gas Savings
(MMBtu/unit)
Oil Savings
(MMBtu/unit)
Propane Savings
(MMBtu/unit)
RNC 0.0714 0.002 0.0041
LI RNC 0.1035 0.0002 0.0096
Non-Energy Impacts
Benefit Type Description Savings Notes
Residential Water Reduction in annual water usage compared to conventional
unit 207
430
Gallons/Unit
Annual Non-
Resource Annual Discounted Rate Cost Reduction
208 $(R1-R2)/kWh Low
Income
Impact Factors for Calculating Adjusted Gross Savings
Measure Name Program ISR SPF RRE RRSP RRWP CFSP CFWP
Dishwasher RNC 1.00 1.00 1.00 1.00 1.00 0.89 1.00
Dishwasher LI RNC 1.00 1.00 1.00 1.00 1.00 0.91 1.00
In-Service Rates All installations have 100% in service rate since all PAs programs include verification of equipment installations.
Savings Persistence Factor All PAs use 100% savings persistence factors.
Realization Rates Realization rates are based on Massachusetts Common Assumptions.
Coincidence Factors Coincidence factors are based on Massachusetts Common Assumptions.
204 Environmental Protection Agency (2010). Life Cycle Cost Estimate for ENERGY STAR Residential Dishwasher. Interactive Excel Spreadsheet found at http://www.energystar.gov/ia/business/bulk_purchasing/bpsavings_calc/CalculatorConsumerDishwasher.xls 205 Ibid. 206 Ibid. 207 Ibid. 208 Oppenheim, Jerry (2000). Memo - Low Income DSM Program non-energy benefits.
Massachusetts Technical Reference Manual Residential Electric Efficiency Measures
August 2011 100
Hot Water – Pool Pump
Measure Overview
Description: The installation of a 2-speed or variable speed drive pool pump. Operating a pool
pump for a longer period of time at a lower wattage can move the same amount of water using
significantly less energy. Primary Energy Impact: Electric
Secondary Energy Impact: None
Non-Energy Impact: None
Sector: Residential Market: Lost Opportunity
End Use: Hot Water
Program: ENERGY STAR Appliances
Algorithms for Calculating Primary Energy Impact
Unit savings are deemed based on the following algorithms which use averaged inputs:
%55)( ××=∆ HourskWkWh BASE
kWkW ∆=∆
Where: Unit = Rebated 2-speed or variable speed pool pump
∆kWh = Average annual kWh reduction: 400 kWh
∆kW = Average annual kW reduction: 0.071 kW209
Hours = Average annual operating hours of pump kWBASE = connected kW of baseline pump
55% = average percent energy reduction from switch to 2-speed or variable speed pump210
Baseline Efficiency
The baseline efficiency case is a single speed pump.
High Efficiency
The high efficiency case is a 2-speed or variable speed pump.
Hours
Hours are considered on a case-by-case basis since they are dependent on seasonal factors, pool size, and treatment conditions.
209 Quantec (2001). National Grid Demand Impact Template. Interactive spreadsheet tool developed for National Grid. 210 Davis Energy Group (2008). Proposal Information Template for Residential Pool Pump Measure Revisions. Prepared for Pacific Gas and Electric Company; Page 2.
Massachusetts Technical Reference Manual Residential Electric Efficiency Measures
August 2011 101
Measure Life
The measure life is 10 years.211
Secondary Energy Impacts
There are no secondary energy impacts for this measure.
Non-Energy Impacts
There are no non-energy impacts for this measure.
Impact Factors for Calculating Adjusted Gross Savings
Measure Name Program ISR SPF RRE RRSP RRWP CFSP CFWP
Pool Pumps ES Appliances 1.00 1.00 1.00 1.00 1.00 0.30 0.00
In-Service Rates In-service rates are set to 100% based on the assumption that all purchased units are installed.
Savings Persistence Factor All PAs use 100% savings persistence factors.
Realization Rates Realization rates are based on Massachusetts Common Assumptions.
Coincidence Factor Coincidence factors are based on Massachusetts Common Assumptions.
211 Davis Energy Group (2008). Proposal Information Template for Residential Pool Pump Measure Revisions. Prepared for Pacific Gas and Electric Company.
Massachusetts Technical Reference Manual Residential Electric Efficiency Measures
August 2011 102
Hot Water – Waterbed Mattress Replacement
Measure Overview
Description: Replacement of waterbed mattress with a standard mattress.
Primary Energy Impact: Electric
Secondary Energy Impact: None Non-Energy Impact: Annual Discounted Rate Cost Reduction
Sector: Low Income
Market: Retrofit
End Use: Hot Water Program: Low-Income 1-4 Family Retrofit
Algorithms for Calculating Primary Energy Impact
Unit savings are deemed based on study results:
kWhkWh ∆=∆
kWkW ∆=∆
Where:
Unit = Mattress replacement ∆kWh = Average annual kWh reduction: 872 kWh212
∆kW = Average annual kW reduction: 0.109 kW213
Baseline Efficiency
The baseline efficiency case is an existing waterbed mattress.
High Efficiency
The high efficiency case is a new standard mattress.
Hours
Not applicable.
Measure Life
The measure life is 10 years.214
212 Cadmus Group, Inc. (2009). Impact Evaluation of the 2007 Appliance Management Program and Low Income Weatherization
Program. Prepared for National Grid. 213 Estimated using demand allocation methodology described in: Quantec, LLC (2000). Impact Evaluation: Single-Family
EnergyWise Program. Prepared for National Grid. 214 See the response to the question “How do I know when I need to buy a new mattress?” at the following link for more details: http://www.serta.com/#/best-mattress-FAQs-mattresses-Serta-Number-1-Best-Selling-Mattress.html (8/19/2010).
Massachusetts Technical Reference Manual Residential Electric Efficiency Measures
August 2011 103
Secondary Energy Impacts
There are no secondary energy impacts for this measure.
Non-Energy Impacts
Benefit Type Description Savings Notes
Annual Non-Resource Annual Discounted Rate Cost Reduction215
$(R1-R2)/kWh Low Income
Impact Factors for Calculating Adjusted Gross Savings
Measure Name Program ISR SPF RRE RRSP RRWP CFSP CFWP
Waterbed LI 1-4 Retrofit 1.00 1.00 1.00 1.00 1.00 0.75 1.00
In-Service Rates All installations have 100% in service rate since all PAs programs include verification of equipment installations.
Savings Persistence Factor All PAs use 100% savings persistence factors.
Realization Rates Realization rates are set to 100% since deemed savings are based on evaluation results.
Coincidence Factors Coincidence factors are estimated using the demand allocation methodology described in the 2000 EnergyWise
program impact evaluation.216
215 Oppenheim, Jerry (2000). Memo - Low Income DSM Program non-energy benefits. 216 Quantec, LLC (2000). Impact Evaluation: Single-Family EnergyWise Program. Prepared for National Grid.
Massachusetts Technical Reference Manual Residential Electric Efficiency Measures
August 2011 104
MassSAVE – Vendor Measures
Measure Overview
Description: Retrofit measures installed through the MassSAVE program including: building
envelope insulation and air sealing, duct sealing and insulation, programmable thermostats,
heating system replacement, windows and DHW measures. Primary Energy Impact: Electric
Secondary Energy Impact: Gas, Oil, Propane
Non-Energy Impact: Water
Sector: Residential Market: Retrofit
End Use: HVAC, Hot Water
Program: MassSAVE
Algorithms for Calculating Primary Energy Impact
National Grid uses vendor calculated savings for these measures in the Residential MassSAVE electric program. These savings values are calculated using vendor proprietary software where the user inputs a
minimum set of technical data about the house and the software calculates building heating and cooling
loads and other key parameters. The proprietary building model is based on thermal transfer, building gains, and a variable-based heating/cooling degree day/hour climate model. This provides an initial
estimate of energy use that may be compared with actual billing data to adjust as needed for existing
conditions. Then, specific recommendations for improvements are added and savings are calculated using measure-specific heat transfer algorithms.
Rather than using a fixed degree day approach, the building model estimates both heating degree days and
cooling degree hours based on the actual characteristics and location of the house to determine the heating and cooling balance point temperatures. Savings from shell measures use standard U-value, area, and
degree day algorithms. Infiltration savings use site-specific seasonal N-factors to convert measured
leakage to seasonal energy impacts. HVAC savings are estimated based on changes in system and/or distribution efficiency improvements, using ASHRAE 152 as their basis. Lighting, appliance, and water
heating savings are based on standard algorithms, taking into account operating conditions and pre- and
post-retrofit energy consumption. Interactivity between architectural and mechanical measures is always included, to avoid overestimating savings due to incorrectly “adding” individual measure results.
Baseline Efficiency
The baseline efficiency case is the existing conditions of the participating household.
High Efficiency
The high efficiency case includes installed energy efficiency measures that reduce heating, cooling and
water heating energy use.
Hours
Hours are project-specific.
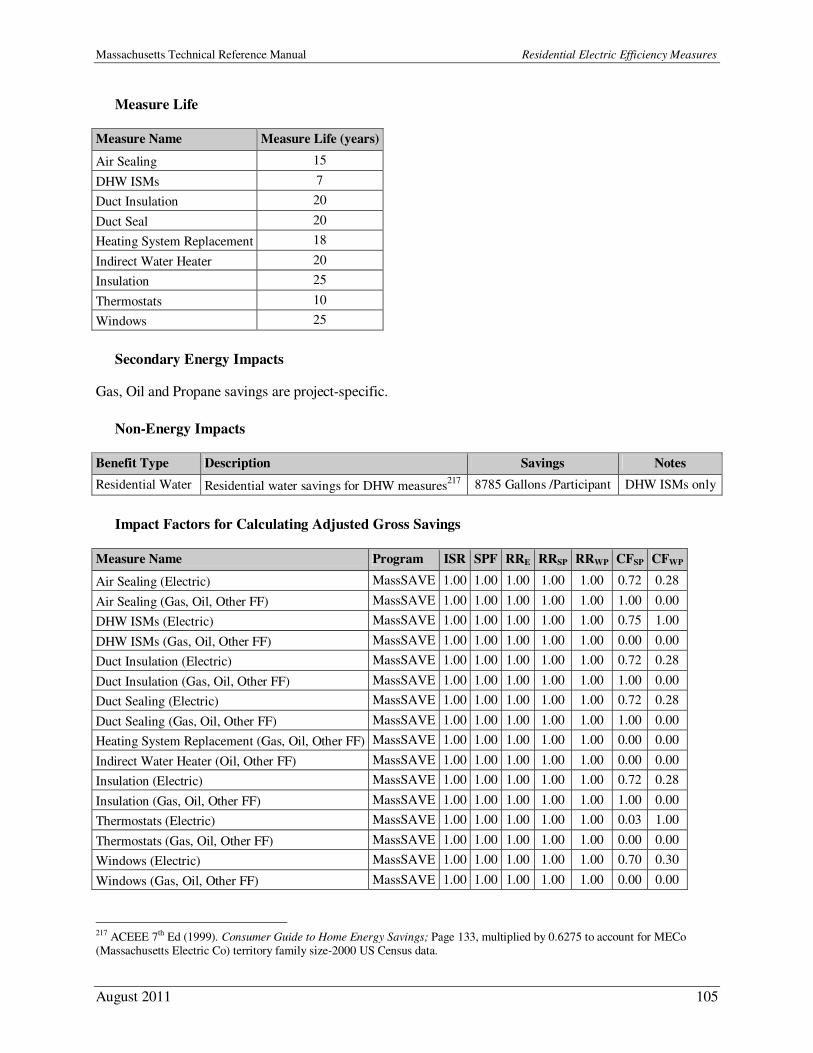
Massachusetts Technical Reference Manual Residential Electric Efficiency Measures
August 2011 105
Measure Life
Measure Name Measure Life (years)
Air Sealing 15
DHW ISMs 7
Duct Insulation 20
Duct Seal 20
Heating System Replacement 18
Indirect Water Heater 20
Insulation 25
Thermostats 10
Windows 25
Secondary Energy Impacts
Gas, Oil and Propane savings are project-specific.
Non-Energy Impacts
Benefit Type Description Savings Notes
Residential Water Residential water savings for DHW measures217 8785 Gallons /Participant DHW ISMs only
Impact Factors for Calculating Adjusted Gross Savings
Measure Name Program ISR SPF RRE RRSP RRWP CFSP CFWP
Air Sealing (Electric) MassSAVE 1.00 1.00 1.00 1.00 1.00 0.72 0.28
Air Sealing (Gas, Oil, Other FF) MassSAVE 1.00 1.00 1.00 1.00 1.00 1.00 0.00
DHW ISMs (Electric) MassSAVE 1.00 1.00 1.00 1.00 1.00 0.75 1.00
DHW ISMs (Gas, Oil, Other FF) MassSAVE 1.00 1.00 1.00 1.00 1.00 0.00 0.00
Duct Insulation (Electric) MassSAVE 1.00 1.00 1.00 1.00 1.00 0.72 0.28
Duct Insulation (Gas, Oil, Other FF) MassSAVE 1.00 1.00 1.00 1.00 1.00 1.00 0.00
Duct Sealing (Electric) MassSAVE 1.00 1.00 1.00 1.00 1.00 0.72 0.28
Duct Sealing (Gas, Oil, Other FF) MassSAVE 1.00 1.00 1.00 1.00 1.00 1.00 0.00
Heating System Replacement (Gas, Oil, Other FF) MassSAVE 1.00 1.00 1.00 1.00 1.00 0.00 0.00
Indirect Water Heater (Oil, Other FF) MassSAVE 1.00 1.00 1.00 1.00 1.00 0.00 0.00
Insulation (Electric) MassSAVE 1.00 1.00 1.00 1.00 1.00 0.72 0.28
Insulation (Gas, Oil, Other FF) MassSAVE 1.00 1.00 1.00 1.00 1.00 1.00 0.00
Thermostats (Electric) MassSAVE 1.00 1.00 1.00 1.00 1.00 0.03 1.00
Thermostats (Gas, Oil, Other FF) MassSAVE 1.00 1.00 1.00 1.00 1.00 0.00 0.00
Windows (Electric) MassSAVE 1.00 1.00 1.00 1.00 1.00 0.70 0.30
Windows (Gas, Oil, Other FF) MassSAVE 1.00 1.00 1.00 1.00 1.00 0.00 0.00
217 ACEEE 7th Ed (1999). Consumer Guide to Home Energy Savings; Page 133, multiplied by 0.6275 to account for MECo (Massachusetts Electric Co) territory family size-2000 US Census data.
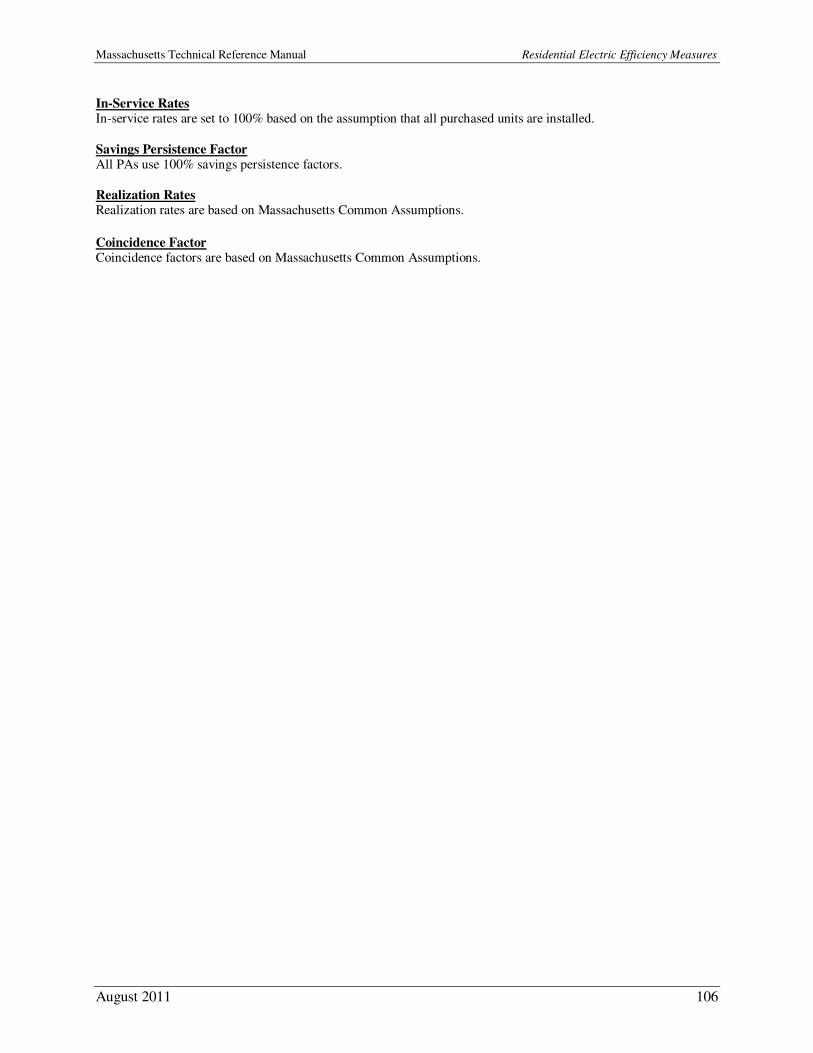
Massachusetts Technical Reference Manual Residential Electric Efficiency Measures
August 2011 106
In-Service Rates In-service rates are set to 100% based on the assumption that all purchased units are installed.
Savings Persistence Factor All PAs use 100% savings persistence factors.
Realization Rates Realization rates are based on Massachusetts Common Assumptions.
Coincidence Factor Coincidence factors are based on Massachusetts Common Assumptions.
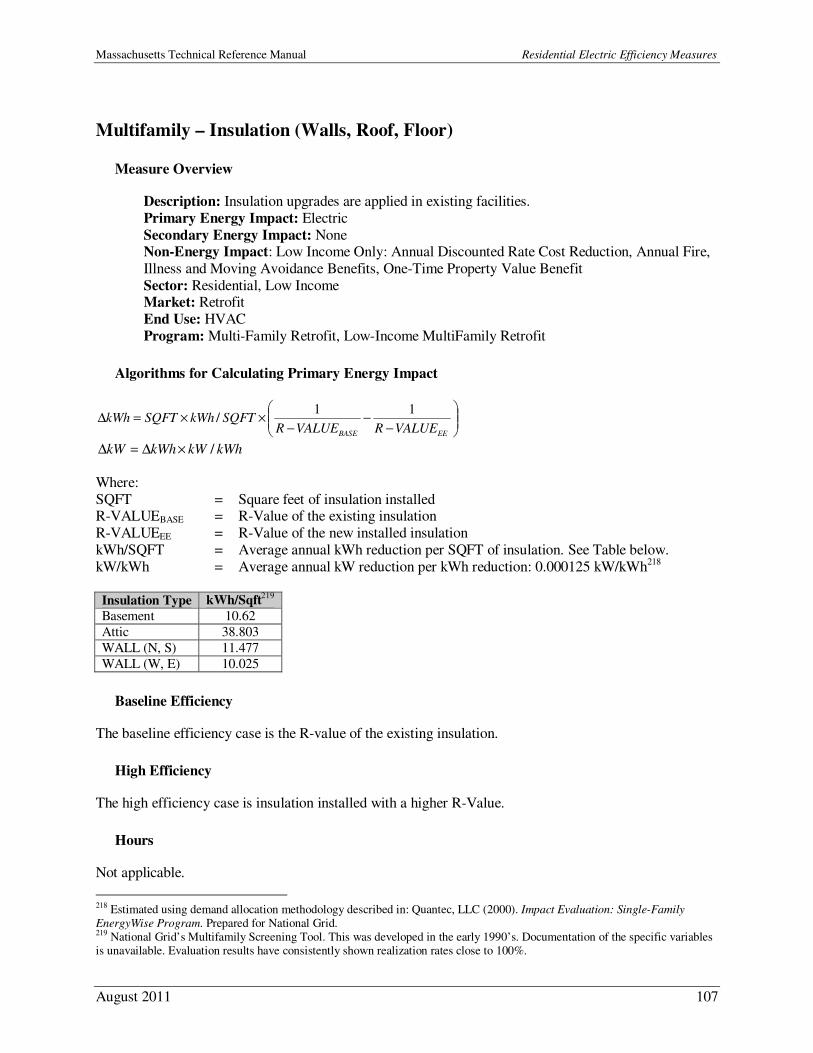
Massachusetts Technical Reference Manual Residential Electric Efficiency Measures
August 2011 107
Multifamily – Insulation (Walls, Roof, Floor)
Measure Overview
Description: Insulation upgrades are applied in existing facilities.
Primary Energy Impact: Electric
Secondary Energy Impact: None Non-Energy Impact: Low Income Only: Annual Discounted Rate Cost Reduction, Annual Fire,
Illness and Moving Avoidance Benefits, One-Time Property Value Benefit
Sector: Residential, Low Income Market: Retrofit
End Use: HVAC
Program: Multi-Family Retrofit, Low-Income MultiFamily Retrofit
Algorithms for Calculating Primary Energy Impact
−
−
−
××=∆
EEBASE VALUERVALUERSQFTkWhSQFTkWh
11/
kWhkWkWhkW /×∆=∆
Where:
SQFT = Square feet of insulation installed R-VALUEBASE = R-Value of the existing insulation
R-VALUEEE = R-Value of the new installed insulation
kWh/SQFT = Average annual kWh reduction per SQFT of insulation. See Table below.
kW/kWh = Average annual kW reduction per kWh reduction: 0.000125 kW/kWh218 Insulation Type kWh/Sqft
219
Basement 10.62
Attic 38.803
WALL (N, S) 11.477
WALL (W, E) 10.025
Baseline Efficiency
The baseline efficiency case is the R-value of the existing insulation.
High Efficiency
The high efficiency case is insulation installed with a higher R-Value.
Hours
Not applicable.
218 Estimated using demand allocation methodology described in: Quantec, LLC (2000). Impact Evaluation: Single-Family
EnergyWise Program. Prepared for National Grid. 219 National Grid’s Multifamily Screening Tool. This was developed in the early 1990’s. Documentation of the specific variables is unavailable. Evaluation results have consistently shown realization rates close to 100%.
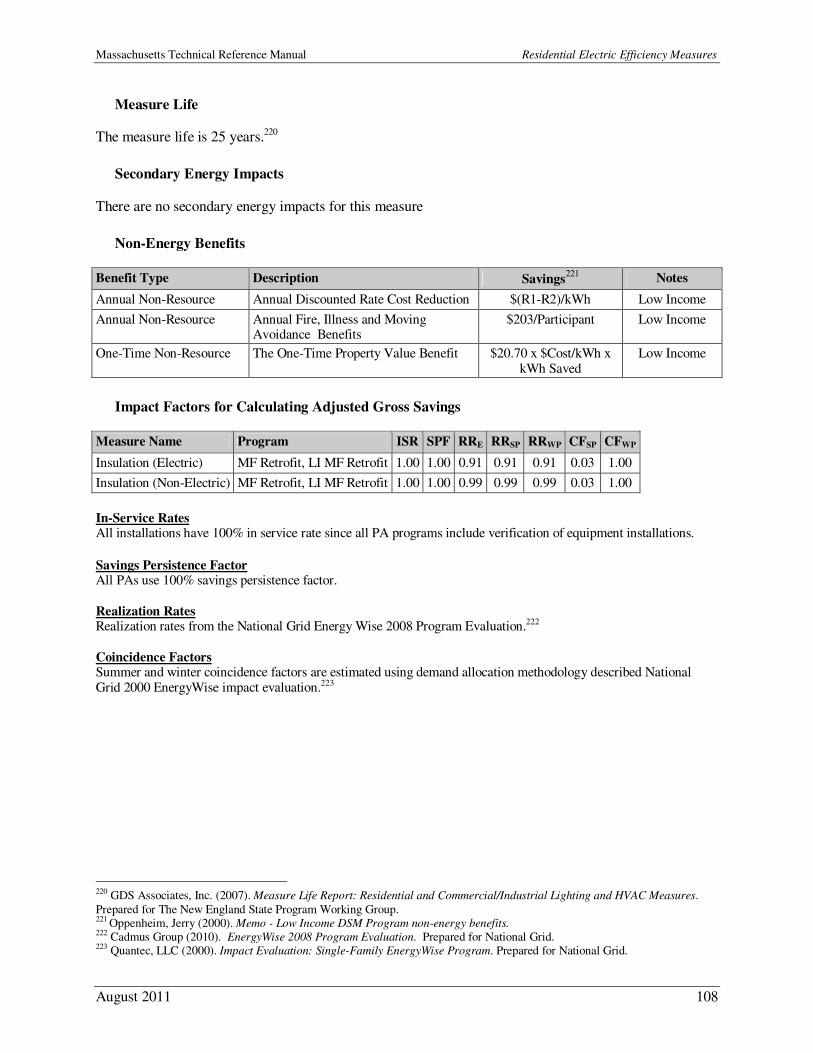
Massachusetts Technical Reference Manual Residential Electric Efficiency Measures
August 2011 108
Measure Life
The measure life is 25 years.220
Secondary Energy Impacts
There are no secondary energy impacts for this measure
Non-Energy Benefits
Benefit Type Description Savings221
Notes
Annual Non-Resource Annual Discounted Rate Cost Reduction $(R1-R2)/kWh Low Income
Annual Non-Resource Annual Fire, Illness and Moving Avoidance Benefits
$203/Participant Low Income
One-Time Non-Resource The One-Time Property Value Benefit $20.70 x $Cost/kWh x kWh Saved
Low Income
Impact Factors for Calculating Adjusted Gross Savings
Measure Name Program ISR SPF RRE RRSP RRWP CFSP CFWP
Insulation (Electric) MF Retrofit, LI MF Retrofit 1.00 1.00 0.91 0.91 0.91 0.03 1.00
Insulation (Non-Electric) MF Retrofit, LI MF Retrofit 1.00 1.00 0.99 0.99 0.99 0.03 1.00
In-Service Rates All installations have 100% in service rate since all PA programs include verification of equipment installations. Savings Persistence Factor All PAs use 100% savings persistence factor.
Realization Rates Realization rates from the National Grid Energy Wise 2008 Program Evaluation.222
Coincidence Factors Summer and winter coincidence factors are estimated using demand allocation methodology described National Grid 2000 EnergyWise impact evaluation.223
220 GDS Associates, Inc. (2007). Measure Life Report: Residential and Commercial/Industrial Lighting and HVAC Measures.
Prepared for The New England State Program Working Group. 221 Oppenheim, Jerry (2000). Memo - Low Income DSM Program non-energy benefits. 222 Cadmus Group (2010). EnergyWise 2008 Program Evaluation. Prepared for National Grid. 223 Quantec, LLC (2000). Impact Evaluation: Single-Family EnergyWise Program. Prepared for National Grid.
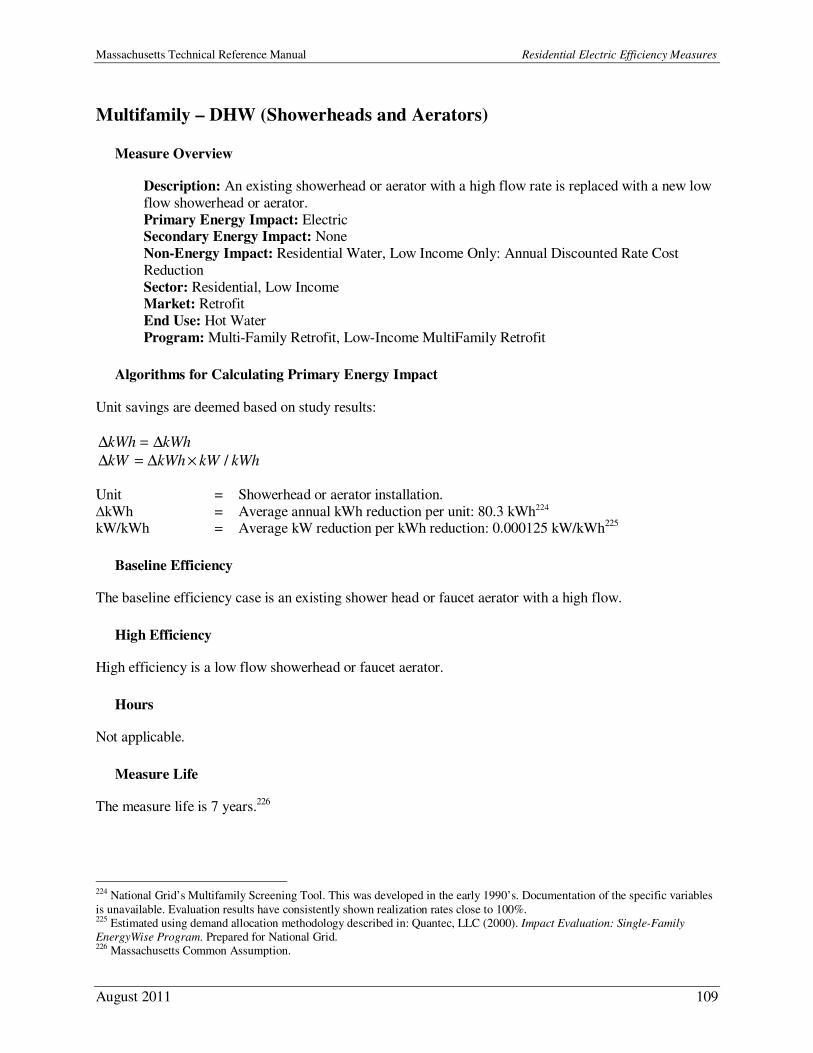
Massachusetts Technical Reference Manual Residential Electric Efficiency Measures
August 2011 109
Multifamily – DHW (Showerheads and Aerators)
Measure Overview
Description: An existing showerhead or aerator with a high flow rate is replaced with a new low
flow showerhead or aerator.
Primary Energy Impact: Electric Secondary Energy Impact: None
Non-Energy Impact: Residential Water, Low Income Only: Annual Discounted Rate Cost
Reduction
Sector: Residential, Low Income Market: Retrofit
End Use: Hot Water
Program: Multi-Family Retrofit, Low-Income MultiFamily Retrofit
Algorithms for Calculating Primary Energy Impact
Unit savings are deemed based on study results:
kWhkWh ∆=∆
kWhkWkWhkW /×∆=∆
Unit = Showerhead or aerator installation.
∆kWh = Average annual kWh reduction per unit: 80.3 kWh224 kW/kWh = Average kW reduction per kWh reduction: 0.000125 kW/kWh225
Baseline Efficiency
The baseline efficiency case is an existing shower head or faucet aerator with a high flow.
High Efficiency
High efficiency is a low flow showerhead or faucet aerator.
Hours
Not applicable.
Measure Life
The measure life is 7 years.226
224 National Grid’s Multifamily Screening Tool. This was developed in the early 1990’s. Documentation of the specific variables
is unavailable. Evaluation results have consistently shown realization rates close to 100%. 225 Estimated using demand allocation methodology described in: Quantec, LLC (2000). Impact Evaluation: Single-Family
EnergyWise Program. Prepared for National Grid. 226 Massachusetts Common Assumption.

Massachusetts Technical Reference Manual Residential Electric Efficiency Measures
August 2011 110
Secondary Energy Impacts
There are no secondary energy impacts for this measure.
Non-Energy Benefits
Benefit Type Description Savings Notes
Residential Water Gallons water saved per year per unit that received DHW
measures227
8785 Gallons/Participant
Annual Non-Resource
Annual Discounted Rate Cost Reduction228
$(R1-R2)/kWh Low Income
Impact Factors for Calculating Adjusted Gross Savings
Measure Name Program ISR SPF RRE RRSP RRWP CFSP CFWP
Showerhead/Aerator (Electric) MF Retrofit, LI MF Retrofit 1.00 1.00 0.91 0.91 0.91 0.75 1.00
Showerhead/Aerator (Non-Electric) MF Retrofit, LI MF Retrofit 1.00 1.00 0.99 0.99 0.99 0.75 1.00
In-Service Rates All installations have 100% in service rate since all PA programs include verification of equipment installations. Savings Persistence Factor All PAs use 100% savings persistence factor.
Realization Rates Realization rates from the National Grid Energy Wise 2008 Program Evaluation.229
Coincidence Factors Summer and winter coincidence factors are estimated using demand allocation methodology described National Grid 2000 EnergyWise impact evaluation.230
227 ACEEE 7th Ed (1999). Consumer Guide to Home Energy Savings; Page 133, multiplied by 0.6275 to account for MECo
(Massachusetts Electric Co) territory family size-2000 US Census data. 228 Oppenheim, Jerry (2000). Memo - Low Income DSM Program non-energy benefits. 229 Cadmus Group (2010). EnergyWise 2008 Program Evaluation. Prepared for National Grid. 230 Quantec, LLC (2000). Impact Evaluation: Single-Family EnergyWise Program. Prepared for National Grid.
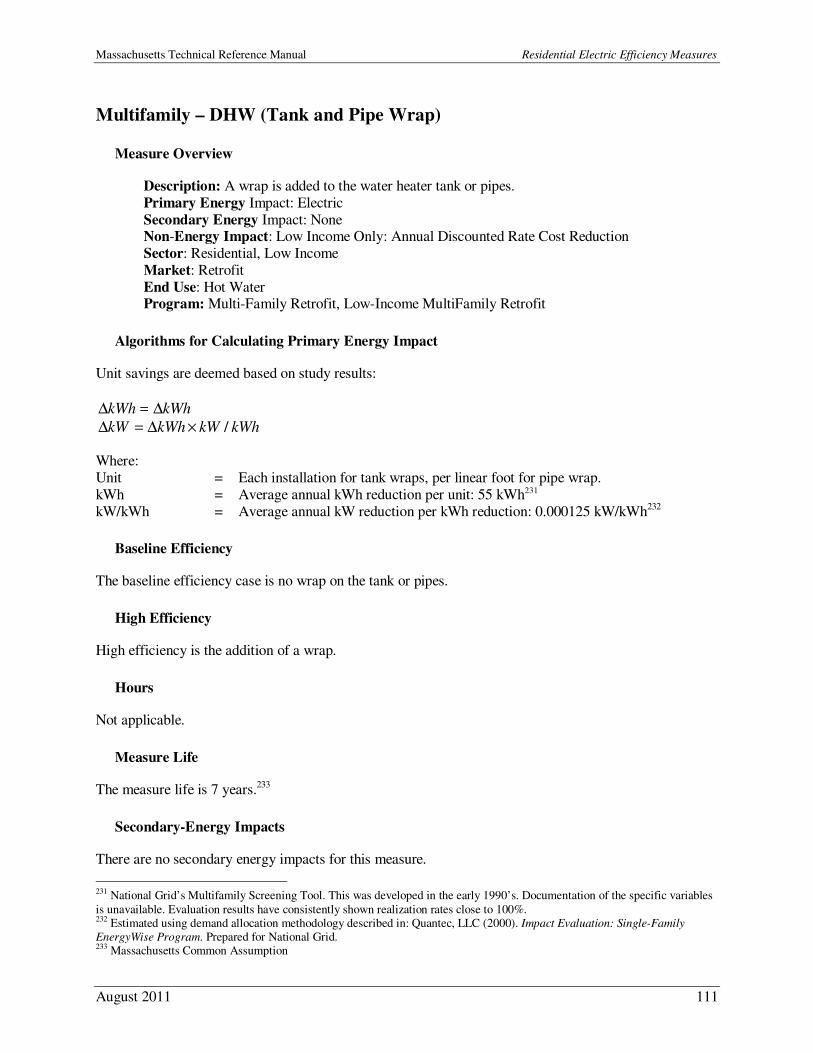
Massachusetts Technical Reference Manual Residential Electric Efficiency Measures
August 2011 111
Multifamily – DHW (Tank and Pipe Wrap)
Measure Overview
Description: A wrap is added to the water heater tank or pipes.
Primary Energy Impact: Electric
Secondary Energy Impact: None Non-Energy Impact: Low Income Only: Annual Discounted Rate Cost Reduction
Sector: Residential, Low Income
Market: Retrofit
End Use: Hot Water Program: Multi-Family Retrofit, Low-Income MultiFamily Retrofit
Algorithms for Calculating Primary Energy Impact
Unit savings are deemed based on study results:
kWhkWh ∆=∆
kWhkWkWhkW /×∆=∆
Where:
Unit = Each installation for tank wraps, per linear foot for pipe wrap.
kWh = Average annual kWh reduction per unit: 55 kWh231
kW/kWh = Average annual kW reduction per kWh reduction: 0.000125 kW/kWh232
Baseline Efficiency
The baseline efficiency case is no wrap on the tank or pipes.
High Efficiency
High efficiency is the addition of a wrap.
Hours
Not applicable.
Measure Life
The measure life is 7 years.233
Secondary-Energy Impacts
There are no secondary energy impacts for this measure.
231 National Grid’s Multifamily Screening Tool. This was developed in the early 1990’s. Documentation of the specific variables
is unavailable. Evaluation results have consistently shown realization rates close to 100%. 232 Estimated using demand allocation methodology described in: Quantec, LLC (2000). Impact Evaluation: Single-Family
EnergyWise Program. Prepared for National Grid. 233 Massachusetts Common Assumption
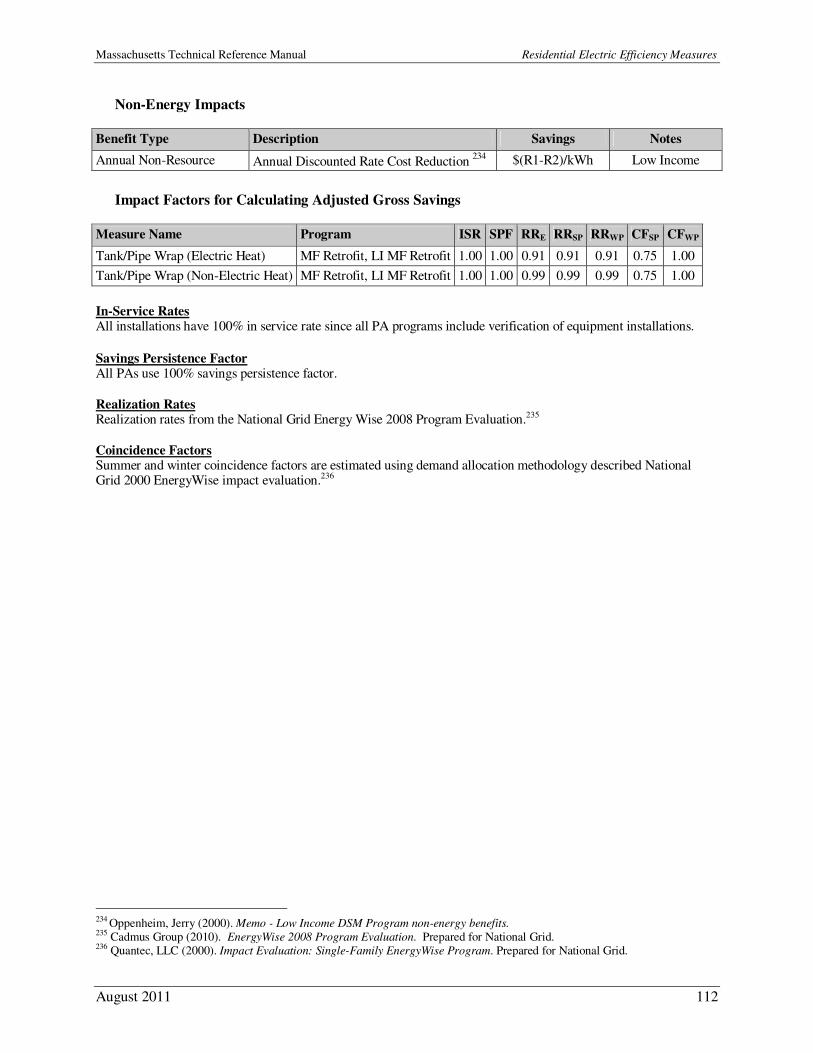
Massachusetts Technical Reference Manual Residential Electric Efficiency Measures
August 2011 112
Non-Energy Impacts
Benefit Type Description Savings Notes
Annual Non-Resource Annual Discounted Rate Cost Reduction 234
$(R1-R2)/kWh Low Income
Impact Factors for Calculating Adjusted Gross Savings
Measure Name Program ISR SPF RRE RRSP RRWP CFSP CFWP
Tank/Pipe Wrap (Electric Heat) MF Retrofit, LI MF Retrofit 1.00 1.00 0.91 0.91 0.91 0.75 1.00
Tank/Pipe Wrap (Non-Electric Heat) MF Retrofit, LI MF Retrofit 1.00 1.00 0.99 0.99 0.99 0.75 1.00
In-Service Rates All installations have 100% in service rate since all PA programs include verification of equipment installations. Savings Persistence Factor All PAs use 100% savings persistence factor.
Realization Rates Realization rates from the National Grid Energy Wise 2008 Program Evaluation.235
Coincidence Factors Summer and winter coincidence factors are estimated using demand allocation methodology described National Grid 2000 EnergyWise impact evaluation.236
234 Oppenheim, Jerry (2000). Memo - Low Income DSM Program non-energy benefits. 235 Cadmus Group (2010). EnergyWise 2008 Program Evaluation. Prepared for National Grid. 236 Quantec, LLC (2000). Impact Evaluation: Single-Family EnergyWise Program. Prepared for National Grid.
Massachusetts Technical Reference Manual Residential Electric Efficiency Measures
August 2011 113
Multifamily – Thermostats
Measure Overview
Description: Installation of programmable thermostats
Primary Energy Impact: Electric
Secondary Energy Impact: None Non-Energy Impact: Low Income Only: Annual Discounted Rate Cost Reduction
Sector: Residential, Low Income
Market: Retrofit
End Use: HVAC Program: Multi-Family Retrofit, Low-Income MultiFamily Retrofit
Algorithms for Calculating Primary Energy Impact
Unit savings are deemed based on study results:
kWhkWh ∆=∆
kWhkWkWhkW /×∆=∆
Where:
Unit = Installation of programmable thermostat.
∆kWh = Average annual kWh reduction per unit: 288 kWh237
kW/kWh = Average annual kW reduction per kWh reduction: 0.000125 kW/kWh238
Baseline Efficiency
The baseline efficiency case is a system without a set back programmable thermostat.
High Efficiency
The high efficiency case is a system with a set-back programmable thermostats and fixed set point
(common areas) thermostats.
Hours
Not applicable.
Measure Life
The measure life is 10 years.239
237 National Grid’s Multifamily Screening Tool. This was developed in the early 1990’s. Documentation of the specific variables is unavailable. Evaluation results have consistently shown realization rates close to 100%. 238 Estimated using demand allocation methodology described in: Quantec, LLC (2000). Impact Evaluation: Single-Family
EnergyWise Program. Prepared for National Grid. 239 GDS Associates, Inc. (2007). Measure Life Report: Residential and Commercial/Industrial Lighting and HVAC Measures. Prepared for The New England State Program Working Group.
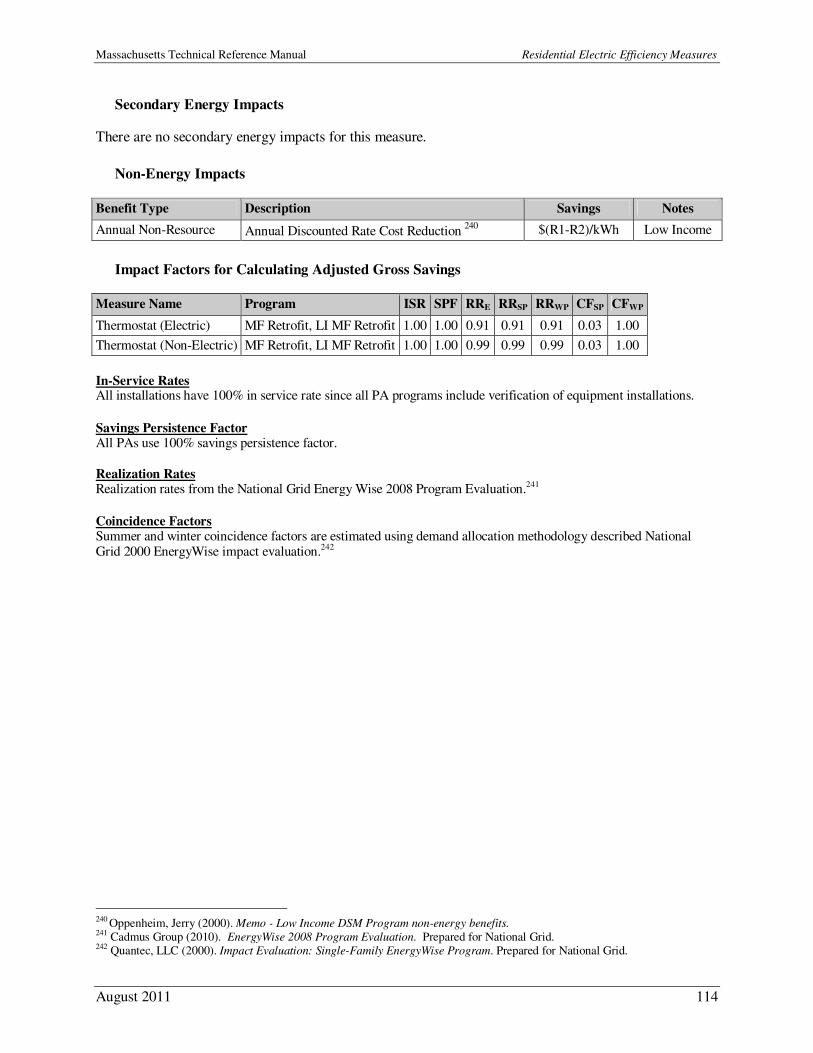
Massachusetts Technical Reference Manual Residential Electric Efficiency Measures
August 2011 114
Secondary Energy Impacts
There are no secondary energy impacts for this measure.
Non-Energy Impacts
Benefit Type Description Savings Notes
Annual Non-Resource Annual Discounted Rate Cost Reduction 240
$(R1-R2)/kWh Low Income
Impact Factors for Calculating Adjusted Gross Savings
Measure Name Program ISR SPF RRE RRSP RRWP CFSP CFWP
Thermostat (Electric) MF Retrofit, LI MF Retrofit 1.00 1.00 0.91 0.91 0.91 0.03 1.00
Thermostat (Non-Electric) MF Retrofit, LI MF Retrofit 1.00 1.00 0.99 0.99 0.99 0.03 1.00
In-Service Rates All installations have 100% in service rate since all PA programs include verification of equipment installations. Savings Persistence Factor All PAs use 100% savings persistence factor.
Realization Rates Realization rates from the National Grid Energy Wise 2008 Program Evaluation.241
Coincidence Factors Summer and winter coincidence factors are estimated using demand allocation methodology described National Grid 2000 EnergyWise impact evaluation.242
240 Oppenheim, Jerry (2000). Memo - Low Income DSM Program non-energy benefits. 241 Cadmus Group (2010). EnergyWise 2008 Program Evaluation. Prepared for National Grid. 242 Quantec, LLC (2000). Impact Evaluation: Single-Family EnergyWise Program. Prepared for National Grid.

Massachusetts Technical Reference Manual Residential Electric Efficiency Measures
August 2011 115
Multifamily – Heat Pump Tune-Up
Measure Overview
Description: Heat pump tune-up for electrically-heated homes only.
Primary Energy Impact: Electric
Secondary Energy Impact: None Non-Energy Impact: Low Income Only: Annual Discounted Rate Cost Reduction
Sector: Residential, Low Income
Market: Retrofit
End Use: HVAC Program: Multi-Family Retrofit
Algorithms for Calculating Primary Energy Impact
Unit savings are deemed based on study results:
kWhkWh ∆=∆
kWhkWkWhkW /×∆=∆
Where:
Unit = Heat pump tune-up performed
∆kWh = Average annual kWh reduction per unit: 1162 kWh243
kW/kWh = Average kW reduction per kWh reduction: 0.000125 kW/kWh244
Baseline Efficiency
The baseline efficiency case is an existing heat pump that is not tuned up.
High Efficiency
The high efficiency case is an existing heat pump that is tuned up.
Hours
Not applicable.
Measure Life
The measure life is 5 years.245
Secondary Energy Impacts
There are no secondary energy impacts for this measure.
243 National Grid’s Multifamily Screening Tool. This was developed in the early 1990’s. Documentation of the specific variables
is unavailable. Evaluation results have consistently shown realization rates close to 100%. 244 Estimated using demand allocation methodology described in: Quantec, LLC (2000). Impact Evaluation: Single-Family
EnergyWise Program. Prepared for National Grid. 245 Massachusetts Common Assumption
Massachusetts Technical Reference Manual Residential Electric Efficiency Measures
August 2011 116
Non-Energy Benefits
There are no non-energy benefits for this measure.
Impact Factors for Calculating Adjusted Gross Savings
Measure Name Program ISR SPF RRE RRSP RRWP CFSP CFWP
Heat Pump Tune-up (Electric) MF Retrofit 1.00 1.00 0.91 0.91 0.91 0.03 1.00
In-Service Rates All installations have 100% in service rate since all PA programs include verification of equipment installations. Savings Persistence Factor All PAs use 100% savings persistence factor.
Realization Rates Realization rates from the National Grid Energy Wise 2008 Program Evaluation.246
Coincidence Factors Summer and winter coincidence factors are estimated using demand allocation methodology described National Grid 2000 EnergyWise impact evaluation.247
246 Cadmus Group (2010). EnergyWise 2008 Program Evaluation. Prepared for National Grid. 247 Quantec, LLC (2000). Impact Evaluation: Single-Family EnergyWise Program. Prepared for National Grid.
Massachusetts Technical Reference Manual Residential Electric Efficiency Measures
August 2011 117
Multifamily – Air Sealing
Measure Overview
Description: Thermal shell air leaks are sealed through strategic use and location of air-tight
materials.
Primary Energy Impact: Electric Secondary Energy Impact: None
Non-Energy Impact: Low Income Only: Annual Discounted Rate Cost Reduction
Sector: Residential, Low Income
Market: Retrofit End Use: HVAC
Program: Multi-Family Retrofit, Low-Income MultiFamily Retrofit
Algorithms for Calculating Primary Energy Impact
Unit savings are calculated using the following algorithms and assumptions:
( ) CFMkWhSQFTCFMSQFTCFMSQFTStorieskWh POSTPRE /// ∆×−××=∆
kWhkWkWhkW /×∆=∆
Where:
Stories = Total stories in the multi-family building SQFT = Total SQFT of building
CFM/SQFTPRE = Estimate of pre-retrofit air leakage in CFM/SQFT based on number of stories in the
building and air-tightness ratings of the existing roof and floor.
CFM/SQFTPOST = Estimate of post-retrofit air leakage in CFM/SQFT based on number of stories in the building and air-tightness ratings of the improved roof and floor.
∆kWh/CFM = Average annual kWh reduction per CFM: 2.48633 kWh/CFM248
kW/kWh = Average kW reduction per kWh reduction: 0.000125 kW/kWh249
Baseline Efficiency
The baseline efficiency case is a facility that has not received comprehensive air-sealing treatment.
High Efficiency
The high efficiency case is a facility with thermal shell air leaks that are sealed, leading to a reduction in air leakage.
Hours
Not applicable.
248 National Grid’s Multifamily Screening Tool. This was developed in the early 1990’s. Documentation of the specific variables is unavailable. Evaluation results have consistently shown realization rates close to 100%. 249 Estimated using demand allocation methodology described in: Quantec, LLC (2000). Impact Evaluation: Single-Family
EnergyWise Program. Prepared for National Grid.

Massachusetts Technical Reference Manual Residential Electric Efficiency Measures
August 2011 118
Measure Life
The measure life is 15 years.250
Secondary Energy Impacts
There are no secondary energy impacts for this measure.
Non-Energy Benefits
Benefit Type Description Savings Notes
Annual Non-Resource Annual Discounted Rate Cost Reduction251
$(R1-R2)/kWh Low Income
Impact Factors for Calculating Adjusted Gross Savings
Measure Name Program ISR SPF RRE RRSP RRWP CFSP CFWP
Air Sealing (Electric Heat) MF Retrofit, LI MF Retrofit 1.00 1.00 0.91 0.91 0.91 0.03 1.00
Air Sealing (Non-Electric Heat) MF Retrofit, LI MF Retrofit 1.00 1.00 0.99 0.99 0.99 0.03 1.00
In-Service Rates All installations have 100% in service rate since all PA programs include verification of equipment installations. Savings Persistence Factor All PAs use 100% savings persistence factor.
Realization Rates Realization rates are from the National Grid Energy Wise 2008 Program Evaluation.252 Coincidence Factors Summer and winter coincidence factors are estimated using demand allocation methodology described National Grid 2000 EnergyWise impact evaluation.253
250 GDS Associates, Inc. (2007). Measure Life Report: Residential and Commercial/Industrial Lighting and HVAC Measures.
Prepared for The New England State Program Working Group. 251 Oppenheim, Jerry (2000). Memo - Low Income DSM Program non-energy benefits. 252 Cadmus Group (2010). EnergyWise 2008 Program Evaluation. Prepared for National Grid. 253 Quantec, LLC (2000). Impact Evaluation: Single-Family EnergyWise Program. Prepared for National Grid.
Massachusetts Technical Reference Manual Residential Electric Efficiency Measures
August 2011 119
Multifamily – Refrigerators and Freezers
Measure Overview
Description: Removal of old inefficient refrigerator or freezer with the installation of new
efficient refrigerator or freezer.
Primary Energy Impact: Electric Secondary Energy Impact: None
Non-Energy Impact: Low Income Only: Annual Discounted Rate Cost Reduction, One-Time
Avoided Refrigerator Purchase
Sector: Residential, Low Income Market: Retrofit
End Use: Refrigeration
Program: Multi-Family Retrofit, Low-Income MultiFamily Retrofit
Algorithms for Calculating Primary Energy Impact
Unit savings are calculated using the following algorithms and assumptions:
POSTPRE kWhkWhkWh −=∆
kWhkWkWhkW /×∆=∆
Where: Unit = Replacement of existing refrigerator with new ENERGY STAR® refrigerator
kWhPRE = Annual kWh consumption of existing equipment. Value entered by the user.
kWhPOST = Annual kWh consumption of new installed equipment. Value entered by the user.
kW/kWh = Average kW reduction per kWh reduction: 0.00013 kW/kWh254
Baseline Efficiency
The baseline efficiency case is an existing refrigerator for which the annual kWh may be looked up in a
refrigerator database. If the manufacturer and model number are not found, the refrigerator is metered for
1.5 hours in order to determine the annual kWh.
High Efficiency
The high efficiency case is a new more efficiency refrigerator. The manufacture and model number is
looked up in a refrigerator database to determine annual kWh.
Measure Life
The measure life is 12 years for non low income255 and 19 years for low income.256
254 Estimated using demand allocation methodology described in: Quantec, LLC (2000). Impact Evaluation: Single-Family
EnergyWise Program. Prepared for National Grid. 255
Environmental Protection Agency (2009). Life Cycle Cost Estimate for ENERGY STAR Residential Refrigerator. Interactive
Excel Spreadsheet found at www.energystar.gov/.../business/bulk_purchasing/bpsavings_calc/Consumer_Residential_Refrig_Sav_Calc.xls. 256 Massachusetts Common Assumption.
Massachusetts Technical Reference Manual Residential Electric Efficiency Measures
August 2011 120
Hours
Not applicable.
Secondary Energy Impacts
There are no secondary energy impacts for this measure.
Non-Energy Impacts
Benefit Type Description Savings Notes
Annual Non-Resource Annual Discounted Rate Cost Reduction 257
$(R1-R2)/kWh Low Income
One-Time Non-Resource One-Time Avoided Refrigerator Purchase 258 $200/Unit
Impact Factors for Calculating Adjusted Gross Savings
Measure Name Program ISR SPF RRE RRSP RRWP CFSP CFWP
Refrig/Freezers (Electric Heat) MF Retrofit, LI MF Retrofit 1.00 1.00 0.91 0.91 0.91 1.00 0.92
Refrig/Freezers (Non-Electric Heat) MF Retrofit, LI MF Retrofit 1.00 1.00 0.99 0.99 0.99 1.00 0.92
In-Service Rates All installations have 100% in service rate since all PA programs include verification of equipment installations. Savings Persistence Factor All PAs use 100% savings persistence factor. Realization Rates Realization rates from the National Grid Energy Wise 2008 Program Evaluation.259
Coincidence Factors Summer and winter coincidence factors are estimated using demand allocation methodology described National Grid 2000 EnergyWise impact evaluation.260
257 Oppenheim, Jerry (2000). Memo - Low Income DSM Program non-energy benefits. 258 Ibid... 259 Cadmus Group (2010). EnergyWise 2008 Program Evaluation. Prepared for National Grid. 260 Quantec, LLC (2000). Impact Evaluation: Single-Family EnergyWise Program. Prepared for National Grid.
Massachusetts Technical Reference Manual Residential Electric Efficiency Measures
August 2011 121
MultiFamily – Fixtures and CFLs
Measure Overview
Description: Removal of existing inefficient fixtures/bulbs with the installation of new efficient
fixtures/bulbs
Primary Energy Impact: Electric Secondary Energy Impact: None
Non-Energy Impact: O&M, Low Income Only: Annual Discounted Rate Cost Reduction
Sector: Residential, Low Income
Market: Retrofit End Use: Lighting
Program: Multi-Family Retrofit, Low-Income MultiFamily Retrofit
Algorithms for Calculating Primary Energy Impact
Unit savings are calculated using the following algorithms and assumptions:
( ) ( )[ ] 521000/ ×××−××=∆ EEEEEEPREPREPRE HoursWattsQTYHoursWattsQTYkWh
( ) ( )[ ] 1000/EEEEPREPRE WattsQTYWattsQTYkW ×−×=∆
Where:
QTYPRE = Quantity of pre-retrofit fixtures/bulbs
QTYEE = Quantity of efficient fixtures/bulbs installed WattsPRE = Rated watts of pre-retrofit fixtures/bulbs
WattsEE = Rated watts of efficient fixtures/bulbs installed
HoursPRE = Weekly hours of operation for pre-retrofit case lighting fixtures/bulbs HoursEE = Weekly hours of operation for efficient lighting fixtures/bulbs
52 = Weeks per year
Baseline Efficiency
The baseline efficiency case is the existing fixture and bulbs.
High Efficiency
The high efficiency case is the new fixture and lamps.
Measure Life
The measure life is 7 years for CFLs and 20 years for fixtures.
Hours
Operating hours are estimated by the vendor for each facility. Typical assumptions are 24 hours/day for common area lighting, 12 hours/day for exterior lighting, and 3 hours/day for in-unit lighting, but may be
adjusted based on type of housing. Estimates are verified with facility maintenance staff when possible.
Massachusetts Technical Reference Manual Residential Electric Efficiency Measures
August 2011 122
Secondary Energy Impacts
There are no secondary energy impacts for this measure.
Non-Energy Impacts
Benefit Type Description Savings Notes
Annual Non-Resource Annual Discounted Rate Cost Reduction 261
$(R1-R2)/kWh Low Income
One-Time Non-Resource (CFL) O&M Cost Reduction 262
$3.00/Bulb
One-Time Non-Resource (Fixture) O&M Cost Reduction 263
$3.50/Fixture
Impact Factors for Calculating Adjusted Gross Savings
Measure Name Program ISR SPF RRE RRSP RRWP CFSP CFWP
CFLs (Electric) MF Retrofit, LI MF Retrofit 1.00 1.00 0.91 0.91 0.91 0.35 1.00
CFLs (Non-Electric) MF Retrofit, LI MF Retrofit 1.00 1.00 0.99 0.99 0.99 0.35 1.00
Fixtures (Electric) MF Retrofit, LI MF Retrofit 1.00 1.00 0.91 0.91 0.91 0.35 1.00
Fixtures (Non-Electric) MF Retrofit, LI MF Retrofit 1.00 1.00 0.99 0.99 0.99 0.35 1.00
In-Service Rates All installations have 100% in service rate since all PA programs include verification of equipment installations. Savings Persistence Factor All PAs use 100% savings persistence factor.
Realization Rates Realization rates from the National Grid Energy Wise 2008 Program Evaluation.264
Coincidence Factors Summer and winter coincidence factors are estimated using demand allocation methodology described National Grid 2000 EnergyWise impact evaluation.265
261 Oppenheim, Jerry (2000). Memo - Low Income DSM Program non-energy benefits. 262 MA Electric Utilities (2003). Non-Electric Benefit Performance Metrics – Residential 1. Memo to MA non-Electric Parties. 263 Ibid. 264 Cadmus Group (2010). EnergyWise 2008 Program Evaluation. Prepared for National Grid. 265 Quantec, LLC (2000). Impact Evaluation: Single-Family EnergyWise Program. Prepared for National Grid.
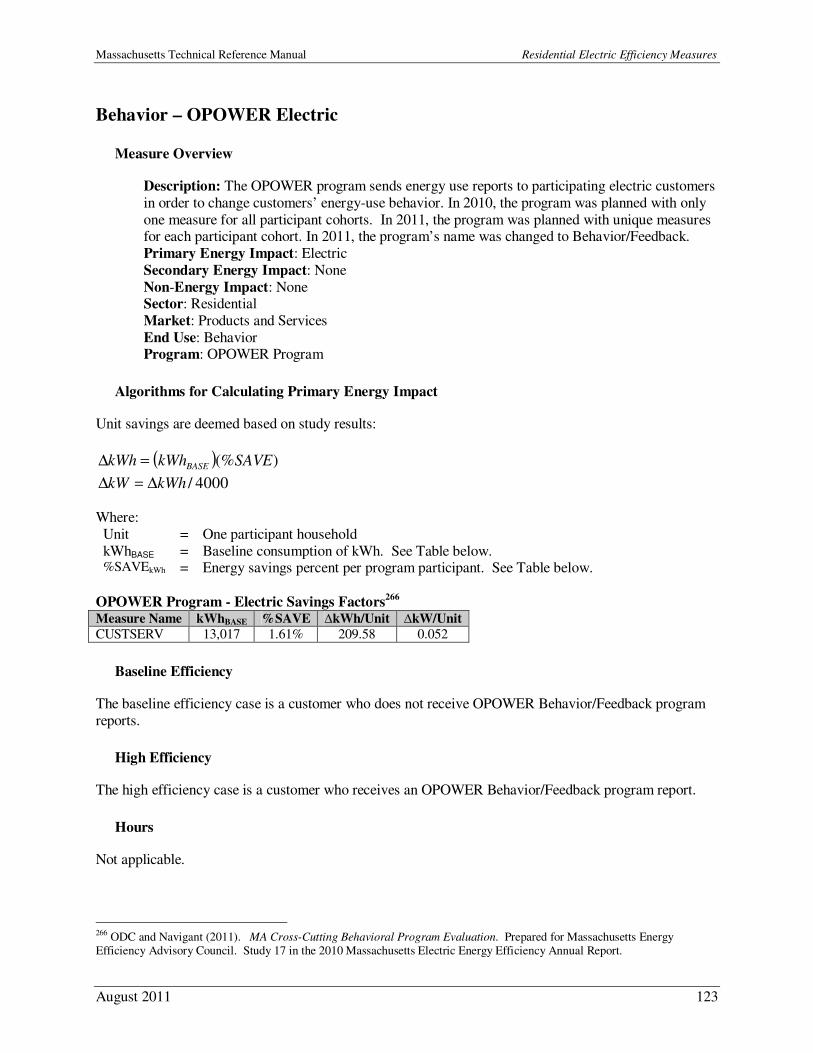
Massachusetts Technical Reference Manual Residential Electric Efficiency Measures
August 2011 123
Behavior – OPOWER Electric
Measure Overview
Description: The OPOWER program sends energy use reports to participating electric customers
in order to change customers’ energy-use behavior. In 2010, the program was planned with only
one measure for all participant cohorts. In 2011, the program was planned with unique measures for each participant cohort. In 2011, the program’s name was changed to Behavior/Feedback.
Primary Energy Impact: Electric
Secondary Energy Impact: None
Non-Energy Impact: None Sector: Residential
Market: Products and Services
End Use: Behavior Program: OPOWER Program
Algorithms for Calculating Primary Energy Impact
Unit savings are deemed based on study results:
( ) )(%SAVEkWhkWh BASE=∆
4000/kWhkW ∆=∆
Where:
Unit = One participant household
kWhBASE = Baseline consumption of kWh. See Table below. %SAVEkWh = Energy savings percent per program participant. See Table below.
OPOWER Program - Electric Savings Factors266
Measure Name kWhBASE %SAVE ∆kWh/Unit ∆kW/Unit
CUSTSERV 13,017 1.61% 209.58 0.052
Baseline Efficiency
The baseline efficiency case is a customer who does not receive OPOWER Behavior/Feedback program
reports.
High Efficiency
The high efficiency case is a customer who receives an OPOWER Behavior/Feedback program report.
Hours
Not applicable.
266 ODC and Navigant (2011). MA Cross-Cutting Behavioral Program Evaluation. Prepared for Massachusetts Energy Efficiency Advisory Council. Study 17 in the 2010 Massachusetts Electric Energy Efficiency Annual Report.
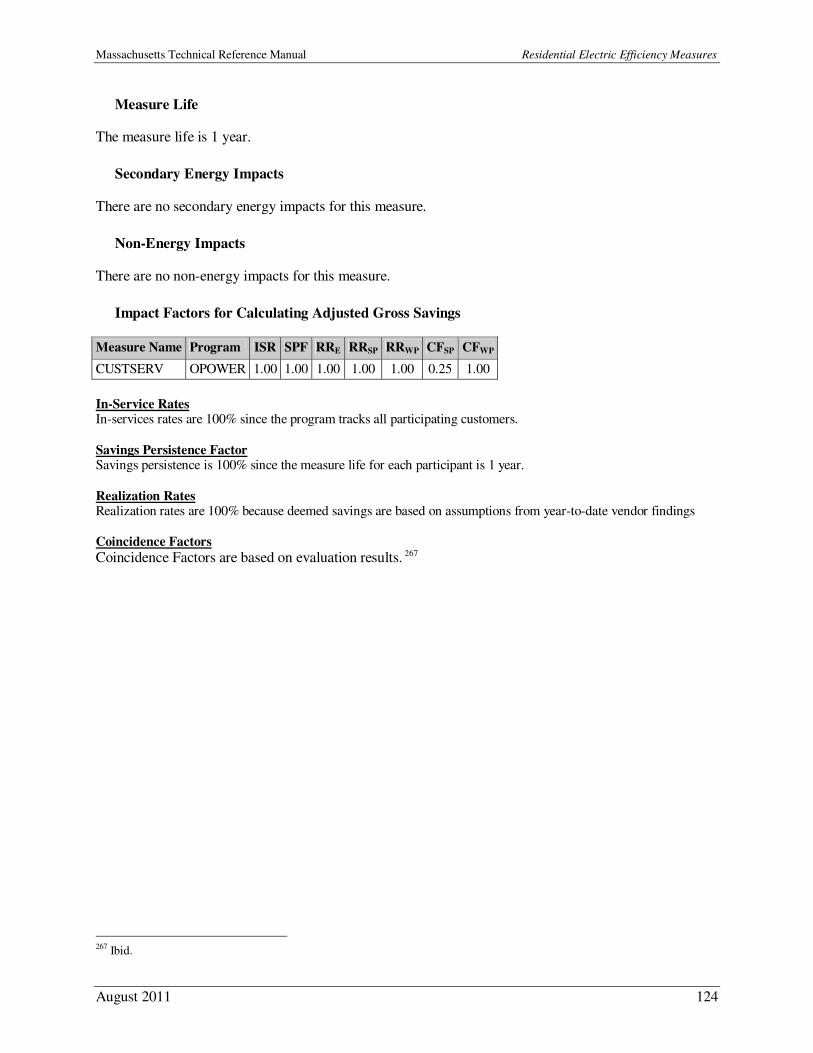
Massachusetts Technical Reference Manual Residential Electric Efficiency Measures
August 2011 124
Measure Life
The measure life is 1 year.
Secondary Energy Impacts
There are no secondary energy impacts for this measure.
Non-Energy Impacts
There are no non-energy impacts for this measure.
Impact Factors for Calculating Adjusted Gross Savings
Measure Name Program ISR SPF RRE RRSP RRWP CFSP CFWP
CUSTSERV OPOWER 1.00 1.00 1.00 1.00 1.00 0.25 1.00
In-Service Rates In-services rates are 100% since the program tracks all participating customers.
Savings Persistence Factor Savings persistence is 100% since the measure life for each participant is 1 year.
Realization Rates Realization rates are 100% because deemed savings are based on assumptions from year-to-date vendor findings
Coincidence Factors
Coincidence Factors are based on evaluation results. 267
267 Ibid.
Massachusetts Technical Reference Manual Commercial and Industrial Electric Efficiency Measures
August 2011 125
Commercial and Industrial Electric Efficiency
Measures
Massachusetts Technical Reference Manual Commercial and Industrial Electric Efficiency Measures
August 2011 126
Lighting – Advanced Lighting Design (Performance Lighting)
Measure Overview
Description: Advanced lighting design refers to the implementation of various lighting design
principles aimed at creating a quality and appropriate lighting experience while reducing
unnecessary light usage. This is often done by a professional in a new construction situation. Advanced lighting design uses techniques like maximizing task lighting and efficient fixtures to
create a system of optimal energy efficiency and functionality.
Primary Energy Impact: Electric
Secondary Energy Impact: Gas, Oil Non-Energy Impact: O&M
Sector: Commercial and Industrial
Market: Lost Opportunity End Use: Lighting
Program: C&I New Construction & Major Renovation
Algorithms for Calculating Primary Energy Impact
( )( )∑=
−
=∆
n
i
ii
iEEiBASEHoursArea
WattsWattskWh
1
,,
1000
( )∑=
−
=∆
n
i
i
iEEiBASEArea
WattsWattskW
1
,,
1000
Where: N = Total number of spaces in Space-by-Space Method or 1 for Building Area Method
WattsBASE,i = Allowed lighting wattage per square foot based on energy code requirements for
building or space type i. For values, see Appendix A: Table 16 and Appendix A: Table 17.
WattsEE,i = Installed lighting wattage per square foot of the efficient lighting system for building or
space type i
1000 = Conversion factor: 1000 watts per 1 kW Areai = Area of building or space i in square feet
Hoursi = Annual hours of operation of the lighting equipment for building or space type i
Note on HVAC system interaction: Additional Electric savings from cooling system interaction are
included in the calculation of adjusted gross savings for Lighting Systems projects. The HVAC
interaction adjustment factor is determined from lighting project evaluations and is included in the energy realization rates and demand coincidence factors and realization rates.
Baseline Efficiency
The Baseline Efficiency assumes compliance with lighting power density requirements as mandated by
Massachusetts State Building Code. As described in Chapter 13 of the aforementioned document, energy
efficiency must be met via compliance with the International Energy Conservation Code (IECC) 2009. IECC offers one compliance path, the Building Area Method. ASHRAE 90.1-2007 offers two compliance
paths. For completeness, the lighting power density requirements for both the Building Area Method and
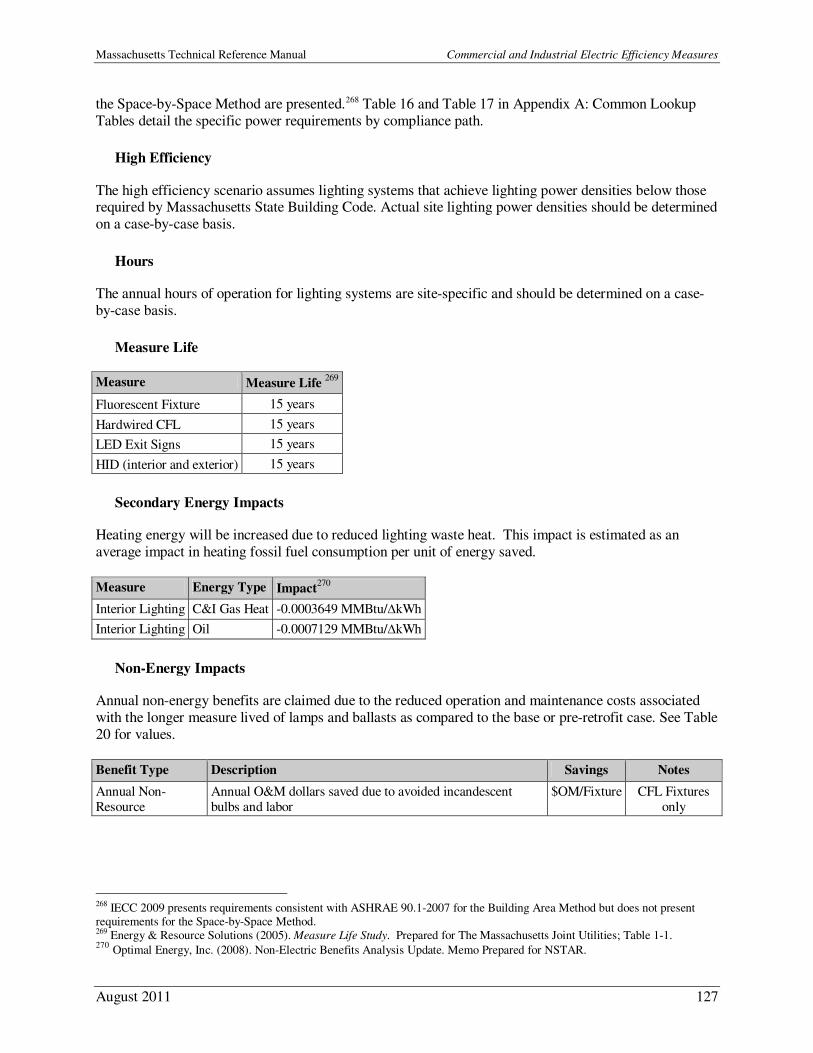
Massachusetts Technical Reference Manual Commercial and Industrial Electric Efficiency Measures
August 2011 127
the Space-by-Space Method are presented.268 Table 16 and Table 17 in Appendix A: Common Lookup
Tables detail the specific power requirements by compliance path.
High Efficiency
The high efficiency scenario assumes lighting systems that achieve lighting power densities below those required by Massachusetts State Building Code. Actual site lighting power densities should be determined
on a case-by-case basis.
Hours
The annual hours of operation for lighting systems are site-specific and should be determined on a case-
by-case basis.
Measure Life
Measure Measure Life 269
Fluorescent Fixture 15 years
Hardwired CFL 15 years
LED Exit Signs 15 years
HID (interior and exterior) 15 years
Secondary Energy Impacts
Heating energy will be increased due to reduced lighting waste heat. This impact is estimated as an
average impact in heating fossil fuel consumption per unit of energy saved.
Measure Energy Type Impact270
Interior Lighting C&I Gas Heat -0.0003649 MMBtu/∆kWh
Interior Lighting Oil -0.0007129 MMBtu/∆kWh
Non-Energy Impacts
Annual non-energy benefits are claimed due to the reduced operation and maintenance costs associated
with the longer measure lived of lamps and ballasts as compared to the base or pre-retrofit case. See Table
20 for values.
Benefit Type Description Savings Notes
Annual Non-Resource
Annual O&M dollars saved due to avoided incandescent bulbs and labor
$OM/Fixture CFL Fixtures only
268 IECC 2009 presents requirements consistent with ASHRAE 90.1-2007 for the Building Area Method but does not present requirements for the Space-by-Space Method. 269 Energy & Resource Solutions (2005). Measure Life Study. Prepared for The Massachusetts Joint Utilities; Table 1-1. 270 Optimal Energy, Inc. (2008). Non-Electric Benefits Analysis Update. Memo Prepared for NSTAR.
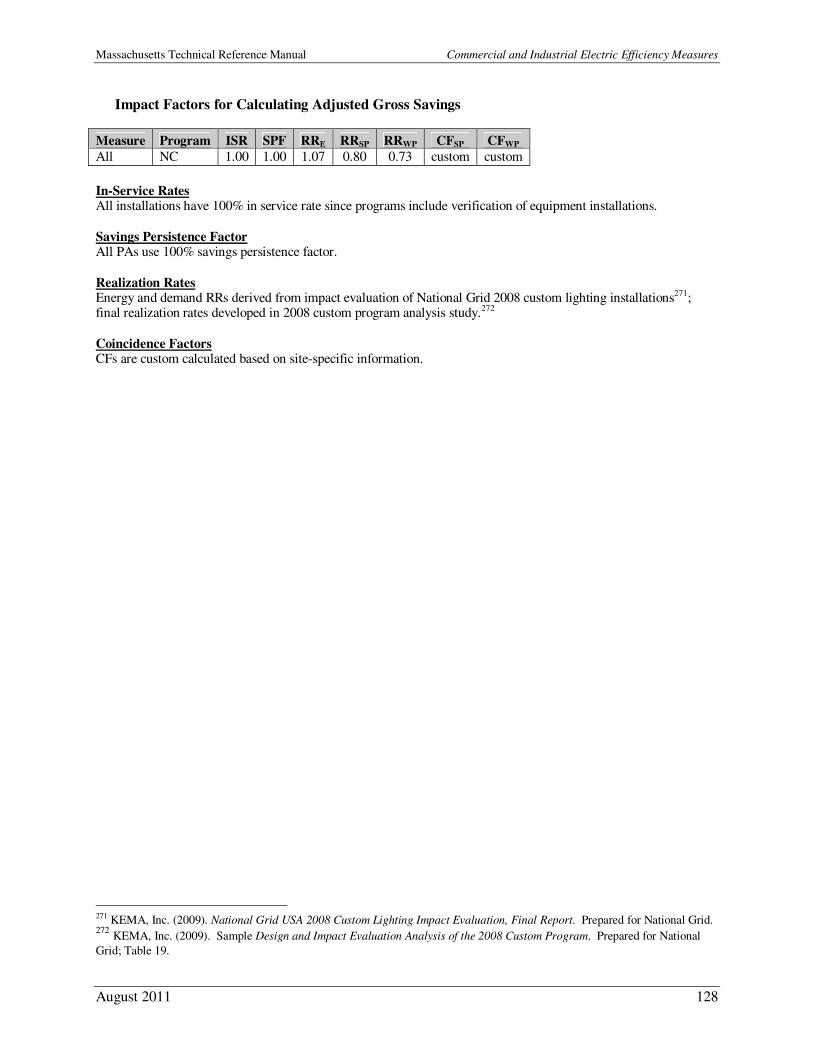
Massachusetts Technical Reference Manual Commercial and Industrial Electric Efficiency Measures
August 2011 128
Impact Factors for Calculating Adjusted Gross Savings
Measure Program ISR SPF RRE RRSP RRWP CFSP CFWP
All NC 1.00 1.00 1.07 0.80 0.73 custom custom
In-Service Rates All installations have 100% in service rate since programs include verification of equipment installations.
Savings Persistence Factor All PAs use 100% savings persistence factor.
Realization Rates Energy and demand RRs derived from impact evaluation of National Grid 2008 custom lighting installations271; final realization rates developed in 2008 custom program analysis study.272
Coincidence Factors CFs are custom calculated based on site-specific information.
271 KEMA, Inc. (2009). National Grid USA 2008 Custom Lighting Impact Evaluation, Final Report. Prepared for National Grid. 272 KEMA, Inc. (2009). Sample Design and Impact Evaluation Analysis of the 2008 Custom Program. Prepared for National
Grid; Table 19.
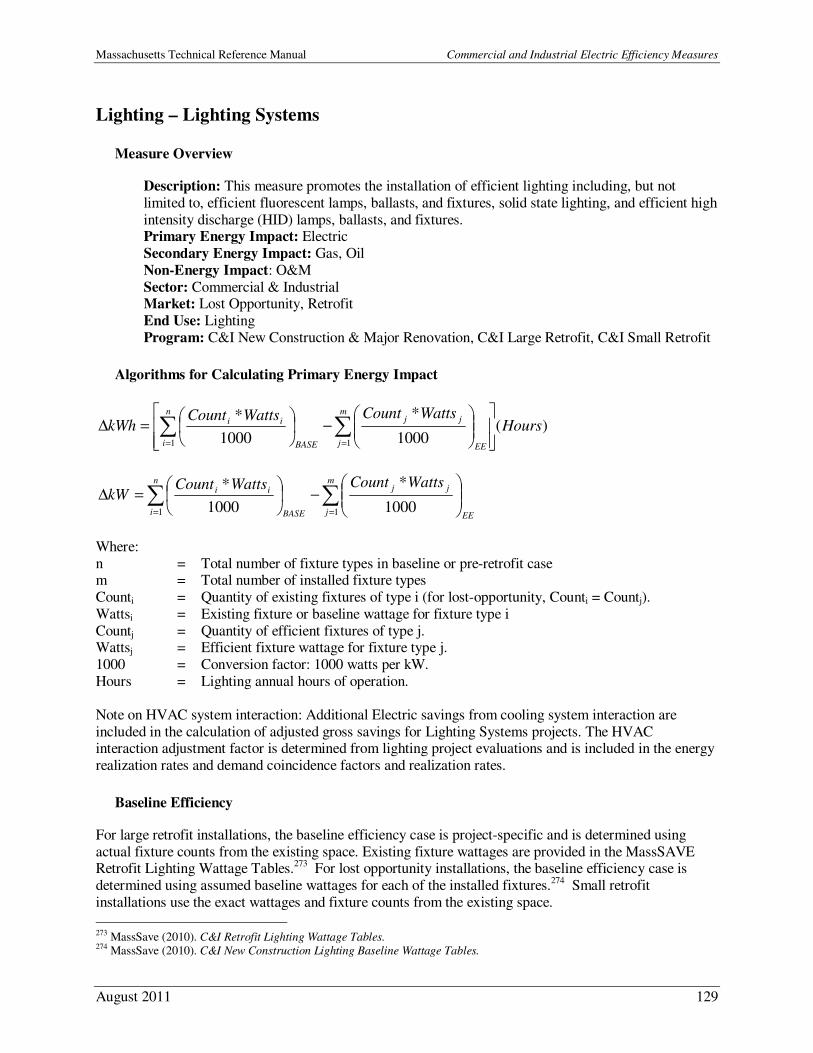
Massachusetts Technical Reference Manual Commercial and Industrial Electric Efficiency Measures
August 2011 129
Lighting – Lighting Systems
Measure Overview
Description: This measure promotes the installation of efficient lighting including, but not
limited to, efficient fluorescent lamps, ballasts, and fixtures, solid state lighting, and efficient high
intensity discharge (HID) lamps, ballasts, and fixtures. Primary Energy Impact: Electric
Secondary Energy Impact: Gas, Oil
Non-Energy Impact: O&M
Sector: Commercial & Industrial Market: Lost Opportunity, Retrofit
End Use: Lighting
Program: C&I New Construction & Major Renovation, C&I Large Retrofit, C&I Small Retrofit
Algorithms for Calculating Primary Energy Impact
)(1000
*
1000
*
1 1
HoursWattsCountWattsCount
kWhn
i
m
j EE
jj
BASE
ii
−
=∆ ∑ ∑
= =
∑ ∑= =
−
=∆
n
i
m
j EE
jj
BASE
iiWattsCountWattsCount
kW1 1 1000
*
1000
*
Where:
n = Total number of fixture types in baseline or pre-retrofit case m = Total number of installed fixture types
Counti = Quantity of existing fixtures of type i (for lost-opportunity, Counti = Countj).
Wattsi = Existing fixture or baseline wattage for fixture type i
Countj = Quantity of efficient fixtures of type j. Wattsj = Efficient fixture wattage for fixture type j.
1000 = Conversion factor: 1000 watts per kW.
Hours = Lighting annual hours of operation.
Note on HVAC system interaction: Additional Electric savings from cooling system interaction are
included in the calculation of adjusted gross savings for Lighting Systems projects. The HVAC interaction adjustment factor is determined from lighting project evaluations and is included in the energy
realization rates and demand coincidence factors and realization rates.
Baseline Efficiency
For large retrofit installations, the baseline efficiency case is project-specific and is determined using
actual fixture counts from the existing space. Existing fixture wattages are provided in the MassSAVE Retrofit Lighting Wattage Tables.273 For lost opportunity installations, the baseline efficiency case is
determined using assumed baseline wattages for each of the installed fixtures.274 Small retrofit
installations use the exact wattages and fixture counts from the existing space.
273 MassSave (2010). C&I Retrofit Lighting Wattage Tables. 274 MassSave (2010). C&I New Construction Lighting Baseline Wattage Tables.
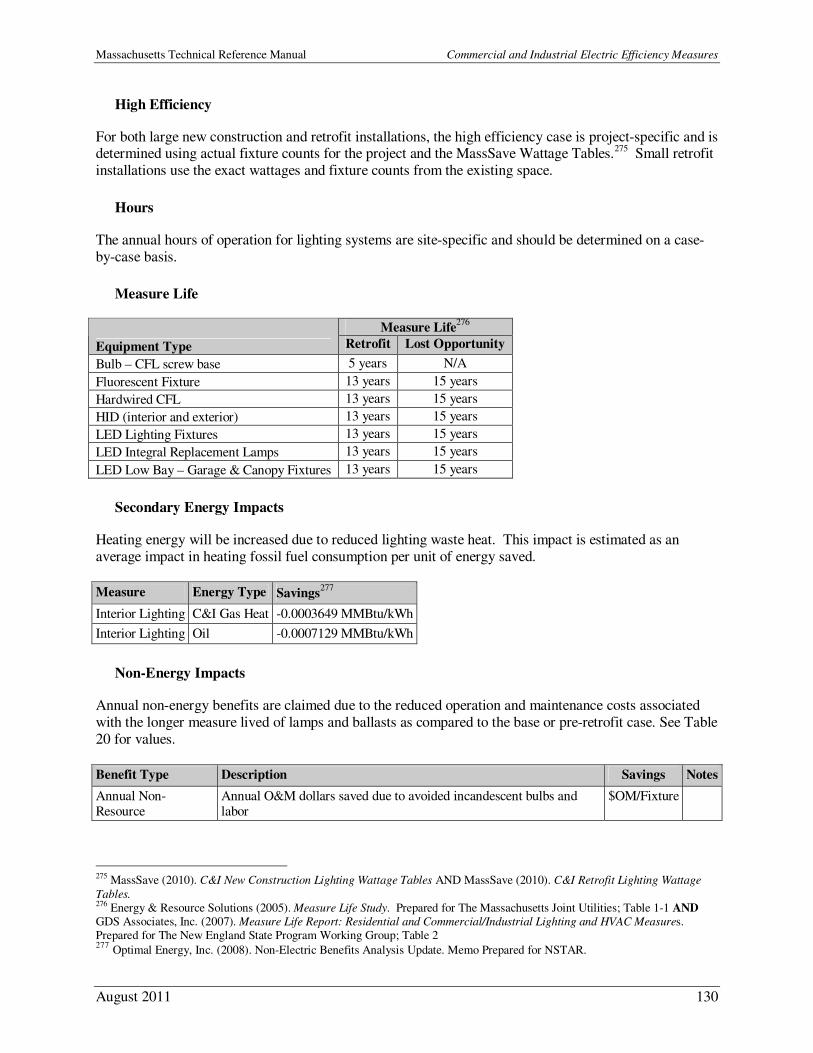
Massachusetts Technical Reference Manual Commercial and Industrial Electric Efficiency Measures
August 2011 130
High Efficiency
For both large new construction and retrofit installations, the high efficiency case is project-specific and is determined using actual fixture counts for the project and the MassSave Wattage Tables.275 Small retrofit
installations use the exact wattages and fixture counts from the existing space.
Hours
The annual hours of operation for lighting systems are site-specific and should be determined on a case-
by-case basis.
Measure Life
Measure Life276
Equipment Type Retrofit Lost Opportunity
Bulb – CFL screw base 5 years N/A
Fluorescent Fixture 13 years 15 years
Hardwired CFL 13 years 15 years
HID (interior and exterior) 13 years 15 years
LED Lighting Fixtures 13 years 15 years
LED Integral Replacement Lamps 13 years 15 years
LED Low Bay – Garage & Canopy Fixtures 13 years 15 years
Secondary Energy Impacts
Heating energy will be increased due to reduced lighting waste heat. This impact is estimated as an
average impact in heating fossil fuel consumption per unit of energy saved.
Measure Energy Type Savings277
Interior Lighting C&I Gas Heat -0.0003649 MMBtu/kWh
Interior Lighting Oil -0.0007129 MMBtu/kWh
Non-Energy Impacts
Annual non-energy benefits are claimed due to the reduced operation and maintenance costs associated
with the longer measure lived of lamps and ballasts as compared to the base or pre-retrofit case. See Table
20 for values.
Benefit Type Description Savings Notes
Annual Non-Resource
Annual O&M dollars saved due to avoided incandescent bulbs and labor
$OM/Fixture
275 MassSave (2010). C&I New Construction Lighting Wattage Tables AND MassSave (2010). C&I Retrofit Lighting Wattage
Tables. 276 Energy & Resource Solutions (2005). Measure Life Study. Prepared for The Massachusetts Joint Utilities; Table 1-1 AND GDS Associates, Inc. (2007). Measure Life Report: Residential and Commercial/Industrial Lighting and HVAC Measures. Prepared for The New England State Program Working Group; Table 2 277 Optimal Energy, Inc. (2008). Non-Electric Benefits Analysis Update. Memo Prepared for NSTAR.
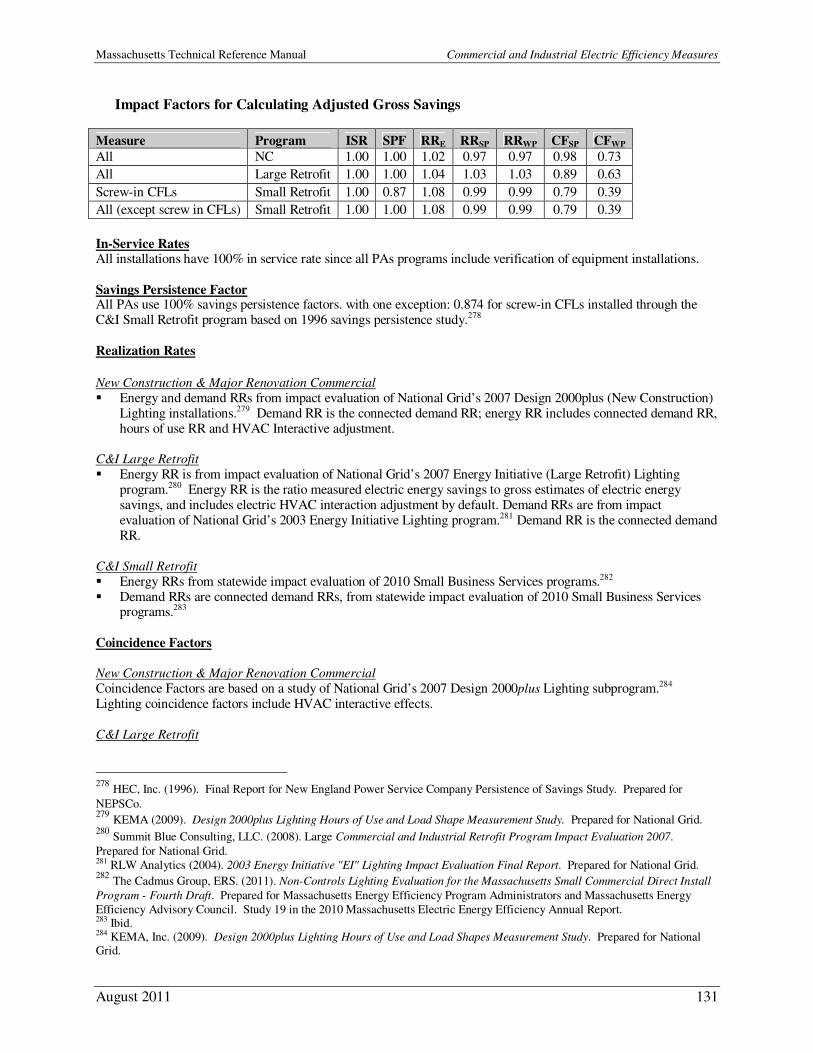
Massachusetts Technical Reference Manual Commercial and Industrial Electric Efficiency Measures
August 2011 131
Impact Factors for Calculating Adjusted Gross Savings
Measure Program ISR SPF RRE RRSP RRWP CFSP CFWP
All NC 1.00 1.00 1.02 0.97 0.97 0.98 0.73
All Large Retrofit 1.00 1.00 1.04 1.03 1.03 0.89 0.63
Screw-in CFLs Small Retrofit 1.00 0.87 1.08 0.99 0.99 0.79 0.39
All (except screw in CFLs) Small Retrofit 1.00 1.00 1.08 0.99 0.99 0.79 0.39
In-Service Rates All installations have 100% in service rate since all PAs programs include verification of equipment installations.
Savings Persistence Factor All PAs use 100% savings persistence factors. with one exception: 0.874 for screw-in CFLs installed through the C&I Small Retrofit program based on 1996 savings persistence study.278
Realization Rates
New Construction & Major Renovation Commercial
� Energy and demand RRs from impact evaluation of National Grid’s 2007 Design 2000plus (New Construction) Lighting installations.279 Demand RR is the connected demand RR; energy RR includes connected demand RR, hours of use RR and HVAC Interactive adjustment.
C&I Large Retrofit
� Energy RR is from impact evaluation of National Grid’s 2007 Energy Initiative (Large Retrofit) Lighting program.280 Energy RR is the ratio measured electric energy savings to gross estimates of electric energy savings, and includes electric HVAC interaction adjustment by default. Demand RRs are from impact evaluation of National Grid’s 2003 Energy Initiative Lighting program.281 Demand RR is the connected demand RR.
C&I Small Retrofit
� Energy RRs from statewide impact evaluation of 2010 Small Business Services programs.282 � Demand RRs are connected demand RRs, from statewide impact evaluation of 2010 Small Business Services
programs.283
Coincidence Factors
New Construction & Major Renovation Commercial
Coincidence Factors are based on a study of National Grid’s 2007 Design 2000plus Lighting subprogram.284 Lighting coincidence factors include HVAC interactive effects. C&I Large Retrofit
278 HEC, Inc. (1996). Final Report for New England Power Service Company Persistence of Savings Study. Prepared for
NEPSCo. 279 KEMA (2009). Design 2000plus Lighting Hours of Use and Load Shape Measurement Study. Prepared for National Grid. 280 Summit Blue Consulting, LLC. (2008). Large Commercial and Industrial Retrofit Program Impact Evaluation 2007.
Prepared for National Grid. 281 RLW Analytics (2004). 2003 Energy Initiative "EI" Lighting Impact Evaluation Final Report. Prepared for National Grid. 282 The Cadmus Group, ERS. (2011). Non-Controls Lighting Evaluation for the Massachusetts Small Commercial Direct Install
Program - Fourth Draft. Prepared for Massachusetts Energy Efficiency Program Administrators and Massachusetts Energy
Efficiency Advisory Council. Study 19 in the 2010 Massachusetts Electric Energy Efficiency Annual Report. 283 Ibid. 284 KEMA, Inc. (2009). Design 2000plus Lighting Hours of Use and Load Shapes Measurement Study. Prepared for National Grid.
Massachusetts Technical Reference Manual Commercial and Industrial Electric Efficiency Measures
August 2011 132
Lighting coincidence Factors are based on a NEEP regional C&I Lighting Loadshape study. Coincidence factors include HVAC interactive effects.285
C&I Small Retrofit Summer Coincidence Factor is based on a NEEP regional C&I Lighting Loadshape study.286 Winter Coincidence Factor is based on statewide impact evaluation of the 2010 Small Business Services programs.287 Coincidence factors include HVAC interactive effects.
285 KEMA, Inc. (2011). C&I Lighting Loadshape Project. Prepared for NEEP Regional EM&V Forum. Study 32 in the 2010 Massachusetts Electric Energy Efficiency Annual Report. 286 Ibid. 287 The Cadmus Group, ERS. (2011). Non-Controls Lighting Evaluation for the Massachusetts Small Commercial Direct Install
Program - Fourth Draft. Prepared for Massachusetts Joint Utilities. Study 19 in the 2010 Massachusetts Electric Energy Efficiency Annual Report.
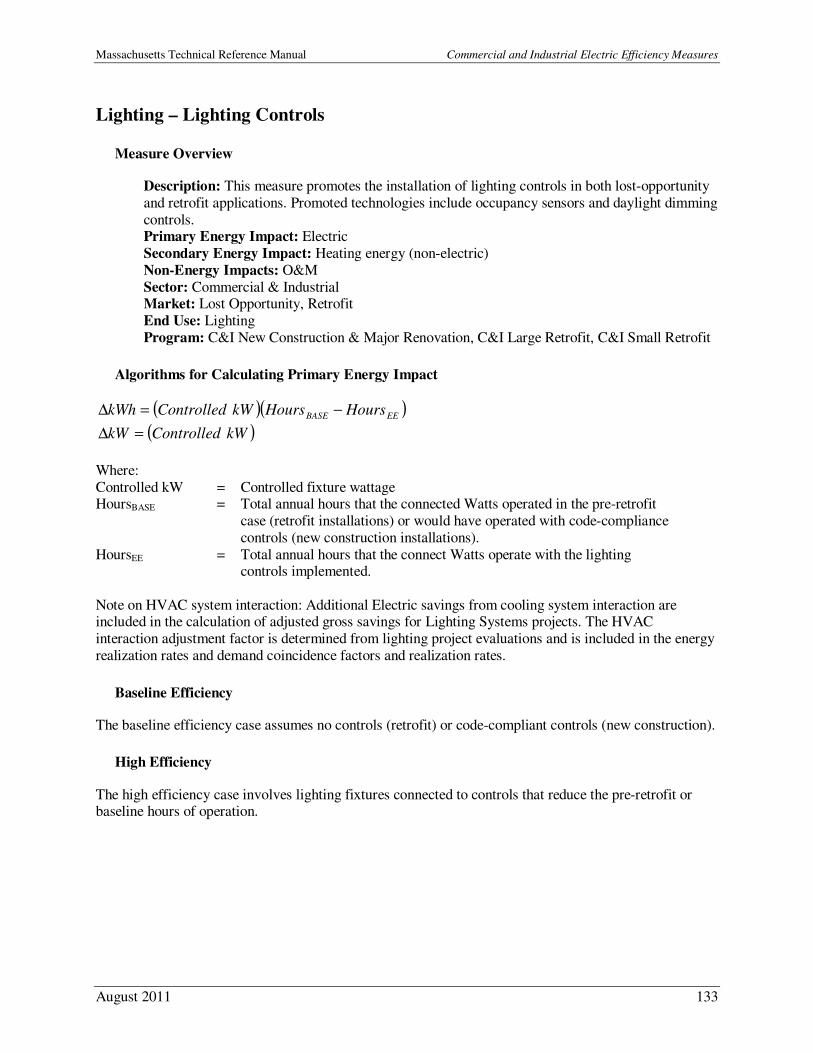
Massachusetts Technical Reference Manual Commercial and Industrial Electric Efficiency Measures
August 2011 133
Lighting – Lighting Controls
Measure Overview
Description: This measure promotes the installation of lighting controls in both lost-opportunity
and retrofit applications. Promoted technologies include occupancy sensors and daylight dimming
controls. Primary Energy Impact: Electric
Secondary Energy Impact: Heating energy (non-electric)
Non-Energy Impacts: O&M
Sector: Commercial & Industrial Market: Lost Opportunity, Retrofit
End Use: Lighting
Program: C&I New Construction & Major Renovation, C&I Large Retrofit, C&I Small Retrofit
Algorithms for Calculating Primary Energy Impact
( )( )EEBASE HoursHourskWControlledkWh −=∆
( )kWControlledkW =∆
Where:
Controlled kW = Controlled fixture wattage HoursBASE = Total annual hours that the connected Watts operated in the pre-retrofit
case (retrofit installations) or would have operated with code-compliance
controls (new construction installations).
HoursEE = Total annual hours that the connect Watts operate with the lighting controls implemented.
Note on HVAC system interaction: Additional Electric savings from cooling system interaction are included in the calculation of adjusted gross savings for Lighting Systems projects. The HVAC
interaction adjustment factor is determined from lighting project evaluations and is included in the energy
realization rates and demand coincidence factors and realization rates.
Baseline Efficiency
The baseline efficiency case assumes no controls (retrofit) or code-compliant controls (new construction).
High Efficiency
The high efficiency case involves lighting fixtures connected to controls that reduce the pre-retrofit or baseline hours of operation.
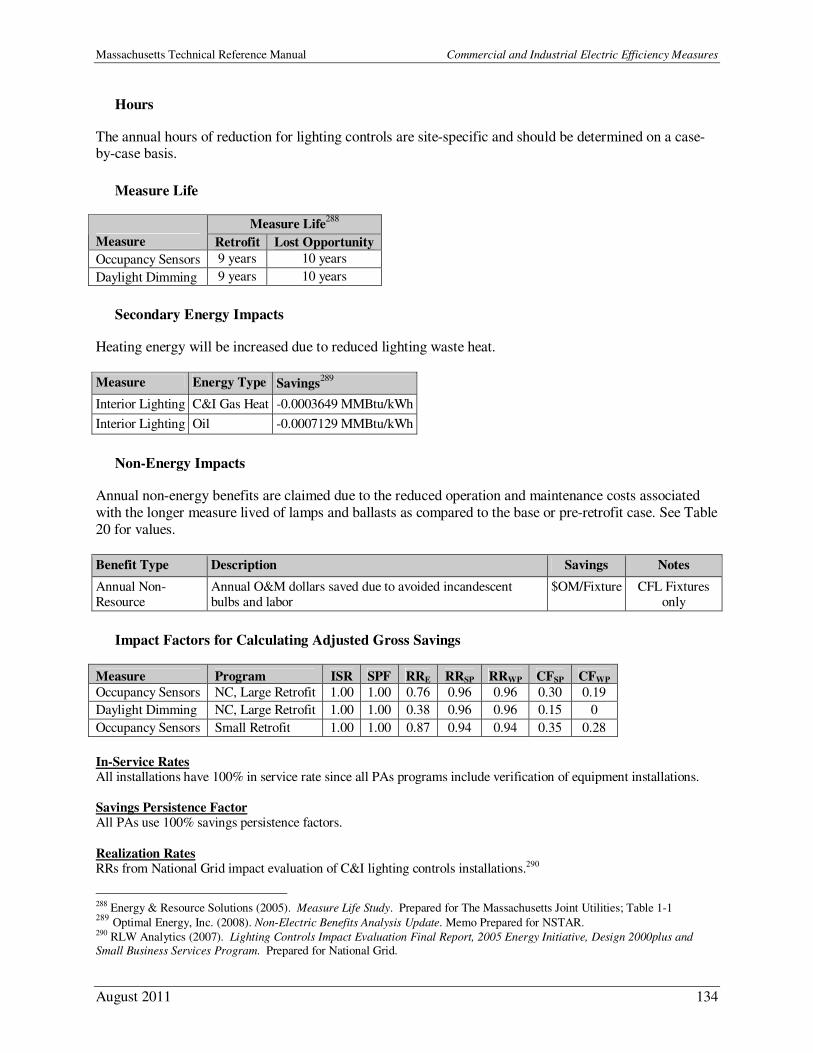
Massachusetts Technical Reference Manual Commercial and Industrial Electric Efficiency Measures
August 2011 134
Hours
The annual hours of reduction for lighting controls are site-specific and should be determined on a case-by-case basis.
Measure Life
Measure Life288
Measure Retrofit Lost Opportunity
Occupancy Sensors 9 years 10 years
Daylight Dimming 9 years 10 years
Secondary Energy Impacts
Heating energy will be increased due to reduced lighting waste heat.
Measure Energy Type Savings289
Interior Lighting C&I Gas Heat -0.0003649 MMBtu/kWh
Interior Lighting Oil -0.0007129 MMBtu/kWh
Non-Energy Impacts
Annual non-energy benefits are claimed due to the reduced operation and maintenance costs associated
with the longer measure lived of lamps and ballasts as compared to the base or pre-retrofit case. See Table
20 for values.
Benefit Type Description Savings Notes
Annual Non-Resource
Annual O&M dollars saved due to avoided incandescent bulbs and labor
$OM/Fixture CFL Fixtures only
Impact Factors for Calculating Adjusted Gross Savings
Measure Program ISR SPF RRE RRSP RRWP CFSP CFWP
Occupancy Sensors NC, Large Retrofit 1.00 1.00 0.76 0.96 0.96 0.30 0.19
Daylight Dimming NC, Large Retrofit 1.00 1.00 0.38 0.96 0.96 0.15 0
Occupancy Sensors Small Retrofit 1.00 1.00 0.87 0.94 0.94 0.35 0.28
In-Service Rates All installations have 100% in service rate since all PAs programs include verification of equipment installations.
Savings Persistence Factor All PAs use 100% savings persistence factors.
Realization Rates RRs from National Grid impact evaluation of C&I lighting controls installations.290
288 Energy & Resource Solutions (2005). Measure Life Study. Prepared for The Massachusetts Joint Utilities; Table 1-1 289 Optimal Energy, Inc. (2008). Non-Electric Benefits Analysis Update. Memo Prepared for NSTAR. 290 RLW Analytics (2007). Lighting Controls Impact Evaluation Final Report, 2005 Energy Initiative, Design 2000plus and
Small Business Services Program. Prepared for National Grid.

Massachusetts Technical Reference Manual Commercial and Industrial Electric Efficiency Measures
August 2011 135
Coincidence Factors CFs from National Grid impact evaluation C&I lighting controls installations.291
291 Ibid.
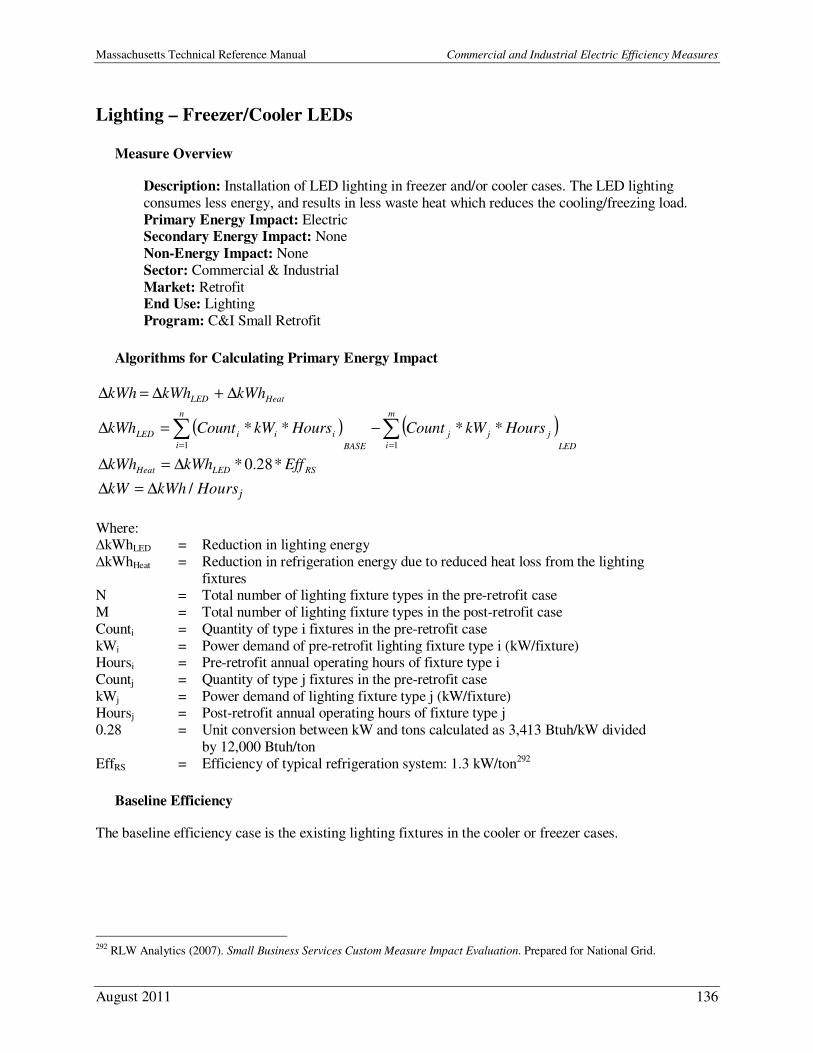
Massachusetts Technical Reference Manual Commercial and Industrial Electric Efficiency Measures
August 2011 136
Lighting – Freezer/Cooler LEDs
Measure Overview
Description: Installation of LED lighting in freezer and/or cooler cases. The LED lighting
consumes less energy, and results in less waste heat which reduces the cooling/freezing load.
Primary Energy Impact: Electric Secondary Energy Impact: None
Non-Energy Impact: None
Sector: Commercial & Industrial
Market: Retrofit End Use: Lighting
Program: C&I Small Retrofit
Algorithms for Calculating Primary Energy Impact
HeatLED kWhkWhkWh ∆+∆=∆
( ) ( )
LED
m
i
jjj
BASE
n
i
iiiLED HourskWCountHourskWCountkWh ∑∑==
−=∆
11
****
RSLEDHeat EffkWhkWh *28.0*∆=∆
jHourskWhkW /∆=∆
Where: ∆kWhLED = Reduction in lighting energy
∆kWhHeat = Reduction in refrigeration energy due to reduced heat loss from the lighting
fixtures N = Total number of lighting fixture types in the pre-retrofit case
M = Total number of lighting fixture types in the post-retrofit case
Counti = Quantity of type i fixtures in the pre-retrofit case
kWi = Power demand of pre-retrofit lighting fixture type i (kW/fixture) Hoursi = Pre-retrofit annual operating hours of fixture type i
Countj = Quantity of type j fixtures in the pre-retrofit case
kWj = Power demand of lighting fixture type j (kW/fixture) Hoursj = Post-retrofit annual operating hours of fixture type j
0.28 = Unit conversion between kW and tons calculated as 3,413 Btuh/kW divided
by 12,000 Btuh/ton
EffRS = Efficiency of typical refrigeration system: 1.3 kW/ton292
Baseline Efficiency
The baseline efficiency case is the existing lighting fixtures in the cooler or freezer cases.
292 RLW Analytics (2007). Small Business Services Custom Measure Impact Evaluation. Prepared for National Grid.
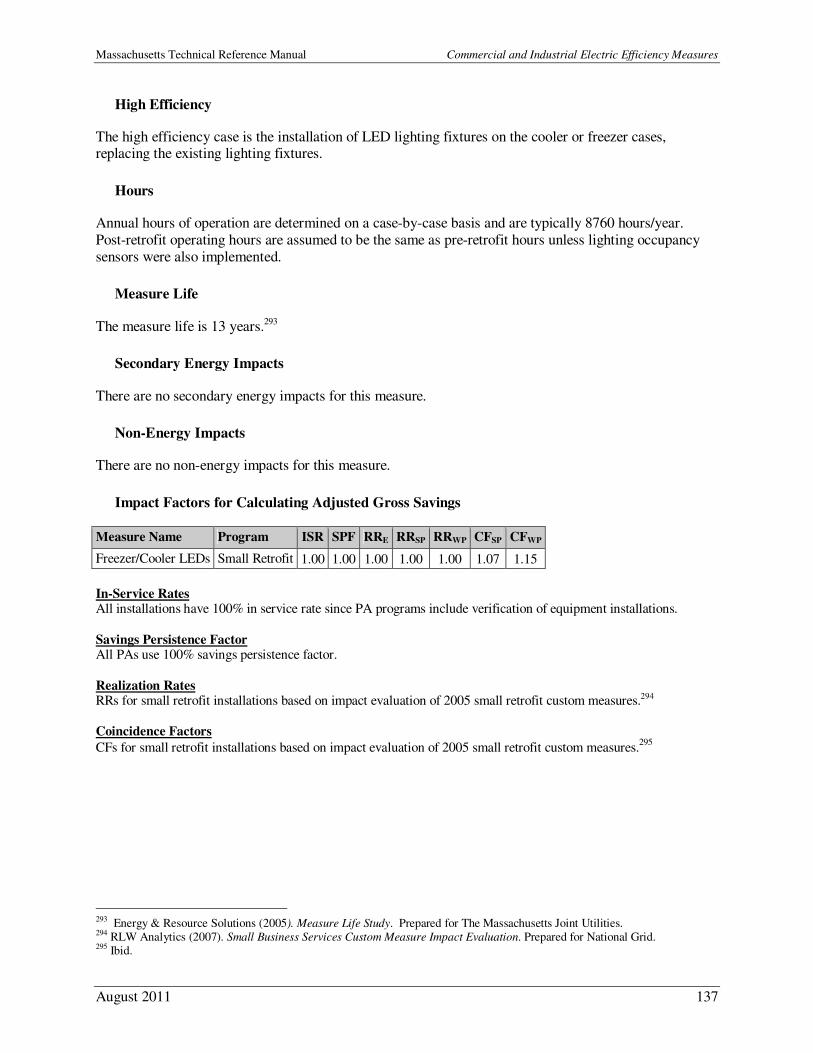
Massachusetts Technical Reference Manual Commercial and Industrial Electric Efficiency Measures
August 2011 137
High Efficiency
The high efficiency case is the installation of LED lighting fixtures on the cooler or freezer cases, replacing the existing lighting fixtures.
Hours
Annual hours of operation are determined on a case-by-case basis and are typically 8760 hours/year.
Post-retrofit operating hours are assumed to be the same as pre-retrofit hours unless lighting occupancy
sensors were also implemented.
Measure Life
The measure life is 13 years.293
Secondary Energy Impacts
There are no secondary energy impacts for this measure.
Non-Energy Impacts
There are no non-energy impacts for this measure.
Impact Factors for Calculating Adjusted Gross Savings
Measure Name Program ISR SPF RRE RRSP RRWP CFSP CFWP
Freezer/Cooler LEDs Small Retrofit 1.00 1.00 1.00 1.00 1.00 1.07 1.15
In-Service Rates All installations have 100% in service rate since PA programs include verification of equipment installations.
Savings Persistence Factor All PAs use 100% savings persistence factor.
Realization Rates RRs for small retrofit installations based on impact evaluation of 2005 small retrofit custom measures.294
Coincidence Factors
CFs for small retrofit installations based on impact evaluation of 2005 small retrofit custom measures.295
293 Energy & Resource Solutions (2005). Measure Life Study. Prepared for The Massachusetts Joint Utilities. 294 RLW Analytics (2007). Small Business Services Custom Measure Impact Evaluation. Prepared for National Grid. 295 Ibid.
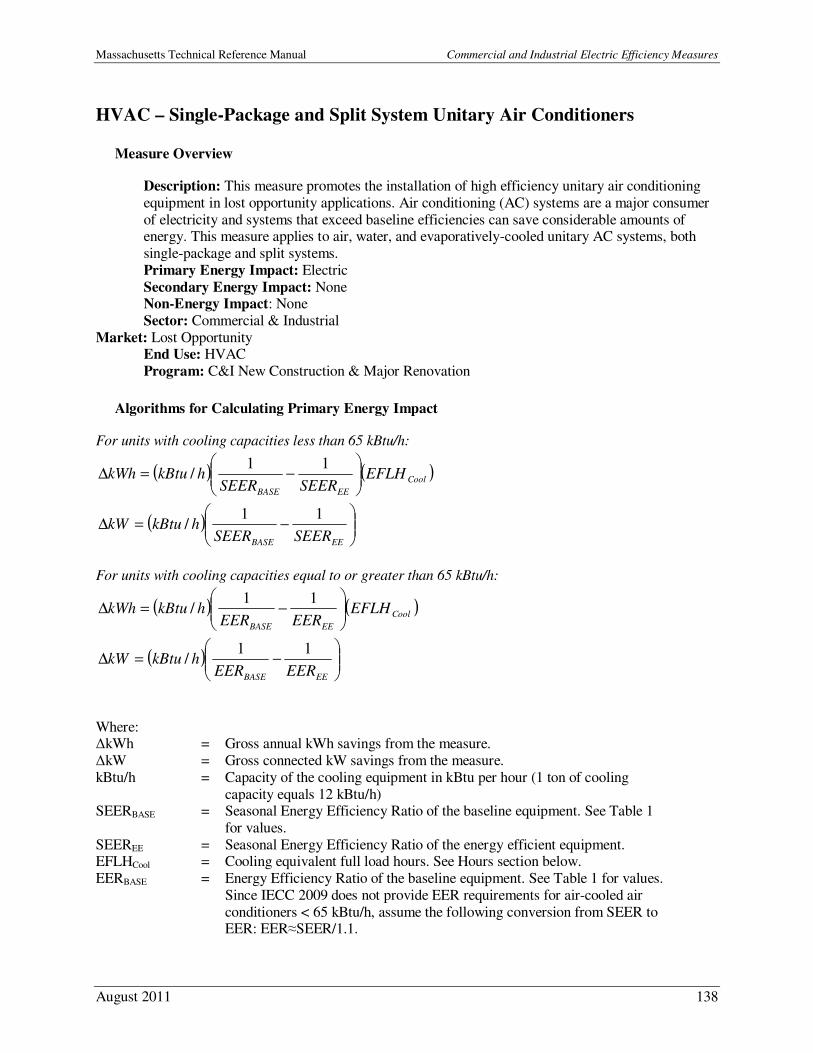
Massachusetts Technical Reference Manual Commercial and Industrial Electric Efficiency Measures
August 2011 138
HVAC – Single-Package and Split System Unitary Air Conditioners
Measure Overview
Description: This measure promotes the installation of high efficiency unitary air conditioning
equipment in lost opportunity applications. Air conditioning (AC) systems are a major consumer
of electricity and systems that exceed baseline efficiencies can save considerable amounts of energy. This measure applies to air, water, and evaporatively-cooled unitary AC systems, both
single-package and split systems.
Primary Energy Impact: Electric
Secondary Energy Impact: None Non-Energy Impact: None
Sector: Commercial & Industrial
Market: Lost Opportunity End Use: HVAC
Program: C&I New Construction & Major Renovation
Algorithms for Calculating Primary Energy Impact
For units with cooling capacities less than 65 kBtu/h:
( ) ( )Cool
EEBASE
EFLHSEERSEER
hkBtukWh
−=∆
11/
( )
−=∆
EEBASE SEERSEERhkBtukW
11/
For units with cooling capacities equal to or greater than 65 kBtu/h:
( ) ( )Cool
EEBASE
EFLHEEREER
hkBtukWh
−=∆
11/
( )
−=∆
EEBASE EEREERhkBtukW
11/
Where: ∆kWh = Gross annual kWh savings from the measure.
∆kW = Gross connected kW savings from the measure.
kBtu/h = Capacity of the cooling equipment in kBtu per hour (1 ton of cooling
capacity equals 12 kBtu/h) SEERBASE = Seasonal Energy Efficiency Ratio of the baseline equipment. See Table 1
for values.
SEEREE = Seasonal Energy Efficiency Ratio of the energy efficient equipment. EFLHCool = Cooling equivalent full load hours. See Hours section below.
EERBASE = Energy Efficiency Ratio of the baseline equipment. See Table 1 for values.
Since IECC 2009 does not provide EER requirements for air-cooled air
conditioners < 65 kBtu/h, assume the following conversion from SEER to EER: EER≈SEER/1.1.
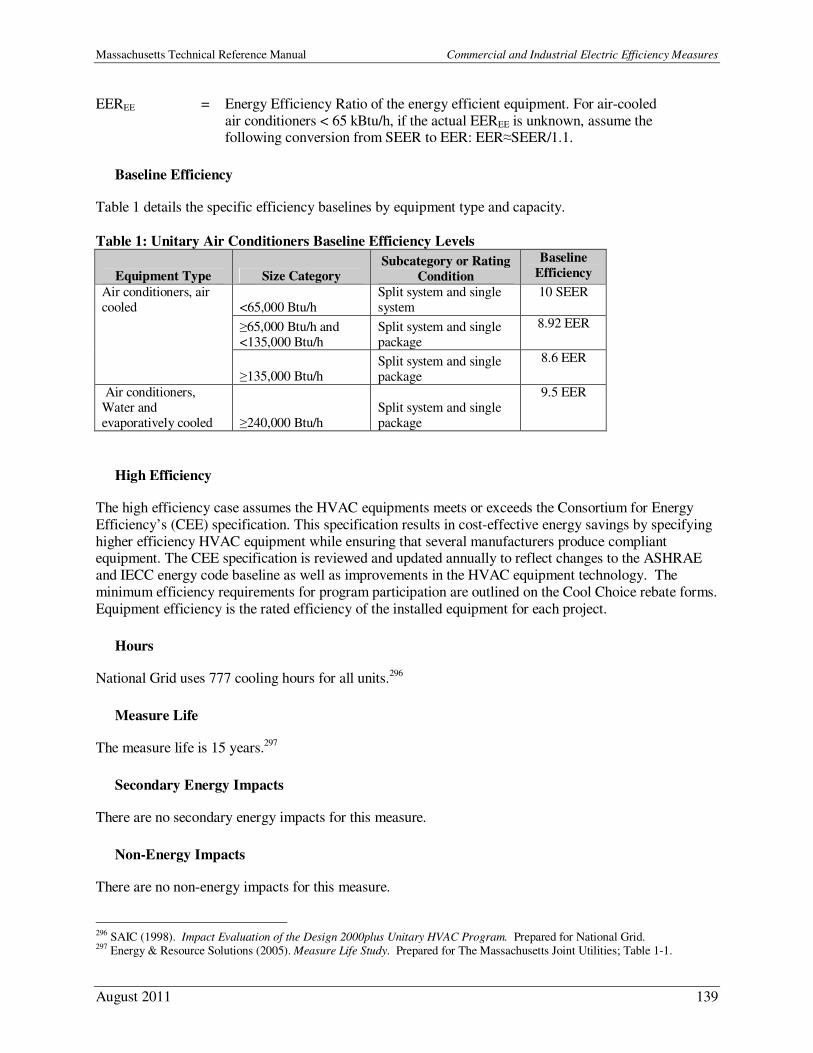
Massachusetts Technical Reference Manual Commercial and Industrial Electric Efficiency Measures
August 2011 139
EEREE = Energy Efficiency Ratio of the energy efficient equipment. For air-cooled
air conditioners < 65 kBtu/h, if the actual EEREE is unknown, assume the following conversion from SEER to EER: EER≈SEER/1.1.
Baseline Efficiency
Table 1 details the specific efficiency baselines by equipment type and capacity.
Table 1: Unitary Air Conditioners Baseline Efficiency Levels
Equipment Type Size Category Subcategory or Rating
Condition
Baseline
Efficiency
Air conditioners, air cooled <65,000 Btu/h
Split system and single system
10 SEER
≥65,000 Btu/h and <135,000 Btu/h
Split system and single package
8.92 EER
≥135,000 Btu/h Split system and single package
8.6 EER
Air conditioners, Water and evaporatively cooled ≥240,000 Btu/h
Split system and single package
9.5 EER
High Efficiency
The high efficiency case assumes the HVAC equipments meets or exceeds the Consortium for Energy
Efficiency’s (CEE) specification. This specification results in cost-effective energy savings by specifying
higher efficiency HVAC equipment while ensuring that several manufacturers produce compliant equipment. The CEE specification is reviewed and updated annually to reflect changes to the ASHRAE
and IECC energy code baseline as well as improvements in the HVAC equipment technology. The
minimum efficiency requirements for program participation are outlined on the Cool Choice rebate forms.
Equipment efficiency is the rated efficiency of the installed equipment for each project.
Hours
National Grid uses 777 cooling hours for all units.296
Measure Life
The measure life is 15 years.297
Secondary Energy Impacts
There are no secondary energy impacts for this measure.
Non-Energy Impacts
There are no non-energy impacts for this measure.
296 SAIC (1998). Impact Evaluation of the Design 2000plus Unitary HVAC Program. Prepared for National Grid. 297 Energy & Resource Solutions (2005). Measure Life Study. Prepared for The Massachusetts Joint Utilities; Table 1-1.
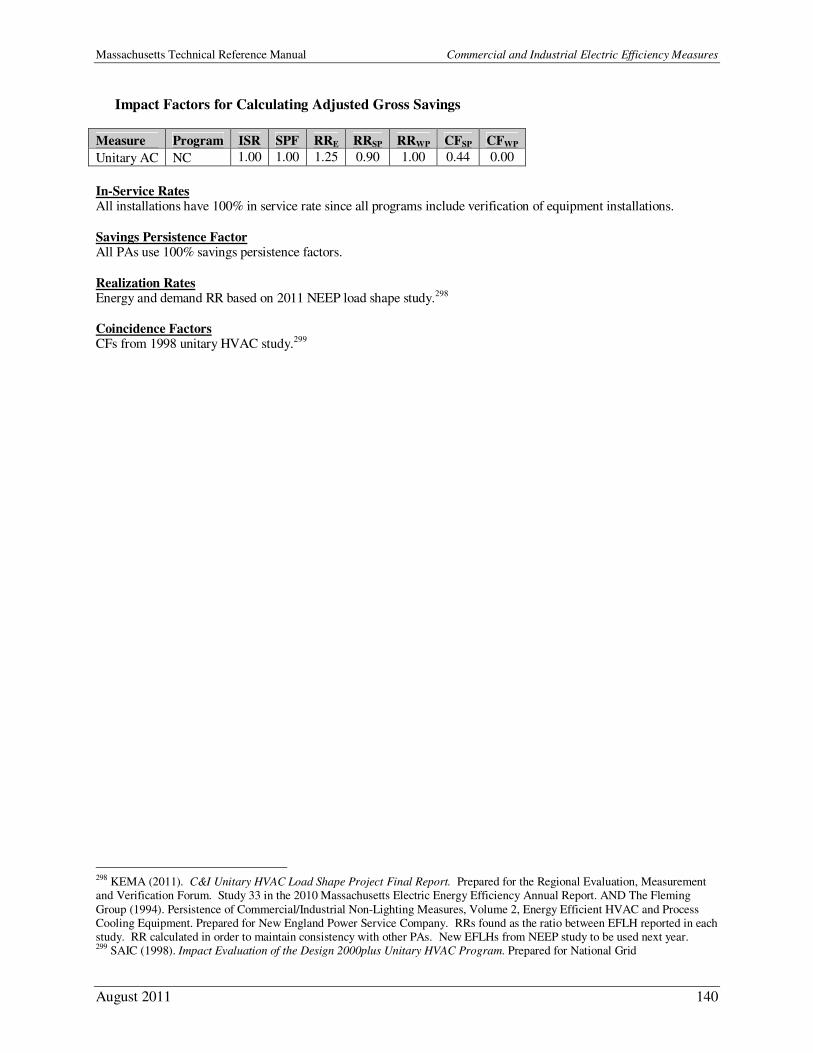
Massachusetts Technical Reference Manual Commercial and Industrial Electric Efficiency Measures
August 2011 140
Impact Factors for Calculating Adjusted Gross Savings
Measure Program ISR SPF RRE RRSP RRWP CFSP CFWP
Unitary AC NC 1.00 1.00 1.25 0.90 1.00 0.44 0.00
In-Service Rates All installations have 100% in service rate since all programs include verification of equipment installations.
Savings Persistence Factor All PAs use 100% savings persistence factors.
Realization Rates Energy and demand RR based on 2011 NEEP load shape study.298 Coincidence Factors CFs from 1998 unitary HVAC study.299
298 KEMA (2011). C&I Unitary HVAC Load Shape Project Final Report. Prepared for the Regional Evaluation, Measurement and Verification Forum. Study 33 in the 2010 Massachusetts Electric Energy Efficiency Annual Report. AND The Fleming
Group (1994). Persistence of Commercial/Industrial Non-Lighting Measures, Volume 2, Energy Efficient HVAC and Process Cooling Equipment. Prepared for New England Power Service Company. RRs found as the ratio between EFLH reported in each study. RR calculated in order to maintain consistency with other PAs. New EFLHs from NEEP study to be used next year. 299 SAIC (1998). Impact Evaluation of the Design 2000plus Unitary HVAC Program. Prepared for National Grid

Massachusetts Technical Reference Manual Commercial and Industrial Electric Efficiency Measures
August 2011 141
HVAC – Single Package or Split System Heat Pump Systems
Measure Overview
Description: This measure applies to the installation of high-efficiency air cooled, water source,
ground water source, and ground source heat pump systems.
Primary Energy Impact: Electric Secondary Energy Impact: None
Non-Energy Impact: None
Sector: Commercial & Industrial
Market: Lost Opportunity End Use: HVAC
Program: C&I New Construction & Major Renovation
Algorithms for Calculating Primary Energy Impact
For air cooled units with cooling capacities less than 65 kBtu/h:
( ) ( )( )HFEFLHSEERSEER
hkBtukWh COOL
EEBASE
−=∆
11/
( )
−=∆
EEBASE EEREERhkBtukW
11/
For all water source, groundwater source, ground source units, and air cooled units with cooling
capacities equal to, or greater than, 65 kBtu/h:
( ) ( )COOL
EEBASE
EFLHEEREER
hkBtukWh
−=∆
11/
( )
−=∆
EEBASE EEREERhkBtukW
11/
Where:
∆kWh = Gross annual kWh savings from the measure.
kBtu/h300 = Capacity of the cooling equipment in kBtu per hour (1 ton of cooling
capacity equals 12 kBtu/h). SEERBASE = Seasonal Energy Efficiency Ratio of the baseline equipment. See Baseline
Efficiency section for values.
SEEREE = Seasonal Energy Efficiency Ratio of the energy efficient equipment. EFLHCOOL = Cooling mode equivalent full load hours.
HF = Heating Factor to account for savings in heating mode for air cooled heat
pumps: 2.39301
300 For equipment with cooling capacities less than 65 kBtu/h, it is assumed that the heating capacity and cooling capacity are equal.
Massachusetts Technical Reference Manual Commercial and Industrial Electric Efficiency Measures
August 2011 142
EERBASE = Energy Efficiency Ratio of the baseline equipment. See Baseline Efficiency
section for values. Since IECC 2009 does not provide EER requirements for air-cooled heat pumps < 65 kBtu/h, assume the following conversion
from SEER to EER: EER≈SEER/1.1.
EEREE = Energy Efficiency Ratio of the energy efficient equipment. For air-cooled
air conditioners < 65 kBtu/h, if the actual EEREE is unknown, assume the following conversion from SEER to EER: EER≈SEER/1.1.
Heating Capacity Conversion Factors:
Air Source HPs
Heating Capacity = Cooling Capacity * 13,900/12,000 (Ratio of heat produced in the heating mode divided by cooling produced in cooling mode)
Water/Ground Source HPs
Heating Capacity = Cooling Capacity * COP/EER (converts the rated cooling output to the rated heating output)
Baseline Efficiency
National Grid specified 10 SEER for all air cooled heat pumps and 11.5 SEER for all water source heat
pumps.
High Efficiency
The high efficiency case assumes the HVAC equipments meets or exceeds the Consortium for Energy Efficiency’s (CEE) specification. This specification results in cost-effective energy savings by specifying
higher efficiency HVAC equipment while ensuring that several manufacturers produce compliant
equipment. The CEE specification is reviewed and updated annually to reflect changes to the ASHRAE
and IECC energy code baseline as well as improvements in the HVAC equipment technology.
The minimum efficiency requirements for program participation are outlined on the Cool Choice rebate
forms. Equipment efficiency is the rated efficiency of the installed equipment for each project.
Hours
National Grid uses default hours of 777 hours302 for air cooled heat pumps and 1029 hours303 for water cooled heat pumps.
Measure Life
The measure life is 15 years.304
301 The Fleming Group (1994). Persistence of Commercial/Industrial Non-Lighting Measures, Volume 2, Energy Efficient HVAC and Process Cooling Equipment. Prepared for New England Power Service Company 302 SAIC (1998). Impact Evaluation of the Design 2000plus Unitary HVAC Program. Prepared for National Grid. 303 The Fleming Group (1994). Persistence of Commercial/Industrial Non-Lighting Measures, Volume 2, Energy Efficient HVAC and Process Cooling Equipment. Prepared for New England Power Service Company 304 Energy & Resource Solutions (2005). Measure Life Study. Prepared for The Massachusetts Joint Utilities; Table 1-1.
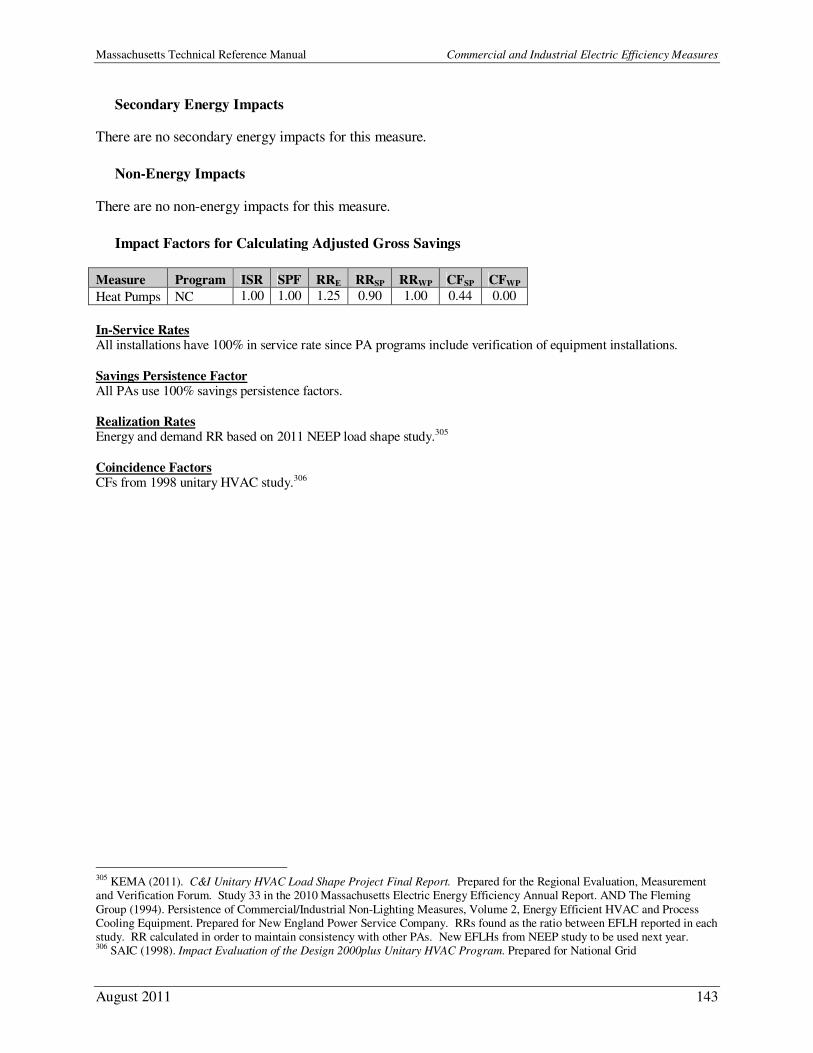
Massachusetts Technical Reference Manual Commercial and Industrial Electric Efficiency Measures
August 2011 143
Secondary Energy Impacts
There are no secondary energy impacts for this measure.
Non-Energy Impacts
There are no non-energy impacts for this measure.
Impact Factors for Calculating Adjusted Gross Savings
Measure Program ISR SPF RRE RRSP RRWP CFSP CFWP
Heat Pumps NC 1.00 1.00 1.25 0.90 1.00 0.44 0.00
In-Service Rates All installations have 100% in service rate since PA programs include verification of equipment installations.
Savings Persistence Factor All PAs use 100% savings persistence factors.
Realization Rates Energy and demand RR based on 2011 NEEP load shape study.305
Coincidence Factors CFs from 1998 unitary HVAC study.306
305 KEMA (2011). C&I Unitary HVAC Load Shape Project Final Report. Prepared for the Regional Evaluation, Measurement and Verification Forum. Study 33 in the 2010 Massachusetts Electric Energy Efficiency Annual Report. AND The Fleming
Group (1994). Persistence of Commercial/Industrial Non-Lighting Measures, Volume 2, Energy Efficient HVAC and Process Cooling Equipment. Prepared for New England Power Service Company. RRs found as the ratio between EFLH reported in each study. RR calculated in order to maintain consistency with other PAs. New EFLHs from NEEP study to be used next year. 306 SAIC (1998). Impact Evaluation of the Design 2000plus Unitary HVAC Program. Prepared for National Grid
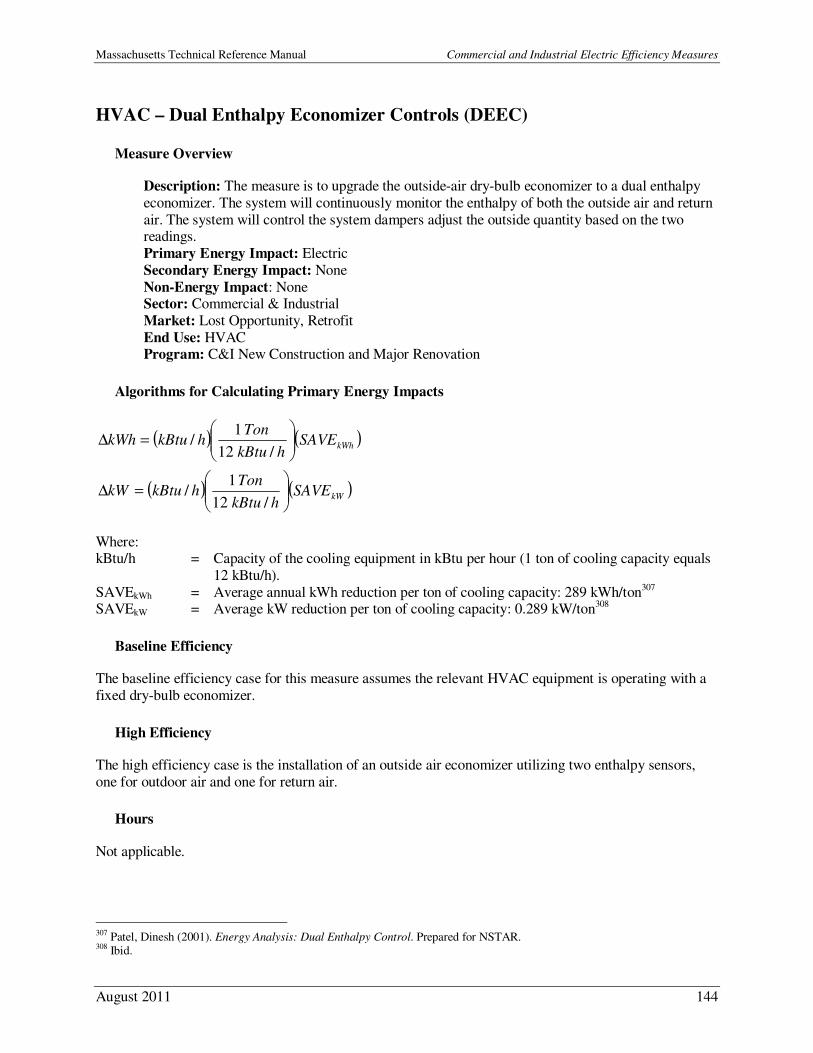
Massachusetts Technical Reference Manual Commercial and Industrial Electric Efficiency Measures
August 2011 144
HVAC – Dual Enthalpy Economizer Controls (DEEC)
Measure Overview
Description: The measure is to upgrade the outside-air dry-bulb economizer to a dual enthalpy
economizer. The system will continuously monitor the enthalpy of both the outside air and return
air. The system will control the system dampers adjust the outside quantity based on the two readings.
Primary Energy Impact: Electric
Secondary Energy Impact: None
Non-Energy Impact: None Sector: Commercial & Industrial
Market: Lost Opportunity, Retrofit
End Use: HVAC Program: C&I New Construction and Major Renovation
Algorithms for Calculating Primary Energy Impacts
( ) ( )kWhSAVEhkBtu
TonhkBtukWh
=∆
/12
1/
( ) ( )kWSAVEhkBtu
TonhkBtukW
=∆
/12
1/
Where: kBtu/h = Capacity of the cooling equipment in kBtu per hour (1 ton of cooling capacity equals
12 kBtu/h).
SAVEkWh = Average annual kWh reduction per ton of cooling capacity: 289 kWh/ton307 SAVEkW = Average kW reduction per ton of cooling capacity: 0.289 kW/ton308
Baseline Efficiency
The baseline efficiency case for this measure assumes the relevant HVAC equipment is operating with a
fixed dry-bulb economizer.
High Efficiency
The high efficiency case is the installation of an outside air economizer utilizing two enthalpy sensors,
one for outdoor air and one for return air.
Hours
Not applicable.
307 Patel, Dinesh (2001). Energy Analysis: Dual Enthalpy Control. Prepared for NSTAR. 308 Ibid.
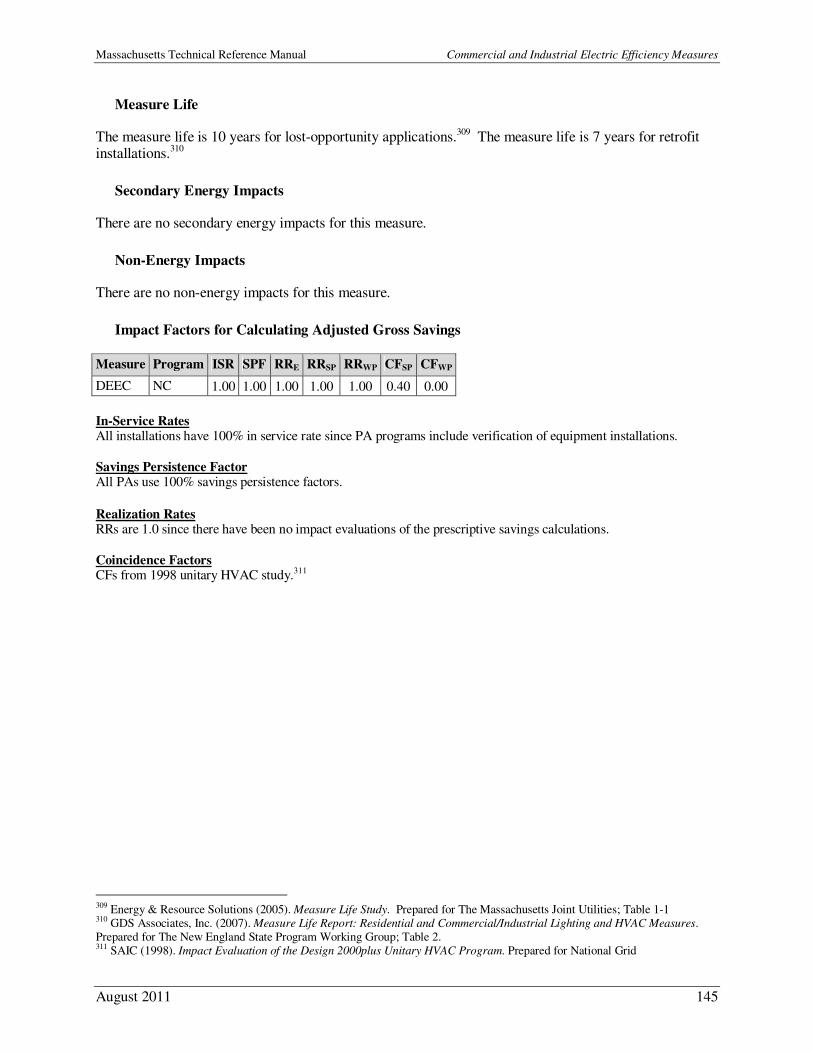
Massachusetts Technical Reference Manual Commercial and Industrial Electric Efficiency Measures
August 2011 145
Measure Life
The measure life is 10 years for lost-opportunity applications.309 The measure life is 7 years for retrofit installations.310
Secondary Energy Impacts
There are no secondary energy impacts for this measure.
Non-Energy Impacts
There are no non-energy impacts for this measure.
Impact Factors for Calculating Adjusted Gross Savings
Measure Program ISR SPF RRE RRSP RRWP CFSP CFWP
DEEC NC 1.00 1.00 1.00 1.00 1.00 0.40 0.00
In-Service Rates All installations have 100% in service rate since PA programs include verification of equipment installations.
Savings Persistence Factor All PAs use 100% savings persistence factors.
Realization Rates RRs are 1.0 since there have been no impact evaluations of the prescriptive savings calculations.
Coincidence Factors CFs from 1998 unitary HVAC study.311
309 Energy & Resource Solutions (2005). Measure Life Study. Prepared for The Massachusetts Joint Utilities; Table 1-1 310 GDS Associates, Inc. (2007). Measure Life Report: Residential and Commercial/Industrial Lighting and HVAC Measures. Prepared for The New England State Program Working Group; Table 2. 311 SAIC (1998). Impact Evaluation of the Design 2000plus Unitary HVAC Program. Prepared for National Grid
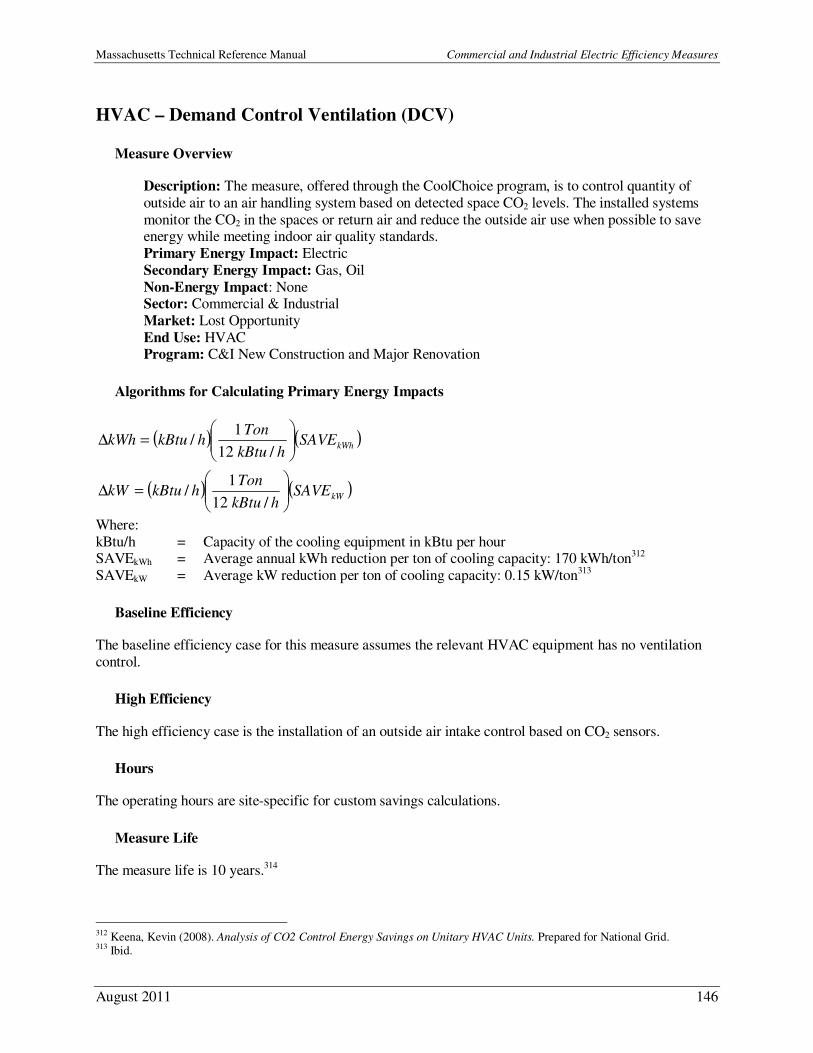
Massachusetts Technical Reference Manual Commercial and Industrial Electric Efficiency Measures
August 2011 146
HVAC – Demand Control Ventilation (DCV)
Measure Overview
Description: The measure, offered through the CoolChoice program, is to control quantity of
outside air to an air handling system based on detected space CO2 levels. The installed systems
monitor the CO2 in the spaces or return air and reduce the outside air use when possible to save energy while meeting indoor air quality standards.
Primary Energy Impact: Electric
Secondary Energy Impact: Gas, Oil
Non-Energy Impact: None Sector: Commercial & Industrial
Market: Lost Opportunity
End Use: HVAC Program: C&I New Construction and Major Renovation
Algorithms for Calculating Primary Energy Impacts
( ) ( )kWhSAVEhkBtu
TonhkBtukWh
=∆
/12
1/
( ) ( )kWSAVEhkBtu
TonhkBtukW
=∆
/12
1/
Where:
kBtu/h = Capacity of the cooling equipment in kBtu per hour SAVEkWh = Average annual kWh reduction per ton of cooling capacity: 170 kWh/ton312
SAVEkW = Average kW reduction per ton of cooling capacity: 0.15 kW/ton313
Baseline Efficiency
The baseline efficiency case for this measure assumes the relevant HVAC equipment has no ventilation
control.
High Efficiency
The high efficiency case is the installation of an outside air intake control based on CO2 sensors.
Hours
The operating hours are site-specific for custom savings calculations.
Measure Life
The measure life is 10 years.314
312 Keena, Kevin (2008). Analysis of CO2 Control Energy Savings on Unitary HVAC Units. Prepared for National Grid. 313 Ibid.
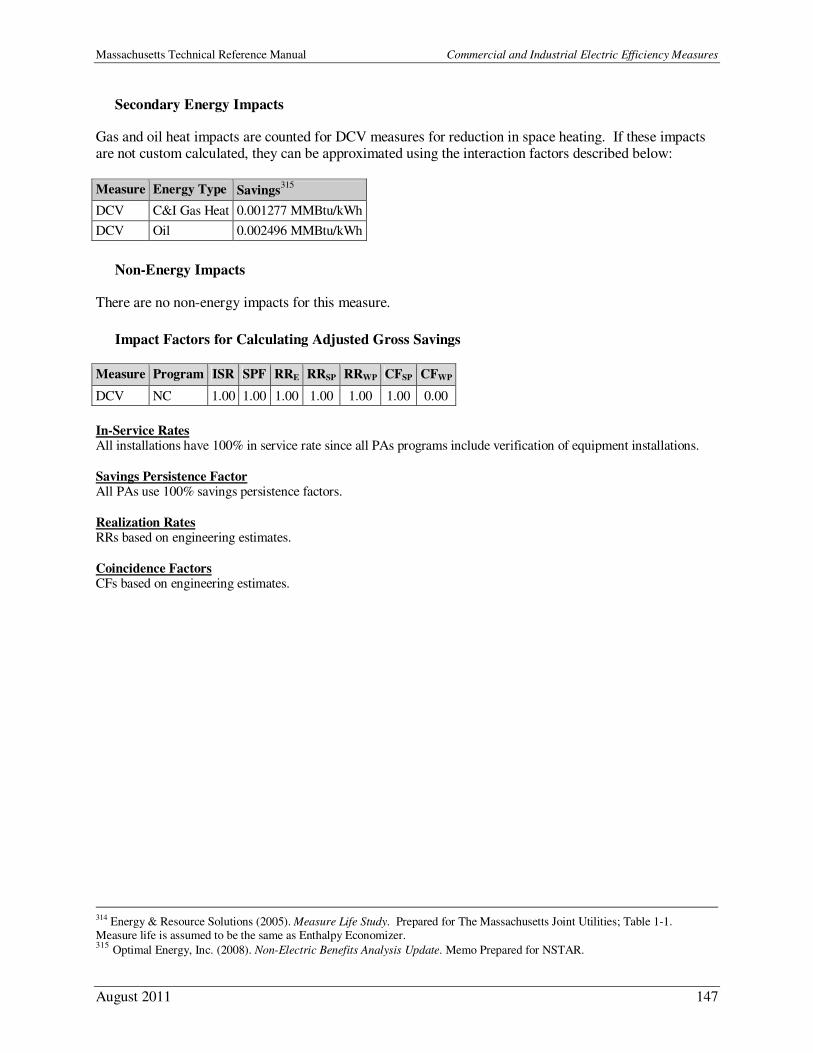
Massachusetts Technical Reference Manual Commercial and Industrial Electric Efficiency Measures
August 2011 147
Secondary Energy Impacts
Gas and oil heat impacts are counted for DCV measures for reduction in space heating. If these impacts are not custom calculated, they can be approximated using the interaction factors described below:
Measure Energy Type Savings315
DCV C&I Gas Heat 0.001277 MMBtu/kWh
DCV Oil 0.002496 MMBtu/kWh
Non-Energy Impacts
There are no non-energy impacts for this measure.
Impact Factors for Calculating Adjusted Gross Savings
Measure Program ISR SPF RRE RRSP RRWP CFSP CFWP
DCV NC 1.00 1.00 1.00 1.00 1.00 1.00 0.00
In-Service Rates All installations have 100% in service rate since all PAs programs include verification of equipment installations.
Savings Persistence Factor All PAs use 100% savings persistence factors.
Realization Rates RRs based on engineering estimates.
Coincidence Factors CFs based on engineering estimates.
314 Energy & Resource Solutions (2005). Measure Life Study. Prepared for The Massachusetts Joint Utilities; Table 1-1. Measure life is assumed to be the same as Enthalpy Economizer. 315 Optimal Energy, Inc. (2008). Non-Electric Benefits Analysis Update. Memo Prepared for NSTAR.
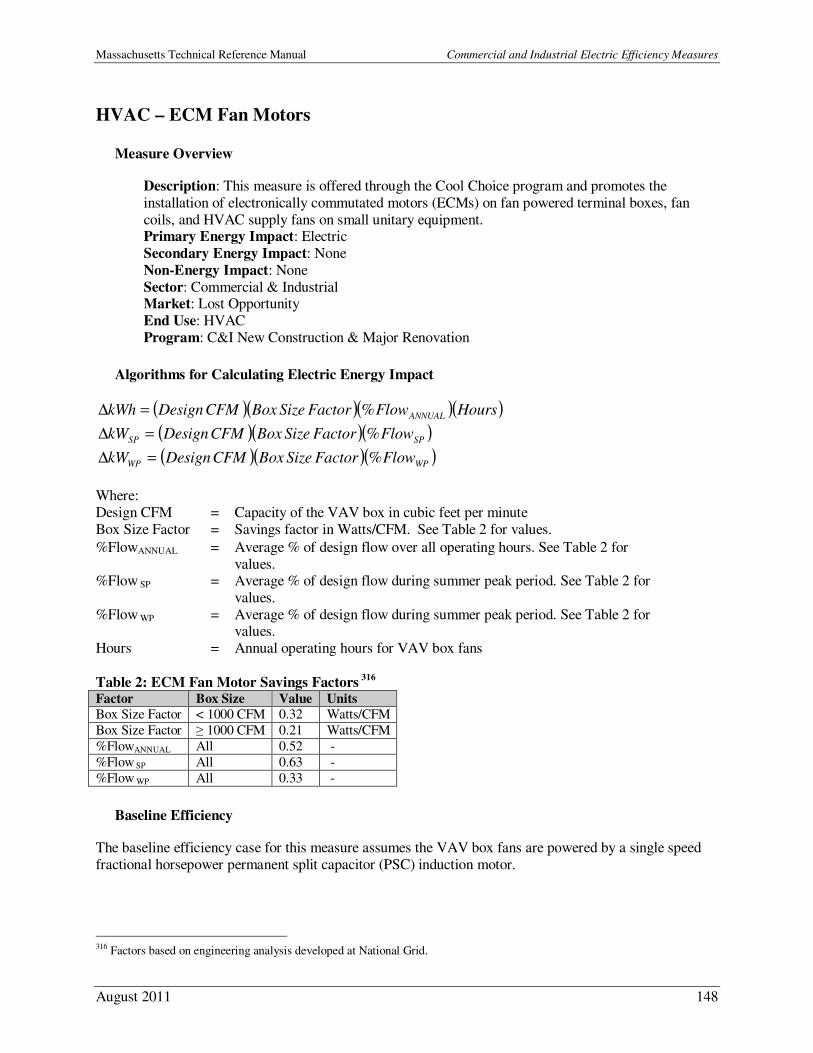
Massachusetts Technical Reference Manual Commercial and Industrial Electric Efficiency Measures
August 2011 148
HVAC – ECM Fan Motors
Measure Overview
Description: This measure is offered through the Cool Choice program and promotes the
installation of electronically commutated motors (ECMs) on fan powered terminal boxes, fan
coils, and HVAC supply fans on small unitary equipment. Primary Energy Impact: Electric
Secondary Energy Impact: None
Non-Energy Impact: None
Sector: Commercial & Industrial Market: Lost Opportunity
End Use: HVAC
Program: C&I New Construction & Major Renovation
Algorithms for Calculating Electric Energy Impact
( )( )( )( )HoursFlowFactorSizeBoxCFMDesignkWh ANNUAL%=∆
( )( )( )SPSP FlowFactorSizeBoxCFMDesignkW %=∆
( )( )( )WPWP FlowFactorSizeBoxCFMDesignkW %=∆
Where:
Design CFM = Capacity of the VAV box in cubic feet per minute
Box Size Factor = Savings factor in Watts/CFM. See Table 2 for values.
%FlowANNUAL = Average % of design flow over all operating hours. See Table 2 for
values. %Flow SP = Average % of design flow during summer peak period. See Table 2 for
values.
%Flow WP = Average % of design flow during summer peak period. See Table 2 for values.
Hours = Annual operating hours for VAV box fans
Table 2: ECM Fan Motor Savings Factors 316
Factor Box Size Value Units
Box Size Factor < 1000 CFM 0.32 Watts/CFM
Box Size Factor ≥ 1000 CFM 0.21 Watts/CFM
%FlowANNUAL All 0.52 -
%Flow SP All 0.63 -
%Flow WP All 0.33 -
Baseline Efficiency
The baseline efficiency case for this measure assumes the VAV box fans are powered by a single speed
fractional horsepower permanent split capacitor (PSC) induction motor.
316 Factors based on engineering analysis developed at National Grid.
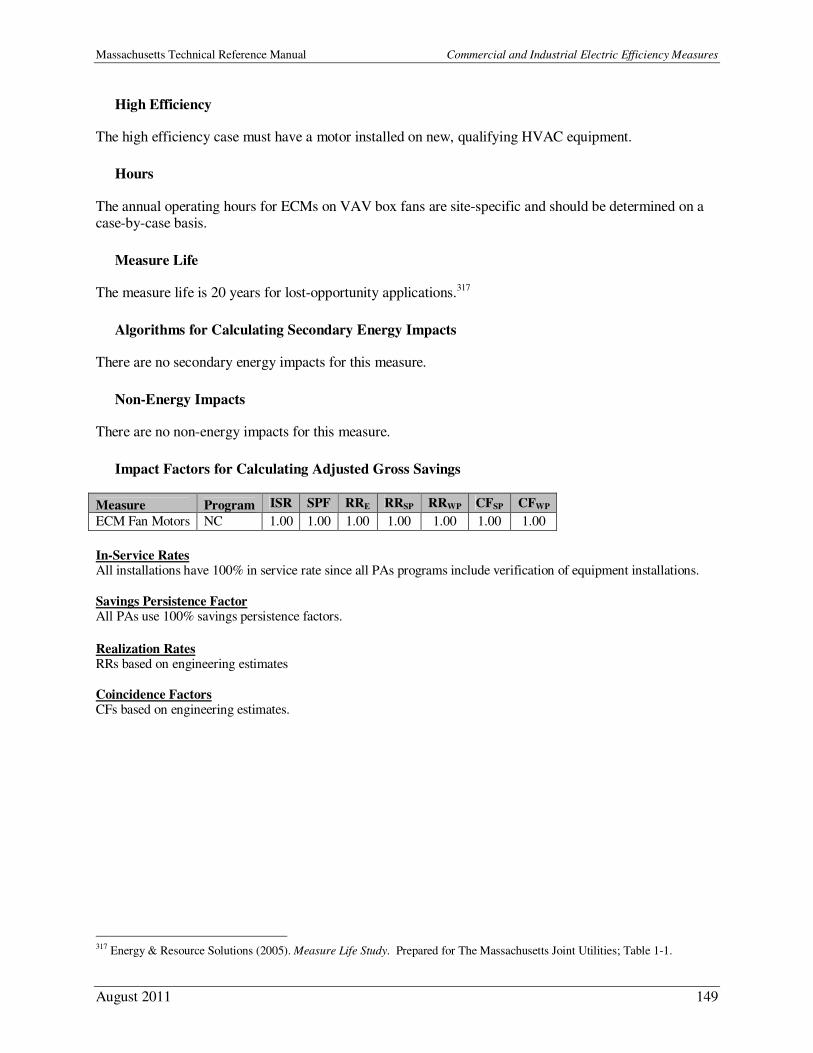
Massachusetts Technical Reference Manual Commercial and Industrial Electric Efficiency Measures
August 2011 149
High Efficiency
The high efficiency case must have a motor installed on new, qualifying HVAC equipment.
Hours
The annual operating hours for ECMs on VAV box fans are site-specific and should be determined on a case-by-case basis.
Measure Life
The measure life is 20 years for lost-opportunity applications.317
Algorithms for Calculating Secondary Energy Impacts
There are no secondary energy impacts for this measure.
Non-Energy Impacts
There are no non-energy impacts for this measure.
Impact Factors for Calculating Adjusted Gross Savings
Measure Program ISR SPF RRE RRSP RRWP CFSP CFWP
ECM Fan Motors NC 1.00 1.00 1.00 1.00 1.00 1.00 1.00
In-Service Rates All installations have 100% in service rate since all PAs programs include verification of equipment installations.
Savings Persistence Factor All PAs use 100% savings persistence factors.
Realization Rates RRs based on engineering estimates
Coincidence Factors CFs based on engineering estimates.
317 Energy & Resource Solutions (2005). Measure Life Study. Prepared for The Massachusetts Joint Utilities; Table 1-1.
Massachusetts Technical Reference Manual Commercial and Industrial Electric Efficiency Measures
August 2011 150
HVAC – Energy Management System
Measure Overview
Description: The measure is the installation of a new building energy management system
(EMS) or the expansion of an existing energy management system for control of non-lighting
electric and gas end-uses in an existing building on existing equipment. Primary Energy Impact: Electric
Secondary Energy Impact: Gas, Oil
Non-Energy Impact: None
Sector: Commercial & Industrial Market: Retrofit
End Use: HVAC
Program: C&I New Construction & Major Renovation, C&I Large Retrofit
Algorithms for Calculating Primary Energy Impacts
Gross energy and demand savings for energy management systems (EMS) are custom calculated using National Grid’s EMS savings calculation tools. The tool is used to calculate energy and demand savings
based on project-specific details including hours of operation, HVAC system equipment and efficiency
and points controlled.318
Baseline Efficiency
The baseline for this measure assumes the relevant HVAC equipment has no control.
High Efficiency
The high efficiency case is the installation of a new EMS or the expansion of an existing EMS to control
additional non-lighting electric or gas equipment. The EMS must be installed in an existing building on
existing equipment.
Hours
Not applicable.
Measure Life
For lost-opportunity applications, the measure life is 15 years.319 For retrofit applications, the measure life
is 10 years.320
318 Detailed descriptions of the EMS Savings Calculation Tools are included in the TRM Library under the “C&I Spreadsheet Tools” folder. 319 Energy & Resource Solutions (2005). Measure Life Study. Prepared for The Massachusetts Joint Utilities; Table 1-1. 320 Ibid.

Massachusetts Technical Reference Manual Commercial and Industrial Electric Efficiency Measures
August 2011 151
Secondary Energy Impacts
Heating Impacts: Gas and oil heat impacts are counted for EMS measures for reduction in space heating. If the heating system impacts are not calculated in the EMS savings calculation tool, they can be
approximated using the interaction factors described below:
Measure Energy Type Savings321
EMS C&I Gas Heat 0.001277 MMBtu/∆kWh
EMS Oil 0.002496 MMBtu/∆kWh
Non-Energy Impacts
There are no non-energy impacts for this measure.
Impact Factors for Calculating Adjusted Gross Savings
Measure Program ISR SPF RRE RRSP RRWP CFSP CFWP
EMS Large Retrofit 1.00 1.00 1.04 1.03 1.03 custom custom
In-Service Rates All installations have 100% in service rate since all PAs programs include verification of equipment installations.
Savings Persistence Factor All PAs use 100% savings persistence factors.
Realization Rates RRs derived from a 1994 study of HVAC and process cooling equipment.322
Coincidence Factor CFs are custom calculated.
321 Optimal Energy, Inc. (2008). Non-Electric Benefits Analysis Update. Memo Prepared for NSTAR. 322 The Fleming Group (1994). Persistence of Commercial/Industrial Non-Lighting Measures, Volume 3, Energy Management
Control Systems. Prepared for New England Power Service Company.
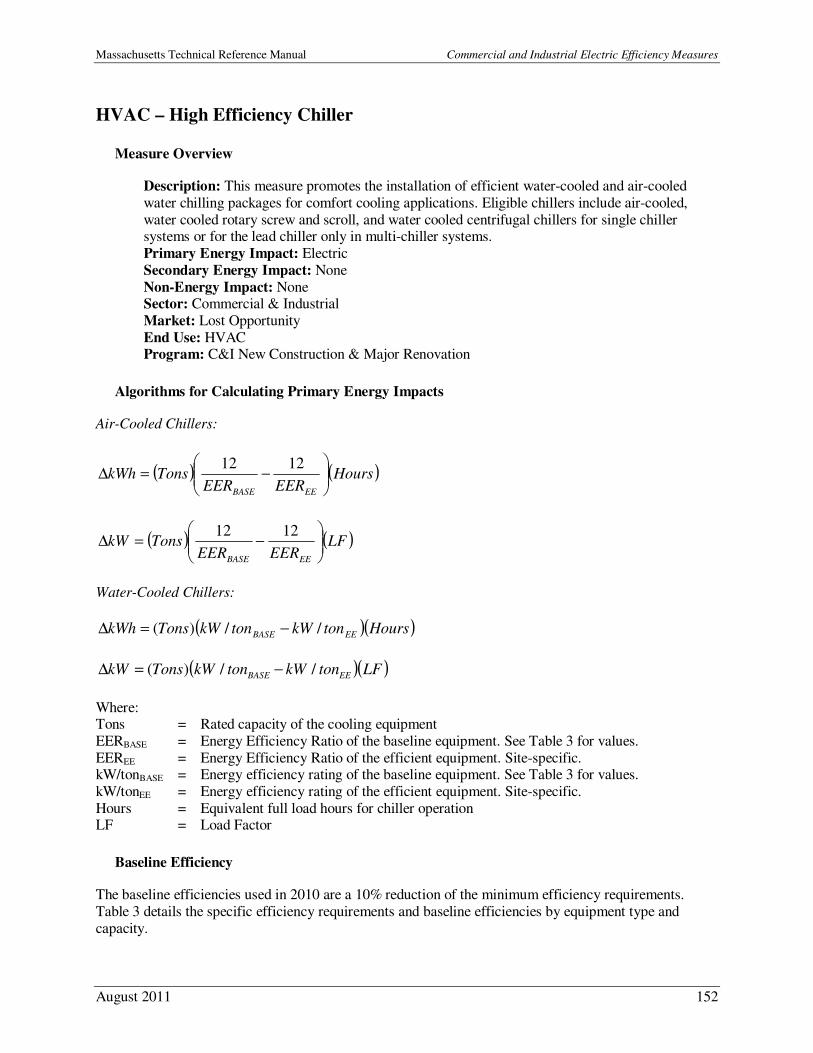
Massachusetts Technical Reference Manual Commercial and Industrial Electric Efficiency Measures
August 2011 152
HVAC – High Efficiency Chiller
Measure Overview
Description: This measure promotes the installation of efficient water-cooled and air-cooled
water chilling packages for comfort cooling applications. Eligible chillers include air-cooled,
water cooled rotary screw and scroll, and water cooled centrifugal chillers for single chiller systems or for the lead chiller only in multi-chiller systems.
Primary Energy Impact: Electric
Secondary Energy Impact: None
Non-Energy Impact: None Sector: Commercial & Industrial
Market: Lost Opportunity
End Use: HVAC Program: C&I New Construction & Major Renovation
Algorithms for Calculating Primary Energy Impacts
Air-Cooled Chillers:
( ) ( )HoursEEREER
TonskWhEEBASE
−=∆
1212
( ) ( )LFEEREER
TonskWEEBASE
−=∆
1212
Water-Cooled Chillers:
( )( )HourstonkWtonkWTonskWh EEBASE //)( −=∆
( )( )LFtonkWtonkWTonskW EEBASE //)( −=∆
Where: Tons = Rated capacity of the cooling equipment
EERBASE = Energy Efficiency Ratio of the baseline equipment. See Table 3 for values.
EEREE = Energy Efficiency Ratio of the efficient equipment. Site-specific. kW/tonBASE = Energy efficiency rating of the baseline equipment. See Table 3 for values.
kW/tonEE = Energy efficiency rating of the efficient equipment. Site-specific.
Hours = Equivalent full load hours for chiller operation LF = Load Factor
Baseline Efficiency
The baseline efficiencies used in 2010 are a 10% reduction of the minimum efficiency requirements.
Table 3 details the specific efficiency requirements and baseline efficiencies by equipment type and
capacity.
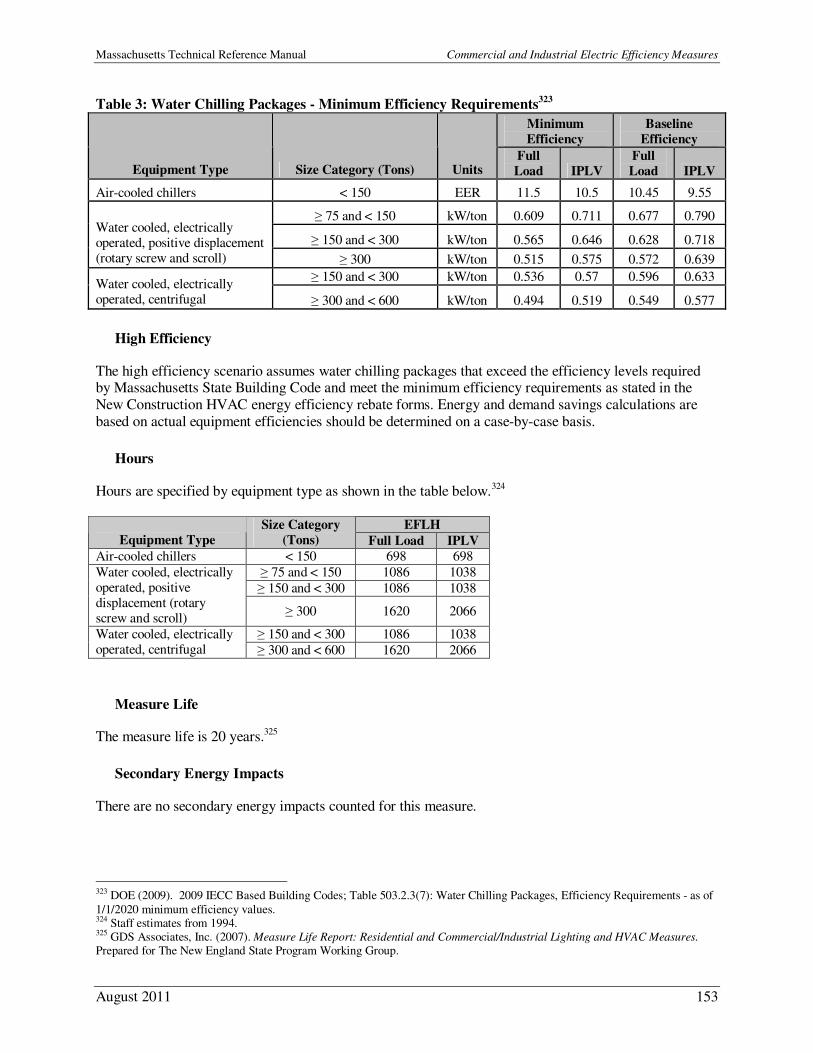
Massachusetts Technical Reference Manual Commercial and Industrial Electric Efficiency Measures
August 2011 153
Table 3: Water Chilling Packages - Minimum Efficiency Requirements323
Minimum
Efficiency
Baseline
Efficiency
Equipment Type Size Category (Tons) Units Full
Load IPLV
Full
Load IPLV
Air-cooled chillers < 150 EER 11.5 10.5 10.45 9.55
≥ 75 and < 150 kW/ton 0.609 0.711 0.677 0.790
≥ 150 and < 300 kW/ton 0.565 0.646 0.628 0.718 Water cooled, electrically operated, positive displacement (rotary screw and scroll) ≥ 300 kW/ton 0.515 0.575 0.572 0.639
≥ 150 and < 300 kW/ton 0.536 0.57 0.596 0.633 Water cooled, electrically operated, centrifugal ≥ 300 and < 600 kW/ton 0.494 0.519 0.549 0.577
High Efficiency
The high efficiency scenario assumes water chilling packages that exceed the efficiency levels required by Massachusetts State Building Code and meet the minimum efficiency requirements as stated in the
New Construction HVAC energy efficiency rebate forms. Energy and demand savings calculations are
based on actual equipment efficiencies should be determined on a case-by-case basis.
Hours
Hours are specified by equipment type as shown in the table below.324
EFLH
Equipment Type
Size Category
(Tons) Full Load IPLV
Air-cooled chillers < 150 698 698
≥ 75 and < 150 1086 1038
≥ 150 and < 300 1086 1038
Water cooled, electrically operated, positive displacement (rotary screw and scroll)
≥ 300 1620 2066
≥ 150 and < 300 1086 1038 Water cooled, electrically operated, centrifugal ≥ 300 and < 600 1620 2066
Measure Life
The measure life is 20 years.325
Secondary Energy Impacts
There are no secondary energy impacts counted for this measure.
323 DOE (2009). 2009 IECC Based Building Codes; Table 503.2.3(7): Water Chilling Packages, Efficiency Requirements - as of
1/1/2020 minimum efficiency values. 324 Staff estimates from 1994. 325 GDS Associates, Inc. (2007). Measure Life Report: Residential and Commercial/Industrial Lighting and HVAC Measures. Prepared for The New England State Program Working Group.
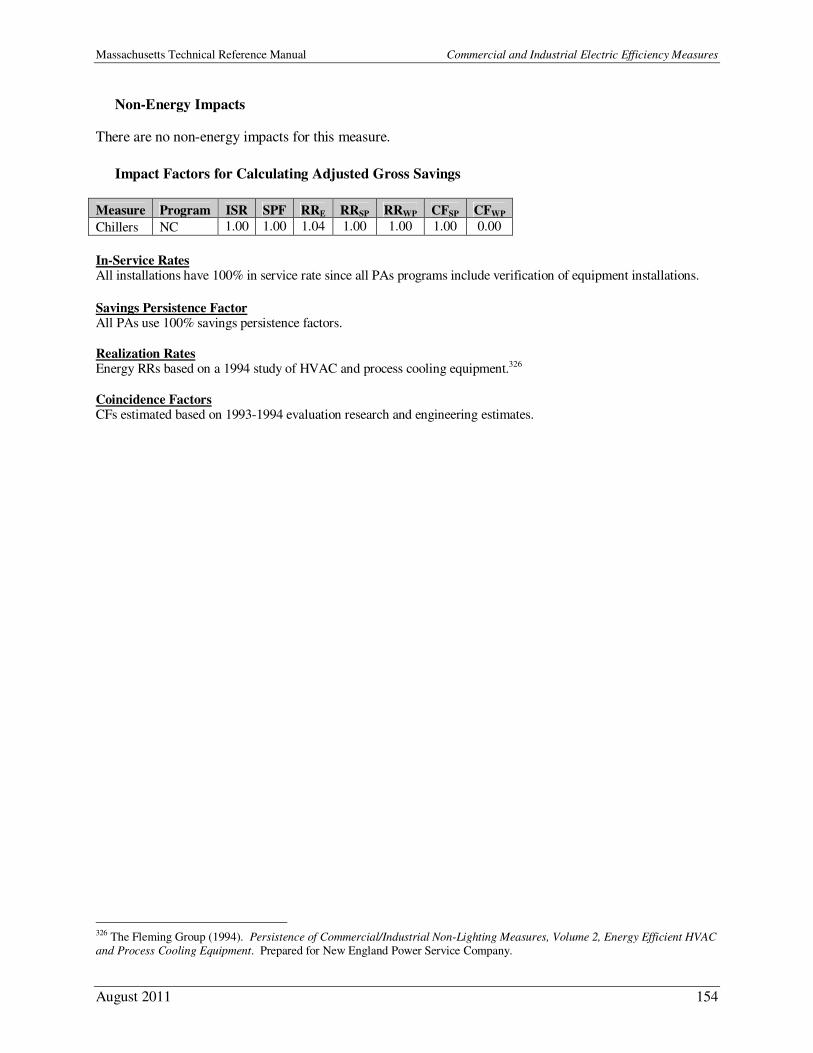
Massachusetts Technical Reference Manual Commercial and Industrial Electric Efficiency Measures
August 2011 154
Non-Energy Impacts
There are no non-energy impacts for this measure.
Impact Factors for Calculating Adjusted Gross Savings
Measure Program ISR SPF RRE RRSP RRWP CFSP CFWP
Chillers NC 1.00 1.00 1.04 1.00 1.00 1.00 0.00
In-Service Rates All installations have 100% in service rate since all PAs programs include verification of equipment installations.
Savings Persistence Factor All PAs use 100% savings persistence factors.
Realization Rates Energy RRs based on a 1994 study of HVAC and process cooling equipment.326
Coincidence Factors CFs estimated based on 1993-1994 evaluation research and engineering estimates.
326 The Fleming Group (1994). Persistence of Commercial/Industrial Non-Lighting Measures, Volume 2, Energy Efficient HVAC
and Process Cooling Equipment. Prepared for New England Power Service Company.
Massachusetts Technical Reference Manual Commercial and Industrial Electric Efficiency Measures
August 2011 155
HVAC – Hotel Occupancy Sensors
Measure Overview
Description: The measure is to the installation of hotel occupancy sensors (HOS) to control
packaged terminal AC units (PTACs) with electric heat, heat pump units and/or fan coil units in
hotels that operate all 12 months of the year. Primary Energy Impact: Electric
Secondary Energy Impact: None
Non-Energy Impact: None
Sector: Commercial & Industrial Market: Retrofit
End Use: HVAC
Program: C&I Large Retrofit
Algorithms for Calculating Primary Energy Impacts
Unit savings are deemed based on evaluation results:
kWhSAVEkWh =∆
kWSAVEkW =∆
Where: Unit = Installed hotel room occupancy sensor
SAVEkWh = Average annual kWh reduction per unit: 1801 kWh327
SAVEkW = Average annual kW reduction per unit: 0.35 kW328
Baseline Efficiency
The baseline efficiency case assumes the equipment has no occupancy based controls.
High Efficiency
The high efficiency case is the installation of controls that include (a) occupancy sensors, (b) window/door switches for rooms that have operable window or patio doors, and (c) set back to 65 F in the
heating mode and set forward to 78 F in the cooling mode when occupancy detector is in the unoccupied
mode. Sensors controlled by a front desk system are not eligible.
Hours
Not applicable.
Measure Life
For retrofit applications, the measure life is 10 years.329
327 MassSave (2010). Energy Analysis: Hotel Guest Occupancy Sensors. 328 Ibid.
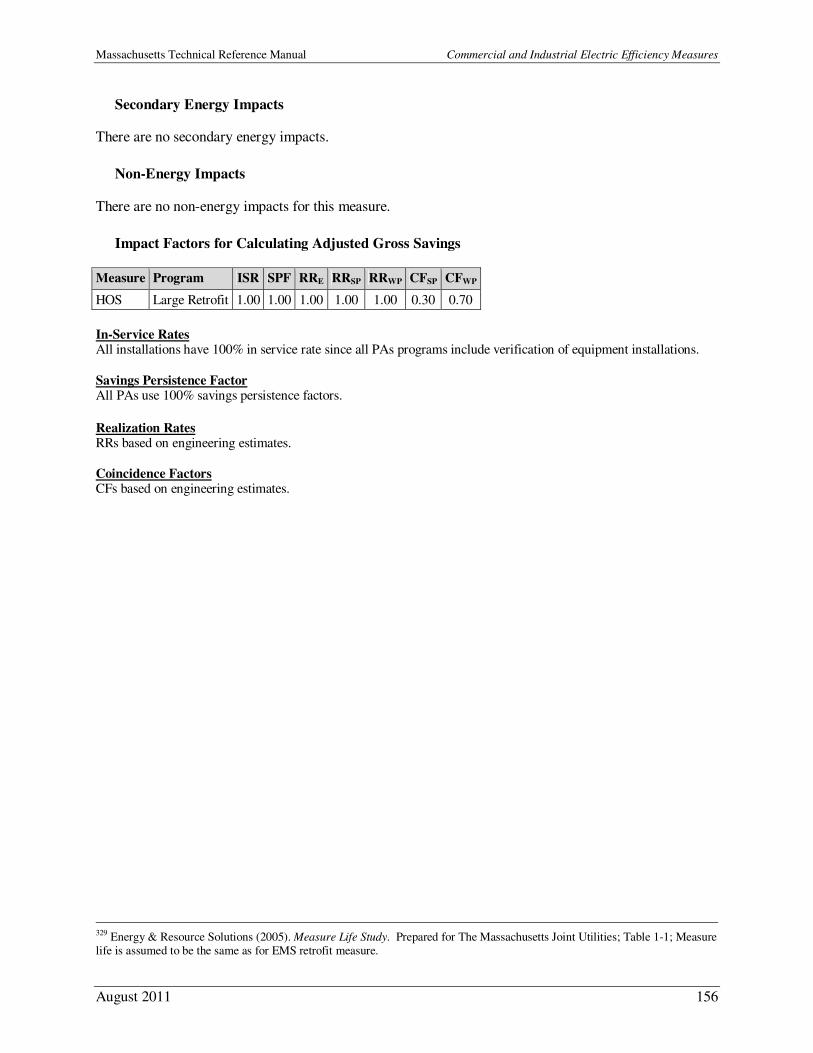
Massachusetts Technical Reference Manual Commercial and Industrial Electric Efficiency Measures
August 2011 156
Secondary Energy Impacts
There are no secondary energy impacts.
Non-Energy Impacts
There are no non-energy impacts for this measure.
Impact Factors for Calculating Adjusted Gross Savings
Measure Program ISR SPF RRE RRSP RRWP CFSP CFWP
HOS Large Retrofit 1.00 1.00 1.00 1.00 1.00 0.30 0.70
In-Service Rates All installations have 100% in service rate since all PAs programs include verification of equipment installations.
Savings Persistence Factor All PAs use 100% savings persistence factors.
Realization Rates RRs based on engineering estimates.
Coincidence Factors CFs based on engineering estimates.
329 Energy & Resource Solutions (2005). Measure Life Study. Prepared for The Massachusetts Joint Utilities; Table 1-1; Measure life is assumed to be the same as for EMS retrofit measure.
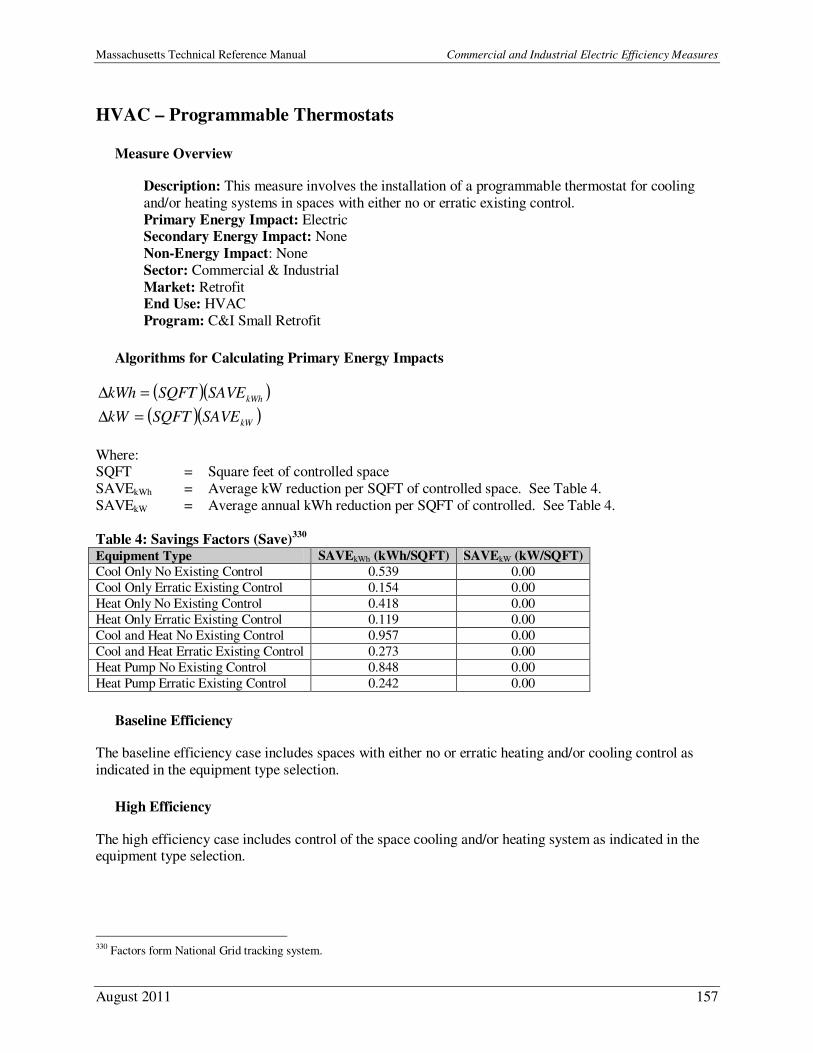
Massachusetts Technical Reference Manual Commercial and Industrial Electric Efficiency Measures
August 2011 157
HVAC – Programmable Thermostats
Measure Overview
Description: This measure involves the installation of a programmable thermostat for cooling
and/or heating systems in spaces with either no or erratic existing control.
Primary Energy Impact: Electric Secondary Energy Impact: None
Non-Energy Impact: None
Sector: Commercial & Industrial
Market: Retrofit End Use: HVAC
Program: C&I Small Retrofit
Algorithms for Calculating Primary Energy Impacts
( )( )kWhSAVESQFTkWh =∆
( )( )kWSAVESQFTkW =∆
Where: SQFT = Square feet of controlled space
SAVEkWh = Average kW reduction per SQFT of controlled space. See Table 4.
SAVEkW = Average annual kWh reduction per SQFT of controlled. See Table 4.
Table 4: Savings Factors (Save)330
Equipment Type SAVEkWh (kWh/SQFT) SAVEkW (kW/SQFT)
Cool Only No Existing Control 0.539 0.00
Cool Only Erratic Existing Control 0.154 0.00
Heat Only No Existing Control 0.418 0.00
Heat Only Erratic Existing Control 0.119 0.00
Cool and Heat No Existing Control 0.957 0.00
Cool and Heat Erratic Existing Control 0.273 0.00
Heat Pump No Existing Control 0.848 0.00
Heat Pump Erratic Existing Control 0.242 0.00
Baseline Efficiency
The baseline efficiency case includes spaces with either no or erratic heating and/or cooling control as
indicated in the equipment type selection.
High Efficiency
The high efficiency case includes control of the space cooling and/or heating system as indicated in the equipment type selection.
330 Factors form National Grid tracking system.
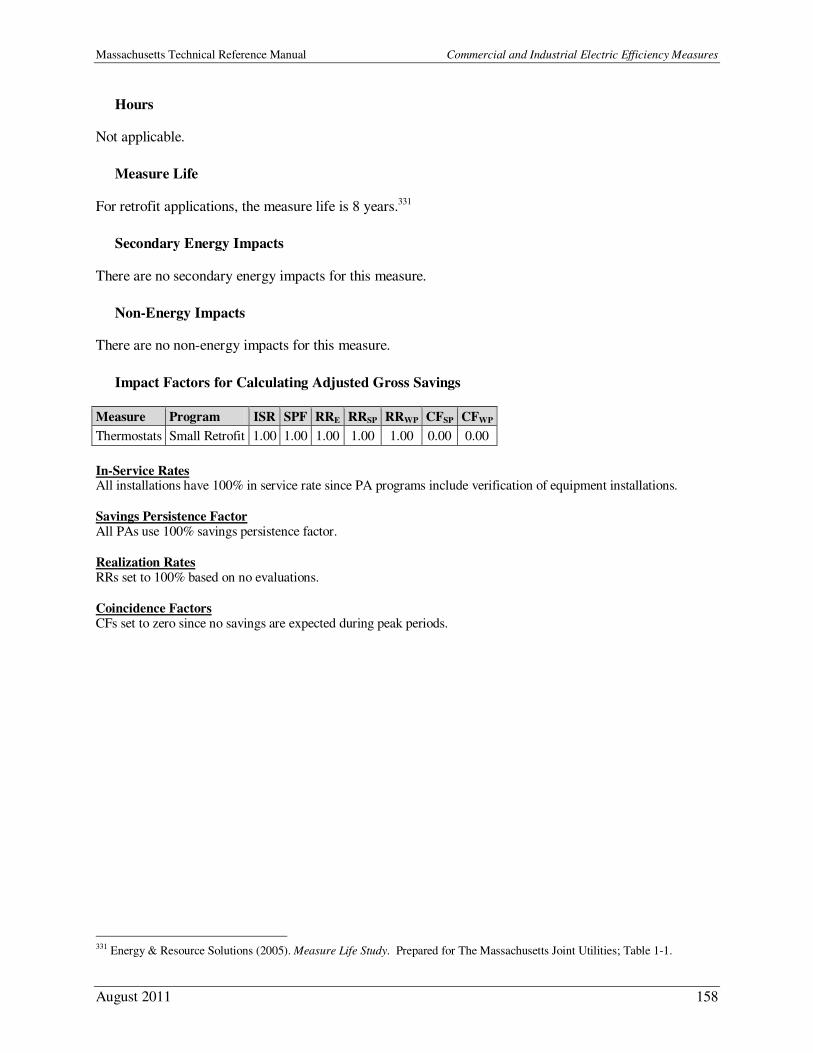
Massachusetts Technical Reference Manual Commercial and Industrial Electric Efficiency Measures
August 2011 158
Hours
Not applicable.
Measure Life
For retrofit applications, the measure life is 8 years.331
Secondary Energy Impacts
There are no secondary energy impacts for this measure.
Non-Energy Impacts
There are no non-energy impacts for this measure.
Impact Factors for Calculating Adjusted Gross Savings
Measure Program ISR SPF RRE RRSP RRWP CFSP CFWP
Thermostats Small Retrofit 1.00 1.00 1.00 1.00 1.00 0.00 0.00
In-Service Rates All installations have 100% in service rate since PA programs include verification of equipment installations.
Savings Persistence Factor All PAs use 100% savings persistence factor.
Realization Rates RRs set to 100% based on no evaluations.
Coincidence Factors CFs set to zero since no savings are expected during peak periods.
331 Energy & Resource Solutions (2005). Measure Life Study. Prepared for The Massachusetts Joint Utilities; Table 1-1.
Massachusetts Technical Reference Manual Commercial and Industrial Electric Efficiency Measures
August 2011 159
Refrigeration – Door Heater Controls
Measure Overview
Description: Installation of controls to reduce the run time of door and frame heaters for freezers
and walk-in or reach-in coolers. The reduced heating results in a reduced cooling load.332
Primary Energy Impact: Electric Secondary Energy Impact: None
Non-Energy Impact: None
Sector: Commercial & Industrial
Market: Retrofit End Use: Refrigeration
Program: C&I Small Retrofit
Algorithms for Calculating Primary Energy Impact
8760*%* OFFkWkWh DH=∆
OFFkWkW DH %*=∆
Where: kWDH = Total demand of the door heater, calculated as Volts * Amps / 1000
8760 = Door heater annual run hours before controls
%OFF Door heater Off time333: 46% for freezer door heaters or 74% for cooler door heaters)
Baseline Efficiency
The baseline efficiency case is a cooler or freezer door heater that operates 8,760 hours per year without
any controls.
High Efficiency
The high efficiency case is a cooler or freezer door heater connected to a heater control system, which
controls the door heaters by measuring the ambient humidity and temperature of the store, calculating the dewpoint, and using pulse width modulation (PWM) to control the anti-sweat heater based on specific
algorithms for freezer and cooler doors. Door temperature is typically maintained about 5oF above the
store air dewpoint temperature with the heaters operating at 80% (adjustable).334
Hours
Pre-retrofit hours are 8,760 hours per year. After controls are installed, the door heaters in freezers are on for an average 4,730.4 hours/year (46% off time) and the door heaters for coolers are on for an average
2,277.6 hours/year (74% off time).
332 The assumptions and algorithms used in this section are specific to NRM products. 333 The value is an estimate by NRM based on hundreds of downloads of hours of use data from Door Heater controllers. These values are also supported by Select Energy (2004). Cooler Control Measure Impact Spreadsheet User’s Manual. Prepared for NSTAR. 334 Select Energy (2004). Analysis of Cooler Control Energy Conservation Measures. Prepared for NSTAR.
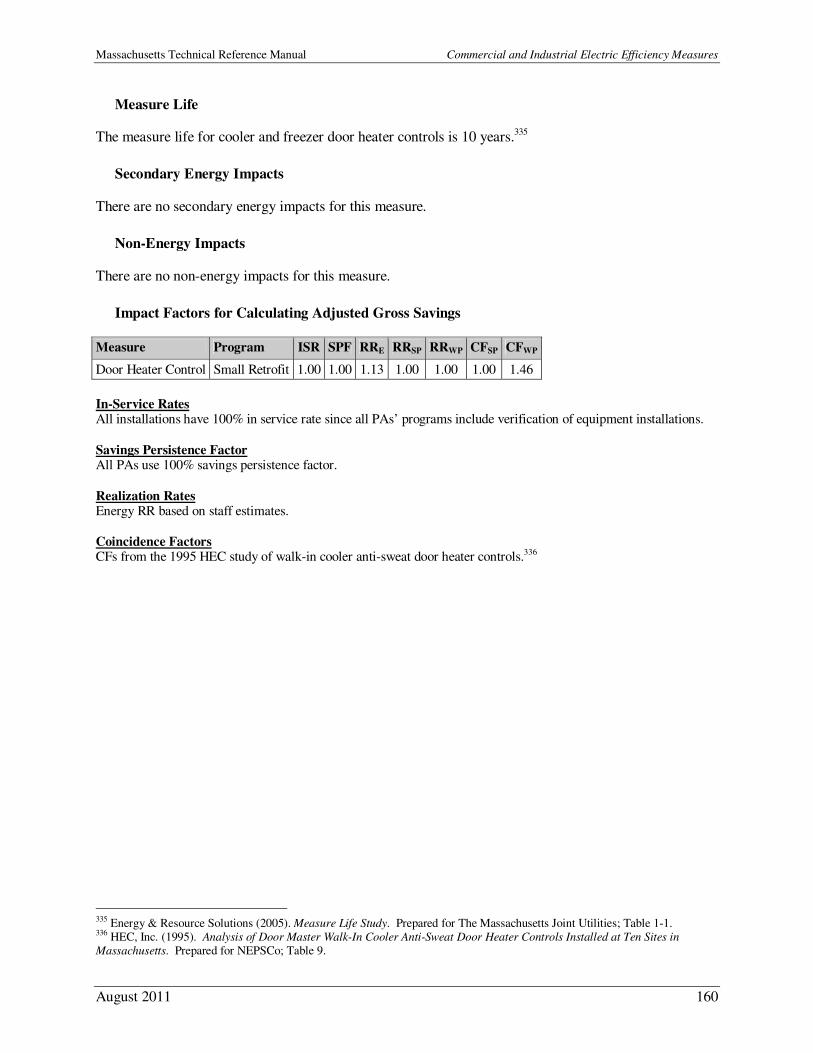
Massachusetts Technical Reference Manual Commercial and Industrial Electric Efficiency Measures
August 2011 160
Measure Life
The measure life for cooler and freezer door heater controls is 10 years.335
Secondary Energy Impacts
There are no secondary energy impacts for this measure.
Non-Energy Impacts
There are no non-energy impacts for this measure.
Impact Factors for Calculating Adjusted Gross Savings
Measure Program ISR SPF RRE RRSP RRWP CFSP CFWP
Door Heater Control Small Retrofit 1.00 1.00 1.13 1.00 1.00 1.00 1.46
In-Service Rates All installations have 100% in service rate since all PAs’ programs include verification of equipment installations.
Savings Persistence Factor All PAs use 100% savings persistence factor.
Realization Rates Energy RR based on staff estimates. Coincidence Factors CFs from the 1995 HEC study of walk-in cooler anti-sweat door heater controls.336
335 Energy & Resource Solutions (2005). Measure Life Study. Prepared for The Massachusetts Joint Utilities; Table 1-1. 336 HEC, Inc. (1995). Analysis of Door Master Walk-In Cooler Anti-Sweat Door Heater Controls Installed at Ten Sites in
Massachusetts. Prepared for NEPSCo; Table 9.
Massachusetts Technical Reference Manual Commercial and Industrial Electric Efficiency Measures
August 2011 161
Refrigeration – Novelty Cooler Shutoff
Measure Overview
Description: Installation of controls to shut off a facility’s novelty coolers for non-perishable
goods based on pre-programmed store hours. Energy savings occur as coolers cycle off during
facility unoccupied hours.337 Primary Energy Impact: Electric
Secondary Energy Impact: None
Non-Energy Impact: None
Sector: Commercial & Industrial Market: Retrofit
End Use: Refrigeration
Program: C&I Small Retrofit
Algorithms for Calculating Primary Energy Impact
( ) )()( HoursOFFDCkWkWh AVGNC=∆
0=∆kW
Where:
∆kW = 0 since savings are assumed to occur during evening hours and are therefore not
coincident with either summer or winter peak periods.
kWNC = Power demand of novelty cooler calculated from equipment nameplate data and estimated 0.85 power factor338
HoursOFF = Potential hours off per night, estimated as one less than the number of hours the store is
closed per day DCAVG = Weighted average annual duty cycle339
Baseline Efficiency
The baseline efficiency case is the novelty coolers operating 8,760 hours per year.
High Efficiency
The high efficiency case is the novelty coolers operating fewer than 8,760 hours per year since they are
controlled to cycle each night based on pre-programmed facility unoccupied hours.
Hours
Energy and demand savings are based on the reduced operation hours of the cooler equipment. Hours
reduced per day are estimated on a case-by-case basis, and are typically calculated as one less than the number of hours per day that the facility is closed each day.
337 The assumptions and algorithms used in this section are specific to NRM products. 338 Conservative value based on 15 years of NRM field observations and experience. 339 Ibid; the estimated duty cycles for Novelty Coolers are supported by Select Energy (2004). Cooler Control Measure Impact
Spreadsheet Users’ Manual. Prepared for NSTAR. The study gives a less conservative value than used by NRM.

Massachusetts Technical Reference Manual Commercial and Industrial Electric Efficiency Measures
August 2011 162
Measure Life
The measure life is 10 years.340
Secondary Energy Impacts
There are no secondary energy impacts for this measure.
Non-Energy Impacts
There are no non-energy impacts for this measure.
Impact Factors for Calculating Adjusted Gross Savings
Measure Name Program ISR SPF RRE RRSP RRWP CFSP CFWP
Novelty Cooler Shutoff Small Retrofit 1.00 1.00 1.13 1.00 1.00 0.73 1.46
In-Service Rates All installations have 100% in service rate since all PAs’ programs include verification of equipment installations.
Savings Persistence Factor All PAs use 100% savings persistence factor.
Realization Rates Energy RR based on staff estimates.
Coincidence Factors CFs from the 1995 HEC study of walk-in cooler anti-sweat door heater controls.341 .
340 Energy & Resource Solutions (2005). Measure Life Study. Prepared for The Massachusetts Joint Utilities; Table 1-1. 341 HEC, Inc. (1995). Analysis of Door Master Walk-In Cooler Anti-Sweat Door Heater Controls Installed at Ten Sites in
Massachusetts. Prepared for NEPSCo; Table 9.
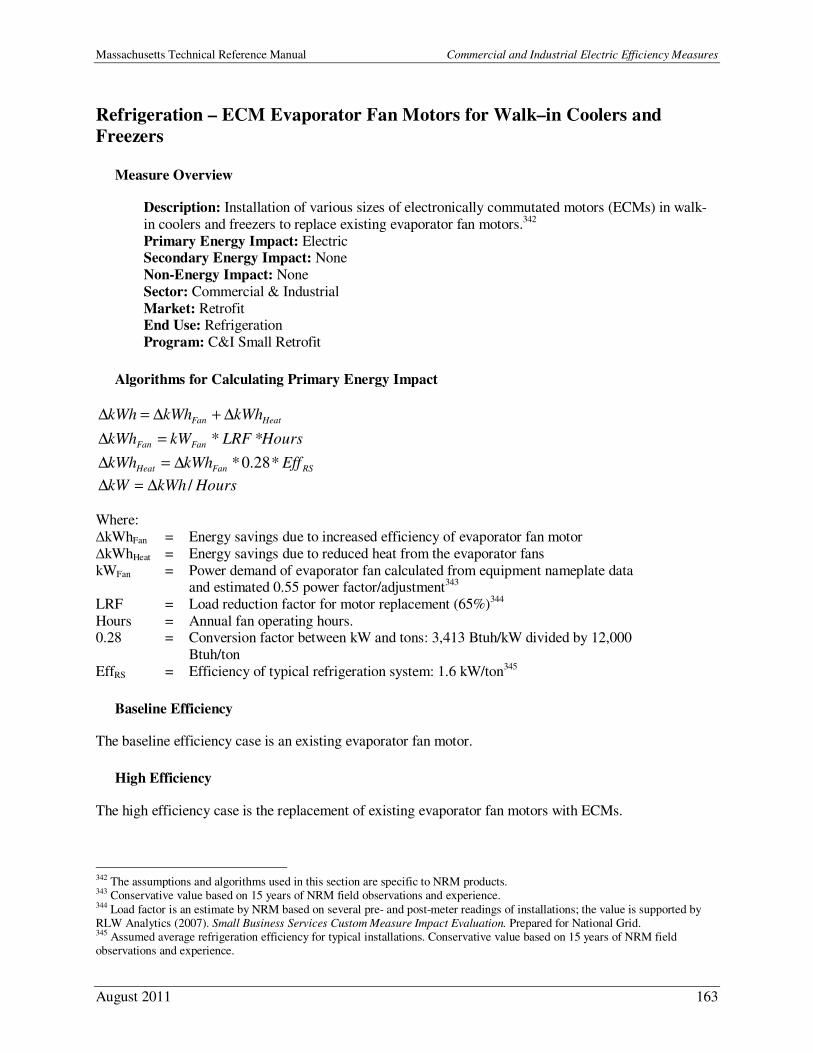
Massachusetts Technical Reference Manual Commercial and Industrial Electric Efficiency Measures
August 2011 163
Refrigeration – ECM Evaporator Fan Motors for Walk–in Coolers and
Freezers
Measure Overview
Description: Installation of various sizes of electronically commutated motors (ECMs) in walk-
in coolers and freezers to replace existing evaporator fan motors.342
Primary Energy Impact: Electric Secondary Energy Impact: None
Non-Energy Impact: None
Sector: Commercial & Industrial
Market: Retrofit End Use: Refrigeration
Program: C&I Small Retrofit
Algorithms for Calculating Primary Energy Impact
HeatFan kWhkWhkWh ∆+∆=∆
HoursLRFkWkWh FanFan **=∆
RSFanHeat EffkWhkWh *28.0*∆=∆
HourskWhkW /∆=∆
Where:
∆kWhFan = Energy savings due to increased efficiency of evaporator fan motor
∆kWhHeat = Energy savings due to reduced heat from the evaporator fans
kWFan = Power demand of evaporator fan calculated from equipment nameplate data and estimated 0.55 power factor/adjustment343
LRF = Load reduction factor for motor replacement (65%)344
Hours = Annual fan operating hours. 0.28 = Conversion factor between kW and tons: 3,413 Btuh/kW divided by 12,000
Btuh/ton
EffRS = Efficiency of typical refrigeration system: 1.6 kW/ton345
Baseline Efficiency
The baseline efficiency case is an existing evaporator fan motor.
High Efficiency
The high efficiency case is the replacement of existing evaporator fan motors with ECMs.
342 The assumptions and algorithms used in this section are specific to NRM products. 343 Conservative value based on 15 years of NRM field observations and experience. 344 Load factor is an estimate by NRM based on several pre- and post-meter readings of installations; the value is supported by RLW Analytics (2007). Small Business Services Custom Measure Impact Evaluation. Prepared for National Grid. 345 Assumed average refrigeration efficiency for typical installations. Conservative value based on 15 years of NRM field observations and experience.
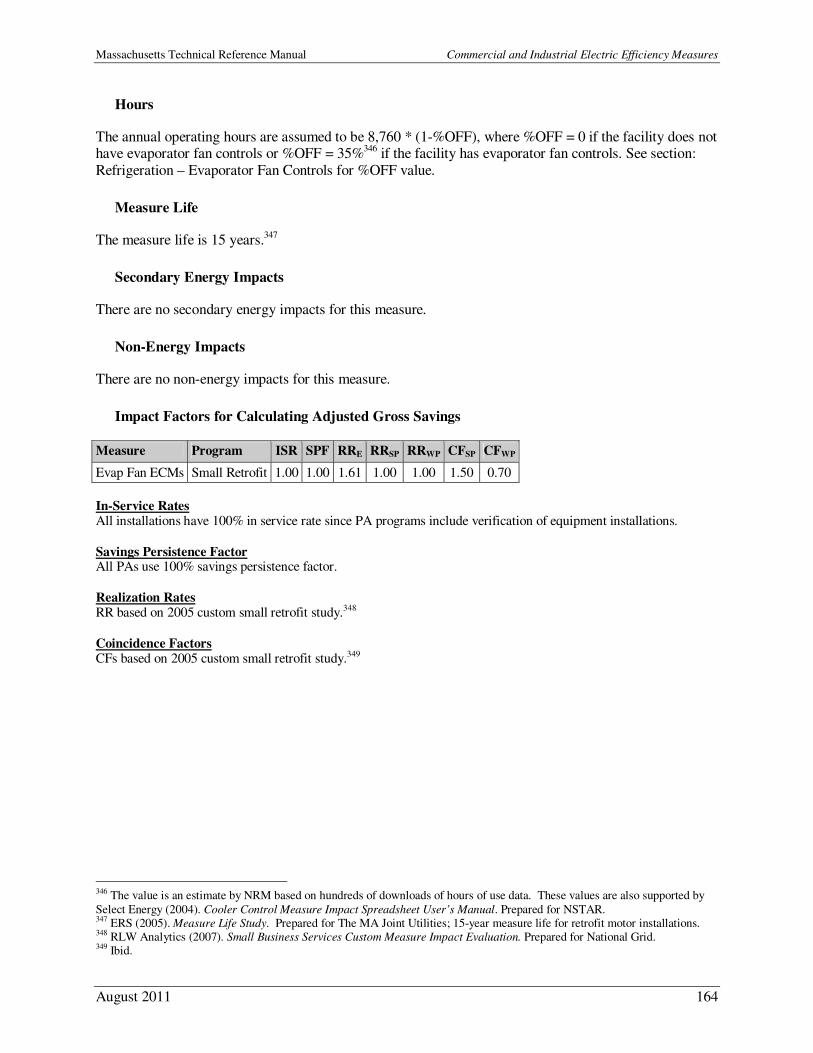
Massachusetts Technical Reference Manual Commercial and Industrial Electric Efficiency Measures
August 2011 164
Hours
The annual operating hours are assumed to be 8,760 * (1-%OFF), where %OFF = 0 if the facility does not have evaporator fan controls or %OFF = 35%346 if the facility has evaporator fan controls. See section:
Refrigeration – Evaporator Fan Controls for %OFF value.
Measure Life
The measure life is 15 years.347
Secondary Energy Impacts
There are no secondary energy impacts for this measure.
Non-Energy Impacts
There are no non-energy impacts for this measure.
Impact Factors for Calculating Adjusted Gross Savings
Measure Program ISR SPF RRE RRSP RRWP CFSP CFWP
Evap Fan ECMs Small Retrofit 1.00 1.00 1.61 1.00 1.00 1.50 0.70
In-Service Rates All installations have 100% in service rate since PA programs include verification of equipment installations.
Savings Persistence Factor All PAs use 100% savings persistence factor.
Realization Rates RR based on 2005 custom small retrofit study.348
Coincidence Factors CFs based on 2005 custom small retrofit study.349
346 The value is an estimate by NRM based on hundreds of downloads of hours of use data. These values are also supported by
Select Energy (2004). Cooler Control Measure Impact Spreadsheet User’s Manual. Prepared for NSTAR. 347 ERS (2005). Measure Life Study. Prepared for The MA Joint Utilities; 15-year measure life for retrofit motor installations. 348 RLW Analytics (2007). Small Business Services Custom Measure Impact Evaluation. Prepared for National Grid. 349 Ibid.
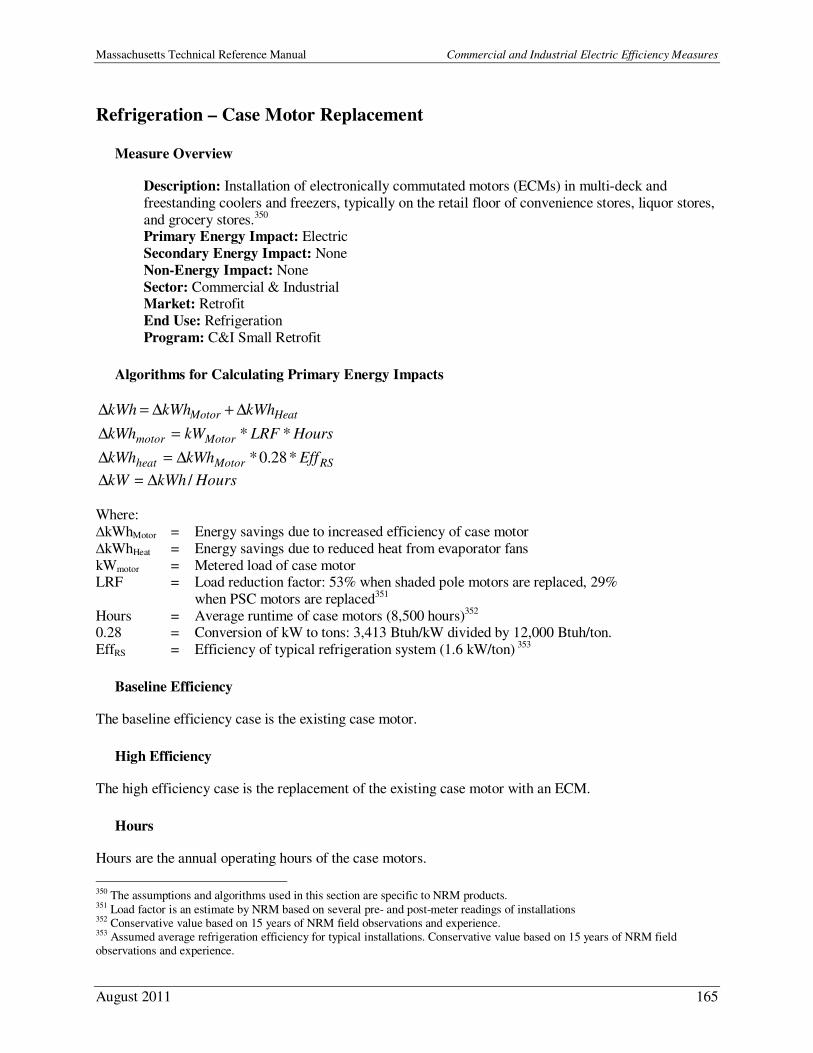
Massachusetts Technical Reference Manual Commercial and Industrial Electric Efficiency Measures
August 2011 165
Refrigeration – Case Motor Replacement
Measure Overview
Description: Installation of electronically commutated motors (ECMs) in multi-deck and
freestanding coolers and freezers, typically on the retail floor of convenience stores, liquor stores,
and grocery stores.350 Primary Energy Impact: Electric
Secondary Energy Impact: None
Non-Energy Impact: None
Sector: Commercial & Industrial Market: Retrofit
End Use: Refrigeration
Program: C&I Small Retrofit
Algorithms for Calculating Primary Energy Impacts
HeatMotor kWhkWhkWh ∆+∆=∆
HoursLRFkWkWh Motormotor **=∆
RSMotorheat EffkWhkWh *28.0*∆=∆
HourskWhkW /∆=∆ Where:
∆kWhMotor = Energy savings due to increased efficiency of case motor
∆kWhHeat = Energy savings due to reduced heat from evaporator fans
kWmotor = Metered load of case motor LRF = Load reduction factor: 53% when shaded pole motors are replaced, 29%
when PSC motors are replaced351
Hours = Average runtime of case motors (8,500 hours)352 0.28 = Conversion of kW to tons: 3,413 Btuh/kW divided by 12,000 Btuh/ton.
EffRS = Efficiency of typical refrigeration system (1.6 kW/ton) 353
Baseline Efficiency
The baseline efficiency case is the existing case motor.
High Efficiency
The high efficiency case is the replacement of the existing case motor with an ECM.
Hours
Hours are the annual operating hours of the case motors.
350 The assumptions and algorithms used in this section are specific to NRM products. 351 Load factor is an estimate by NRM based on several pre- and post-meter readings of installations 352 Conservative value based on 15 years of NRM field observations and experience. 353 Assumed average refrigeration efficiency for typical installations. Conservative value based on 15 years of NRM field observations and experience.
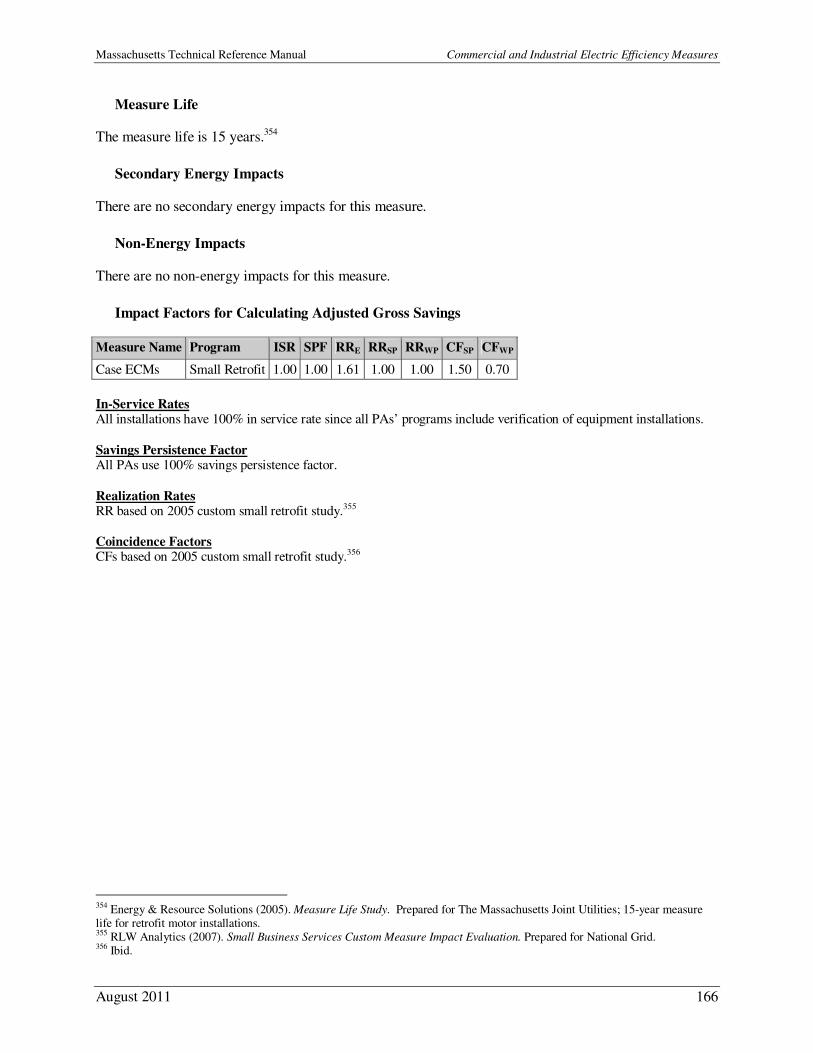
Massachusetts Technical Reference Manual Commercial and Industrial Electric Efficiency Measures
August 2011 166
Measure Life
The measure life is 15 years.354
Secondary Energy Impacts
There are no secondary energy impacts for this measure.
Non-Energy Impacts
There are no non-energy impacts for this measure.
Impact Factors for Calculating Adjusted Gross Savings
Measure Name Program ISR SPF RRE RRSP RRWP CFSP CFWP
Case ECMs Small Retrofit 1.00 1.00 1.61 1.00 1.00 1.50 0.70
In-Service Rates All installations have 100% in service rate since all PAs’ programs include verification of equipment installations.
Savings Persistence Factor All PAs use 100% savings persistence factor.
Realization Rates RR based on 2005 custom small retrofit study.355 Coincidence Factors CFs based on 2005 custom small retrofit study.356
354 Energy & Resource Solutions (2005). Measure Life Study. Prepared for The Massachusetts Joint Utilities; 15-year measure life for retrofit motor installations. 355 RLW Analytics (2007). Small Business Services Custom Measure Impact Evaluation. Prepared for National Grid. 356 Ibid.
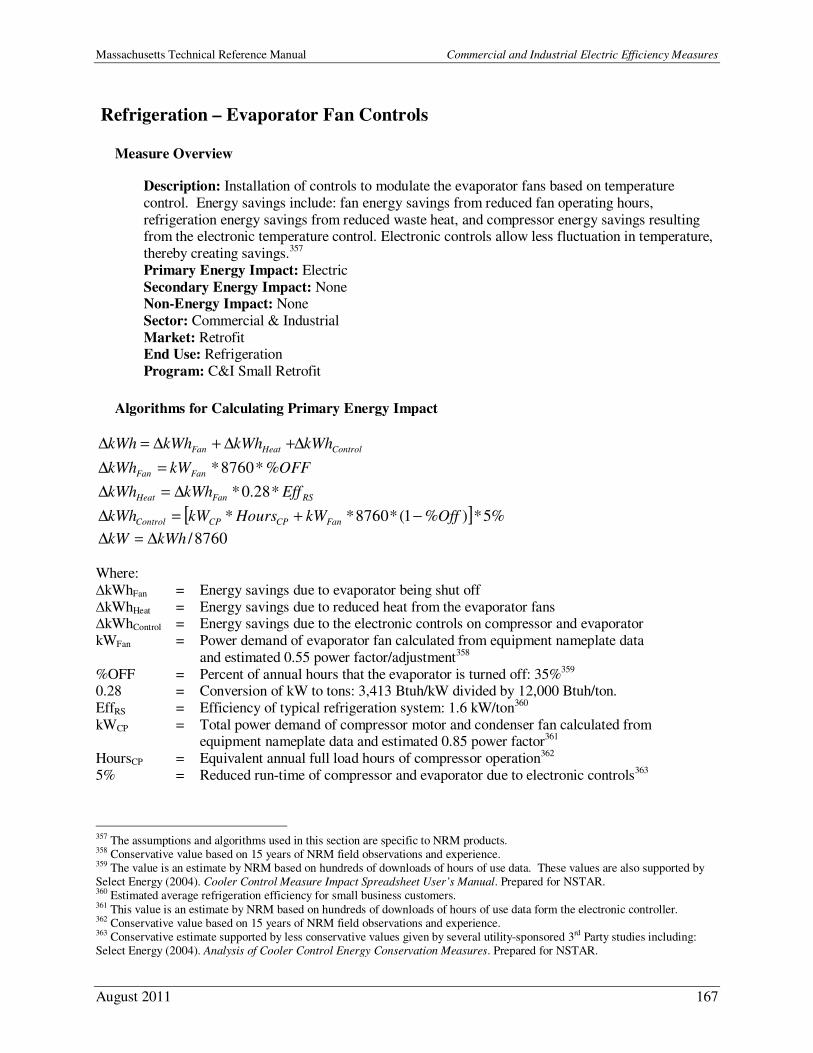
Massachusetts Technical Reference Manual Commercial and Industrial Electric Efficiency Measures
August 2011 167
Refrigeration – Evaporator Fan Controls
Measure Overview
Description: Installation of controls to modulate the evaporator fans based on temperature
control. Energy savings include: fan energy savings from reduced fan operating hours,
refrigeration energy savings from reduced waste heat, and compressor energy savings resulting from the electronic temperature control. Electronic controls allow less fluctuation in temperature,
thereby creating savings.357
Primary Energy Impact: Electric
Secondary Energy Impact: None Non-Energy Impact: None
Sector: Commercial & Industrial
Market: Retrofit End Use: Refrigeration
Program: C&I Small Retrofit
Algorithms for Calculating Primary Energy Impact
ControlHeatFan kWhkWhkWhkWh ∆+∆+∆=∆
OFFkWkWh FanFan %*8760*=∆
RSFanHeat EffkWhkWh *28.0*∆=∆
[ ] %5*)%1(*8760** OffkWHourskWkWh FanCPCPControl −+=∆
8760/kWhkW ∆=∆
Where:
∆kWhFan = Energy savings due to evaporator being shut off
∆kWhHeat = Energy savings due to reduced heat from the evaporator fans ∆kWhControl = Energy savings due to the electronic controls on compressor and evaporator
kWFan = Power demand of evaporator fan calculated from equipment nameplate data
and estimated 0.55 power factor/adjustment358
%OFF = Percent of annual hours that the evaporator is turned off: 35%359 0.28 = Conversion of kW to tons: 3,413 Btuh/kW divided by 12,000 Btuh/ton.
EffRS = Efficiency of typical refrigeration system: 1.6 kW/ton360
kWCP = Total power demand of compressor motor and condenser fan calculated from equipment nameplate data and estimated 0.85 power factor361
HoursCP = Equivalent annual full load hours of compressor operation362
5% = Reduced run-time of compressor and evaporator due to electronic controls363
357 The assumptions and algorithms used in this section are specific to NRM products. 358 Conservative value based on 15 years of NRM field observations and experience. 359 The value is an estimate by NRM based on hundreds of downloads of hours of use data. These values are also supported by Select Energy (2004). Cooler Control Measure Impact Spreadsheet User’s Manual. Prepared for NSTAR. 360 Estimated average refrigeration efficiency for small business customers. 361 This value is an estimate by NRM based on hundreds of downloads of hours of use data form the electronic controller. 362 Conservative value based on 15 years of NRM field observations and experience. 363 Conservative estimate supported by less conservative values given by several utility-sponsored 3rd Party studies including: Select Energy (2004). Analysis of Cooler Control Energy Conservation Measures. Prepared for NSTAR.
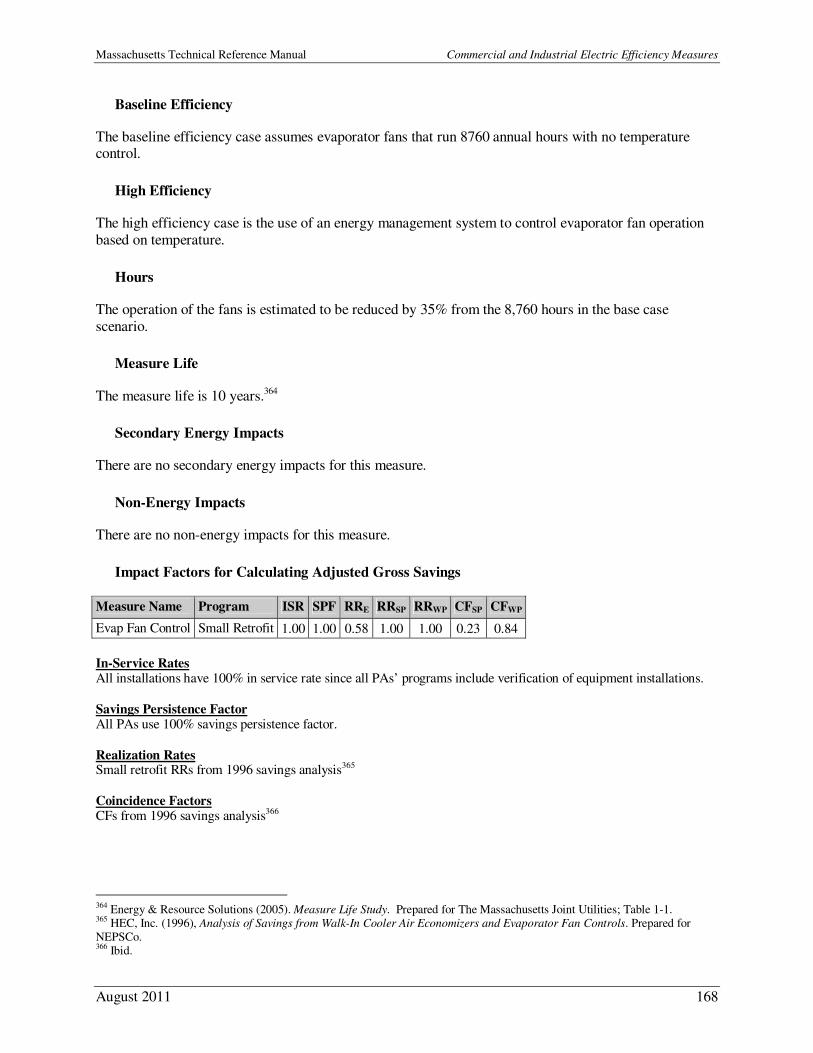
Massachusetts Technical Reference Manual Commercial and Industrial Electric Efficiency Measures
August 2011 168
Baseline Efficiency
The baseline efficiency case assumes evaporator fans that run 8760 annual hours with no temperature control.
High Efficiency
The high efficiency case is the use of an energy management system to control evaporator fan operation
based on temperature.
Hours
The operation of the fans is estimated to be reduced by 35% from the 8,760 hours in the base case
scenario.
Measure Life
The measure life is 10 years.364
Secondary Energy Impacts
There are no secondary energy impacts for this measure.
Non-Energy Impacts
There are no non-energy impacts for this measure.
Impact Factors for Calculating Adjusted Gross Savings
Measure Name Program ISR SPF RRE RRSP RRWP CFSP CFWP
Evap Fan Control Small Retrofit 1.00 1.00 0.58 1.00 1.00 0.23 0.84
In-Service Rates All installations have 100% in service rate since all PAs’ programs include verification of equipment installations.
Savings Persistence Factor All PAs use 100% savings persistence factor.
Realization Rates Small retrofit RRs from 1996 savings analysis365
Coincidence Factors CFs from 1996 savings analysis366
364 Energy & Resource Solutions (2005). Measure Life Study. Prepared for The Massachusetts Joint Utilities; Table 1-1. 365 HEC, Inc. (1996), Analysis of Savings from Walk-In Cooler Air Economizers and Evaporator Fan Controls. Prepared for NEPSCo. 366 Ibid.
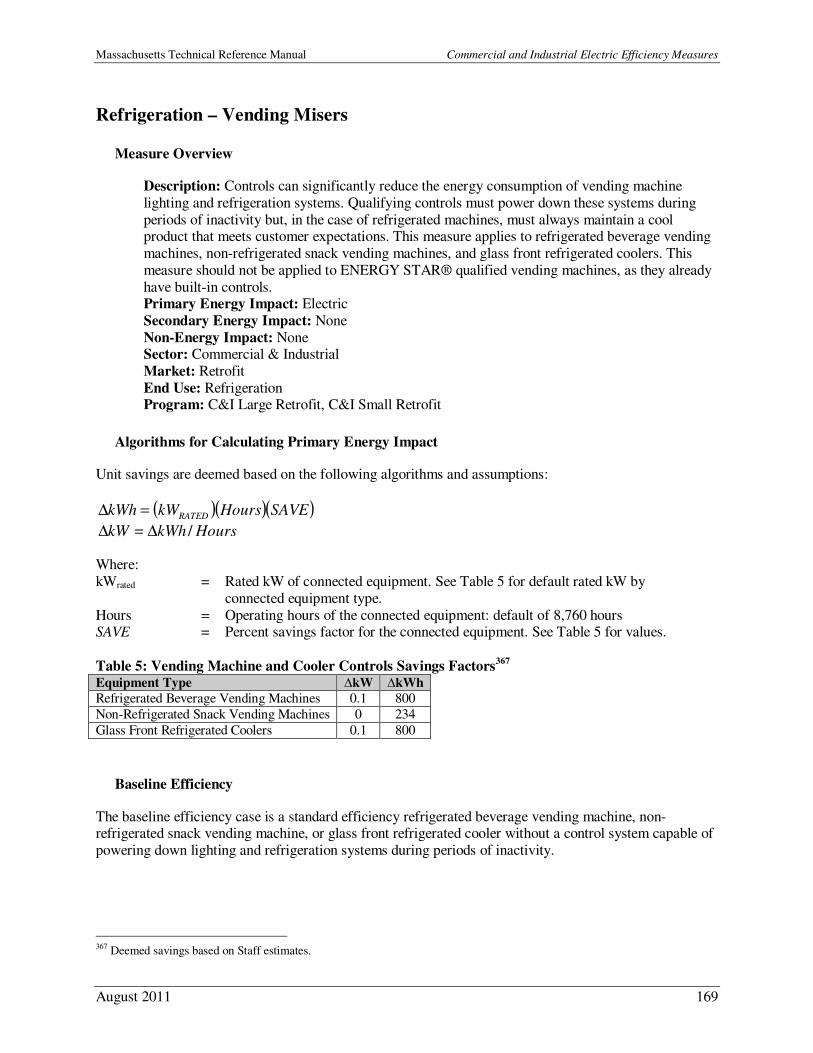
Massachusetts Technical Reference Manual Commercial and Industrial Electric Efficiency Measures
August 2011 169
Refrigeration – Vending Misers
Measure Overview
Description: Controls can significantly reduce the energy consumption of vending machine
lighting and refrigeration systems. Qualifying controls must power down these systems during
periods of inactivity but, in the case of refrigerated machines, must always maintain a cool product that meets customer expectations. This measure applies to refrigerated beverage vending
machines, non-refrigerated snack vending machines, and glass front refrigerated coolers. This
measure should not be applied to ENERGY STAR® qualified vending machines, as they already
have built-in controls. Primary Energy Impact: Electric
Secondary Energy Impact: None
Non-Energy Impact: None Sector: Commercial & Industrial
Market: Retrofit
End Use: Refrigeration Program: C&I Large Retrofit, C&I Small Retrofit
Algorithms for Calculating Primary Energy Impact
Unit savings are deemed based on the following algorithms and assumptions:
( )( )( )SAVEHourskWkWh RATED=∆
HourskWhkW /∆=∆
Where:
kWrated = Rated kW of connected equipment. See Table 5 for default rated kW by
connected equipment type.
Hours = Operating hours of the connected equipment: default of 8,760 hours SAVE = Percent savings factor for the connected equipment. See Table 5 for values.
Table 5: Vending Machine and Cooler Controls Savings Factors367
Baseline Efficiency
The baseline efficiency case is a standard efficiency refrigerated beverage vending machine, non-refrigerated snack vending machine, or glass front refrigerated cooler without a control system capable of
powering down lighting and refrigeration systems during periods of inactivity.
367 Deemed savings based on Staff estimates.
Equipment Type ∆kW ∆kWh
Refrigerated Beverage Vending Machines 0.1 800
Non-Refrigerated Snack Vending Machines 0 234
Glass Front Refrigerated Coolers 0.1 800
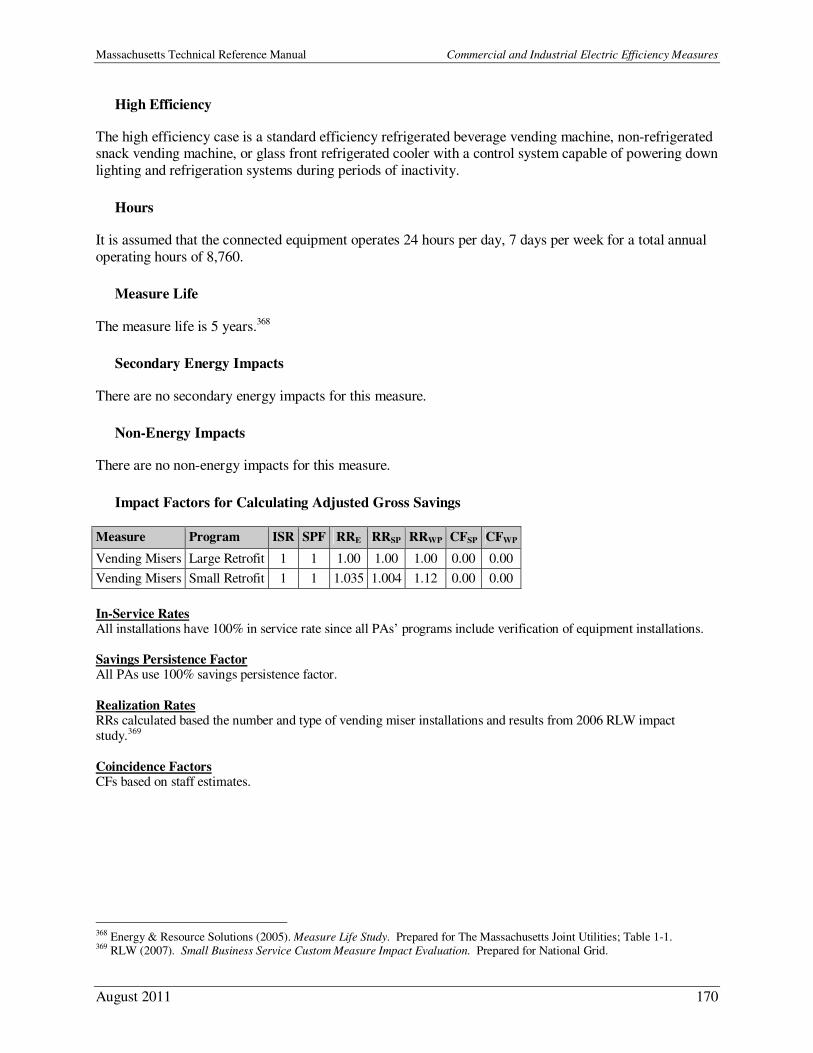
Massachusetts Technical Reference Manual Commercial and Industrial Electric Efficiency Measures
August 2011 170
High Efficiency
The high efficiency case is a standard efficiency refrigerated beverage vending machine, non-refrigerated snack vending machine, or glass front refrigerated cooler with a control system capable of powering down
lighting and refrigeration systems during periods of inactivity.
Hours
It is assumed that the connected equipment operates 24 hours per day, 7 days per week for a total annual
operating hours of 8,760.
Measure Life
The measure life is 5 years.368
Secondary Energy Impacts
There are no secondary energy impacts for this measure.
Non-Energy Impacts
There are no non-energy impacts for this measure.
Impact Factors for Calculating Adjusted Gross Savings
Measure Program ISR SPF RRE RRSP RRWP CFSP CFWP
Vending Misers Large Retrofit 1 1 1.00 1.00 1.00 0.00 0.00
Vending Misers Small Retrofit 1 1 1.035 1.004 1.12 0.00 0.00
In-Service Rates All installations have 100% in service rate since all PAs’ programs include verification of equipment installations. Savings Persistence Factor All PAs use 100% savings persistence factor.
Realization Rates RRs calculated based the number and type of vending miser installations and results from 2006 RLW impact study.369
Coincidence Factors CFs based on staff estimates.
368 Energy & Resource Solutions (2005). Measure Life Study. Prepared for The Massachusetts Joint Utilities; Table 1-1. 369 RLW (2007). Small Business Service Custom Measure Impact Evaluation. Prepared for National Grid.
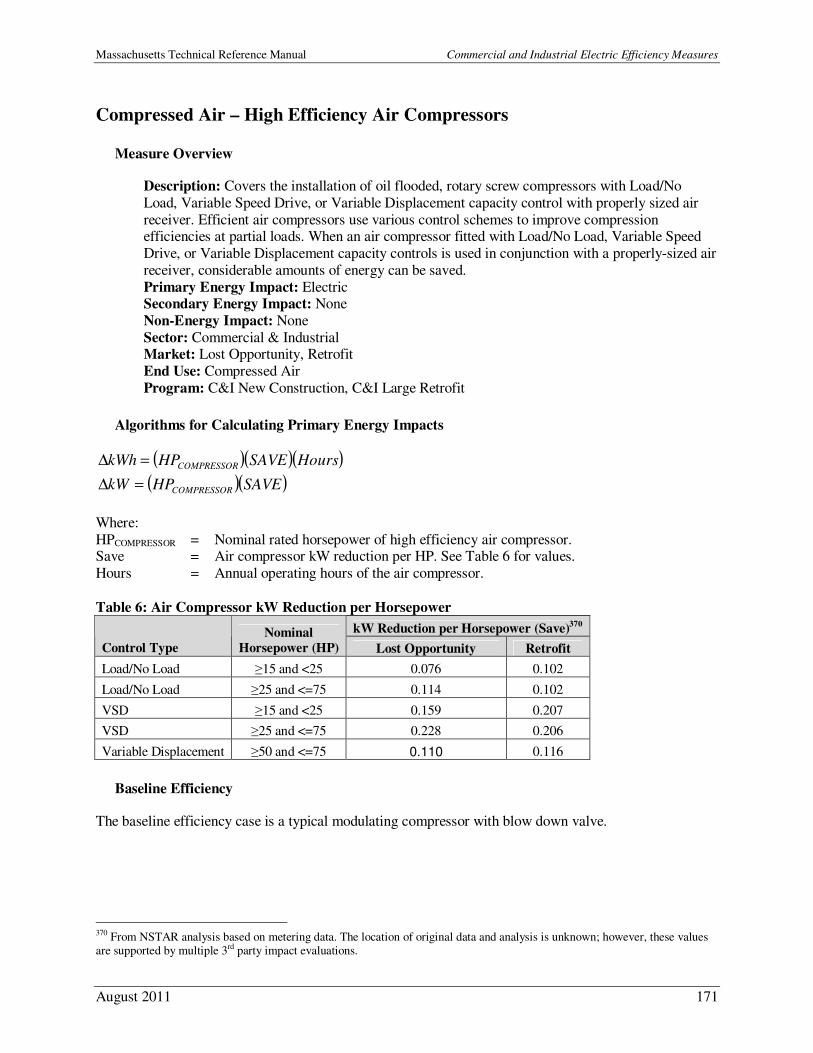
Massachusetts Technical Reference Manual Commercial and Industrial Electric Efficiency Measures
August 2011 171
Compressed Air – High Efficiency Air Compressors
Measure Overview
Description: Covers the installation of oil flooded, rotary screw compressors with Load/No
Load, Variable Speed Drive, or Variable Displacement capacity control with properly sized air
receiver. Efficient air compressors use various control schemes to improve compression efficiencies at partial loads. When an air compressor fitted with Load/No Load, Variable Speed
Drive, or Variable Displacement capacity controls is used in conjunction with a properly-sized air
receiver, considerable amounts of energy can be saved.
Primary Energy Impact: Electric Secondary Energy Impact: None
Non-Energy Impact: None
Sector: Commercial & Industrial Market: Lost Opportunity, Retrofit
End Use: Compressed Air
Program: C&I New Construction, C&I Large Retrofit
Algorithms for Calculating Primary Energy Impacts
( )( )( )HoursSAVEHPkWh COMPRESSOR=∆
( )( )SAVEHPkW COMPRESSOR=∆
Where:
HPCOMPRESSOR = Nominal rated horsepower of high efficiency air compressor. Save = Air compressor kW reduction per HP. See Table 6 for values.
Hours = Annual operating hours of the air compressor.
Table 6: Air Compressor kW Reduction per Horsepower
kW Reduction per Horsepower (Save)370
Control Type
Nominal
Horsepower (HP) Lost Opportunity Retrofit
Load/No Load ≥15 and <25 0.076 0.102
Load/No Load ≥25 and <=75 0.114 0.102
VSD ≥15 and <25 0.159 0.207
VSD ≥25 and <=75 0.228 0.206
Variable Displacement ≥50 and <=75 0.110 0.116
Baseline Efficiency
The baseline efficiency case is a typical modulating compressor with blow down valve.
370 From NSTAR analysis based on metering data. The location of original data and analysis is unknown; however, these values are supported by multiple 3rd party impact evaluations.
Massachusetts Technical Reference Manual Commercial and Industrial Electric Efficiency Measures
August 2011 172
High Efficiency
The high efficient case is an oil-flooded, rotary screw compressor with Load/No Load, Variable Speed Drive, or Variable Displacement capacity control with a properly sized air receiver. Air receivers are
designed to provide a supply buffer to meet short-term demand spikes which can exceed the compressor
capacity. Installing a larger receiver tank to meet occasional peak demands can allow for the use of a
smaller compressor.
Hours
The annual hours of operation for air compressors are site-specific and should be determined on a case-
by-case basis.
Measure Life
For lost-opportunity installations, the lifetime for this measure is 15 years. For retrofit projects, the
lifetime is 13 years.371
Secondary Energy Impacts
There are no secondary energy impacts for this measure.
Non-Energy Impacts
There are no non-energy impacts for this measure.
Impact Factors for Calculating Adjusted Gross Savings
Measure Name Program ISR SPF RRE RRSP RRWP CFSP CFWP
Air Compressor NC, Large Retrofit 1.00 1.00 1.00 1.00 1.00 0.80 0.54
In-Service Rates All installations have 100% in service rate since PA programs include verification of equipment installations.
Savings Persistence Factor All PAs use 100% savings persistence factor.
Realization Rates RRs based on impact evaluation of PY 2004 compressed air installations.372
Coincidence Factors CFs based on impact evaluation of PY 2004 compressed air installations.373
371 Energy & Resource Solutions (2005). Measure Life Study. Prepared for The Massachusetts Joint Utilities; Table 1-1. 372 Ibid. 373 Demand Management Institute (2006). Impact Evaluation of 2004 Compressed Air Prescriptive Rebates. Prepared for National Grid. Results analyzed in RLW Analytics (2006). Sample Design and Impact Evaluation Analysis for Prescriptive
Compressed Air Measures in the Energy Initiative and Design 2000 Programs. Prepared for National Grid.
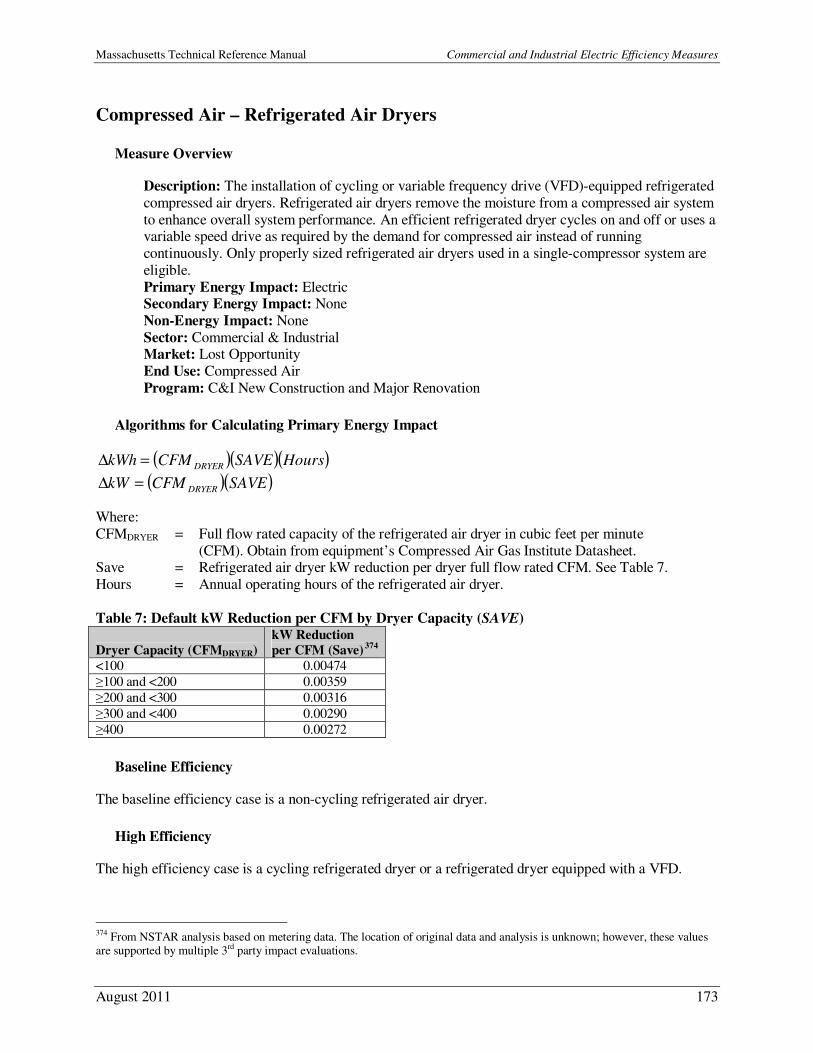
Massachusetts Technical Reference Manual Commercial and Industrial Electric Efficiency Measures
August 2011 173
Compressed Air – Refrigerated Air Dryers
Measure Overview
Description: The installation of cycling or variable frequency drive (VFD)-equipped refrigerated
compressed air dryers. Refrigerated air dryers remove the moisture from a compressed air system
to enhance overall system performance. An efficient refrigerated dryer cycles on and off or uses a variable speed drive as required by the demand for compressed air instead of running
continuously. Only properly sized refrigerated air dryers used in a single-compressor system are
eligible.
Primary Energy Impact: Electric Secondary Energy Impact: None
Non-Energy Impact: None
Sector: Commercial & Industrial Market: Lost Opportunity
End Use: Compressed Air
Program: C&I New Construction and Major Renovation
Algorithms for Calculating Primary Energy Impact
( )( )( )HoursSAVECFMkWh DRYER=∆
( )( )SAVECFMkW DRYER=∆
Where:
CFMDRYER = Full flow rated capacity of the refrigerated air dryer in cubic feet per minute
(CFM). Obtain from equipment’s Compressed Air Gas Institute Datasheet. Save = Refrigerated air dryer kW reduction per dryer full flow rated CFM. See Table 7.
Hours = Annual operating hours of the refrigerated air dryer.
Table 7: Default kW Reduction per CFM by Dryer Capacity (SAVE)
Dryer Capacity (CFMDRYER)
kW Reduction
per CFM (Save) 374
<100 0.00474
≥100 and <200 0.00359
≥200 and <300 0.00316
≥300 and <400 0.00290
≥400 0.00272
Baseline Efficiency
The baseline efficiency case is a non-cycling refrigerated air dryer.
High Efficiency
The high efficiency case is a cycling refrigerated dryer or a refrigerated dryer equipped with a VFD.
374 From NSTAR analysis based on metering data. The location of original data and analysis is unknown; however, these values are supported by multiple 3rd party impact evaluations.
Massachusetts Technical Reference Manual Commercial and Industrial Electric Efficiency Measures
August 2011 174
Hours
The annual hours of operation for compressed air dryers are site-specific.
Measure Life
The measure life is 15 years.375
Secondary Energy Impacts
There are no secondary energy impacts for this measure.
Non-Energy Impacts
There are no non-energy impacts for this measure.
Impact Factors for Calculating Adjusted Gross Savings
Measure Name Program ISR SPF RRE RRSP RRWP CFSP CFWP
Refrigerated Air Dryers NC 1.00 1.00 1.00 1.00 1.00 0.80 0.54
In-Service Rates All installations have 100% in service rate since PA programs include verification of equipment installations.
Savings Persistence Factor All PAs use 100% savings persistence factor.
Realization Rates RRs based on impact evaluation of PY 2004 compressed air installations.376
Coincidence Factors CFs based on impact evaluation of PY 2004 compressed air installations.377
375 Energy & Resource Solutions (2005). Measure Life Study. Prepared for The Massachusetts Joint Utilities; Table 1-1. 376 DMI (2006). Impact Evaluation of 2004 Compressed Air Prescriptive Rebates. Prepared for National Grid. Results analyzed in RLW Analytics (2006). Sample Design and Impact Evaluation. 377 Ibid.
Massachusetts Technical Reference Manual Commercial and Industrial Electric Efficiency Measures
August 2011 175
Motors/Drives – Premium Efficiency Motors
Measure Overview
Description: This measure promotes the purchase and installation of NEMA Premium Efficiency
motors for new construction or time-of-replacement applications. Motors covered by this
program must be new, three phase, induction motors, NEMA Design A & B, 1-200 HP, Open Drip-Proof (ODP) or Totally Enclosed Fan Cooled (TEFC), 1200, 1800, 3600 RPM and operate a
minimum of 2,000 hours per year.
Primary Energy Impact: Electric
Secondary Energy Impact: None Non-Energy Impact: None
Sector: Commercial & Industrial
Market: Lost Opportunity End Use: Motors/Drives
Program: C&I New Construction & Major Renovation
Algorithms for Calculating Energy and Demand Savings
( )( )( ) ( )HOURSLFHPkWheebase
−=∆
ηη
11746.0
( ) ( )
−=∆
eebase
LFHPkWηη
11)746.0(
Where: HP = Motor rated nameplate horsepower.
0.746 = kW per HP.
LF = Motor load factor: 0.62378 ηbase = Baseline motor efficiency. See Table 18.
ηee = Installed motor efficiency. See Table 19.
HOURS = Motor annual run hours.
Baseline Efficiency
For both lost opportunity and retrofit applications, it is assumed that the baseline efficiency meets the minimum federal manufacturing requirements as legislated by the Energy Policy Act of 1992 (EPACT
1992). The Baseline Efficiency levels are presented in Appendix A: Table 18.
High Efficiency
The high efficiency scenario assumes compliance with NEMA Premium Efficiency Motors requirements
by motor type and size. These requirements are reproduced in Appendix A: Table 19.
378 SAIC (1995). Motor Run-Time and Persistence Study Final Report. Prepared for New England Power Service Company; Exhibit 5.1.
Massachusetts Technical Reference Manual Commercial and Industrial Electric Efficiency Measures
August 2011 176
Hours
The annual hours of operation for motors are site-specific and should be determined on a case-by-case basis.
Measure Life
The measure life is 20 years.379
Secondary Energy Impacts
There are no secondary energy impacts for this measure.
Non-Energy Impacts
There are no non-energy impacts for this measure.
Impact Factors for Calculating Adjusted Gross Savings
Measure Program ISR SPF RRE RRSP RRWP CFSP CFWP
Motors NC 1.00 1.00 0.97 1.00 1.00 0.76 0.60
In-Service Rates All installations have 100% in service rate since PA programs include verification of equipment installations.
Savings Persistence Factor All PAs use 100% savings persistence factors.
Realization Rates Energy RR is the hours of use realization rate380; demand RR is set to 100% since the motor load factor is based on evaluated results.
Coincidence Factors CFs from motor run-time and persistence study381
379 Energy & Resource Solutions (2005). Measure Life Study. Prepared for The Massachusetts Joint Utilities; Table 1-1. 380 SAIC (1995). Motor Run-Time and Persistence Study Final Report. Prepared for New England Power Service Company; Exhibit 5.1. 381 Ibid.
Massachusetts Technical Reference Manual Commercial and Industrial Electric Efficiency Measures
August 2011 177
Motors/Drives – Variable Frequency Drives
Measure Overview
Description: This measure covers the installation of variable speed drives according to the terms
and conditions stated on the statewide worksheet. The measure covers multiple end use types.
The installation of this measure saves energy since the power required to rotate a pump or fan at lower speeds requires less power than when rotated at full speed.
Primary Energy Impact: Electric
Secondary Energy Impact: None
Non-Energy Impact: None Sector: Commercial & Industrial
Market: Lost Opportunity, Retrofit
End Use: Motors/Drives Program: C&I New Construction & Major Renovation, C&I Large Retrofit
Algorithms for Calculating Primary Energy Impacts
( )( )HPkWhHPkWh /=∆
( )( )HPkWHPkW /=∆
Where: kWh/HP = Annual electric energy reduction based on program and equipment type. See Table 8.
kW/HP = Electric demand reduction based on program and equipment type. See Table 8.
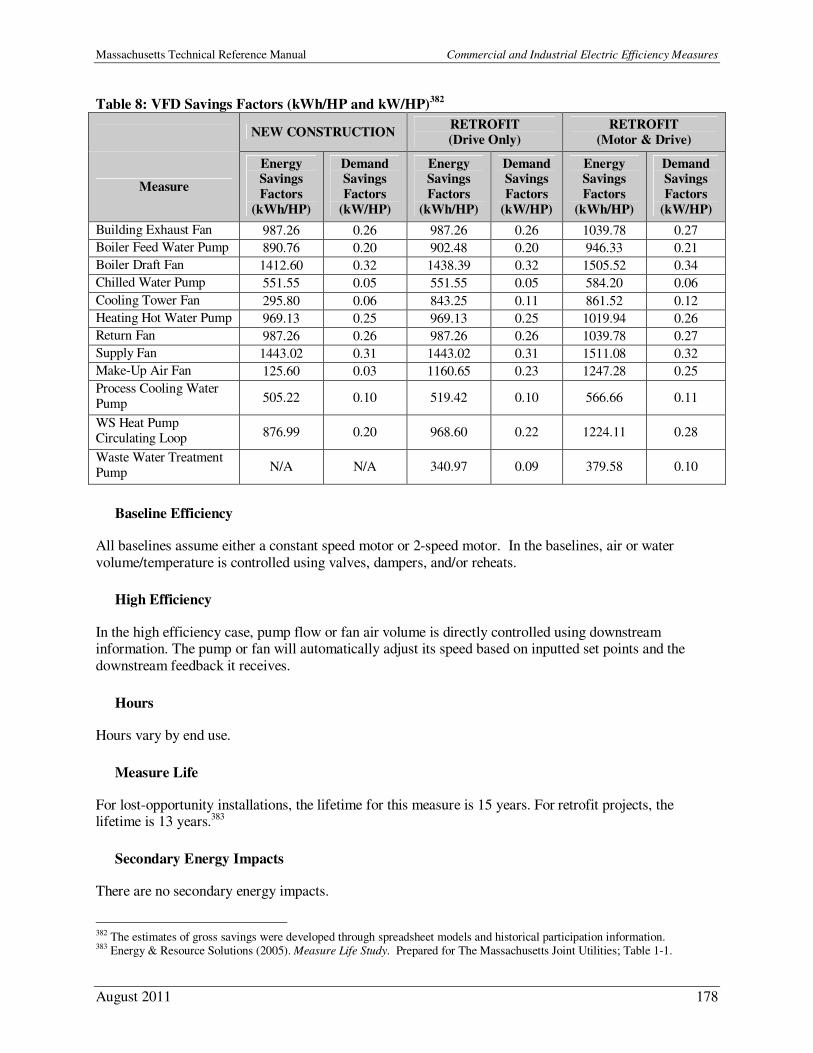
Massachusetts Technical Reference Manual Commercial and Industrial Electric Efficiency Measures
August 2011 178
Table 8: VFD Savings Factors (kWh/HP and kW/HP)382
NEW CONSTRUCTION RETROFIT
(Drive Only)
RETROFIT
(Motor & Drive)
Measure
Energy Savings
Factors
(kWh/HP)
Demand Savings
Factors
(kW/HP)
Energy Savings
Factors
(kWh/HP)
Demand Savings
Factors
(kW/HP)
Energy Savings
Factors
(kWh/HP)
Demand Savings
Factors
(kW/HP)
Building Exhaust Fan 987.26 0.26 987.26 0.26 1039.78 0.27
Boiler Feed Water Pump 890.76 0.20 902.48 0.20 946.33 0.21
Boiler Draft Fan 1412.60 0.32 1438.39 0.32 1505.52 0.34
Chilled Water Pump 551.55 0.05 551.55 0.05 584.20 0.06
Cooling Tower Fan 295.80 0.06 843.25 0.11 861.52 0.12
Heating Hot Water Pump 969.13 0.25 969.13 0.25 1019.94 0.26
Return Fan 987.26 0.26 987.26 0.26 1039.78 0.27
Supply Fan 1443.02 0.31 1443.02 0.31 1511.08 0.32
Make-Up Air Fan 125.60 0.03 1160.65 0.23 1247.28 0.25
Process Cooling Water Pump 505.22 0.10 519.42 0.10 566.66 0.11
WS Heat Pump Circulating Loop 876.99 0.20 968.60 0.22 1224.11 0.28
Waste Water Treatment Pump N/A N/A 340.97 0.09 379.58 0.10
Baseline Efficiency
All baselines assume either a constant speed motor or 2-speed motor. In the baselines, air or water
volume/temperature is controlled using valves, dampers, and/or reheats.
High Efficiency
In the high efficiency case, pump flow or fan air volume is directly controlled using downstream information. The pump or fan will automatically adjust its speed based on inputted set points and the
downstream feedback it receives.
Hours
Hours vary by end use.
Measure Life
For lost-opportunity installations, the lifetime for this measure is 15 years. For retrofit projects, the lifetime is 13 years.383
Secondary Energy Impacts
There are no secondary energy impacts.
382 The estimates of gross savings were developed through spreadsheet models and historical participation information. 383 Energy & Resource Solutions (2005). Measure Life Study. Prepared for The Massachusetts Joint Utilities; Table 1-1.
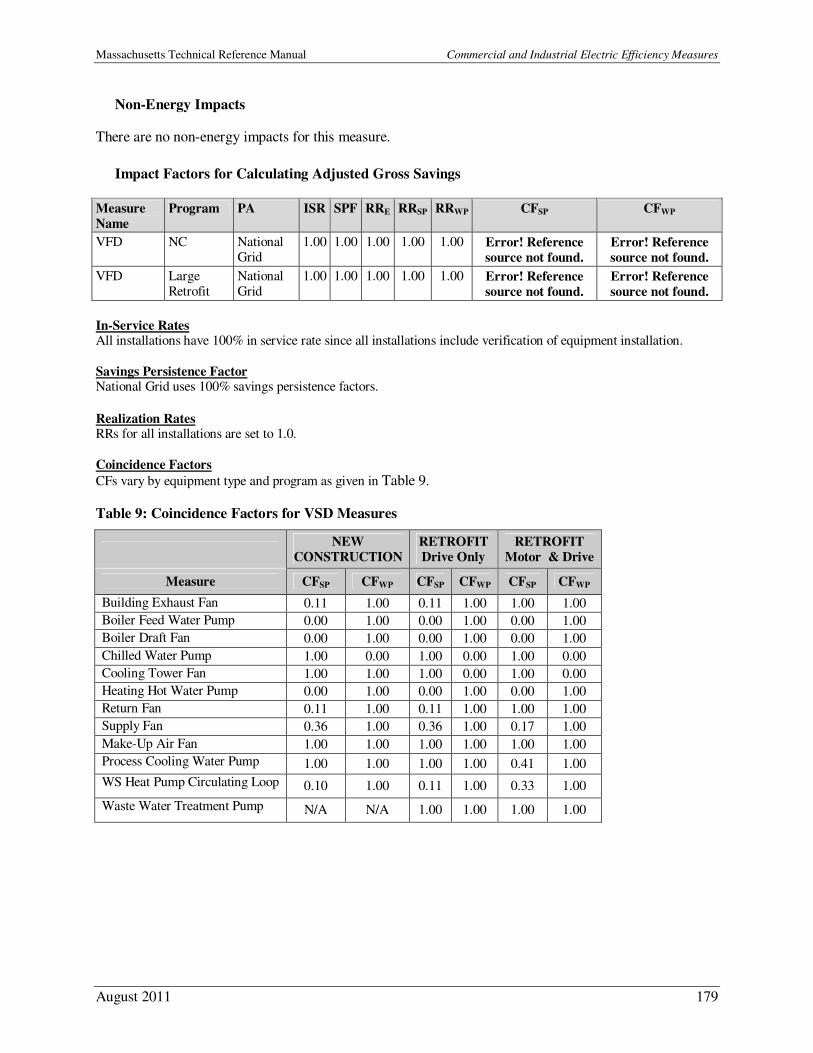
Massachusetts Technical Reference Manual Commercial and Industrial Electric Efficiency Measures
August 2011 179
Non-Energy Impacts
There are no non-energy impacts for this measure.
Impact Factors for Calculating Adjusted Gross Savings
Measure
Name
Program PA ISR SPF RRE RRSP RRWP CFSP CFWP
VFD NC National Grid
1.00 1.00 1.00 1.00 1.00 Error! Reference
source not found. Error! Reference
source not found.
VFD Large Retrofit
National Grid
1.00 1.00 1.00 1.00 1.00 Error! Reference
source not found. Error! Reference
source not found.
In-Service Rates All installations have 100% in service rate since all installations include verification of equipment installation.
Savings Persistence Factor National Grid uses 100% savings persistence factors.
Realization Rates RRs for all installations are set to 1.0.
Coincidence Factors
CFs vary by equipment type and program as given in Table 9.
Table 9: Coincidence Factors for VSD Measures
NEW
CONSTRUCTION
RETROFIT
Drive Only
RETROFIT
Motor & Drive
Measure CFSP CFWP CFSP CFWP CFSP CFWP
Building Exhaust Fan 0.11 1.00 0.11 1.00 1.00 1.00
Boiler Feed Water Pump 0.00 1.00 0.00 1.00 0.00 1.00
Boiler Draft Fan 0.00 1.00 0.00 1.00 0.00 1.00
Chilled Water Pump 1.00 0.00 1.00 0.00 1.00 0.00
Cooling Tower Fan 1.00 1.00 1.00 0.00 1.00 0.00
Heating Hot Water Pump 0.00 1.00 0.00 1.00 0.00 1.00
Return Fan 0.11 1.00 0.11 1.00 1.00 1.00
Supply Fan 0.36 1.00 0.36 1.00 0.17 1.00
Make-Up Air Fan 1.00 1.00 1.00 1.00 1.00 1.00
Process Cooling Water Pump 1.00 1.00 1.00 1.00 0.41 1.00
WS Heat Pump Circulating Loop 0.10 1.00 0.11 1.00 0.33 1.00
Waste Water Treatment Pump N/A N/A 1.00 1.00 1.00 1.00
Massachusetts Technical Reference Manual Commercial and Industrial Electric Efficiency Measures
August 2011 180
Custom Measures
Measure Overview
Description: The Custom project track is offered for energy efficiency projects involving
complex site-specific applications that require detailed engineering analysis and/or projects which
do not qualify for incentives under any of the prescriptive rebate offering. Projects offered through the custom approach must pass a cost-effectiveness test based on project-specific costs
and savings.
Primary Energy Impact: Electric
Secondary Energy Impact: Project Specific Non-Energy Impact: Project Specific
Sector: Commercial & Industrial
Market: Lost Opportunity, Retrofit End Use: All
Program: C&I New Construction & Major Renovation, C&I Large Retrofit, C&I Small Retrofit
Algorithms for Calculating Primary Energy Impact
Gross energy and demand savings estimates for custom projects are calculated using engineering analysis
with project-specific details. Custom analyses typically include a weather dependent load bin analysis, whole building energy model simulation, end-use metering or other engineering analysis and include
estimates of savings, costs, and an evaluation of the projects’ cost-effectiveness.
Baseline Efficiency
For Lost Opportunity projects, the baseline efficiency case assumes compliance with the efficiency
requirements as mandated by Massachusetts State Building Code or industry accepted standard practice. For retrofit projects, the baseline efficiency case is the same as the existing, or pre-retrofit, case for the
facility.
High Efficiency
The high efficiency scenario is specific to the custom project and may include one or more energy
efficiency measures. Energy and demand savings calculations are based on projected or measured changes in equipment efficiencies and operating characteristics and are determined on a case-by-case
basis. The project must be proven cost-effective in order to qualify for energy efficiency incentives.
Hours
All hours for custom savings analyses should be determined on a case-by-case basis.
Measure Life
For both lost-opportunity and retrofit custom applications, the measure life is determined based on
specific project using the common custom measure life recommendations.384
384 Energy & Resource Solutions (2005). Measure Life Study. Prepared for The Massachusetts Joint Utilities; Table 1-2.
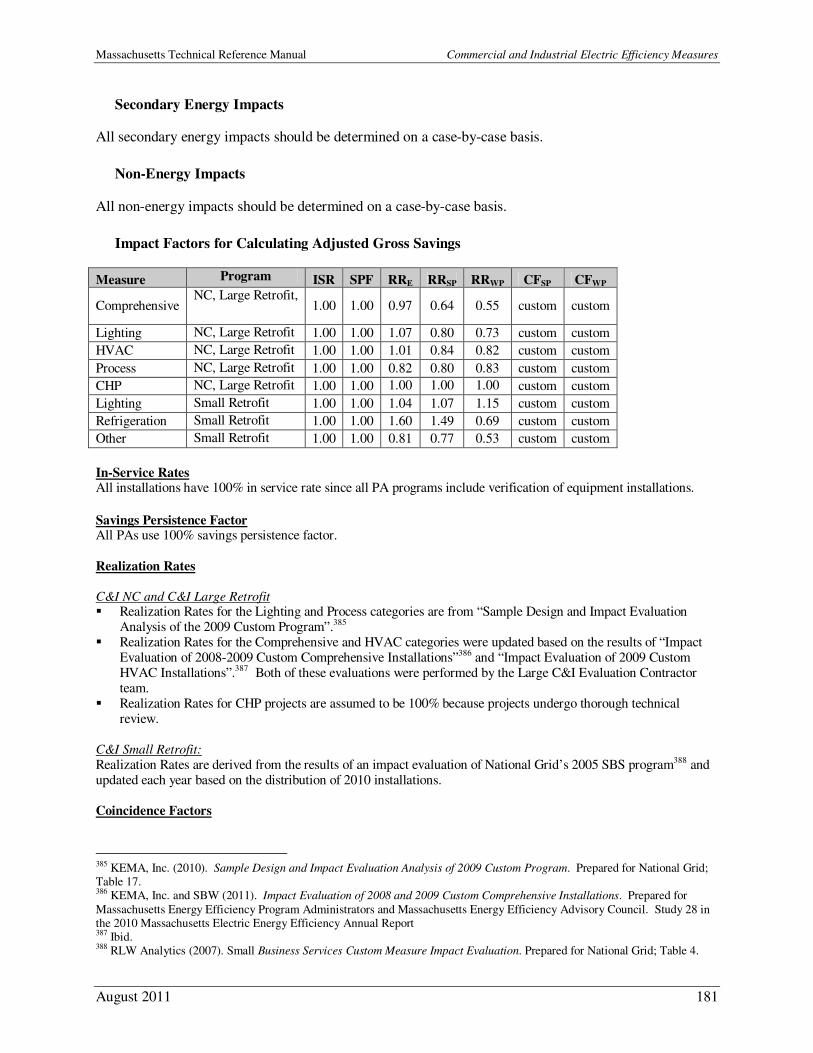
Massachusetts Technical Reference Manual Commercial and Industrial Electric Efficiency Measures
August 2011 181
Secondary Energy Impacts
All secondary energy impacts should be determined on a case-by-case basis.
Non-Energy Impacts
All non-energy impacts should be determined on a case-by-case basis.
Impact Factors for Calculating Adjusted Gross Savings
Measure Program ISR SPF RRE RRSP RRWP CFSP CFWP
Comprehensive NC, Large Retrofit, 1.00 1.00 0.97 0.64 0.55 custom custom
Lighting NC, Large Retrofit 1.00 1.00 1.07 0.80 0.73 custom custom
HVAC NC, Large Retrofit 1.00 1.00 1.01 0.84 0.82 custom custom
Process NC, Large Retrofit 1.00 1.00 0.82 0.80 0.83 custom custom
CHP NC, Large Retrofit 1.00 1.00 1.00 1.00 1.00 custom custom
Lighting Small Retrofit 1.00 1.00 1.04 1.07 1.15 custom custom
Refrigeration Small Retrofit 1.00 1.00 1.60 1.49 0.69 custom custom
Other Small Retrofit 1.00 1.00 0.81 0.77 0.53 custom custom
In-Service Rates All installations have 100% in service rate since all PA programs include verification of equipment installations. Savings Persistence Factor All PAs use 100% savings persistence factor.
Realization Rates C&I NC and C&I Large Retrofit
� Realization Rates for the Lighting and Process categories are from “Sample Design and Impact Evaluation Analysis of the 2009 Custom Program”.385
� Realization Rates for the Comprehensive and HVAC categories were updated based on the results of “Impact Evaluation of 2008-2009 Custom Comprehensive Installations”386 and “Impact Evaluation of 2009 Custom HVAC Installations”.387 Both of these evaluations were performed by the Large C&I Evaluation Contractor team.
� Realization Rates for CHP projects are assumed to be 100% because projects undergo thorough technical review.
C&I Small Retrofit:
Realization Rates are derived from the results of an impact evaluation of National Grid’s 2005 SBS program388 and updated each year based on the distribution of 2010 installations.
Coincidence Factors
385 KEMA, Inc. (2010). Sample Design and Impact Evaluation Analysis of 2009 Custom Program. Prepared for National Grid; Table 17. 386 KEMA, Inc. and SBW (2011). Impact Evaluation of 2008 and 2009 Custom Comprehensive Installations. Prepared for
Massachusetts Energy Efficiency Program Administrators and Massachusetts Energy Efficiency Advisory Council. Study 28 in the 2010 Massachusetts Electric Energy Efficiency Annual Report 387 Ibid. 388 RLW Analytics (2007). Small Business Services Custom Measure Impact Evaluation. Prepared for National Grid; Table 4.

Massachusetts Technical Reference Manual Commercial and Industrial Electric Efficiency Measures
August 2011 182
Gross summer and winter peak coincidence factors are custom-calculated for each custom project based on project-specific information. The actual or measured coincidence factors are included in the summer and winter demand realization rates.
Massachusetts Technical Reference Manual Residential Gas Efficiency Measures
August 2011 183
Residential Natural Gas Efficiency Measures
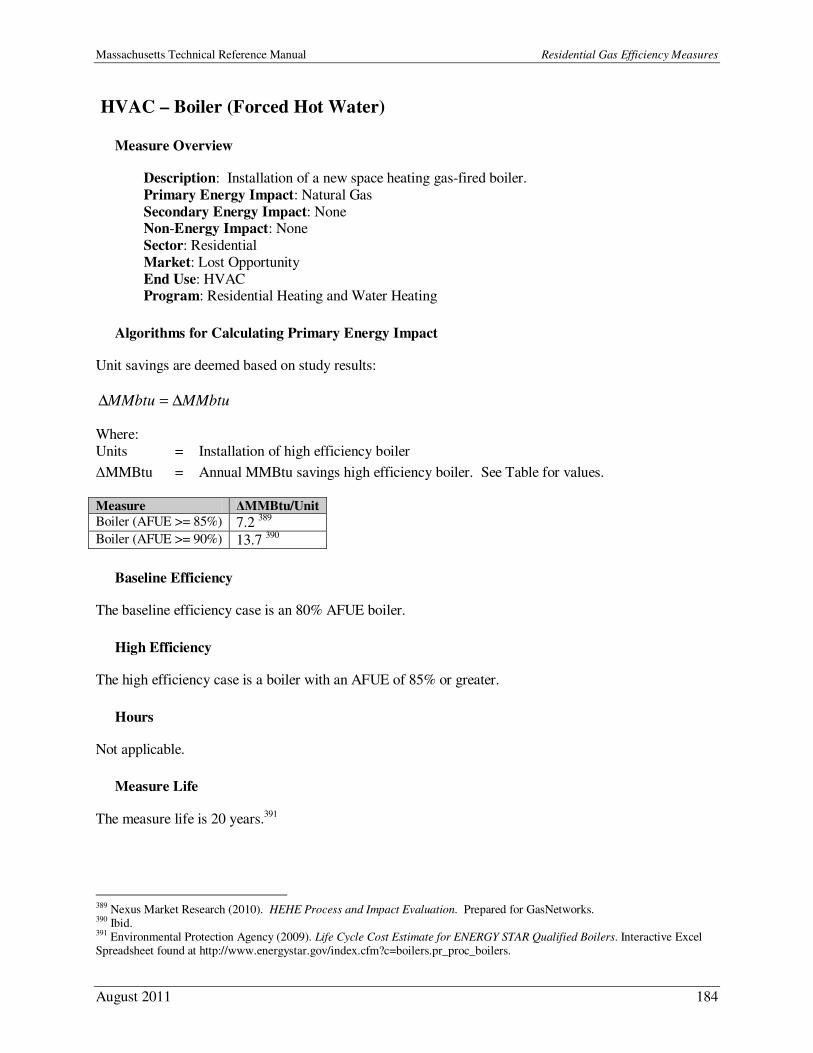
Massachusetts Technical Reference Manual Residential Gas Efficiency Measures
August 2011 184
HVAC – Boiler (Forced Hot Water)
Measure Overview
Description: Installation of a new space heating gas-fired boiler.
Primary Energy Impact: Natural Gas
Secondary Energy Impact: None Non-Energy Impact: None
Sector: Residential
Market: Lost Opportunity
End Use: HVAC Program: Residential Heating and Water Heating
Algorithms for Calculating Primary Energy Impact
Unit savings are deemed based on study results:
MMbtuMMbtu ∆=∆
Where:
Units = Installation of high efficiency boiler
∆MMBtu = Annual MMBtu savings high efficiency boiler. See Table for values. Measure ∆MMBtu/Unit
Boiler (AFUE >= 85%) 7.2 389
Boiler (AFUE >= 90%) 13.7 390
Baseline Efficiency
The baseline efficiency case is an 80% AFUE boiler.
High Efficiency
The high efficiency case is a boiler with an AFUE of 85% or greater.
Hours
Not applicable.
Measure Life
The measure life is 20 years.391
389 Nexus Market Research (2010). HEHE Process and Impact Evaluation. Prepared for GasNetworks. 390 Ibid. 391 Environmental Protection Agency (2009). Life Cycle Cost Estimate for ENERGY STAR Qualified Boilers. Interactive Excel Spreadsheet found at http://www.energystar.gov/index.cfm?c=boilers.pr_proc_boilers.
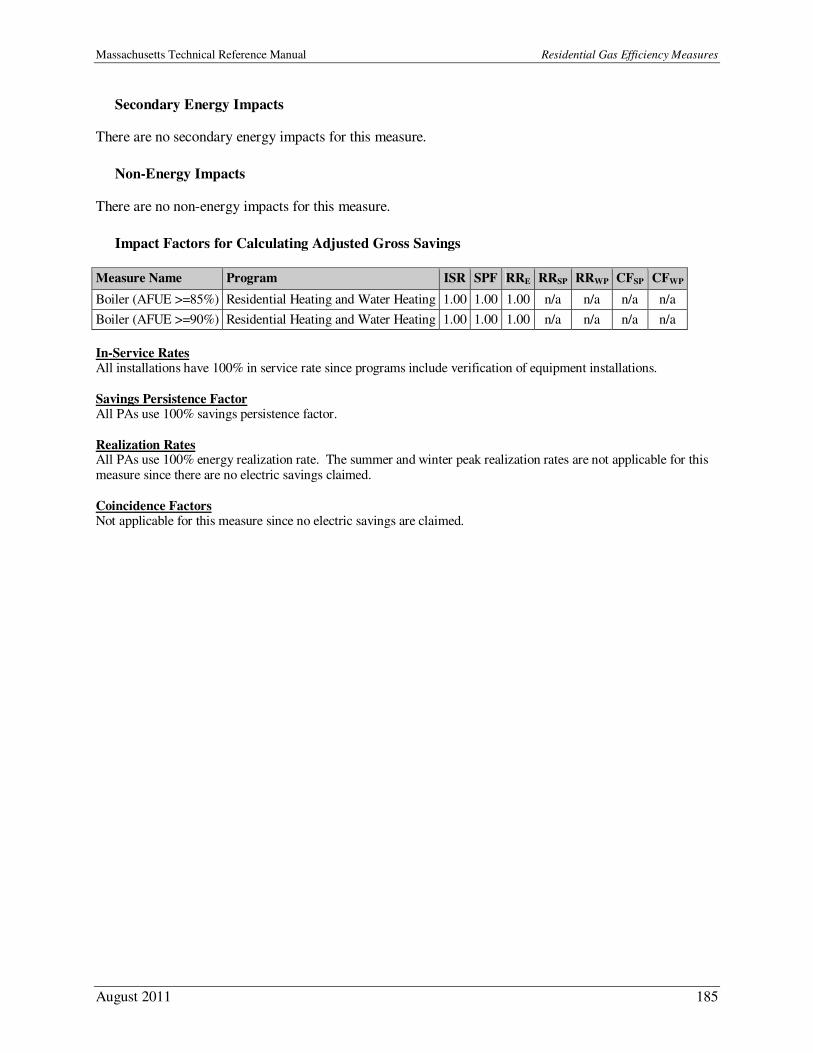
Massachusetts Technical Reference Manual Residential Gas Efficiency Measures
August 2011 185
Secondary Energy Impacts
There are no secondary energy impacts for this measure.
Non-Energy Impacts
There are no non-energy impacts for this measure.
Impact Factors for Calculating Adjusted Gross Savings
Measure Name Program ISR SPF RRE RRSP RRWP CFSP CFWP
Boiler (AFUE >=85%) Residential Heating and Water Heating 1.00 1.00 1.00 n/a n/a n/a n/a
Boiler (AFUE >=90%) Residential Heating and Water Heating 1.00 1.00 1.00 n/a n/a n/a n/a
In-Service Rates All installations have 100% in service rate since programs include verification of equipment installations.
Savings Persistence Factor All PAs use 100% savings persistence factor.
Realization Rates All PAs use 100% energy realization rate. The summer and winter peak realization rates are not applicable for this measure since there are no electric savings claimed.
Coincidence Factors Not applicable for this measure since no electric savings are claimed.
Massachusetts Technical Reference Manual Residential Gas Efficiency Measures
August 2011 186
HVAC – Boiler Reset Controls (Retrofit only)
Measure Overview
Description: Boiler Reset Controls are devices that automatically control boiler water
temperature based on outdoor temperature using a software program.
Primary Energy Impact: Natural Gas Secondary Energy Impact: None
Non-Energy Impact: None
Sector: Residential
Market: Retrofit End Use: HVAC
Program: Residential Heating and Water Heating
Algorithms for Calculating Primary Energy Impact
Unit savings are deemed based on study results:
MMbtuMMbtu ∆=∆
Where:
∆MMBtu = Annual MMBtu savings per boiler reset control installed: 7.9 MMBtu392 Units = Number of installed Boiler Reset Controls
Baseline Efficiency
The baseline efficiency case is a boiler without reset controls.
High Efficiency
The high efficiency case is a boiler with reset controls.
Hours
Not applicable.
Measure Life
The measure life is 15 years.393
Secondary Energy Impacts
There are no secondary energy impacts for this measure.
392 ACEEE (2006). Emerging Technologies Report: Advanced Boiler Controls. Prepared for ACEEE; Page 2. 393 Ibid.

Massachusetts Technical Reference Manual Residential Gas Efficiency Measures
August 2011 187
Non-Energy Impacts
There are no non-energy impacts for this measure.
Impact Factors for Calculating Adjusted Gross Savings
Measure Name Program ISR SPF RRE RRSP RRWP CFSP CFWP
Boiler Reset Controls Residential Heating and Water Heating 1.00 1.00 1.00 n/a n/a n/a n/a
In-Service Rates All installations have 100% in service rate since programs include verification of equipment installations.
Savings Persistence Factor All PAs use 100% savings persistence factor.
Realization Rates
All PAs use 100% energy realization rate. The summer and winter peak realization rates are not applicable for this
measure since there are no electric savings claimed.
Coincidence Factors Not applicable for this measure since no electric savings are claimed.
Massachusetts Technical Reference Manual Residential Gas Efficiency Measures
August 2011 188
HVAC – Early Replacement Boiler
Measure Overview
Description: Early retirement of inefficient gas-fired boiler and installation of new high
efficiency gas-fired boiler.
Primary Energy Impact: Natural Gas Secondary Energy Impact: None
Non-Energy Impact: None
Sector: Residential
Market: Retrofit End Use: HVAC
Program: Residential Heating and Water Heating
Algorithms for Calculating Primary Energy Impact
Unit savings are deemed based on study results and include two parts: (1) energy savings over the
remaining lifetime of the existing boiler and (2) energy savings over the full life of the new high efficiency boiler:
EERETIRE MMbtuMMbtuMMbtu ∆+∆=∆
Where:
Unit = Removal of existing inefficient boiler and installation of new high efficiency boiler
∆MMBtuRETIRE = Annual MMBtu savings of new code-compliant boiler compared to existing boiler: 9.0 MMBtu394
∆MMBtuEE = Annual MMBtu savings of high efficiency boiler compared to new code-compliant
boiler: 15.0 MMBtu395
Baseline Efficiency
For the retirement savings over the remaining life of existing boiler, the baseline is the existing inefficient boiler. For the high efficiency unit savings over lifetime of the new boiler, the baseline is a code-
compliant boiler (AFUE = 80%).
High Efficiency
For the retirement savings over the remaining life of existing boiler, the efficient case is a code-compliant
boiler (AFUE = 80%). For the high efficiency savings over lifetime of the new boiler, the efficient case is a new high efficiency (AFUE >= 85%).
Hours
Not applicable.
394 GDS Associates, Inc. (2009). Natural Gas Energy Efficiency Potential in Massachusetts. Prepared for GasNetworks. 395 Ibid.
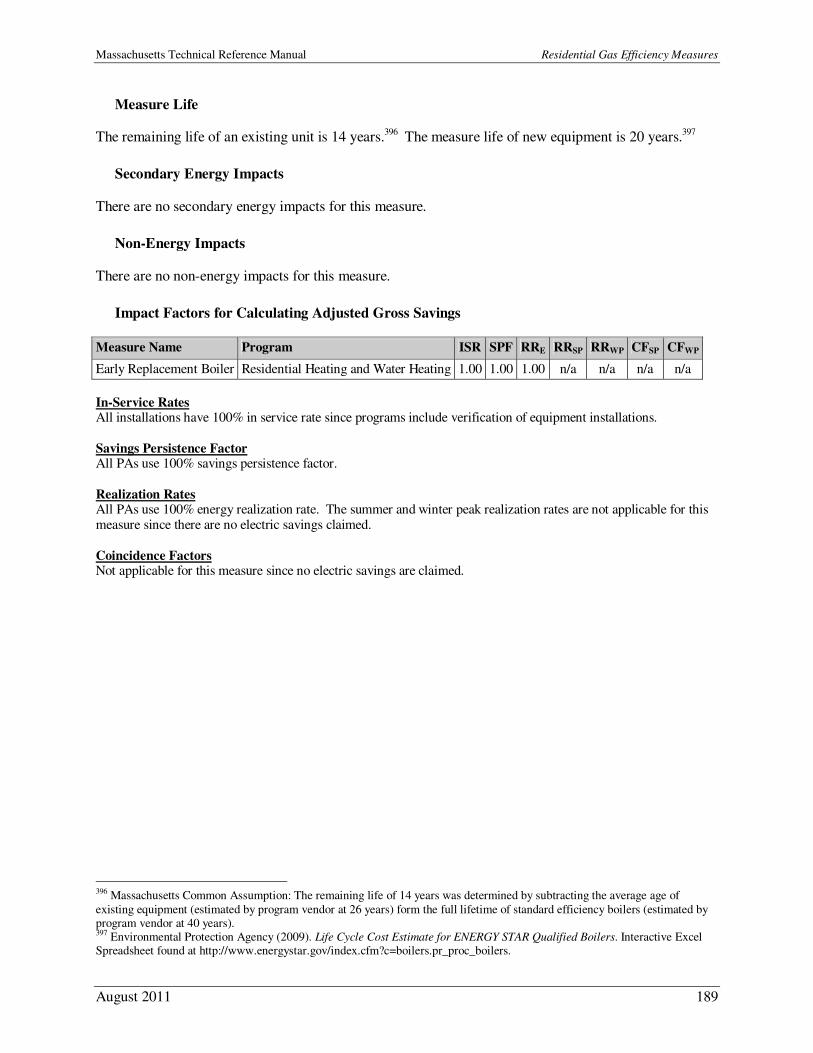
Massachusetts Technical Reference Manual Residential Gas Efficiency Measures
August 2011 189
Measure Life
The remaining life of an existing unit is 14 years.396 The measure life of new equipment is 20 years.397
Secondary Energy Impacts
There are no secondary energy impacts for this measure.
Non-Energy Impacts
There are no non-energy impacts for this measure.
Impact Factors for Calculating Adjusted Gross Savings
Measure Name Program ISR SPF RRE RRSP RRWP CFSP CFWP
Early Replacement Boiler Residential Heating and Water Heating 1.00 1.00 1.00 n/a n/a n/a n/a
In-Service Rates All installations have 100% in service rate since programs include verification of equipment installations.
Savings Persistence Factor All PAs use 100% savings persistence factor.
Realization Rates All PAs use 100% energy realization rate. The summer and winter peak realization rates are not applicable for this measure since there are no electric savings claimed.
Coincidence Factors Not applicable for this measure since no electric savings are claimed.
396 Massachusetts Common Assumption: The remaining life of 14 years was determined by subtracting the average age of
existing equipment (estimated by program vendor at 26 years) form the full lifetime of standard efficiency boilers (estimated by program vendor at 40 years). 397 Environmental Protection Agency (2009). Life Cycle Cost Estimate for ENERGY STAR Qualified Boilers. Interactive Excel Spreadsheet found at http://www.energystar.gov/index.cfm?c=boilers.pr_proc_boilers.
Massachusetts Technical Reference Manual Residential Gas Efficiency Measures
August 2011 190
HVAC – Programmable Thermostats
Measure Overview
Description: Installation of ENERGY STAR® labeled or 7-day programmable thermostats,
which give the ability to adjust heating or air-conditioning operating times according to a pre-set
schedule. Primary Energy Impact: Natural Gas
Secondary Energy Impact: None
Non-Energy Impact: None
Sector: Residential Market: Retrofit
End Use: HVAC
Program: Residential Heating and Water Heating
Algorithms for Calculating Primary Energy Impact
Unit savings are deemed based on study results:
MMbtuMMbtu ∆=∆
Where: Units = Number of Programmable T-stats installed
∆MMBtu = Annual MMBtu savings per programmable thermostat installed: 7.7 MMBtu398
Baseline Efficiency
The baseline efficiency case is an HVAC system using natural gas to provide space heating without a
programmable thermostat.
High Efficiency
The high efficiency case is an HVAC system that has an ENERGY STAR® or 7-day programmable thermostat installed.
Hours
Not applicable.
Measure Life
The measure life is 15 years.399
398 RLW Analytics (2007). Validating the Impacts of Programmable Thermostats. Prepared for GasNetworks; Page 2,
conversion factor CCF to Therms is 1.024. 399 Environmental Protection Agency (2010). Life Cycle Cost Estimate for ENERGY STAR Programmable Thermostat. Interactive Excel Spreadsheet found at www.energystar.gov/ia/business/bulk_purchasing/bpsavings_calc/CalculatorProgrammableThermostat.xls.
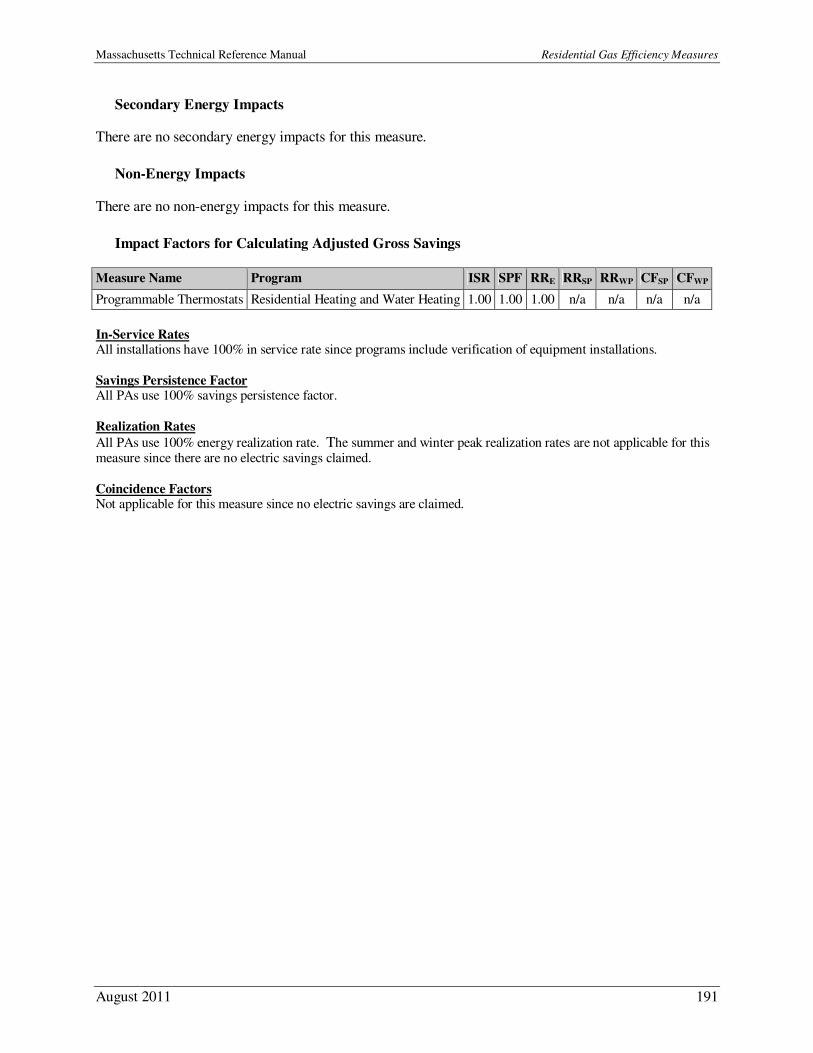
Massachusetts Technical Reference Manual Residential Gas Efficiency Measures
August 2011 191
Secondary Energy Impacts
There are no secondary energy impacts for this measure.
Non-Energy Impacts
There are no non-energy impacts for this measure.
Impact Factors for Calculating Adjusted Gross Savings
Measure Name Program ISR SPF RRE RRSP RRWP CFSP CFWP
Programmable Thermostats Residential Heating and Water Heating 1.00 1.00 1.00 n/a n/a n/a n/a
In-Service Rates All installations have 100% in service rate since programs include verification of equipment installations.
Savings Persistence Factor All PAs use 100% savings persistence factor.
Realization Rates
All PAs use 100% energy realization rate. The summer and winter peak realization rates are not applicable for this measure since there are no electric savings claimed.
Coincidence Factors Not applicable for this measure since no electric savings are claimed.
Massachusetts Technical Reference Manual Residential Gas Efficiency Measures
August 2011 192
HVAC – Furnace (Forced Hot Air) with ECM
Measure Overview
Description: Installation of a new high efficiency space heating gas-fired furnace with an
electronically commutated motor (ECM) for the fan.
Primary Energy Impact: Natural Gas Secondary Energy Impact: Electric
Non-Energy Impact: None
Sector: Residential
Market: Lost Opportunity End Use: HVAC
Program: Residential Heating and Water Heating
Algorithms for Calculating Primary Energy Impact
Unit savings are deemed based on study results:
MMbtuMMbtu ∆=∆
Where:
Units = Installation of furnace with ECM ∆MMBtu = Annual MMBtu savings for a furnace with ECM. See Table for values.
Measure ∆MMBtu
Furnace (AFUE = 92%) 11.8 400 Furnace w/ECM (AFUE = 92%) 19.6 401 Furnace w/ECM (AFUE = 94%) 23.6 402
Baseline Efficiency
The baseline efficiency case is a 78% AFUE furnace.
High Efficiency
The high efficiency case is a new furnace with AFUE >= 92%.
Hours
Not applicable.
Measure Life
The measure life is 18 years.403
400 Nexus Market Research (2010). HEHE Process and Impact Evaluation. Prepared for GasNetworks. 401 Ibid. 402 Ibid.
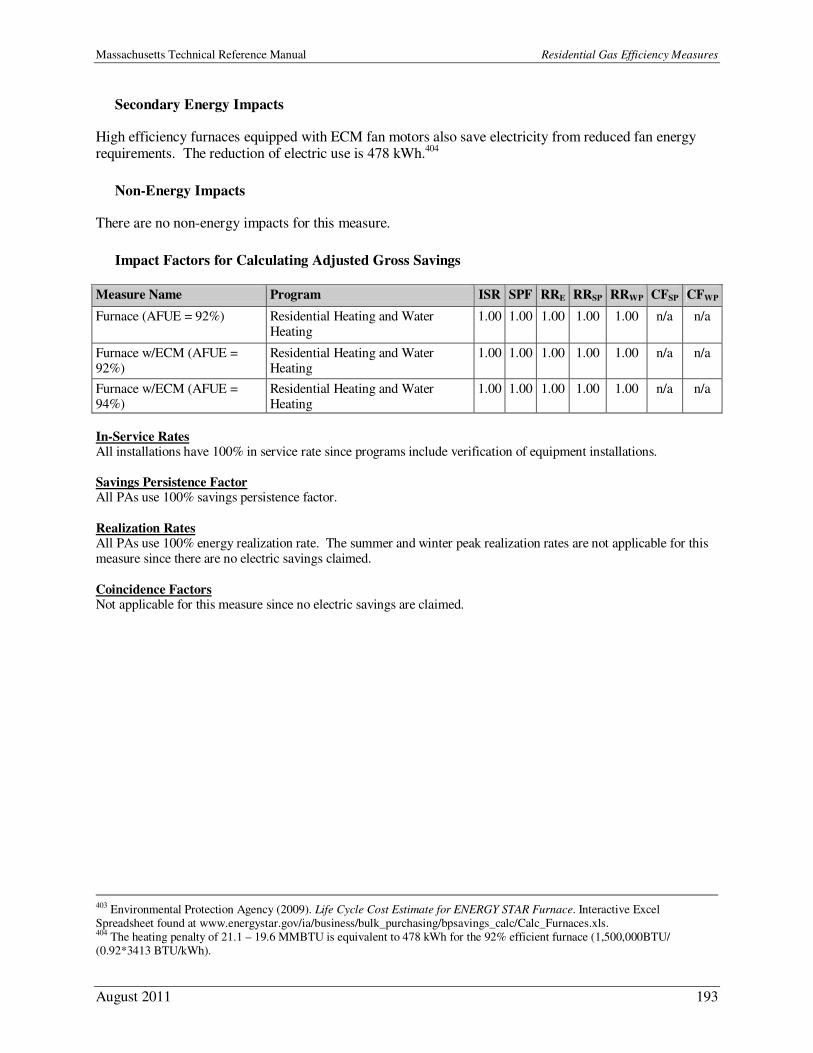
Massachusetts Technical Reference Manual Residential Gas Efficiency Measures
August 2011 193
Secondary Energy Impacts
High efficiency furnaces equipped with ECM fan motors also save electricity from reduced fan energy requirements. The reduction of electric use is 478 kWh.404
Non-Energy Impacts
There are no non-energy impacts for this measure.
Impact Factors for Calculating Adjusted Gross Savings
Measure Name Program ISR SPF RRE RRSP RRWP CFSP CFWP
Furnace (AFUE = 92%) Residential Heating and Water Heating
1.00 1.00 1.00 1.00 1.00 n/a n/a
Furnace w/ECM (AFUE = 92%)
Residential Heating and Water Heating
1.00 1.00 1.00 1.00 1.00 n/a n/a
Furnace w/ECM (AFUE = 94%)
Residential Heating and Water Heating
1.00 1.00 1.00 1.00 1.00 n/a n/a
In-Service Rates All installations have 100% in service rate since programs include verification of equipment installations. Savings Persistence Factor All PAs use 100% savings persistence factor.
Realization Rates All PAs use 100% energy realization rate. The summer and winter peak realization rates are not applicable for this measure since there are no electric savings claimed.
Coincidence Factors Not applicable for this measure since no electric savings are claimed.
403 Environmental Protection Agency (2009). Life Cycle Cost Estimate for ENERGY STAR Furnace. Interactive Excel Spreadsheet found at www.energystar.gov/ia/business/bulk_purchasing/bpsavings_calc/Calc_Furnaces.xls. 404 The heating penalty of 21.1 – 19.6 MMBTU is equivalent to 478 kWh for the 92% efficient furnace (1,500,000BTU/ (0.92*3413 BTU/kWh).

Massachusetts Technical Reference Manual Residential Gas Efficiency Measures
August 2011 194
HVAC – Heat Recovery Ventilator
Measure Overview
Description: Heat Recovery Ventilators (HRV) can help make mechanical ventilation more cost
effective by reclaiming energy from exhaust airflows.
Primary Energy Impact: Natural Gas Secondary Energy Impact: None
Non-Energy Impact: None
Sector: Residential
Market: Lost Opportunity End Use: HVAC
Program: Residential Heating and Water Heating
Algorithms for Calculating Primary Energy Impact
Unit savings are deemed based on study results:
MMbtuMMbtu ∆=∆
Where:
∆MMBtu = Annual MMBtu savings per heat recovery ventilation installed: 7.7 MMBtu 405 Units = Number of heat recovery ventilation systems installed
Baseline Efficiency
The baseline efficiency case is an ASHRAE 62.2-compliant exhaust fan system with no heat recovery.
High Efficiency
The high efficiency case is an exhaust fan system with heat recovery.
Hours
Not applicable.
Measure Life
The measure life is 20 years.406
Secondary Energy Impacts
There are no secondary energy impacts for this measure.
405 GDS Associates, Inc. (2009). Natural Gas Energy Efficiency Potential in Massachusetts. Prepared for GasNetworks. 406 Ibid.

Massachusetts Technical Reference Manual Residential Gas Efficiency Measures
August 2011 195
Non-Energy Impacts
There are no non-energy impacts for this measure.
Impact Factors for Calculating Adjusted Gross Savings
Measure Name Program ISR SPF RRE RRSP RRWP CFSP CFWP
Heat Recovery Ventilator Residential Heating and Water Heating 1.00 1.00 1.00 n/a n/a n/a n/a
In-Service Rates All installations have 100% in service rate since programs include verification of equipment installations.
Savings Persistence Factor All PAs use 100% savings persistence factor.
Realization Rates
All PAs use 100% energy realization rate. The summer and winter peak realization rates are not applicable for this
measure since there are no electric savings claimed.
Coincidence Factors Not applicable for this measure since no electric savings are claimed.

Massachusetts Technical Reference Manual Residential Gas Efficiency Measures
August 2011 196
HVAC – Stand Alone Storage Water Heater
Measure Overview
Description: High efficiency water heaters that are not combined with space heating devices.
Primary Energy Impact: Natural Gas
Secondary Energy Impact: None
Non-Energy Impact: None
Sector: Residential
Market: Lost Opportunity
End Use: Hot Water
Program: Residential Heating and Water Heating
Algorithms for Calculating Primary Energy Impact
Unit savings are deemed based on study results:
MMbtuMMbtu ∆=∆
Where: Units = Number of stand alone storage water heaters installed
∆MMBtu = Annual MMBtu savings per stand alone storage water heater EF >= 0.62: 1.9407
Baseline Efficiency
The baseline efficiency case is a stand alone tank water heater with an energy factor of 0.575.
High Efficiency
The high efficiency case is a stand alone tank water heater with an energy factor of 0.62 or higher.
Hours
Not applicable.
Measure Life
The measure life is 13 years.408
Secondary Energy Impacts
There are no secondary energy impacts for this measure.
Non-Energy Impacts
There are no non-energy impacts for this measure.
407 DOE (2008). ENERGY STAR® Residential Water Heaters: Final Criteria Analysis. Prepared for the DOE; Page 10. 408 Ibid.
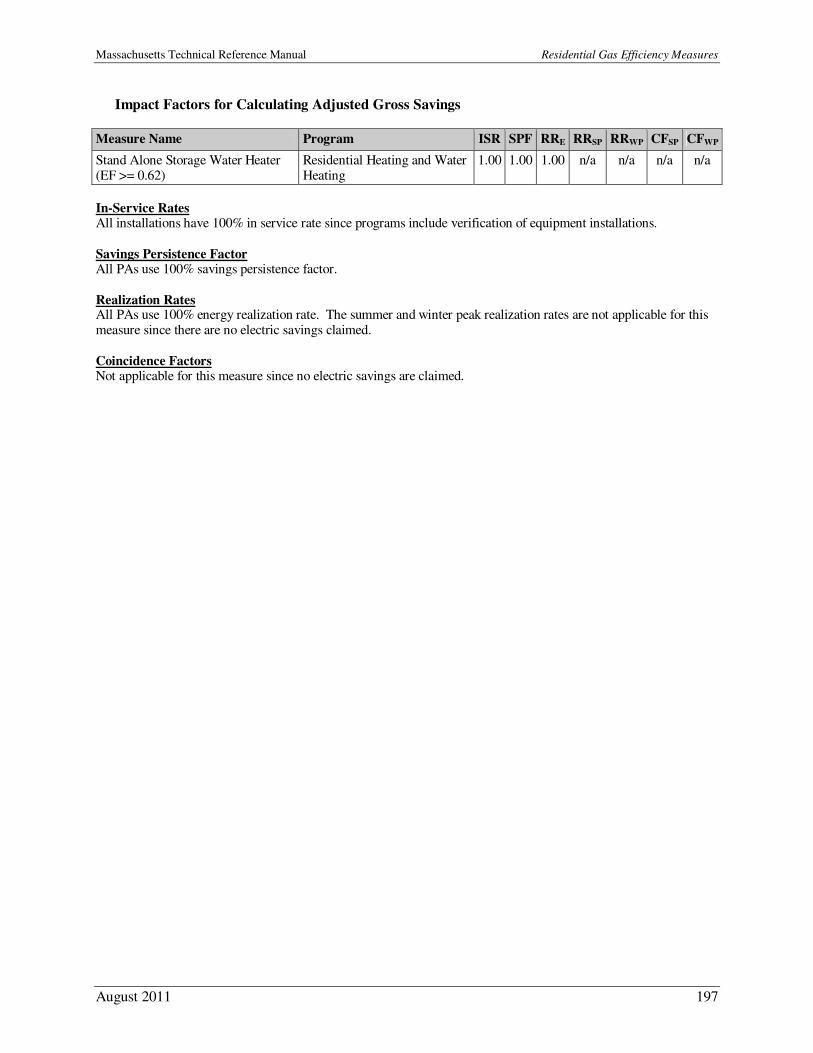
Massachusetts Technical Reference Manual Residential Gas Efficiency Measures
August 2011 197
Impact Factors for Calculating Adjusted Gross Savings
Measure Name Program ISR SPF RRE RRSP RRWP CFSP CFWP
Stand Alone Storage Water Heater (EF >= 0.62)
Residential Heating and Water Heating
1.00 1.00 1.00 n/a n/a n/a n/a
In-Service Rates All installations have 100% in service rate since programs include verification of equipment installations.
Savings Persistence Factor All PAs use 100% savings persistence factor.
Realization Rates All PAs use 100% energy realization rate. The summer and winter peak realization rates are not applicable for this measure since there are no electric savings claimed.
Coincidence Factors Not applicable for this measure since no electric savings are claimed.

Massachusetts Technical Reference Manual Residential Gas Efficiency Measures
August 2011 198
HVAC – Gas Heating System Replacement (Low Income)
Measure Overview
Description: Replacement of an existing gas heating system with a new high efficiency system.
Electric savings are achieved from reduced fan run time.
Primary Energy Impact: Gas Secondary Energy Impact: Electric
Non-Energy Impact: Annual Discounted Rate Cost Reduction, One-Time Arrearage Reduction,
Annual Fire, Illness and Moving Avoidance Benefits, One-Time Property Value Benefit
Sector: Low Income Market: Retrofit
End Use: HVAC
Program: Low-Income Single Family Retrofit
Algorithms for Calculating Primary Energy Impact
Unit savings are deemed based on study results:
MMBtuMMBtu ∆=∆
Where:
Unit = Installation of new high efficiency gas heating system. ∆MMBtu = Average annual MMBtu savings per unit: 12.2 MMBtu409
Baseline Efficiency
The baseline efficiency case is the existing inefficient heating equipment.
High Efficiency
The high efficiency case is the new efficient heating equipment.
Hours
Not applicable.
Measure Life
The measure life is 20 years.410
Secondary Energy Impacts
Unit electric savings are deemed based on study results.
409 Cadmus Group, Inc. (2009). Impact Evaluation of the 2007 Appliance Management Program and Low Income Weatherization
Program. Prepared for National Grid; Page 5, Table 1. 410 Environmental Protection Agency (2009). Life Cycle Cost Estimate for ENERGY STAR Qualified Boilers. Interactive Excel Spreadsheet found at http://www.energystar.gov/index.cfm?c=boilers.pr_proc_boilers.
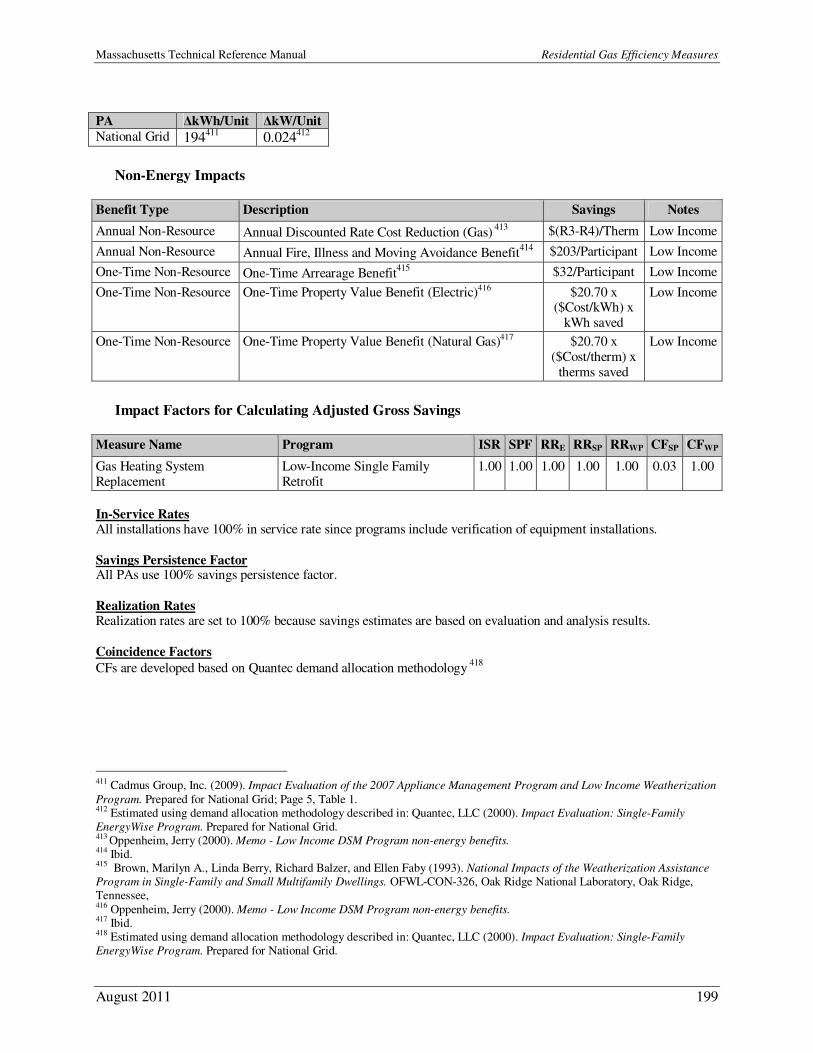
Massachusetts Technical Reference Manual Residential Gas Efficiency Measures
August 2011 199
PA ∆kWh/Unit ∆kW/Unit
National Grid 194411 0.024412
Non-Energy Impacts
Benefit Type Description Savings Notes
Annual Non-Resource Annual Discounted Rate Cost Reduction (Gas) 413
$(R3-R4)/Therm Low Income
Annual Non-Resource Annual Fire, Illness and Moving Avoidance Benefit414
$203/Participant Low Income
One-Time Non-Resource One-Time Arrearage Benefit415
$32/Participant Low Income
One-Time Non-Resource One-Time Property Value Benefit (Electric)416 $20.70 x ($Cost/kWh) x
kWh saved
Low Income
One-Time Non-Resource One-Time Property Value Benefit (Natural Gas)417 $20.70 x ($Cost/therm) x
therms saved
Low Income
Impact Factors for Calculating Adjusted Gross Savings
Measure Name Program ISR SPF RRE RRSP RRWP CFSP CFWP
Gas Heating System Replacement
Low-Income Single Family Retrofit
1.00 1.00 1.00 1.00 1.00 0.03 1.00
In-Service Rates All installations have 100% in service rate since programs include verification of equipment installations.
Savings Persistence Factor All PAs use 100% savings persistence factor.
Realization Rates Realization rates are set to 100% because savings estimates are based on evaluation and analysis results.
Coincidence Factors
CFs are developed based on Quantec demand allocation methodology 418
411 Cadmus Group, Inc. (2009). Impact Evaluation of the 2007 Appliance Management Program and Low Income Weatherization
Program. Prepared for National Grid; Page 5, Table 1. 412 Estimated using demand allocation methodology described in: Quantec, LLC (2000). Impact Evaluation: Single-Family
EnergyWise Program. Prepared for National Grid. 413 Oppenheim, Jerry (2000). Memo - Low Income DSM Program non-energy benefits. 414 Ibid. 415 Brown, Marilyn A., Linda Berry, Richard Balzer, and Ellen Faby (1993). National Impacts of the Weatherization Assistance
Program in Single-Family and Small Multifamily Dwellings. OFWL-CON-326, Oak Ridge National Laboratory, Oak Ridge, Tennessee, 416 Oppenheim, Jerry (2000). Memo - Low Income DSM Program non-energy benefits. 417 Ibid. 418 Estimated using demand allocation methodology described in: Quantec, LLC (2000). Impact Evaluation: Single-Family
EnergyWise Program. Prepared for National Grid.
Massachusetts Technical Reference Manual Residential Gas Efficiency Measures
August 2011 200
HVAC – Gas Weatherization (Low Income)
Measure Overview
Description: Installation of weatherization measures such as air sealing and insulation in gas
heated homes. Electric savings are achieved from reduced fan run time.
Primary Energy Impact: Gas Secondary Energy Impact: Electric
Non-Energy Impact: Annual Discounted Rate Cost Reduction, One-Time Arrearage Reduction,
Annual Fire, Illness and Moving Avoidance Benefits, One-Time Property Value Benefit
Sector: Low Income Market: Retrofit
End Use: HVAC
Program: Low-Income Single Family Retrofit
Algorithms for Calculating Primary Energy Impact
Unit savings are deemed based on study results:
MMBtuMMBtu ∆=∆
Where:
Unit = Household with weatherization measures installed ∆MMBtu = Average annual MMBtu savings per unit: 13.7 MMBtu419
Baseline Efficiency
The baseline efficiency case is the existing home shell.
High Efficiency
The high efficiency case can be a combination of increased insulation, air sealing, duct sealing, and other
improvements to the home shell.
Hours
Not applicable.
Measure Life
The measure lives for weatherization projects may differ depending on the measures implemented. The final measure life of each application is weighted based on the mix of weatherization measures installed.
The measure life for each type of weatherization measure is based on statewide measure lives for
residential energy efficiency measures.420
419 Cadmus Group, Inc. (2009). Impact Evaluation of the 2007 Appliance Management Program and Low Income Weatherization
Program. Prepared for National Grid; Page 5, Table 1. 420 GDS Associates, Inc. (2007). Measure Life Report: Residential and Commercial/Industrial Lighting and HVAC Measures. Prepared for The New England State Program Working Group.
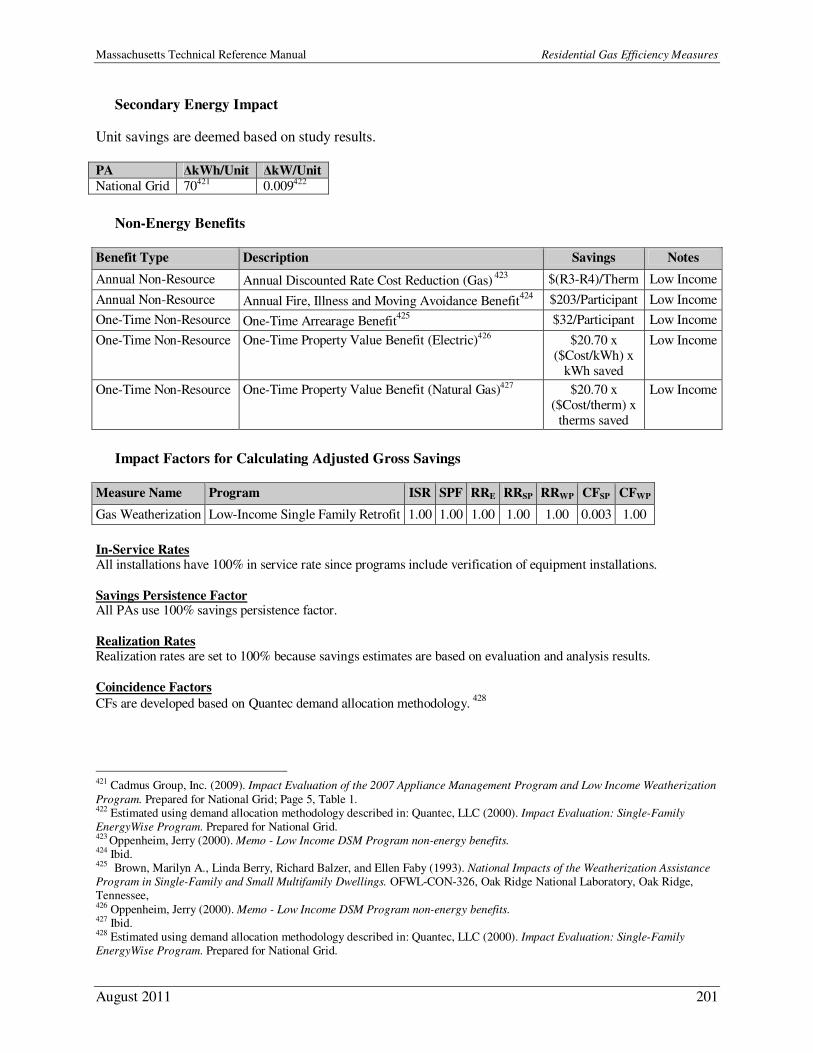
Massachusetts Technical Reference Manual Residential Gas Efficiency Measures
August 2011 201
Secondary Energy Impact
Unit savings are deemed based on study results. PA ∆kWh/Unit ∆kW/Unit
National Grid 70421 0.009422
Non-Energy Benefits
Benefit Type Description Savings Notes
Annual Non-Resource Annual Discounted Rate Cost Reduction (Gas) 423
$(R3-R4)/Therm Low Income
Annual Non-Resource Annual Fire, Illness and Moving Avoidance Benefit424
$203/Participant Low Income
One-Time Non-Resource One-Time Arrearage Benefit425
$32/Participant Low Income
One-Time Non-Resource One-Time Property Value Benefit (Electric)426 $20.70 x ($Cost/kWh) x
kWh saved
Low Income
One-Time Non-Resource One-Time Property Value Benefit (Natural Gas)427 $20.70 x ($Cost/therm) x
therms saved
Low Income
Impact Factors for Calculating Adjusted Gross Savings
Measure Name Program ISR SPF RRE RRSP RRWP CFSP CFWP
Gas Weatherization Low-Income Single Family Retrofit 1.00 1.00 1.00 1.00 1.00 0.003 1.00
In-Service Rates All installations have 100% in service rate since programs include verification of equipment installations.
Savings Persistence Factor All PAs use 100% savings persistence factor.
Realization Rates Realization rates are set to 100% because savings estimates are based on evaluation and analysis results.
Coincidence Factors
CFs are developed based on Quantec demand allocation methodology. 428
421 Cadmus Group, Inc. (2009). Impact Evaluation of the 2007 Appliance Management Program and Low Income Weatherization
Program. Prepared for National Grid; Page 5, Table 1. 422 Estimated using demand allocation methodology described in: Quantec, LLC (2000). Impact Evaluation: Single-Family
EnergyWise Program. Prepared for National Grid. 423 Oppenheim, Jerry (2000). Memo - Low Income DSM Program non-energy benefits. 424 Ibid. 425 Brown, Marilyn A., Linda Berry, Richard Balzer, and Ellen Faby (1993). National Impacts of the Weatherization Assistance
Program in Single-Family and Small Multifamily Dwellings. OFWL-CON-326, Oak Ridge National Laboratory, Oak Ridge, Tennessee, 426 Oppenheim, Jerry (2000). Memo - Low Income DSM Program non-energy benefits. 427 Ibid. 428 Estimated using demand allocation methodology described in: Quantec, LLC (2000). Impact Evaluation: Single-Family
EnergyWise Program. Prepared for National Grid.
Massachusetts Technical Reference Manual Residential Gas Efficiency Measures
August 2011 202
HVAC – Gas Insulation
Measure Overview
Description: Shell insulation upgrades are applied in existing homes including improved
insulation in attics, basements and sidewalls.
Primary Energy Impact: Natural Gas Secondary Energy Impact: None
Non-Energy Impact: None
Sector: Residential
Market: Retrofit End Use: HVAC
Program: Residential Gas Weatherization Program
Algorithms for Calculating Primary Energy Impact
Unit savings are deemed based on study results:
MMbtuMMbtu ∆=∆
Where:
∆MMBtu = Annual MMBtu savings for insulation in a gas heated home: 12.3 MMBtu429
Baseline Efficiency
The baseline efficiency case is any existing home shell measures.
High Efficiency
The high efficiency case includes increased weatherization insulation levels.
Hours
Not applicable.
Measure Life
The measure life is 20 years.430
Secondary Energy Impacts
There are no secondary energy impacts for this measure.
429 Residential Gas Weatherization Program Impact Evaluation: 2008 Program Year by Summit Blue Consulting July 2009 430 GDS Associates, Inc. (2007). Measure Life Report: Residential and Commercial/Industrial Lighting and HVAC Measures. Prepared for The New England State Program Working Group; Page A-2.

Massachusetts Technical Reference Manual Residential Gas Efficiency Measures
August 2011 203
Non-Energy Impacts
There are no non-energy impacts for this measure.
Impact Factors for Calculating Adjusted Gross Savings
Measure Name Program ISR SPF RRE RRSP RRWP CFSP CFWP
Insulation Gas Weatherization 1.00 1.00 1.00 n/a n/a n/a n/a
In-Service Rates All installations have 100% in service rate since all PA programs include verification of equipment installations.
Savings Persistence Factor All PAs use 100% savings persistence factors.
Realization Rates Realization rates are set to 100% since deemed savings are based on evaluation results.
Coincidence Factors There are no electric savings for this measure.
Massachusetts Technical Reference Manual Residential Gas Efficiency Measures
August 2011 204
HVAC – Gas Air Sealing
Measure Overview
Description: Thermal shell air leaks are sealed through strategic use and location of air-tight
materials.
Primary Energy Impact: Natural Gas Secondary Energy Impact: None
Non-Energy Impact: None
Sector: Residential
Market: Retrofit End Use: HVAC
Program: Residential Gas Weatherization Program
Algorithms for Calculating Primary Energy Impact
Unit savings are deemed:
MMbtuMMbtu ∆=∆
Where:
∆MMBtu = Annual MMBtu savings for air sealing in a gas heated home: 6.5 MMBtu431
Baseline Efficiency
The baseline efficiency case is the existing building before the air sealing measure is implemented.
High Efficiency
The baseline efficiency case is the existing building after the air sealing measure is implemented.
Hours
Not applicable.
Measure Life
The measure life is 20 years.432
Secondary Energy Impacts
There are no secondary energy impacts for this measure.
431 Estimated based on previous years’ savings per home reported by CSG for the RCS program. 432 GDS Associates, Inc. (2007). Measure Life Report: Residential and Commercial/Industrial Lighting and HVAC Measures. Prepared for The New England State Program Working Group; Page A-2.
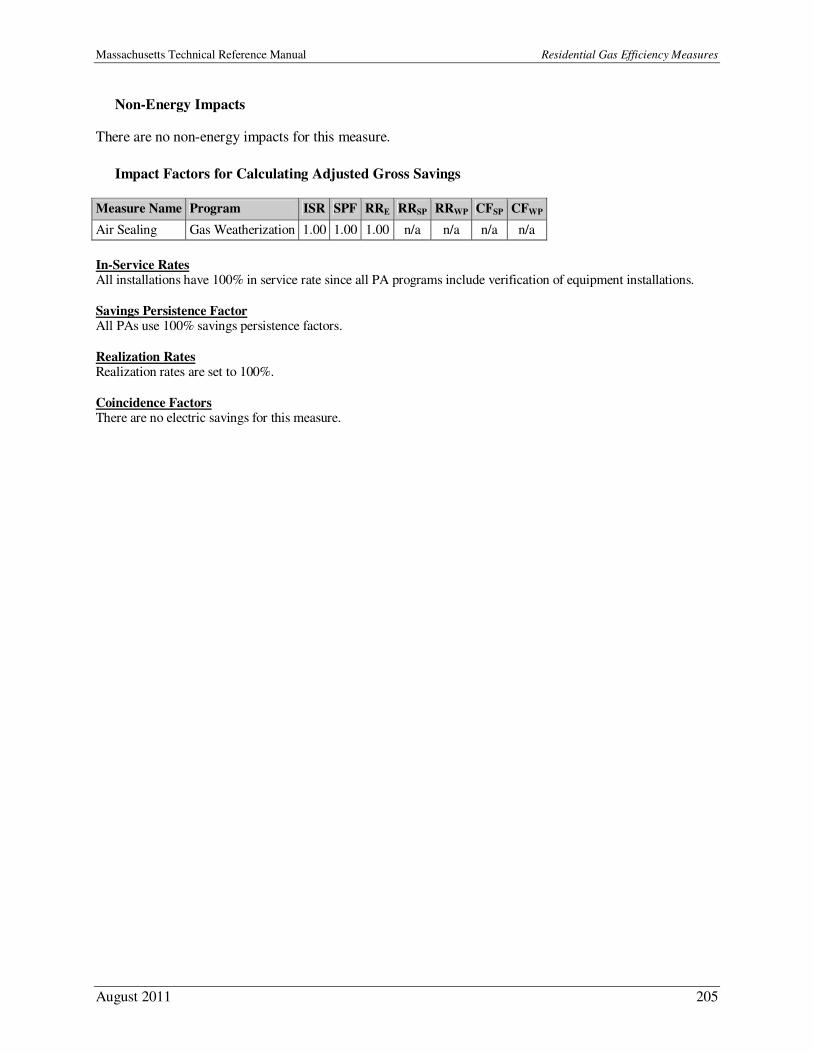
Massachusetts Technical Reference Manual Residential Gas Efficiency Measures
August 2011 205
Non-Energy Impacts
There are no non-energy impacts for this measure.
Impact Factors for Calculating Adjusted Gross Savings
Measure Name Program ISR SPF RRE RRSP RRWP CFSP CFWP
Air Sealing Gas Weatherization 1.00 1.00 1.00 n/a n/a n/a n/a
In-Service Rates All installations have 100% in service rate since all PA programs include verification of equipment installations.
Savings Persistence Factor All PAs use 100% savings persistence factors.
Realization Rates Realization rates are set to 100%.
Coincidence Factors There are no electric savings for this measure.
Massachusetts Technical Reference Manual Residential Gas Efficiency Measures
August 2011 206
HVAC/Hot Water – Integrated Water Heater/Condensing Boiler
Measure Overview
Description: This measure promotes the installation of a combined high-efficiency boiler and
water heating unit. Combined boiler and water heating systems are more efficient than separate
systems because they eliminate the standby heat losses of an additional tank. Primary Energy Impact: Natural Gas
Secondary Energy Impact: None
Non-Energy Impact: None
Sector: Residential
Market: Lost Opportunity
End Use: HVAC Program: Residential Heating and Water Heating
Algorithms for Calculating Primary Energy Impact
Unit savings are deemed based on study results:
MMbtuMMbtu ∆=∆
Where: Units = Installation of integrated water heater/condensing boiler
∆MMBtu = Annual MMBtu savings per integrated water heater/condensing boiler installed: 21.1
MMBtu433
Baseline Efficiency
The baseline efficiency case is an 80% AFUE boiler with a 0.594 EF water heater.
High Efficiency
The high efficiency case is an integrated water heater/condensing boiler with a 90% AFUE boiler and a
0.9 EF water heater.
Hours
Not applicable.
Measure Life
The measure life is 20 years.434
433 GDS Associates, Inc. (2009). Natural Gas Energy Efficiency Potential in Massachusetts. Prepared for GasNetworks. 434 Environmental Protection Agency (2009). Life Cycle Cost Estimate for ENERGY STAR Qualified Boilers. Interactive Excel Spreadsheet found at http://www.energystar.gov/index.cfm?c=boilers.pr_proc_boilers; measure life assumed to be the same as a boiler.
Massachusetts Technical Reference Manual Residential Gas Efficiency Measures
August 2011 207
Secondary Energy Impacts
There are no secondary energy impacts for this measure.
Non-Energy Impacts
There are no non-energy impacts for this measure.
Impact Factors for Calculating Adjusted Gross Savings
Measure Name Program ISR SPF RRE RRSP RRWP CFSP CFWP
Integrated water heater/condensing boiler
Residential Heating and Water Heating
1.00 1.00 1.00 n/a n/a n/a n/a
In-Service Rates All installations have 100% in service rate since programs include verification of equipment installations.
Savings Persistence Factor All PAs use 100% savings persistence factor.
Realization Rates All PAs use 100% energy realization rate. The summer and winter peak realization rates are not applicable for this measure since there are no electric savings claimed.
Coincidence Factors Not applicable for this measure since no electric savings are claimed.
Massachusetts Technical Reference Manual Residential Gas Efficiency Measures
August 2011 208
HVAC/Hot Water – Integrated Water Heater/Non-Condensing Boiler
Measure Overview
Description: This measure promotes the installation of a combined high-efficiency boiler and
water heating unit. Combined boiler and water heating systems are more efficient than separate
systems because they eliminate the standby heat losses of an additional tank. Primary Energy Impact: Natural Gas
Secondary Energy Impact: None
Non-Energy Impact: None
Sector: Residential Market: Lost Opportunity
End Use: HVAC
Program: Residential Heating and Water Heating
Algorithms for Calculating Primary Energy Impact
Unit savings are deemed based on study results:
MMbtuMMbtu ∆=∆
Where: Units = Number of per integrated water heater/condensing boilers installed
∆MMBtu = Annual MMBtu savings per integrated water heater/condensing boiler installed:
13.5 MMBtu435
Baseline Efficiency
The baseline efficiency case is an 80% AFUE boiler with a 0.594 EF water heater.
High Efficiency
The high efficiency case is an integrated water heater/condensing boiler with an 85% AFUE boiler and a 0.86 EF water heater.
Hours
Not applicable.
Measure Life
The measure life is 20 years.436
435 GDS Associates, Inc. (2009). Natural Gas Energy Efficiency Potential in Massachusetts. Prepared for GasNetworks. 436 Environmental Protection Agency (2009). Life Cycle Cost Estimate for ENERGY STAR Qualified Boilers. Interactive Excel Spreadsheet found at http://www.energystar.gov/index.cfm?c=boilers.pr_proc_boilers; measure life assumed to be the same as a boiler.
Massachusetts Technical Reference Manual Residential Gas Efficiency Measures
August 2011 209
Secondary Energy Impacts
There are no secondary energy impacts for this measure.
Non-Energy Impacts
There are no non-energy impacts for this measure.
Impact Factors for Calculating Adjusted Gross Savings
Measure Name Program ISR SPF RRE RRSP RRWP CFSP CFWP
Integrated water heater/non-condensing boiler
Residential Heating and Water Heating
1.00 1.00 1.00 n/a n/a n/a n/a
In-Service Rates All installations have 100% in service rate since programs include verification of equipment installations.
Savings Persistence Factor All PAs use 100% savings persistence factor.
Realization Rates All PAs use 100% energy realization rate. The summer and winter peak realization rates are not applicable for this measure since there are no electric savings claimed.
Coincidence Factors Not applicable for this measure since no electric savings are claimed.
Massachusetts Technical Reference Manual Residential Gas Efficiency Measures
August 2011 210
Hot Water – Condensing Water Heater
Measure Overview
Description: Condensing water heaters recover energy by using either a larger heat exchanger or
a second heat exchanger to reduce the flue-gas temperature to the point that water vapor
condenses, thus releasing even more energy. Primary Energy Impact: Natural Gas
Secondary Energy Impact: None
Non-Energy Impact: None
Sector: Residential
Market: Lost Opportunity
End Use: Hot Water Program: Residential Heating and Water Heating
Algorithms for Calculating Primary Energy Impact
Unit savings are deemed based on study results:
MMbtuMMbtu ∆=∆
Where: ∆MMBtu = Annual MMBtu savings per condensing stand alone water heater installed: 7.4
MMBtu437
Units = Number of Condensing Water Heaters installed
Baseline Efficiency
The baseline efficiency case is a stand alone tank water heater with an energy factor of 0.575.
High Efficiency
The high efficiency case is a condensing water heater with an energy factor of 0.8.
Hours
Not applicable.
Measure Life
The measure life is 15 years.438
Secondary Energy Impacts
There are no secondary energy impacts for this measure.
437 DOE (2008). ENERGY STAR® Residential Water Heaters: Final Criteria Analysis. Prepared for the DOE; Page 10. 438 Ibid.

Massachusetts Technical Reference Manual Residential Gas Efficiency Measures
August 2011 211
Non-Energy Impacts
There are no non-energy impacts for this measure.
Impact Factors for Calculating Adjusted Gross Savings
Measure Name Program ISR SPF RRE RRSP RRWP CFSP CFWP
Condensing water heaters Residential Heating and Water Heating 1.00 1.00 1.00 n/a n/a n/a n/a
In-Service Rates All installations have 100% in service rate since programs include verification of equipment installations.
Savings Persistence Factor All PAs use 100% savings persistence factor.
Realization Rates All PAs use 100% energy realization rate. The summer and winter peak realization rates are not applicable for this measure since there are no electric savings claimed.
Coincidence Factors Not applicable for this measure since no electric savings are claimed.
Massachusetts Technical Reference Manual Residential Gas Efficiency Measures
August 2011 212
Hot Water – Indirect Water Heater
Measure Overview
Description: The installation of a high-efficiency indirect water heater. Indirect water heaters use
a storage tank that is heated by the main boiler. The energy stored by the water tank allows the
boiler to turn off and on less often, saving considerable energy. Primary Energy Impact: Natural Gas
Secondary Energy Impact: None
Non-Energy Impact: None
Sector: Residential Market: Lost Opportunity
End Use: Hot Water
Program: Residential Heating and Water Heating
Algorithms for Calculating Primary Energy Impact
Unit savings are deemed based on study results:
MMbtuMMbtu ∆=∆
Where: ∆MMBtu = Annual MMBtu savings indirect water heater unit installed: 8.0 MMBtu 439
Units = Number of savings indirect water heaters installed
Baseline Efficiency
The baseline efficiency case is a stand alone tank water heater with an energy factor of 0.575.
High Efficiency
The high efficiency case is an indirect water heater attached to an ENERGY STAR® rated forced hot
water gas boiler.
Hours
Not applicable.
Measure Life
The measure life is 20 years.440
Secondary Energy Impacts
There are no secondary energy impacts for this measure.
439 Nexus Market Research (2010). HEHE Process and Impact Evaluation. Prepared for GasNetworks. 440 GDS Associates, Inc. (2003). Consumer Guide to Home Energy Savings. Prepared for the 8th ed. ACEEE; Table 6.6.
Massachusetts Technical Reference Manual Residential Gas Efficiency Measures
August 2011 213
Non-Energy Impacts
There are no non-energy impacts for this measure.
Impact Factors for Calculating Adjusted Gross Savings
Measure Name Program ISR SPF RRE RRSP RRWP CFSP CFWP
Indirect Water Heaters Residential Heating and Water Heating 1.00 1.00 1.00 n/a n/a n/a n/a
In-Service Rates All installations have 100% in service rate since programs include verification of equipment installations.
Savings Persistence Factor All PAs use 100% savings persistence factor.
Realization Rates All PAs use 100% energy realization rate. The summer and winter peak realization rates are not applicable for this measure since there are no electric savings claimed.
Coincidence Factors Not applicable for this measure since no electric savings are claimed.
Massachusetts Technical Reference Manual Residential Gas Efficiency Measures
August 2011 214
Hot Water – Tankless Water Heaters
Measure Overview
Description: The installation of a high-efficiency tankless water heater with electronic ignition
and an Energy Factor (EF) of at least 0.82. Tankless water heaters circulate water through a heat
exchanger to be heated for immediate use, eliminating the standby heat loss associated with a storage tank.
Primary Energy Impact: Natural Gas
Secondary Energy Impact: None
Non-Energy Impact: None Sector: Residential
Market: Lost Opportunity
End Use: Hot Water Program: Residential Heating and Water Heating
Algorithms for Calculating Primary Energy Impact
Unit savings are deemed based on study results:
MMbtuMMbtu ∆=∆
Where:
∆MMBtu = Annual MMBtu savings per tankless water heater (EF >= 0.82) installed: 9.7 MMBtu441
Units = Number of tankless water heaters installed.
Baseline Efficiency
The baseline efficiency case is a stand alone tank water heater with an energy factor of 0.575.
High Efficiency
The high efficiency case is a tankless water heater with an energy factor of 0.82 or greater.
Hours
Not applicable.
Measure Life
The measure life is 20 years.442
Secondary Energy Impacts
There are no secondary energy impacts for this measure.
441 Nexus Market Research (2010). HEHE Process and Impact Evaluation. Prepared for GasNetworks. 442 DOE (2008). ENERGY STAR® Residential Water Heaters: Final Criteria Analysis. Prepared for the DOE; Page 10.
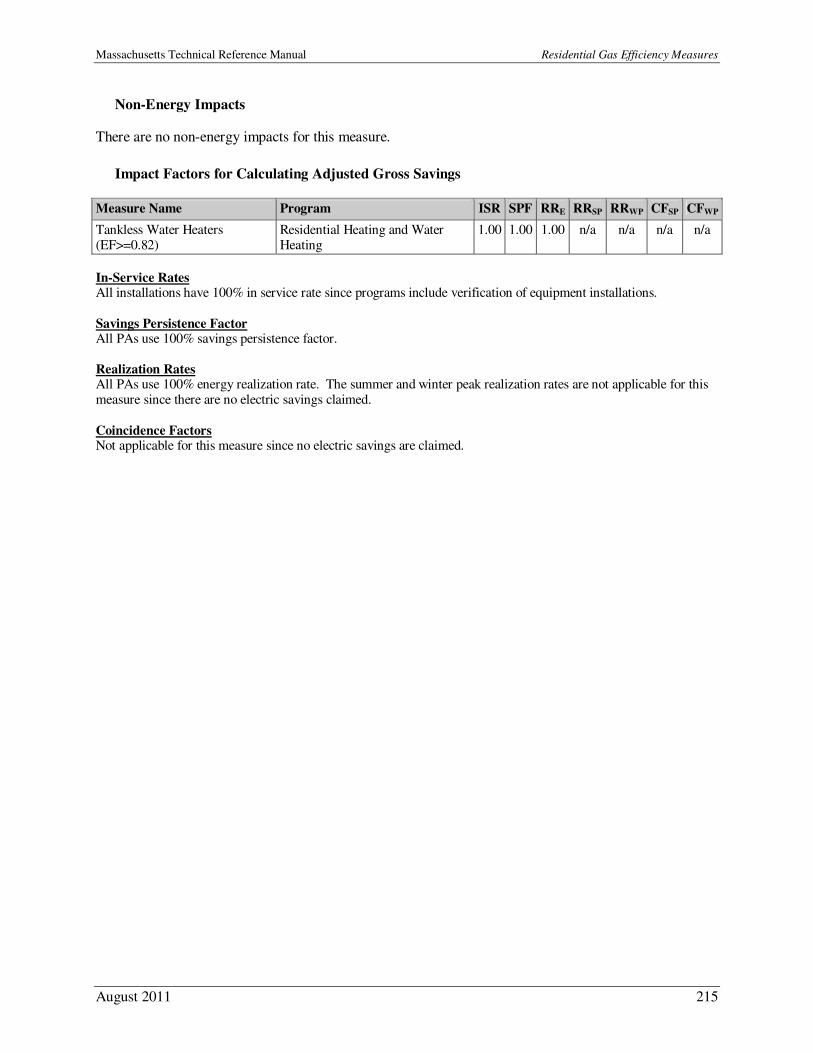
Massachusetts Technical Reference Manual Residential Gas Efficiency Measures
August 2011 215
Non-Energy Impacts
There are no non-energy impacts for this measure.
Impact Factors for Calculating Adjusted Gross Savings
Measure Name Program ISR SPF RRE RRSP RRWP CFSP CFWP
Tankless Water Heaters (EF>=0.82)
Residential Heating and Water Heating
1.00 1.00 1.00 n/a n/a n/a n/a
In-Service Rates All installations have 100% in service rate since programs include verification of equipment installations.
Savings Persistence Factor All PAs use 100% savings persistence factor. Realization Rates All PAs use 100% energy realization rate. The summer and winter peak realization rates are not applicable for this measure since there are no electric savings claimed.
Coincidence Factors Not applicable for this measure since no electric savings are claimed.
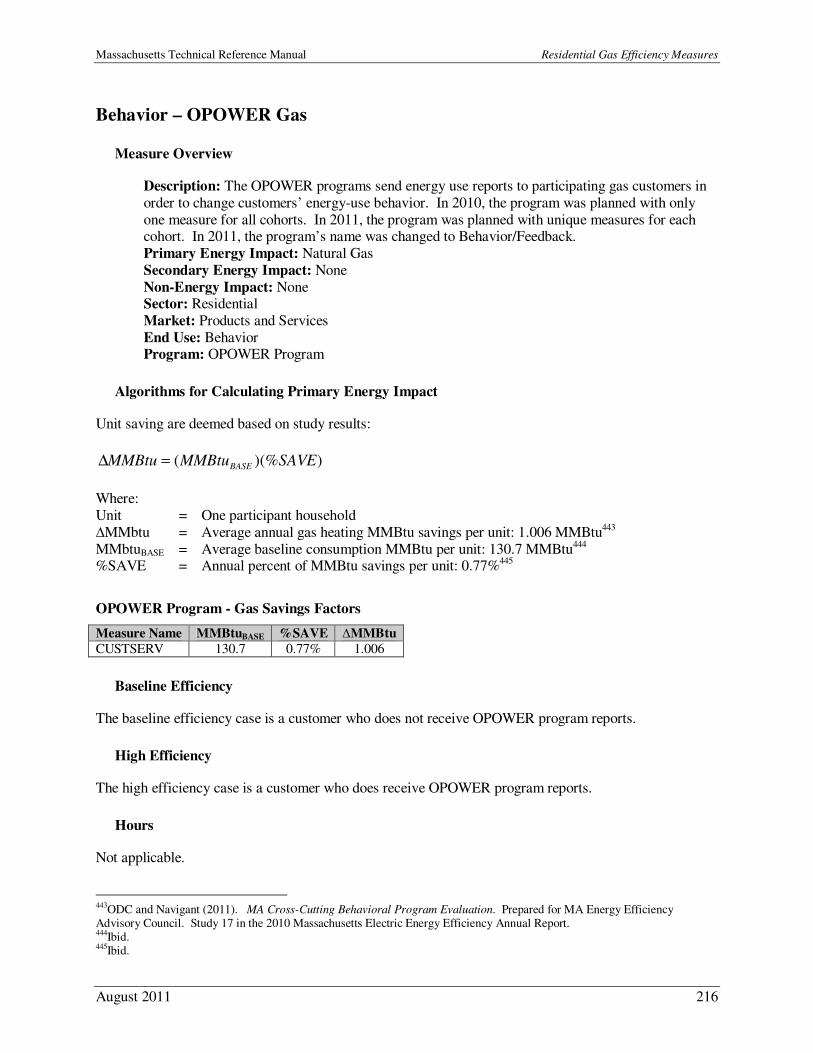
Massachusetts Technical Reference Manual Residential Gas Efficiency Measures
August 2011 216
Behavior – OPOWER Gas
Measure Overview
Description: The OPOWER programs send energy use reports to participating gas customers in
order to change customers’ energy-use behavior. In 2010, the program was planned with only
one measure for all cohorts. In 2011, the program was planned with unique measures for each cohort. In 2011, the program’s name was changed to Behavior/Feedback.
Primary Energy Impact: Natural Gas
Secondary Energy Impact: None
Non-Energy Impact: None Sector: Residential
Market: Products and Services
End Use: Behavior Program: OPOWER Program
Algorithms for Calculating Primary Energy Impact
Unit saving are deemed based on study results:
))(%( SAVEMMBtuMMBtu BASE=∆
Where:
Unit = One participant household
∆MMbtu = Average annual gas heating MMBtu savings per unit: 1.006 MMBtu443
MMbtuBASE = Average baseline consumption MMBtu per unit: 130.7 MMBtu444 %SAVE = Annual percent of MMBtu savings per unit: 0.77%445
OPOWER Program - Gas Savings Factors
Measure Name MMBtuBASE %SAVE ∆MMBtu
CUSTSERV 130.7 0.77% 1.006
Baseline Efficiency
The baseline efficiency case is a customer who does not receive OPOWER program reports.
High Efficiency
The high efficiency case is a customer who does receive OPOWER program reports.
Hours
Not applicable.
443ODC and Navigant (2011). MA Cross-Cutting Behavioral Program Evaluation. Prepared for MA Energy Efficiency Advisory Council. Study 17 in the 2010 Massachusetts Electric Energy Efficiency Annual Report. 444Ibid. 445Ibid.
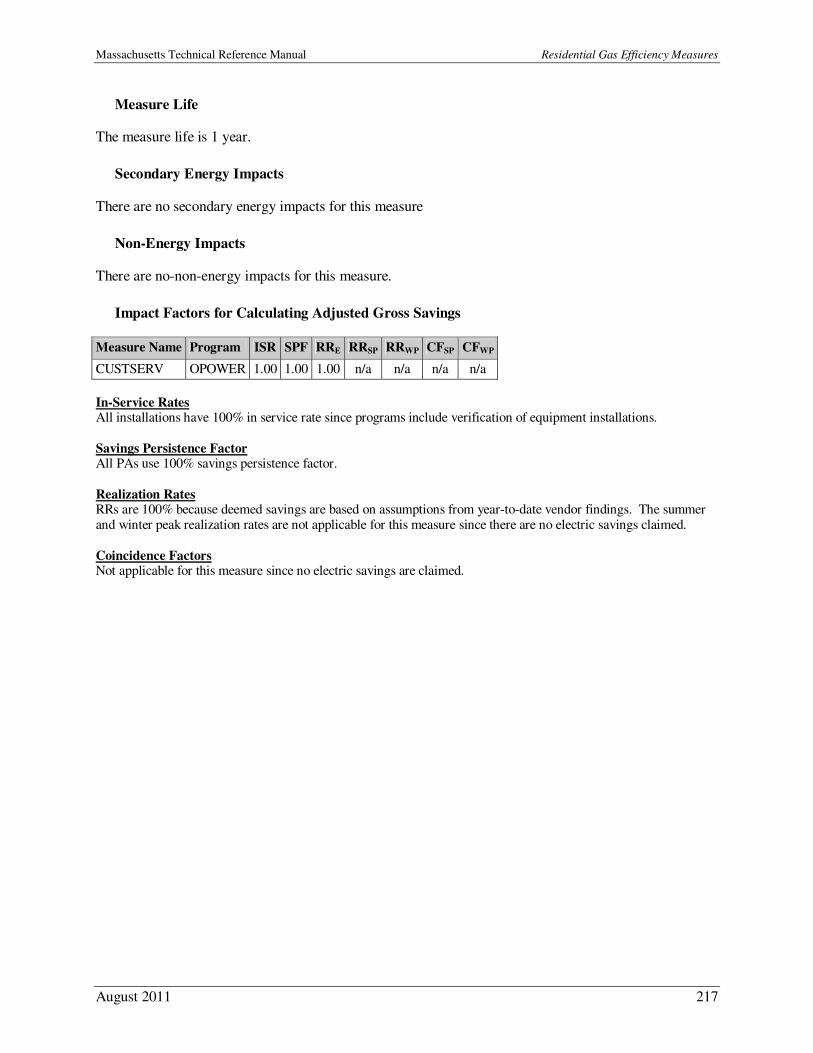
Massachusetts Technical Reference Manual Residential Gas Efficiency Measures
August 2011 217
Measure Life
The measure life is 1 year.
Secondary Energy Impacts
There are no secondary energy impacts for this measure
Non-Energy Impacts
There are no-non-energy impacts for this measure.
Impact Factors for Calculating Adjusted Gross Savings
Measure Name Program ISR SPF RRE RRSP RRWP CFSP CFWP
CUSTSERV OPOWER 1.00 1.00 1.00 n/a n/a n/a n/a
In-Service Rates All installations have 100% in service rate since programs include verification of equipment installations.
Savings Persistence Factor All PAs use 100% savings persistence factor.
Realization Rates RRs are 100% because deemed savings are based on assumptions from year-to-date vendor findings. The summer and winter peak realization rates are not applicable for this measure since there are no electric savings claimed.
Coincidence Factors Not applicable for this measure since no electric savings are claimed.

Massachusetts Technical Reference Manual Commercial and Industrial Natural Gas Efficiency Measures
August 2011 219
Commercial and Industrial Natural Gas Efficiency
Measures
Massachusetts Technical Reference Manual Commercial and Industrial Natural Gas Efficiency Measures
August 2011 220
HVAC – Programmable Thermostat
Measure Overview
Description: Installation of ENERGY STAR® labeled or 7-day programmable thermostats with
the ability to adjust heating or air-conditioning operating times according to a pre-set schedule to
meet occupancy needs and minimize redundant HVAC operation. Primary Energy Impact: Natural Gas
Secondary Energy Impact: None
Non-Energy Impact: None
Sector: Commercial & Industrial Market: Retrofit
End Use: HVAC
Program: C&I Retrofit, C&I Direct Install
Algorithms for Calculating Primary Energy Impact
Unit savings are deemed based on study results:
MMBtuMMBtu ∆=∆
Where:
Unit = Installed programmable thermostat ∆MMBtu = Average annual MMBtu reduction per unit: 7.5 MMBtu446
Baseline Efficiency
The baseline efficiency case is an HVAC system using natural gas to provide space heating without a
programmable thermostat.
High Efficiency
The high efficiency case is an HVAC system using natural gas to provide space heating with an
ENERGY STAR® labeled or 7-day programmable thermostat installed.
Hours
Not applicable.
Measure Life
The measure life is 15 years.447
446 RLW Analytics (2007). Validating the Impacts of Programmable Thermostats; Page 2, conversion factor CCF to Therms is
1.024. 447 Environmental Protection Agency (2010). Life Cycle Cost Estimate for ENERGY STAR Programmable Thermostat. Interactive Excel Spreadsheet found at www.energystar.gov/ia/business/bulk_purchasing/bpsavings_calc/CalculatorProgrammableThermostat.xls.
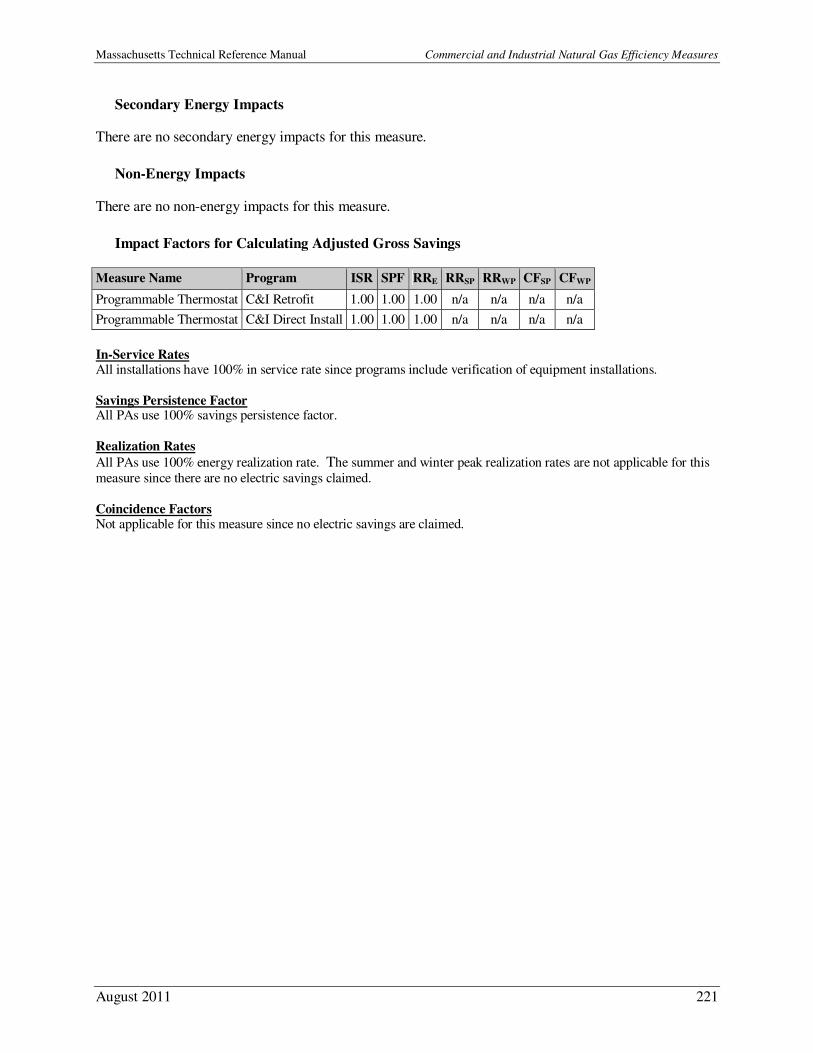
Massachusetts Technical Reference Manual Commercial and Industrial Natural Gas Efficiency Measures
August 2011 221
Secondary Energy Impacts
There are no secondary energy impacts for this measure.
Non-Energy Impacts
There are no non-energy impacts for this measure.
Impact Factors for Calculating Adjusted Gross Savings
Measure Name Program ISR SPF RRE RRSP RRWP CFSP CFWP
Programmable Thermostat C&I Retrofit 1.00 1.00 1.00 n/a n/a n/a n/a
Programmable Thermostat C&I Direct Install 1.00 1.00 1.00 n/a n/a n/a n/a
In-Service Rates All installations have 100% in service rate since programs include verification of equipment installations.
Savings Persistence Factor All PAs use 100% savings persistence factor.
Realization Rates
All PAs use 100% energy realization rate. The summer and winter peak realization rates are not applicable for this
measure since there are no electric savings claimed.
Coincidence Factors Not applicable for this measure since no electric savings are claimed.
Massachusetts Technical Reference Manual Commercial and Industrial Natural Gas Efficiency Measures
August 2011 222
HVAC – Boiler Reset Controls (Retrofit only)
Measure Overview
Description: Boiler Reset Controls are devices that automatically control boiler water
temperature based on outdoor or return water temperature using a software program.
Primary Energy Impact: Natural Gas Secondary Energy Impact: None
Non-Energy Impact: None
Sector: Commercial & Industrial
Market: Retrofit End Use: HVAC
Program: C&I Retrofit, C&I Direct Install
Algorithms for Calculating Primary Energy Impact
Unit savings are deemed based on study results:
MMBtuMMBtu ∆=∆
Where:
Unit = Installed boiler reset control
∆MMBtu = Average annual MMBtu savings per unit: 35.5 MMBtu448
Baseline Efficiency
The baseline efficiency case is a boiler without reset controls.
High Efficiency
The high efficiency case is a boiler with reset controls.
Hours
Not applicable.
Measure Life
The measure life is 20 years.449
Secondary Energy Impacts
There are no secondary energy impacts for this measure.
448 GDS Associates, Inc. (2009). Natural Gas Energy Efficiency Potential in Massachusetts. Prepared for GasNetworks; the GDS
Study assumes 710.46 MMBTU base use with 5% savings factor. 449 GDS Associates, Inc. (2009). Natural Gas Energy Efficiency Potential in Massachusetts. Prepared for GasNetworks; the study references “KEMA (2003). CA Statewide Commercial Sector NG EE Potential Study, Study ID #SW061. Prepared for PG&E; Appendix D.”

Massachusetts Technical Reference Manual Commercial and Industrial Natural Gas Efficiency Measures
August 2011 223
Non-Energy Impacts
There are no non-energy impacts for this measure.
Impact Factors for Calculating Adjusted Gross Savings
Measure Name Program ISR SPF RRE RRSP RRWP CFSP CFWP
Boiler Reset Controls C&I Retrofit 1.00 1.00 1.00 n/a n/a n/a n/a
Boiler Reset Controls C&I Direct Install 1.00 1.00 1.00 n/a n/a n/a n/a
In-Service Rates All installations have 100% in service rate since programs include verification of equipment installations.
Savings Persistence Factor All PAs use 100% savings persistence factor. Realization Rates
All PAs use 100% energy realization rate. The summer and winter peak realization rates are not applicable for this
measure since there are no electric savings claimed.
Coincidence Factors Not applicable for this measure since no electric savings are claimed.
Massachusetts Technical Reference Manual Commercial and Industrial Natural Gas Efficiency Measures
August 2011 224
HVAC – Condensing Unit Heater
Measure Overview
Description: Installation of a Condensing Gas Fired Unit Heater for space heating with capacity
of 151 – 400 MBH and minimum combustion efficiency of 90%
Primary Energy Impact: Natural Gas Secondary Energy Impact: None
Non-Energy Impact: None
Sector: Commercial & Industrial
Market: Lost Opportunity End Use: HVAC
Program: C&I New Construction & Major Renovation
Algorithms for Calculating Primary Energy Impact
Unit savings are deemed based on study results:
MMBtuMMBtu ∆=∆
Where:
Unit = Installed condensing unit heater
∆MMBtu = Average annual MMBtu savings per unit: 40.9 MMBtu450
Baseline Efficiency
The baseline efficiency case is a standard efficiency gas fired unit heater with minimum combustion efficiency of 80%, interrupted or intermittent ignition device (IID), and either power venting or an
automatic flue damper.451
High Efficiency
The high efficiency case is a condensing gas unit heater with 90% AFUE or greater.
Hours
Not applicable.
Measure Life
The measure life is 18 years.452
450 NYSERDA Deemed Savings Database (Rev 11); Measure Name: A.UNIT-HEATER-COND.<300000.CI._._.N. The database provides savings of 204.6 MMBtu per million BTU/hr of heater input capacity. Assume average unit size of 200,000 BTU
capacity. 451 ASHRAE Standard 90.1-2007; Table 6.8.1E. 452 Ecotrope (2003). Natural Gas Efficiency and Conservation Measure Resource Assessment. Prepared for the Energy Trust of Oregon.

Massachusetts Technical Reference Manual Commercial and Industrial Natural Gas Efficiency Measures
August 2011 225
Secondary Energy Impacts
There are no secondary energy impacts for this measure.
Non-Energy Impacts
There are no non-energy impacts for this measure.
Impact Factors for Calculating Adjusted Gross Savings
Measure Name Program ISR SPF RRE RRSP RRWP CFSP CFWP
Condensing Unit Heater C&I NC 1.00 1.00 1.00 n/a n/a n/a n/a
In-Service Rates All installations have 100% in service rate since programs include verification of equipment installations.
Savings Persistence Factor All PAs use 100% savings persistence factor.
Realization Rates
All PAs use 100% energy realization rate. The summer and winter peak realization rates are not applicable for this
measure since there are no electric savings claimed.
Coincidence Factors Not applicable for this measure since no electric savings are claimed.
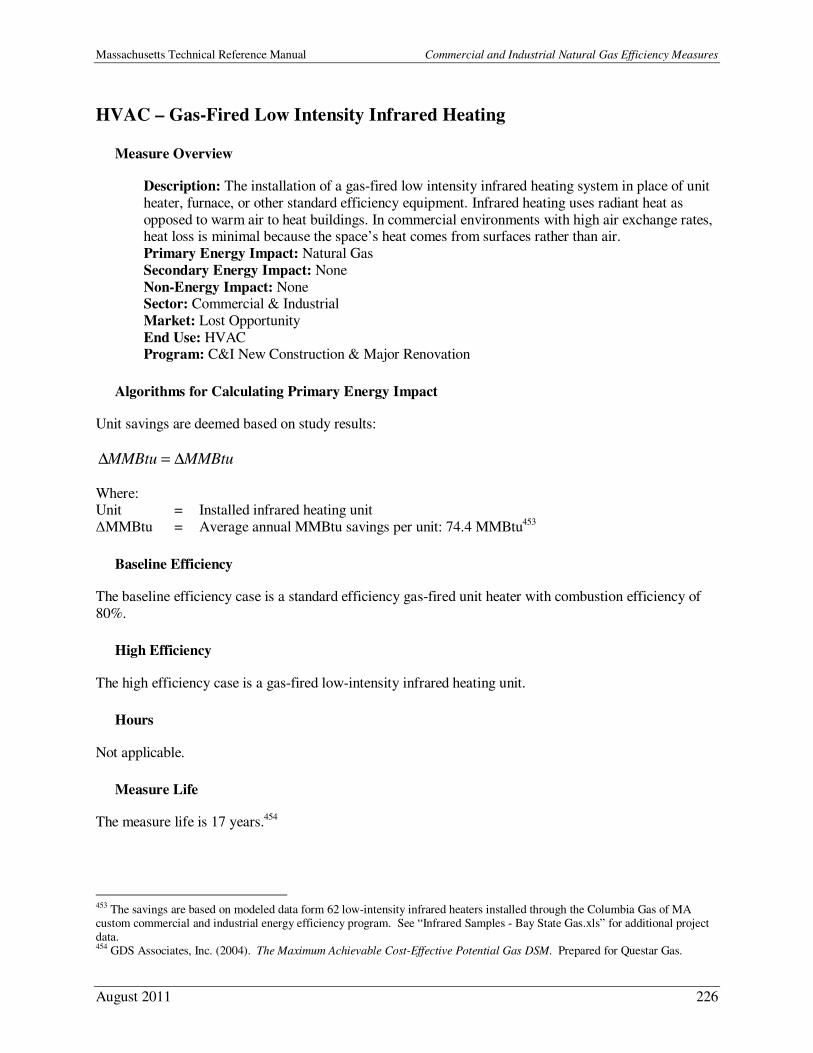
Massachusetts Technical Reference Manual Commercial and Industrial Natural Gas Efficiency Measures
August 2011 226
HVAC – Gas-Fired Low Intensity Infrared Heating
Measure Overview
Description: The installation of a gas-fired low intensity infrared heating system in place of unit
heater, furnace, or other standard efficiency equipment. Infrared heating uses radiant heat as
opposed to warm air to heat buildings. In commercial environments with high air exchange rates, heat loss is minimal because the space’s heat comes from surfaces rather than air.
Primary Energy Impact: Natural Gas
Secondary Energy Impact: None
Non-Energy Impact: None Sector: Commercial & Industrial
Market: Lost Opportunity
End Use: HVAC Program: C&I New Construction & Major Renovation
Algorithms for Calculating Primary Energy Impact
Unit savings are deemed based on study results:
MMBtuMMBtu ∆=∆
Where: Unit = Installed infrared heating unit
∆MMBtu = Average annual MMBtu savings per unit: 74.4 MMBtu453
Baseline Efficiency
The baseline efficiency case is a standard efficiency gas-fired unit heater with combustion efficiency of
80%.
High Efficiency
The high efficiency case is a gas-fired low-intensity infrared heating unit.
Hours
Not applicable.
Measure Life
The measure life is 17 years.454
453 The savings are based on modeled data form 62 low-intensity infrared heaters installed through the Columbia Gas of MA custom commercial and industrial energy efficiency program. See “Infrared Samples - Bay State Gas.xls” for additional project data. 454 GDS Associates, Inc. (2004). The Maximum Achievable Cost-Effective Potential Gas DSM. Prepared for Questar Gas.

Massachusetts Technical Reference Manual Commercial and Industrial Natural Gas Efficiency Measures
August 2011 227
Secondary Energy Impacts
There are no secondary energy impacts for this measure.
Non-Energy Impacts
There are no non-energy impacts for this measure.
Impact Factors for Calculating Adjusted Gross Savings
Measure Name Program ISR SPF RRE RRSP RRWP CFSP CFWP
Low-Intensity Infrared Heating Unit C&I NC 1.00 1.00 1.00 n/a n/a n/a n/a
In-Service Rates All installations have 100% in service rate since programs include verification of equipment installations.
Savings Persistence Factor All PAs use 100% savings persistence factor.
Realization Rates
All PAs use 100% energy realization rate. The summer and winter peak realization rates are not applicable for this measure since there are no electric savings claimed.
Coincidence Factors Not applicable for this measure since no electric savings are claimed.
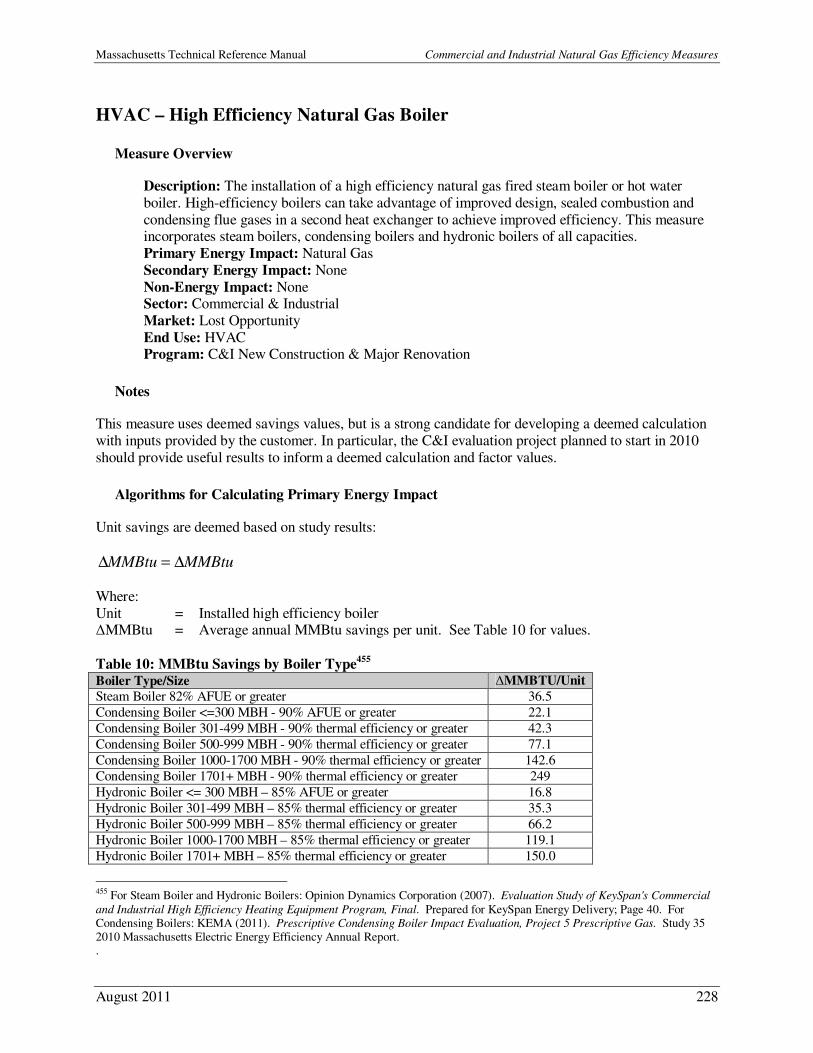
Massachusetts Technical Reference Manual Commercial and Industrial Natural Gas Efficiency Measures
August 2011 228
HVAC – High Efficiency Natural Gas Boiler
Measure Overview
Description: The installation of a high efficiency natural gas fired steam boiler or hot water
boiler. High-efficiency boilers can take advantage of improved design, sealed combustion and
condensing flue gases in a second heat exchanger to achieve improved efficiency. This measure incorporates steam boilers, condensing boilers and hydronic boilers of all capacities.
Primary Energy Impact: Natural Gas
Secondary Energy Impact: None
Non-Energy Impact: None Sector: Commercial & Industrial
Market: Lost Opportunity
End Use: HVAC Program: C&I New Construction & Major Renovation
Notes
This measure uses deemed savings values, but is a strong candidate for developing a deemed calculation
with inputs provided by the customer. In particular, the C&I evaluation project planned to start in 2010
should provide useful results to inform a deemed calculation and factor values.
Algorithms for Calculating Primary Energy Impact
Unit savings are deemed based on study results:
MMBtuMMBtu ∆=∆
Where:
Unit = Installed high efficiency boiler ∆MMBtu = Average annual MMBtu savings per unit. See Table 10 for values.
Table 10: MMBtu Savings by Boiler Type455
Boiler Type/Size ∆MMBTU/Unit
Steam Boiler 82% AFUE or greater 36.5
Condensing Boiler <=300 MBH - 90% AFUE or greater 22.1
Condensing Boiler 301-499 MBH - 90% thermal efficiency or greater 42.3
Condensing Boiler 500-999 MBH - 90% thermal efficiency or greater 77.1
Condensing Boiler 1000-1700 MBH - 90% thermal efficiency or greater 142.6
Condensing Boiler 1701+ MBH - 90% thermal efficiency or greater 249
Hydronic Boiler <= 300 MBH – 85% AFUE or greater 16.8
Hydronic Boiler 301-499 MBH – 85% thermal efficiency or greater 35.3
Hydronic Boiler 500-999 MBH – 85% thermal efficiency or greater 66.2
Hydronic Boiler 1000-1700 MBH – 85% thermal efficiency or greater 119.1
Hydronic Boiler 1701+ MBH – 85% thermal efficiency or greater 150.0
455 For Steam Boiler and Hydronic Boilers: Opinion Dynamics Corporation (2007). Evaluation Study of KeySpan's Commercial
and Industrial High Efficiency Heating Equipment Program, Final. Prepared for KeySpan Energy Delivery; Page 40. For Condensing Boilers: KEMA (2011). Prescriptive Condensing Boiler Impact Evaluation, Project 5 Prescriptive Gas. Study 35 2010 Massachusetts Electric Energy Efficiency Annual Report. .
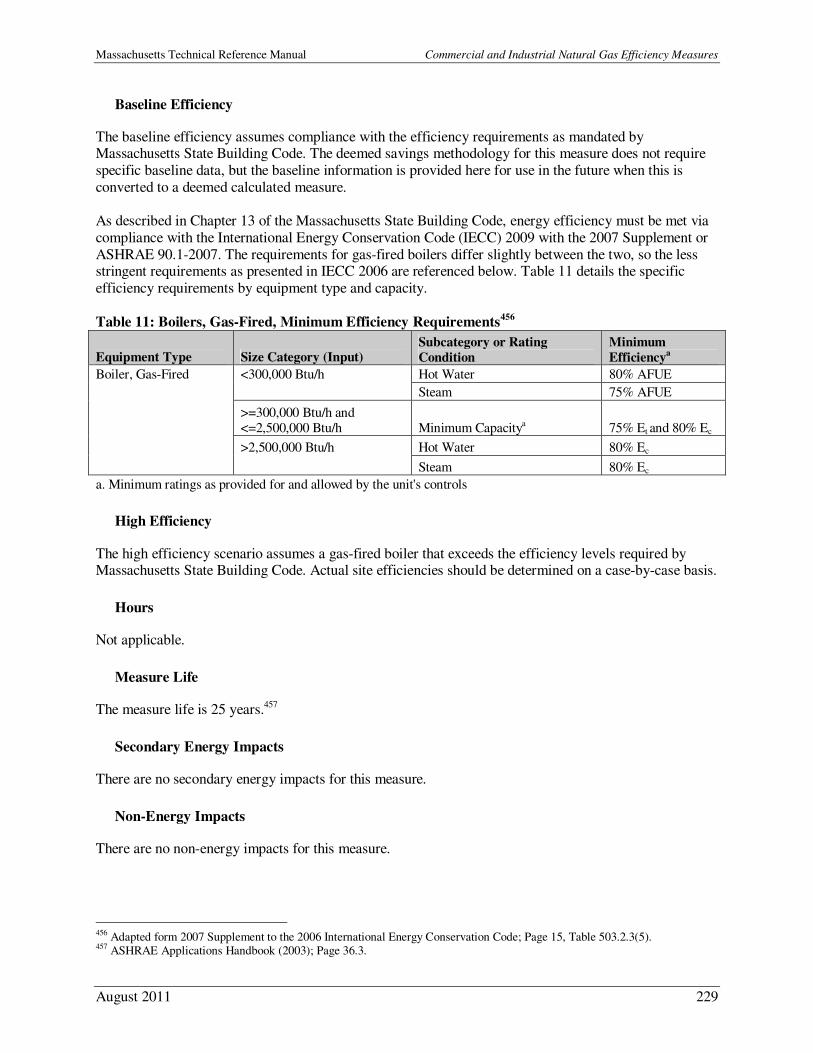
Massachusetts Technical Reference Manual Commercial and Industrial Natural Gas Efficiency Measures
August 2011 229
Baseline Efficiency
The baseline efficiency assumes compliance with the efficiency requirements as mandated by Massachusetts State Building Code. The deemed savings methodology for this measure does not require
specific baseline data, but the baseline information is provided here for use in the future when this is
converted to a deemed calculated measure.
As described in Chapter 13 of the Massachusetts State Building Code, energy efficiency must be met via
compliance with the International Energy Conservation Code (IECC) 2009 with the 2007 Supplement or
ASHRAE 90.1-2007. The requirements for gas-fired boilers differ slightly between the two, so the less stringent requirements as presented in IECC 2006 are referenced below. Table 11 details the specific
efficiency requirements by equipment type and capacity.
Table 11: Boilers, Gas-Fired, Minimum Efficiency Requirements456
Equipment Type Size Category (Input) Subcategory or Rating
Condition
Minimum
Efficiencya
Boiler, Gas-Fired <300,000 Btu/h Hot Water 80% AFUE
Steam 75% AFUE
>=300,000 Btu/h and <=2,500,000 Btu/h Minimum Capacitya 75% Et and 80% Ec
>2,500,000 Btu/h Hot Water 80% Ec
Steam 80% Ec
a. Minimum ratings as provided for and allowed by the unit's controls
High Efficiency
The high efficiency scenario assumes a gas-fired boiler that exceeds the efficiency levels required by Massachusetts State Building Code. Actual site efficiencies should be determined on a case-by-case basis.
Hours
Not applicable.
Measure Life
The measure life is 25 years.457
Secondary Energy Impacts
There are no secondary energy impacts for this measure.
Non-Energy Impacts
There are no non-energy impacts for this measure.
456 Adapted form 2007 Supplement to the 2006 International Energy Conservation Code; Page 15, Table 503.2.3(5). 457 ASHRAE Applications Handbook (2003); Page 36.3.
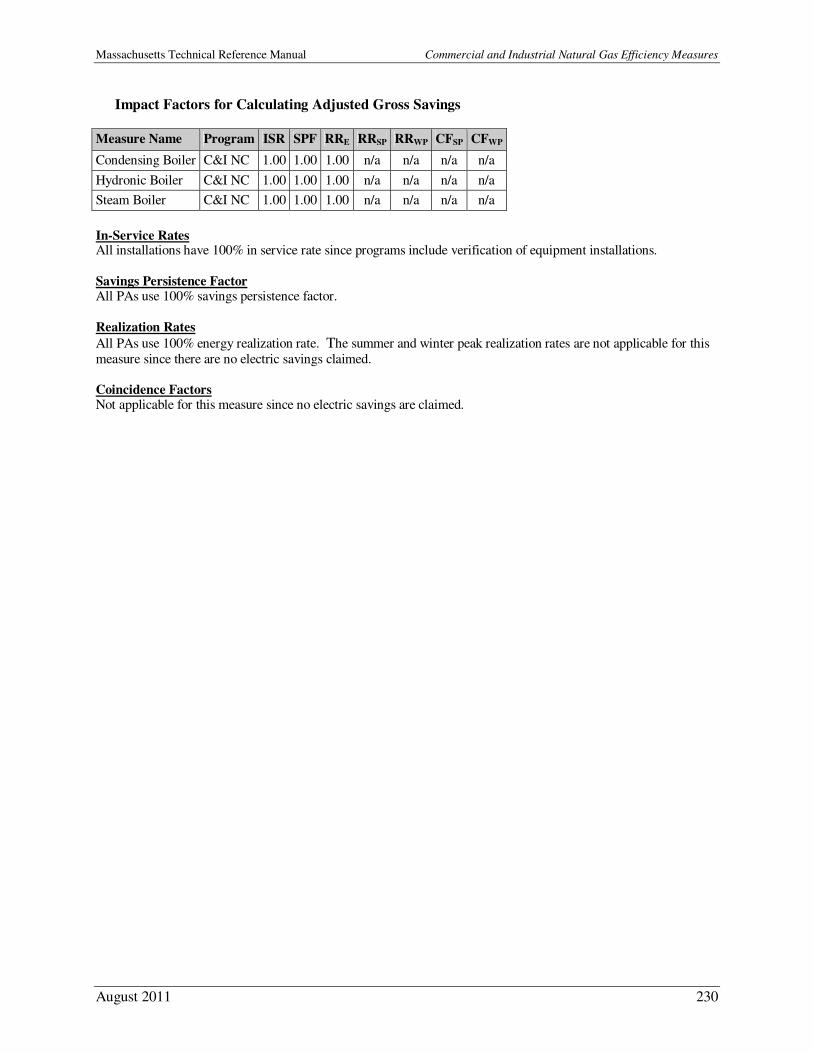
Massachusetts Technical Reference Manual Commercial and Industrial Natural Gas Efficiency Measures
August 2011 230
Impact Factors for Calculating Adjusted Gross Savings
Measure Name Program ISR SPF RRE RRSP RRWP CFSP CFWP
Condensing Boiler C&I NC 1.00 1.00 1.00 n/a n/a n/a n/a
Hydronic Boiler C&I NC 1.00 1.00 1.00 n/a n/a n/a n/a
Steam Boiler C&I NC 1.00 1.00 1.00 n/a n/a n/a n/a
In-Service Rates All installations have 100% in service rate since programs include verification of equipment installations.
Savings Persistence Factor All PAs use 100% savings persistence factor.
Realization Rates
All PAs use 100% energy realization rate. The summer and winter peak realization rates are not applicable for this
measure since there are no electric savings claimed. Coincidence Factors Not applicable for this measure since no electric savings are claimed.
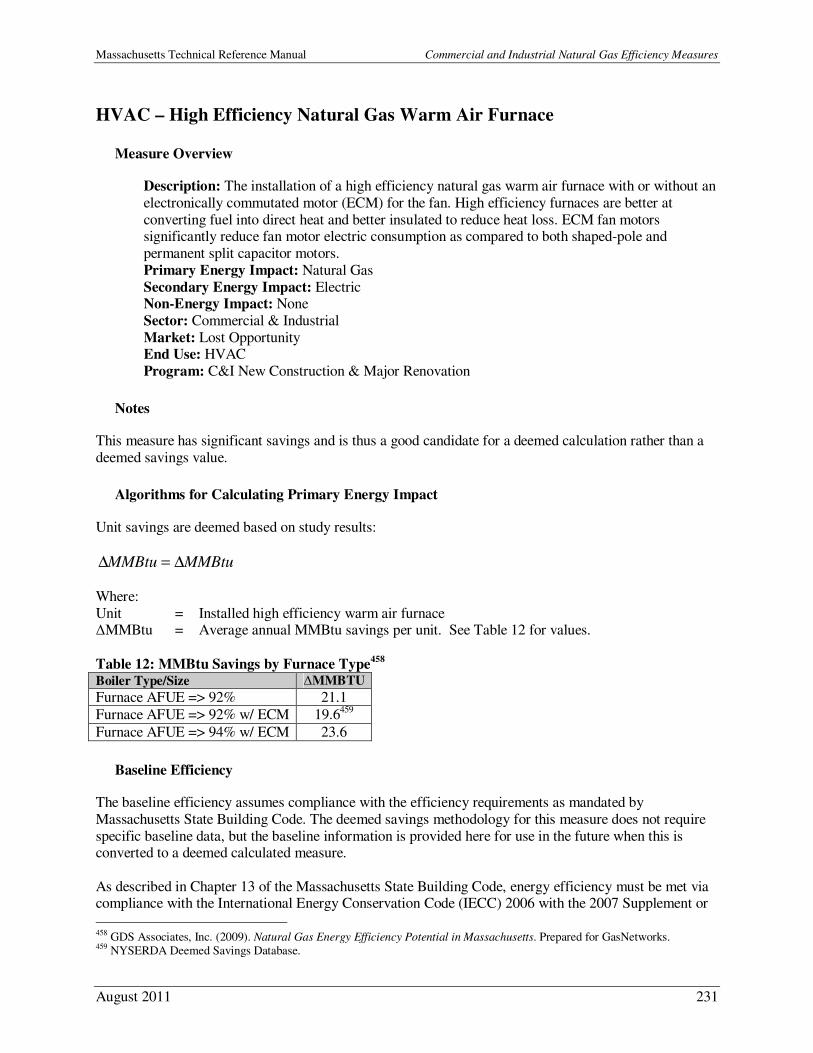
Massachusetts Technical Reference Manual Commercial and Industrial Natural Gas Efficiency Measures
August 2011 231
HVAC – High Efficiency Natural Gas Warm Air Furnace
Measure Overview
Description: The installation of a high efficiency natural gas warm air furnace with or without an
electronically commutated motor (ECM) for the fan. High efficiency furnaces are better at
converting fuel into direct heat and better insulated to reduce heat loss. ECM fan motors significantly reduce fan motor electric consumption as compared to both shaped-pole and
permanent split capacitor motors.
Primary Energy Impact: Natural Gas
Secondary Energy Impact: Electric Non-Energy Impact: None
Sector: Commercial & Industrial
Market: Lost Opportunity End Use: HVAC
Program: C&I New Construction & Major Renovation
Notes
This measure has significant savings and is thus a good candidate for a deemed calculation rather than a
deemed savings value.
Algorithms for Calculating Primary Energy Impact
Unit savings are deemed based on study results:
MMBtuMMBtu ∆=∆
Where:
Unit = Installed high efficiency warm air furnace ∆MMBtu = Average annual MMBtu savings per unit. See Table 12 for values.
Table 12: MMBtu Savings by Furnace Type458
Boiler Type/Size ∆MMBTU
Furnace AFUE => 92% 21.1
Furnace AFUE => 92% w/ ECM 19.6459
Furnace AFUE => 94% w/ ECM 23.6
Baseline Efficiency
The baseline efficiency assumes compliance with the efficiency requirements as mandated by
Massachusetts State Building Code. The deemed savings methodology for this measure does not require
specific baseline data, but the baseline information is provided here for use in the future when this is converted to a deemed calculated measure.
As described in Chapter 13 of the Massachusetts State Building Code, energy efficiency must be met via compliance with the International Energy Conservation Code (IECC) 2006 with the 2007 Supplement or
458 GDS Associates, Inc. (2009). Natural Gas Energy Efficiency Potential in Massachusetts. Prepared for GasNetworks. 459 NYSERDA Deemed Savings Database.
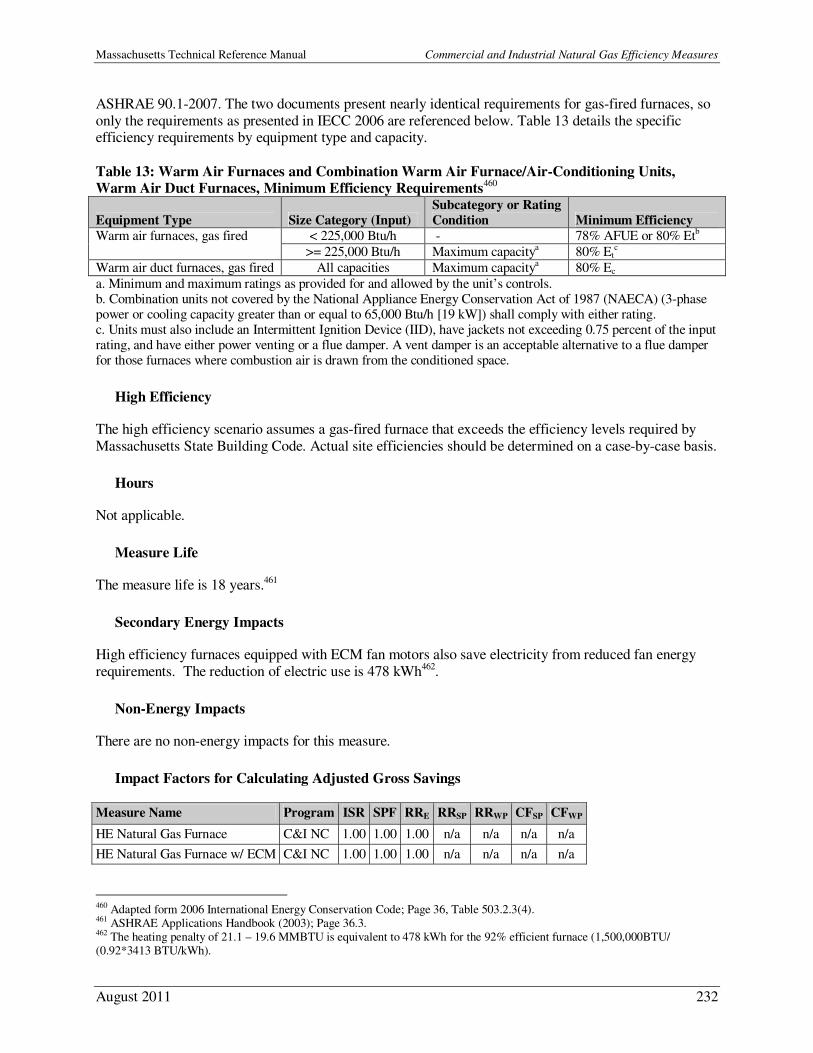
Massachusetts Technical Reference Manual Commercial and Industrial Natural Gas Efficiency Measures
August 2011 232
ASHRAE 90.1-2007. The two documents present nearly identical requirements for gas-fired furnaces, so
only the requirements as presented in IECC 2006 are referenced below. Table 13 details the specific efficiency requirements by equipment type and capacity.
Table 13: Warm Air Furnaces and Combination Warm Air Furnace/Air-Conditioning Units,
Warm Air Duct Furnaces, Minimum Efficiency Requirements460
Equipment Type Size Category (Input)
Subcategory or Rating
Condition Minimum Efficiency
Warm air furnaces, gas fired < 225,000 Btu/h - 78% AFUE or 80% Etb
>= 225,000 Btu/h Maximum capacitya 80% Etc
Warm air duct furnaces, gas fired All capacities Maximum capacitya 80% Ec
a. Minimum and maximum ratings as provided for and allowed by the unit’s controls. b. Combination units not covered by the National Appliance Energy Conservation Act of 1987 (NAECA) (3-phase power or cooling capacity greater than or equal to 65,000 Btu/h [19 kW]) shall comply with either rating. c. Units must also include an Intermittent Ignition Device (IID), have jackets not exceeding 0.75 percent of the input rating, and have either power venting or a flue damper. A vent damper is an acceptable alternative to a flue damper for those furnaces where combustion air is drawn from the conditioned space.
High Efficiency
The high efficiency scenario assumes a gas-fired furnace that exceeds the efficiency levels required by
Massachusetts State Building Code. Actual site efficiencies should be determined on a case-by-case basis.
Hours
Not applicable.
Measure Life
The measure life is 18 years.461
Secondary Energy Impacts
High efficiency furnaces equipped with ECM fan motors also save electricity from reduced fan energy
requirements. The reduction of electric use is 478 kWh462.
Non-Energy Impacts
There are no non-energy impacts for this measure.
Impact Factors for Calculating Adjusted Gross Savings
Measure Name Program ISR SPF RRE RRSP RRWP CFSP CFWP
HE Natural Gas Furnace C&I NC 1.00 1.00 1.00 n/a n/a n/a n/a
HE Natural Gas Furnace w/ ECM C&I NC 1.00 1.00 1.00 n/a n/a n/a n/a
460 Adapted form 2006 International Energy Conservation Code; Page 36, Table 503.2.3(4). 461 ASHRAE Applications Handbook (2003); Page 36.3. 462 The heating penalty of 21.1 – 19.6 MMBTU is equivalent to 478 kWh for the 92% efficient furnace (1,500,000BTU/ (0.92*3413 BTU/kWh).

Massachusetts Technical Reference Manual Commercial and Industrial Natural Gas Efficiency Measures
August 2011 233
In-Service Rates All installations have 100% in service rate since programs include verification of equipment installations.
Savings Persistence Factor All PAs use 100% savings persistence factor. Realization Rates
All PAs use 100% energy realization rate. The summer and winter peak realization rates are not applicable for this
measure since there are no electric savings claimed.
Coincidence Factors Not applicable for this measure since no electric savings are claimed.

Massachusetts Technical Reference Manual Commercial and Industrial Natural Gas Efficiency Measures
August 2011 234
HVAC/Hot Water – Combined High Efficiency Boiler and Water Heater
Measure Overview
Description: This measure promotes the installation of a combined high-efficiency boiler and
water heating unit. Combined boiler and water heating systems are more efficient than separate systems because they eliminate the standby heat losses of an additional tank.
Primary Energy Impact: Natural Gas
Secondary Energy Impact: None Non-Energy Impact: None
Sector: Commercial & Industrial
Market: Lost Opportunity
End Use: HVAC, Hot Water
Program: New Construction & Major Renovation Commercial
Algorithms for Calculating Primary Energy Impact
Unit savings are deemed based on study results:
MMBtuMMBtu ∆=∆
Where:
Unit = Installed high efficiency boiler/water heater combo units ∆MMBtu = Average annual MMBtu savings per unit. See Table 14 for values.
Table 14: MMBtu Savings by Boiler/Water Heater Combo Type463
Boiler/Water Heater Combo Type ∆MMBTU
Integrated water heater/condensing boiler (0.86 EF, 0.85 AFUE) 20.0
Integrated water heater/condensing boiler (0.86 EF, 0.90 AFUE) 24.6
Baseline Efficiency
The baseline efficiency case is a standard efficiency gas-fired storage tank hot water heater with a separate standard efficiency boiler for space heating purposes.
High Efficiency
The high efficiency case is a condensing, integrated water heater/boiler with an AFUE of >=90% or
>=85%.
Hours
Not applicable.
463 Based on an analysis conducted by Summit Blue, Inc. See “SB Gas Networks Calculations for Combined HVAC and DHW.xlsx” for source calculations.
Massachusetts Technical Reference Manual Commercial and Industrial Natural Gas Efficiency Measures
August 2011 235
Measure Life
The measure life is 25 years.464
Secondary Energy Impacts
There are no secondary energy impacts for this measure.
Non-Energy Impacts
There are no non-energy impacts for this measure.
Impact Factors for Calculating Adjusted Gross Savings
Measure Name Program ISR SPF RRE RRSP RRWP CFSP CFWP
Integrated Water Heater/Condensing Boiler C&I NC 1.00 1.00 1.00 n/a n/a n/a n/a
In-Service Rates All installations have 100% in service rate since programs include verification of equipment installations.
Savings Persistence Factor All PAs use 100% savings persistence factor.
Realization Rates
All PAs use 100% energy realization rate. The summer and winter peak realization rates are not applicable for this measure since there are no electric savings claimed.
Coincidence Factors Not applicable for this measure since no electric savings are claimed.
464 ASHRAE Applications Handbook (2003); Page 36.3, assumes combined boiler and water heating systems have a measure life similar to a typical boiler.
Massachusetts Technical Reference Manual Commercial and Industrial Natural Gas Efficiency Measures
August 2011 236
Hot Water – Condensing Stand-Alone Water Heater
Measure Overview
Description: Installation of a condensing stand alone water heater with a capacity between 75-
300 MBH and thermal efficiency of 95% or greater.
Primary Energy Impact: Natural Gas Secondary Energy Impact: None
Non-Energy Impact: None
Sector: Commercial & Industrial
Market: Lost Opportunity End Use: Hot water
Program: C&I New Construction & Major Renovation
Algorithms for Calculating Primary Energy Impact
Unit savings are deemed based on study results:
MMBtuMMBtu ∆=∆
Where:
Unit = Installed condensing stand-alone water heater
∆MMBtu = Average annual MMBtu savings per unit (75,000 – 300,000 BTU) installed: 25.0 MMBtu465
Baseline Efficiency
The baseline efficiency case is a stand alone tank water heater with a thermal efficiency of 80%.466
High Efficiency
The high efficiency case is a condensing stand alone commercial water heater with a thermal efficiency of
95% or greater and a capacity between 75,000 Btu and 300,000 Btu.
Hours
Not applicable.
Measure Life
The measure life is 15 years.467
465 GDS Associates, Inc. (2009). Natural Gas Energy Efficiency Potential in Massachusetts. Prepared for GasNetworks; Page 2 of Appendix B-2, measure GDS C-WH-3. The GDS study references “ESource (2007). Gas Fired Water Heater Screening
Tool. http://www.esource.com/BEA/demo/PDF/P_PA_41.pdf. Accessed on 10/22/10; used 0.96 Thermal Efficiency and 250 gallons per day.” 466 ASHRAE Standard 90.1-2007; Table 7.8 467 GDS Associates, Inc. (2009). Natural Gas Energy Efficiency Potential in Massachusetts. Prepared for GasNetworks; Page 2 of Appendix B-2, measure GDS C-WH-4. The GDS study references “ACEEE (2004). Emerging technologies and practices; W1 - pg 46.”
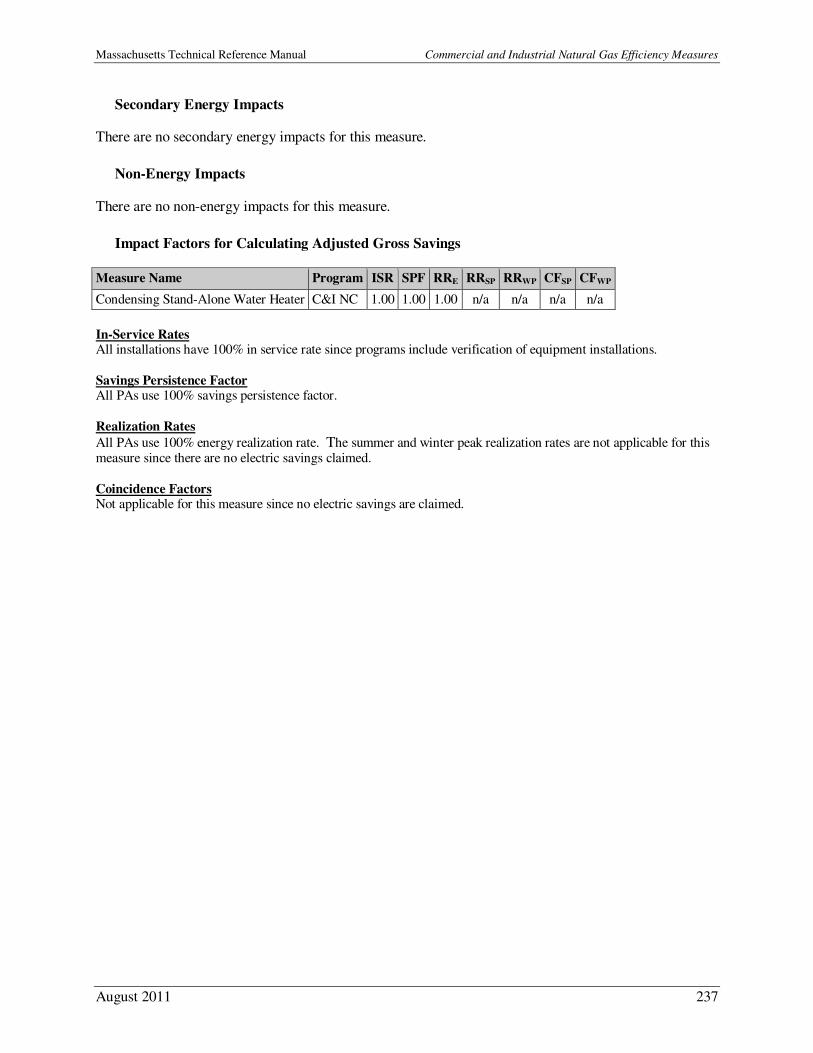
Massachusetts Technical Reference Manual Commercial and Industrial Natural Gas Efficiency Measures
August 2011 237
Secondary Energy Impacts
There are no secondary energy impacts for this measure.
Non-Energy Impacts
There are no non-energy impacts for this measure.
Impact Factors for Calculating Adjusted Gross Savings
Measure Name Program ISR SPF RRE RRSP RRWP CFSP CFWP
Condensing Stand-Alone Water Heater C&I NC 1.00 1.00 1.00 n/a n/a n/a n/a
In-Service Rates All installations have 100% in service rate since programs include verification of equipment installations.
Savings Persistence Factor All PAs use 100% savings persistence factor.
Realization Rates
All PAs use 100% energy realization rate. The summer and winter peak realization rates are not applicable for this measure since there are no electric savings claimed.
Coincidence Factors Not applicable for this measure since no electric savings are claimed.
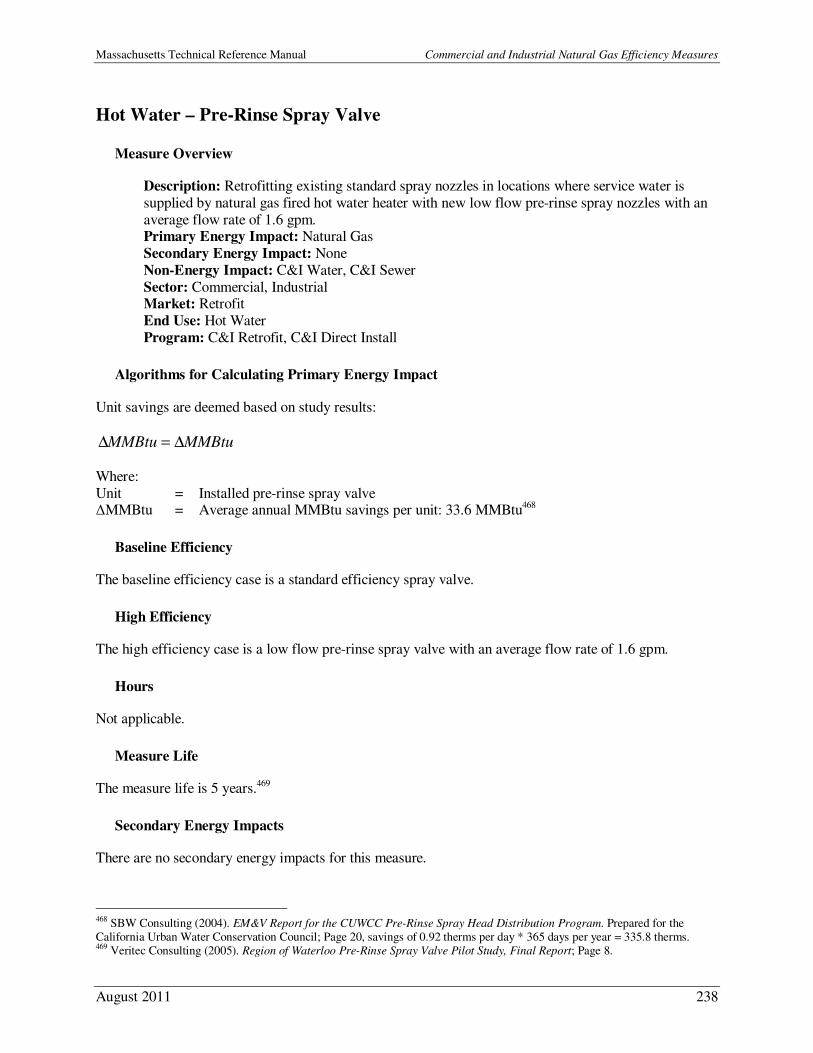
Massachusetts Technical Reference Manual Commercial and Industrial Natural Gas Efficiency Measures
August 2011 238
Hot Water – Pre-Rinse Spray Valve
Measure Overview
Description: Retrofitting existing standard spray nozzles in locations where service water is
supplied by natural gas fired hot water heater with new low flow pre-rinse spray nozzles with an
average flow rate of 1.6 gpm. Primary Energy Impact: Natural Gas
Secondary Energy Impact: None
Non-Energy Impact: C&I Water, C&I Sewer
Sector: Commercial, Industrial Market: Retrofit
End Use: Hot Water
Program: C&I Retrofit, C&I Direct Install
Algorithms for Calculating Primary Energy Impact
Unit savings are deemed based on study results:
MMBtuMMBtu ∆=∆
Where:
Unit = Installed pre-rinse spray valve ∆MMBtu = Average annual MMBtu savings per unit: 33.6 MMBtu468
Baseline Efficiency
The baseline efficiency case is a standard efficiency spray valve.
High Efficiency
The high efficiency case is a low flow pre-rinse spray valve with an average flow rate of 1.6 gpm.
Hours
Not applicable.
Measure Life
The measure life is 5 years.469
Secondary Energy Impacts
There are no secondary energy impacts for this measure.
468 SBW Consulting (2004). EM&V Report for the CUWCC Pre-Rinse Spray Head Distribution Program. Prepared for the California Urban Water Conservation Council; Page 20, savings of 0.92 therms per day * 365 days per year = 335.8 therms. 469 Veritec Consulting (2005). Region of Waterloo Pre-Rinse Spray Valve Pilot Study, Final Report; Page 8.
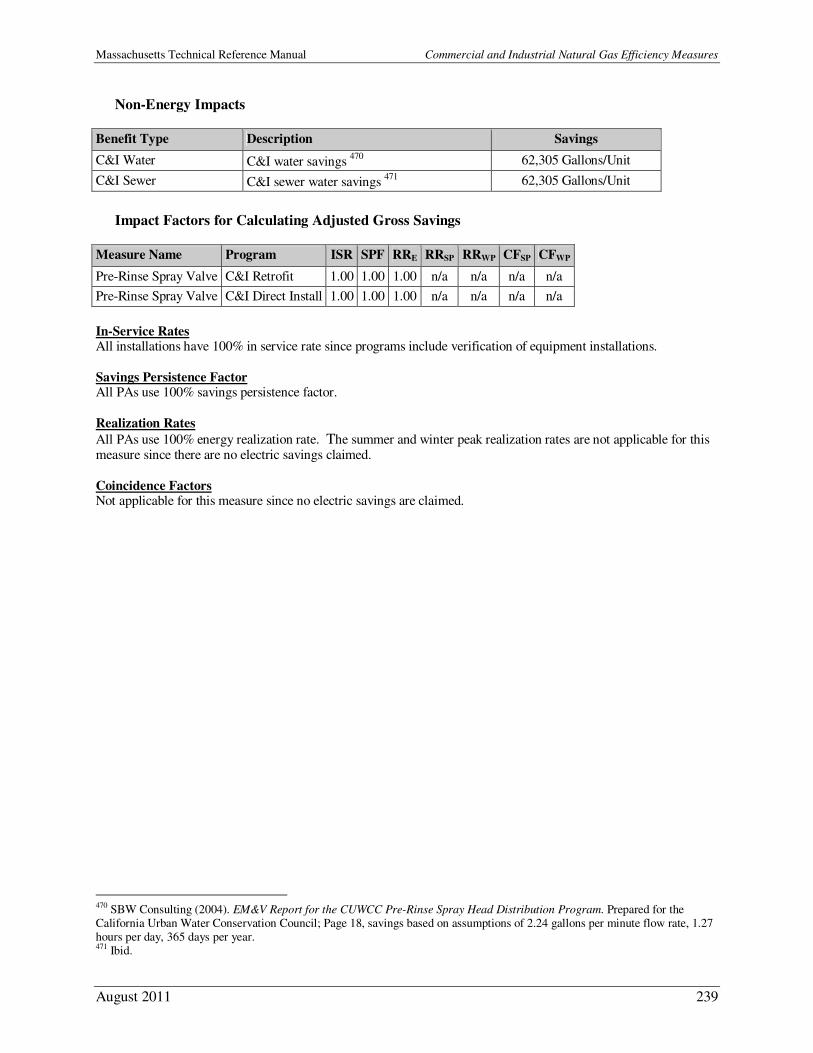
Massachusetts Technical Reference Manual Commercial and Industrial Natural Gas Efficiency Measures
August 2011 239
Non-Energy Impacts
Benefit Type Description Savings
C&I Water C&I water savings 470 62,305 Gallons/Unit
C&I Sewer C&I sewer water savings 471 62,305 Gallons/Unit
Impact Factors for Calculating Adjusted Gross Savings
Measure Name Program ISR SPF RRE RRSP RRWP CFSP CFWP
Pre-Rinse Spray Valve C&I Retrofit 1.00 1.00 1.00 n/a n/a n/a n/a
Pre-Rinse Spray Valve C&I Direct Install 1.00 1.00 1.00 n/a n/a n/a n/a
In-Service Rates All installations have 100% in service rate since programs include verification of equipment installations.
Savings Persistence Factor All PAs use 100% savings persistence factor.
Realization Rates
All PAs use 100% energy realization rate. The summer and winter peak realization rates are not applicable for this measure since there are no electric savings claimed.
Coincidence Factors Not applicable for this measure since no electric savings are claimed.
470 SBW Consulting (2004). EM&V Report for the CUWCC Pre-Rinse Spray Head Distribution Program. Prepared for the California Urban Water Conservation Council; Page 18, savings based on assumptions of 2.24 gallons per minute flow rate, 1.27 hours per day, 365 days per year. 471 Ibid.

Massachusetts Technical Reference Manual Commercial and Industrial Natural Gas Efficiency Measures
August 2011 240
Hot Water – Repair/Replace Malfunctioning Steam Trap
Measure Overview
Description: Repair or replace malfunctioning steam traps.
Primary Energy Impact: Natural Gas
Secondary Energy Impact: None Non-Energy Impact: None
Sector: Commercial & Industrial
Market: Retrofit
End Use: HVAC, Process Program: C&I Retrofit
Algorithms for Calculating Primary Energy Impact
Unit savings are deemed based on study results:
MMBtuMMBtu ∆=∆
Where: Unit = Repaired/replaced steam trap
∆MMBtu = Average annual MMBtu savings per unit: 25.3 MMBtu472
Baseline Efficiency
The baseline efficiency case is a failed steam trap.
High Efficiency
The high efficiency case is a repaired or replaced steam trap.
Hours
Not applicable.
Measure Life
The measure life is 1 year.473
Secondary Energy Impacts
There are no secondary energy impacts for this measure.
Non-Energy Impacts
There are no non-energy impacts for this measure.
472 Assumption based on historical steam trap surveys. 473 Massachusetts Common Assumption.
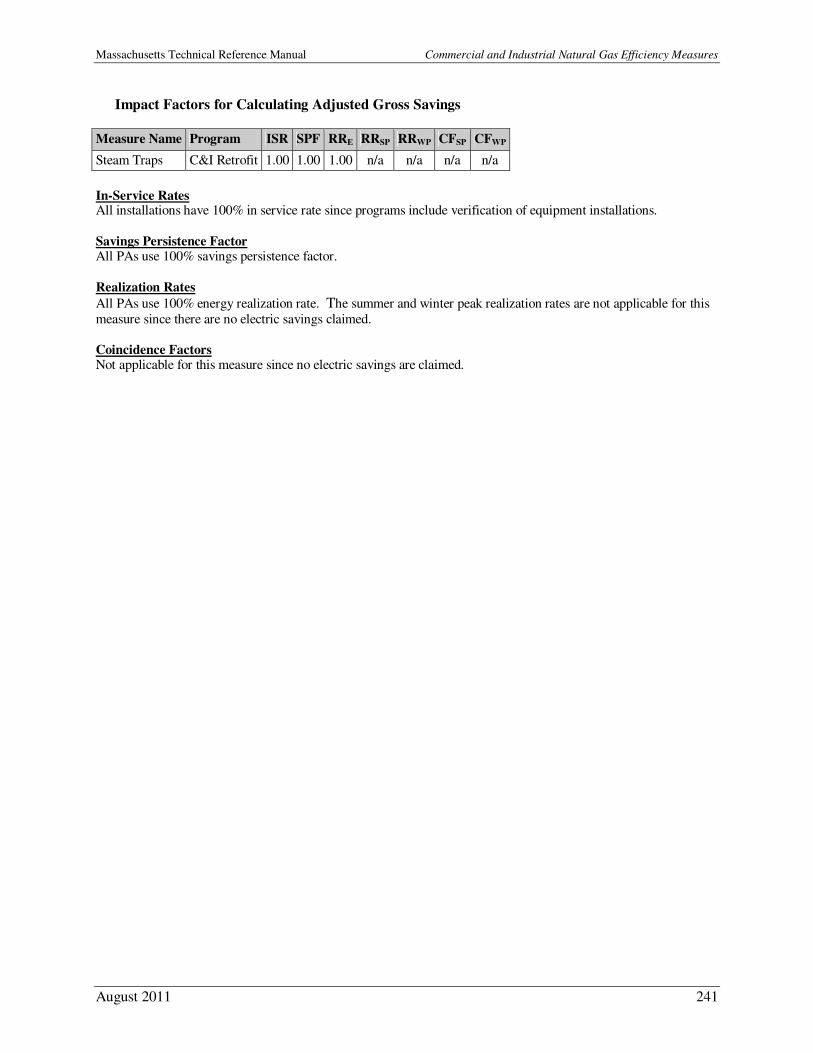
Massachusetts Technical Reference Manual Commercial and Industrial Natural Gas Efficiency Measures
August 2011 241
Impact Factors for Calculating Adjusted Gross Savings
Measure Name Program ISR SPF RRE RRSP RRWP CFSP CFWP
Steam Traps C&I Retrofit 1.00 1.00 1.00 n/a n/a n/a n/a
In-Service Rates All installations have 100% in service rate since programs include verification of equipment installations.
Savings Persistence Factor All PAs use 100% savings persistence factor.
Realization Rates
All PAs use 100% energy realization rate. The summer and winter peak realization rates are not applicable for this
measure since there are no electric savings claimed. Coincidence Factors Not applicable for this measure since no electric savings are claimed.
Massachusetts Technical Reference Manual Commercial and Industrial Natural Gas Efficiency Measures
August 2011 242
Hot Water – Low Flow Shower Heads
Measure Overview
Description: Installation of a low flow showerhead with a flow rate of 1.5 gpm or less in a
commercial setting with service water heated by natural gas.
Primary Energy Impact: Natural Gas Secondary Energy Impact: None
Non-Energy Impact: C&I Water, C&I Sewer
Sector: Commercial
Market: Retrofit End Use: Hot water
Program: C&I Direct Install
Algorithms for Calculating Primary Energy Impact
Unit savings are deemed based on study results:
MMBtuMMBtu ∆=∆
Where:
Unit = Installed low flow shower head
∆MMBtu = Average annual MMBtu savings per unit: 5.2 MMBtu474
Baseline Efficiency
The baseline efficiency case is a 2.5 gpm showerhead.
High Efficiency
The high efficiency case is a 1.5 gpm showerhead.
Hours
The savings estimates for this measure are determined empirically in terms of units installed and so the
equivalent heating full load hours are not directly used, however, the calculator used to determine the
deemed savings uses a default operation of 20 minutes a day, 365 days a year.
Measure Life
The measure life is 10 years.475
474US DOE: Federal Energy Management Program (2010). Cost Calculator for Faucets & Shower Heads. http://www1.eere.energy.gov/femp/technologies/eep_faucets_showerheads_calc.html#output. Accessed on 4/6/2010 using baseline 2.5 gpm and retrofit model at 1.5 gpm. Also supported by: GDS Associates, Inc. (2009). Natural Gas Energy Efficiency
Potential in Massachusetts. Prepared for GasNetworks; measure C-WH-15. 475 US DOE: Federal Energy Management Program (2010). Cost Calculator for Faucets & Shower Heads. http://www1.eere.energy.gov/femp/technologies/eep_faucets_showerheads_calc.html#output. Accessed on 4/6/2010; Optimal Energy, ACEEE, VEIC, Resource Insight and Energy & Environmental Analysis (2006). Natural Gas Energy Efficiency Resource Development Potential in New York- Final Report. Prepared for NYSERDA; Page 27, Appendix B.
Massachusetts Technical Reference Manual Commercial and Industrial Natural Gas Efficiency Measures
August 2011 243
Secondary Energy Impacts
There are no secondary energy impacts for this measure.
Non-Energy Impacts
Benefit Type Description Savings
C&I Water C&I water savings 7,300 Gallons/Unit
C&I Sewer C&I sewer water savings 7,300 Gallons/Unit
Impact Factors for Calculating Adjusted Gross Savings
Measure Name Program ISR SPF RRE RRSP RRWP CFSP CFWP
Low Flow Shower Heads C&I Direct Install 1.00 1.00 1.00 n/a n/a n/a n/a
In-Service Rates All installations have 100% in service rate since programs include verification of equipment installations.
Savings Persistence Factor All PAs use 100% savings persistence factor.
Realization Rates
All PAs use 100% energy realization rate. The summer and winter peak realization rates are not applicable for this measure since there are no electric savings claimed.
Coincidence Factors Not applicable for this measure since no electric savings are claimed.
Massachusetts Technical Reference Manual Commercial and Industrial Natural Gas Efficiency Measures
August 2011 244
Hot Water – Faucet Aerator
Measure Overview
Description: Installation of a faucet aerator with a flow rate of 1.5 gpm or less on an existing
faucet with high flow in a commercial setting with service water heated by natural gas.
Primary Energy Impact: Natural Gas Secondary Energy Impact: None
Non-Energy Impact: C&I Water, C&I Sewer
Sector: Commercial
Market: Retrofit End Use: Hot water
Program: C&I Direct Install
Algorithms for Calculating Primary Energy Impact
Unit savings are deemed based on study results:
MMBtuMMBtu ∆=∆
Where:
Unit = Installed faucet aerator
∆MMBtu = Average annual MMBtu savings per unit: 1.7 MMBtu476
Baseline Efficiency
The baseline efficiency case is a 2.2 gpm faucet.
High Efficiency
The high efficiency case is a faucet with 1.5 gpm or less aerator installed.
Hours
The savings estimates for this measure are determined empirically in terms of units installed and so the
equivalent heating full load hours are not directly used, however, the calculator used to determine the
deemed savings uses a default operation of 30 minutes a day, 260 days a year.
Measure Life
The measure life is 10 years.477
476 US DOE: Federal Energy Management Program (2010). Cost Calculator for Faucets & Shower Heads. http://www1.eere.energy.gov/femp/technologies/eep_faucets_showerheads_calc.html#output. Accessed on 4/6/2010 using baseline 2.2 gpm and retrofit model at 1.5 gpm. Same results also form: GDS Associates, Inc. (2009). Natural Gas Energy
Efficiency Potential in Massachusetts. Prepared for GasNetworks; measure C-WH-15. 477 US DOE: Federal Energy Management Program (2010). Cost Calculator for Faucets & Shower Heads. http://www1.eere.energy.gov/femp/technologies/eep_faucets_showerheads_calc.html#output. Accessed on 4/6/2010; Optimal Energy, ACEEE, VEIC, Resource Insight and Energy & Environmental Analysis (2006). Natural Gas Energy Efficiency Resource Development Potential in New York- Final Report. Prepared for NYSERDA; Page 27, Appendix B.
Massachusetts Technical Reference Manual Commercial and Industrial Natural Gas Efficiency Measures
August 2011 245
Secondary Energy Impacts
There are no secondary energy impacts for this measure.
Non-Energy Impacts
Benefit Type Description Savings
C&I Water C&I water savings 5,460 Gallons/Unit
C&I Sewer C&I sewer water savings 5,460 Gallons/Unit
Impact Factors for Calculating Adjusted Gross Savings
Measure Name Program ISR SPF RRE RRSP RRWP CFSP CFWP
Faucet Aerator C&I Direct Install 1.00 1.00 1.00 1.00 1.00 n/a n/a
In-Service Rates All installations have 100% in service rate since programs include verification of equipment installations.
Savings Persistence Factor All PAs use 100% savings persistence factor.
Realization Rates
All PAs use 100% energy realization rate. The summer and winter peak realization rates are not applicable for this measure since there are no electric savings claimed.
Coincidence Factors Not applicable for this measure since no electric savings are claimed.
Massachusetts Technical Reference Manual Commercial and Industrial Natural Gas Efficiency Measures
August 2011 246
Hot Water – High Efficiency Indirect Water Heater
Measure Overview
Description: The installation of a high-efficiency indirect water heater. Indirect water heaters use
a storage tank that is heated by the main boiler. The energy stored by the water tank allows the
boiler to turn off and on less often, saving considerable energy. Primary Energy Impact: Natural Gas
Secondary Energy Impact: None
Non-Energy Impact: None
Sector: Commercial & Industrial Market: Lost Opportunity
End Use: Hot Water
Program: C&I New Construction & Major Renovation
Algorithms for Calculating Primary Energy Impact
Unit savings are deemed based on study results:
MMBtuMMBtu ∆=∆
Where:
Unit = Installed high efficiency indirect water heater ∆MMBtu = Average annual MMBtu savings per unit: 30.4 MMBtu478
Baseline Efficiency
The baseline efficiency case is a code compliant gas-fired storage water heater with an assumed energy
factor of 0.59. The baseline efficiency case assumes compliance with the efficiency requirements as
mandated by Massachusetts State Building Code. As described in Chapter 13 of the State Building Code, energy efficiency must be met via compliance with the International Energy Conservation Code (IECC)
2009 with the 2007 Supplement or ASHRAE 90.1-2007. The two documents present nearly identical
requirements for gas-fired storage water heaters. The assumed efficiency slightly exceeds the minimum
required by code to reflect the typical baseline unit available in the marketplace.
High Efficiency
The high efficiency scenario is an indirect water heater with a Combined Appliance Efficiency (CAE) of
85% or greater.
Hours
Not applicable.
478 GDS Associates, Inc. (2009). Natural Gas Energy Efficiency Potential in Massachusetts. Prepared for GasNetworks; Appendix B-2.

Massachusetts Technical Reference Manual Commercial and Industrial Natural Gas Efficiency Measures
August 2011 247
Measure Life
The measure life is 15 years.479
Secondary Energy Impacts
There are no secondary energy impacts for this measure.
Non-Energy Impacts
There are no non-energy impacts for this measure.
Impact Factors for Calculating Adjusted Gross Savings
Measure Name Program ISR SPF RRE RRSP RRWP CFSP CFWP
HE Indirect Water Heater C&I NC 1.00 1.00 1.00 n/a n/a n/a n/a
In-Service Rates All installations have 100% in service rate since programs include verification of equipment installations.
Savings Persistence Factor All PAs use 100% savings persistence factor.
Realization Rates
All PAs use 100% energy realization rate. The summer and winter peak realization rates are not applicable for this measure since there are no electric savings claimed.
Coincidence Factors Not applicable for this measure since no electric savings are claimed.
479 Ibid.
Massachusetts Technical Reference Manual Commercial and Industrial Natural Gas Efficiency Measures
August 2011 248
Hot Water – High Efficiency Tankless Water Heater
Measure Overview
Description: The installation of a high-efficiency tankless water heater with electronic ignition
and an Energy Factor of at least 0.82. Tankless water heaters circulate water through a heat
exchanger to be heated for immediate use, eliminating the standby heat loss associated with a storage tank.
Primary Energy Impact: Natural Gas
Secondary Energy Impact: None
Non-Energy Impact: None Sector: Commercial & Industrial
Market: Lost Opportunity
End Use: Hot Water Program: C&I New Construction & Major Renovation
Algorithms for Calculating Primary Energy Impact
Unit savings are deemed based on study results:
MMBtuMMBtu ∆=∆
Where: Unit = Installed high efficiency tankless water heater
∆MMBtu = Average annual MMBtu savings per unit: 7.1 MMBtu480
Baseline Efficiency
The baseline efficiency case is a code compliant gas-fired storage water heater with an assumed Energy
Factor of 0.59. The baseline efficiency assumes compliance with the efficiency requirements as mandated by Massachusetts State Building Code. As described in Chapter 13 of the aforementioned document,
energy efficiency must be met via compliance with the International Energy Conservation Code (IECC)
2006 with the 2007 Supplement or ASHRAE 90.1-2007. The two documents present nearly identical
requirements for gas-fired storage water heaters. The assumed efficiency slightly exceeds the minimum required by code to reflect the typical baseline unit available in the marketplace.
High Efficiency
The high efficiency equipment is a gas-fired instantaneous hot water heater with an Energy Factor of at
least 0.82.
Hours
Not applicable.
480 GDS Associates, Inc. (2009). Natural Gas Energy Efficiency Potential in Massachusetts. Prepared for GasNetworks; Appendix B-2.

Massachusetts Technical Reference Manual Commercial and Industrial Natural Gas Efficiency Measures
August 2011 249
Measure Life
The measure life is 20 years.481
Secondary Energy Impacts
There are no secondary energy impacts for this measure.
Non-Energy Impacts
There are no non-energy impacts for this measure.
Impact Factors for Calculating Adjusted Gross Savings
Measure Name Program ISR SPF RRE RRSP RRWP CFSP CFWP
Tankless Water Heater C&I NC 1.00 1.00 1.00 n/a n/a n/a n/a
In-Service Rates All installations have 100% in service rate since programs include verification of equipment installations.
Savings Persistence Factor All PAs use 100% savings persistence factor.
Realization Rates
All PAs use 100% energy realization rate. The summer and winter peak realization rates are not applicable for this measure since there are no electric savings claimed.
Coincidence Factors Not applicable for this measure since no electric savings are claimed.
481 Hewitt, D. Pratt, J. & Smith, G. (2005) Tankless Gas Water Heaters: Oregon Market Status. Prepared for the Energy Trust of Oregon.
Massachusetts Technical Reference Manual Commercial and Industrial Natural Gas Efficiency Measures
August 2011 250
Hot Water – High Efficiency Free Standing Water Heater
Measure Overview
Description: The installation of a high efficiency ENERGY STAR® freestanding water heater
with an Energy Factor of at least 0.62, a nominal input of 75,000 BTU/hour, or less and a rated storage volume from 20 to 100 gallons.
Primary Energy Impact: Natural Gas
Secondary Energy Impact: None Non-Energy Impact: None
Sector: Commercial & Industrial
Market: Lost Opportunity End Use: Hot Water
Program: C&I New Construction & Major Renovation
Algorithms for Calculating Primary Energy Impact
Unit savings are deemed based on study results:
MMBtuMMBtu ∆=∆
Where: Unit = Installed high efficiency free-standing water heater
∆MMBtu = Average annual MMBtu savings per unit: 0.76 MMBtu482
Baseline Efficiency
The baseline efficiency case is a code compliant gas-fired free standing water heater with an assumed
Energy Factor of 0.594. The baseline efficiency assumes compliance with the efficiency requirements as mandated by Massachusetts State Building Code. As described in Chapter 13 of the aforementioned
document, energy efficiency must be met via compliance with the International Energy Conservation
Code (IECC) 2006 with the 2007 Supplement or ASHRAE 90.1-2007. The two documents present nearly identical requirements for gas-fired storage water heaters. The assumed efficiency slightly exceeds the
minimum required by code to reflect the typical baseline unit available in the marketplace.
High Efficiency
The high efficiency case is an ENERGY STAR® gas-fired freestanding hot water heater with an Energy
Factor of at least 0.62 and a nominal input of 75,000 BTU/hour.
Hours
Not applicable.
482 GDS Associates, Inc. (2009). Natural Gas Energy Efficiency Potential in Massachusetts. Prepared for GasNetworks; Appendix A-2.
Massachusetts Technical Reference Manual Commercial and Industrial Natural Gas Efficiency Measures
August 2011 251
Measure Life
The measure life is 10 years.483
Secondary Energy Impacts
There are no secondary energy impacts for this measure.
Non-Energy Impacts
There are no non-energy impacts for this measure.
Impact Factors for Calculating Adjusted Gross Savings
Measure Name Program ISR SPF RRE RRSP RRWP CFSP CFWP
HE Free Standing Water Heater C&I NC 1.00 1.00 1.00 n/a n/a n/a n/a
In-Service Rates All installations have 100% in service rate since programs include verification of equipment installations.
Savings Persistence Factor All PAs use 100% savings persistence factor.
Realization Rates
All PAs use 100% energy realization rate. The summer and winter peak realization rates are not applicable for this measure since there are no electric savings claimed.
Coincidence Factors Not applicable for this measure since no electric savings are claimed.
483 GDS Associates, Inc. (2009). Natural Gas Energy Efficiency Potential in Massachusetts. Prepared for GasNetworks; Appendix A-2.
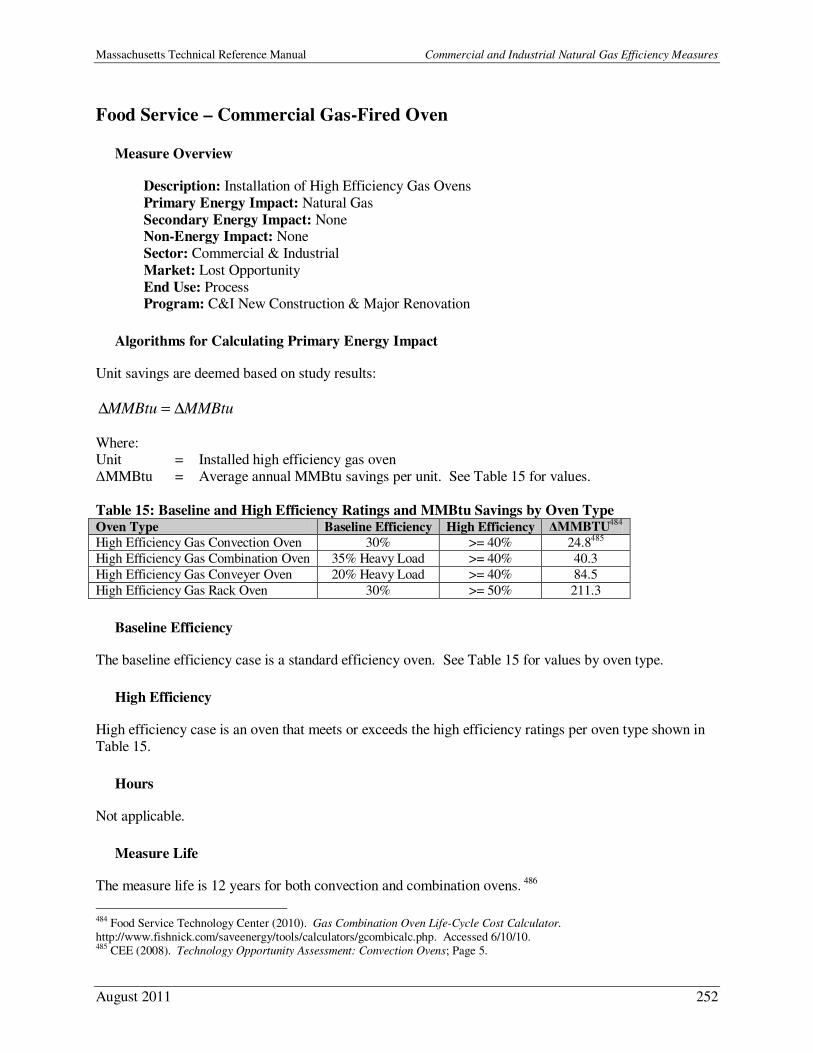
Massachusetts Technical Reference Manual Commercial and Industrial Natural Gas Efficiency Measures
August 2011 252
Food Service – Commercial Gas-Fired Oven
Measure Overview
Description: Installation of High Efficiency Gas Ovens
Primary Energy Impact: Natural Gas
Secondary Energy Impact: None Non-Energy Impact: None
Sector: Commercial & Industrial
Market: Lost Opportunity
End Use: Process Program: C&I New Construction & Major Renovation
Algorithms for Calculating Primary Energy Impact
Unit savings are deemed based on study results:
MMBtuMMBtu ∆=∆
Where: Unit = Installed high efficiency gas oven
∆MMBtu = Average annual MMBtu savings per unit. See Table 15 for values.
Table 15: Baseline and High Efficiency Ratings and MMBtu Savings by Oven Type Oven Type Baseline Efficiency High Efficiency ∆MMBTU
484
High Efficiency Gas Convection Oven 30% >= 40% 24.8485
High Efficiency Gas Combination Oven 35% Heavy Load >= 40% 40.3
High Efficiency Gas Conveyer Oven 20% Heavy Load >= 40% 84.5
High Efficiency Gas Rack Oven 30% >= 50% 211.3
Baseline Efficiency
The baseline efficiency case is a standard efficiency oven. See Table 15 for values by oven type.
High Efficiency
High efficiency case is an oven that meets or exceeds the high efficiency ratings per oven type shown in
Table 15.
Hours
Not applicable.
Measure Life
The measure life is 12 years for both convection and combination ovens. 486
484 Food Service Technology Center (2010). Gas Combination Oven Life-Cycle Cost Calculator.
http://www.fishnick.com/saveenergy/tools/calculators/gcombicalc.php. Accessed 6/10/10. 485 CEE (2008). Technology Opportunity Assessment: Convection Ovens; Page 5.
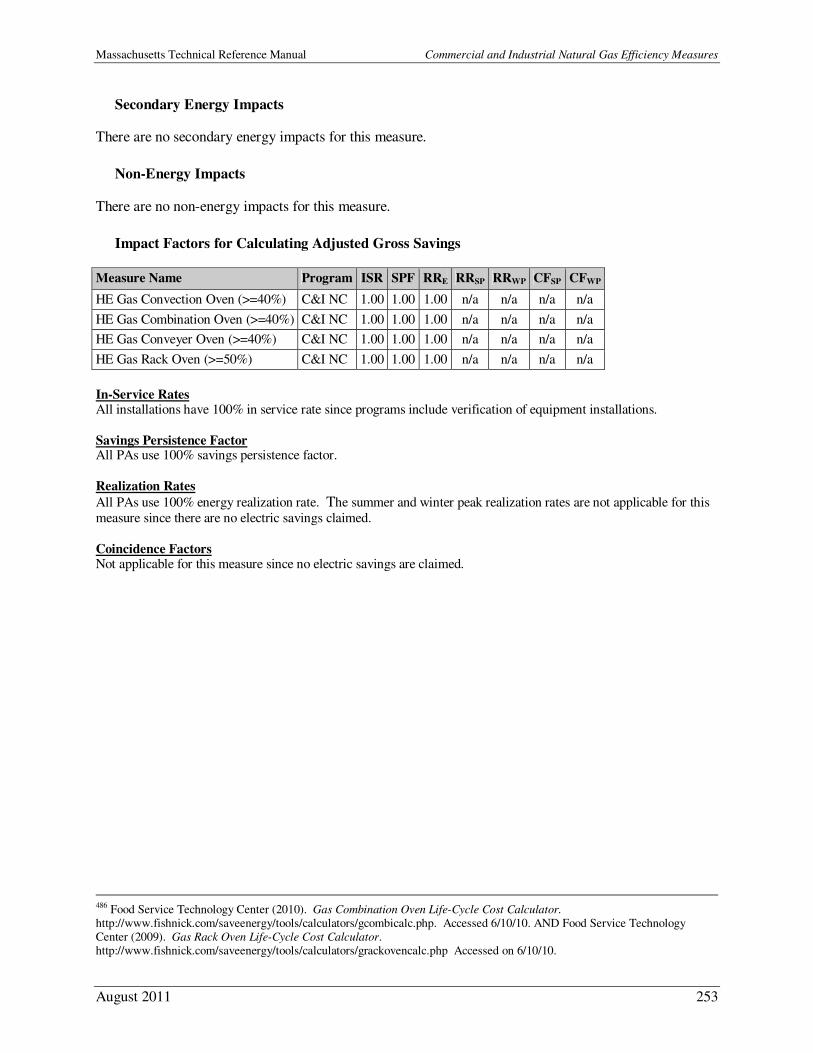
Massachusetts Technical Reference Manual Commercial and Industrial Natural Gas Efficiency Measures
August 2011 253
Secondary Energy Impacts
There are no secondary energy impacts for this measure.
Non-Energy Impacts
There are no non-energy impacts for this measure.
Impact Factors for Calculating Adjusted Gross Savings
Measure Name Program ISR SPF RRE RRSP RRWP CFSP CFWP
HE Gas Convection Oven (>=40%) C&I NC 1.00 1.00 1.00 n/a n/a n/a n/a
HE Gas Combination Oven (>=40%) C&I NC 1.00 1.00 1.00 n/a n/a n/a n/a
HE Gas Conveyer Oven (>=40%) C&I NC 1.00 1.00 1.00 n/a n/a n/a n/a
HE Gas Rack Oven (>=50%) C&I NC 1.00 1.00 1.00 n/a n/a n/a n/a
In-Service Rates All installations have 100% in service rate since programs include verification of equipment installations.
Savings Persistence Factor All PAs use 100% savings persistence factor.
Realization Rates
All PAs use 100% energy realization rate. The summer and winter peak realization rates are not applicable for this
measure since there are no electric savings claimed.
Coincidence Factors Not applicable for this measure since no electric savings are claimed.
486 Food Service Technology Center (2010). Gas Combination Oven Life-Cycle Cost Calculator.
http://www.fishnick.com/saveenergy/tools/calculators/gcombicalc.php. Accessed 6/10/10. AND Food Service Technology Center (2009). Gas Rack Oven Life-Cycle Cost Calculator. http://www.fishnick.com/saveenergy/tools/calculators/grackovencalc.php Accessed on 6/10/10.
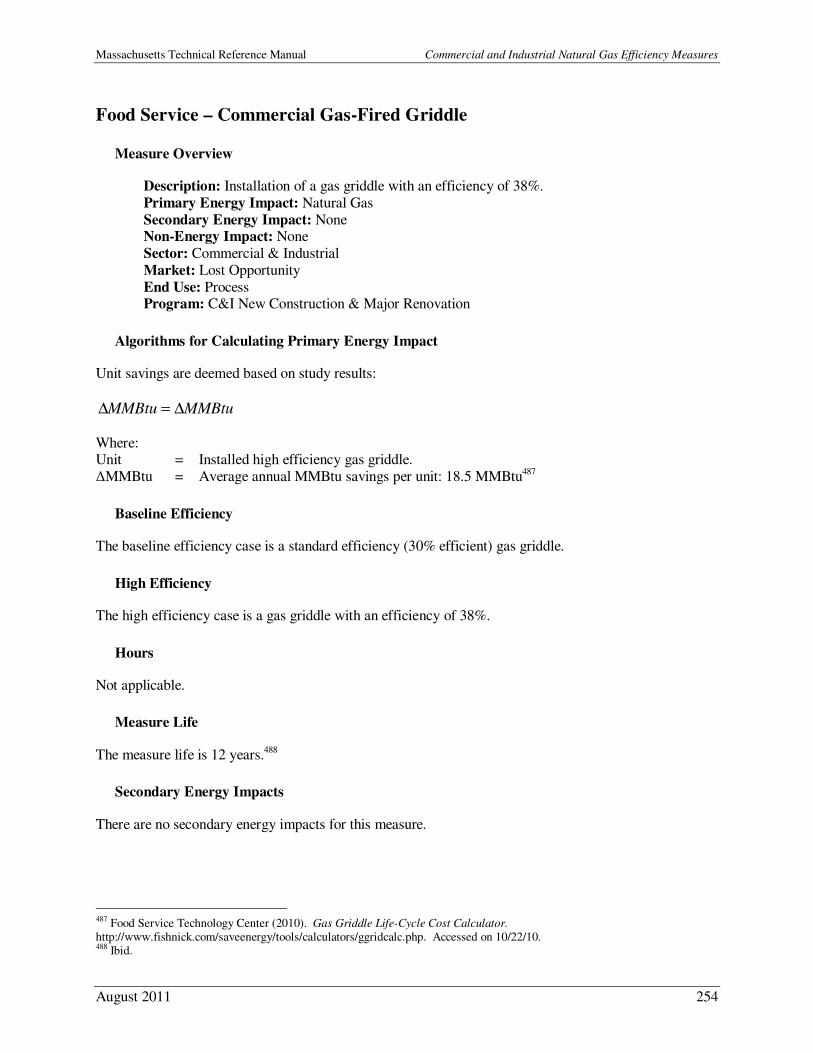
Massachusetts Technical Reference Manual Commercial and Industrial Natural Gas Efficiency Measures
August 2011 254
Food Service – Commercial Gas-Fired Griddle
Measure Overview
Description: Installation of a gas griddle with an efficiency of 38%.
Primary Energy Impact: Natural Gas
Secondary Energy Impact: None Non-Energy Impact: None
Sector: Commercial & Industrial
Market: Lost Opportunity
End Use: Process Program: C&I New Construction & Major Renovation
Algorithms for Calculating Primary Energy Impact
Unit savings are deemed based on study results:
MMBtuMMBtu ∆=∆
Where: Unit = Installed high efficiency gas griddle.
∆MMBtu = Average annual MMBtu savings per unit: 18.5 MMBtu487
Baseline Efficiency
The baseline efficiency case is a standard efficiency (30% efficient) gas griddle.
High Efficiency
The high efficiency case is a gas griddle with an efficiency of 38%.
Hours
Not applicable.
Measure Life
The measure life is 12 years.488
Secondary Energy Impacts
There are no secondary energy impacts for this measure.
487 Food Service Technology Center (2010). Gas Griddle Life-Cycle Cost Calculator. http://www.fishnick.com/saveenergy/tools/calculators/ggridcalc.php. Accessed on 10/22/10. 488 Ibid.

Massachusetts Technical Reference Manual Commercial and Industrial Natural Gas Efficiency Measures
August 2011 255
Non-Energy Impacts
There are no non-energy impacts for this measure.
Impact Factors for Calculating Adjusted Gross Savings
Measure Name Program ISR SPF RRE RRSP RRWP CFSP CFWP
Gas-Fired Griddle C&I NC 1.00 1.00 1.00 n/a n/a n/a n/a
In-Service Rates All installations have 100% in service rate since programs include verification of equipment installations.
Savings Persistence Factor All PAs use 100% savings persistence factor.
Realization Rates
All PAs use 100% energy realization rate. The summer and winter peak realization rates are not applicable for this
measure since there are no electric savings claimed.
Coincidence Factors Not applicable for this measure since no electric savings are claimed.
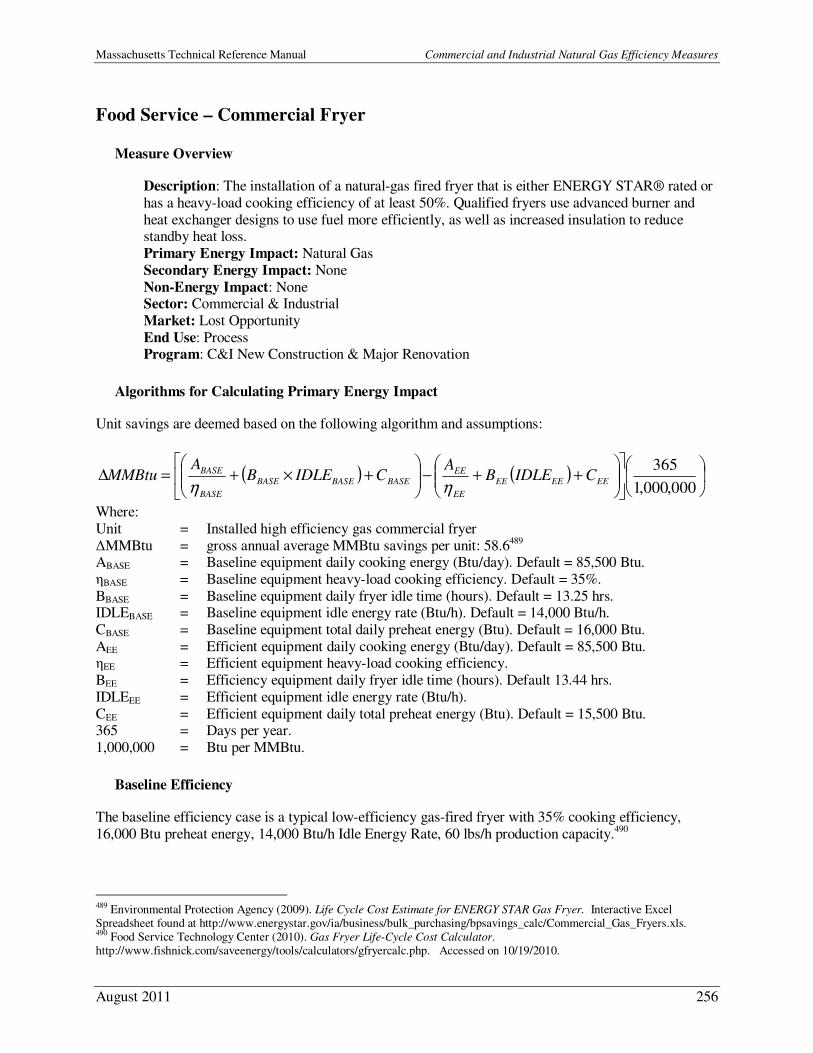
Massachusetts Technical Reference Manual Commercial and Industrial Natural Gas Efficiency Measures
August 2011 256
Food Service – Commercial Fryer
Measure Overview
Description: The installation of a natural-gas fired fryer that is either ENERGY STAR® rated or
has a heavy-load cooking efficiency of at least 50%. Qualified fryers use advanced burner and
heat exchanger designs to use fuel more efficiently, as well as increased insulation to reduce standby heat loss.
Primary Energy Impact: Natural Gas
Secondary Energy Impact: None
Non-Energy Impact: None Sector: Commercial & Industrial
Market: Lost Opportunity
End Use: Process Program: C&I New Construction & Major Renovation
Algorithms for Calculating Primary Energy Impact
Unit savings are deemed based on the following algorithm and assumptions:
( ) ( )
++−
+×+=∆
000,000,1
365EEEEEE
EE
EE
BASEBASEBASE
BASE
BASE CIDLEBA
CIDLEBA
MMBtuηη
Where:
Unit = Installed high efficiency gas commercial fryer
∆MMBtu = gross annual average MMBtu savings per unit: 58.6489 ABASE = Baseline equipment daily cooking energy (Btu/day). Default = 85,500 Btu.
ηBASE = Baseline equipment heavy-load cooking efficiency. Default = 35%.
BBASE = Baseline equipment daily fryer idle time (hours). Default = 13.25 hrs. IDLEBASE = Baseline equipment idle energy rate (Btu/h). Default = 14,000 Btu/h.
CBASE = Baseline equipment total daily preheat energy (Btu). Default = 16,000 Btu.
AEE = Efficient equipment daily cooking energy (Btu/day). Default = 85,500 Btu. ηEE = Efficient equipment heavy-load cooking efficiency.
BEE = Efficiency equipment daily fryer idle time (hours). Default 13.44 hrs.
IDLEEE = Efficient equipment idle energy rate (Btu/h).
CEE = Efficient equipment daily total preheat energy (Btu). Default = 15,500 Btu. 365 = Days per year.
1,000,000 = Btu per MMBtu.
Baseline Efficiency
The baseline efficiency case is a typical low-efficiency gas-fired fryer with 35% cooking efficiency,
16,000 Btu preheat energy, 14,000 Btu/h Idle Energy Rate, 60 lbs/h production capacity.490
489 Environmental Protection Agency (2009). Life Cycle Cost Estimate for ENERGY STAR Gas Fryer. Interactive Excel Spreadsheet found at http://www.energystar.gov/ia/business/bulk_purchasing/bpsavings_calc/Commercial_Gas_Fryers.xls. 490 Food Service Technology Center (2010). Gas Fryer Life-Cycle Cost Calculator. http://www.fishnick.com/saveenergy/tools/calculators/gfryercalc.php. Accessed on 10/19/2010.
Massachusetts Technical Reference Manual Commercial and Industrial Natural Gas Efficiency Measures
August 2011 257
High Efficiency
The high efficiency case cooking efficiency and Idle Energy Rate are site specific and can be determined on a case-by-case basis. To simplify the savings algorithm, typical values for food load (150 lbs/day) and
preheat energy (15,500 Btu) are assumed.
Hours
Not applicable.
Measure Life
The measure life is 12 years.491
Secondary Energy Impacts
There are no secondary energy impacts for this measure.
Non-Energy Impacts
There are no non-energy impacts for this measure.
Impact Factors for Calculating Adjusted Gross Savings
Measure Name Program ISR SPF RRE RRSP RRWP CFSP CFWP
Commercial Fryer C&I NC 1.00 1.00 1.00 n/a n/a n/a n/a
In-Service Rates All installations have 100% in service rate since programs include verification of equipment installations.
Savings Persistence Factor All PAs use 100% savings persistence factor.
Realization Rates
All PAs use 100% energy realization rate. The summer and winter peak realization rates are not applicable for this
measure since there are no electric savings claimed.
Coincidence Factors Not applicable for this measure since no electric savings are claimed.
491 Ibid.
Massachusetts Technical Reference Manual Commercial and Industrial Natural Gas Efficiency Measures
August 2011 258
Food Service – Commercial Gas-Fired Steamer
Measure Overview
Description: The installation of an ENERGY STAR® rated natural-gas fired steamer, either
connectionless or steam-generator design, with heavy-load cooking efficiency of at least 38%. Qualified steamers reduce heat loss due to better insulation, improved heat exchange, and more
efficient steam delivery systems.
Primary Energy Impact: Natural Gas Secondary Energy Impact: None
Non-Energy Impact: Water
Sector: Commercial & Industrial
Market: Lost Opportunity
End Use: Process Program: C&I New Construction & Major Renovation
Algorithms for Calculating Primary Energy Impact
Unit savings are deemed based on the following algorithm and assumptions:
( )( )SAVEPANSMMBtu =∆
Where:
Unit = Installed high efficiency gas-fired steamer ∆MMBtu = Average annual MMBTU savings for default condition of three pans: 153.6
MMBtu
PANS = Efficient equipment number of pans. Default is 3 pans.
SAVE = Average savings per pan: default of 51.2 MMBtu492
Baseline Efficiency
The baseline efficiency case is a typical boiler-based steamer with the following operating parameters:
Preheat Energy = 18,000 Btu, Idle Energy Rate = 3,667 Btu/h/pan, Heavy Load Efficiency = 15.0%,
Production Capacity = 21.7 lbs/h/pan, Average Water Consumption Rate = 40 gal/h, and Percentage of
Time in Constant Steam Mode = 90%.493
High Efficiency
The high efficiency case is an ENERGY STAR® qualified gas-fired steamer with the following operating
parameters: Preheat Energy = 7,000 Btu, Idle Energy Rate = 2,083 Btu/h/pan, Heavy Load Efficiency =
492 Food Service Technology Center (2010). Gas Steamer Life-Cycle Cost Calculator. http://www.fishnick.com/saveenergy/tools/calculators/gsteamercalc.php. Accessed on 10/20/2010; the estimated annual MMBtu savings per pan is derived using the referenced cost calculator and the operating parameters described in the Baseline Efficiency,
High Efficiency, and Hours sections. The savings per pan is found by averaging the per pan savings estimates for 3-, 4-, 5-, and 6-pan steamers. 493 Food Service Technology Center (2010). Gas Steamer Life-Cycle Cost Calculator. http://www.fishnick.com/saveenergy/tools/calculators/gsteamercalc.php. Accessed on 10/20/2010.
Massachusetts Technical Reference Manual Commercial and Industrial Natural Gas Efficiency Measures
August 2011 259
38.0%, Production Capacity = 18.3 lbs/h/pan, Average Water Consumption Rate = 3.0 gal/h, and
Percentage of Time in Constant Steam Mode = 0%.494
Hours
The deemed savings assumes 4,380 annual operating hours (12 hours a day * 365 days/year). 495
Measure Life
The measure life is 10 years.496
Secondary Energy Impacts
There are no secondary energy impacts for this measure.
Non-Energy Impacts
Benefit Type Description Savings497
C&I Water C&I Water Savings 162,060 Gallons/Unit
C&I Wastewater C&I Wastewater Savings 162,060 Gallons/Unit
Impact Factors for Calculating Adjusted Gross Savings
Measure Name Program ISR SPF RRE RRSP RRWP CFSP CFWP
Gas-Fired Steamer C&I NC 1.00 1.00 1.00 1.00 1.00 n/a n/a
In-Service Rates All installations have 100% in service rate since programs include verification of equipment installations.
Savings Persistence Factor All PAs use 100% savings persistence factor. Realization Rates
All PAs use 100% energy realization rate. The summer and winter peak realization rates are not applicable for this
measure since there are no electric savings claimed.
Coincidence Factors Not applicable for this measure since no electric savings are claimed.
494 Ibid. 495 Consortium for Energy Efficiency (2010). Program Design Guidance: Steamers. 496 Ibid. 497 Food Service Technology Center (2010). Gas Steamer Life-Cycle Cost Calculator. http://www.fishnick.com/saveenergy/tools/calculators/gsteamercalc.php. Accessed on 10/20/2010; the estimated water savings is derived using the referenced cost calculator and the operating parameters described in the Baseline Efficiency, High Efficiency, and Hours sections. The savings per pan is found by averaging the per pan savings estimates for 3-, 4-, 5-, and 6-pan steamers.
Massachusetts Technical Reference Manual Commercial and Industrial Natural Gas Efficiency Measures
August 2011 260
Custom Measures
Measure Overview
Description: The Custom project track is offered for energy efficiency projects involving
complex site-specific applications that require detailed engineering analysis and/or projects which
do not qualify for incentives under any of the prescriptive rebate offering. Projects offered through the custom approach must pass a cost-effectiveness test based on project-specific costs
and savings.
Primary Energy Impact: Natural Gas (Heating, Water Heating, or All)
Secondary Energy Impact: Project Specific Non-Energy Impact: Project Specific
Sector: Commercial & Industrial
Market: Lost Opportunity, Retrofit End Use: All
Program: All
Algorithms for Calculating Primary Energy Impact
Gross energy and demand savings estimates for custom projects are calculated using engineering analysis
and project-specific details. Custom analyses typically include a weather dependent load bin analysis, whole building energy model simulation, or other engineering analysis and include estimates of savings,
costs, and an evaluation of the project’s cost-effectiveness.
Baseline Efficiency
For Lost Opportunity projects, the baseline efficiency case assumes compliance with the efficiency
requirements as mandated by Massachusetts State Building Code or industry accepted standard practice.
For retrofit projects, the baseline efficiency case is the same as the existing, or pre-retrofit, case for the
facility.
High Efficiency
The high efficiency scenario is specific to the custom project and may include one or more energy efficiency measures. Energy and demand savings calculations are based on projected changes in
equipment efficiencies and operating characteristics and are determined on a case-by-case basis. The
project must be proven cost-effective in order to qualify for energy efficiency incentives.
Hours
All hours for custom savings analyses should be determined on a case-by-case basis.
Measure Life
For both lost-opportunity and retrofit custom applications, the measure life is determined on a case-by-case basis.

Massachusetts Technical Reference Manual Commercial and Industrial Natural Gas Efficiency Measures
August 2011 261
Secondary Energy Impacts
All secondary energy impacts should be determined on a case-by-case basis.
Non-Energy Impacts
All non-energy impacts should be determined on a case-by-case basis.
Impact Factors for Calculating Adjusted Gross Savings
Measure Program ISR SPF RRE RRSP RRWP CFSP CFWP
Custom All 1.00 1.00 1.00 n/a n/a n/a n/a
In-Service Rates All installations have 100% in service rate since programs include verification of equipment installations.
Savings Persistence Factor All PAs use 100% savings persistence factor. Realization Rates All PAs use 100% energy realization rate. The summer and winter peak realization rates are not applicable for this measure since there are no electric savings claimed.
Coincidence Factors Not applicable for this measure since no electric savings are claimed.


Massachusetts Technical Reference Manual Appendix A: Common Lookup Tables
August 2011 263
Appendices
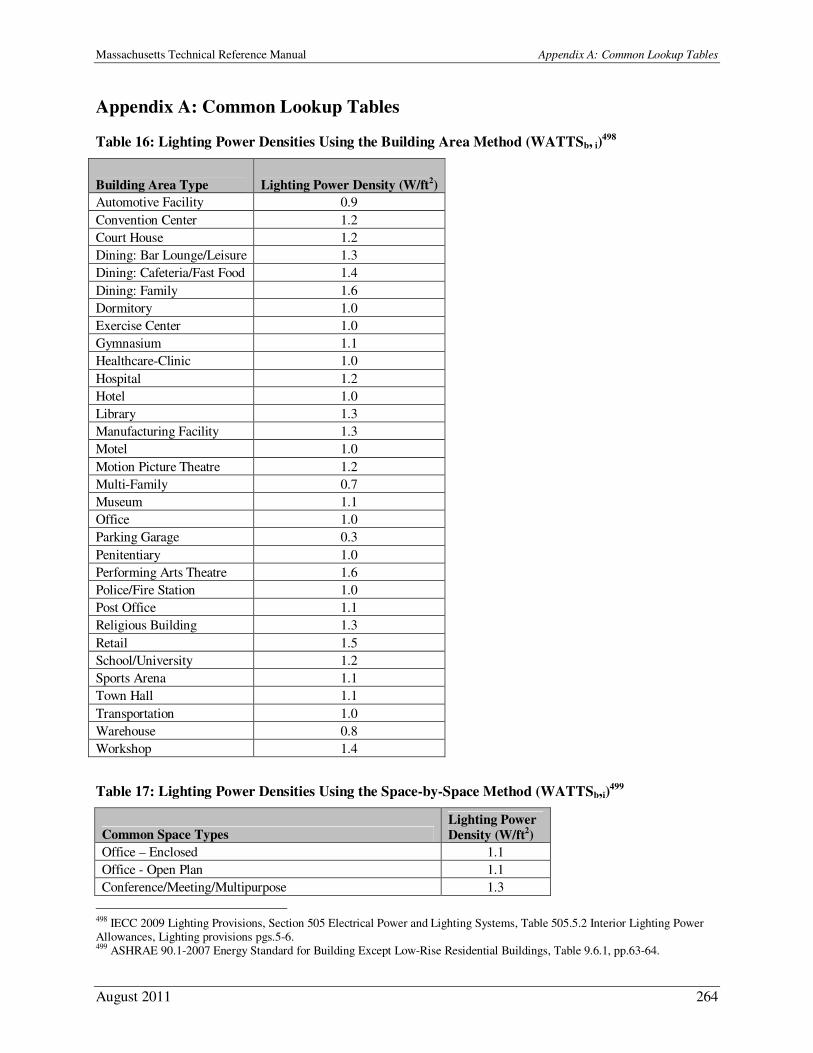
Massachusetts Technical Reference Manual Appendix A: Common Lookup Tables
August 2011 264
Appendix A: Common Lookup Tables
Table 16: Lighting Power Densities Using the Building Area Method (WATTSb, i)498
Building Area Type Lighting Power Density (W/ft2)
Automotive Facility 0.9
Convention Center 1.2
Court House 1.2
Dining: Bar Lounge/Leisure 1.3
Dining: Cafeteria/Fast Food 1.4
Dining: Family 1.6
Dormitory 1.0
Exercise Center 1.0
Gymnasium 1.1
Healthcare-Clinic 1.0
Hospital 1.2
Hotel 1.0
Library 1.3
Manufacturing Facility 1.3
Motel 1.0
Motion Picture Theatre 1.2
Multi-Family 0.7
Museum 1.1
Office 1.0
Parking Garage 0.3
Penitentiary 1.0
Performing Arts Theatre 1.6
Police/Fire Station 1.0
Post Office 1.1
Religious Building 1.3
Retail 1.5
School/University 1.2
Sports Arena 1.1
Town Hall 1.1
Transportation 1.0
Warehouse 0.8
Workshop 1.4
Table 17: Lighting Power Densities Using the Space-by-Space Method (WATTSb,i)499
Common Space Types Lighting Power
Density (W/ft2)
Office – Enclosed 1.1
Office - Open Plan 1.1
Conference/Meeting/Multipurpose 1.3
498 IECC 2009 Lighting Provisions, Section 505 Electrical Power and Lighting Systems, Table 505.5.2 Interior Lighting Power Allowances, Lighting provisions pgs.5-6. 499 ASHRAE 90.1-2007 Energy Standard for Building Except Low-Rise Residential Buildings, Table 9.6.1, pp.63-64.
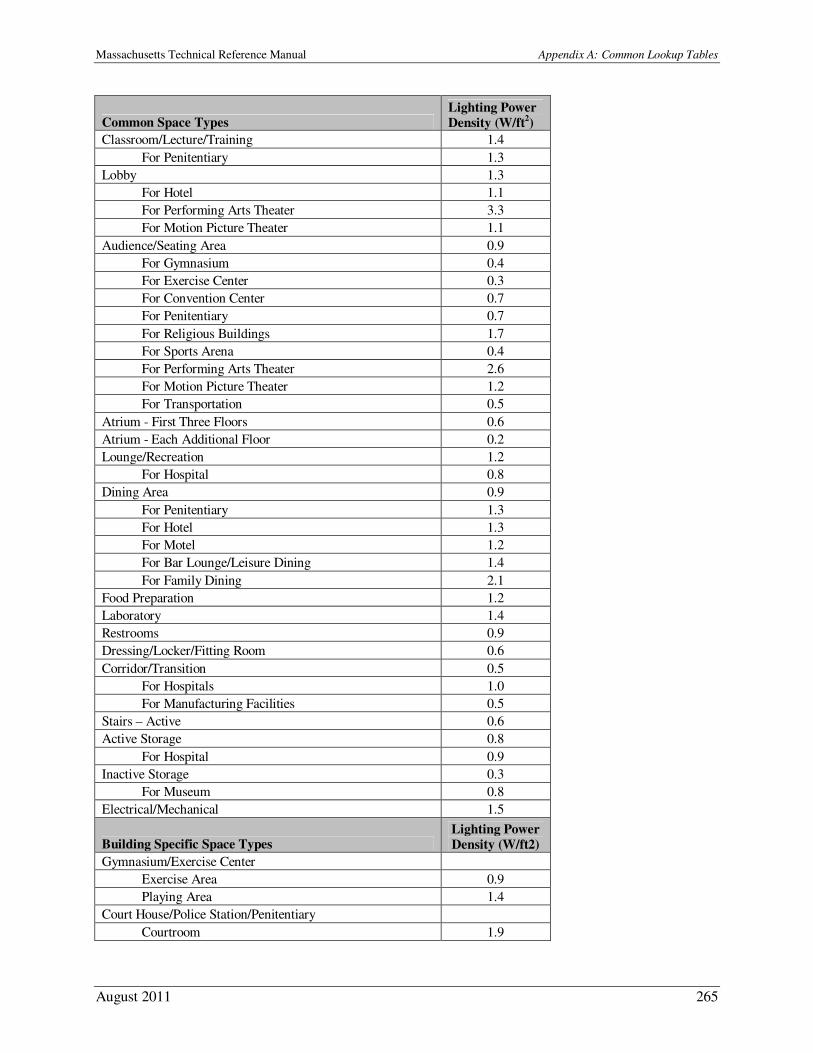
Massachusetts Technical Reference Manual Appendix A: Common Lookup Tables
August 2011 265
Common Space Types Lighting Power
Density (W/ft2)
Classroom/Lecture/Training 1.4
For Penitentiary 1.3
Lobby 1.3
For Hotel 1.1
For Performing Arts Theater 3.3
For Motion Picture Theater 1.1
Audience/Seating Area 0.9
For Gymnasium 0.4
For Exercise Center 0.3
For Convention Center 0.7
For Penitentiary 0.7
For Religious Buildings 1.7
For Sports Arena 0.4
For Performing Arts Theater 2.6
For Motion Picture Theater 1.2
For Transportation 0.5
Atrium - First Three Floors 0.6
Atrium - Each Additional Floor 0.2
Lounge/Recreation 1.2
For Hospital 0.8
Dining Area 0.9
For Penitentiary 1.3
For Hotel 1.3
For Motel 1.2
For Bar Lounge/Leisure Dining 1.4
For Family Dining 2.1
Food Preparation 1.2
Laboratory 1.4
Restrooms 0.9
Dressing/Locker/Fitting Room 0.6
Corridor/Transition 0.5
For Hospitals 1.0
For Manufacturing Facilities 0.5
Stairs – Active 0.6
Active Storage 0.8
For Hospital 0.9
Inactive Storage 0.3
For Museum 0.8
Electrical/Mechanical 1.5
Building Specific Space Types Lighting Power
Density (W/ft2)
Gymnasium/Exercise Center
Exercise Area 0.9
Playing Area 1.4
Court House/Police Station/Penitentiary
Courtroom 1.9
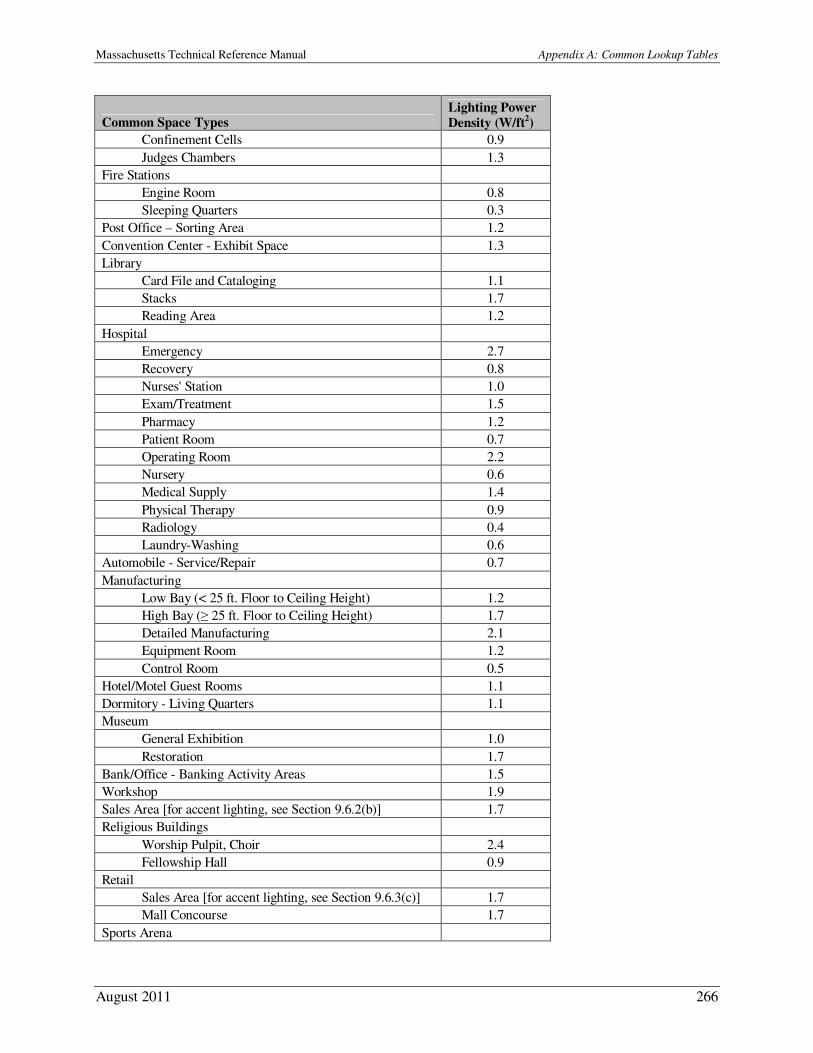
Massachusetts Technical Reference Manual Appendix A: Common Lookup Tables
August 2011 266
Common Space Types Lighting Power
Density (W/ft2)
Confinement Cells 0.9
Judges Chambers 1.3
Fire Stations
Engine Room 0.8
Sleeping Quarters 0.3
Post Office – Sorting Area 1.2
Convention Center - Exhibit Space 1.3
Library
Card File and Cataloging 1.1
Stacks 1.7
Reading Area 1.2
Hospital
Emergency 2.7
Recovery 0.8
Nurses' Station 1.0
Exam/Treatment 1.5
Pharmacy 1.2
Patient Room 0.7
Operating Room 2.2
Nursery 0.6
Medical Supply 1.4
Physical Therapy 0.9
Radiology 0.4
Laundry-Washing 0.6
Automobile - Service/Repair 0.7
Manufacturing
Low Bay (< 25 ft. Floor to Ceiling Height) 1.2
High Bay (≥ 25 ft. Floor to Ceiling Height) 1.7
Detailed Manufacturing 2.1
Equipment Room 1.2
Control Room 0.5
Hotel/Motel Guest Rooms 1.1
Dormitory - Living Quarters 1.1
Museum
General Exhibition 1.0
Restoration 1.7
Bank/Office - Banking Activity Areas 1.5
Workshop 1.9
Sales Area [for accent lighting, see Section 9.6.2(b)] 1.7
Religious Buildings
Worship Pulpit, Choir 2.4
Fellowship Hall 0.9
Retail
Sales Area [for accent lighting, see Section 9.6.3(c)] 1.7
Mall Concourse 1.7
Sports Arena
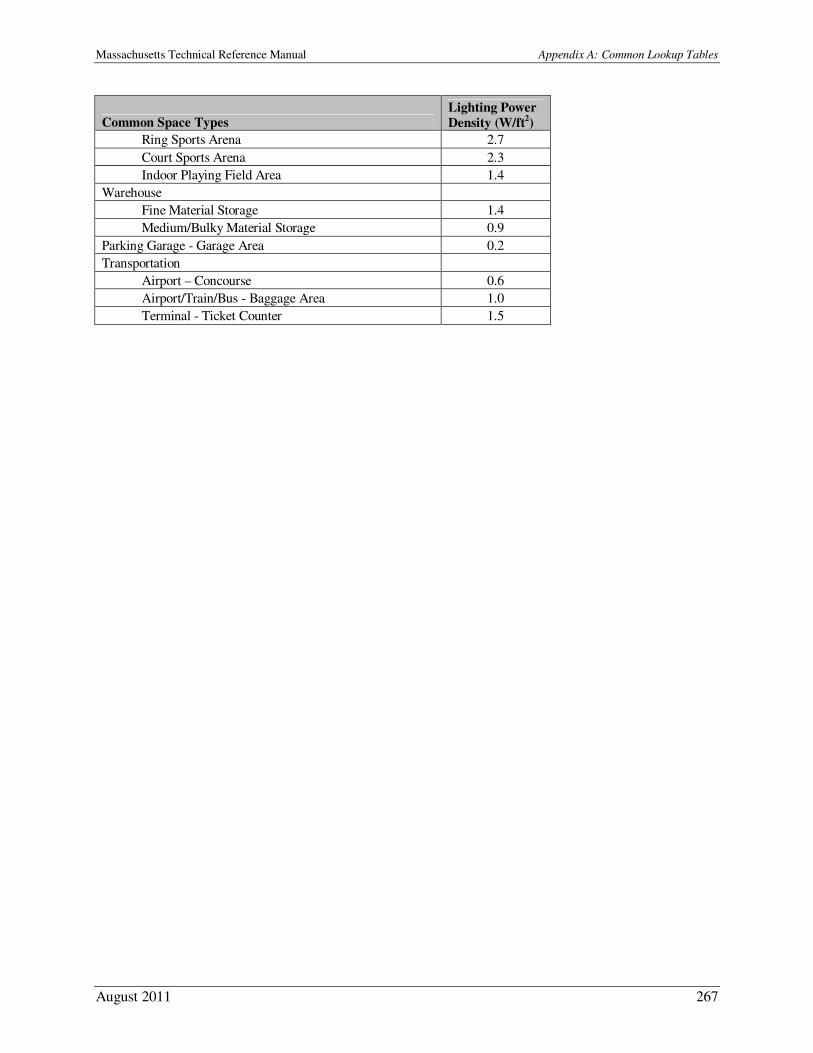
Massachusetts Technical Reference Manual Appendix A: Common Lookup Tables
August 2011 267
Common Space Types Lighting Power
Density (W/ft2)
Ring Sports Arena 2.7
Court Sports Arena 2.3
Indoor Playing Field Area 1.4
Warehouse
Fine Material Storage 1.4
Medium/Bulky Material Storage 0.9
Parking Garage - Garage Area 0.2
Transportation
Airport – Concourse 0.6
Airport/Train/Bus - Baggage Area 1.0
Terminal - Ticket Counter 1.5
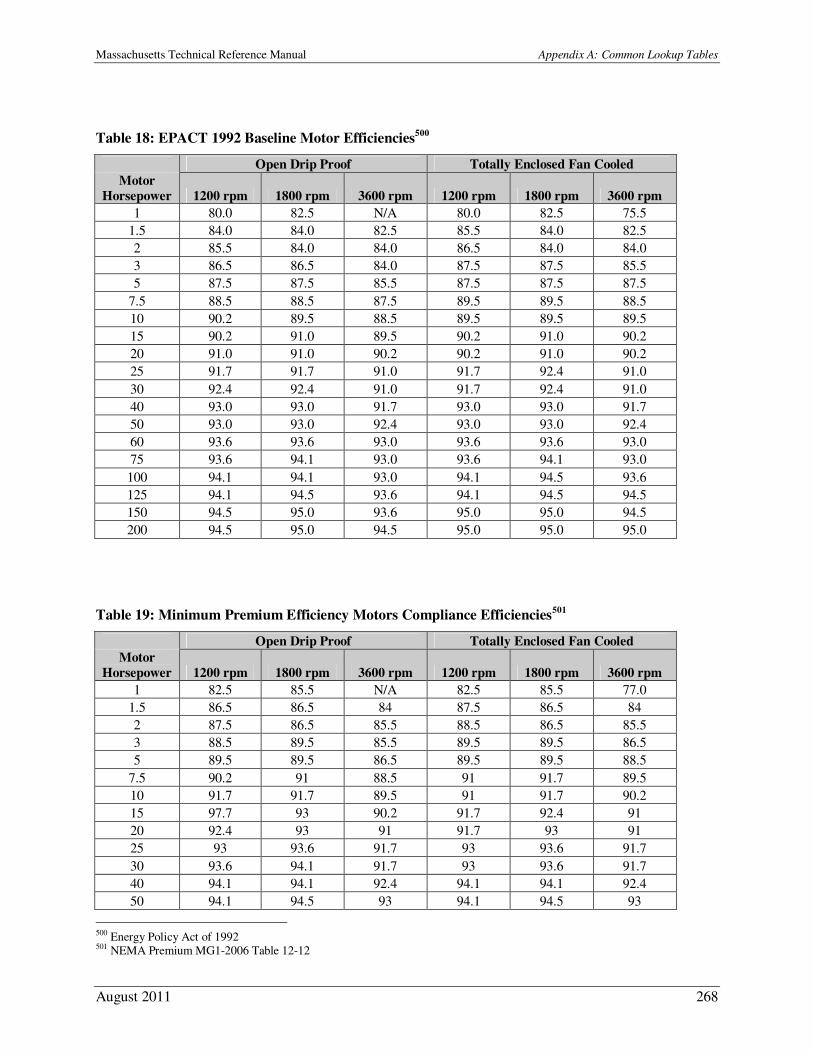
Massachusetts Technical Reference Manual Appendix A: Common Lookup Tables
August 2011 268
Table 18: EPACT 1992 Baseline Motor Efficiencies500
Open Drip Proof Totally Enclosed Fan Cooled
Motor
Horsepower 1200 rpm 1800 rpm 3600 rpm 1200 rpm 1800 rpm 3600 rpm
1 80.0 82.5 N/A 80.0 82.5 75.5
1.5 84.0 84.0 82.5 85.5 84.0 82.5
2 85.5 84.0 84.0 86.5 84.0 84.0
3 86.5 86.5 84.0 87.5 87.5 85.5
5 87.5 87.5 85.5 87.5 87.5 87.5
7.5 88.5 88.5 87.5 89.5 89.5 88.5
10 90.2 89.5 88.5 89.5 89.5 89.5
15 90.2 91.0 89.5 90.2 91.0 90.2
20 91.0 91.0 90.2 90.2 91.0 90.2
25 91.7 91.7 91.0 91.7 92.4 91.0
30 92.4 92.4 91.0 91.7 92.4 91.0
40 93.0 93.0 91.7 93.0 93.0 91.7
50 93.0 93.0 92.4 93.0 93.0 92.4
60 93.6 93.6 93.0 93.6 93.6 93.0
75 93.6 94.1 93.0 93.6 94.1 93.0
100 94.1 94.1 93.0 94.1 94.5 93.6
125 94.1 94.5 93.6 94.1 94.5 94.5
150 94.5 95.0 93.6 95.0 95.0 94.5
200 94.5 95.0 94.5 95.0 95.0 95.0
Table 19: Minimum Premium Efficiency Motors Compliance Efficiencies501
Open Drip Proof Totally Enclosed Fan Cooled
Motor
Horsepower 1200 rpm 1800 rpm 3600 rpm 1200 rpm 1800 rpm 3600 rpm
1 82.5 85.5 N/A 82.5 85.5 77.0
1.5 86.5 86.5 84 87.5 86.5 84
2 87.5 86.5 85.5 88.5 86.5 85.5
3 88.5 89.5 85.5 89.5 89.5 86.5
5 89.5 89.5 86.5 89.5 89.5 88.5
7.5 90.2 91 88.5 91 91.7 89.5
10 91.7 91.7 89.5 91 91.7 90.2
15 97.7 93 90.2 91.7 92.4 91
20 92.4 93 91 91.7 93 91
25 93 93.6 91.7 93 93.6 91.7
30 93.6 94.1 91.7 93 93.6 91.7
40 94.1 94.1 92.4 94.1 94.1 92.4
50 94.1 94.5 93 94.1 94.5 93
500 Energy Policy Act of 1992 501 NEMA Premium MG1-2006 Table 12-12
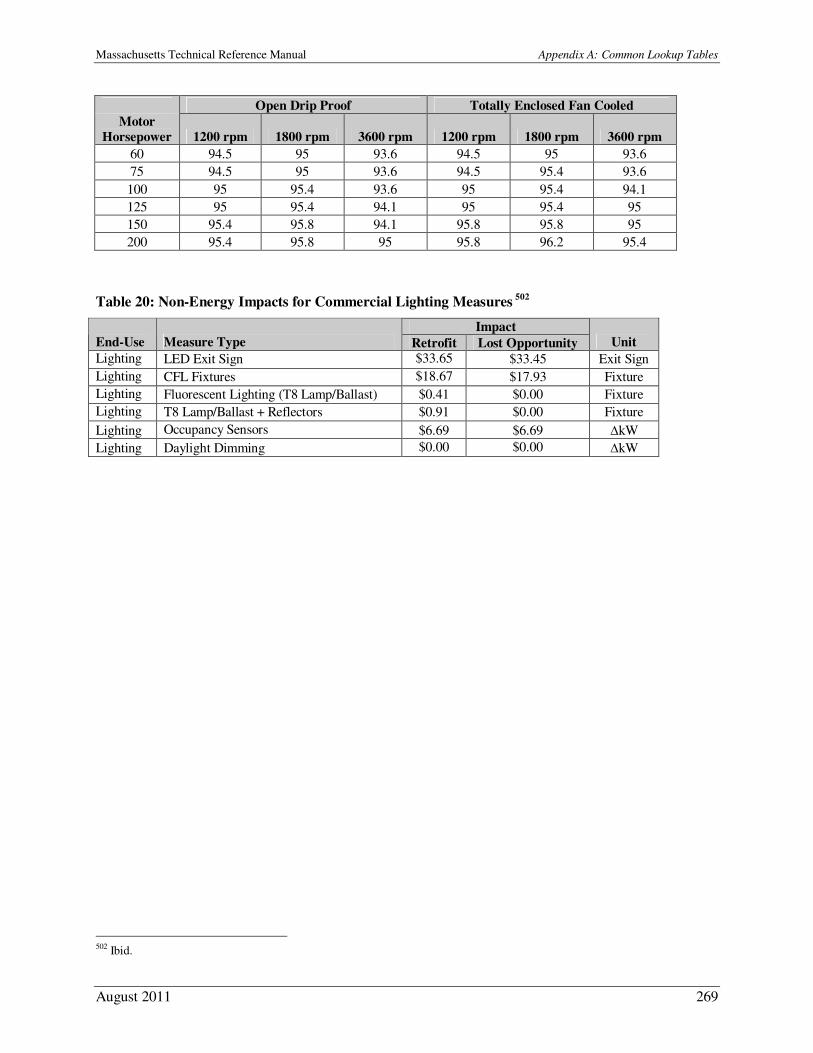
Massachusetts Technical Reference Manual Appendix A: Common Lookup Tables
August 2011 269
Open Drip Proof Totally Enclosed Fan Cooled
Motor
Horsepower 1200 rpm 1800 rpm 3600 rpm 1200 rpm 1800 rpm 3600 rpm
60 94.5 95 93.6 94.5 95 93.6
75 94.5 95 93.6 94.5 95.4 93.6
100 95 95.4 93.6 95 95.4 94.1
125 95 95.4 94.1 95 95.4 95
150 95.4 95.8 94.1 95.8 95.8 95
200 95.4 95.8 95 95.8 96.2 95.4
Table 20: Non-Energy Impacts for Commercial Lighting Measures 502
Impact
End-Use Measure Type Retrofit Lost Opportunity Unit
Lighting LED Exit Sign $33.65 $33.45 Exit Sign
Lighting CFL Fixtures $18.67 $17.93 Fixture
Lighting Fluorescent Lighting (T8 Lamp/Ballast) $0.41 $0.00 Fixture
Lighting T8 Lamp/Ballast + Reflectors $0.91 $0.00 Fixture
Lighting Occupancy Sensors $6.69 $6.69 ∆kW
Lighting Daylight Dimming $0.00 $0.00 ∆kW
502 Ibid.

Massachusetts Technical Reference Manual Appendix B: Net-to-Gross Impact Factors
August 2011 271
Appendix B: Net to Gross Impact Factors
Residential Electric Efficiency Measures Measure PA FR SOP SONP NTG
Residential New Construction & Major Renovation
LED Fixture National Grid 0% 0% 0% 100%
Residential Cooling & Heating Equipment
Brushless Furnace Fan Motor National Grid 15% 0% 0% 85%
CoolSmart AC (SEER >= 15 / EER >= 12.5) National Grid 15% 0% 0% 85%
CoolSmart AC (SEER >= 15 / EER >= 13) National Grid 15% 0% 0% 85%
CoolSmart AC (SEER 14.5 / EER 12) National Grid 15% 0% 0% 85%
CoolSmart AC Digital Check-up/Tune-up National Grid 15% 0% 0% 85%
MassSAVE
Air Sealing, Electric National Grid 7% 0% 0% 93%
Air Sealing, Gas National Grid 7% 0% 0% 93%
Air Sealing, Oil National Grid 7% 0% 0% 93%
Air Sealing, Other FF National Grid 7% 0% 0% 93%
Boiler Reset Controls National Grid 0% 0% 0% 100%
DHW ISMs, Electric National Grid 25% 0% 0% 75%
DHW ISMs, Gas National Grid 25% 0% 0% 75%
DHW ISMs, Oil National Grid 25% 0% 0% 75%
DHW ISMs, Other FF National Grid 25% 0% 0% 75%
Duct Insulation, Electric National Grid 20% 8% 50% 138%
Duct Insulation, Gas National Grid 20% 8% 50% 138%
Duct Insulation, Oil National Grid 20% 8% 50% 138%
Duct Insulation, Other FF National Grid 20% 8% 50% 138%
Duct Seal, Electric National Grid 7% 0% 0% 93%
Duct Seal, Oil National Grid 7% 0% 0% 93%
Duct Seal, Other FF National Grid 7% 0% 0% 93%
ES Window, Electric National Grid 0% 0% 0% 100%
ES Window, Gas National Grid 0% 0% 0% 100%
ES Window, Oil National Grid 0% 0% 0% 100%
ES Window, Other FF National Grid 0% 0% 0% 100%
Heating System Replacement, Gas National Grid 28% 0% 0% 72%
Heating System Replacement, Oil National Grid 28% 0% 0% 72%
Heating System Replacement, Other FF National Grid 28% 0% 0% 72%
Indirect Water Heater, Oil National Grid 25% 0% 0% 75%
Indirect Water Heater, Other FF National Grid 25% 0% 0% 75%
Insulation, Electric National Grid 20% 8% 50% 138%
Insulation, Gas National Grid 20% 8% 50% 138%
Insulation, Oil National Grid 20% 8% 50% 138%
Insulation, Other FF National Grid 20% 8% 50% 138%
Refrigerator (ES Value) National Grid 35% 36% 0% 101%
Massachusetts Technical Reference Manual Appendix B: Net-to-Gross Impact Factors
August 2011 272
Refrigerator (Retirement Value) National Grid 35% 36% 0% 101%
Screw-in Bulbs National Grid 22% 19% 0% 97%
Screw-in Bulbs (piggyback) National Grid 22% 19% 0% 97%
Thermostats, Electric National Grid 11% 0% 0% 89%
Multi-Family Retrofit
Air Sealing (FF) National Grid 3% 0% 0% 97%
CFL (Electric) National Grid 3% 0% 0% 97%
CFL (Non-Electric) National Grid 3% 0% 0% 97%
Common Area Int Fixtures National Grid 3% 0% 0% 97%
Common Area Occupancy Sensors National Grid 3% 0% 0% 97%
DHW Measures (FF) National Grid 3% 0% 0% 97%
DHW Measures (Electric) National Grid 3% 0% 0% 97%
DHW Showerheads/Aerators (Electric) National Grid 3% 0% 0% 97%
DHW Showerheads/Aerators (Non-Electric) National Grid 3% 0% 0% 97%
DHW Tank/Pipe Wrap (Electric) National Grid 3% 0% 0% 97%
DHW Tank/Pipe Wrap (Non-Electric) National Grid 3% 0% 0% 97%
Fixtures (Electric) National Grid 3% 0% 0% 97%
Fixtures (Non-Electric) National Grid 3% 0% 0% 97%
Heat Pump Tune-Up (Electric) National Grid 3% 0% 0% 97%
Indoor Fixture National Grid 8% 4% 0% 96%
Insulation (Electric) National Grid 3% 0% 0% 97%
Insulation (FF) National Grid 3% 0% 0% 97%
Outdoor Fixture National Grid 12% 7% 0% 95%
Programmable Thermostats (Electric) National Grid 3% 0% 0% 97%
Programmable Thermostats (FF) National Grid 3% 0% 0% 97%
Refrigerator (ES Value) National Grid 3% 0% 0% 97%
Refrigerator (Retirement Value) National Grid 3% 0% 0% 97%
Refrigerators/Freezers (Electric Heat) National Grid 3% 0% 0% 97%
Refrigerators/Freezers (Non-Electric Heat) National Grid 3% 0% 0% 97%
Room AC National Grid 35% 0% 0% 65%
Room AC National Grid 35% 0% 0% 65%
Screw-in Bulbs National Grid 3% 0% 0% 97%
Smart Strips National Grid 0% 0% 0% 100%
SPACE Air Sealing (Electric) National Grid 3% 0% 0% 97%
SPACE Air Sealing (Non-Electric) National Grid 3% 0% 0% 97%
SPACE Insulation (Electric) National Grid 3% 0% 0% 97%
SPACE Insulation (Non-Electric) National Grid 3% 0% 0% 97%
SPACE Thermostats (Electric) National Grid 3% 0% 0% 97%
SPACE Thermostats (Non-Electric) National Grid 3% 0% 0% 97%
OPOWER Program
CUSTSERV National Grid 0% 0% 0% 100%
ENERGY STAR Lighting
Indoor Fixture National Grid 8% 4% 0% 96%
LED Fixture National Grid 0% 0% 0% 100%

Massachusetts Technical Reference Manual Appendix B: Net-to-Gross Impact Factors
August 2011 273
LED Lamp National Grid 0% 0% 0% 100%
Outdoor Fixture National Grid 12% 7% 0% 95%
Screw-in Bulbs* National Grid 57% 0% 0% 43%
Screw-in Bulbs (Hard to Reach)* National Grid 40% 0% 0% 60%
Screw-in Bulbs (School Fundraiser)* National Grid 0% 0% 0% 100%
Screw-in Bulbs (Specialty bulbs)* National Grid 40% 0% 0% 60%
Torchiere National Grid 6% 3% 0% 97%
ENERGY STAR Appliances
Computer Monitors National Grid 0% 0% 0% 100%
Freezer Rebate National Grid 0% 0% 0% 100%
LCD/TV National Grid 0% 0% 0% 100%
PC Computers National Grid 0% 0% 0% 100%
Pool Pumps National Grid 0% 0% 0% 100%
Ref Frz Recycling National Grid 0% 0% 0% 67%
Refrigerator Rebate National Grid 0% 0% 0% 100%
Room AC (Upstream) National Grid 35% 0% 0% 65%
Room AC (Upstream) National Grid 35% 0% 0% 65%
Room Air Cleaner National Grid 0% 0% 0% 100%
Smart Strips National Grid 0% 0% 0% 100%
Low-Income Residential New Construction
ENERGY STAR Appliances – Refrigerators National Grid 0% 0% 0% 100%
ENERGY STAR Homes – Heating, Cooling, and Water Heat Savings
National Grid 0% 0% 0% 100%
ENERGY STAR Homes – Heating, Cooling, and Water Heat Savings
National Grid 0% 0% 0% 100%
ENERGY STAR Homes – Heating, Cooling, and Water Heat Savings
National Grid 0% 0% 0% 100%
ENERGY STAR Lighting – Indoor Fixtures National Grid 0% 0% 0% 100%
ENERGY STAR Lighting – Light–Emitting Diode Lights National Grid 0% 0% 0% 100%
ENERGY STAR® CFL Lamps National Grid 0% 0% 0% 100%
ENERGY STAR® Dishwashers National Grid 0% 0% 0% 100%
Low-Income 1-4 Family Retrofit
ENERGY STAR Appliances – Dehumidifiers National Grid 0% 0% 0% 100%
ENERGY STAR Appliances – Dehumidifiers National Grid 0% 0% 0% 100%
Low Income – Appliance Removal National Grid 0% 0% 0% 100%
Low Income – Basic Educational Measures National Grid 0% 0% 0% 100%
Low Income – DHW Measures (Electric) National Grid 0% 0% 0% 100%
Low Income – Electric Weatherization National Grid 0% 0% 0% 100%
Low Income – ENERGY STAR® CFL Bulbs National Grid 0% 0% 0% 100%
Low Income – Freezers National Grid 0% 0% 0% 100%
Low Income – Heating System Replacement (Oil) National Grid 0% 0% 0% 100%
Low Income – Oil and Gas DHW Measures (Oil and Gas) National Grid 0% 0% 0% 100%
Low Income – Oil and Gas DHW Measures (Oil and Gas) National Grid 0% 0% 0% 100%
Low Income – Oil Weatherization National Grid 0% 0% 0% 100%
Low Income – Refrigerators National Grid 0% 0% 0% 100%
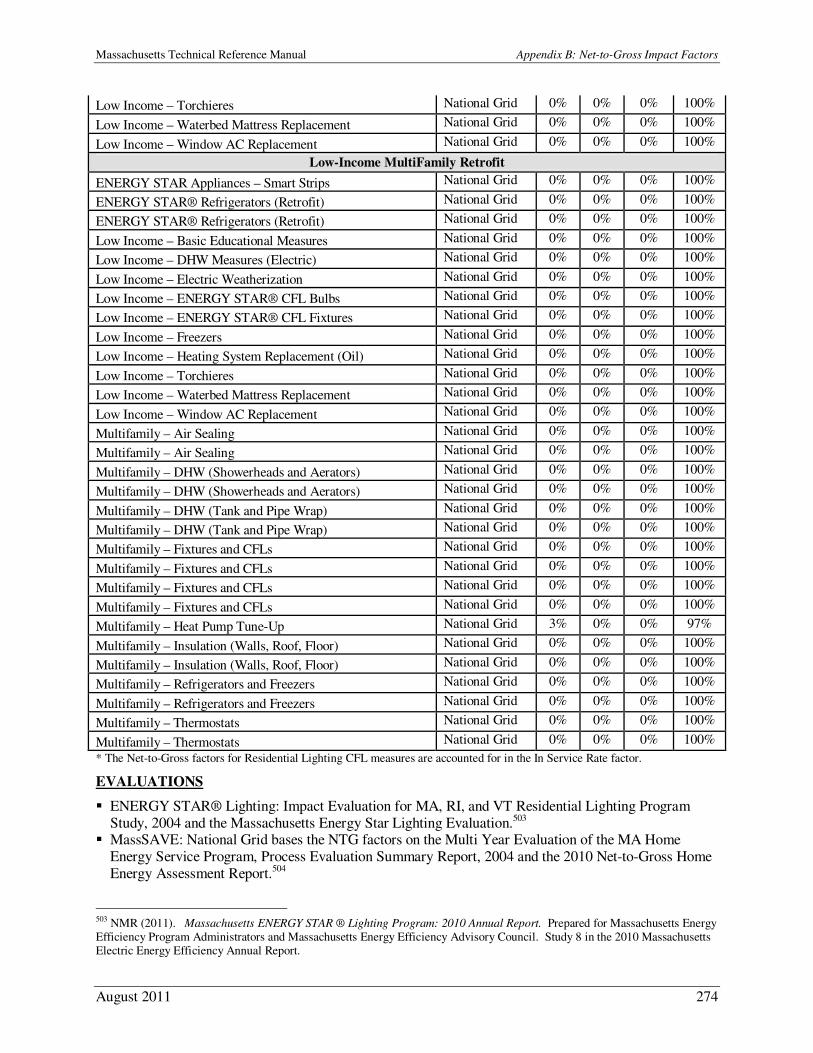
Massachusetts Technical Reference Manual Appendix B: Net-to-Gross Impact Factors
August 2011 274
Low Income – Torchieres National Grid 0% 0% 0% 100%
Low Income – Waterbed Mattress Replacement National Grid 0% 0% 0% 100%
Low Income – Window AC Replacement National Grid 0% 0% 0% 100%
Low-Income MultiFamily Retrofit
ENERGY STAR Appliances – Smart Strips National Grid 0% 0% 0% 100%
ENERGY STAR® Refrigerators (Retrofit) National Grid 0% 0% 0% 100%
ENERGY STAR® Refrigerators (Retrofit) National Grid 0% 0% 0% 100%
Low Income – Basic Educational Measures National Grid 0% 0% 0% 100%
Low Income – DHW Measures (Electric) National Grid 0% 0% 0% 100%
Low Income – Electric Weatherization National Grid 0% 0% 0% 100%
Low Income – ENERGY STAR® CFL Bulbs National Grid 0% 0% 0% 100%
Low Income – ENERGY STAR® CFL Fixtures National Grid 0% 0% 0% 100%
Low Income – Freezers National Grid 0% 0% 0% 100%
Low Income – Heating System Replacement (Oil) National Grid 0% 0% 0% 100%
Low Income – Torchieres National Grid 0% 0% 0% 100%
Low Income – Waterbed Mattress Replacement National Grid 0% 0% 0% 100%
Low Income – Window AC Replacement National Grid 0% 0% 0% 100%
Multifamily – Air Sealing National Grid 0% 0% 0% 100%
Multifamily – Air Sealing National Grid 0% 0% 0% 100%
Multifamily – DHW (Showerheads and Aerators) National Grid 0% 0% 0% 100%
Multifamily – DHW (Showerheads and Aerators) National Grid 0% 0% 0% 100%
Multifamily – DHW (Tank and Pipe Wrap) National Grid 0% 0% 0% 100%
Multifamily – DHW (Tank and Pipe Wrap) National Grid 0% 0% 0% 100%
Multifamily – Fixtures and CFLs National Grid 0% 0% 0% 100%
Multifamily – Fixtures and CFLs National Grid 0% 0% 0% 100%
Multifamily – Fixtures and CFLs National Grid 0% 0% 0% 100%
Multifamily – Fixtures and CFLs National Grid 0% 0% 0% 100%
Multifamily – Heat Pump Tune-Up National Grid 3% 0% 0% 97%
Multifamily – Insulation (Walls, Roof, Floor) National Grid 0% 0% 0% 100%
Multifamily – Insulation (Walls, Roof, Floor) National Grid 0% 0% 0% 100%
Multifamily – Refrigerators and Freezers National Grid 0% 0% 0% 100%
Multifamily – Refrigerators and Freezers National Grid 0% 0% 0% 100%
Multifamily – Thermostats National Grid 0% 0% 0% 100%
Multifamily – Thermostats National Grid 0% 0% 0% 100%
* The Net-to-Gross factors for Residential Lighting CFL measures are accounted for in the In Service Rate factor.
EVALUATIONS
� ENERGY STAR® Lighting: Impact Evaluation for MA, RI, and VT Residential Lighting Program
Study, 2004 and the Massachusetts Energy Star Lighting Evaluation.503 � MassSAVE: National Grid bases the NTG factors on the Multi Year Evaluation of the MA Home
Energy Service Program, Process Evaluation Summary Report, 2004 and the 2010 Net-to-Gross Home
Energy Assessment Report.504
503 NMR (2011). Massachusetts ENERGY STAR ® Lighting Program: 2010 Annual Report. Prepared for Massachusetts Energy Efficiency Program Administrators and Massachusetts Energy Efficiency Advisory Council. Study 8 in the 2010 Massachusetts Electric Energy Efficiency Annual Report.
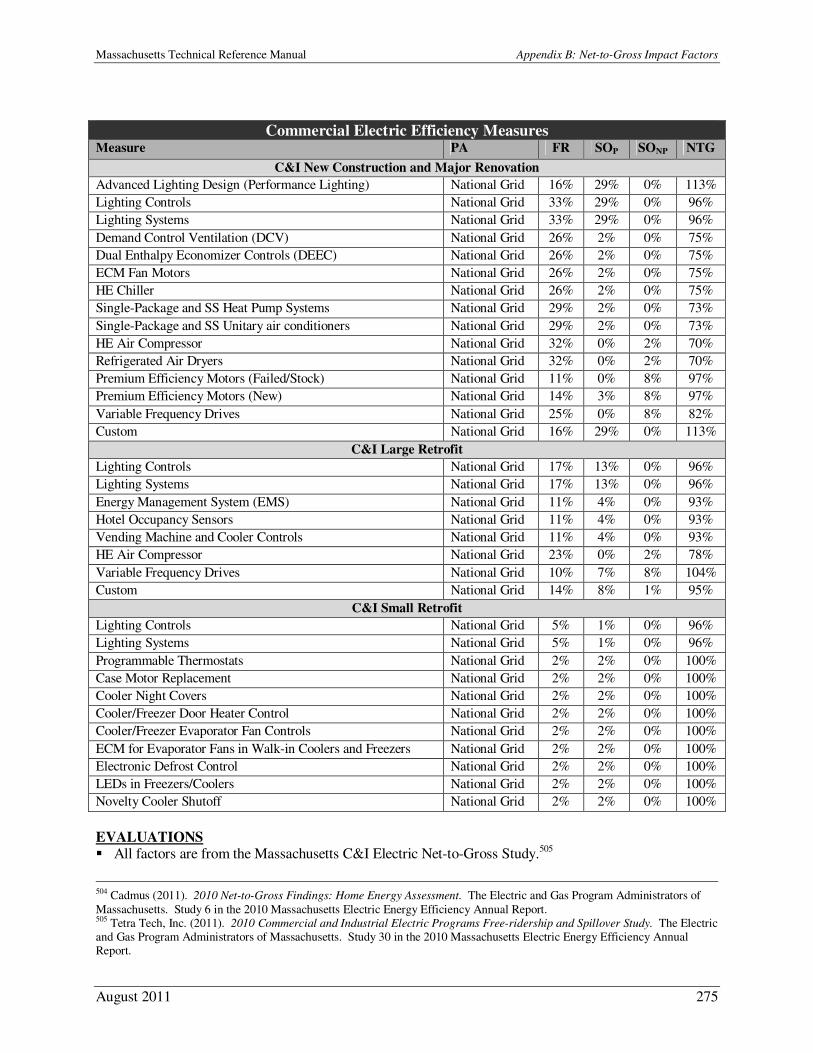
Massachusetts Technical Reference Manual Appendix B: Net-to-Gross Impact Factors
August 2011 275
Commercial Electric Efficiency Measures Measure PA FR SOP SONP NTG
C&I New Construction and Major Renovation
Advanced Lighting Design (Performance Lighting) National Grid 16% 29% 0% 113%
Lighting Controls National Grid 33% 29% 0% 96%
Lighting Systems National Grid 33% 29% 0% 96%
Demand Control Ventilation (DCV) National Grid 26% 2% 0% 75%
Dual Enthalpy Economizer Controls (DEEC) National Grid 26% 2% 0% 75%
ECM Fan Motors National Grid 26% 2% 0% 75%
HE Chiller National Grid 26% 2% 0% 75%
Single-Package and SS Heat Pump Systems National Grid 29% 2% 0% 73%
Single-Package and SS Unitary air conditioners National Grid 29% 2% 0% 73%
HE Air Compressor National Grid 32% 0% 2% 70%
Refrigerated Air Dryers National Grid 32% 0% 2% 70%
Premium Efficiency Motors (Failed/Stock) National Grid 11% 0% 8% 97%
Premium Efficiency Motors (New) National Grid 14% 3% 8% 97%
Variable Frequency Drives National Grid 25% 0% 8% 82%
Custom National Grid 16% 29% 0% 113%
C&I Large Retrofit
Lighting Controls National Grid 17% 13% 0% 96%
Lighting Systems National Grid 17% 13% 0% 96%
Energy Management System (EMS) National Grid 11% 4% 0% 93%
Hotel Occupancy Sensors National Grid 11% 4% 0% 93%
Vending Machine and Cooler Controls National Grid 11% 4% 0% 93%
HE Air Compressor National Grid 23% 0% 2% 78%
Variable Frequency Drives National Grid 10% 7% 8% 104%
Custom National Grid 14% 8% 1% 95%
C&I Small Retrofit
Lighting Controls National Grid 5% 1% 0% 96%
Lighting Systems National Grid 5% 1% 0% 96%
Programmable Thermostats National Grid 2% 2% 0% 100%
Case Motor Replacement National Grid 2% 2% 0% 100%
Cooler Night Covers National Grid 2% 2% 0% 100%
Cooler/Freezer Door Heater Control National Grid 2% 2% 0% 100%
Cooler/Freezer Evaporator Fan Controls National Grid 2% 2% 0% 100%
ECM for Evaporator Fans in Walk-in Coolers and Freezers National Grid 2% 2% 0% 100%
Electronic Defrost Control National Grid 2% 2% 0% 100%
LEDs in Freezers/Coolers National Grid 2% 2% 0% 100%
Novelty Cooler Shutoff National Grid 2% 2% 0% 100%
EVALUATIONS
� All factors are from the Massachusetts C&I Electric Net-to-Gross Study.505
504 Cadmus (2011). 2010 Net-to-Gross Findings: Home Energy Assessment. The Electric and Gas Program Administrators of
Massachusetts. Study 6 in the 2010 Massachusetts Electric Energy Efficiency Annual Report. 505 Tetra Tech, Inc. (2011). 2010 Commercial and Industrial Electric Programs Free-ridership and Spillover Study. The Electric and Gas Program Administrators of Massachusetts. Study 30 in the 2010 Massachusetts Electric Energy Efficiency Annual Report.
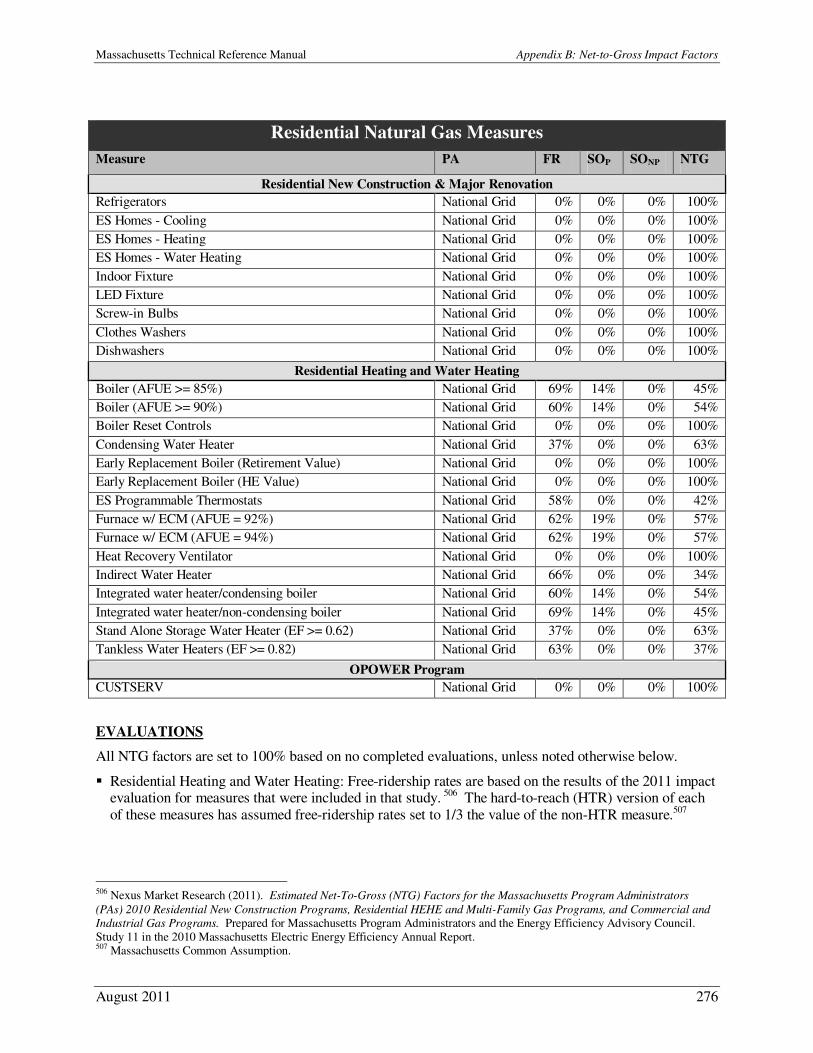
Massachusetts Technical Reference Manual Appendix B: Net-to-Gross Impact Factors
August 2011 276
Residential Natural Gas Measures
Measure PA FR SOP SONP NTG
Residential New Construction & Major Renovation
Refrigerators National Grid 0% 0% 0% 100%
ES Homes - Cooling National Grid 0% 0% 0% 100%
ES Homes - Heating National Grid 0% 0% 0% 100%
ES Homes - Water Heating National Grid 0% 0% 0% 100%
Indoor Fixture National Grid 0% 0% 0% 100%
LED Fixture National Grid 0% 0% 0% 100%
Screw-in Bulbs National Grid 0% 0% 0% 100%
Clothes Washers National Grid 0% 0% 0% 100%
Dishwashers National Grid 0% 0% 0% 100%
Residential Heating and Water Heating
Boiler (AFUE >= 85%) National Grid 69% 14% 0% 45%
Boiler (AFUE >= 90%) National Grid 60% 14% 0% 54%
Boiler Reset Controls National Grid 0% 0% 0% 100%
Condensing Water Heater National Grid 37% 0% 0% 63%
Early Replacement Boiler (Retirement Value) National Grid 0% 0% 0% 100%
Early Replacement Boiler (HE Value) National Grid 0% 0% 0% 100%
ES Programmable Thermostats National Grid 58% 0% 0% 42%
Furnace w/ ECM (AFUE = 92%) National Grid 62% 19% 0% 57%
Furnace w/ ECM (AFUE = 94%) National Grid 62% 19% 0% 57%
Heat Recovery Ventilator National Grid 0% 0% 0% 100%
Indirect Water Heater National Grid 66% 0% 0% 34%
Integrated water heater/condensing boiler National Grid 60% 14% 0% 54%
Integrated water heater/non-condensing boiler National Grid 69% 14% 0% 45%
Stand Alone Storage Water Heater (EF >= 0.62) National Grid 37% 0% 0% 63%
Tankless Water Heaters (EF >= 0.82) National Grid 63% 0% 0% 37%
OPOWER Program
CUSTSERV National Grid 0% 0% 0% 100%
EVALUATIONS
All NTG factors are set to 100% based on no completed evaluations, unless noted otherwise below.
� Residential Heating and Water Heating: Free-ridership rates are based on the results of the 2011 impact evaluation for measures that were included in that study. 506 The hard-to-reach (HTR) version of each
of these measures has assumed free-ridership rates set to 1/3 the value of the non-HTR measure.507
506 Nexus Market Research (2011). Estimated Net-To-Gross (NTG) Factors for the Massachusetts Program Administrators
(PAs) 2010 Residential New Construction Programs, Residential HEHE and Multi-Family Gas Programs, and Commercial and
Industrial Gas Programs. Prepared for Massachusetts Program Administrators and the Energy Efficiency Advisory Council. Study 11 in the 2010 Massachusetts Electric Energy Efficiency Annual Report. 507 Massachusetts Common Assumption.
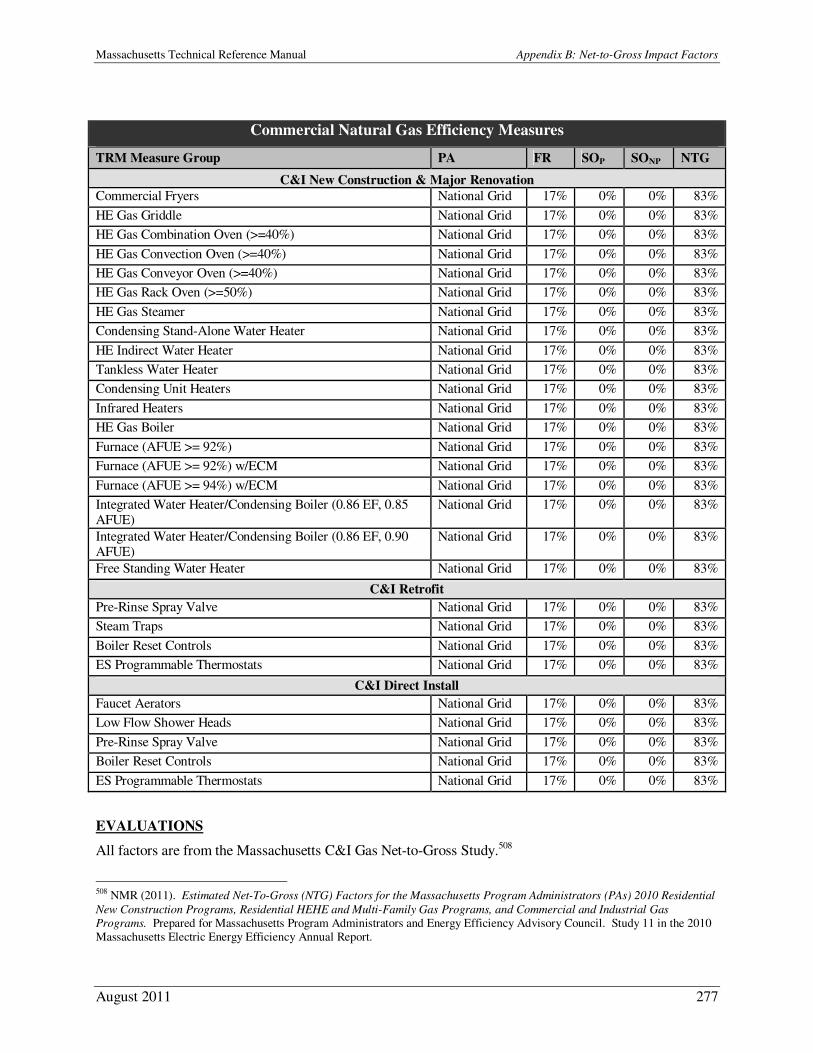
Massachusetts Technical Reference Manual Appendix B: Net-to-Gross Impact Factors
August 2011 277
Commercial Natural Gas Efficiency Measures
TRM Measure Group PA FR SOP SONP NTG
C&I New Construction & Major Renovation
Commercial Fryers National Grid 17% 0% 0% 83%
HE Gas Griddle National Grid 17% 0% 0% 83%
HE Gas Combination Oven (>=40%) National Grid 17% 0% 0% 83%
HE Gas Convection Oven (>=40%) National Grid 17% 0% 0% 83%
HE Gas Conveyor Oven (>=40%) National Grid 17% 0% 0% 83%
HE Gas Rack Oven (>=50%) National Grid 17% 0% 0% 83%
HE Gas Steamer National Grid 17% 0% 0% 83%
Condensing Stand-Alone Water Heater National Grid 17% 0% 0% 83%
HE Indirect Water Heater National Grid 17% 0% 0% 83%
Tankless Water Heater National Grid 17% 0% 0% 83%
Condensing Unit Heaters National Grid 17% 0% 0% 83%
Infrared Heaters National Grid 17% 0% 0% 83%
HE Gas Boiler National Grid 17% 0% 0% 83%
Furnace (AFUE >= 92%) National Grid 17% 0% 0% 83%
Furnace (AFUE >= 92%) w/ECM National Grid 17% 0% 0% 83%
Furnace (AFUE >= 94%) w/ECM National Grid 17% 0% 0% 83%
Integrated Water Heater/Condensing Boiler (0.86 EF, 0.85 AFUE)
National Grid 17% 0% 0% 83%
Integrated Water Heater/Condensing Boiler (0.86 EF, 0.90 AFUE)
National Grid 17% 0% 0% 83%
Free Standing Water Heater National Grid 17% 0% 0% 83%
C&I Retrofit
Pre-Rinse Spray Valve National Grid 17% 0% 0% 83%
Steam Traps National Grid 17% 0% 0% 83%
Boiler Reset Controls National Grid 17% 0% 0% 83%
ES Programmable Thermostats National Grid 17% 0% 0% 83%
C&I Direct Install
Faucet Aerators National Grid 17% 0% 0% 83%
Low Flow Shower Heads National Grid 17% 0% 0% 83%
Pre-Rinse Spray Valve National Grid 17% 0% 0% 83%
Boiler Reset Controls National Grid 17% 0% 0% 83%
ES Programmable Thermostats National Grid 17% 0% 0% 83%
EVALUATIONS
All factors are from the Massachusetts C&I Gas Net-to-Gross Study.508
508 NMR (2011). Estimated Net-To-Gross (NTG) Factors for the Massachusetts Program Administrators (PAs) 2010 Residential
New Construction Programs, Residential HEHE and Multi-Family Gas Programs, and Commercial and Industrial Gas
Programs. Prepared for Massachusetts Program Administrators and Energy Efficiency Advisory Council. Study 11 in the 2010 Massachusetts Electric Energy Efficiency Annual Report.

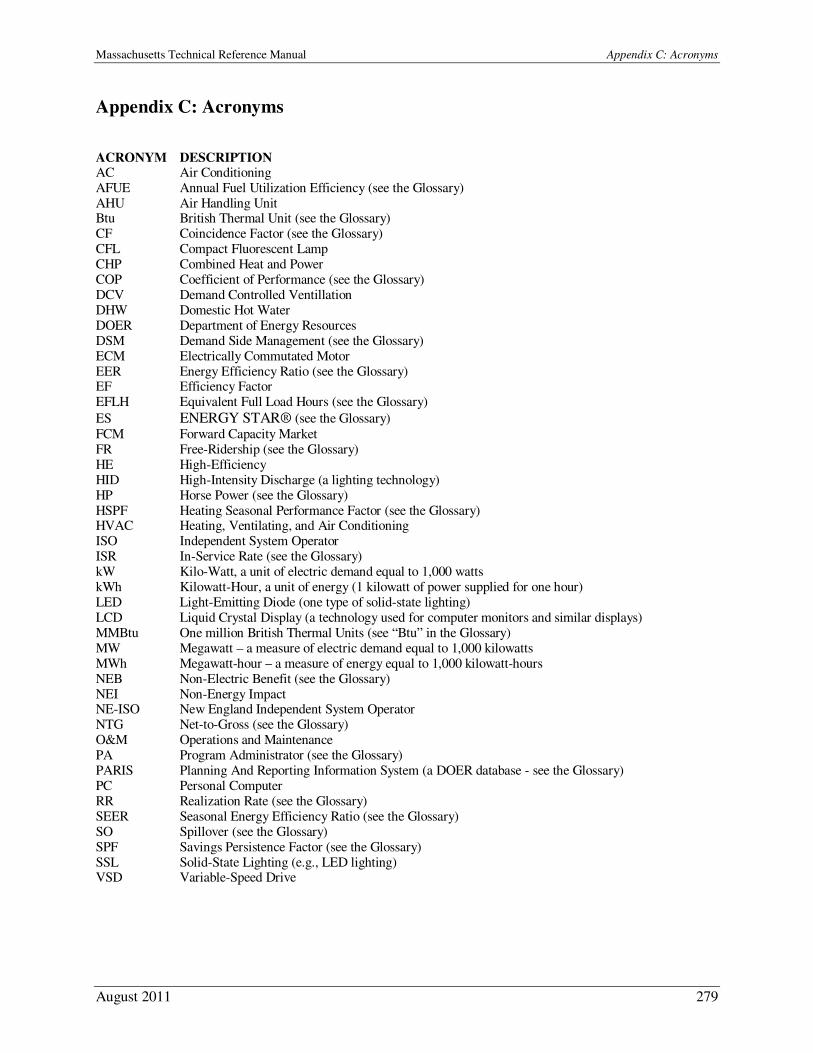
Massachusetts Technical Reference Manual Appendix C: Acronyms
August 2011 279
Appendix C: Acronyms
ACRONYM DESCRIPTION AC Air Conditioning AFUE Annual Fuel Utilization Efficiency (see the Glossary) AHU Air Handling Unit Btu British Thermal Unit (see the Glossary) CF Coincidence Factor (see the Glossary) CFL Compact Fluorescent Lamp CHP Combined Heat and Power COP Coefficient of Performance (see the Glossary) DCV Demand Controlled Ventillation DHW Domestic Hot Water DOER Department of Energy Resources DSM Demand Side Management (see the Glossary) ECM Electrically Commutated Motor EER Energy Efficiency Ratio (see the Glossary) EF Efficiency Factor EFLH Equivalent Full Load Hours (see the Glossary)
ES ENERGY STAR® (see the Glossary)
FCM Forward Capacity Market FR Free-Ridership (see the Glossary) HE High-Efficiency HID High-Intensity Discharge (a lighting technology) HP Horse Power (see the Glossary) HSPF Heating Seasonal Performance Factor (see the Glossary) HVAC Heating, Ventilating, and Air Conditioning ISO Independent System Operator ISR In-Service Rate (see the Glossary) kW Kilo-Watt, a unit of electric demand equal to 1,000 watts kWh Kilowatt-Hour, a unit of energy (1 kilowatt of power supplied for one hour) LED Light-Emitting Diode (one type of solid-state lighting) LCD Liquid Crystal Display (a technology used for computer monitors and similar displays) MMBtu One million British Thermal Units (see “Btu” in the Glossary) MW Megawatt – a measure of electric demand equal to 1,000 kilowatts MWh Megawatt-hour – a measure of energy equal to 1,000 kilowatt-hours NEB Non-Electric Benefit (see the Glossary) NEI Non-Energy Impact NE-ISO New England Independent System Operator NTG Net-to-Gross (see the Glossary) O&M Operations and Maintenance PA Program Administrator (see the Glossary) PARIS Planning And Reporting Information System (a DOER database - see the Glossary) PC Personal Computer RR Realization Rate (see the Glossary) SEER Seasonal Energy Efficiency Ratio (see the Glossary) SO Spillover (see the Glossary) SPF Savings Persistence Factor (see the Glossary) SSL Solid-State Lighting (e.g., LED lighting) VSD Variable-Speed Drive
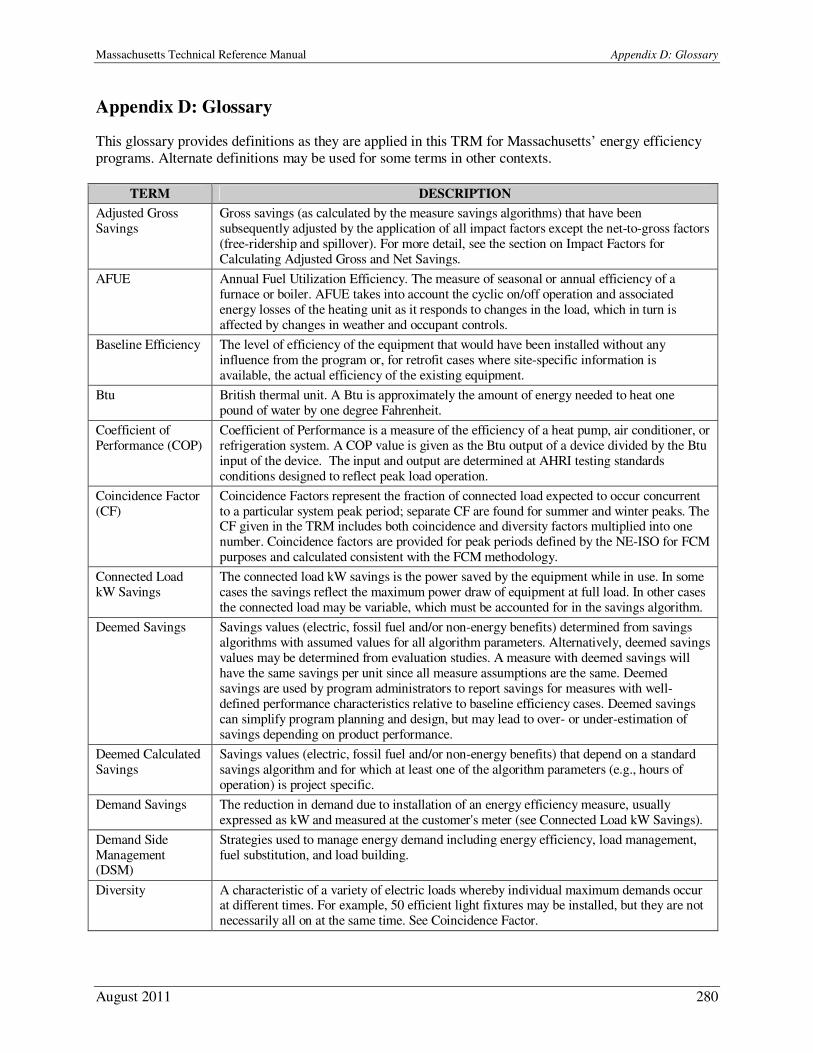
Massachusetts Technical Reference Manual Appendix D: Glossary
August 2011 280
Appendix D: Glossary
This glossary provides definitions as they are applied in this TRM for Massachusetts’ energy efficiency
programs. Alternate definitions may be used for some terms in other contexts.
TERM DESCRIPTION
Adjusted Gross Savings
Gross savings (as calculated by the measure savings algorithms) that have been subsequently adjusted by the application of all impact factors except the net-to-gross factors (free-ridership and spillover). For more detail, see the section on Impact Factors for Calculating Adjusted Gross and Net Savings.
AFUE Annual Fuel Utilization Efficiency. The measure of seasonal or annual efficiency of a furnace or boiler. AFUE takes into account the cyclic on/off operation and associated energy losses of the heating unit as it responds to changes in the load, which in turn is affected by changes in weather and occupant controls.
Baseline Efficiency The level of efficiency of the equipment that would have been installed without any influence from the program or, for retrofit cases where site-specific information is available, the actual efficiency of the existing equipment.
Btu British thermal unit. A Btu is approximately the amount of energy needed to heat one pound of water by one degree Fahrenheit.
Coefficient of Performance (COP)
Coefficient of Performance is a measure of the efficiency of a heat pump, air conditioner, or refrigeration system. A COP value is given as the Btu output of a device divided by the Btu input of the device. The input and output are determined at AHRI testing standards conditions designed to reflect peak load operation.
Coincidence Factor (CF)
Coincidence Factors represent the fraction of connected load expected to occur concurrent to a particular system peak period; separate CF are found for summer and winter peaks. The CF given in the TRM includes both coincidence and diversity factors multiplied into one number. Coincidence factors are provided for peak periods defined by the NE-ISO for FCM purposes and calculated consistent with the FCM methodology.
Connected Load kW Savings
The connected load kW savings is the power saved by the equipment while in use. In some cases the savings reflect the maximum power draw of equipment at full load. In other cases the connected load may be variable, which must be accounted for in the savings algorithm.
Deemed Savings Savings values (electric, fossil fuel and/or non-energy benefits) determined from savings algorithms with assumed values for all algorithm parameters. Alternatively, deemed savings values may be determined from evaluation studies. A measure with deemed savings will have the same savings per unit since all measure assumptions are the same. Deemed savings are used by program administrators to report savings for measures with well-defined performance characteristics relative to baseline efficiency cases. Deemed savings can simplify program planning and design, but may lead to over- or under-estimation of savings depending on product performance.
Deemed Calculated Savings
Savings values (electric, fossil fuel and/or non-energy benefits) that depend on a standard savings algorithm and for which at least one of the algorithm parameters (e.g., hours of operation) is project specific.
Demand Savings The reduction in demand due to installation of an energy efficiency measure, usually expressed as kW and measured at the customer's meter (see Connected Load kW Savings).
Demand Side Management (DSM)
Strategies used to manage energy demand including energy efficiency, load management, fuel substitution, and load building.
Diversity A characteristic of a variety of electric loads whereby individual maximum demands occur at different times. For example, 50 efficient light fixtures may be installed, but they are not necessarily all on at the same time. See Coincidence Factor.
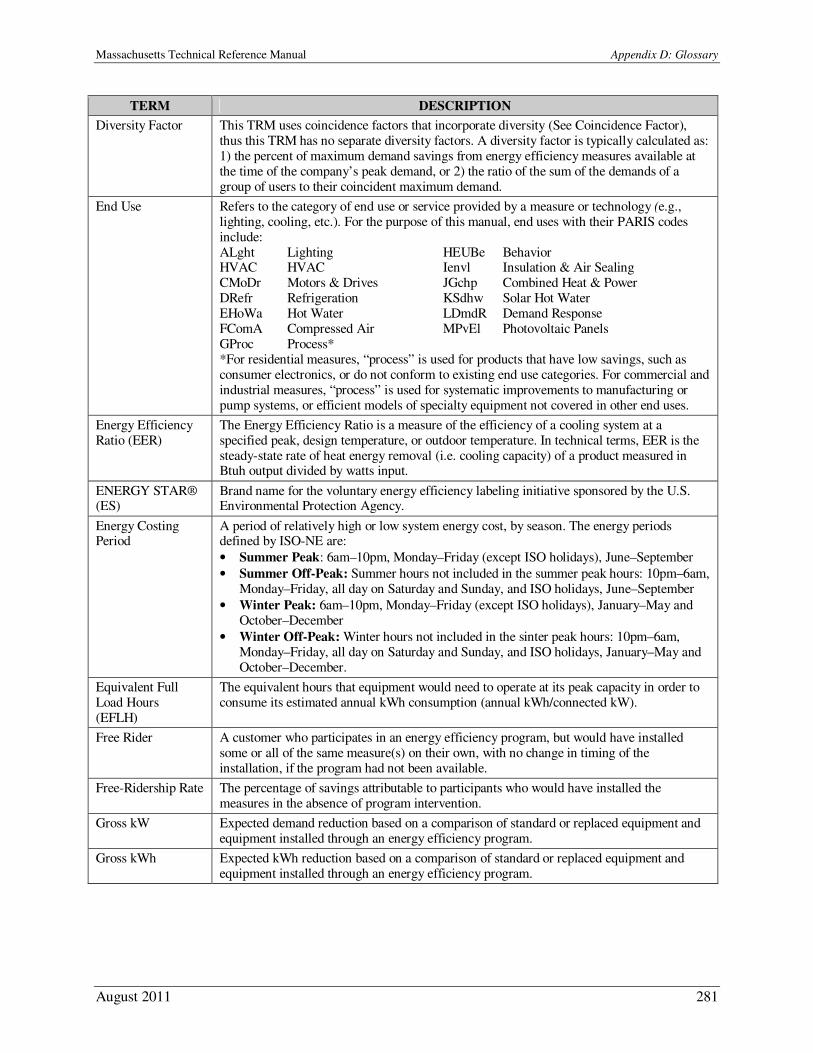
Massachusetts Technical Reference Manual Appendix D: Glossary
August 2011 281
TERM DESCRIPTION
Diversity Factor This TRM uses coincidence factors that incorporate diversity (See Coincidence Factor), thus this TRM has no separate diversity factors. A diversity factor is typically calculated as: 1) the percent of maximum demand savings from energy efficiency measures available at the time of the company’s peak demand, or 2) the ratio of the sum of the demands of a group of users to their coincident maximum demand.
End Use Refers to the category of end use or service provided by a measure or technology (e.g., lighting, cooling, etc.). For the purpose of this manual, end uses with their PARIS codes include: ALght Lighting HEUBe Behavior HVAC HVAC Ienvl Insulation & Air Sealing CMoDr Motors & Drives JGchp Combined Heat & Power DRefr Refrigeration KSdhw Solar Hot Water EHoWa Hot Water LDmdR Demand Response FComA Compressed Air MPvEl Photovoltaic Panels GProc Process* *For residential measures, “process” is used for products that have low savings, such as consumer electronics, or do not conform to existing end use categories. For commercial and industrial measures, “process” is used for systematic improvements to manufacturing or pump systems, or efficient models of specialty equipment not covered in other end uses.
Energy Efficiency Ratio (EER)
The Energy Efficiency Ratio is a measure of the efficiency of a cooling system at a specified peak, design temperature, or outdoor temperature. In technical terms, EER is the steady-state rate of heat energy removal (i.e. cooling capacity) of a product measured in Btuh output divided by watts input.
ENERGY STAR® (ES)
Brand name for the voluntary energy efficiency labeling initiative sponsored by the U.S. Environmental Protection Agency.
Energy Costing Period
A period of relatively high or low system energy cost, by season. The energy periods defined by ISO-NE are:
• Summer Peak: 6am–10pm, Monday–Friday (except ISO holidays), June–September
• Summer Off-Peak: Summer hours not included in the summer peak hours: 10pm–6am, Monday–Friday, all day on Saturday and Sunday, and ISO holidays, June–September
• Winter Peak: 6am–10pm, Monday–Friday (except ISO holidays), January–May and October–December
• Winter Off-Peak: Winter hours not included in the sinter peak hours: 10pm–6am, Monday–Friday, all day on Saturday and Sunday, and ISO holidays, January–May and October–December.
Equivalent Full Load Hours (EFLH)
The equivalent hours that equipment would need to operate at its peak capacity in order to consume its estimated annual kWh consumption (annual kWh/connected kW).
Free Rider A customer who participates in an energy efficiency program, but would have installed some or all of the same measure(s) on their own, with no change in timing of the installation, if the program had not been available.
Free-Ridership Rate The percentage of savings attributable to participants who would have installed the measures in the absence of program intervention.
Gross kW Expected demand reduction based on a comparison of standard or replaced equipment and equipment installed through an energy efficiency program.
Gross kWh Expected kWh reduction based on a comparison of standard or replaced equipment and equipment installed through an energy efficiency program.
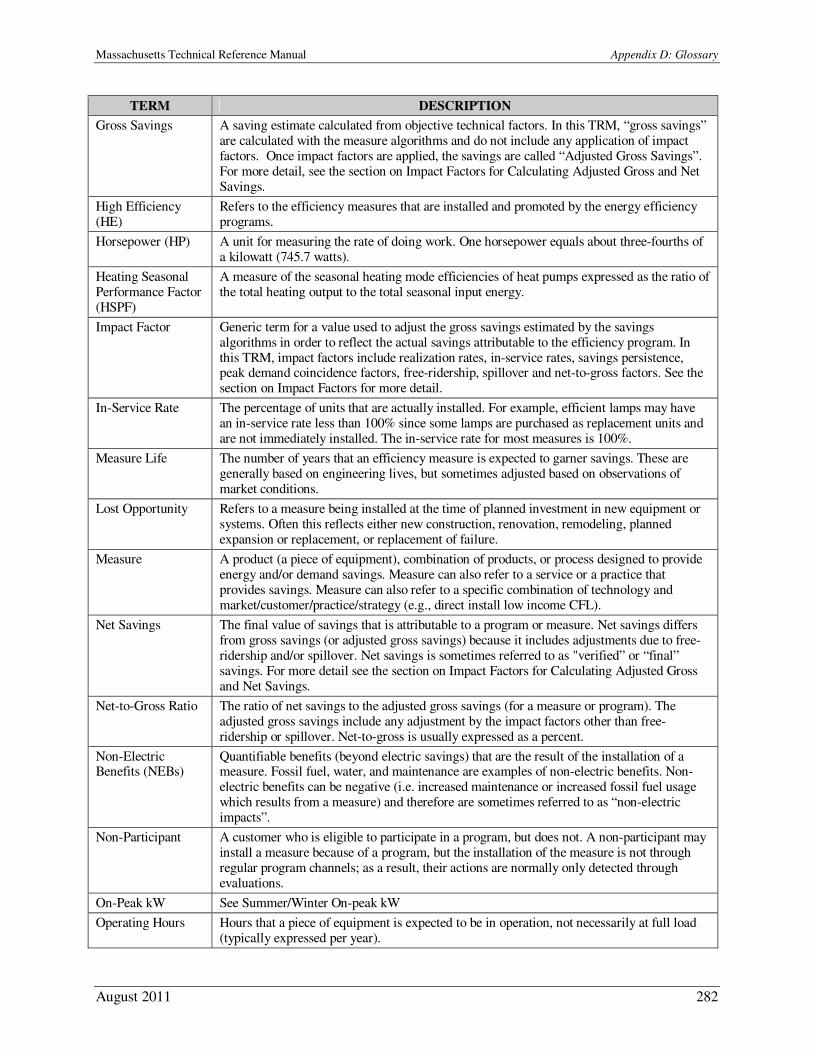
Massachusetts Technical Reference Manual Appendix D: Glossary
August 2011 282
TERM DESCRIPTION
Gross Savings A saving estimate calculated from objective technical factors. In this TRM, “gross savings” are calculated with the measure algorithms and do not include any application of impact factors. Once impact factors are applied, the savings are called “Adjusted Gross Savings”. For more detail, see the section on Impact Factors for Calculating Adjusted Gross and Net Savings.
High Efficiency (HE)
Refers to the efficiency measures that are installed and promoted by the energy efficiency programs.
Horsepower (HP) A unit for measuring the rate of doing work. One horsepower equals about three-fourths of a kilowatt (745.7 watts).
Heating Seasonal Performance Factor (HSPF)
A measure of the seasonal heating mode efficiencies of heat pumps expressed as the ratio of the total heating output to the total seasonal input energy.
Impact Factor Generic term for a value used to adjust the gross savings estimated by the savings algorithms in order to reflect the actual savings attributable to the efficiency program. In this TRM, impact factors include realization rates, in-service rates, savings persistence, peak demand coincidence factors, free-ridership, spillover and net-to-gross factors. See the section on Impact Factors for more detail.
In-Service Rate The percentage of units that are actually installed. For example, efficient lamps may have an in-service rate less than 100% since some lamps are purchased as replacement units and are not immediately installed. The in-service rate for most measures is 100%.
Measure Life The number of years that an efficiency measure is expected to garner savings. These are generally based on engineering lives, but sometimes adjusted based on observations of market conditions.
Lost Opportunity Refers to a measure being installed at the time of planned investment in new equipment or systems. Often this reflects either new construction, renovation, remodeling, planned expansion or replacement, or replacement of failure.
Measure A product (a piece of equipment), combination of products, or process designed to provide energy and/or demand savings. Measure can also refer to a service or a practice that provides savings. Measure can also refer to a specific combination of technology and market/customer/practice/strategy (e.g., direct install low income CFL).
Net Savings The final value of savings that is attributable to a program or measure. Net savings differs from gross savings (or adjusted gross savings) because it includes adjustments due to free-ridership and/or spillover. Net savings is sometimes referred to as "verified” or “final” savings. For more detail see the section on Impact Factors for Calculating Adjusted Gross and Net Savings.
Net-to-Gross Ratio The ratio of net savings to the adjusted gross savings (for a measure or program). The adjusted gross savings include any adjustment by the impact factors other than free-ridership or spillover. Net-to-gross is usually expressed as a percent.
Non-Electric Benefits (NEBs)
Quantifiable benefits (beyond electric savings) that are the result of the installation of a measure. Fossil fuel, water, and maintenance are examples of non-electric benefits. Non-electric benefits can be negative (i.e. increased maintenance or increased fossil fuel usage which results from a measure) and therefore are sometimes referred to as “non-electric impacts”.
Non-Participant A customer who is eligible to participate in a program, but does not. A non-participant may install a measure because of a program, but the installation of the measure is not through regular program channels; as a result, their actions are normally only detected through evaluations.
On-Peak kW See Summer/Winter On-peak kW
Operating Hours Hours that a piece of equipment is expected to be in operation, not necessarily at full load (typically expressed per year).
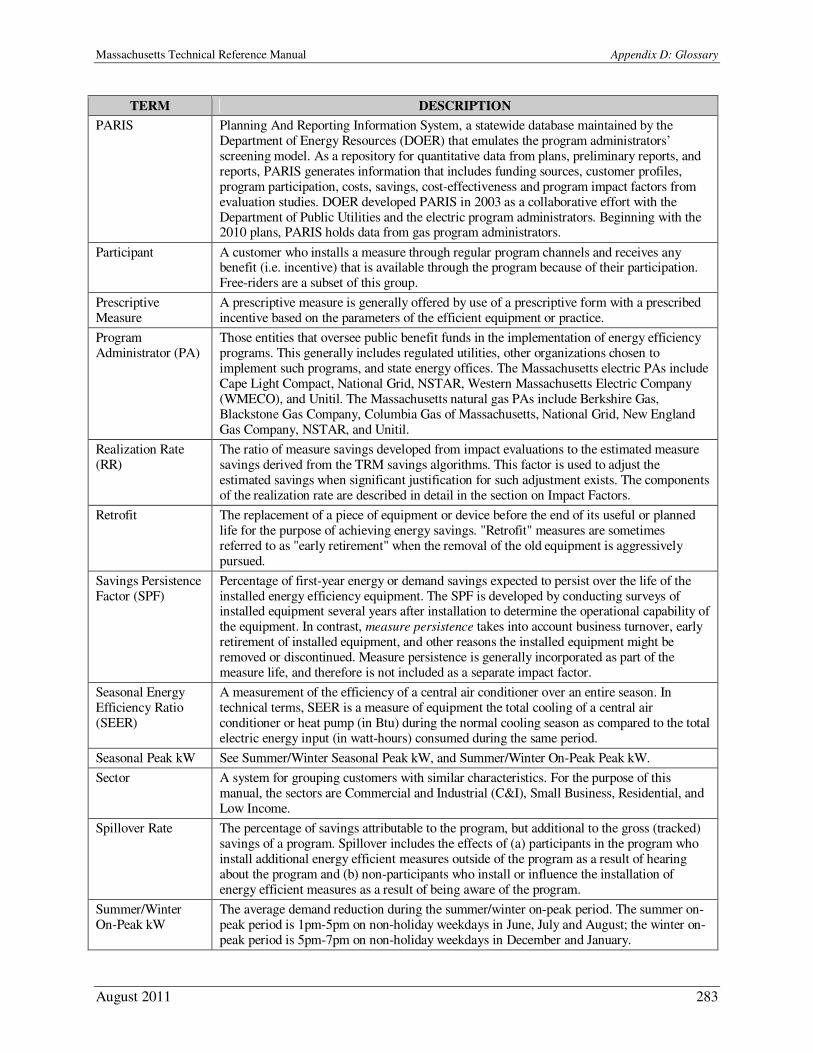
Massachusetts Technical Reference Manual Appendix D: Glossary
August 2011 283
TERM DESCRIPTION
PARIS Planning And Reporting Information System, a statewide database maintained by the Department of Energy Resources (DOER) that emulates the program administrators’ screening model. As a repository for quantitative data from plans, preliminary reports, and reports, PARIS generates information that includes funding sources, customer profiles, program participation, costs, savings, cost-effectiveness and program impact factors from evaluation studies. DOER developed PARIS in 2003 as a collaborative effort with the Department of Public Utilities and the electric program administrators. Beginning with the 2010 plans, PARIS holds data from gas program administrators.
Participant A customer who installs a measure through regular program channels and receives any benefit (i.e. incentive) that is available through the program because of their participation. Free-riders are a subset of this group.
Prescriptive Measure
A prescriptive measure is generally offered by use of a prescriptive form with a prescribed incentive based on the parameters of the efficient equipment or practice.
Program Administrator (PA)
Those entities that oversee public benefit funds in the implementation of energy efficiency programs. This generally includes regulated utilities, other organizations chosen to implement such programs, and state energy offices. The Massachusetts electric PAs include Cape Light Compact, National Grid, NSTAR, Western Massachusetts Electric Company (WMECO), and Unitil. The Massachusetts natural gas PAs include Berkshire Gas, Blackstone Gas Company, Columbia Gas of Massachusetts, National Grid, New England Gas Company, NSTAR, and Unitil.
Realization Rate (RR)
The ratio of measure savings developed from impact evaluations to the estimated measure savings derived from the TRM savings algorithms. This factor is used to adjust the estimated savings when significant justification for such adjustment exists. The components of the realization rate are described in detail in the section on Impact Factors.
Retrofit The replacement of a piece of equipment or device before the end of its useful or planned life for the purpose of achieving energy savings. "Retrofit" measures are sometimes referred to as "early retirement" when the removal of the old equipment is aggressively pursued.
Savings Persistence Factor (SPF)
Percentage of first-year energy or demand savings expected to persist over the life of the installed energy efficiency equipment. The SPF is developed by conducting surveys of installed equipment several years after installation to determine the operational capability of the equipment. In contrast, measure persistence takes into account business turnover, early retirement of installed equipment, and other reasons the installed equipment might be removed or discontinued. Measure persistence is generally incorporated as part of the measure life, and therefore is not included as a separate impact factor.
Seasonal Energy Efficiency Ratio (SEER)
A measurement of the efficiency of a central air conditioner over an entire season. In technical terms, SEER is a measure of equipment the total cooling of a central air conditioner or heat pump (in Btu) during the normal cooling season as compared to the total electric energy input (in watt-hours) consumed during the same period.
Seasonal Peak kW See Summer/Winter Seasonal Peak kW, and Summer/Winter On-Peak Peak kW.
Sector A system for grouping customers with similar characteristics. For the purpose of this manual, the sectors are Commercial and Industrial (C&I), Small Business, Residential, and Low Income.
Spillover Rate The percentage of savings attributable to the program, but additional to the gross (tracked) savings of a program. Spillover includes the effects of (a) participants in the program who install additional energy efficient measures outside of the program as a result of hearing about the program and (b) non-participants who install or influence the installation of energy efficient measures as a result of being aware of the program.
Summer/Winter On-Peak kW
The average demand reduction during the summer/winter on-peak period. The summer on-peak period is 1pm-5pm on non-holiday weekdays in June, July and August; the winter on-peak period is 5pm-7pm on non-holiday weekdays in December and January.
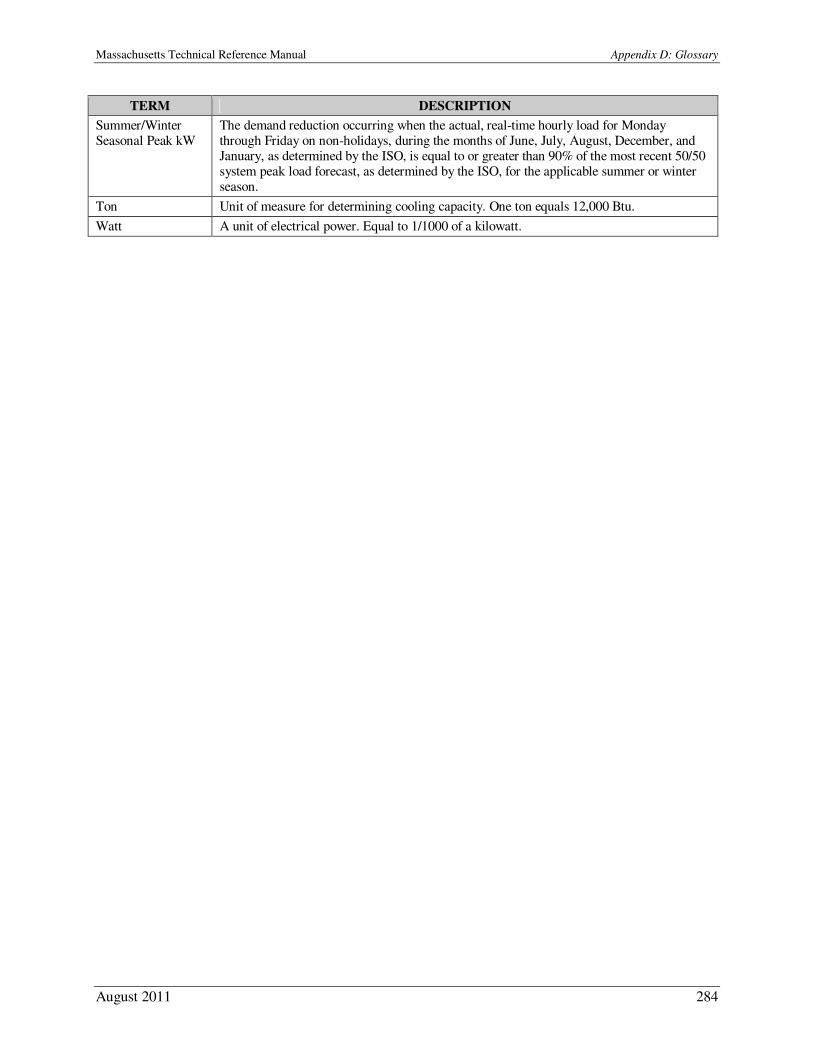
Massachusetts Technical Reference Manual Appendix D: Glossary
August 2011 284
TERM DESCRIPTION
Summer/Winter Seasonal Peak kW
The demand reduction occurring when the actual, real-time hourly load for Monday through Friday on non-holidays, during the months of June, July, August, December, and January, as determined by the ISO, is equal to or greater than 90% of the most recent 50/50 system peak load forecast, as determined by the ISO, for the applicable summer or winter season.
Ton Unit of measure for determining cooling capacity. One ton equals 12,000 Btu.
Watt A unit of electrical power. Equal to 1/1000 of a kilowatt.

Massachusetts Technical Reference Manual Appendix D: Glossary
August 2011 285