MASSACHUSETTS OPERATION STOREFRONT many participants in Operation Storefront who dedicated their...
25
MASSACHUSETTS OPERATION STOREFRONT - 1998 - It’s Time We Made Smoking History
-
Upload
nguyendung -
Category
Documents
-
view
213 -
download
1
Transcript of MASSACHUSETTS OPERATION STOREFRONT many participants in Operation Storefront who dedicated their...

M A S S A C H U S E T T SOPERATION STOREFRONT -1998 -
It’s Time We Made Smoking History

The M a ss a chus e t t s Toba cco C ont rol
Progr am (MTCP) wishes to recognize
t he m any pa r t i c ipant s in O p e r a t ion
St oref ront who dedica t ed t he i r t ime
and ef for t s to the document a t ion of
storef ront adver t isement s wi thin the ir
loca l communi t i es. Youth and adul t s
f rom loca l boards of he a l th, communi t y
coa l i t ions, and other agenci es f unded
through the He a l th Prot ect ion Fund,
in addi t ion to par t ic ipant s f rom non-
f unded a g enc i e s, w e r e cr uc i a l in
put t ing t h i s compr e hens i v e sur v e y
toge ther.
The M a ss a chus e t t s Toba cco C ont rol
P r o g r a m i s o p e r a t e d b y t h e
Massachuse t t s Depar t ment of Publ ic
H e a l t h u n d e r t h e d i r e c t i o n o f
C omm i ss ione r H ow a rd Koh, M . D,
M. P. H. The progr am is adm ini s t ered
w i t h in t he B ur e au of Fa m i l y and
Communi t y He a l th, which is direct ed
by Debor ah Kl e in Wa lker, Ed.D.
This repor t was prepared by Gregor y
N. Connolly, Carolyn Celebucki, Geoffrey
Wayne, Kerr y Disk in, and Dor is Cul l en
of the Massachuse t t s Tobacco Cont rol
Progr am; and Denise Lymper is, MTCP
consul t ant. The repor t could not have
be en produced wi thout the assist ance
f r o m a n d c o n t r i b u t i o n s b y t h e
fol lowing indi v idua ls: Harr i e t Robbins,
S p e c i a l A dv i sor, M T C P ; Jos eph
Morr issey, Regiona l Fi e ld Director and
Proj ect Manager of Oper a t ion St ore
Front ; B r uc e C ohen, Dire c t or of
Research and Epidemiology, Bure au of
H e a l t h S t a t i s t i cs, R e s e a rch, and
Ev a lua t ion; Se an Fi t zpa t r ick, Director
of Mar ke t ing and Medi a.
1
To obt a in addi t ional copies of this repor t, cont act Geof f rey Wayne a t:
Massachuset ts Depar tment of Publ ic Heal th
Massachuset ts Tobacco Control Program
250 Washington Street, 4th Floor
Boston, MA 02108-4619
(617) 624-5900
ACKNOWLEDGEMENTS

2
EXECUTIVE SUMMARY . . . . . . . . (P.3)
I . BACKGROUND . . . . . . . . . . (P.6)
I I . CAMPAIGN OVERVIEW . . . . . . (P.7)
I I I . CAMPAIGN RESULTS . . . . . . (P.10)
IV. DISCUSSION . . . . . . . . . (P.15)
APPENDIX A: INDUSTRY QUOTES . . . (P.19)
APPENDIX B: REGIONAL COMMUNITIES . (P.23)
APPENDIX C: TABLES . . . . . . . (P.24)
TABLE OF CONTENTS

BACKGROUND
The tobacco industry spent over $6 bil-
l ion in 1993 on advert isements and pro-
motions to at tract and keep customers,
par t icular ly youth. The 1994 Surgeon
General’s Report on Youth and Smoking
concluded tha t cigaret t e adver t ising
appears to increase substant ially the risk
of young people smoking. A wealth of
ev idence demonstra t es that tobacco
manuf acturers specif ically target youth
in their product adver t ising, and that
youth are inf luenced by such market ing:
•Internal industry documents reveal a
targeted campaign to capture the youth
market.
•Brands smoked by youth are more
heavily advertised in magazines with
large youth readership than in
other magazines.
•Non-smoking youth who can name a
favorite brand advertisement are more
susceptible to smoking uptake and are
more likely to become smokers.
•High school students in Massachusetts
who own a promotional item (such as
T-shirts, caps, or other ‘gear’) are more
than twice as likely to smoke as those
who do not.
OVERVIEW
Massachusetts Operat ion Storefront, a
study conducted by the Massachusetts
Depar tment of Publ ic Heal th, was
designed to assess the quant ity and type
of tobacco advert isements encountered
by youth in storefront advert ising during
the course of their normal daily act ivi-
t ies.
Participants in Operation Storefront— youth
and adults from the Massachusetts Tobacco
Control Program (MTCP) funded local
programs and other non-funded agencies—
surveyed more than 3,000 vendors in 125
Massachusetts cities and towns with a
combined population greater than 3,500,000.
The survey results document the high
levels of tobacco advert ising to which
our youth are exposed. These f indings
should encourage a voluntary reduct ion
of tobacco advert isements and promo-
t ions by local shop owners and the adop-
t ion of policies to protect our youth.
RESULTS
Tobacco advertisements made up 52% of
the more than 20,000 advertisements visible
to youth from outside retail establishments
surveyed from February through April 1998.
3
EXECUTIVE SUMMARY

Convenience stores and gas stations—
where the majority of youth obtain ciga-
ret t es—displayed the
largest propor t ion of
tobacco advertising (55%
of total advert isements).
Pharmacies and drug
stores displayed the
smal lest propor t ion of
tobacco ads (6%), fol-
lowed by department stores (9%), and
grocery stores (30%).
Brands smoked by youth (Marlboro,
Camel, Newpor t, Winston) were a lso
the most heavily adver tised brands,
account ing for more than two-thirds of
all tobacco ads.
Storefronts located within 1000 feet of a
school were more likely to display more
tobacco adver t isements per ret a i l
vendor, and displayed more ads per
vendor, than storefronts located f arther
away from schools- exposing children
to approximately one-and-a-hal f
t imes the tobacco adver t ising they
would otherwise encounter.
Establishments in poorer communities
displayed much higher numbers of
tobacco ads per vendor (5) in compari-
son to more aff luent communit ies (3), as
well as a greater percentage of retail
ads dedicated to tobacco (54%).
Minority communities
— especially areas clos-
er to schools — are sub-
jected to a much higher
proport ion of tobacco
advert ising, account ing
for more than one half of
all tobacco ads and only 40% of all other
retail ads. Menthol brands (Kool,
Newport) were 2-3 times more likely to
be advertised in minority areas.
4

5
Storefronts that displayed some form of
age or ID requirement had a lower per-
centage of tobacco adver tisement s.
DISCUSSION
Patterns of storefront tobacco advertis-
ing mirror patterns of youth purchasing.
Most youth buy cigaret tes—and are most
successful buying them—in convenience
stores and gas st a t ions, where the
majority of cigaret te advert isements are
displayed. Retail merchant rates of i l le-
gal sales were highest for convenience
stores and gas stat ions.
The brands that are most heavily adver-
tised mirror youth brand preferences.
Children are l ike ly to smoke wha t
they see advert ised. The brands account-
ing for 93% of youth smoking in
Massachuset ts were a lso the four
most displayed storef ront brands,
account ing for two-thirds of a l l
tobacco advert isements.
Tobacco adver tising increa ses with
proximity to schools. Storefronts near-
est to schools carry more tobacco adver-
t ising, display a greater percentage of
tobacco ads, and are less l ikely to display
age or ID requirements. While areas near
schools have been declared drug-free,
promotion of tobacco products in proxim-
ity to schools goes unchecked.
Poorer children a re more highly
exposed to tobacco adver tising, as the
industry concentrates advert ising in poor
and urban communit ies. As a result,
poorer children may be at higher risk for
tobacco use.
Minority children a re also more
highly exposed, par ticularly to adver-
t ising for menthol brands such
as Newpor t and Kool. Sevent y-three
percent (73%) of black youth smokers
and sixty-eight percent (68%) of Lat ino
youth smokers smoke Newpor t. The
predominance of tobacco advert ising in
minority areas is part icularly disturbing
in l ight of the recent nat ional r ise in
minority youth smoking rates.
The pervasiveness of tobacco adver-
tising can have a profound impact on
youth. Young people consistent ly over-
est imate the number of adult and youth
smokers. When more than half of retail
advert isements are tobacco ads, this can
distor t the real i t y of overal l smoking
prevalence and normalize or glamorize
smoking in the minds of youth.

I . BACKGROUND
\Tobacco products are among the most
heavily advert ised and widely promoted
products in America.1 Although tobacco
adver t ising has been banned f rom
television since 1971, the tobacco indus-
try spent more than $6 billion in 1993
alone on advert isements and promotions
to at tract and keep customers, through
such diverse media as magazines,
newspapers, outdoor and in-store adver-
t ising, point-of-purchase, direct mai l,
brand-ident if ied non-tobacco items, and
event sponsorship.1 The Food and Drug
Administrat ion determined in its invest i-
gat ion of tobacco advert ising that “young
people are indeed exposed to substantial
and unavoidable advert ising and promo-
t ion [of tobacco products].” 2,3 This high
exposure to tobacco advert ising creates a
climate of “friendly f amiliarity,” which
may make tobacco products more appeal-
ing to youth.1 Non-smoking youth who are
able to name a favorite brand or b r a n d
a d v e r t i s e m e n t a r e m o r e susceptible
to taking up smoking.4 The 1994 Surgeon
General’s Report on Youth and Smoking
concluded that cigaret t e adver t ising
appears to increase substantially the risk
of young people smoking.5
The impact of advert ising on youth smok-
ing has been well documented. One study
found that even a brief exposure to tobac-
co adver t ising can creat e a f avorable
impression of smokers in young people.6
Children, particularly adolescents, remem-
ber more about advert ising images than
adults.7 These images appear to affect chil-
dren’s perceptions of the pervasiveness,
image, and function of smoking, which are
directly related to smoking initiation. This
may partly explain why children who smoke
perceive uniformly higher smoking preva-
lence levels than children who do not
smoke. In addition, a number of studies link
an improvement in self-image to the mes-
sages promoted by a preferred brand of
cigarettes.5
Recently released internal industry doc-
uments reveal a campaign target ing ado-
lescent pre-smokers and smokers (see
Appendix A). The importance of target-
ing youth is underscored in one docu-
ment, which notes that 40 percent of reg-
ular smokers have made a loyal brand
choice by age 18.8 A study by the Centers
for Disease Control and Prevent ion
found that young people choose
cigarettes on the basis of advert ising
rather than other factors, such as price or
health information.9 Young people smoke
f ewer brands than adults, and their
choices can be direct ly related to the
amount and kind of a d v e r t i s i n g o f a
given brand. In Massachuset ts, the
6

four most heavi ly adver t ised brands
(Marlboro, Newport, Winston, Camel)
accounted for 93% of youth smoking.10 By
contrast, the most commonly smoked
cigarettes nationwide among adult smokers
are brandless or generic cigarettes.11
A number of separate studies have docu-
mented industry promotional campaigns
directed at the youth market. Brands smoked
by youth were found to be more heavily adver-
tised in magazines with large youth reader-
ship than in other magazines.12 Cartoon char-
acters have also been used to sell cigarettes.
In one study, children as young as 3 to 6 years
old recognized the Joe Camel character and
knew that he sold cigarettes.2 Items such as
T-shirts, jackets, and bags have been used
to promote tobacco products. These were
applauded in one industry report as “not
only reach[ing] younger adult consumers,
but convert[ing] younger adults into walk-
ing billboards.”13 High school students in
Massachusetts who own a promotional
item are more than twice as likely to smoke.
This points to the success of this strategy.14
I I . CAMPAIGN OVERVIEW
What is Massachusetts
Operation Storefront?
The Massachusetts Operat ion Storefront
was conducted during the Spring of 1998
in order to raise awareness about the
images that adver t ise and promot e
dependence on tobacco. Par t icipants
from across the Commonwealth surveyed
advert ising visible from outside of local
ret ai l stores and other tobacco
merchandisers in order to:
1. ident if y locat ions, quant i t ies, and
types of advert isements in storefront
displays outside of retail stores
2. ident ify specif ic target areas—such
as minority, non-English speaking, or
high-pover ty communit ies—where
tobacco advert ising may be more per-
vasive, or where specif ic brands and
products may be more visible
3. compare types and amounts of
adver t ising found near schools to
advert ising in other locat ions
4. compare tobacco advert ising to other
retail storefront advert ising
5. explore differing patterns of advert is-
ing by geographic area and region
6. not e where adver t ising appeal and
youth preference may overlap
7
The results of this survey document the
high levels of advert ising to which youth
are exposed. This campaign can encour-
age a volunt ar y reduct ion of tobacco
advert isements and promotions by local
shop owners and adoption of policies to
protect youth.
Who participated in
Operation Storefront?
Both youth and adults f rom MTCP fund-
ed loca l p r o g r a m s a n d o t h e r n o n -
f u n d e d agencies were invi t ed to par t ic-
ipat e in surveys conduct ed across every
region of the Commonwe al th dur ing the
pe r iod f rom Februa r y t hrough Apr i l
1998. Par t icipa t ion was volunt ary, and
leve ls of par t icipa t ion were ext remely
high, wi t h more t han 3 0 0 sur v eyor s
r anging f rom age s ix through adul t.
•Part icipants in Operat ion Storefront
surveyed a total of 125 Massachusetts
cities or towns (with 124 returning
usable numeric data).
•The total populat ion covered by
part icipat ing cit ies and towns was
greater than 3,500,000—or approximate-
ly 58% of the Commonwealth.
•More than 3000 vendors were surveyed
in all- including convenience stores
(1194), gas stations (564), liquor stores
(508), grocery stores (290), restaurants/
bars (283), drug stores and pharmacies
(242), and department stores (42).
•Approximately 70% of identified retail
vendors in the participating communi-
ties were surveyed.
What did participants do?
Trained survey participants identified and
mapped the tobacco vendors in their com-
munities according to location, type of
establishment, and distance from schools or
playgrounds. All exterior/storefront adver-
tising displayed by each vendor was record-
ed, according to the following categories:
•number of tobacco or other type of
advertisement (alcohol or other)
•type of tobacco advert ised (cigar,
smokeless, or cigarette)
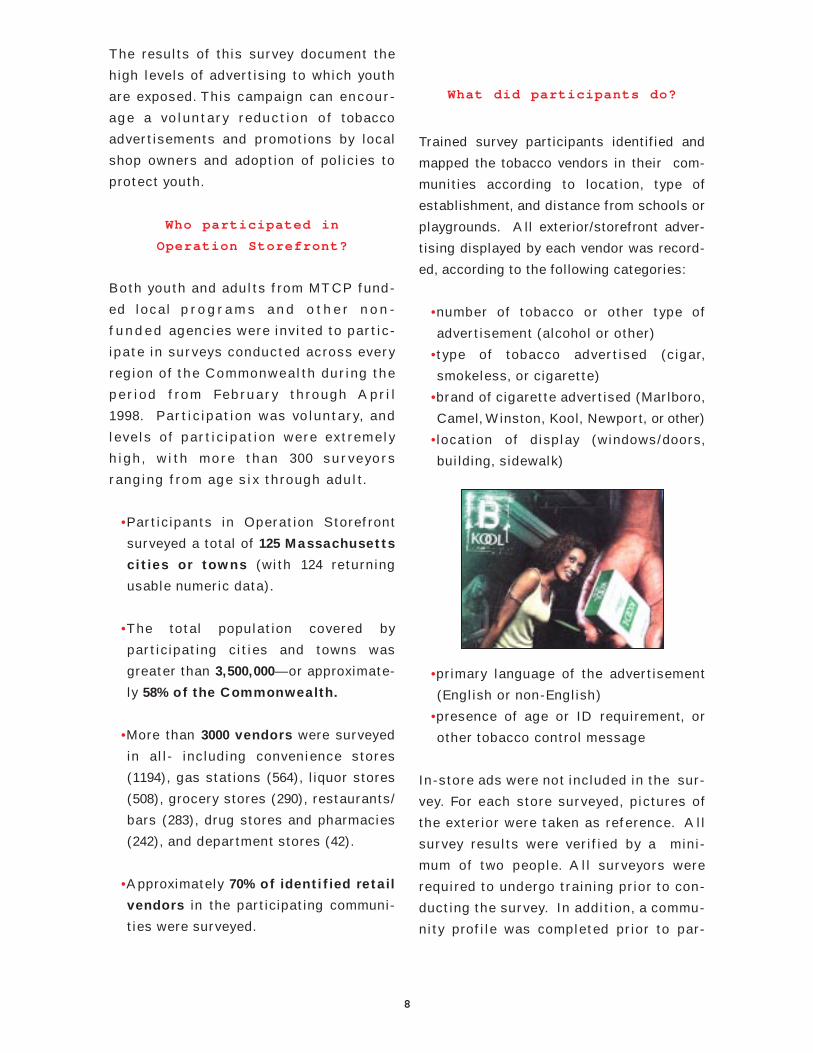
•brand of cigarette advertised (Marlboro,
Camel, Winston, Kool, Newport, or other)
•locat ion of display (windows/doors,
building, sidewalk)
•primary language of the advertisement
(English or non-English)
•presence of age or ID requirement, or
other tobacco control message
In-store ads were not included in the sur-
vey. For each store surveyed, pictures of
the exterior were taken as reference. All
survey results were verif ied by a mini-
mum of two people. All surveyors were
required to undergo training prior to con-
ducting the survey. In addit ion, a commu-
nity prof ile was completed prior to par-
8

t icipat ion, which assessed the types of
community act ivity undertaken, as well as
the number and type of tobacco vendors
in the community.
Dat a entry was performed by the
Massachusetts Tobacco Control Program
(MTCP), and analyses were conducted by
the research and evaluat ion unit of
MTCP.
How was the collected
information analyzed?
A n a l y s e s w e r e b a s e d on t h e d a t a
col lect ed for ret ai l stores, including
conveni ence s t ores, gas s t a t ions/
mini-marts, department stores, pharma-
cies/ drug stores, and grocery stores.
Liquor stores and pot ent ial a lcohol-
s er v ing es t abl ishment s ( res t aur ant s,
clubs) were excluded from analysis in
order to facilitate comparability across
communit ies. Of t en, these t ypes of
establishments are subject to state and
local regulat ions governing alcohol sales,
required distance from schools, and age
requirements for entry, or are banned
completely. Some Operat ion Storefront
communit ies did not survey restaurant,
bar, or private club advertisements. With
the exception of bars, all vendors were
represent ed in propor t ions similar to
those obt ained in two represent at ive
samples of tobacco vendors conducted in
1996 and 1997.
All tobacco advertisements, all alcohol adver-
tisements, and any displayed advertisements
for other retail products were included in the
analyses. The presence of an ID or age require-
ment (e.g. FDA, local signage, etc.) was also
recorded. Regions were defined in accordance
with the statewide regional structure adopted
by the Massachusetts Department of Public
Health. (See Appendix B)
Target areas were defined as follows:
•high-pover ty community—greater
than or equal to the state average for
proport ion of people with incomes
below 200% of the federal poverty level
(state average = 16.4%)
•high-minority community—greater
than or equal to the state average for
percent of minority population (state
average = 11.9%)
•size of community—greater than or
equal to 100,000 people; greater than or
equal to 50,000 and less than 100,000;
greater than or equal to 25,000 and less
than 50,000; or less than 25,000
•proximity to school—vendor located
within 1000 feet of a school
9

Which vendors are
displaying tobacco ads?
Tobacco adver tisement s made up 52%
(10,665) of the more than 20,000 tot al
ret a i l adver t isements sur veyed for
Massachuset ts Opera t ion Storef ront.
(Table 1, see Appendix C)
The greatest number of storefront dis-
plays (of all kinds) were found on or out-
side of convenience stores (13,253), gas
st a t ions (4,591), and grocery stores
(2,423). (Fig 1,Table 2, see Appendix C)
Convenience stores and gas stations were
far more likely to display tobacco adver-
t isements than other establishments.
Fif ty-f ive percent of both convenience
store and gas station displays were tobac-
co advertisements. Pharmacies displayed
the lowest percentage of tobacco ads (6%),
followed by department stores (9%) and
then grocery stores (30%). (Table 2, see
Appendix C)
Retail store chains were less likely to
advertise tobacco products than indepen-
dently operated stores. With the exception
of department stores, which showed no
statistical difference, retail store chains
displayed a smaller proportion of store-
front tobacco advertising. (Figure 2)
Which products are most
heavily advertised?(Table 3,
See Appendix C)
The four most popular brands among
youth—Marlboro, Newport, Camel, and
Winston—account ing for 93% of youth
smoking, were also the four most heavily
marketed brands in this survey.
The brands most heavily advertised were:
Marlboro (3,547), unspecif ied brands
(2,315), Winston (1,529), Newport (1,166),
Camel (1,094), and Kool (763). Smokeless
tobacco products (164) and cigars (87)
were less likely to be advertised.
Marlboro averaged 1 1/2 ads on every
outdoor retail storefront surveyed. Of
the 4.57 tobacco ads averaged per retail
storefront, Marlboro (1.52) accounted for
one-third; Winston (0.65), Newport (0.5),
and Camel (0.47), made up another third;
with all other tobacco ads the f inal third
(Figure 3).
10
%
%
%
%
%
%
%
%
%
PERCENTAGE OF TOTAL ADS DEDICATED TO TOBACCOChain Stores vs. Independent Stores
70%
60%
50%
40%
30%
20%
10%
0%Convenience
StoresGas
StationsGrocery Stores
Pharmacies Department Stores
Figure 2
DEPARTMENT STORES
PHARMACIES
GROCERY STORES
CONVENIENCE STORES
GAS STATIONS
120001000080006000400020000 14000
Figure 1
TOTAL STOREFRONT DISPLAYS Tobacco Ads Vs. Other Ads
CHAIN STORES
INDEPENDENT STORES
80%
OTHER TOBACCO ADS 31%
MARLBORO 33%
NEWPORT 11%WINSTON 14%
CAMEL 10%
PERCENTAGE OF RETAIL ADVERTISEMENTS, BY BRAND
Figure 3
TOBACCO ADS
ALL OTHER ADS
Total Number of Storefront Displays
III.CAMPAIGN RESULTS

Are areas near schools a
target for tobacco advertising?
Storefronts located within 1000 feet of a
school were significantly more likely to
display tobacco advertisements, and
displayed more tobacco advertisements
per vendor, than did storefronts located
f arther away from schools.*** Fif ty-four
percent (54%) of retail ads near schools
were for tobacco, while only 50% percent
away f rom schools were tobacco ads.
(Table 4, see Appendix C)
The average number of tobacco adver-
t isements was 5.49 for stores near
schools, and only 3.96** for other
stores—exposing children to nea rly
one and a half t imes more tobacco
displays during their daily activities.
(Figure 4)
Menthol brands of cigaret t es were
advert ised more frequent ly near schools
(820) than away from schools (725) in the
community. (Table 4, see Appendix C)
Retail establishments near schools aver-
aged 1.15 menthol cigaret te ads, nearly
twice that of other retail establishments
f arther away (0.66).*** (Figure 4)
The places where youth say that they buy ciga-
rettes—convenience stores and gas stations—
displayed a significantly greater average num-
ber of tobacco advertisements near schools
(6.3) than away from schools (5.1)** and were
significantly less likely to display age/ID
requirements near schools (34%) than away
from schools (41%).* (Table 5, see Appendix C)
Which communities are
most heavily targeted?
HIGH POVERTY (TABLE 6, SEE APPENDIX C)
Poorer communities displayed much
higher numbers of tobacco ads per
vendor, averaging 5 tobacco ads per
ret ai l vendor, in comparison with 3
ads/vendor for other communit ies.*
Convenience stores in high-pover t y
areas displayed an even higher average
of 6.5 tobacco ads for each retail vendor.
In addit ion, poorer communities had a
greater percentage of retail ads dedi-
cated to tobacco. Fif t y-four percent
(54%) of retail advert isements in poorer
communit ies were ret a i l tobacco ads,
compared with 43% for more af f luent
communit ies.**
All brands of cigarettes were advertised in
much higher proportion in poorer communi-
ties. Nonetheless, menthol brands were
advertised almost exclusively in poor
areas, with 94% of Newport ads and 92% of
Kool ads displayed in high poverty communities.
11
TOBACCO ADVERTISING NEAR SCHOOLS
TOBACCO ADS MENTHOL ADS
NEAR SCHOOLS
AWAY FROM
6
5
4
3
2
1
0
Figure 4
Ave
rage
Num
ber o
f Ads
/Sto
refr
ont

MINORITY (TABLE 7 AND 8, SEE APPENDIX C)
The proportion of retail storefront
advertising dedicated to tobacco was
greater in high-minority communities
(54%) than in low-minority communities
(50%).*
Menthol brands such as Newport and Kool,
which are smoked by a majority of
Massachusetts minority youth, were adver-
tised in much greater proportion in high-
minority communities. Of the Newport ads
displayed, 68% (greater than two-thirds)
were found in high- minority communities.
While only forty-eight percent (48%) of the
total advertisements counted were located
in high-minority areas, the total proportion
of tobacco advertising found in high-minori-
ty communities was greater than fifty per-
cent (52%). More than half of cigarette
brand advertising was found in high-
minority areas.
School areas in high-minority communities
displayed an even greater percentage of
tobacco brand advertisements. Within 1000
feet of schools, 58% of all retail tobacco
ads were located in high-minority areas ver-
sus 42% in low-minority areas.
Brands preferred by minorities were more
likely to be displayed nearer to schools.
Seventy-eight percent (78%) of Newport
ads displayed near schools were located in
high-minority communities. (Figure 5)
Age or ID requirements were displayed on
30% of retail establishments in high- minor-
ity areas, versus 37% of establishments
in low-minority areas.
12
HIGH-MINORITY78%
PERCENTAGE OF NEWPORT ADS DISPLAYED NEAR SCHOOLS
(NEWPORT IS A MENTHOLATED BRAND)
LOW-MINORITY22%
BRAND PREFERENCE OF BLACK YOUTH
WHO SMOKE
NEWPORT73%
OTHER 27%
Figure 5

SIZE OF COMMUNITY
(TABLE 9, SEE APPENDIX C)
Urban communities displayed a much
higher propor tion of tobacco ads as a
percentage of total retail ads (57%),
compared with rural areas (47%).
Menthol brand adver tisement s were
highly concentrated in urban areas,
par t icular ly those with a populat ion
grea t er than 100,000. The number of
Newport ads per vendor was more than 3
t imes greater in highly urban areas than
in very rural communit ies.
Adver t isements for Camel, Kool, and
Marlboro were rela t ively high in mid-
sized cit ies (50,000-100,000). Camel ads
were displayed with t wice the f re-
quency in mid-sized cities as they were
elsewhere (0.77 ads/vendor.)
Retail establishments in the most rural
communit ies (25,000 or less) displayed
high levels of ads for cigars, smokeless
tobacco, and the unspecif ied brands of
cigaret tes. While account ing for only 25%
of sample populat ion, rural communit ies
displayed 56% of smokeless tobacco
ads and 38% of cigar ads.
How do different regions
of Massachusetts compare?
(Tables 10 & 11)
Figure 6 depicts the percentage that each
region contributed to the total surveyed
vendors. This can be compared with the
percentage of the Commonwealth’s total
population represented by each region pro-
vided in the following regional descrip-
tions.
BOSTON REGION
(11.9% of Commonwealth population; 80%
o f r e g i ona l c o mmunit ie s p ar t ic ip a t e d,
representing 54.5% of regional population)
The Boston Region showed a dispropor-
t ionately high concentrat ion of ads for all
youth brands of cigarettes. In part icular,
menthol brands such as Kool and
Newport—tradit ional ly market ed to
minority communit ies—were advert ised
two-three t imes more in Boston propor-
t ionat ely than in the rest of t h e
Commonwe a l t h. Mos t t oba cco adver-
t ising was found on or outside of conve-
nience stores (82%). A disproport ionate-
ly high level of gas stat ion ads (75%) and
grocery store ads (59%) were tobacco ads.
CENTRAL REGION
(12.6% of Commonwealth p opulat ion; 23%
of r egi ona l c o mmunit ies par t ic ipa t ed,
represent ing 55.6% of regional population)
The Central Region had a high number
of tot al ret ai l ads, with proport ionat ely
f ewer tobacco ads. However, both cigars
and smokeless tobacco products were
most heavi ly adver t ised in this region. A
high propor t ion of the region’s tobacco
ads were displ ayed in gas st a t ions
(34%).
13
SOUTHEAST 23%
CENTRAL 19%
METRO-WEST 7%
NORTHEAST 29%
TOTAL VENDORS SURVEYED BY REGION
WEST 13% BOSTON 9%
Figure 6

METRO-WEST REGION
(23.4% of Commonwealth population; 1 3 %
o f r e g i o n a l c o m m un i t i e s partic ipated,
representing 22.4% of regional population)
The Metro-West Region was part icularly
dominated by Camel and Winston ads
(0.77 and 0.71 ads/ vendor). Tobacco ads
made up a relat ively small proport ion of
overall ads (42%). Only 16% of grocery
store ads were tobacco ads-slight ly more
than half the statewide average.
NORTHEAST REGION
(19.6% of Commonwealth population; 76%
of regional c ommunities part ic ipated, rep-
resenting 81.8% of regional population)
The Northeast Region displayed high
overall numbers of ads for the brands
relat ed to youth smoking-Marlboro,
Newport, Winston, Camel. Due to the high
levels of part icipat ion in the region, the
Northeast made up a more signif icant
port ion of the overall sample relat ive to
its populat ion. Advert ising patterns in
this region were s i m i l a r t o t h e p a t -
t e r n s f o r t h e Commonwealth as a whole.
SOUTHEAST REGION
(18.8% of Commonwealth population; 50%
of regiona l c o mmunit ies par t ic ipated,
representing 65.7% of regional population)
The Southeast Region revealed a heavy
proportion of Kool and Winston ads com-
pared with other regions, as well as a high
number of ads for unspecified brands of
cigarettes. Cigar advertisements were dis-
played more frequently than in other areas.
Similar to the Central Region, a large pro-
portion of total tobacco advertisements
were located in gas stations (32%).
WEST REGION
(13.6% of Commonwealth population; 25%
of regional c ommunities part ic ipated, rep-
resenting 56.5% of regional population)
The West Region had twice as many
Newport ads as any other brand (except
Marlboro), and the highest number of
14
NORTHEASTREGION
BOSTONREGION
SOUTHEASTREGION
METRO-WESTREGION
WESTREGION
CENTRAL REGION
Figure 7

unspecif ied brands displayed. Smokeless
tobacco was most adver t ised in this
region, averaging 0.1 ads/ vendor. Gas
stat ions displayed a high proport ion of
the total retail tobacco advert isements
(36%).
•All regions displayed high propor-tions of Marlboro ads relative toother brands.
•The Boston and Nor theast regionswere least likely to display an ID orage requirement, and displayed apropor tionately greater number oftobacco ads.
The results of Operation Storefront, a
statewide survey of more than 3000 retail
outlets that sell tobacco products in
Massachusetts, document the high levels of
storefront tobacco advertising to which
youth in general are exposed in the
Commonwealth. More than half of the 20,000
retail ads surveyed in the study were for
tobacco products. Overall, patterns of store-
front advertising mirror youth purchasing
patterns and brand preferences. The majori-
ty of ads were displayed in convenience
stores and gas stations, stores in which
most youth purchase cigarettes and where
illegal sales to young people are highest. 10
Children are more likely to smoke the prod-
ucts that they see advertised. 1 Therefore, it
is not surprising that the cigarette brands
that account for the majority (93%) of youth
smoking (Marlboro, Newport, Camel, and
Winston) were also the four most commonly
displayed storefront brands. 10
While storefront advertising of tobacco products
is generally pervasive, there is a striking increase
with proximity to schools. Stores where youth buy
their cigarettes that are located nearest to
schools display more tobacco advertising and a
greater percentage of tobacco ads, and are also
less likely to display age or ID requirements.
This type of situation, which was prevalent in
the Boston and Northeast regions, is
15
12
10
8
6
4
2
0
TOTAL RETAIL ADS AND TOBACCO ADS, BY VENDOR
ADS PER VENDOR TOBACCO ADS
BOSTON CENTRAL
METRO-WEST NORTHEAST
SOUTHEAST WEST
AVER
AGE
NUM
BER
OF A
DS
Figure 8
IV. DISCUSSION

par t icul ar ly a l arming because youth
exposed to tobacco adver t ising are more
likely to be inf luenced to at t empt to buy
a product—and succeed in making the
purchase—if there is no obvious det er-
rent. The creat ion of drug-f ree zones
around schools is paradoxical in v iew of
the fact that the purchase of tobacco prod-
ucts by minors, and hence nicotine addic-
tion, continues unchecked. The posting of
an age or ID requirement correlated with
proportionately reduced advertising.
Storef ront tobacco adver t isements were
also more prevalent in poor and urban
communi t i es. In minor i t y are as, the
aggressive adver t ising of menthol ciga-
ret t es is specif ical ly t arget ed at black
and Lat ino youth, the majori ty of whom
smoke menthol brands such as Kool and
Newpor t. 10 Re t a i l est abl ishment s in
most rural areas demonstrat e a unique
pat t ern of storef ront adver t ising, dis-
playing high levels of ads for cigars,
smokeless tobacco, and the unspecif ied
brands of cigaret t es.
The pat t ern of adver t ising and promo-
t ion of tobacco products in neighbor-
hood storef ront s document ed by this
study is par t of a del iberat e campaign
by the tobacco industry to at tract young
pot ent ial smokers and inf luence their
brand choices once they begin smoking.
There are numerous int ernal corporat e
documents per t aining to this subject,
which reveal that the industry regards
children and adolescents as i ts primary
source of replacement smokers and has
deve loped a v ar i e t y of sophist ica t ed
promot ional strat egies aimed at captur-
ing the youth market. (see Appendix A)
A st at ewide storef ront tobacco adver-
t ising study conduct ed in California in
1994 revealed results similar to those of
the Massachuse t t s sur vey, 15 and pro-
v ides f ur ther ev idence of indust r y
ef for t s to t arge t youth through this
strat egy, which is more than l ikely oper-
at ing on a nat ional scale. In addit ion to
aggressively promot ing tobacco prod-
ucts in storef ront adver t ising, manuf ac-
turers t arget youth with hats, T-shir ts,
and other non-tobacco promot iona l
“gear.” This insidious merchandising strat-
egy not only attracts young customers, but
as one R.J. Reynolds report phrased it,
effectively turns them into “walking bill-
boards,” that lure still more youth into the
smoking habit.13 It is apparent ly highly
successful, for high school students
in Massachusetts who own a pro
16

17
mot ional i t em are more than twice as
l ikely to smoke.14
Manufacturers not only direct their adver-
t ising at youth as a whole, but also target
specif ic groups within this populat ion,
such as the less aff luent and minorit ies.
As a result, these children may be at
higher risk for tobacco use. The predom-
inance of tobacco advert ising in minority
areas is part icularly disturbing in light of
the recent nat ional rise in minority youth
smoking rates.16
The impact of tobacco adver t ising on
youth cannot be understated. That it has
a profound inf luence in encour aging
children, especially adolescents, to begin
smok ing is we l l document ed by the
1994 Surgeon Gener a l ’s repor t and
numerous addi t iona l s tudi es. 1,5 Youth
consistent ly overest imate the number of
smokers.1 When more than half of retail
advert isements are tobacco ads, this can
distort young people’s perception of the
reality of overall smoking prevalence by
normalizing or glamorizing smoking in
their minds. Furthermore, the corporate
l i t erature reveals that manuf acturers
of tobacco products are aware that
advert ising has a powerful impact on the
exist ing peer pressure within this age
group to smoke, and in sett ing standards
of conformity with regard to brand prefer-
ences. Measures to curtail the amount
and type of advert isement that youth are
exposed to can be a powerful tool in
reducing the susceptibility of youth to
smoking.
This survey cannot be considered repre-
sentative of the Commonwealth. Community
par t ic ipa t ion was volunt ar y, and the
Metro-west region was underrepresented
while the Nor theast region was over-
represented. Nonetheless, with over one-
third of all est imated tobacco vendors in
the Commonwealth surveyed, and with
the rema ining regions e ach cover ing
slightly more than 50% of their community
populat ion, i t is l ikely that Operat ion
Storefront provides a good est imate of
youth exposure to storefront advert ising
in Massachusetts. These results may offer
a conservat ive est imate of exposure, as
the overrepresented region falls below
the state average in terms of tobacco ads
per vendor, while the underrepresented
region is over the state average.
It’s time we made smoking history.
* P<0.05** P<0.01
*** P<0.001

18
1. Food and Drug Administration. Regulations
Restricting the Sale and Distribution of Cigarettes
and Smokeless Tobacco to Protect Children and
Adolescents; Final Rule. Federal Register. August 28,
1996. 61(168): 44396-44618.
2. Fischer PM, Schwartz MP, Richards JW, Goldstein
AO, Rojas TH. Brand Logo Recognition by Children
Aged 3 to 6 Years: Mickey Mouse and Old Joe Camel.
Journal of the American Medical Association. 1991.
266: 3145-3148.
3. Mizerski R, Straughn K, Feldman J. The
Relationship Between Cartoon Trade Character
Recognition and Product Category Attitude in Young
Children. Presented at Marketing and Public Policy
Conference, 1994.
4. Pierce JP, Choi WS, Gilpin EA, Farkas AJ, Berry
CC. Tobacco Industry Promotion of Cigarettes and
Adolescent Smoking. Journal of the American
Medical Association. 1998. 279: 511-515.
5. Department of Health and Human Services.
Preventing Tobacco Use Among Young People: A
Report of the Surgeon General. Atlanta, Georgia:
U.S. Department of Health and Human Services,
Public Health Services, Centers for Disease Control
and Prevention, National Center for Chronic Disease
Prevention and Health Promotion, Office on Smoking
and Health, 1994.
6. Pechmann C, Ratneshwar S. The Effects of
Antismoking and Cigarette Advertising on Young
Adolescents’ Perception of Peers Who Smoke.
Journal of Consumer Research. 1994. 21: 236-251.
7. Dubow JS. Advertising Recognition and Recall by
Age-Including Teens. Journal of Advertising
Research. Sept/Oct 1995, 55-60.
8. Burrows D. Younger Adult Smokers: Strategies and
Opportunities. RJ Reynolds: Strategic Research
Report, February 29, 1984. (See Appendix A)
9. Centers for Disease Control and Prevention.
Current Trends: Changes in the Cigarette Brand
Preferences of Adolescent Smokers, United States,
1989-1993. Mortality and Morbidity Weekly Report.
Centers for Disease Control and Prevention. August
19, 1994, 43: 577-581.
10. Briton NJ, Clark TW, Baker AK, Posner J, Soldz S,
Krakow M. Adolescent Tobacco Use in
Massachusetts: Trends Among Public High School
Students: 1984-1996. Boston, MA: Health & Addictions
Research, Inc., May 1997.
11. Teinowitz L. Add RJR to List of Cigarette Price
Cuts. Advertising Age. April 26, 1993, 3 and 46.
12. King C, Siegel M, Celebucki C, Connolly, GN.
Adolescent Exposure to Cigarette Advertising in
Magazines: An Evaluation of Brand-Specific
Advertising in Relation to Youth Readership. Journal
of the American Medical Association. 1995. 279 (7):
516-520.
13. Younger Adult Smokers. RJ Reynolds.
Presentation, 1987. (See Appendix A)
14. University of Massachusetts, Boston: Center for
Survey Research. Tobacco Advertising and
Promotions: The Impact on Massachusetts Teens.
Data taken from: Massachusetts Adult Tobacco
Survey. 1993. Umass Boston: Center for Survey
Research.
15. Operation Storefront: Youth Against Tobacco
Advertising and Promotion. July 1995. California
Department of Health Services. (unpublished)
16. Department of Health and Human Services.
Tobacco Use Among U.S. Racial/Ethnic Minority
Groups: A Report of the Surgeon General. Atlanta,
Georgia: U.S. Department of Health and Human
Services, Public Health Service, Centers for Disease
Control and Prevention, National Center for Chronic
Disease Prevention and Health Promotion, Office on
Smoking and Health, 1998.
ENDNOTES

19
“At the outset it should be said that we
are present ly, and I bel ieve unf air ly,
constrained f rom direct ly promot ing
c iga re t t e s t o t he yout h ma r k e t. . .
Real ist ical ly, i f our Company is to
survive and prosper, over the long term
we must get our share of the youth mar-
ket. In my opinion, this will require new
brands tailored to the youth market...”
Research Planning Memorandum on Some
Thoughts About New Brands of Cigarettes
f or the Youth Market—R.J. Reynolds,
Memorandum by CE Teague, February 2,
1973 (Mangini Trial Exhibit 2)
“Marlboro’s phenomenal growth rate in
the past has been at tributable in large
par t to our high market penetra t ion
among young smokers [15-19 years-old]...
[M]y own data, which includes younger
teenagers, shows even higher Marlboro
market penetration among 15-17 year-olds.”
“The teenage years are also important
because those are the years during which
most smokers begin to smoke, the years in
which initial brand selections are made, and
the period of the life-cycle in which confor-
mity to peer-group norms is greatest.”
The Decline in the Rate of Growth of
Marlboro Red—Philip Morris, Correspondence
from Myron Johnston to Dr. R. B. Seligman,
May 21, 1975 (Minnesota Trial Exhibit 2557)
“ Tod a y ’s t e e n a g e r i s t omo r r o w ’s
potent ial regular customer, and the over-
whelming majority of smokers f irst begin
to smoke while st il l in their teens... The
smoking patterns of teenagers are par-
t icularly important to Philip Morris... the
share index is highest in the youngest
group for all Marlboro and Virginia Slims
packings... At least a part of the success
of Marlboro Red during its most rapid
growth period was because it became the
brand of choice among teenagers who
then stuck with it as they grew older...”
“We will no longer be able to rely on a
rapidly increasing pool of teenagers from
which to replace smokers lost through
normal at trit ion... Because of our high
share of the market among the youngest
smokers, Philip Morris will suff er more
than the other companies from the decline
in the number of teenage smokers.”
Yo ung S m o k e r s : P r eva l e nc e , Tr e nd s ,
Implicat ions, and Related Demographic
Trends—Philip Morris, Report by Myron
Johnston, March 31, 1981 (Minnesota Trial
Exhibit 10339)
“Kool has shown lit t le or no growth in
share of users in the 26+ age group...
Growth is f rom 16-25 year olds. At the
present rate, a smoker in the 16-25 year
age group will soon be three t imes as
important to Kool as a prospect in any
other broad age category.”
APPENDIX A: INDUSTRY QUOTES

20
“KOOL’S stake in the 16-25 year old popu-
lation segment is such that the value of
this audience should be accurately
weighted and ref lected in current media
programs. As a result, all magazines will
be reviewed to see how efficiently they
reach this group and other groups as well.”
Brown and Williamson, Correspondence
from RL Johnson to RA Pittman, February
21, 1973 (Minnesota Trial Exhibit 13820)
“[C]omic str ip t ype copy might get a
much higher readership among younger
people than any other type of copy.”
Cigar e t t e Pr o duc t Formula t i on—R.J.
Reynolds, Meet ing Notes, April 12, 1973
(Mangini Trial Trial, Exhibit 8)
“[A]ny desired addit ional nicot ine ‘k ick’
could be easi ly obt a ined through pH
regulat ion.”
Cigarette Concept t o Assure RJR a Larger
Segment of the Youth Mar ke t—R.J.
Reynolds, Memo by Frank Colby,
December 4, 1973 (Minnesota Trial Exhibit
12464)
“They represent tomorrow’s cigaret t e
business. As this 14-24 age group
matures, they will account for a key share
of the total cigaret te volume-for at least
the next 25 years.”
1975 Market ing Plans Presentat ion—R.J.
Reynolds, September 30, 1974 (Minnesota
Trial Exhibit 12493)
“Our prof i le t aken local ly shows this
brand being purchased by black people
(all ages), young adults (usually college
age), but the base of our business is the
high school student.”
Loril lard, Memo from TL Achey to Curt is
Judge, August 30, 1978 (Minnesota Trial
Exhibit 10195)
“Younger adult smokers have been the
crit ical f actor in the growth and decline
of every major brand and company over
the last 50 years. They will cont inue to be
just as important to brands/companies in
the future for two simple reasons: The
renewal of the market st ems almost
ent irely f rom 18 year old smokers. No
more than 5% of smokers start af ter age
24. [And] the brand loyalty of 18 year old
smokers f ar outweighs any tendency to
switch with age.. . Brands/companies
which f ail to at tract their f air share of
younger adult smokers f ace an uphi l l
bat t le. They must achieve net switching
gains every year to merely hold share...”
“Younger adult smokers are the only
source of replacement smokers.. .If
younger adults turn away from smoking,
the Industry must decline, just as a popu-
la t ion which does not give bir th wi l l
eventually dwindle.”
APPENDIX A: INDUSTRY QUOTES CONT.

21
Younger Adult Smokers: Strategies and
Opp ortunit ies—R.J. Reynolds, Strategic
Research Repor t, February 29, 1984
(Mangini Trial Exhibit 32)
“We are not sure that anything can be
done to hal t a major exodus if one gets
going among t he young. This group
fol lows the crowd, and we don’t pret end
to know wha t gets them going for one
t hing or anot her. Cer t a inl y Phi l ip
Morr is should cont inue ef for t s for
Mar lboro in the youth market, but per-
haps as st rongly as possible a imed a t
the whit e market ra ther than a t t empt ing
to encompass blacks as wel l.”
A Study of Smoking Habits Among Youth
Smokers—Philip Morris, Report by Roper
Organizat ion, Inc., July 1974 (Minnesota
Trial Exhibit 10497)
“Smoking a cigaret te for the beginner is
a symbolic act... ‘I am no longer my moth-
er’s child,’ ‘I’m tough,’ ‘I am an adventur-
er,’ ‘I’m not a square’... As the force from
the psychological symbolism subsides,
the pharmacological eff ect takes over to
sustain the habit...”
Why One Smokes—Philip Morris, Draft
Report, Fall/1969 (Minnesota Trial Exhibit 3681)
“Evidence is now available to indicate
that the 14 to 18 year old group is an
increasing segment of the smoking
populat ion. RJR-T must soon establish a
successful new brand in this market if
our posi t ion in the industry is to be
maintained over the long term.”
Planning Assumptions and Forecast for
the Period 1977-1986+ for R.J. Reynolds
Tobacc o Company—R.J. Reynolds, Draf t
report by Claude Teague, April 15, 1976
(Mangini Trial Exhibit 6)
“ O v e r a l l , C a m e l adv e r t i s ing w i l l be
d i r e c t e d t o w a r d u s i n g p e e r
a cc ept anc e / inf luenc e t o prov ide t he
mot i v a t ion for t arge t smokers to se l ect
C a m e l. . . conv inc ing t a rg e t smok e r s
tha t by se l ect ing came l as the ir usua l
br and they wi l l proj ect an image tha t
wi l l enhance the ir accept ance among
the ir pe ers.”
“[A]dvert ising will create the percept ion
that Camel smokers are non-conformist,
self-conf ident and project a cool at t itude
which is admired by their peers... This
approach will capitalize on the ubiqui-
tous nature of Marlboro by reposit ioning
it as the epitome of conformity, versus
C a m e l t h e s m o k e o f t h e c o o l /
in-group.”
C a m e l N e w A d v e r t i s i n g C a m p a i g n
Development—R.J. Reynolds, Memoran-
dum f rom RT Cauf ie ld to DN Iauco,
March 12, 1986 (Mangini Trial Exhibit 58)
APPENDIX A: INDUSTRY QUOTES CONT.

22
“I have just received data on the graduat-
ing class of 1982 and the results are much
more encouraging and corroborate the
Roper data [a survey that tracked smok-
ing trends]... These data show that smok-
ing prevalence among these 18 year old
high school seniors has increased from
1981 to 1982.”
Still More Trends in Cigarette Smoking
Prevalence—Philip Morris, Memorandum
by Myron Johnston, February 18, 1983
(Minnesota Trial Exhibit 10525)
“To ensure increased and longer-t erm
growth for CAMEL FILTER, the brand
must increase i ts share penetra t ion
among the 14-24 age group which have a
new set of more l iberal va lues and
which represent tomorrow’s cigaret t e
business.”
Rec o mmenda t i on t o Expand ‘Me e t the
Turk’ Ad Campaign—R.J. Reynolds, Memo
from JW Hind, January 23, 1975 (Mangini
Trial Document 13)
“Long af ter the adolescent preoccupa-
t ion with self-image has subsided, the
cigaret te will even preempt food in t imes
of scarcity on the smokers’ priority l ist.”
“The act of smok ing is symbol ic, i t
s igni f i es adul t hood, he smokes t o
enhance his image in the eyes of his
peers. But the psychosocial mot ive is not
enough to explain cont inued smoking.”
Smo ker Psycho logy Research—Phil ip
Morr is, Memorandum by M Wakeham,
November 26, 1969 (Minnesot a Tr ia l
Exhibit 10299)
“[Jack Danie l’s] is an example of
a v iable posi t ioning, execut ed in a
‘n o n s t a n d a r d ’ b u t a u t h e n t i c a n d
unpret ent ious way, which not only
reached YA [young adult] consumers but
converted YA’s into walking bil lboards.”
Younger Adult Smokers—R.J. Reynolds,
Presentation, 1987 (Mangini Trial Exhibit 35)
“Thus, a tobacco product is, in essence, a
vehicle for delivery of nicot ine designed
to del iver the nicot ine in a general ly
accept able and a t t ract ive form. Our
industry is then based upon design,
manuf acture, and sale of a t t ract ive
dosage forms of nicot ine, and our
Company’s posit ion in our Industry is
det ermined by our abi l i t y to produce
dosage forms of nicot ine which have
more overall value, tangible or intangi-
ble, to the consumer than those of our
compet itors.”
RJR Conf ident ia l Research Planning
Me morandum on the Na tur e of the
Tobacc o Business and the Crucial Role of
Nic o t ine There in—RJ Reynolds, Memo-
randum by CE Teague, Apri l 14, 1972
(Mangini Trial Exhibit 48)
APPENDIX A: INDUSTRY QUOTES CONT.

23
Bos ton Region: Boston*, Brookl ine, Chelsea*,
Revere*, Winthrop*
Cent ral Region: Ashburnham, Ashby, Auburn,
Ayer*, Barre, Bel l ingham, Ber l in, Blackstone,
Bolton, Boylston, Brimf ield, Brookf ield, Charlton,
Cl inton, Douglas, Dudley*, East Brookf ie ld,
Fitchburg*, Franklin*, Gardner*, Groton, Hardwick,
Harvard, Holden, Holland, Hopedale, Hubbardston,
Lancast er, Leicest er, Leominst er*, Lunenburg,
Medway*, Mendon, Milford*, Millbury, Millvil le, New
Braintree, North Brookf ield, Northbridge, Oakham,
Oxford*, Paxton, Pepperel l, Pr inceton, Rut land,
Shir ley*, Shrewsbury, Southbridge*, Spencer,
St er l ing, Sturbr idge*, Sut ton, Templeton,
Townsend*, Upton, Uxbridge, Wales, Warren,
Webst er, West Boylston, West Brookf ie ld,
Westminster, Winchendon*, Worcester*
Metro-West Region: Acton, Arlington, Ashland,
Bedford, Belmont, Boxborough, Braintree,
Bur l ington*, Cambridge*, Canton, Car l isle,
Cohasset, Concord, Dedham, Dover, Foxborough,
Framingham, Hingham, Hol l iston, Hopkinton,
Hudson, Hul l, Lexington, Lincoln, Li t t le ton,
Marlborough, Maynard, Medf ield, Mil l is*, Milton,
Na t ick, Needham, Newton, Norfolk*,
Nor thborough*, Norwel l, Norwood, Plainv i l le*,
Quincy*, Randolph, Scituat e, Sharon, Sherborn,
Somer vi l le*, Southborough, Stow, Sudbury,
Walpole, Waltham, Watertown, Wayland, Wellesley,
Westborough, Weston, Westwood, Weymouth,
Wilmington, Winchester, Woburn, Wrentham
Nor theast Region: Amesbury*, Andover, Beverly*,
Billerica*, Boxford, Chelmsford*, Danvers, Dracut,
Dunst able, Essex*, Everet t*, Georgetown*,
Gloucest er*, Groveland*, Hamil ton*, Haverhi l l*,
Ipswich*, Lawrence*, Lowell*, Lynn*, Lynnf ield*,
Malden*, Manchest er*, Marblehead, Medford*,
Melrose*, Merr imac*, Methuen*, Middleton*,
Nahant, Newbury*, Newburyport*, North Andover*,
Nor th Reading, Peabody, Reading*, Rockpor t*,
Rowley*, Salem*, Salisbury*, Saugus, Stoneham*,
Swampscott, Tewksbury*, Topsf ield, Tyngsborough*,
Wakef ield*, Wenham*, West Newbury*, Westford*
Southea s t Region: Abington, Acushnet*,
Att leboro*, Avon*, Barnstable*, Berkley, Bourne,
Brewst er, Br idgewa t er, Brockton*, Car ver,
Cha tham, Chi lmark*, Dar tmouth*, Dennis*,
Dighton, Duxbury, East Br idgewa t er, Eastham,
Easton*, Edgar town*, Fairhaven*, Fal l River*,
Falmouth*, Freetown, Gay Head*, Gosnold, Halif ax,
Hanover, Hanson, Harwich, Holbrook, Kingston,
Lakevi l le, Mansf ie ld*, Marion*, Marshf ie ld,
Mashpee*, Ma t t apoiset t*, Middleborough*,
Nantucket, New Bedford*, Nor th At t leborough*,
Nor ton*, Oak Bluf f s*, Or leans*, Pembroke,
Plymouth, Plympton, Provincetown*, Raynham*,
Rehoboth, Rochest er*, Rockland, Sandwich*,
Seekonk*, Somerset, Stoughton, Swansea,
Taunton*, Tisbury*, Truro, Wareham*, Wel lf leet,
West Br idgewa t er, West Tisbury*, Westpor t*,
Whitman, Yarmouth*
West Region: Adams*, Agawam, Alford, Amherst*,
Ashf ie ld, Athol, Becket, Belcher town*,
Bernardston, Blandford, Buckland, Char lemont,
Cheshire, Chest er, Chest erf ie ld, Chicopee,
Clarksburg, Colrain, Conway, Cummington,
Dalton*, Deerf ie ld, East Longmeadow,
Easthampton*, Egremont, Er v ing, Flor ida, Gi l l,
Goshen, Granby, Granvi l le, Grea t Barr ington*,
Greenf ie ld*, Hadley*, Hampden, Hancock,
Ha tf ie ld*, Hawley, Hea th, Hinsdale, Holyoke*,
Hunt ington*, Lanesborough*, Lee*, Lenox*,
Leveret t, Leyden, Longmeadow, Ludlow*,
Middlef ie ld, Monroe, Monson*, Mont ague,
Mont erey, Montgomery, Mount Washington, New
Ashford, New Mar lborough, New Salem, Nor th
APPENDIX B: MASSACHUSETTS COMMUNITIES BY REGION

24
Adams*, Northampton, Northf ield, Orange, Ot is,
Palmer*, Pelham, Peru, Pet ersham, Phi l l ipston,
Pit tsf ield*, Plainf ield, Richmond, Rowe, Royalston,
Russell, Sandisf ield, Savoy, Sheff ield, Shelburne,
Shut esbury, South Hadley, Southampton,
Southwick, Springf ield*, Stockbridge*, Sunderland,
Tolland, Tyringham, Ware*, Warwick, Washington,
Wendel l, West Springf ie ld, West Stockbridge,
Westf ie ld, Westhampton, Wha t ely, Wilbraham*,
Williamsburg, Williamstown*, Windsor, Worthington
* i nd i c a t e s t h a t commun i t y p a r t i c i p a t e d in
Operat ion Storefront
APPENDIX B: MASSACHUSETTS COMMUNITIES BY REGION
Table 1: Retail Establishment Summary
Table 2: Operation Storefront Summary
Table 3: Establishment Summary with Means
Table 4: Distance to School Retail Establishment Summary
Table 5: Operation Storefront Distance to School Comparison
Table 6: Poverty Population Retail Establishment Summary
Table 7: Minority Population Retail Establishment Summary
Table 8: Operation Storefront Summary Minority Comparison
Table 9: Retail Population Comparison
Table 10: Regional Retail Summary
Table 11: Operation Storefront Summary by Region
APPENDIX C: TABLES


![StoreFront 3 - Citrix Docs · If the Citrix SCOM Management Pack Agent service is installed on the StoreFront server, StoreFront cannot upgrade. [#DNA-34792] On upgrade, StoreFront](https://static.fdocuments.net/doc/165x107/60ea15540160bf6e9274e47a/storefront-3-citrix-docs-if-the-citrix-scom-management-pack-agent-service-is-installed.jpg)