MASS BALANCE, METEOROLOGICAL, AND RUNOFF MEASUREMENTS AT ... · MASS BALANCE, METEOROLOGICAL, AND...
44
MASS BALANCE, METEOROLOGICAL, AND RUNOFF MEASUREMENTS AT SOUTH CASCADE GLACIER, WASHINGTON, 1992 BALANCE YEAR By Robert M. Krimmel U.S. GEOLOGICAL SURVEY Open-File Report 93-640 Tacoma, Washington 1993
Transcript of MASS BALANCE, METEOROLOGICAL, AND RUNOFF MEASUREMENTS AT ... · MASS BALANCE, METEOROLOGICAL, AND...

MASS BALANCE, METEOROLOGICAL, AND RUNOFF MEASUREMENTS AT SOUTH CASCADE GLACIER, WASHINGTON, 1992 BALANCE YEAR
By Robert M. Krimmel
U.S. GEOLOGICAL SURVEY
Open-File Report 93-640
Tacoma, Washington 1993

U.S. DEPARTMENT OF THE INTERIOR BRUCE BABBITT, Secretary
U.S. GEOLOGICAL SURVEY Robert M. Hirsch, Acting Director
For additional information Copies of this report can write to: be purchased from:
Chief, Ice and Climate Project U.S. Geological Survey U.S. Geological Survey Earth Science Information Center University of Puget Sound Open-File Reports Section Tacoma, Washington 98416 Box 25286, MS 517
Denver Federal Center Denver, Colorado 80225
CONTENTS
Page Abstract...................................................................................................................................... 1Introduction................................................................................................................................ 1
Description and climate of area............................................................................................ 1Measurement systems ..........................................................................................................2
1992 Balance year data collection................................................................................................ 3Recorded variables............................................................................................................... 3Aerial photography ..............................................................................................................4Measurements near the 1991 mass balance minimum............................................................ 5Measurements near the 1992 mass balance maximum........................................................... 5Measurements during June through October ........................................................................ 5
Runoff measurements.................................................................................................................. 61992 mass balance evaluation...................................................................................................... 6
Winter balance..................................................................................................................... 7Net balance.......................................................................................................................... 8Balance year to hydrologic year adjustments........................................................................ 8Balance measurement errors................................................................................................. 9
Conclusions and long-term balance record................................................................................. 10References................................................................................................................................ 11
ILLUSTRATIONS
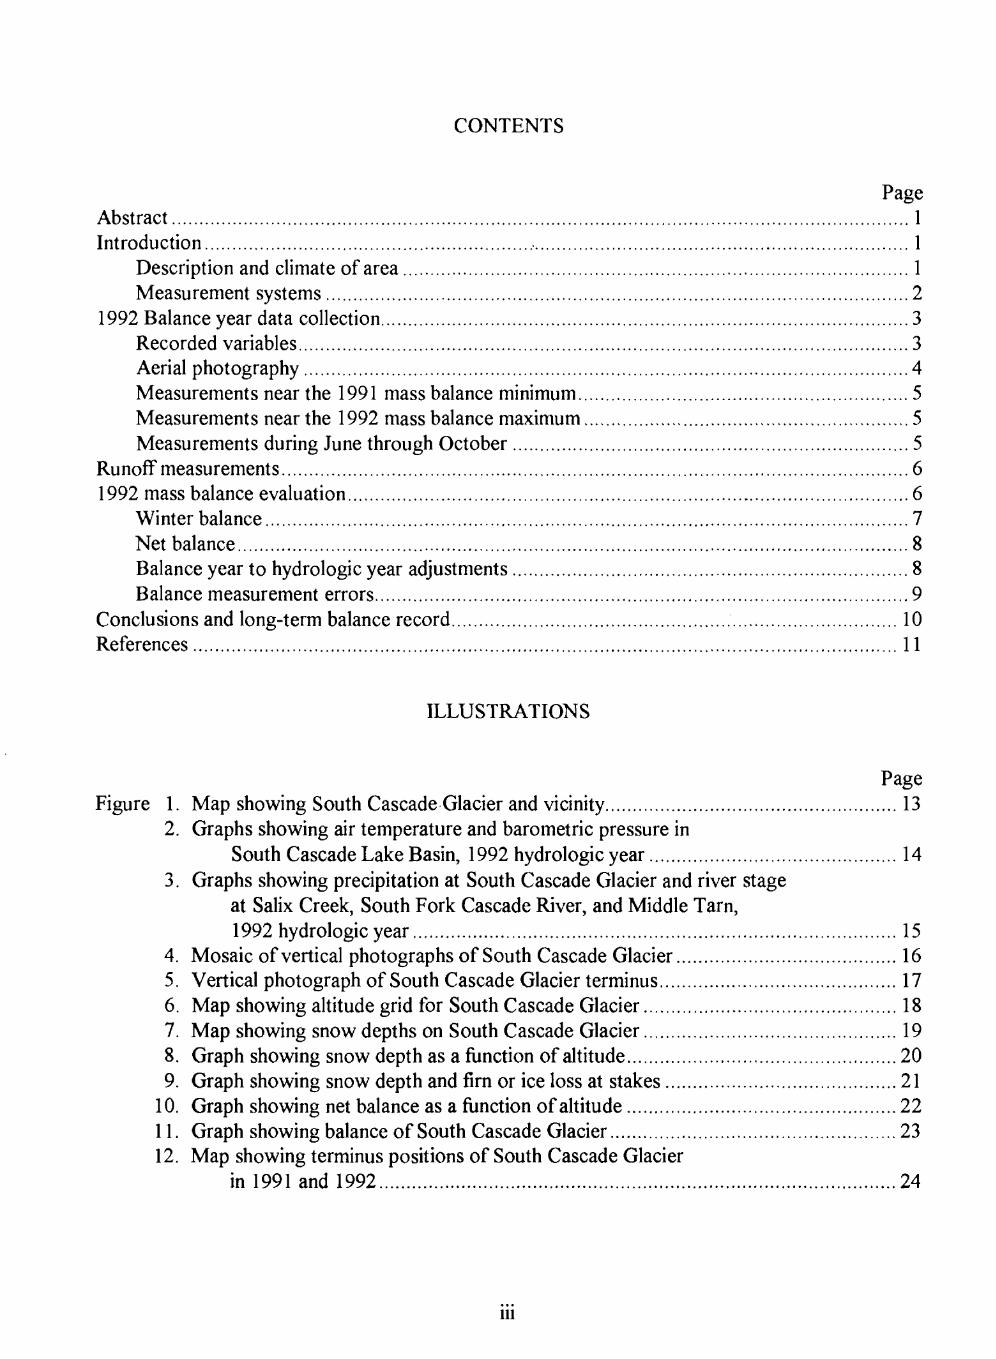
Page Figure 1. Map showing South Cascade Glacier and vicinity..................................................... 13
2. Graphs showing air temperature and barometric pressure inSouth Cascade Lake Basin, 1992 hydrologic year............................................. 14
3. Graphs showing precipitation at South Cascade Glacier and river stage at Salix Creek, South Fork Cascade River, and Middle Tarn, 1992 hydrologic year........................................................................................ 15
4. Mosaic of vertical photographs of South Cascade Glacier........................................ 165. Vertical photograph of South Cascade Glacier terminus........................................... 176. Map showing altitude grid for South Cascade Glacier.............................................. 187. Map showing snow depths on South Cascade Glacier.............................................. 198. Graph showing snow depth as a function of altitude................................................. 209. Graph showing snow depth and firn or ice loss at stakes.......................................... 21
10. Graph showing net balance as a function of altitude .................................................2211. Graph showing balance of South Cascade Glacier.................................................... 2312. Map showing terminus positions of South Cascade Glacier
in 1991 and 1992.............................................................................................. 24
111

TABLES
Table 1. Areas of distinct units within and near South Cascade Glacier Basin,October 6, 1992................................................................................................. 25
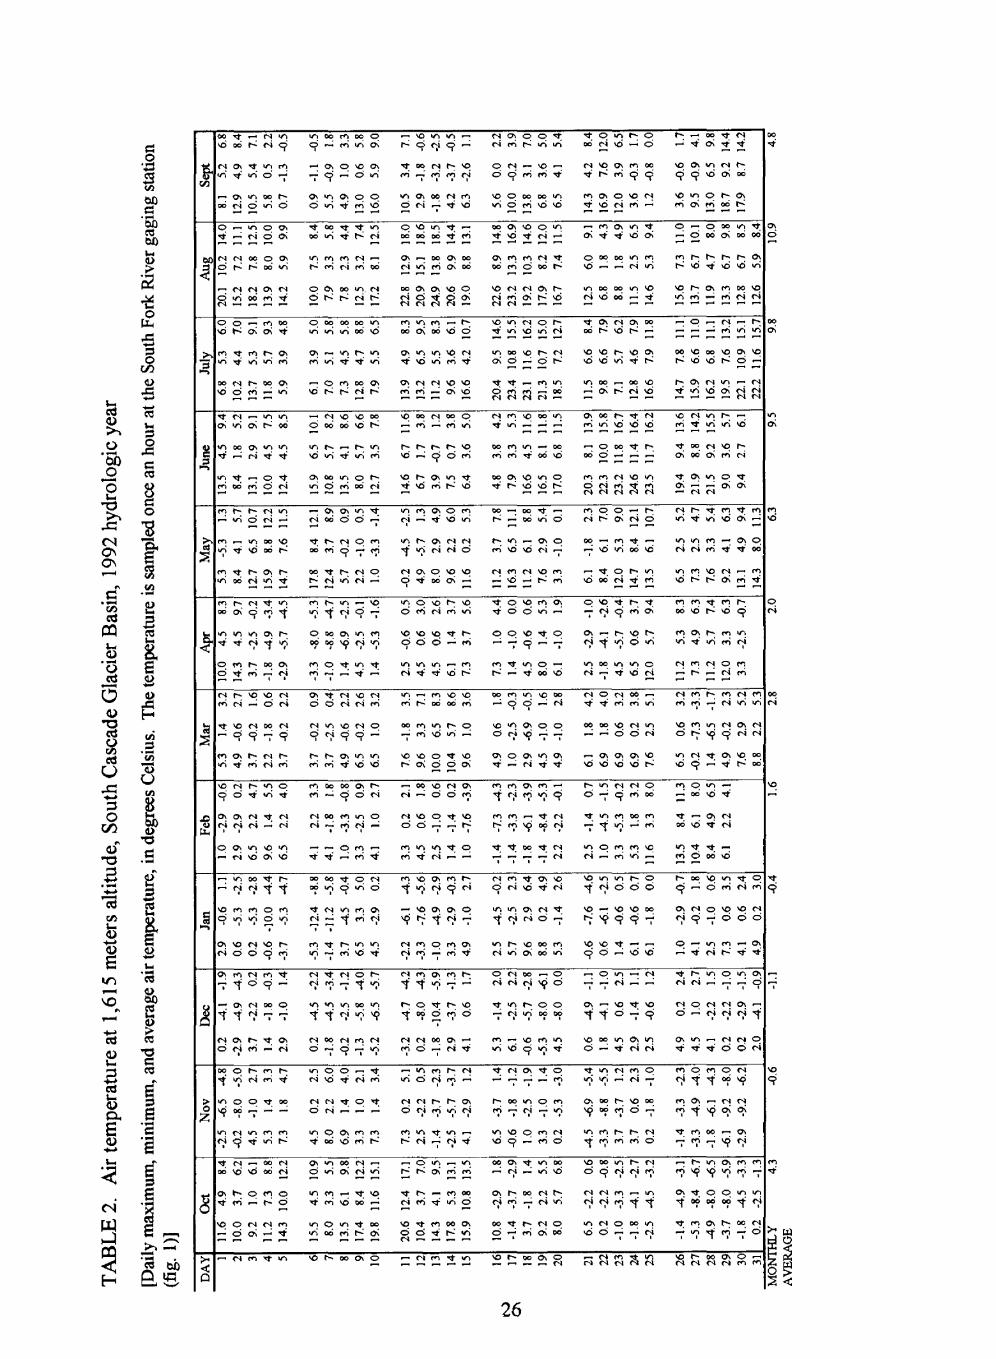
2. Air temperature at 1,615 meters altitude, South Cascade Glacier Basin,1992 hydrologicyear..........................................................................................26
3. Air temperature at 1,867 meters altitude, South Cascade Glacier Basin,1992 hydrologic year.......................................................................................... 27
4. Precipitation at 1,615 meters altitude, South Cascade Glacier Basin,1992 hydrologic year.......................................................................................... 28
5. Aerial photography of South Cascade Glacier Basin, 1992 ........................................296. South Cascade Glacier altitude grid, October 6, 1992................................................ 307. Snow density at South Cascade Glacier, April 15, 1992............................................. 318. Snow depths at South Cascade Glacier, April 15-16, 1992 ........................................ 329. Snow density at 1,618 meters altitude in South Cascade Glacier Basin,
April 16, 1992.................................................................................................... 3310. Stake measurements at South Cascade Glacier in the 1992 balance year.................... 3411. South Cascade Glacier Basin runoff, 1992 hydrologic year........................................ 3512. Salix Basin runoff, 1992 hydrologic year................................................................... 3613. South Cascade Glacier mass balance time series........................................................ 3714. Machine-readable files available as a supplement to this report .................................. 38
IV

CONVERSION FACTORS, VERTICAL DATUM, SYMBOLS, AND MACHINE-READABLE FILES
Multiply By To obtain
centimeter (cm) 0.3937 inchdegree Celsius (°C) 1.8, then add 32 degrees Fahrenheitfoot (ft) 0.3048 metergram 0.002205 poundhectare (ha) 2.471 acresinch 2.54 centimeterkilogram (kg) 2.205 poundskilometer (km) 0.6214 milemeter (m) 3.281 footmillimeter 0.03937 inchsquare kilometer (km2) 0.3861 square mile
Vertical datum:
In this report "sea level" refers to the National Geodetic Vertical Datum of 1929 (NGVD of 1929)~a geodetic datum derived from a general adjustment of the first-order level nets of both the United States and Canada, formerly called Sea Level Datum of 1929.
Symbols used in this report:
bo The change in balance between the minimum balance near the beginning of the hydrologic year and October 1.
b\ The change in balance between the minimum balance near the end of the hydrologic year and September 30.
ba The change in snow, firn, and ice storage between the beginning and end of some fixed period, which here is the hydrologic year.
b m (s) The snow above the previously formed summer surface as measured directly by field work in late spring as near as possible to the time of greatest glacier mass.
b a The change in snow, firn, and ice storage between times of minimum mass.
b w (s) The maximum of snow mass during the balance year.
t'0 The time at which the minimum glacier mass occurs at the beginning of the balance year.
t\ The time at which the minimum glacier mass occurs at the end of the balance year.

Machine-readable files:
To make the data contained in this report more usable, most of these data have been recorded on easily copied computer media. This machine-readable material is available from the World Data Center, Campus Box 449, University of Colorado, Boulder, CO, 80309.
VI
MASS BALANCE, METEOROLOGICAL, AND RUNOFF MEASUREMENTS AT SOUTH CASCADE GLACIER, WASHINGTON, 1992 BALANCE YEAR
Robert M. Krimmel
ABSTRACT
Values of winter snow accumulation and summer snow, firn, and ice ablation were measured at South Cascade Glacier, Wash., to determine the winter and net balance for the 1992 balance year. The 1992 winter balance, averaged over the glacier, was 1.91 meters, and the net balance was -2.01 meters. This extremely negative balance continued a trend of negative balance years beginning in 1977. Air temperature (at 1,615 meters and 1,867 meters), barometric pressure, precipitation, and runoff from this glacier basin and an adjacent non-glacierized basin were also continuously measured. This report makes all these data, in tabular, graphical, and machine-readable forms, available to users throughout the glaciological and climatological community.
INTRODUCTION
South Cascade Glacier is a small valley glacier near the crest of the North Cascade Range, Washington State (fig. 1). Numerous variables relating to the glacier regime have been measured on and near South Cascade Glacier since the late 1950's. The long-term goal of this project is to understand the climate-glacier relation. A short-term goal is to document the measurements with sufficient precision so that an internally consistent record of conditions on and around the glacier can be assembled despite personnel changes, discontinuous records, and changing methods of data collection and analysis. Some periods of record at South Cascade Glacier have been documented. Work from 1957-64 is described by Meier and Tangborn (1965), work from 1965-67 is described by Meier and others (1971) and by Tangborn and others (1977). Mass balance results for 1958-85 are summarized by Krimmel (1989). The purpose of this report is to document the measurements of the 1992 balance year that are relevant to the South Cascade Glacier-climate relation.
Description and Climate of Area
South Cascade Glacier is located at the head of the South Fork of the Cascade River, a tributary to the Skagit River, which flows into Puget Sound about 100 km to the west. The glacier area is dominated by steep terrain, with relief of more than 1,000 m. Areas within the basin not covered by glacier ice or water are underlain by bedrock. The bedrock is either mantled by a thin layer of soil and, in places, by scrub conifer, heather, or other vegetation typical of the high North Cascade Range, or is covered by glacial moraine or outwash material. The climate of the region is maritime. Near the glacier, typical winter low temperatures are about -10°C, and typical summer high temperatures are about 20°C. Most of the precipitation, which commonly reaches 4.5 m annually (Meier and others, 1971), falls as snow in the period October to May.
South Cascade Lake Basin has an area of'6.14 km2 (table 1), and spans from 1,615 to 2,518 m altitude. A sub-basin of the South Cascade Lake Basin is the 4.46-km2 Middle Tarn Basin2 , which constitutes the southern two-thirds of the South Cascade Lake Basin. Virtually all ice melt3 within the South Cascade Lake Basin takes place in the Middle Tarn Basin. Near the end of the 1992 melt season, the total snow and ice covered area in Middle Tarn Basin was 2.50 km2 .
Salix Basin is adjacent to the South Cascade Lake Basin, has an area of 40.22 km2, spans from 1,587 to 2,140 m altitude, and is predominantly south facing.
Measurement Systems
Glacier mass balance definitions (Mayo and others, 1972), are adhered to in this report, and the stratigraphic system, which is more field compatible than the fixed date system, is usually used. The specific terms are defined when used.
The balance year, defined by Mayo and others (1972) as the interval between the minimum glacier mass in one year and the minimum glacier mass the following year, is used when appropriate. The hydrologic year is the interval between the beginning of October and the end of the following September.
Units used is this report are a mix of metric and English. Graphical representations preserve the units in which the data were collected. The computed tabular data are converted to metric units.
All local coordinates are in meters, in which the local +Y axis is approximately true north. Vertical location is in meters above the National Geodetic Datum of 1929. Horizontal locations are defined by a local system that can be converted to Universal Transverse Mercator (UTM) zone 10 coordinates by:
UTM easting = local X + 642,000UTM northing = local Y + 5,355,000.
Densities are given as a decimal fraction of the density of water, the density of which is considered to be 1,000 kilograms per cubic meter.
! The area of this basin has been previously reported as 6.02 and 6.11 km2 . These differences are due to different interpretations of the drainage divide.
2"Middle Tarn" is an unofficial name.
3 A small, debris-covered area of perennial ice lies outside of the Middle Tarn Basin.
4Salix Basin drainage divides are poorly defined.

1992 BALANCE YEAR DATA COLLECTION
Recorded Variables
Several variables are measured continuously; these are truncated to the hydrologic year (HY), October 1, 1991 through September 30, 1992. When information beyond the HY concerning these variables is required for analysis of the glacier mass balance, the required data are discussed. The continuous measurements may be stored on analog recorders, which give a continuous trace of the variable; on digital recorders, which store instantaneous data at regular time intervals; or transmitted via satellite through a data collection platform (DCP) to Tacoma. The time interval may be different for different variables. Some variables are stored on redundant analog and digital recorders.
River stage, air temperature, wind speed and direction, barometric pressure, and precipitation values are relayed from the South Fork Cascade River gaging station (fig. 1) to Tacoma, Wash., through the DCP. On June 12, 1992, the DCP failed. Repairs were made and the unit was replaced, and successful data transmissions began on August 18. However, because of changes in ground station hardware and software, data transmissions after August 18 were also intermittent.
Air temperature is measured at the South Fork gaging station at 1,615 m altitude. The DCP temperature is sampled once each hour. An analog strip-chart recorder also records air temperature, serving as a back-up system. Both sensors are housed in radiation shields 6 m above ground level. This temperature record is shown in figure 2 and in table 2. When the DCP was not working, data were obtained from the strip chart, which was calibrated using prior data from the DCP.
Air temperature is also sampled and recorded once each hour on a data logger at 1,867 m altitude at RUBY (fig. 1). This sensor is housed in a radiation shield 1.5m above the ground. Wind scour keeps the winter snow from burying this sensor. The temperature record is shown in figure 2, and in table 3. Air temperature data at both sites are estimated to be accurate to 1°C. Air temperature is also measured at the hut (fig. 1), at 1,844 m altitude, on a 30-day circular analog chart. The record is used only as a backup system, and for the convenience of personnel at the station.
Barometric pressure is sampled near the South Fork gaging station at 1,615 m altitude once each hour and transmitted through the DCP. A data gap appears in the record (fig. 2) when the DCP was not working.
Precipitation is measured near the South Fork gaging station at 1,615 m altitude using a tipping bucket gage with a sensitivity of 0.01 inches of precipitation. The cumulative precipitation for each hour is relayed through the DCP (fig. 3, table 4). The 8-inch orifice of the gage is about 5 m above ground level. There is no wind shield on this gage. An attempt was made to heat the orifice using a catalytic propane heater, but the propane supply was exhausted by December 5, 1991, and was not replenished. Thus the gage orifice was probably snow covered at times after December 5. The 1992 hydrologic year precipitation record ended on June 12, 1992, when the
DCP transmission system failed. It is suspected that the gaged precipitation, as reported, is not representative of the true average precipitation in the basin because of low gage catch in blowing snow, snow caps over the orifice, and the variability of precipitation within the basin.
Water stage is recorded at the Salix Creek gaging station on an analog strip chart and independently on a digital paper punch at 15-minute intervals. The stage record is accurate to 0.01 ft. The entire record shown in figure 3 is from the digital recorder. Both recorders were non-functional from late February until mid April.
The stage of the South Cascade Lake is measured near the outlet to the South Fork Cascade River about 10m from the South Fork gaging station. Lake stage is sensed by a float in a well attached to a potentiometer. Stage is sampled once an hour and relayed by the DCP. The South Fork Cascade River stage is measured as it leaves South Cascade Lake at the South Fork gaging station. The stages of the lake and the outlet river are equivalent. The river stage is sensed by a float attached to a digital paper punch, and is recorded at 30-minute intervals. An independent float, in the same well, is attached to an analog recorder. These stage records are accurate to 0.01 ft. The record shown in figure 3 is from the DCP data except for December 9-11, 1991, and June 12 to September 30, 1992, when the DCP was not working, for which period the record is from the analog recorder.
The stage of Middle Tarn is measured in a stilling well at the edge of the tarn about 50 m from the outlet stream. The stage (fig. 3) is sensed by a float attached to a potentiometer, and is recorded at 15-minute intervals on a data logger. This stage record is accurate to 0.01 ft. This well and recorder were installed in late June 1992.
Aerial Photography
Aerial photography provides an accurate record of a glacier at a specific time. Aerial photographs of South Cascade Glacier were acquired July 28, September 15, 18, and 29, and October 6, 1992 (table 5). A calibrated 9-inch camera with a 6-inch lens was used for the vertical photography. On September 15, 18, and 29, a thin cover of new snow obscured the transient snow and firn lines. On October 6, only a trace of obscuring new snow was present, and photographs were acquired at two scales: nearly the entire basin was photographed at 1:12,000 scale (fig. 4), and most of the basin below 2,000 m altitude was photographed at 1:8,000 scale (fig. 5).
The October 6 photographs were used to measure the terminus position, transient snow and firn lines, and a surface grid over the entire glacier. Stereo photogrammetry was used for these measurements, and was done by the author using standard photogrammetric procedures. The perimeters of distinct surficial units (such as snow patches, water bodies, and basin boundaries) were defined by numerous points encompassing the respective unit. The area of each polygon (shown on fig. 1) was calculated and given in Table 1. Gridded altitudes are shown in figure 6 and table 6. All photogrammetrically measured altitudes are accurate to 1 m in horizontal and vertical location; however, the actual altitude measurement may be up to 3 m from the nominal grid point.

Measurements Near the 1991 Mass Balance Minimum
The 1992 balance year began in the autumn of 1991 when new snow fell on the glacier, and remained throughout the winter. Air temperature generally remained above freezing in the lower basin until October 16, 1991. A snow depth of 0.15 m was recorded at the lower glacier stake (5 A-1991, near 4-1992 [fig. 1]) at the time of the last 1991 visit to the glacier basin on November 1, 1991. Early November was wet and generally above freezing at 1,615 m altitude. At 1,867 m altitude, air temperature was generally below freezing after mid-October. A temperature sensor 0.10 m above ground level at 1,615 m altitude, stabilized at 0°C on November 20, indicating that the ground was snow covered , and remained so until the following spring. The glacier was probably snow covered continuously beginning on or about October 16, which would mark the beginning of the 1992 balance year.
Measurements Near the 1992 Mass Balance Maximum
Density measurements were made along the entire vertical column of snow in a snow pit (PIT, fig. 1) on April 15, 1992 (table 7). The depth to firn was 4.23 m. The presence of firn, rather than ice, under the snowpack verified that there was indeed a positive balance at this location for the previous balance year. Bulk snowpack density was 0.49, and zones of frozen snow were found in the pit. No detailed temperature or stratigraphic profile of the snow pit was made. On April 15, the depth of snow on the upper glacier was probed about every 50 m, estimated by pacing, on a direct line between approximately known points (fig. 7, table 8). Penetration of the snowpack was fairly easy over the entire profile, and at most probe points a layer of depth hoar could be felt near the bottom of the snowpack.
On April 16, snow depth probings were made at approximately 50 m intervals along both the east and west sides of the lower glacier (fig. 7, table 8). Snow depth and density measurements were made at eight locations between two marker poles near the South Fork gaging station using a snow tube that penetrated the entire snowpack (table 9). Average snow depth between the marker poles was 142 cm and density was 0.54.
Measurements During June Through October
Several visits are made to South Cascade Glacier each summer. The purpose of these visits is to monitor the melting of snow and ice, to make discharge measurements at the streamgaging stations, to set and reset ablation stakes as needed, and to do maintenance that cannot be done when there is snow around the facilities.
On June 3-4, four stakes were set on the glacier. Each stake was 6 m long, and set in a hole 7-8 m deep. An attempt was made to set the stakes so that they would be visible on the next visit, and so that they would not need to be reset during the summer. The terminus was about 50 percent snow free, and the lake was 90 percent snow and ice free.

On June 23-25, the stilling well was installed in Middle Tarn, and repairs were made at the hut. The glacier was again visited August 17-18, at which time the DCP was restarted and all balance stakes were measured and reset as necessary. On September 7-9, a trip was made to measure balance stakes.
The final trip of the balance year was made on October 10. It was expected that ablation would be negligible after that time. All stakes were measured (table 10), the hut was closed for the winter, and all recorders were serviced for the winter.
RUNOFF MEASUREMENTS
Runoff from the South Cascade Glacier Basin has been measured since 1957 and from Salix Basin since 1960. In 1992, an additional station, Middle Tarn, was installed to measure runoff from the northern 73 percent of the South Cascade Glacier Basin.
Discharge measurements made in the outlet stream from South Cascade Lake are used to develop a stage-discharge rating curve, which is then used to convert recorded stage to water flux The flux is shown as runoff, in millimeters per day, in table 11.
The stage of Salix Creek is converted to water flux using a stage-discharge rating that was developed several years ago. Because the control and channel are stable, the relation of stage to discharge does not change. Daily values of runoff from Salix Basin are given in table 12.
A tarn at the glacier terminus called Middle Tarn in this report that first became exposed in 1985 was 1.4 ha in area by 1992. A stable bedrock channel controls the outlet from Middle Tarn, and virtually all of the glacier runoff is directed through that outlet. Three discharge measurements were made at the outlet in 1992, but no runoff calculations were made because the rating curve was not sufficiently defined by these measurements. Significant advantages are gained by measuring runoff from the Middle Tarn Basin rather than from the entire South Cascade Lake Basin. Although Middle Tarn Basin is entirely contained within the South Cascade Lake Basin, portions of the South Cascade Lake Basin are not included in the Middle Tarn Basin. These include South Cascade Lake, which tends to attenuate the distinctive "signal" of glacier runoff strong diurnal fluctuation and release of stored water and a large area of steep and inaccessible cliffs where there is no perennial snow or ice.
1992 MASS BALANCE EVALUATION
The collection of balance measurements made at specific locations at specific times and the recorded temperatures, precipitation, and runoff are used to estimate several area-averaged mass balance values and the dates on which they occur. At South Cascade Glacier, the field measurements are stratigraphic, that is, referenced to the time-transgressive surface that formed as the previous ablation season ended. Area-averaged stratigraphic balance values are estimated, as are adjustments to these values, so that the glacier balance values can be related to the hydrologic year, October 1, 1991 through September 30, 1992.

Previously published South Cascade Glacier mass balances for the years 1965-67 (Meier and others, 1971, Tangborn and others, 1977) were derived from the same types of data as those used in this report. A major difference between the data sets for 1965-67 and 1992 was a denser stake network in the former years in 1965-67 each stake represented about 0.1 km2 of the glacier surface, and in 1992 each stake represented about 0.5 km2 . In both 1965-67 and 1992, the stake networks covered nearly the entire altitude range of the glacier, but the 1965-67 network allowed lateral balance variations to be observed, whereas the 1992 net gave no information about the lateral variations. The 1965-67 area integrated balance values were derived from isopack maps of balance. Because there was not sufficient spatial resolution to draw balance maps in 1992, a different method to determine area integrated balances was devised.
A graphical procedure called the Grid-Index (GI) method is used to create a representation of the area/altitude distribution of a glacier. The GI method is based on gridded surface altitudes (essentially a digital elevation model) and functions of balance variables that are dependent on altitude. The altitude-dependent functions are determined by finding a curve that approximates all the available data. The curve is then evaluated at the altitude of each grid node, and the product of each value and the grid cell area is a balance volume. The cumulative volume is the balance volume, which can be converted to a one dimensional quantity by division by the number of grid cells. Although the GI method accounts for the area-altitude distribution of the glacier, it does not account for variations of balance values at a given altitude.
The surface altitude grid used at South Cascade Glacier has a cell size of 0.1 by 0.1 km. The altitude of the entire cell is considered to be the altitude at the nominal center of the cell, which is based on the local X,Y coordinate system; the cell centers are at
XGrid = 70, 170,270....YGrid=100, 200, 300....
This particular translation was chosen to allow the entire South Cascade Lake Basin to be included within a 24 by 40 grid area.
Winter Balance
The measured winter snow balance, b m (s), is defined by Mayo and others (1972) as the snow above the previously formed summer surface as measured directly in late spring as near as possible to the time of greatest glacier mass. The snow depth and density measurements made on
April 15-16, 1992 are the principal data source for im (s). The grid used for winter snow balance measurements was based on photographs taken on September 9, 1991. The altitude of each of the 64 probed snow depths was determined from a contour map drawn from the 1991 grid. A 2d degree polynomial was fit to the snow depth and altitude at the 64 probe points and the snow depth at the 1,615 m altitude snow course (fig. 8). A linear fit was made between the density measurements made at 1,615 m altitude (0.54) and at 1,852 m altitude (0.49). The product of the evaluation of the polynomial (for the snow depth) and the line (for density) at the altitude of each grid point gives the snow water equivalent (W.E.) at each grid point. The product of the W.E. at each grid and the grid cell area (0.01 km2) gives the water volume at each cell, and the cumulation

of all the cells gives the total water volume of the winter snow, 4.32xl06 m3 . Dividing this volume by the September 9, 1991 glacier area, 2.26xl06 m2 , gives bm (s) = 1.91 m.
The maximum winter snow balance, 6w (s), is defined by Mayo and others (1972) as the maximum of snow mass during the balance year. This quantity is computed or estimated from themeasured winter snow balance, bm (s), and from other information that may be available, such as recorded temperature, precipitation, and runoff data. In the spring of 1992, the date of maximum snow mass was not obvious. The precipitation on April 16 was observed to be rain over the entire glacier, and the precipitation near the end of April coincided with above-freezing temperatures, and was also probably rain. Zones of frozen snow were observed in the pit dug on April 15, thus some of the rain may have frozen in the snow. The runoff from South Cascade Lake Basin was substantial for a few days in early April and mid-April, and major runoff beganApril 27. It is estimated that b w (s) was reached on April 26, and was not significantly greater than bm (s).
Net Balance
Net balance, b n , is defined by Mayo and others (1972) as the change in snow, firn, and ice
storage between times, t'0 and t\ of minimum mass. The observation of the balance at each of the
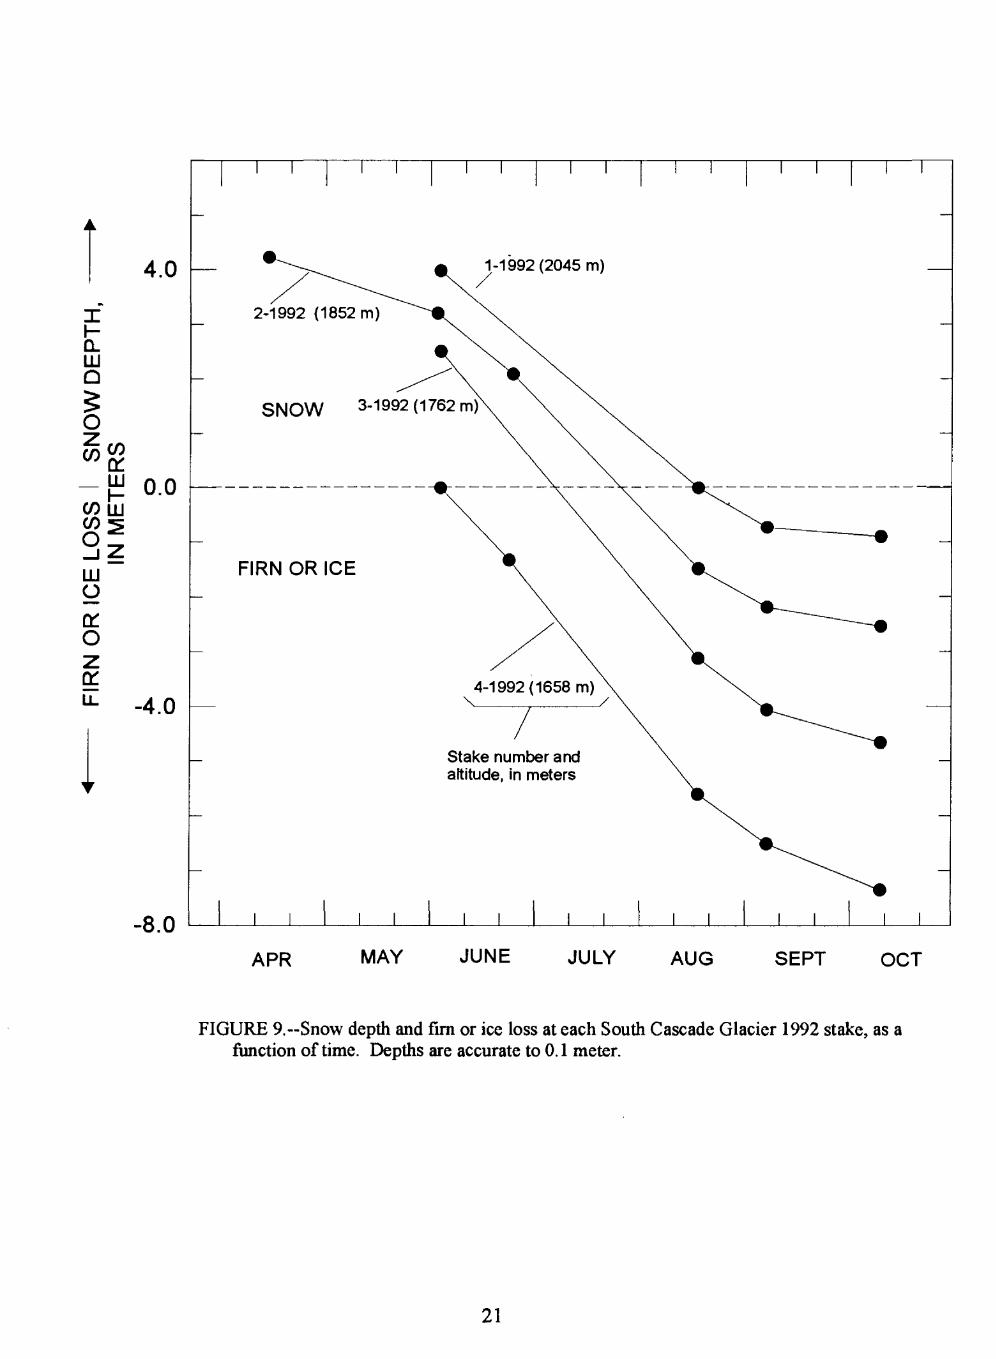
stakes (fig. 9, table 10) is the principal data source for b n . The stake balances are referenced to the surface formed at the end of the previous ablation season at the stake location. An estimation of the balance change after the last stake measurement and the end of ablation at the stake is made on the basis of the continuously recorded temperatures, precipitation, and stream-stages; and in some cases by measurements of the ice level on the balance stakes in the following balance year. A 2d degree polynomial is fit to the final balance at each of the four stakes and their respective altitudes and a fifth point, that of the equilibrium line altitude on October 6, 1992, where the balance was zero (fig. 10). The grid used in the GI method net balance integration is determined from the October 6, 1992 photographs. The polynomial is evaluated at the altitude of each grid cell, and the cumulation of the grid cell volumes, -4.16x10⁶ m3, divided by the combined area of
all the grid cells, 2.07xl06 m2, gives bn = -2.01 m.
Balance Year To Hydrologic Year Adjustments
Mayo and others (1972) define two terms required to relate the stratigraphic measurementsto the hydrologic year. The initial balance increment, bo, is the change in balance between the minimum balance near the beginning of the hydrologic year and October 1; the final balance
increment, b\, is the change in balance between the minimum balance near the end of the hydrologic year and September 30.
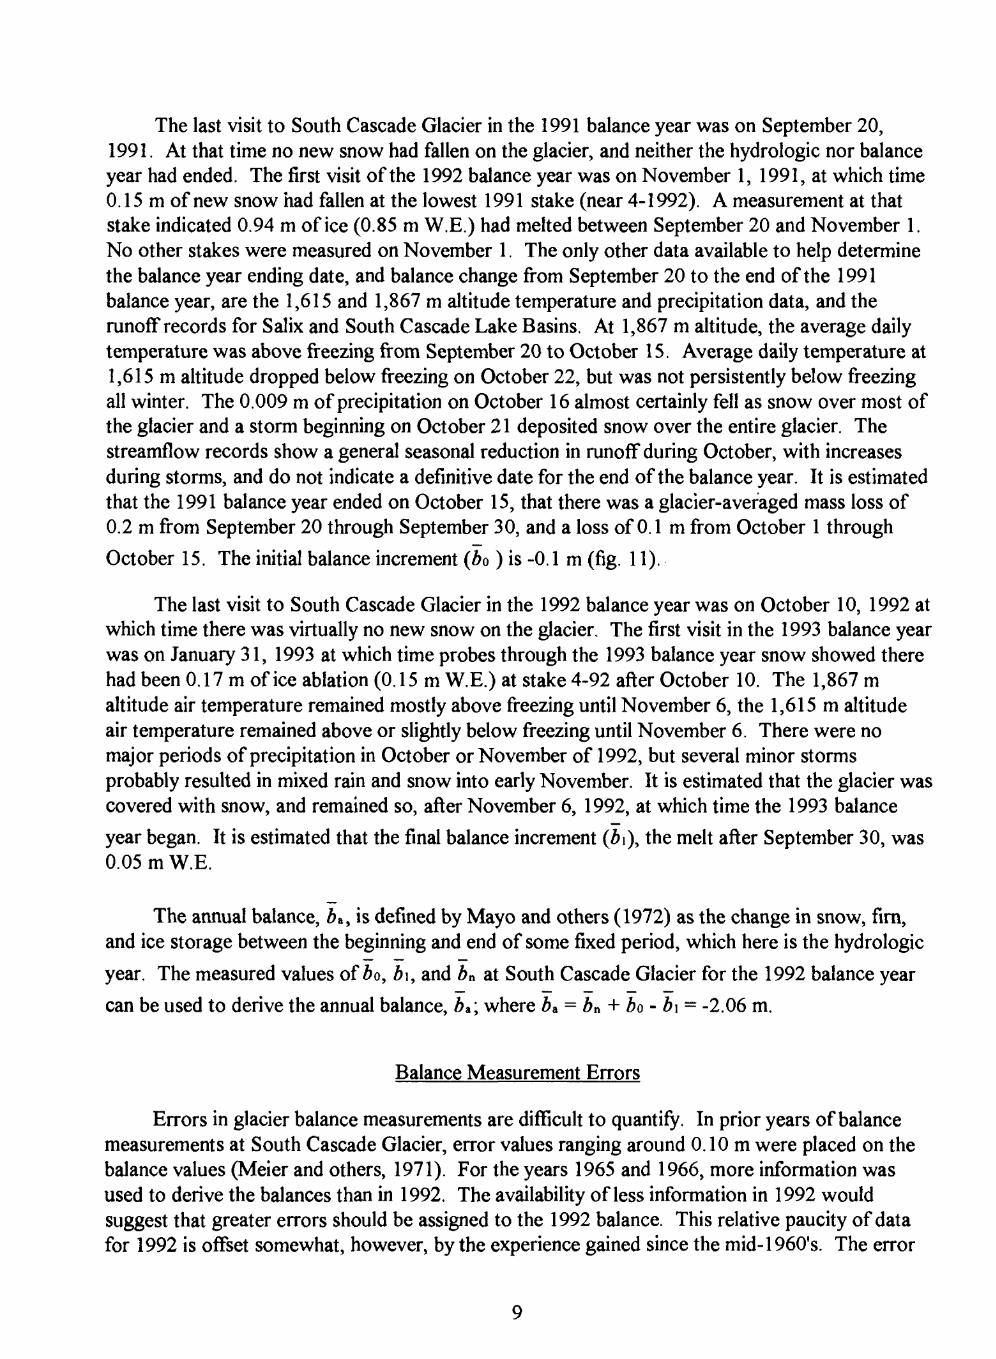
The last visit to South Cascade Glacier in the 1991 balance year was on September 20, 1991. At that time no new snow had fallen on the glacier, and neither the hydrologic nor balance year had ended. The first visit of the 1992 balance year was on November 1, 1991, at which time 0.15 m of new snow had fallen at the lowest 1991 stake (near 4-1992). A measurement at that stake indicated 0.94 m of ice (0.85 m W.E.) had melted between September 20 and November 1. No other stakes were measured on November 1. The only other data available to help determine the balance year ending date, and balance change from September 20 to the end of the 1991 balance year, are the 1,615 and 1,867 m altitude temperature and precipitation data, and the runoff records for Salix and South Cascade Lake Basins. At 1,867 m altitude, the average daily temperature was above freezing from September 20 to October 15. Average daily temperature at 1,615 m altitude dropped below freezing on October 22, but was not persistently below freezing all winter. The 0.009 m of precipitation on October 16 almost certainly fell as snow over most of the glacier and a storm beginning on October 21 deposited snow over the entire glacier. The streamflow records show a general seasonal reduction in runoff during October, with increases during storms, and do not indicate a definitive date for the end of the balance year. It is estimated that the 1991 balance year ended on October 15, that there was a glacier-averaged mass loss of 0.2 m from September 20 through September 30, and a loss of 0.1 m from October 1 through
October 15. The initial balance increment (bo ) is -0.1 m (fig. 11).
The last visit to South Cascade Glacier in the 1992 balance year was on October 10, 1992 at which time there was virtually no new snow on the glacier. The first visit in the 1993 balance year was on January 31, 1993 at which time probes through the 1993 balance year snow showed there had been 0.17 m of ice ablation (0.15 m W.E.) at stake 4-92 after October 10. The 1,867 m altitude air temperature remained mostly above freezing until November 6, the 1,615 m altitude air temperature remained above or slightly below freezing until November 6. There were no major periods of precipitation in October or November of 1992, but several minor storms probably resulted in mixed rain and snow into early November. It is estimated that the glacier was covered with snow, and remained so, after November 6, 1992, at which time the 1993 balance
year began. It is estimated that the final balance increment (b\\ the melt after September 30, was 0.05 m W.E.
The annual balance, ia, is defined by Mayo and others (1972) as the change in snow, firn, and ice storage between the beginning and end of some fixed period, which here is the hydrologic
year. The measured values of bo, b\, and b n at South Cascade Glacier for the 1992 balance year
can be used to derive the annual balance, i a ; where b* = b n + bo - b\ = -2.06 m.
Balance Measurement Errors
Errors in glacier balance measurements are difficult to quantify. In prior years of balance measurements at South Cascade Glacier, error values ranging around 0.10 m were placed on the balance values (Meier and others, 1971). For the years 1965 and 1966, more information was used to derive the balances than in 1992. The availability of less information in 1992 would suggest that greater errors should be assigned to the 1992 balance. This relative paucity of data for 1992 is offset somewhat, however, by the experience gained since the mid-1960's. The error

of the 1992 balance values is estimated to be 10 percent. Although other factors that affect the balance, such as internal accumulation of ice, superimposed ice, internal melt, and basal melt, are possible, they are not considered in this report. These factors are insignificant compared with the errors assigned to the surface balance values.
CONCLUSIONS AND LONG-TERM BALANCE RECORD
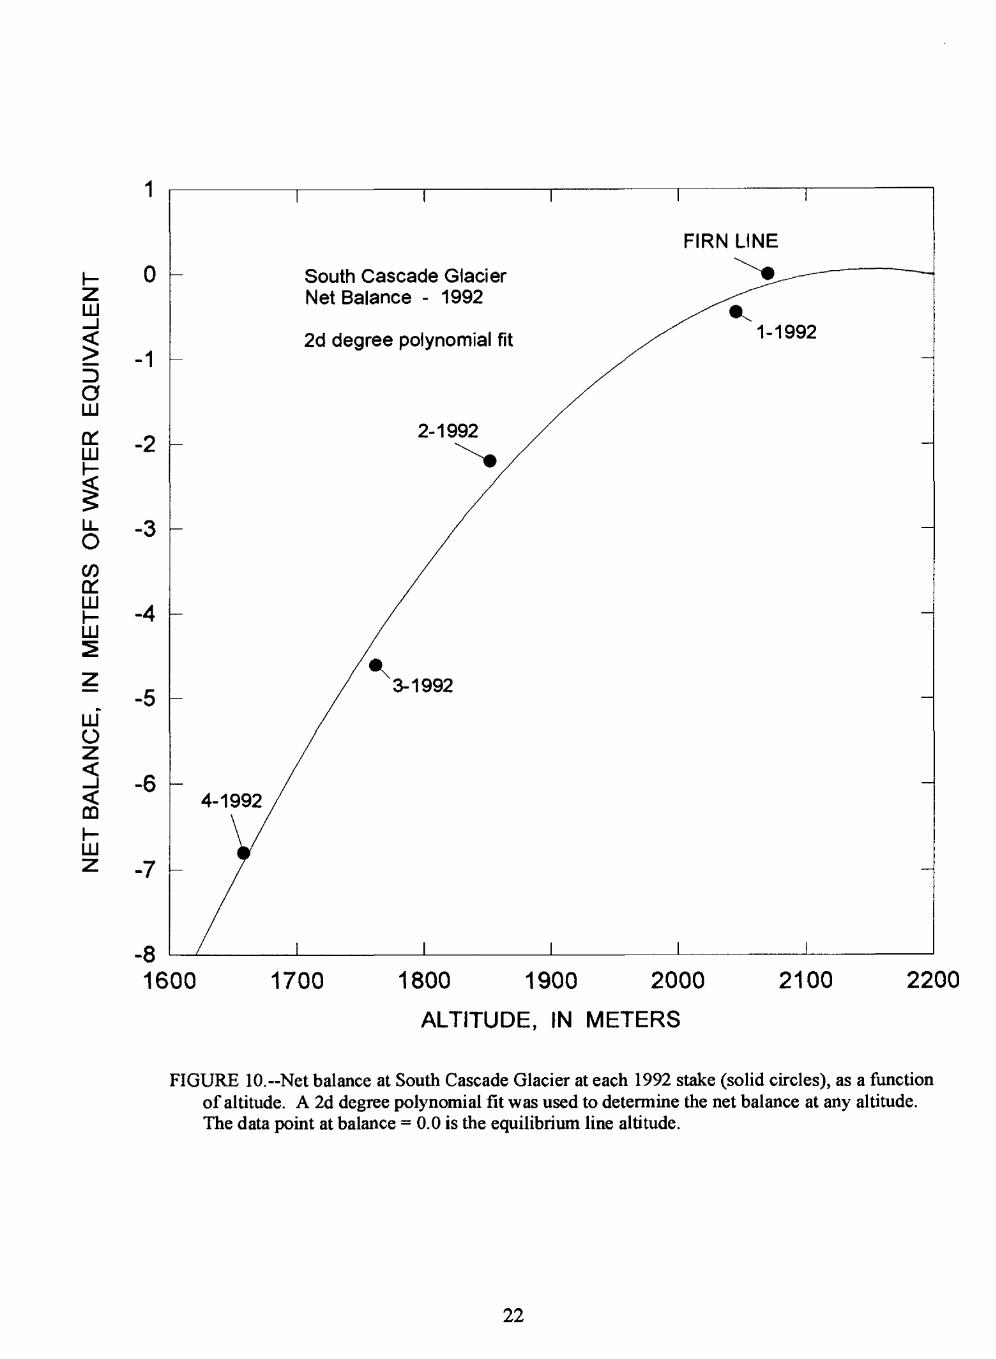
The negative mass balance of 1992 resulted in major changes to the glacier. Measurements made on aerial photographs taken on September 9, 1991 and October 6, 1992 show that the terminus retreated 38m between those dates. This recession is considered extreme, and does not account for the appearance of new nunataks in 1992 (fig. 12). The equilibrium line altitude was 2,070 m on October 6, 1992, and the area accumulation ratio was 0.08. Taking 83 m as the average thickness of the glacier (Hodge, 1979), this loss represents more than 2 percent of the glacier mass. Furthermore, the negative balance continues a negative trend in balances at South Cascade Glacier which began in 1977 (table 13).
Total HY 1992 runoff from South Cascade Lake Basin was 3.9 m. Total basin averaged
precipitation for HY 1992 can only be estimated, but on the basis of knowledge of bm (s) and the partial precipitation record from 1,615 m altitude, a reasonable estimate is 2.2 m. The large discrepancy between runoff and precipitation is due to the loss of glacier ice during the year.
The mass balance results obtained from field measurements should agree with the mass change measured from aerial photographs (Krimmel, 1989). The photogrammetrically determined change in volume of South Cascade Glacier between late 1985 (photographs were taken near the end of the 1985 balance year) and late 1992 was -10.2 m averaged over the glacier area. When adjusted for the density of material lost, this value should be the same as the cumulative mass balance (determined from field measurements) for the years 1986 through 1992, which is -8.53 m. If the glacier were in a state of equilibrium, the density of the material lost would be that of ice, about 0.9. However, South Cascade Glacier has not been in equilibrium, it has lost considerable mass since late 1985, and the excess mass lost has included firn with a density between 0.6 and 0.9. In a similar volume change-cumulative balance change comparison at South Cascade Glacier for the years 1958-85 (Krimmel, 1989), also a period of general mass loss, about one-half the material lost had a density of firn. For the 1986-92 period, 0.9 is a better approximation of the average density of the glacier than it was for 1958-85, because most of the firn was melted in the earlier period, leaving a more dense glacier (a higher ratio of ice to firn) in the later period. By using an average density of 0.84 for the mass lost for 1986-92, agreement between the two methods can be obtained. The similarity in results obtained from the two methods volume change and cumulative balance change indicates that the balance methods are approximately correct. Even without any adjustment to the density of the mass lost, the difference between the methods is within the errors of either method.
The application of the GI method for mass balance measurement has limitations. 1) The relations between altitude and various balance components must be defined. Certain characteristics of snow density, snow depth, and ablation can be expected on the basis of previous experience at South Cascade Glacier. For instance, it is expected that the bulk density of the
10
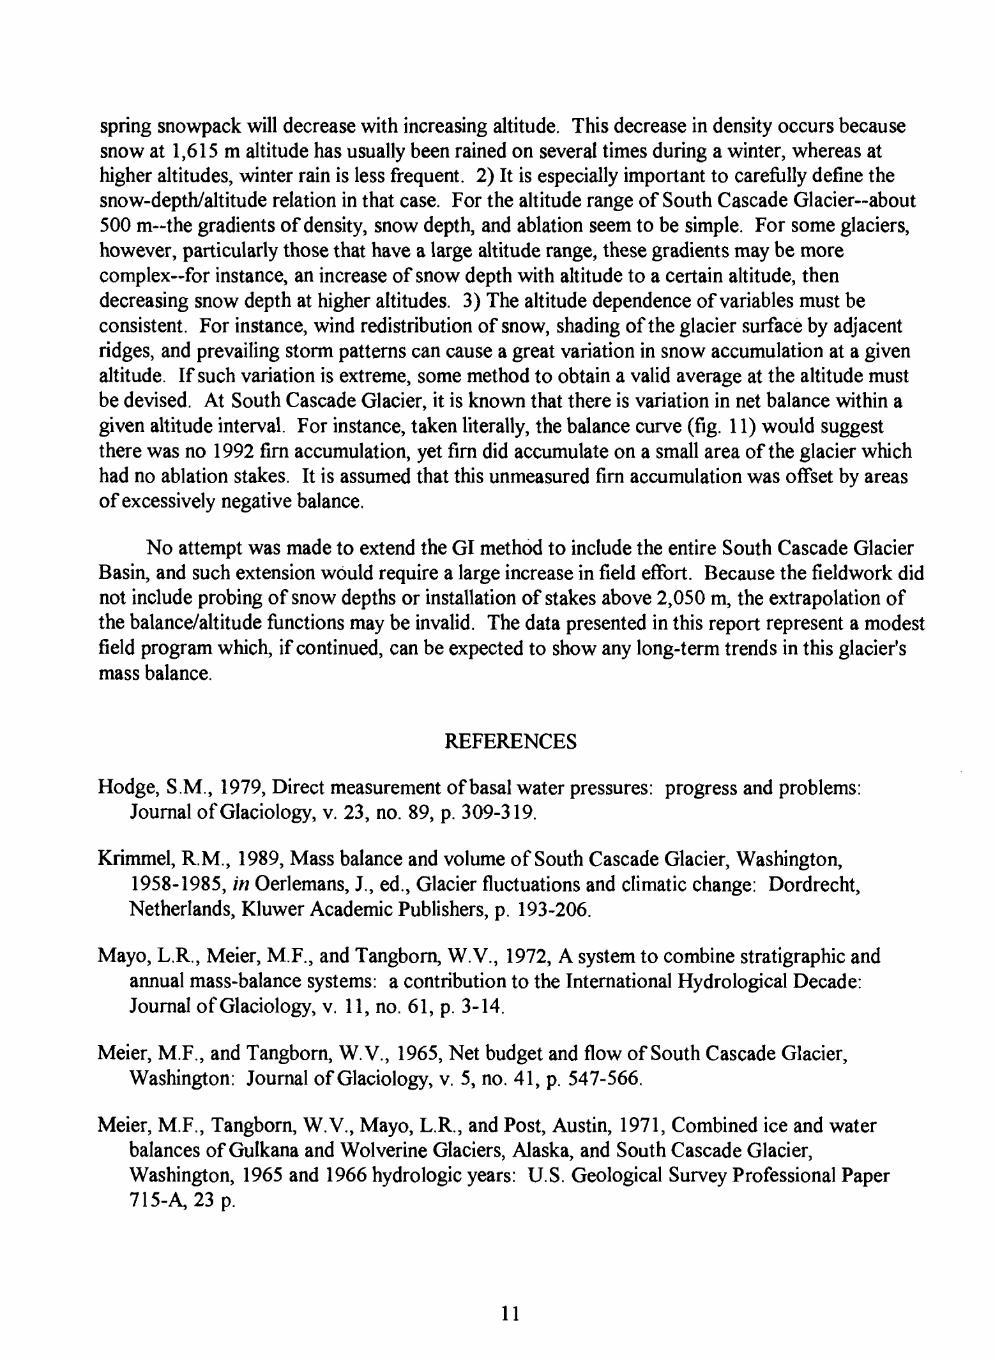
spring snowpack will decrease with increasing altitude. This decrease in density occurs because snow at 1,615 m altitude has usually been rained on several times during a winter, whereas at higher altitudes, winter rain is less frequent. 2) It is especially important to carefully define the snow-depth/altitude relation in that case. For the altitude range of South Cascade Glacier about 500 m the gradients of density, snow depth, and ablation seem to be simple. For some glaciers, however, particularly those that have a large altitude range, these gradients may be more complex for instance, an increase of snow depth with altitude to a certain altitude, then decreasing snow depth at higher altitudes. 3) The altitude dependence of variables must be consistent. For instance, wind redistribution of snow, shading of the glacier surface by adjacent ridges, and prevailing storm patterns can cause a great variation in snow accumulation at a given altitude. If such variation is extreme, some method to obtain a valid average at the altitude must be devised. At South Cascade Glacier, it is known that there is variation in net balance within a given altitude interval. For instance, taken literally, the balance curve (fig. 11) would suggest there was no 1992 firn accumulation, yet firn did accumulate on a small area of the glacier which had no ablation stakes. It is assumed that this unmeasured firn accumulation was offset by areas of excessively negative balance.
No attempt was made to extend the GI method to include the entire South Cascade Glacier Basin, and such extension would require a large increase in field effort. Because the fieldwork did not include probing of snow depths or installation of stakes above 2,050 m, the extrapolation of the balance/altitude functions may be invalid. The data presented in this report represent a modest field program which, if continued, can be expected to show any long-term trends in this glacier's mass balance.
REFERENCES
Hodge, S.M., 1979, Direct measurement of basal water pressures: progress and problems: Journal of Glaciology, v. 23, no. 89, p. 309-319.
Krimmel, R.M., 1989, Mass balance and volume of South Cascade Glacier, Washington, 1958-1985, in Oerlemans, J., ed., Glacier fluctuations and climatic change: Dordrecht, Netherlands, Kluwer Academic Publishers, p. 193-206.
Mayo, L.R., Meier, M.F., and Tangborn, W.V., 1972, A system to combine stratigraphic and annual mass-balance systems: a contribution to the International Hydrological Decade: Journal of Glaciology, v. 11, no. 61, p. 3-14.
Meier, M.F., and Tangborn, W.V., 1965, Net budget and flow of South Cascade Glacier, Washington: Journal of Glaciology, v. 5, no. 41, p. 547-566.
Meier, M.F., Tangborn, W.V., Mayo, L.R., and Post, Austin, 1971, Combined ice and water balances of Gulkana and Wolverine Glaciers, Alaska, and South Cascade Glacier, Washington, 1965 and 1966 hydrologic years: U.S. Geological Survey Professional Paper 715-A,23p.
11

Tangborn, W.V., Mayo, L.R., Scully, D.R., and Krimmel, R.M., 1977, Combined ice and water balances of Maclure Glacier, California, South Cascade Glacier, Washington, and Wolverine and Gulkana Glaciers, Alaska, 1967 hydrologic year: U.S. Geological Survey Professional Paper715-B, 20 p.
12

5000
4000
V)OH LU
LJJ
5O
3000
2000
1000 -
<t * * I »
WASHINGTON ,.
SOUTH CASCADELAKE BASIN BOUNDARY
SOUTH FORK CASCADE RIVER GAGING STATION (STAGE. TEMPERATURE. AND BAROMETRIC PRESSURE)
SOUTH CASCADE GLACIER
+ 121°02'10-
0h0
2,000 4,000 FEET
500 1,000 1,500 METERS
I
1000 30002000 LOCAL X, IN METERS
FIGURE 1. South Cascade Glacier and vicinity. The areas of polygons a-u, which represent distinct types of surfaces on and near the glacier, are given in table 1. Polygon / was delineated from 1985 photography. Polygon u is the 1992 firn area. Stake locations are shown as open circles.
13

60 MINUTETEMPERATURE,
IN DEGREES CELSIUSro o
60 MINUTEBAROMETRIC PRESSURE, IN INCHES OF MERCURY
ro ro 10 ro 10 10 ro w ^ 01 a> -~ib b b b b b
60 MINUTETEMPERATURE,
IN DEGREES CELSIUS
T) I I
r8 ISCO M
PO oi OQ So' i X OS
00 OS vl
I
a. a-
In o'
1 Ics
OS
L/l
i
a.
Ioo §
O
S. n
O
O m O
n m en
Zm
c
o
COm TJ

z
O (
/) 0.
4K
-UJ
Q.
"2L
r\ f
)o
z °
'2
°~
0.0
'i
i i
PR
EC
IPIT
AT
ION
AT
161
5 M
ET
ER
S (
SO
UT
H
,it,m ,
, .
L,
.. .L
. ll
1
i i
il
i 1
l
FO
RK
GA
GIN
G S
TA
TIO
N)
li
1 11
1,i. u
U ki..
.l 11
il ii..
iLiIII
1ill
,1,1,
N
O D
AT
A (
JUN
E 1
2 -S
EP
T 3
0)
SA
UX
CR
EE
K S
TA
GE
NO
DA
TA
SO
UT
H F
OR
K C
AS
CA
DE
RIV
ER
ST
AG
E
UJ
MID
DL
E T
AR
N S
TA
GE
WZ
1
RE
CO
RD
BE
GA
N O
N J
UN
E 2
5
OC
TN
OV
DE
CJA
NF
EB
MAR
APR
MA
YJUNE
JULY
AUG
SEPT
FIG
UR
E 3
.--P
reci
pita
tion
at 1
,615
met
ers
altit
ude,
Sal
ix C
reek
sta
ge,
Sout
h Fo
rk C
asca
de R
iver
sta
ge,
and
Mid
dle
Tar
n st
age,
19
92 h
ydro
logi
c ye
ar.
The
Mid
dle
Tar
n st
age
reco
rd w
as in
itial
ized
in
mid
-Jun
e.

FIGURE 4.-Mosaic of vertical aerial photographs of South Cascade Glacier, October 6, 1992, photographs 92V5- 242, 243, and 244. The maximum dimension of the lake north of terminus of the glacier is about 800 meters.
16

N
FIGURE 5.--Vertical photograph of the terminus area of South Cascade Glacier, October 6, 1992, photograph 92V5-252. The maximum dimension of the lake north of terminus of the glacier is about 800 meters.
17

4000
3500
3000
CO QL LU
LU
>-"
so
2500
2000
1500
1M9
EXPLANATION
Altitude, in meters above the National Vertical Geodetic Datum of 1929
2005 2020 2032 2036 2051 2071 2078 2085 2083 2093
2017 2025 2032 2038 2052 2085 2076 2075 2103 2118
2025 2025 2026 2036 2047 2057 2070 2082 2098 y2124
4
1500 2000 2500
LOCAL X, IN METERS3000
FIGURE 6.--Altitude grid for South Cascade Glacier, measured from stereo vertical aerial photographs taken on October 6, 1992.
18

4000
3500
3000
CO OH LU
fc
2500
5o
2000
1500
N
EXPLANATION
45 Snow depth, in meters
1500
Glacier edge, from 1992 aerial photograpy
2000 2500
LOCAL X, IN METERS
3000
FIGURE 7.--Snow depths, in meters, determined by probing on South Cascade Glacier,April 15-16, 1992. The locations of the probes were estimated in the field by pacing, and are accurate to 100 meters horizontally. The probe depths are accurate to 0.1 meter.
19

6.0
5.0
4.0LJJ
LJJ
I
Q. LJJ Q
I
3.0
2.0
1.0
0.0 _L _L _L _L _L
1500 1600 1700 1800 1900 2000
ALTITUDE, IN METERS
2100 2200
FIGURE 8.-Snow depth on South Cascade Glacier, determined by probing on April 15-16, 1992, as a function of altitude. A 2d degree polynomial fit between points was used to determine the probe depth at any altitude.
20
SNOW 3-1992 (1762m)
Stake number and altitude, in meters
APR MAY JUNE JULY AUG SEPT OCT
FIGURE 9.--Snow depth and firn or ice loss at each South Cascade Glacier 1992 stake, as a function of time. Depths are accurate to 0.1 meter.
21
NE
T B
AL
AN
CE
, IN
M
ET
ER
S
OF
WA
TE
R
EQ
UIV
AL
EN
T
o C
"8 i
g" °- if
gf^
o
o 8
a
to
to
§ I
iJQ
"*
O
M
S
§ '2
8
8-8 "*
fr Is
°
COs-
io
Wf
e. o 5'
o
o.
S3
n?»
co
Pi M
ff.
fft
II
o
O.
' §
CO o
o
00
O)
enO
)
O
O 00 o
H a
m m
m 73
0)
<o
o
o O o fO o
o fO
fO o
o

OCT NOV DEC JAN FEB MAR APR MAY JUNE JULY AUG SEPT
-2
FIGURE 11.-Balance of South Cascade Glacier, 1992 hydrologic and balance years, bo is the change in balance
between the minimum balance near the beginning of the hydrologic year and October 1. b\ is the change in
balance between the minimum balance near the end of the hydrologic year and September 30. ba is the change in snow, firn, and ice storage between the beginning and end of some fixed period, which here is the
hydrologic year. b m (s) is the snow above the previously formed summer surface as measured directly by field
work in late spring as near as possible to the time of greatest glacier mass. bn is the change in snow, firn, and
ice storage between times of minimum mass. bw (s) is the maximum of snow mass during the balance year. The balance year is the interval between the minimum glacier mass in one year and the minimum glacier mass the following year. The hydrologic year is the interval between the beginning of October and the end of the following September.
23
4000
CO K. LJJ h- LJJ
so
3500
3000
T T
Terminus Positions
Octobers, 1992
September 9, 1991
New nunataks in 1992
0 300 600 900 FEET
100 200 300 METERS
1500 2000 LOCAL X, IN METERS
FIGURE 12.-Terminus positions of South Cascade Glacier, September 9, 1991 and October 6, 1992.
24
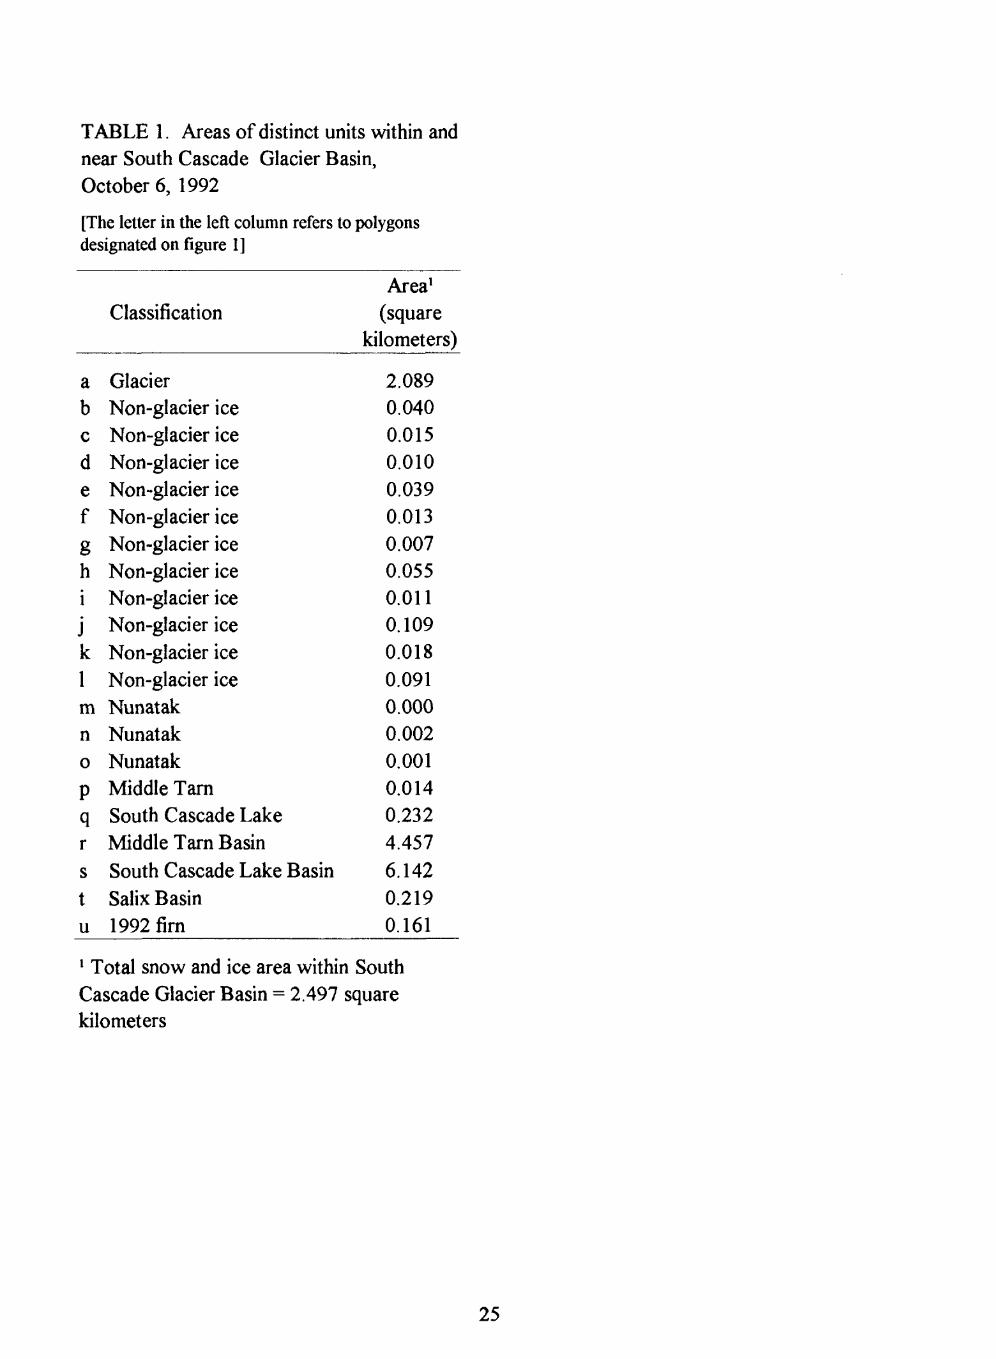
TABLE 1. Areas of distinct units within and near South Cascade Glacier Basin, October 6, 1992
[The letter in the left column refers to polygons designated on figure 1]
Classification
a Glacierb Non-glacier icec Non-glacier iced Non-glacier icee Non-glacier icef Non-glacier iceg Non-glacier iceh Non-glacier icei Non-glacier icej Non-glacier icek Non-glacier ice1 Non-glacier icem Nunatakn Nunatako Nunatakp Middle Tarnq South Cascade Laker Middle Tarn Basins South Cascade Laket Salix Basinu 1992 firn
Area1(square
kilometers)
2.0890.0400.0150.0100.0390.0130.0070.0550.0110.1090.0180.0910.0000.0020.0010.0140.2324.457
Basin 6.1420.2190.161
1 Total snow and ice area within SouthCascade Glacier Basin =kilometers
2.497 square
25
TA
BL
E 2
. A
ir te
mpe
ratu
re a
t 1,
615
met
ers
altit
ude,
Sou
th C
asca
de G
laci
er B
asin
, 19
92 h
ydro
logi
c ye
ar
Pai
ly m
axim
um, m
inim
um, a
nd a
vera
ge a
ir te
mpe
ratu
re, i
n de
gree
s C
elsi
us.
The
tem
pera
ture
is s
ampl
ed o
nce
an h
our a
t the
Sou
th F
ork
Riv
er g
agin
g st
atio
n (f
ig.
D]
DA
Y 1 2 3 4 5 6 1 8 9 10 11 12 13 14 15 16 17 18 19 20 21 22 23 24 25 26 27 28 29 30 31
Oct
11.6
4.
9 8.
410
.0
3.7
6.2
9.2
1.0
6.111
.2
7.3
8.8
14.3
10
.0
12.2
15.5
4.
5 10
.98.
0 3.
3 5.
513
.5
6.1
9.8
17.4
8.
4 12
.219
.8
11.6
15
.1
20.6
12
.4
17.1
10.4
3.
7 7.
014
.3
4.1
9.5
17.8
5.
3 13
.115
.9
10.8
13
.5
10.8
-2
.9
1.8
-1.4
-3
.7
-2.9
3.7
-1.8
1.
49.
2 2.
2 5.
58.
0 5.
7 6.
8
6.5
-2.2
0.
60.
2 -2
.2
-0.8
-1.0
-3
.3
-2.5
-1.8
-4
.1
-2.7
-2.5
-4
.5
-3.2
-1.4
-4
.9
-3.1
-5.3
-8
.4
-6.7
4.9
-8
.0
-6.5
-3.7
-8
.0
-5.9
-1.8
-4
.5
-3.3
0.2
-2.5
-1
.3
Nov
-2.5
-6
.5
-4.8
-0.2
-8
.0
-5.0
4.5
-1.0
2.
75.
3 1.
4 3.
37.
3 1.
8 4.
7
4.5
0.2
2.5
8.0
2.2
6.0
6.9
1.4
4.0
3.3
1.0
2.1
7.3
1.4
3.4
7.3
0.2
5.1
2.5
-2.2
0.
5-1
.4
-3.7
-2
.3-2
.5
-5.7
-3
.74.
1 -2
.9
1.2
6.5
-3.7
1.
4-0
.6
-1.8
-1
.21.
0 -2
.5
-1.9
3.3
-1.0
1.
40.
2 -5
.3
-3.0
-4.5
-6
.9
-5.4
-3.3
-8
.8
-5.5
3.7
-3.7
1.
23.
7 0.
6 2.
30.
2 -1
.8
-1.0
-1.4
-3
.3
-2.3
-3.3
-4
.9
-4.0
-1.8
-6
.1
4.3
-6.1
-9
.2
-8.0
-2.9
-9
.2
-6.2
Dec
0.2
-4.1
-1
.9-2
.9
-4.9
-4
.33.
7 -2
.2
0.2
1.4
-1.8
-0
.32.
9 -1
.0
1.4
0.2
-4.5
-2
.2-1
.8
-4.5
-3
.4-0
.2
-2.5
-1
.2-1
.3
-5.8
-4
.0-5
.2
-6.5
-5
.7
-3.2
-4
.7
-4.2
0.2
-8.0
-4
.3-1
.8
-10.
4 -5
.92.
9 -3
.7
-1.3
4.1
0.6
1.7
5.3
-1.4
2.
06.
1 -2
.5
2.2
-0.6
-5
.7
-2.8
-5.3
-8
.0
-6.1
4.5
-8.0
0.
0
0.6
A.9
-1
.11.
8 -4
.1
-1.0
4.5
0.6
2.5
2.9
-1.4
1.
12.
5 -0
.6
1.2
4.9
0.2
2.4
4.5
1.0
2.7
4.1
-2.2
1.
50.
2 -2
.2
-1.0
0.2
-2.9
-1
.52.
0 -4
.1
-0.9
Jan
2.9
-0.6
1.1
0.6
-5.3
-2
.50.
2 -5
.3
-2.8
-0.6
-1
0.0
-4.4
-3.7
-5
.3
-4.7
-5.3
-1
2.4
-8.8
-1.4
-1
1.2
-5.8
3.7
-4.5
-0
.46.
5 3.
3 5.
04.
5 -2
.9
0.2
-2.2
-6
.1
-4.3
-3.3
-7
.6
-5.6
-1.0
-4
.9
-2.9
3.3
-2.9
-0
.34.
9 -1
.0
2.7
2.5
-4.5
-0
.25.
7 -2
.5
2.3
9.6
2.9
6.4
8.8
0.2
4.9
5.3
-1.4
2.
6
-0.6
-7
.6
-4.6
0.6
-6.1
-2
.51.
4 -0
.6
0.5
6.1
-0.6
0.
76.1
-1
.8
0.0
1.0
-2.9
-0
.74.
1 -0
.2
1.8
2.5
-1.0
0.
67.
3 0.
6 3.
54.
1 0.
6 2.
44.
9 0.
2 3.
0
Feb
1.0
-2.9
-0
.62.
9 -2
.9
0.2
6.5
2.2
4.7
9.6
1.4
5.5
6.5
2.2
4.0
4.1
2.2
3.3
4.1
-1.8
1.
81.
0 -3
.3
-0.8
3.3
-2.5
0.
94.
1 1.
0 2.
7
3.3
0.2
2.1
4.5
0.6
1.8
2.5
-1.0
0.
61.
4 -1
.4
0.2
1.0
-7.6
-3
.9
-1.4
.7
.3
.4.3
-1.4
-3
.3
-2.3
-1.8
-6
.1
-3.9
-1.4
-8
.4
-5.3
2.2
-2.2
-0
.1
2.5
-1.4
0.
71.
0 -4
.5
-1.5
3.3
-5.3
4.2
5.3
1.8
3.2
11.6
3.
3 8.
0
13.5
8.
4 11
.310
.4
6.1
8.0
8.4
4.9
6.5
6.1
2.2
4.1
Mar
5.3
1.4
3.2
4.9
-0.6
2.
73.
7 -0
.2
1.6
2.2
-1.8
0.
63.
7 -0
.2
2.2
3.7
-0.2
0.
93.
7 -2
.5
0.4
4.9
-0.6
2.
26.
5 -0
.2
2.6
6.5
1.0
3.2
7.6
-1.8
3.
59.
6 3.
3 7.
110
.0
6.5
8.3
10.4
5.
7 8.
69.
6 1.
0 3.
6
4.9
0.6
1.81.
0 -2
.5
-0.3
2.9
-6.9
-0
.54.
5 -1
.0
1.6
4.9
-1.0
2.
8
6.1
1.8
4.2
6.9
1.8
4.0
6.9
0.6
3.2
6.9
0.2
3.8
7.6
2.5
5.1
6.5
0.6
3.2
-0.2
-7
.3
-3.3
1.4
-6.5
-1
.74.
9 -0
.2
2.3
7.6
2.9
5.2
8.8
2.2
5.3
Apr
10.0
4.
5 8.
314
.3
4.5
9.7
3.7
-2.5
-0
.2-1
.8
-4.9
-3
.4-2
.9
-5.7
-4
.5
-3.3
-8
.0
-5.3
-1.0
-8
.8
-4.7
1.4
-6.9
-2
.54.
5 -2
.5
-0.1
1.4
-5.3
-1
.6
2.5
-0.6
0.
54.
5 0.
6 3.
04.
5 0.
6 2.
66.
1 1.
4 3.
77.
3 3.
7 5.
6
7.3
1.0
4.4
1.4
-1.0
0.
04.
5 -0
.6
0.6
8.0
1.4
5.3
6.1
-1.0
1.
9
2.5
-2.9
-1
.0-1
.8
-4.1
-2
.64.
5 -5
.7
-0.4
6.5
0.6
3.7
12.0
5.
7 9.
4
11.2
5.
3 8.
37.
3 4.
9 6.
31 1
.2
5.7
7.4
12.0
3.
3 6.
33.
3 -2
.5
-0.7
May
5.3
-5.3
1.
38.
4 4.
1 5.
712
.7
6.5
10.7
15.9
8.
8 12
.214
.7
7.6
11.5
17.8
8.
4 12
.112
.4
3.7
8.9
5.7
-0.2
0.
92.
2 -1
.0
0.5
1.0
-3.3
-1
.4
-0.2
-4
.5
-2.5
4.9
-5.7
1.
38.
0 2.
9 4.
99.
6 2.
2 6.
011
.6
0.2
5.3
11.2
3.
7 7.
816
.3
6.5
11.1
11.2
6.
1 8.
87.
6 2.
9 5.
43.
3 -1
.0
0.1
6.1
-1.8
2.
38.
4 6.
1 7.
012
.0
5.3
9.0
14.7
8.
4 12
.113
.5
6.1
10.7
6.5
2.5
5.2
7.3
2.5
4.7
7.6
3.3
5.4
9.2
4.1
6.3
13.1
4.
9 9.
414
.3
8.0
11.3
June
13.5
4.
5 9.
48.
4 1.
8 5.
213
.1
2.9
9.1
10.0
4.
5 7.
512
.4
4.5
8.5
15.9
6.
5 10
.110
.8
5.7
8.2
13.5
4.
1 8.
68.
0 5.
7 6.
612
.7
3.5
7.8
14.6
6.
7 11
.66.
7 1.
7 3.
83.
9 -0
.7
1.2
7.5
0.7
3.8
6.4
3.6
5.0
4.8
3.8
4.2
7.9
3.3
5.3
16.6
4.
5 11
.616
.5
8.1
11.8
17.0
6.
8 11
.5
20.3
8.
1 13
.922
.3
10.0
15
.823
.2
11.8
16
.724
.6
11.4
16
.423
.5
11.7
16
.2
19.4
9.
4 13
.621
.9
8.8
14.2
21.5
9.
2 15
.59.
0 3.
6 5.
79.
4 2.
7 6.
1
July
6.8
5.3
6.0
10.2
4.
4 7.
013
.7
5.3
9.1
11.8
5.
7 9.
35.
9 3.
9 4.
8
6.1
3.9
5.0
7.0
5.1
5.8
7.3
4.5
5.8
12.8
4.
7 8.
87.
9 5.
5 6.
5
13.9
4.
9 8.
313
.2
6.5
9.5
11.2
5.
5 8.
39.
6 3.
6 6.1
16.6
4.
2 10
.7
20.4
9.
5 14
.623
.4
10.8
15
.523
.1
11.6
16
.221
.3
10.7
15
.018
.5
7.2
12.7
11.5
6.
6 8.
49.
8 6.
6 7.
97.1
5.
7 6.
212
.8
4.6
7.9
16.6
7.
9 11
.8
14.7
7.
8 11
.115
.9
6.6
11.0
16.2
6.
8 11
.119
.5
7.6
13.2
22.1
10
.9
15.1
22.2
11
.6
15.7
Aug
20.1
10
.2
14.0
15.2
7.
2 11
.118
.2
7.8
12.5
13.9
8.
0 10
.014
.2
5.9
9.9
10.0
7.
5 8.
47.
9 3.
3 5.
87.
8 2.
3 4.
412
.5
3.2
7.4
17.2
8.
1 12
.5
22.8
12
.9
18.0
20.9
15
.1
18.6
24.9
13
.8
18.5
20.6
9.
9 14
.419
.0
8.8
13.1
22.6
8.
9 14
.823
.2
13.3
16
.919
.2
10.3
14
.617
.9
8.2
12.0
16.7
7.
4 11
.5
12.5
6.
0 9.
16.
8 1.
8 4.
38.
8 1.
8 4.
911
.5
2.5
6.5
14.6
5.
3 9.
4
15.6
7.
3 11
.013
.7
6.7
10.1
11.9
4.
7 8.
013
.3
6.7
9.8
12.8
6.
7 8.
512
.6
5.9
8.4
Sept
8.1
5.2
6.8
12.9
4.
9 8.
410
.5
5.4
7.1
5.8
0.5
2.2
0.7
-1.3
-0
.5
0.9
-1.1
-0
.55.
5 -0
.9
1.8
4.9
1.0
3.3
13.0
0.
6 5.
816
.0
5.9
9.0
10.5
3.
4 7.
12.
9 -1
.8
-0.6
-1.8
-3
.2
-2.5
4.2
-3.7
-0
.56.
3 -2
.6
1.1
5.6
0.0
2.2
10.0
-0
.2
3.9
13.8
3.
1 7.
06.
8 3.
6 5.
06.
5 4.
1 5.
4
14.3
4.
2 8.
416
.9
7.6
12.0
12.0
3.
9 6.
53.
6 -0
.3
1.7
1.2
-0.8
0.
0
3.6
-0.6
1.
79.
5 -0
.9
4.1
13.0
6.
5 9.
818
.7
9.2
14.4
17.9
8.
7 14
.2
MO
NTH
LY
AV
ERA
GE
4.3
-0.6
1.6
2.8
2.0
6.3
9.5
9.8
10.9
4.8

TA
BL
E 3
. A
ir te
mpe
ratu
re a
t 1,
867
met
ers
altit
ude,
Sou
th C
asca
de G
laci
er B
asin
, 19
92 h
ydro
logi
c ye
ar
[Dai
ly m
axim
um, m
inim
um, a
nd a
vera
ge a
ir te
mpe
ratu
re, i
n de
gree
s Ce
lsius
. Th
e te
mpe
ratu
re is
sam
pled
onc
e an
hou
r at s
tatio
n R
UB
Y (f
ig.
1)]
DA
Y 1 2 3 4 5 6 7 8 9 10 11 12
13 14
15 16 17 18
19 20 21 22 23 24 25 26
27
28
29
30
31
Oct
9.0
3.5
6.6
10.8
1.
6 4.
89.
0 0.
1 4.
2 7.
8 3.
3 5.
6 11
.6
6.1
9.3
13.4
2.
4 9.
4 9.
1 1.
4 4.
1 12
.8
5.6
8.4
17.2
8.
5 12
.2
19.9
14
.1
17.0
19.4
10
.5
16.0
9.
0 1.
6 5.
0 14
.0
2.4
9.1
17.3
11
.6
13.7
15
.2
8.7
11.9
7.8
-5.1
-0
.2-2
.2
-5.9
-4
.42.
4 -5
.1
-0.7
6.
5 1.
8 3.
9 6.
1 4.
2 5.
2
4.1
-3.9
-0
.8-2
.1
-4.5
-3
.4-3
.2
-5.3
-4
.2-1
.5
-6.2
-4
.3-4
.1
-6.8
-5
.6
-1.7
-6
.1
-4.9
-6
.4
-10.
9 -8
.1
-4.2
-1
1.2
-8.8
-6
.4
-10.
8 -8
.6
-0.7
-7
.3
-4.6
2.
2 -5
.2
-2.1
Nov
-4.9
-8
.2
-6.7
4.3
-1
1.3
-8.8
4.9
-4.3
1.
0 2.
1 -0
.1
1.2
4.5
-1.0
2.
7
4.2
-3.0
0.
1 4.
9 -0
.8
2.8
4.6
-0.3
2.
01.
8 -2
.1
-0.4
3.
6 -2
.5
0.9
4.1
-0.3
2.
7 0.
2 -4
.4
-1.1
-2
.6
-4.8
-4
.2-0
.8
-7.4
-5
.6
1.5
-6.5
-1
.8
3.0
-6.5
-1
.9-1
.5
-3.9
-3
.2-2
.9
-4.5
-3
.9
0.0
-3.3
-1
.0
-1.1
-6
.8
-4.1
-4.3
-8
.3
-6.8
-5.7
-1
0.5
-8.3
0.2
-8.5
-3
.01.
6 -0
.3
0.5
-0.3
-3
.9
-2.4
.3.8
-5
.4
-4.6
-3
.1
-6.6
-5
.5
-3.6
-8
.9
-6.1
-4
.7
-10.
9 -9
.2
-5.7
-1
1.5
-8.4
Dec
-1.7
-6
.2
-3.9
-5.1
-6
.7
-6.0
0.3
-5.1
-2
.0
-1.7
-4
.1
-2.6
0.
3 -3
.3
-0.7
-2.0
-6
.6
-4.0
-4
.4
-6.6
-5
.6
-1.7
-4
.2
-3.2
-2.2
-8
.0
-5.3
-6
.5
-9.1
-7
.4
-4.1
-6
.8
-5.7
-2
.3
-9.7
-5
.9
-4.4
-1
2.7
-8.5
1.1
-5.3
-3
.0
2.7
-2.4
-0
.5
3.7
-1.3
0.
92.
8 -3
.6
-0.1
-2.5
-8
.0
-5.4
-7
.2
-9.0
-8
.1
1.6
-8.3
-3
.5
-1.0
-4
.9
-2.6
0.7
-5.2
-2
.51.
6 -1
.5
0.1
-0.2
-2
.6
-1.1
-0.5
-3
.0
-1.7
0.4
-3.6
-1
.2
1.2
-1.9
-0
.6
1.1
-3.6
-1
.2
-2.8
-4
.8
-3.5
-0
.6
-5.7
-3
.7
-0.8
-6
.9
-4.6
Jan
0.2
-3.9
-1
.6-1
.4
-8.1
-5
.1-2
.8
-8.2
-6
.6
-3.4
-9
.6
-5.7
-6
.1
-8.5
-6
.7
-6.1
-1
2.1
-8.6
-2
.2
-8.3
-5
.1
1.6
-5.1
-1
.73.
8 1.
6 2.
6 1.
5 -5
.0
-1.4
-5.0
-7
.7
-6.1
-5
.3
-9.7
-7
.7
0.8
-7.4
-4
.40.
4 -3
.9
-1.9
2.
3 -1
.5
0.2
-0.2
-2
.9
-1.9
3.3
-2.2
0.
57.
1 2.
1 4.
5 9.
6 0.
6 4.
8 3.
0 -2
.8
0.5
-2.7
-9
.1
-6.0
-2.2
-8
.6
-5.5
-0.2
-2
.1
-1.2
0.3
-2.3
-1
.4-0
.6
-4.3
-2
.7
-2.0
-4
.9
-3.8
0.
3 -3
.0
-1.1
0.
2 -3
.2
-1.8
4.
0 -2
.6
-0.1
3.
6 -0
.7
0.5
1.6
-1.6
0.
5
Feb
-0.3
-5
.4
-2.3
0.2
-5.9
-2
.94.
8 -1
.0
2.2
8.9
1.2
4.7
6.0
1.2
3.4
2.9
-0.8
0.
8 1.
6 -3
.2
-0.7
-0
.9
-4.2
-2
.75.
2 -4
.4
-1.1
0.
4 -2
.4
-0.8
0.9
-1.7
-0
.5
0.7
-2.7
-1
.2
1.5
-2.8
-1
.5-1
.6
-3.8
-2
.6
0.0
-7.9
-4
.4
1.0
-7.0
-4
.7-3
.6
-5.4
-4
.6-3
.4
-8.0
-5
.8
-4.3
-1
1.8
-8.0
2.
9 -6
.4
-2.1
0.4
-5.7
-2
.4-1
.8
-6.0
-3
.80.
5 -8
.2
-2.7
5.9
-0.2
1.
710
.4
2.5
6.9
10.2
6.
5 8.
5 13
.7
5.8
8.7
11.4
3.
7 6.
5 3.
7 0.
2 2.
0
Mar
3.6
-0.8
1.1
7.7
-3.0
1.1
1.5
-2.2
-0
.6
-1.1
-3
.6
-1.9
1.
0 -2
.3
-0.6
4.9
-1.9
0.
1 3.
6 -3
.9
-1.3
4.
8 -0
.9
1.4
8.0
0.3
2.2
7.7
0.5
2.8
10.2
0.
7 4.
6 10
.1
3.9
6.4
6.7
3.7
5.5
8.1
4.3
6.3
6.8
-0.4
2.
8
6.4
-1.6
0.
81.
7 -4
.0
-1.6
4.0
-7.0
-1
.6
5.6
-2.1
0.
6 2.
8 -1
.4
0.8
3.2
-0.9
1.
57.
8 1.1
3.
66.
0 -0
.2
2.4
7.5
-0.6
2.
86.
9 1.
6 4.
2
9.0
-0.4
2.
5 -0
.9
-9.0
-4
.6
-1.3
-7
.4
-4.3
1.
8 -3
.3
-0.6
10
.9
1.0
4.2
11.3
1.
5 5.
4
Apr
13.2
5.
3 9.
213
.1
3.7
9.1
2.3
-4.7
-1
.4
-1.6
-7
.5
-5.3
-4
.1
-7.8
-6
.2
-3.2
-8
.9
-6.6
5.
3 -8
.7
-5.0
3.
9 -7
.4
-2.6
5.7
-4.5
-1
.1
2.3
-7.2
-3
.1
0.3
-3.2
-2
.0
3.9
-2.7
0.
9 5.
3 -0
.7
1.5
7.0
-0.6
2.
7 5.
1 2.
4 3.
7
5.5
-0.9
2.
41.
5 -3
.8
-1.2
2.5
-3.9
-1
.4
5.1
-1.1
2.
8 3.
3 -3
.4
-0.3
2.2
-4.9
-2
.3-1
.3
-6.6
-4
.84.
2 -8
.9
-1.9
3.4
-2.5
0.
79.
0 3.
3 6.
5
12.6
2.
9 7.
8 5.
2 2.
4 3.
7 7.
7 3.
6 5.
1 8.
3 0.
3 4.
1 0.
7 -5
.6
-2.9
May
6.4
-7.5
-0
.49.
5 0.
6 4.
511
.7
6.4
9.7
15.6
10
.5
12.6
18
.7
11.3
14
.4
19.2
10
.5
14.6
12
.8
2.4
8.6
2.6
-1.8
-0
.41.
3 -2
.4
-1.2
-1
.1
-6.7
-3
.4
2.4
-6.6
-3
.2
2.7
-6.9
-1
.3
8.8
-0.4
3.
813
.0
0.8
5.7
9.2
0.2
4.2
13.2
3.
9 8.
215
.5
7.1
11.1
12.1
3.
3 7.
1 8.
5 1.
3 4.
2 1.1
-2
.2
-0.7
8.1
-3.5
2.
28.
1 3.
3 5.
713
.9
5.2
9.5
16.1
10
.6
13.7
14.6
6.
3 11
.5
6.0
1.5
4.3
9.5
0.7
4.2
8.3
3.1
5.0
10.1
2.
9 5.
8 14
.2
2.1
8.6
17.6
8.
8 12
.7
June
13.2
2.
4 9.
48.
5 0.
9 4.
513
.7
2.0
7.7
11.8
3.
0 7.
1 12
.4
3.3
8.0
15.8
6.
0 10
.0
12.0
5.
2 8.
0 14
.9
2.6
8.2
9.2
3.2
5.2
12.5
2.
6 7.
4
14.2
5.
9 10
.6
5.9
0.1
3.1
2.6
-1.2
0.
88.
9 0.
5 4.
4 9.
4 3.
5 6.
2
6.7
3.3
4.6
10.2
3.
1 6.
417
.4
8.7
12.1
17
.1
8.1
12.4
17
.5
7.9
12.1
20.1
10
.0
15.2
23.3
12
.4
17.7
22.8
14
.1
17.7
20.6
13
.7
17.3
21.8
12
.3
16.8
20.5
10
.5
14.8
22
.0
10.3
16
.4
19.6
9.
0 14
.9
8.4
3.5
5.6
10.8
2.
2 6.
8
July
7.7
5.1
6.3
10.0
3.
9 6.
612
.3
4.6
8.7
10.5
4.
2 8.1
4.
5 2.
4 3.
3
6.1
2.9
4.5
6.5
3.7
4.7
8.0
3.3
5.2
14.1
4.
2 9.
1 8.
5 5.
8 7.
0
13.0
5.
5 8.
9 13
.2
7.8
10.1
9.
5 4.
6 7.
211
.1
3.1
6.0
16.8
4.
1 11
.6
20.4
12
.7
15.8
22.6
12
.8
17.5
23.4
14
.2
18.0
22
.9
12.8
16
.5
19.6
9.
2 12
.8
11.1
7.
8 8.
99.
9 6.
4 7.
86.
7 4.
8 5.
814
.1
3.9
8.5
18.0
10
.7
13.6
15.6
8.
3 11
.5
16.8
7.
5 11
.9
17.1
9.
3 12
.5
20.7
9.
6 15
.2
23.8
14
.6
18.5
24
.0
14.8
19
.4
Aug
21.6
12
.1
17.1
15.0
7.
1 11
.318
.5
8.1
13.3
13
.9
7.7
10.1
13
.9
5.7
9.4
10.5
6.
2 7.
9 6.
3 2.
4 4.
6 9.
0 1.1
3.
712
.8
2.3
7.5
20.8
10
.3
14.9
20.3
15
.0
17.4
22
.1
16.0
18
.5
22.9
16
.1
19.2
21.1
11
.9
16.2
19
.1
11.0
14
.7
23.0
10
.9
16.8
24.0
17
.0
19.6
19.9
10
.5
16.2
19
.2
9.8
14.0
16
.8
8.0
12.7
14.1
4.
9 10
.47.
2 1.
6 4.
49.
0 1.
2 4.
912
.2
2.9
7.3
15.6
6.
1 10
.7
15.2
8.
9 11
.6
13.6
7.
2 9.
9 11
.6
4.2
7.8
13.1
7.
3 9.
7 14
.5
7.4
9.7
13.3
6.
7 9.
1
Sept
8.0
5.3
7.0
14.2
5.
9 9.
110
.8
5.9
7.3
5.3
-0.9
1.
5 0.
6 -1
.7
-0.8
1.0
-2.9
-0
.9
5.6
-1.9
1.
8 4.
3 0.
8 3.
314
.7
0.5
7.5
16.8
9.
0 11
.7
11.1
2.
1 7.
6 0.
9 -2
.8
-0.7
-0
.8
-3.5
-2
.55.
6 -4
.0
-0.5
6.
8 -3
.1
1.5
7.1
-0.7
2.
311
.0
-0.5
4.
113
.9
4.4
8.7
7.1
4.1
5.3
7.1
4.9
5.8
14.7
4.
9 9.
815
.9
10.7
13
.911
.1
2.9
5.9
2.3
-0.6
1.1
0.9
-1.3
-0
.5
3.7
-1.6
0.
9 8.
1 -1
.8
4.0
14.2
8.
9 11
.1
16.5
11
.8
14.1
16
.5
11.3
14
.7
to
MO
NTH
LY
AV
ERA
GE
2.8
-2.8
-3.3
-2.4
-0.3
1.5
0.4
5.8
9.7
10.4
11.6
5.1

TABLE 4. Precipitation at 1,615 meters altitude, South Cascade Glacier Basin, 1992 hydrologic year
Paily gaged precipitation, in millimeters, -99 indicates the gage was non-functional]
DAY12345
6789
10
1112131415
1617181920
2122232425
262728293031
TOTALS
Oct00000
00000
00010
95002
162491
011018
60
Nov007
3022
02
3833
603010
10
841
3114
606
3013
02101
323
Dec4121
51
001
-99-99
-990000
00000
20110
000000..
Jan00000
002
323
01320
01000
00
1190
014
54
1319
119
Feb43000
00110
00106
10002
33360
0001
35
Mar50100
02000
00007
15100
00000
320000
27
Apr00410
00000
03521
2410204
31100
115
542
4
128
May00000
00339
80000
00015
10002
250
13400
74
June00000
00070
10
-99-99-99
-99-99-99-99-99
-99-99-99-99-99
-99-99-99-99-99
..
July-99-99-99-99-99
-99-99-99-99-99
-99-99-99-99-99
-99-99-99-99-99
-99-99-99-99-99
-99-99-99-99-99-99
..
Aug-99-99-99-99-99
-99-99-99-99-99
-99-99-99-99-99
-99-99-99-99-99
-99-99-99-99-99
-99-99-99-99-99-99
..
Sept-99-99-99-99-99
-99-99-99-99-99
-99-99-99-99-99
-99-99-99-99-99
-99-99-99-99-99
-99-99-99-99-99
..
28
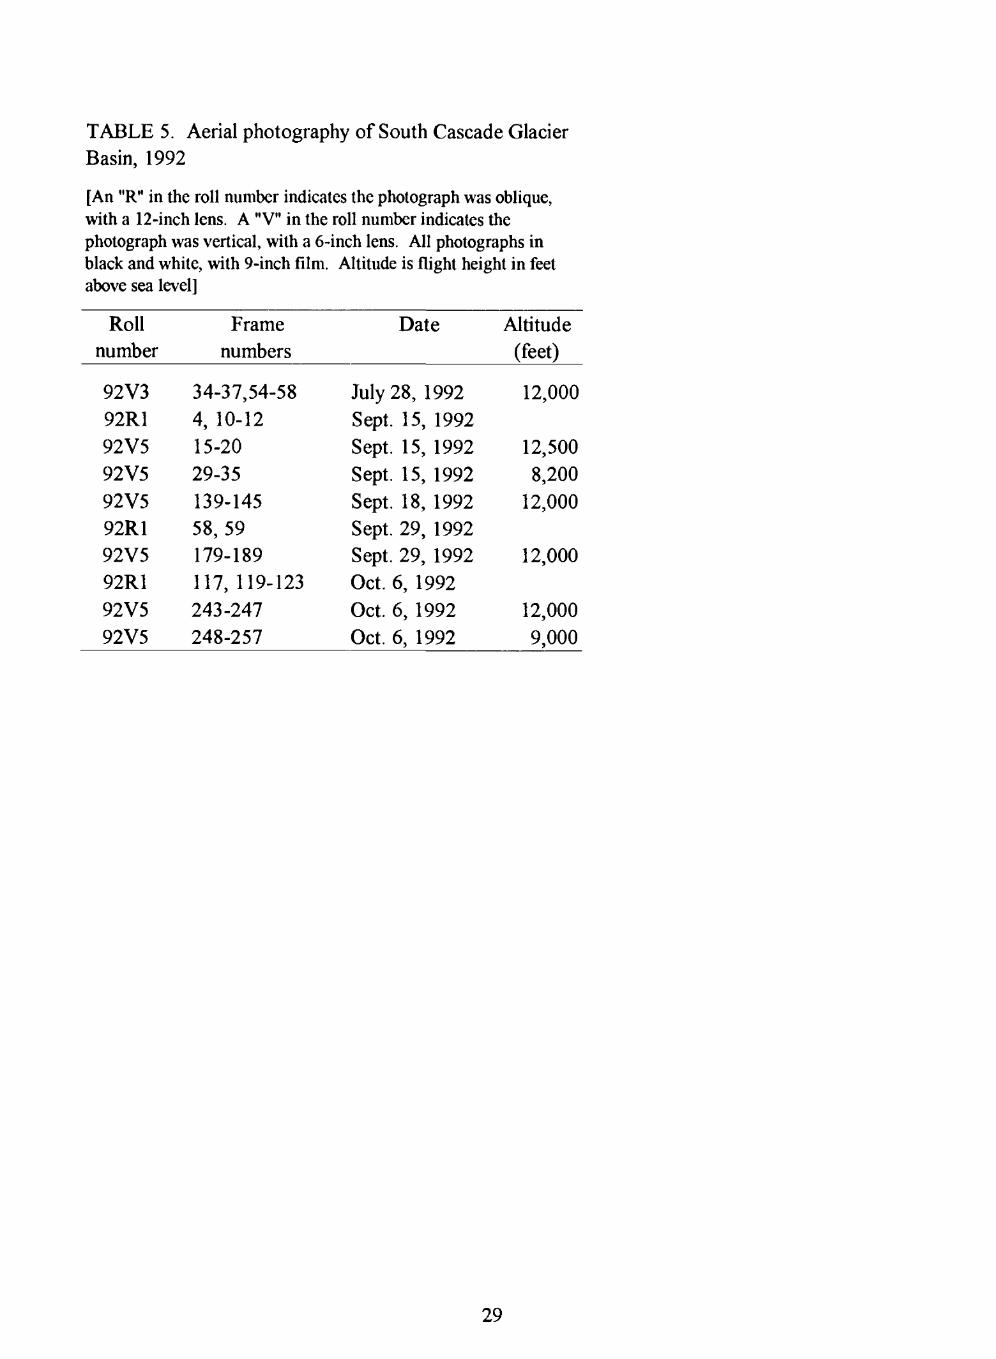
TABLE 5. Aerial photography of South Cascade Glacier Basin, 1992
[An "R" in the roll number indicates the photograph was oblique, with a 12-inch lens. A "V" in the roll number indicates the photograph was vertical, with a 6-inch lens. All photographs in black and white, with 9-inch film. Altitude is flight height in feet above sea level]
Roll Frame Date Altitude number____numbers______________(feet)
92V3 34-37,54-58 July 28, 1992 12,00092R1 4, 10-12 Sept. 15, 199292 V5 15-20 Sept. 15, 1992 12,50092 V5 29-35 Sept. 15, 1992 8,20092V5 139-145 Sept. 18, 1992 12,00092R1 58, 59 Sept. 29, 199292V5 179-189 Sept. 29, 1992 12,00092R1 117,119-123 Oct. 6, 199292V5 243-247 Oct. 6, 1992 12,00092V5 248-257 Oct. 6, 1992 9,000
29

TABLE 6. South Cascade Glacier altitude grid, October 6, 1992
[Surface altitude (Z), in meters above National Geodetic Vertical Datum of 1929, was measured near the nominal point for each grid cell. Coordinates X and Y are local (see fig. 6). The tenths of meters are marginally significant]
X Y Z1671.4 3698.8 1660.61771.6 3702.2 1646.31869.2 3699.5 1642.4
1670.9 3599.5 1678.81770.8 3599.6 1674.0
1872.8 3597.9 1656.81569.3 3498.3 1680.51667.3 3500.8 1702.11769.6 3497.8 1692.71873.1 3498.1 1674.41571.0 3402.2 1724.21669.2 3401.0 1728.31767.9 3397.3 1716.31873.7 3395.3 1699.5
1971.1 3405.8 1705.52063.3 3404.6 1722.42171.4 3399.9 1717.9
1468.9 3300.5 1758.91567.4 3295.9 1754.71664.0 3299.1 1752.81771.9 3298.3 1749.21872.2 3293.4 1731.01962.7 3304.6 1749.12068.4 3295.6 1748.32168.4 3301.4 1740.62268.7 3301.6 1753.91470.4 3201.4 1784.0
1570.7 3203.8 1779.51669.4 3198.0 1784.41767.4 3203.0 1794.3
1871.3 3197.8 1804.91972.8 3198.2 1806.7
2072.1 3200.5 1786.92173.1 3198.6 1782.12275.5 3197.2 1772.71469.6 3101.6 1818.41570.7 3099.8 1812.71671.2 3098.6 1812.6
1769.8 3096.9 1822.11870.5 3098.1 1829.31970.0 3099.1 1832.42071.5 3099.5 1828.7
2172.9 3100.9 1828.92268.1 3101.3 1803.31469.5 2999.7 1839.81568.7 2998.9 1833.4
1669.6 2998.0 1830.7
1768.5 2997.6 1837.2
1871.3 2999.9 1842.1
1971.5 2999.6 1843.92069.9 2999.6 1841.32169.8 3000.4 1835.8
X Y Z2270.5 3000.7 1836.11471.6 2900.5 1852.01570.9 2898.9 1848.51670.4 2900.1 1848.31771.4 2900.0 1845.41870.3 2901.4 1847.41969.7 2899.4 1847.52071.0 2900.3 1845.72170.6 2900.7 1842.92269.3 2901.0 1837.52370.7 2899.9 1843.01371.8 2800.1 1897.51466.4 2799.0 1863.61567.8 2798.0 1855.41668.1 2799.4 1854.71770.5 2799.9 1854.7
1869.9 2800.1 1851.41970.6 2802.0 1850.42069.6 2800.3 1847.32169.1 2799.6 1843.12270.2 2801.2 1846.72370.6 2800.5 1859.31470.7 2701.4 1874.21569.5 2698.4 1863.11670.0 2699.9 1862.21771.4 2698.3 1861.8
1870.3 2700.0 1858.41970.5 2700.9 1855.5
2072.7 2702.3 1853.42170.3 2701.5 1853.22271.2 2702.1 1863.6
2371.6 2703.2 1874.21569.1 2598.3 1875.01670.7 2599.5 1873.11770.8 2598.4 1871.41870.7 2601.6 1868.11970.6 2600.0 1867.42069.8 2599.6 1864.82169.7 2598.9 1876.12270.9 2600.0 1894.02369.3 2601.7 1903.71471.5 2497.8 1902.31568.0 2499.3 1887.71672.4 2501.0 1884.21769.3 2500.4 1883.41868.4 2500.4 1883.0
1969.2 2499.5 1884.2
2070.3 2501.1 1893.8
2167.6 2499.5 1904.6
2269.3 2501.2 1918.62371.7 2502.0 1930.41569.5 2398.0 1908.9
X Y Z1670.4 2398.6 1895.61768.2 2398.7 1896.51871.9 2401.6 1900.91969.4 2399.3 1910.82069.6 2401.5 1915.12168.7 2399.4 1919.52269.7 2400.9 1935.42370.8 2400.2 1944.62469.0 2402.5 1963.11568.5 2298.9 1932.31669.2 2297.9 1909.41768.1 2300.5 1905.91872.3 2299.8 1914.01970.2 2301.6 1925.52068.7 2299.9 1931.92170.2 2298.7 1936.0
2270.7 2300.6 1943.72370.8 2298.8 1946.22468.8 2300.1 1959.92569.9 2300.1 2003.41669.3 2198.7 1930.01768.7 2201.8 1933.21869.8 2199.8 1924.81969.5 2199.6 1934.02070.9 2201.4 1941.22171.1 2201.9 1945.32269.9 2201.1 1951.8
2368.3 2198.5 1954.12470.0 2200.8 1965.01772.3 2103.0 1939.9
1868.0 2102.3 1941.4
1969.5 2098.0 1945.42072.3 2099.2 1949.02171.6 2101.8 1953.42270.6 2098.1 1958.32371.9 2100.8 1961.42471.7 2101.6 1973.8
2569.8 2102.2 2008.71870.7 2001.8 1969.41970.1 1997.0 1959.72072.9 2002.2 1961.42167.0 2002.6 1958.92268.6 2001.7 1960.52371.2 1997.8 1961.72471.0 2002.6 1981.71871.1 1897.1 1990.9
1968.9 1900.4 1976.1
2071.2 1901.4 1972.1
2167.9 1902.5 1970.5
2271.0 1900.2 1987.12369.5 1901.0 1994.82472.8 1899.4 2009.5
X Y Z1868.4 1803.7 2012.5
1968.7 1803.0 1999.32067.0 1799.3 1985.42172.6 1803.7 1987.32269.1 1802.2 2005.52369.2 1799.8 2020.32469.2 1803.4 2032.22567.1 1800.5 2038.92669.0 1799.3 2051.52769.5 1799.1 2071.32869.6 1797.9 2078.62968.4 1799.6 2085.03072.1 1800.7 2083.63170.6 1800.7 2093.31970.2 1702.8 2007.92073.6 1703.0 2008.9
2173.1 1702.9 2010.02273.9 1703.6 2017.32372.8 1699.4 2025.12472.5 1701.4 2032.02572.5 1702.1 2036.02667.0 1700.0 2052.92770.7 1699.5 2065.72871.8 1702.0 2076.32971.8 1698.9 2075.93069.7 1704.6 2103.3
3172.1 1702.8 2116.42069.7 1601.2 2030.9
2170.0 1599.9 2025.72270.9 1599.4 2025.82367.2 1600.7 2026.8
2469.4 1599.9 2038.72566.5 1597.9 2047.82672.4 1598.1 2057.42769.8 1601.6 2070.22868.6 1603.1 2082.62968.1 1604.0 2098.4
3068.3 1602.7 2124.02172.8 1501.1 2047.32268.3. 1497.3 2042.02372.7 1500.4 2042.22468.4 1496.3 2044.62570.1 1503.9 2050.42669.6 1502.2 2064.42770.0 1504.3 2076.52870.6 1506.9 2091.8
2373.2 1398.1 2062.0
2464.1 1396.3 2059.42573.6 1397.3 2061.82669.8 1400.3 2087.72770.9 1399.4 2110.2
30

TABLE 7. Snow density at South Cascade Glacier, April 15, 1992
[Measured in a snow pit, through the entire thickness of the snow, at local X = 1856, Y = 2793, Z = 1852. cm = centimeters]
Samplebottom Sampledepth length Mass Density (cm)___(cm) (grams)
4285127163191230268309349387423
4243423628393841403836
725735775715570810810835900830885
0.410.410.440.470.490.500.510.490.540.520.59
31
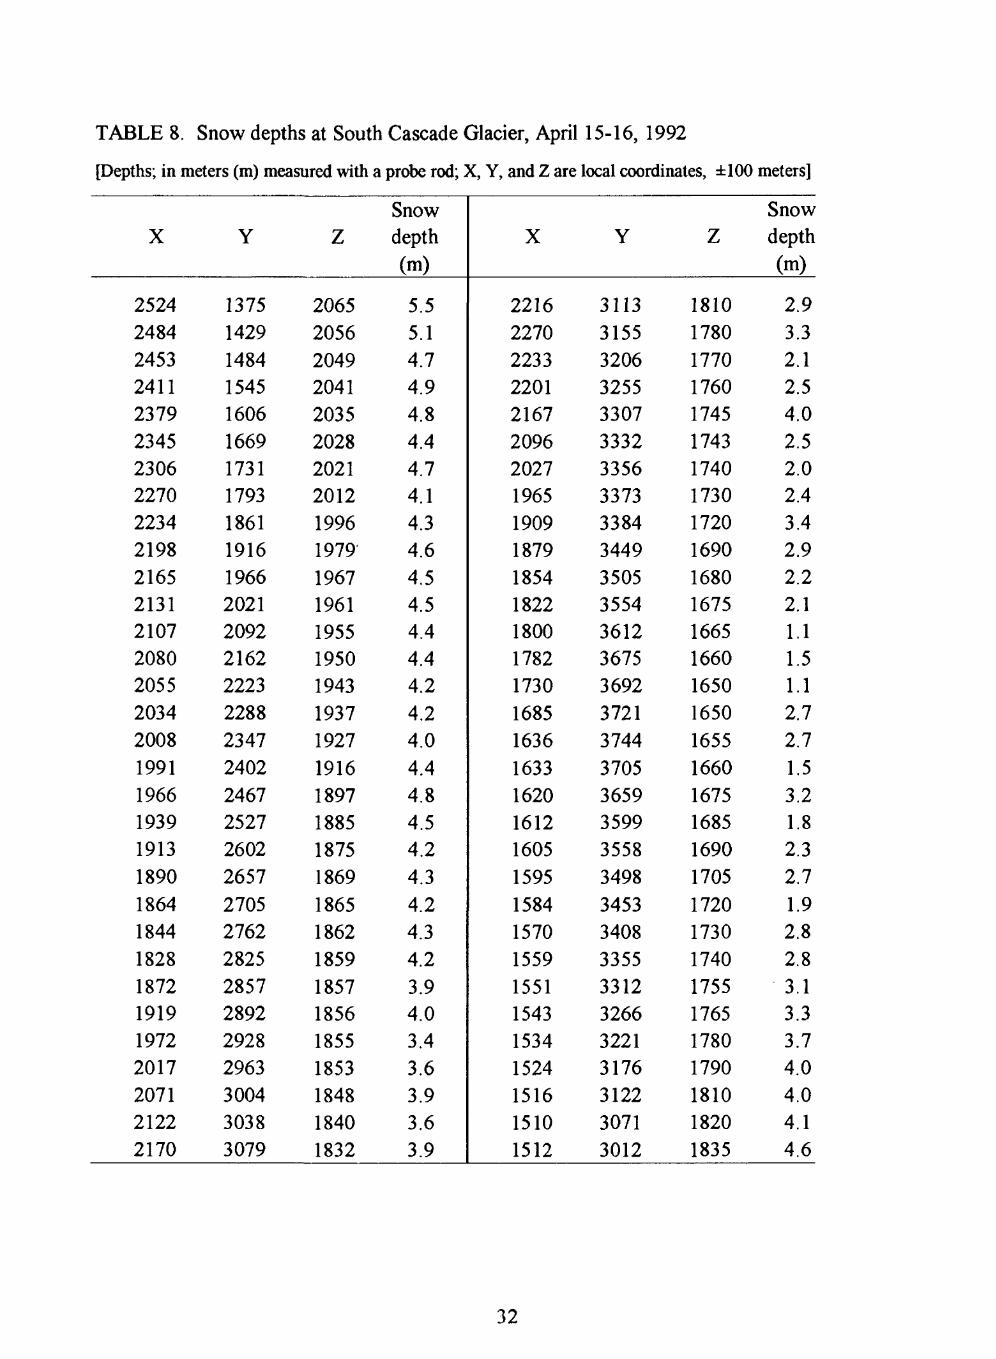
TABLE 8. Snow depths at South Cascade Glacier, April 15-16, 1992
Pepths; in meters (m) measured with a probe rod; X, Y, and Z are local coordinates, ±100 meters]
X
25242484245324112379234523062270223421982165213121072080205520342008199119661939191318901864184418281872191919722017207121222170
Y
13751429148415451606166917311793186119161966202120922162222322882347240224672527260226572705276228252857289229282963300430383079
Z
20652056204920412035202820212012199619791967196119551950194319371927191618971885187518691865186218591857185618551853184818401832
Snow depth (m)
5.55.14.74.94.84.44.74.14.34.64.54.54.44.44.24.24.04.44.84.54.24.34.24.34.23.94.03.43.63.93.63.9
X
22162270223322012167209620271965190918791854182218001782173016851636163316201612160515951584157015591551154315341524151615101512
Y
31133155320632553307333233563373338434493505355436123675369237213744370536593599355834983453340833553312326632213176312230713012
Z
18101780177017601745174317401730172016901680167516651660165016501655166016751685169017051720173017401755176517801790181018201835
Snow depth (m)
2.93.32.12.54.02.52.02.43.42.92.22.11.11.51.12.72.71.53.21.82.32.71.92.82.83.13.33.74.04.04.14.6
32

TABLE 9. Snow density at 1,618 meters altitude in South Cascade Glacier Basin, April 16, 1992
[Measured with a snow tube that penetrated the entire snowpack in one sample. The distance between sample locations was about 15 meters. Depth and water equivalent (W.E.) in meters]
Sample
West end234567
East end
Depth (m)
1.301.421.321.321.471.321.731.50
W.E. (m)
0.71.79.71.66.79.69.97.81
Average depth = 1.42 m Average W.E. = 0.77m Average density = 0.54
33

TABLE 10. Stake measurements at South Cascade Glacier in the 1992 balance year.
[Surface material may be snow (s), firn (f), or ice (i); density estimated based on interpolation between measurements made in mid-April, and assumed density of firn of 0.6. Balance is the gain or loss of material, referenced to the previous year's melt horizon, in water content. Local X, Y, and Z coordinates (in meters) given for each stake]
Date
June 4Aug. 18Sept. 7Oct. 10
Apr. 15June 3June 25Aug. 18Sept. 7Oct. 10
June 4Aug. 18Sept. 7Oct. 10
June 4June 24Aug. 18Sept. 7Oct. 10Jan. 31
Surfacematerial
Stake 1-1992s
s/fff
Stake 2- 1992sssiii
Stake 3-1992siii
Stake 4-1992s/iiiiii
Depth(meters)
[X = 25343.98
0.0-.73-.90
[X= 18564.233.202.09
-1.49-2.19-2.54
[X = 21112.50
-3.12-4.06-4.67
[X=18210.0
-1.33-5.61-6.51-7.35-7.52
Density
, Y=1598,0.52
.6
.6
, Y = 2793,0.48.55.55
.67.9.9.9
,Y = 3254,0.55
.9
.9
.9
,Y = 3645,
0.9.9.9.9.9
Balance Remarks(meters)
Z = 2045]2.07
0.0 At snow/firn contact-.44-.54
Z= 1852]1 .90 Dug snow pit here on this day1.761.15
-1.23-1.86-2.18
Z=1761]1.38
-2.81-3.65-4.20
Z=1658]0.0 At snow/firn contact
-1.20-5.05-5.86-6.62-6.77 Measured through snow
34
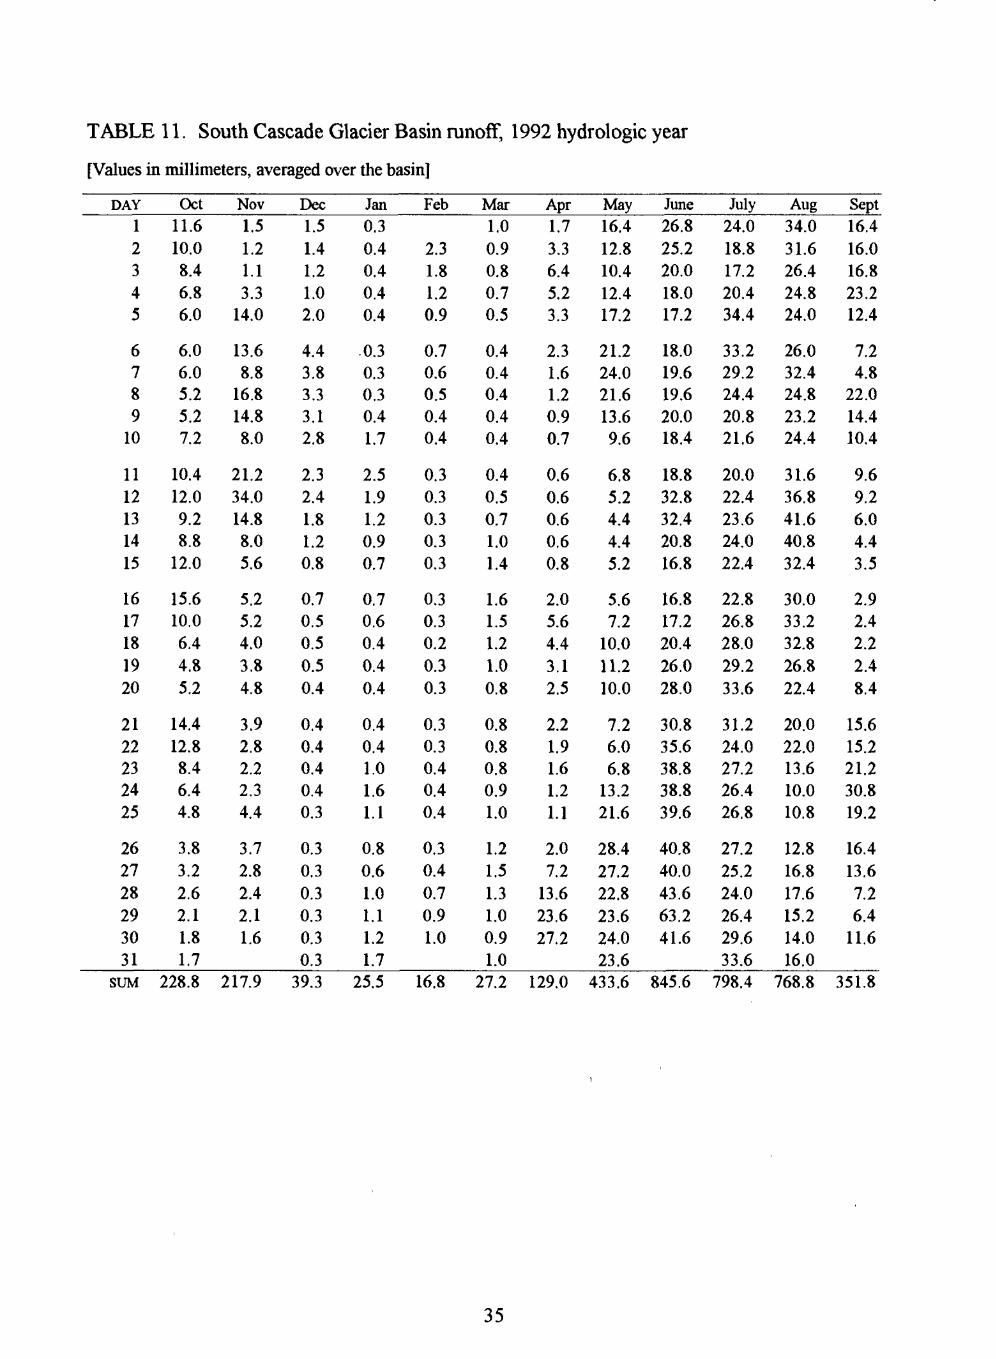
TABLE 11. South Cascade Glacier Basin runoff, 1992 hydrologic year
[Values in millimeters, averaged over the basin]
DAY
1
2345
6789
10
1112131415
1617181920
2122232425
262728293031
Oct11.610.08.46.86.0
6.06.05.25.27.2
10.412.09.28.8
12.0
15.610.06.44.85.2
14.412.88.46.44.8
3.83.22.62.11.81.7
Nov1.51.21.13.3
14.0
13.68.8
16.814.88.0
21.234.014.88.05.6
5.25.24.03.84.8
3.92.82.22.34.4
3.72.82.42.11.6
Dec1.51.41.21.02.0
4.43.83.33.12.8
2.32.41.81.20.8
0.70.50.50.50.4
0.40.40.40.40.3
0.30.30.30.30.30.3
Jan0.30.40.40.40.4
.0.30.30.30.41.7
2.51.91.20.90.7
0.70.60.40.40.4
0.40.41.01.61.1
0.80.61.01.11.21.7
Feb
2.31.81.20.9
0.70.60.50.40.4
0.30.30.30.30.3
0.30.30.20.30.3
0.30.30.40.40.4
0.30.40.70.91.0
Mar1.00.90.80.70.5
0.40.40.40.40.4
0.40.50.71.01.4
1.61.51.21.00.8
0.80.80.80.91.0
1.21.51.31.00.91.0
Apr1.73.36.45.23.3
2.31.61.20.90.7
0.60.60.60.60.8
2.05.64.43.12.5
2.21.91.61.21.1
2.07.2
13.623.627.2
May16.412.810.412.417.2
21.224.021.613.69.6
6.85.24.44.45.2
5.67.2
10.011.210.0
7.26.06.8
13.221.6
28.427.222.823.624.023.6
June26.825.220.018.017.2
18.019.619.620.018.4
18.832.832.420.816.8
16.817.220.426.028.0
30.835.638.838.839.6
40.840.043.663.241.6
July24.018.817.220.434.4
33.229.224.420.821.6
20.022.423.624.022.4
22.826.828.029.233.6
31.224.027.226.426.8
27.225.224.026.429.633.6
Aug34.031.626.424.824.0
26.032.424.823.224.4
31.636.841.640.832.4
30.033.232.826.822.4
20.022.013.610.010.8
12.816.817.615.214.016.0
Sept16.416.016.823.212.4
7.24.8
22.014.410.4
9.69.26.04.43.5
2.92.42.22.48.4
15.615.221.230.819.2
16.413.67.26.4
11.6
SUM 228.8 217.9 39.3 25.5 16.8 27.2 129.0 433.6 845.6 798.4 768.8 351.8
35

TABLE 12. Salix Basin runoff, 1992 hydrologic year
[Values in millimeters, averaged over the basin; -99.0 indicates no data]
DAY
1
2345
6789
10
1112131415
1617181920
2122232425
262728293031
Oct0.50.50.50.50.4
0.40.40.40.40.4
0.40.40.40.40.2
1.30.90.90.80.6
7.03.52.52.22.0
2.01.71.51.51.41.3
Nov1.10.91.1
23.628.3
5.54.0
24.87.44.0
38.922.4
9.25.84.7
4.64.64.15.08.6
4.03.43.25.4
13.0
4.53.12.52.22.2
Dec2.12.01.71.4
11.7
13.03.72.52.11.7
.5
.4
.3
.3
.3
1.31.21.21.21.2
1.11.11.10.90.9
0.90.90.80.80.80.8
Jan0.80.80.80.80.8
0.80.80.85.8
14.2
5.03.93.93.92.7
2.02.01.81.21.2
1.21.11.11.41.3
1.21.22.63.26.4
15.3
Feb7.93.42.62.42.1
1.91.91.81.71.4
1.31.21.21.11.1
1.11.11.11.11.1
-99.0-99.0-99.0-99.0-99.0
-99.0-99.0-99.0-99.0
Mar-99.0-99.0-99.0-99.0-99.0
-99.0-99.0-99.0-99.0-99.0
-99.0-99.0-99.0-99.0-99.0
-99.0-99.0-99.0-99.0-99.0
-99.0-99.0-99.0-99.0-99.0
-99.0-99.0-99.0-99.0-99.0-99.0
Apr-99.0-99.0-99.0-99.0-99.0
-99.0-99.0-99.0-99.0-99.0
-99.0-99.0-99.0-99.0-99.0
-99.015.37.25.36.7
6.85.04.03.56.5
16.541.330.764.940.1
May16.511.818.933.037.8
42.538.921.213.09.1
6.65.36.6
11.813.0
16.523.626.021.214.2
10.011.222.434.233.0
36.624.821.222.420.122.4
June21.216.514.211.811.4
11.09.89.49.27.9
6.826.022.411.88.3
6.76.35.45.05.1
5.25.04.74.43.9
3.73.33.3
18.95.1
July3.73.22.76.3
11.3
11.87.65.23.83.8
3.73.12.62.21.9
1.51.41.31.41.8
1.51.46.43.32.0
1.51.31.10.90.80.8
Aug0.70.70.60.70.6
1.33.33.13.01.5
1.10.80.80.70.6
0.60.50.50.50.5
0.51.90.80.60.5
0.50.50.50.40.40.5
Sept0.40.40.52.72.2
2.12.0
20.12.71.4
1.12.23.85.43.9
2.21.51.21.12.7
1.81.28.0
23.615.3
15.35.93.73.02.7
SUM 37.3 252.1 64.9 90.0 - 645.8 283.7 101.3 29.2 140.1
36

TABLE 13. South Cascade Glacier mass balance time series
[For years 1986-91 net balance, Bn , was determined by the index
regression method discussed in Krimmel (1989) and has an error of
0.23 m. For years 1959-64 and 1968-1982 winter balance, Bw (s), from
unpublished snow accumulation maps, and has an error of 0.12 m. For
years 1983-1991 Bv,(s) determined using a similar index station
regression as discussed in Krimmel (1989), and has an error of 0.23 m]
Year1
2 195919601961196219631964
3 19651966
4 19675 19681969197019711972197319741975
Bn
(meters)
0.70-0.50-1.100.20-1.301.20
-0.17-1.03-0.630.01-0.73-1.200.601.43
-1.041.02
-0.05
5w(s) (meters)
3.282.212.402.502.233.253.482.473.293.003.172.413.514.272.213.653.06
Year1
19761977197819791980198119821983198419851986198719881989199019911992
Bn
(meters)
0.95-1.30-0.38-1.56-1.02-0.840.08-0.770.12-1.20-0.71-2.56-1.64-0.71-0.73-0.20-2.01
£w (s) (meters)
3.531.572.492.181.832.283.111.912.382.182.431.881.892.352.803.351.91
1 Balance year (for example, 1959 is from the minimum
balance in 1958 to the minimum balance in 1959, and the
1959 £ w (s) occurred in the spring of 1959)
2 Bn for years 1959 through 1964 from Meier and Tangborn (1965)
3 Years 1965 through 1966 from Meier and others (1971)
4 Year 1967 from Tangborn and others (1977)
5 £ for years 1968 through 1985 from Krimmel (1989)
37

TABLE 14. Machine-readable files available as a supplement to this report
ParameterTime
intervalUnit of
measurement
South Fork Cascade River stage 60 minutesSalix Creek stage 15 minutesMiddle Tarn stage 15 minutes1,615 meters altitude precipitation 60 minutes1,615 meters altitude temperature 60 minutes1,867 meters altitude temperature 60 minutes1,615 meters altitude barometric pressure 60 minutesSouth Cascade Glacier Basin runoff daySalix Basin runoff day1,615 meters altitude precipitation day1,615 meters altitude minimum temperature day1,615 meters altitude maximum temperature day1,615 meters altitude average temperature day1,867 meters altitude minimum temperature day1,867 meters altitude maximum temperature day1,867 meters altitude average temperature day Perimeters and areas of features Probe depthsAltitude grid________ ___ ~-
0.01 foot0.01 foot0.01 foot0.01 inch0.1°Celsius0.1°Celsius0.01 inchHg1 millimeter1 millimeter1 millimeter0.1°Celsius0.1°Celsius0.1°Celsius0.1°Celsius0.1°Celsius0.1°Celsius0.001 square kilometers10 centimeters1 meter
* U.S. GOVERNMENT PRINTING OFFICE 1993-0-590-213/10034
38