Mass balance 4.3
31
Mass balance 4.3 NP NE NV NX OP OE OV OX HP HE HV HX CP CE CV CX NN ON HN CN P E E V X N O H C n n n n n n n n n n n n n n n n n n n n J J J J J J J J J R O M O M O O M M O O M M n n J J J n n J J n J n 0 ; 0 0 0 2 1 2 0 2 0 0 0 1 ; ; 1 N O H C M P E V X O minerals carbon dioxide water dioxygen nitrogen-waste organics food structure reserve product 1 Cj ij i n n J flux of compound i chemical index for element i in compoun for all compounds j DEB model specifies organic fluxes Mineral fluxes follow from mass balance Extendable to more elements/compounds compounds
-
Upload
regina-clements -
Category
Documents
-
view
71 -
download
2
description
Mass balance 4.3. minerals carbon dioxide water dioxygen nitrogen-waste. organics food structure reserve product. flux of compound i chemical index for element i in compound j for all compounds j. compounds. DEB model specifies organic fluxes - PowerPoint PPT Presentation
Transcript of Mass balance 4.3

Mass balance 4.3
NPNENVNX
OPOEOVOX
HPHEHVHX
CPCECVCX
NN
ON
HN
CN
P
EE
V
X
N
O
H
C
nnnnnnnnnnnnnnnn
nnnn
JJJ
JJ
JJJJ
R
OMOM
OOMMOOMM
nnJJ
JnnJJnJn0
;
000212020001
;;
1
NOHCM
PEVXOminerals
carbon dioxidewaterdioxygennitrogen-waste
organicsfoodstructurereserveproduct
1Cj
ij
i
n
nJ flux of compound i
chemical index for element i in compound j for all compounds j
DEB model specifies organic fluxesMineral fluxes follow from mass balanceExtendable to more elements/compounds
com
poun
ds

Mass-energy coupling 4.3
PGPDPA
EEE
VG
XA
G
D
A
P
EE
V
X
EVEVGVGVGEXEAXAXXA
ηηημμμ
ηη
ppp
JJJ
JJ
μyμμημyμμη
R
111
11
0000
;;
;;;;
OO
OO
ηpJ
pηJ
com
poun
ds
PEVXO organics
foodstructurereserveproduct
pow
ers
GDA assimilation
dissipationgrowth ij
ij
E
ηyμ chemical potential of E
yield of compound i on jcoupler of compound i to power j for faeces:
OOMMMOOMOOMM ηnnηpηpηnnJnnJ 111 for Decomposition of mineral fluxes into contributions from 3 basic energy fluxes:
0 PGPD ηη
Organic fluxesare linear combinations
of 3 energy fluxes
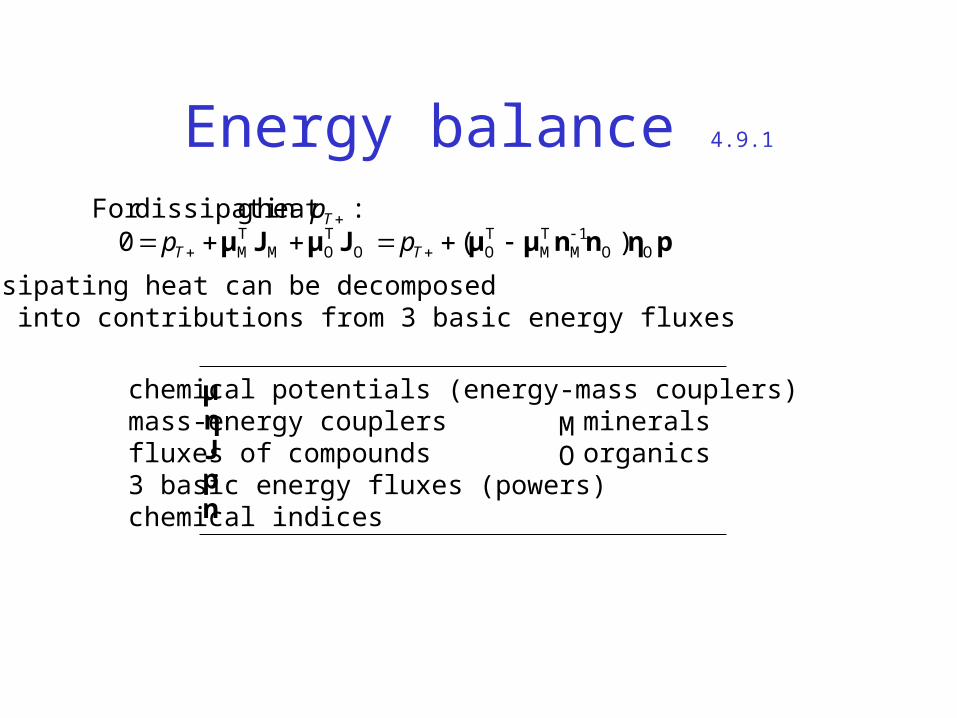
Energy balance 4.9.1
pηnnμμJμJμ OOMTM
TOO
TOM
TM )(0
:heat gdissipatinFor 1
TT
T
ppp
Dissipating heat can be decomposed into contributions from 3 basic energy fluxes
npJημ chemical potentials (energy-mass couplers)
mass-energy couplers fluxes of compounds3 basic energy fluxes (powers)chemical indices
OM minerals
organics

Method of indirect calorimetry 4.9.2
Empirical origin (multiple regression): Lavoisier 1780
Heat production = wC CO2-production + wO O2-consumption + wN N-waste production
DEB-explanation:Mass and heat fluxes = wA assimilation + wD dissipation + wG growthApplies to CO2, O2, N-waste, heat, food, faeces, …
For V1-morphs: dissipation maintenance

Mass fluxes 4.1
dioxidecarbon 2 CJ
water2 HJ
dioxygen2 OJ
ammonia10 NJ
foodXJ
structure40 VJ
reserve)(10
REE JJ faeces
PJ
llength scaled
f
lux
f
lux
bl pl
notice small dent due to transition
maturation reproductionAt abundant food: growth ceases at l = 1
allocation toreproduction
use of reservenot balanced by
feeding in embryo
bl pl
0 1
10

Methanotrophy 4.3.1
Yield coefficients Y and chemical indices n depend on (variable) specific growth rate rNWOWHW nnnWX3NX2OX2CX4 NOCH Y NH Y O Y CO Y CH
AC Assim (catabolic) -1 1 2 -2 0 0 0
AA Assim (anabolic) -1 0 1 0
M Maintenance 0 1 -1 0
GC Growth (catabolic) 0 1 -1 0
GA Growth (anabolic) 0 0 -1 1
C Carbon 1 1 0 0 0 1 1
H Hydrogen 4 0 2 0 3
O Oxygen 0 2 1 2 0
N Nitrogen 0 0 0 0 1
2/2/2/
2/32/2/
2/2/1
2/2/3
2/2/
2/2/32
From
GHEOVOE
GOE
GNEHVHE
GHE
NVNEG
NE
MHEOE
MOE
HENEM
HE
OEA
HXA
OX
HEA
NXA
HX
NEA
NX
YnnY
YnnY
nnY
YnY
nnY
nYY
nYY
nY
nY0
AHXY A
OXY ANXY
MHEY
GHEY
MHEY
MOEYM
OEYG
OEY GNEY
NEn
NEn
HEn
OEn
NEn
HVn
OVn
NVn
sym
bol
proc
ess
X: m
etha
ne
C: c
arbo
n di
oxid
e
H: w
ater
O: d
ioxy
gen
N: a
mm
onia
E: r
eser
ve
V: s
truc
ture
EAXE jy )1(
EAj
EGVE jy )1(
EGVE jy
EMj
EVE
EMEEVV
EVEG
MEVEM
EAmEA
ym
jkmM
dt
dMr
ryj
kyjXK
Xjj
1
For reserve density mE = ME/MV (ratio of amounts of reserve and structure), the macroscopic transformation can be decomposed into 5 microscopic ones with fixed coefficients
rate
Yie
ld c
oeff
icie
ntsT
Che
mic
al in
dice
s

Methanotrophy 4.3.1
spec growth rate, h-1 spec growth rate, h-1
X/O
N/O
C/O
flux
rat
io, m
ol.m
ol-1
spec
flu
x, m
ol.m
ol-1.h
-1
CE
N
X
O
X: methaneC: carbon dioxideO: dioxygenN: ammoniaE: reserve
jEAm = 1.2 mol.mol-1.h-1
yEX = 0.8yVE = 0.8kM = 0.01 h-1
kE = 2 h-1
nHE = 1.8nOE = 0.3nNE = 0.3
nHV = 1.8nOV = 0.3nNV = 0.3
chemical indices
Kooijman, Andersen &Kooi 2004. Ecology, to appear
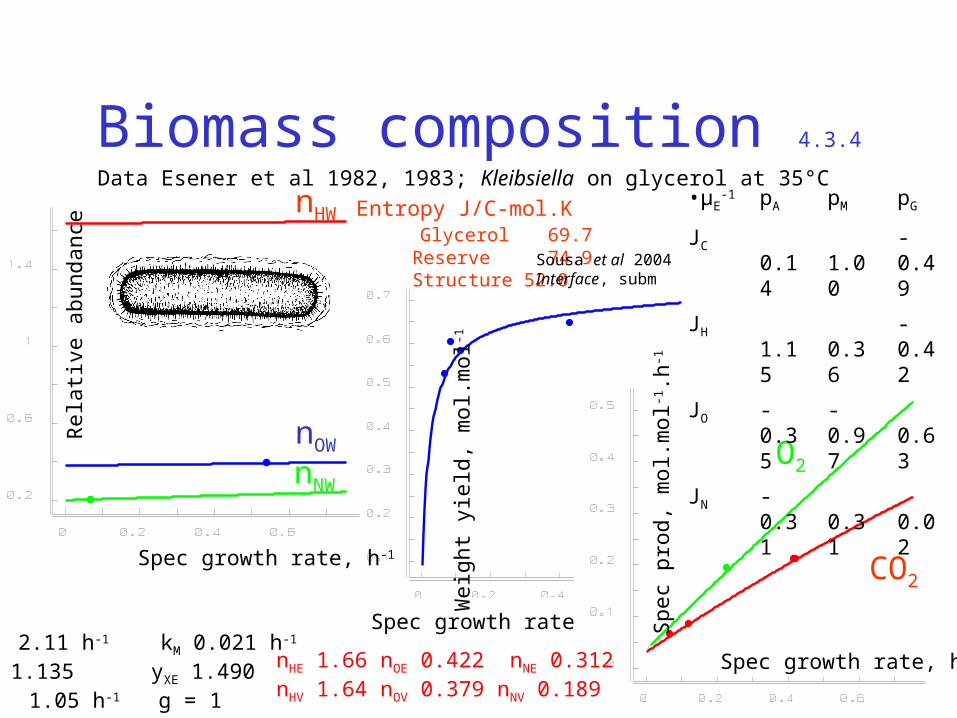
Biomass composition 4.3.4
Data Esener et al 1982, 1983; Kleibsiella on glycerol at 35°CnHW
nOW
nNW
O2
CO2Spec growth rate, h-1
Spec growth rate
Spec growth rate, h-1
Rel
ativ
e ab
unda
nce
Spe
c pr
od, m
ol.m
ol-1.h
-1
Wei
ght y
ield
, mol
.mol
-1
nHE 1.66 nOE 0.422 nNE 0.312nHV 1.64 nOV 0.379 nNV 0.189
kE 2.11 h-1 kM 0.021 h-1
yEV 1.135 yXE 1.490rm 1.05 h-1 g = 1
•μE-1 pA pM pG
JC 0.14 1.00 -0.49
JH 1.15 0.36 -0.42
JO -0.35 -0.97 0.63
JN -0.31 0.31 0.02
Entropy J/C-mol.K Glycerol 69.7 Reserve 74.9 Structure 52.0
Sousa et al 2004Interface, subm

Product Formation 4.7
throughput rate, h-1
glyc
erol
, eth
anol
, g/l
pyru
vate
, mg/
l
glycerol
ethanol
pyru
vate
Glucose-limited growth of SaccharomycesData from Schatzmann, 1975
According to Dynamic Energy Budget theory:
Product formation rate = wA . Assimilation rate + wM . Maintenance rate + wG . Growth rate
For pyruvate: wG<0

1 Reserve – 1 Structure
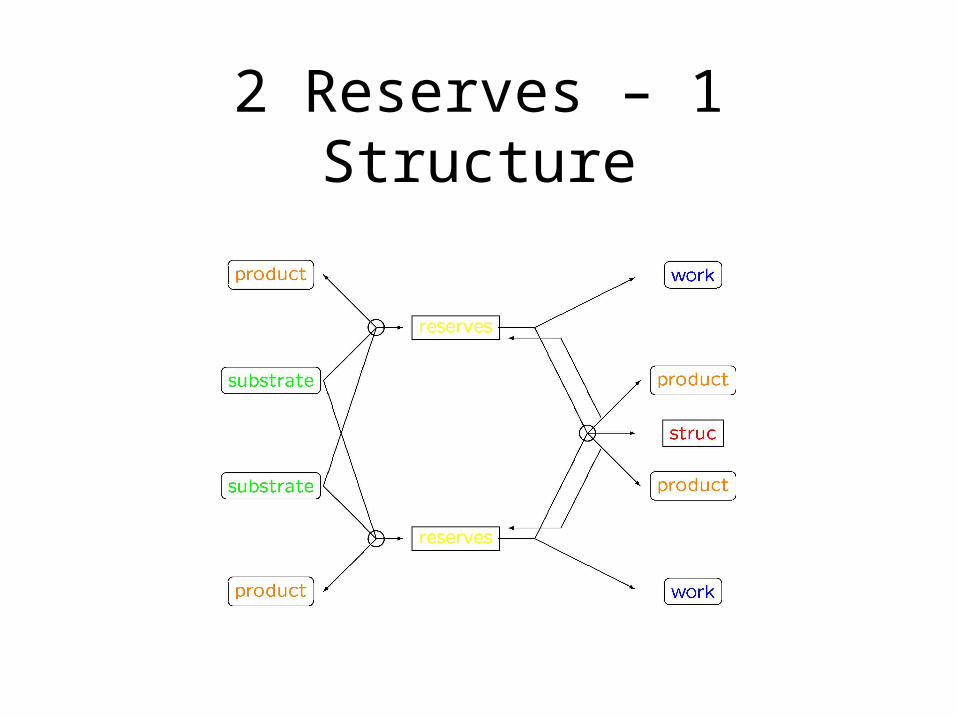
2 Reserves – 1 Structure
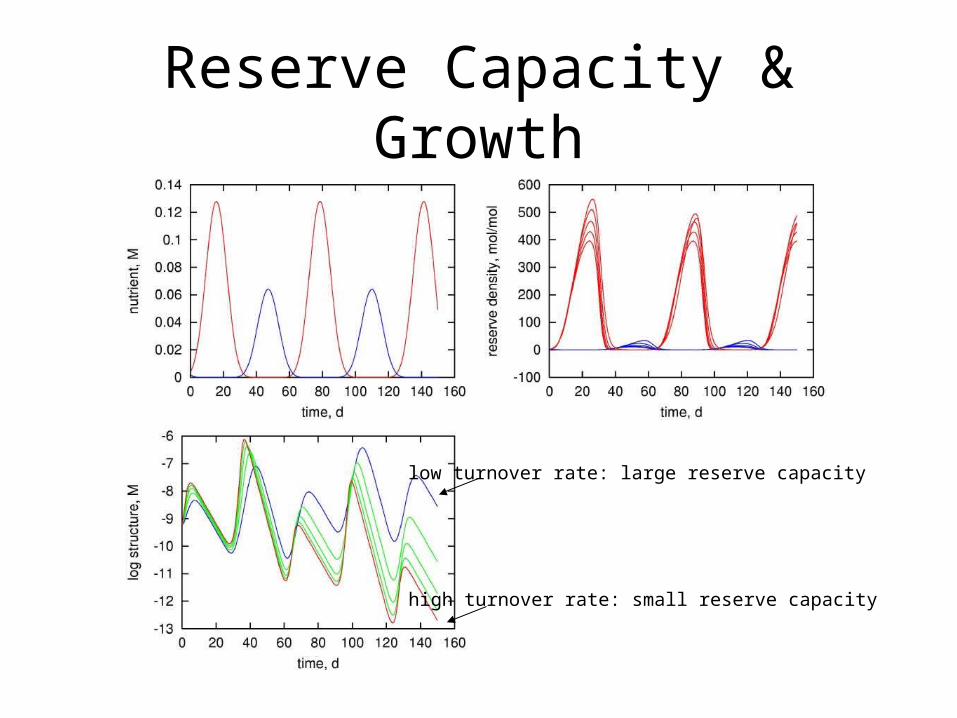
Reserve Capacity & Growth
low turnover rate: large reserve capacity
high turnover rate: small reserve capacity
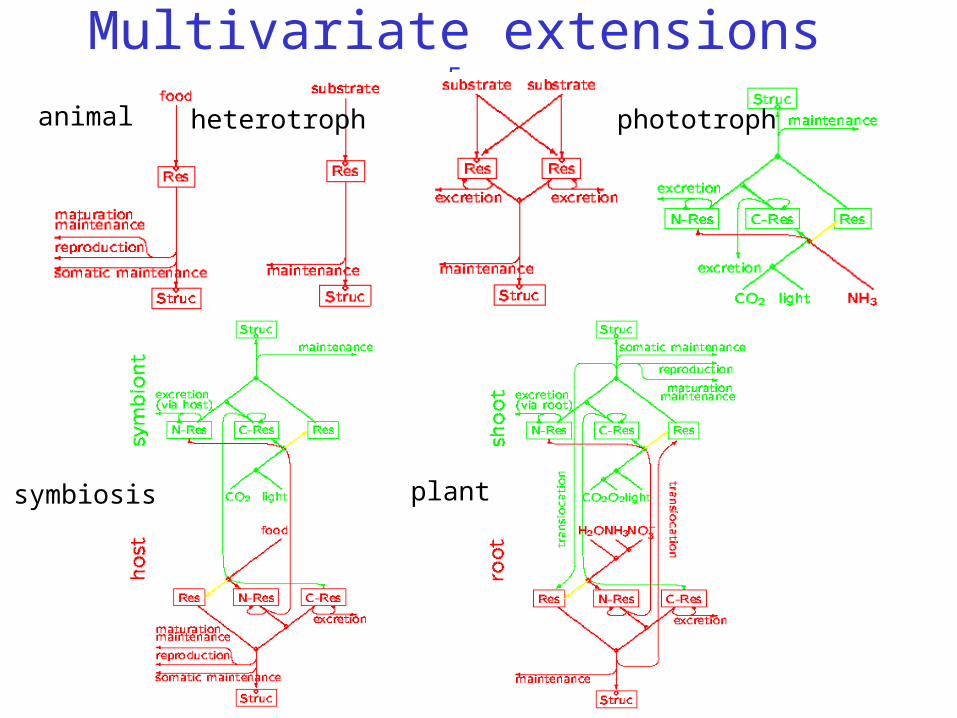
Multivariate extensions 5
animal heterotroph phototroph
symbiosis plant
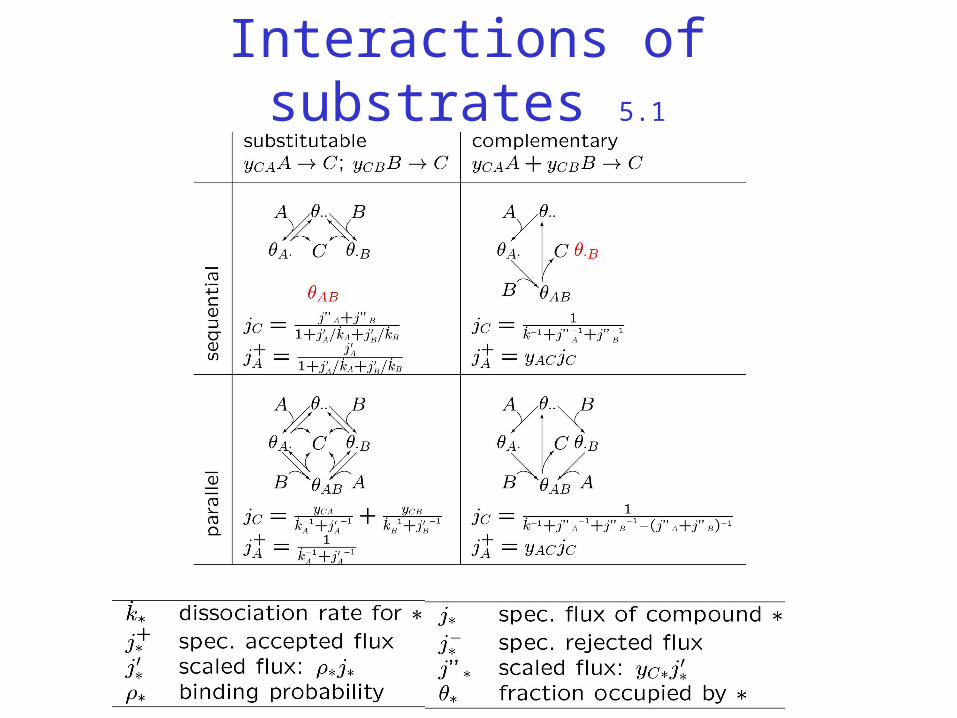
Interactions of substrates 5.1

Photosynthesis 5.1.3
2 H2O + 4 h O2 + 4 H+ + 4 e-
CO2 + 4 H+ + 4 e- CH2O + H2O
CO2 + H2O + light CH2O + O2
3222
32
NHOOHCONOCH
NOOCH
ENOEHECEnnn
ENEC
HNEOEHE
OH
yyyy
yy

Simultaneous nutrient limitation 5.2.3
Specific growth rate of Pavlova lutheri as function of intracellular phosphorus and vitamine B12 at 20 ºC
Data from Droop 1974Note the absence of high contents for both compounds
due to damming up of reserves, andlow contents in structure (at zero growth)

Reserve interactions 5.2.4
Spec growth rate, d-1 Spec growth rate, d-1 Spec growth rate, d-1
P-c
onte
nt, f
mol
.cel
l-1P
-con
c, μ
M
B12
-con
c, p
M
B12
-con
t., 1
0-21 .m
ol.c
ell-1
P Vitamin B12
kE 1.19 1.22 d-1
yXV 0.39 10-15 2.35 mol.cell-1
jEAm 4.91 10-21 76.6 10-15 mol.cell-1. d-1
κE 0.69 0.96
kM 0.0079 0.135 d-1
K 0.017 0.12 pM, μM
Data from Droop 1974 on Pavlova lutheri
P(μM) B12(pM)
1.44 68
14.4 6.8
1.44 20.4
1.44 6.8

Steps in food 7.1.2
Growth of Daphnia magna at 2 constant food levels
time, d time, d time, d time, d
0 d 7 d 14 d 21 dle
ngth
, mm
leng
th, m
m
Only curves at 0 d are fittedNotice • slow response• gut content in down steps
Steps up
Steps down
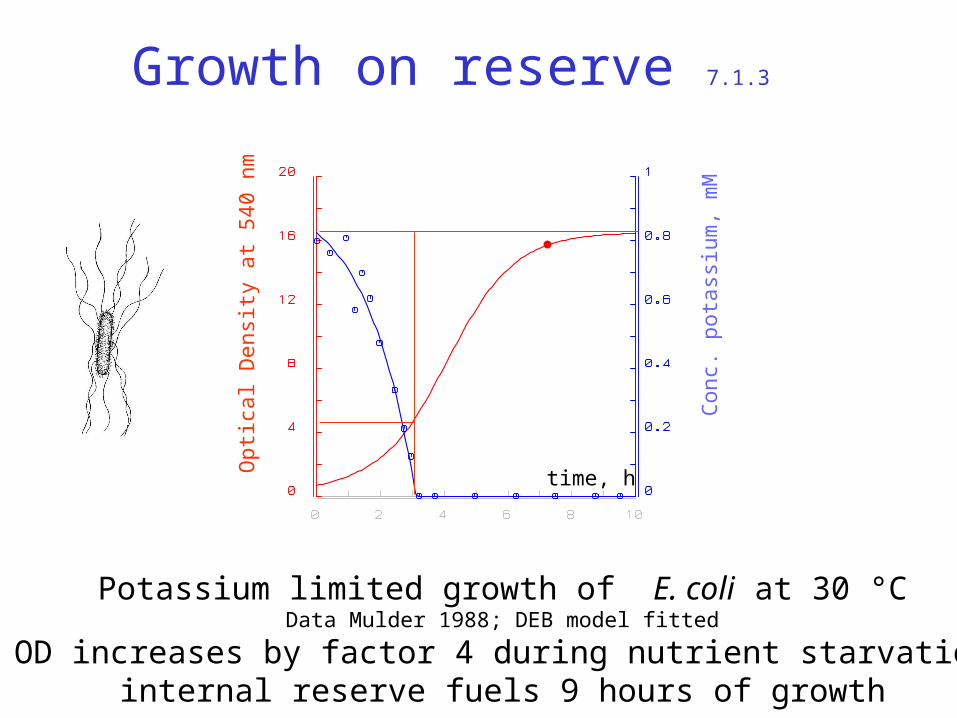
Growth on reserve 7.1.3
Opt
ical
Den
sity
at 5
40 n
m
Con
c. p
otas
sium
, mM
Potassium limited growth of E. coli at 30 °CData Mulder 1988; DEB model fitted
OD increases by factor 4 during nutrient starvationinternal reserve fuels 9 hours of growth
time, h
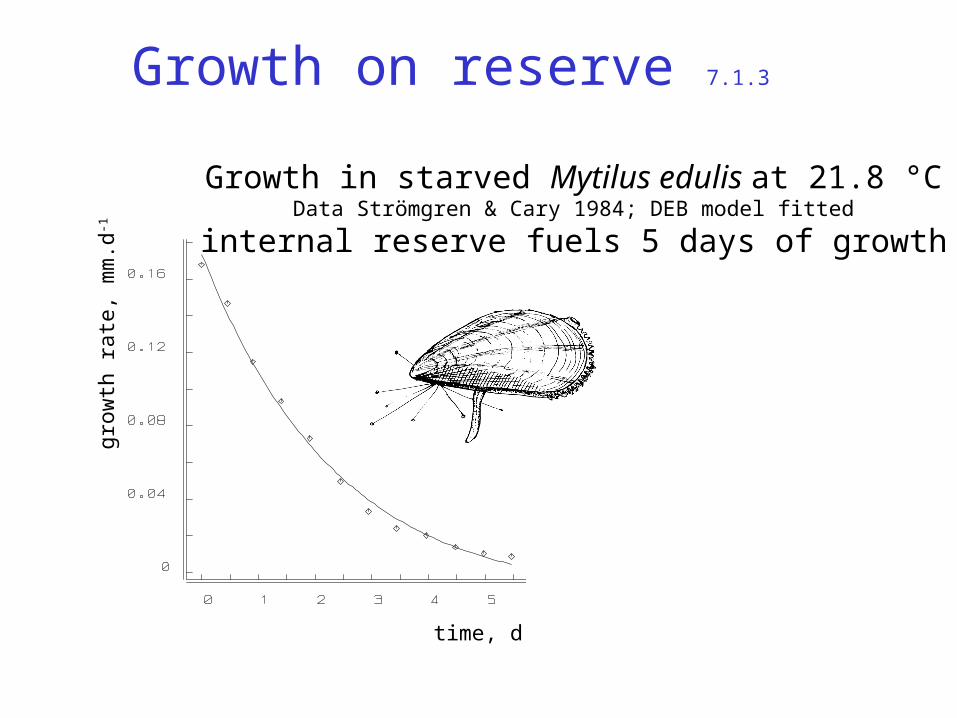
Growth on reserve 7.1.3
Growth in starved Mytilus edulis at 21.8 °CData Strömgren & Cary 1984; DEB model fitted
internal reserve fuels 5 days of growth
time, d
grow
th r
ate,
mm
.d-1

Protein synthesis 7.5
spec growth rate, h-1 scaled spec growth rate
RN
A/d
ry w
eigh
t, μg
.μg-1
scal
ed e
long
atio
n ra
te
Data from Koch 1970Data from Bremer & Dennis 1987
RNA = wRV MV + wRE ME
dry weight = wdV MV + wdE ME

Scales of life 8.0
Life span
10log aVolume
10log m3earth
whale
bacterium
water molecule
life on earth
whale
bacteriumATP

Invariance property 8.1
The parameters of two individuals can differ in a very special way such that both individuals behave identically at constant food density if they start with the same values for the state variables (reserve, structure, damage)
At varying food density, two individuals only behave identically if all their parameters are equal

Inter-species body size scaling 8.2
• parameter values tend to co-vary across species• parameters are either intensive or extensive• ratios of extensive parameters are intensive• maximum body length is allocation fraction to growth + maint. (intensive) volume-specific maintenance power (intensive) surface area-specific assimilation power (extensive)• conclusion : (so are all extensive parameters)• write physiological property as function of parameters (including maximum body weight)• evaluate this property as function of max body weight
]/[}{ MAm ppL
}{ Ap
][ Mp
mA Lp }{
Kooijman 1986 Energy budgets can explain body size scaling relationsJ. Theor. Biol. 121: 269-282

Primary scaling relationships 8.1
K2=K1z+X(z-1) {JXm}2={JXm}1z [pM]2=[pM]1 {pT}2={pT}1
Lb2 = Lb1 {pAm}2={pAm}1z [EG]2=[EG]1 ha2 = ha1
Lp2 = Lp1 [Em]2=[Em]1z 2= 1 R2= R1
K2=K1z {JXm}2={JXm}1z [pM]2=[pM]1 {pT}2={pT}1
Lb2 = Lb1z {pAm}2={pAm}1z [EG]2=[EG]1 ha2 = ha1
Lp2 = Lp1z [Em]2=[Em]1z 2= 1 R2= R1
K saturation constant
{JXm} max spec feeding rate
[pM] spec maint. costs
{pT} spec heating costs
Lb length at birth {pAm} max spec assim rate
[EG] spec growth costs
ha aging acceleration
Lp length at puberty
[Em] max reserve capacity
partitionning fraction
R reprod. efficiency
z: arbitrary zoom factor for species 2 relative to species 1: z = Lm2/Lm1
invarianceproperty
(at food density X)
primaryscaling
parameters

Length at puberty 8.2.1
L, cm
Lp,
cm
Clupea• Brevoortia° Sprattus Sardinops Sardina
Sardinella+ Engraulis* Centengraulis Stolephorus
Data from Blaxter & Hunter 1982
Clupoid fishes
Length at first reproduction Lp ultimate length L

Body weight 8.2.2
Body weight has contribution from structure and reserveIf reserves allocated to reproduction hardly contribute:
13/4
13/100
11
1
)(][
][
W
EEmV
EEmV
f
EEV
L
μwEd
μwEdVμwEVdW
VVV/VVW
][ m
E
E
V
Eμwd
WLE
V
W
V
Wintra-spec body weightinter-spec body weightintra-spec structural volumeInter-spec structural volumereserve energycompound length-parameter
specific density for structuremolecular weight for reservechemical potential of reservemaximum reserve energy density

Feeding rate 8.2.2
slope = 1
poikilothermic tetrapodsData: Farlow 1976
Inter-species: JXm VIntra-species: JXm V2/3
Mytilus edulisData: Winter 1973
Length, cm
Filt
ratio
n ra
te, l
/h
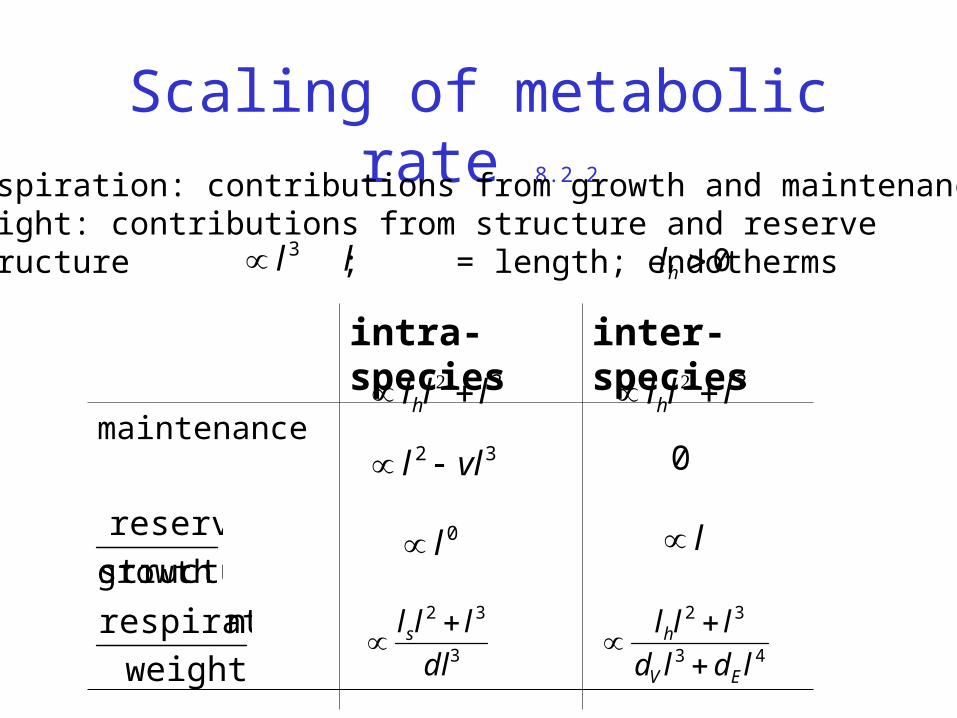
Scaling of metabolic rate 8.2.2
intra-species inter-species
maintenance
growth
weight
nrespiratio3
32
dl
llls
43
32
ldld
lll
EV
h
structure
reserve
32 vll
l0l
0
3lllh
Respiration: contributions from growth and maintenanceWeight: contributions from structure and reserveStructure ; = length; endotherms 3l l
3lllh
0hl
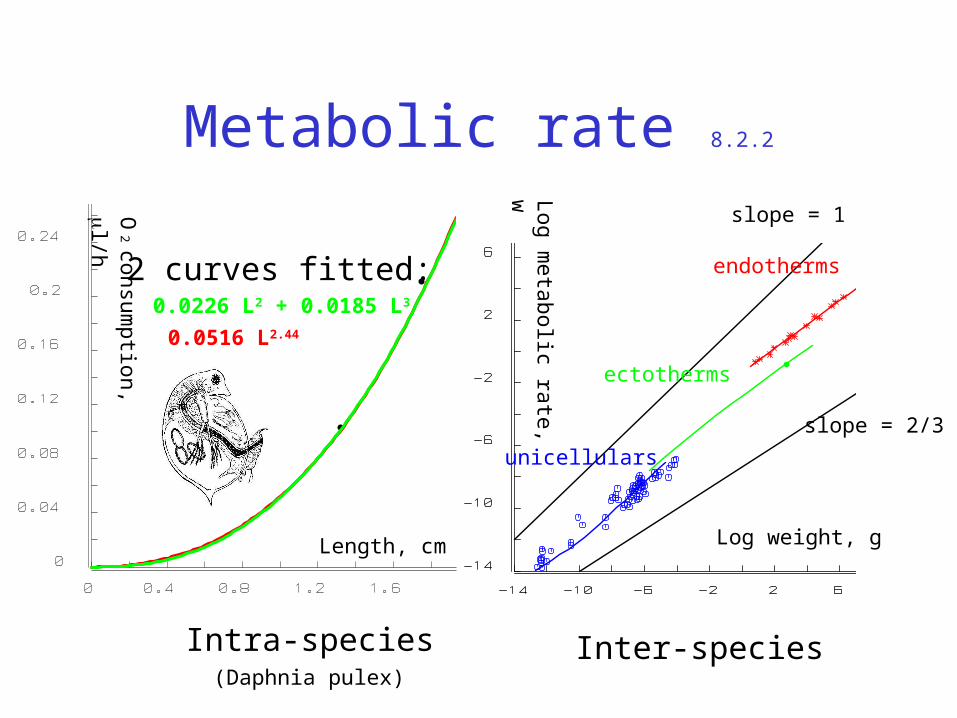
Metabolic rate 8.2.2
Log weight, g
Log metabolic rate,
w
endotherms
ectotherms
unicellulars
slope = 1
slope = 2/3
Length, cm
O2 consum
ption,
l/h
Inter-speciesIntra-species
0.0226 L2 + 0.0185 L3
0.0516 L2.44
2 curves fitted:
(Daphnia pulex)

13/113/1 /3/3/3/3
vkvVkr MMB V
At 25 °C : maint rate coeff kM = 400 a-1
energy conductance v = 0.3 m a-1
25 °CTA = 7 kK
10log ultimate length, mm 10log ultimate length, mm
10lo
g vo
n B
ert
grow
th r
ate
, a-1
)exp()()( 3/13/13/13/1 arVVVaV Bb
3/1V
a
3/1V
3/1bV
1Br
↑
↑0
Von Bertalanffy growth rate 8.2.2