MARYLAND DEPARTMENT OF THE ENVIRONMENT … · This Guidance Document is designed to assist local...
26
MARYLAND DEPARTMENT OF THE ENVIRONMENT Water Supply Program Guidance for Preparing Water Supply Capacity Management Plans Revised June 2013
Transcript of MARYLAND DEPARTMENT OF THE ENVIRONMENT … · This Guidance Document is designed to assist local...

MARYLAND DEPARTMENT OF THE ENVIRONMENT Water Supply Program
Guidance for Preparing Water Supply Capacity Management Plans
Revised June 2013

2
July 6, 2006 (Revised June, 2013)
This Guidance Document for Water Supply Capacity Management Plans (including the Capacity
Management Plan Worksheets) is available at MDE’s web site using the link:
http://www.mde.state.md.us/programs/Water/Water_Supply/Pages/CapacityManagement.aspx
www.mde.state.md.us

3
TABLE OF CONTENTS
I. PURPOSE OF THIS GUIDANCE DOCUMENT ...................................................4 II. BENEFITS OF CAPACITY MANAGEMENT PLANNING………………………….4 III. SUBMITTAL OF CMPs…………………………………………................................4
A. Who is Required to Submit a CMP………………………………........................5 B. Documentation .................................................................................................5 C. Where to Submit Plans. ...................................................................................5
IV. LEGAL MANDATES AND DEFINITIONS TO MANAGE WATER SUPPLY ALLOCATIONS.....................................................................................................6
A. Legal Mandates……………………………………………………………………..6 B. Definitions……………………………………………………………………………6 V. ELEMENTS OF CMP............................................................................................7
A. Determine the Existing Water Demand. ……...................................................8
B. Estimate the Potential Additional Water Demand...........................................10 C. Determine the Capacity of the Water Supply System ....................................11
D. Estimate the Excess Water Supply Capacity By Determining the Limiting Factor………………………………………………………………………............14
E. Control the Allocation of New Connections to the Water Supply System.......16
VI. COVER LETTER.................................................................................................17 VII. APPENDICES
References for Fire Flow and Storage.............................................................. A-1 Example: Frederick County Water Storage Requirements Example: Frederick County Fire Hydrant Design Flow Rates References for Water Demand Projections....................................................... B-1 Example: Anne Arundel Co. – Basis for Resid. Water Demand Projections Capacity Management Plans – Worksheets and Summary ..............................C-1
4
I. PURPOSE OF THIS GUIDANCE DOCUMENT This Guidance Document is designed to assist local jurisdictions and owners of community water supply systems in developing Capacity Management Plans (CMPs). This Guide will explain how to: calculate available/allocable capacity, establish a system to track allocation commitments; and report certain information to the Maryland Department of the Environment (MDE). The local jurisdiction or owner of the community water supply system will be able to:
• Identify when the demand for water is approaching or exceeding the safe capacity of the water supply system;
• Provide timely and critical information to the Local Health Officer, Environmental
Health Director, and elected officials for the approval of subdivision plats and building permits;
• Make commitments for new connections with confidence that there is adequate capacity
to serve new as well as existing customers;
• Determine when the approval of subdivision plats and the issuance of additional building permits need to be curtailed until improvements are completed to meet the additional water demand;
• Plan for needed water supply system improvements to ensure continued adequacy of
the water system as new growth occurs and as water demand increases; and
• Provide an adequate water supply in order to ensure the protection of public health II. BENEFITS OF CAPACITY MANAGEMENT PLANNING A CMP is a useful planning and engineering tool used to manage the relationship between the demand for water and the capability of the water supply system to meet that demand. Having an adequate water supply that meets the existing and future water demand in a community is vital for the protection of public health. Accurate allocation information, combined with reasonable demand projections, helps ensure that water supply systems achieve a high level of public health protection; operate within Water Appropriation Permit parameters; operate within the limitations of their system to produce safe water; and meet the water supply needs of future residential, commercial, and industrial users in a timely manner. III. SUBMITTAL OF CMPs The CMP should contain information regarding water system capacity as it relates to existing and projected demand.
5
A. Who is Required to Submit a CMP Owners of community water supply systems over 20,000 gpd are required to submit a CMP to MDE if the water supply system is:
• Operating at 80% or more of its Water Appropriation Permit (annual average daily permit limitation); or
• Purchasing water and operating at 80% or more of its contractual limit for the purchased
water. MDE strongly recommends that each Maryland community water supply system over 20,000 gpd (annual average daily demand) prepare a CMP. In addition, community waters systems may be required to complete a CMP when operating subject to a Consent Order with MDE or with the U.S. Environmental Protection Agency and when the Secretary of the Department specifically designates that a water system is required to submit a CMP to MDE.
B. Documentation Worksheets to assist in the preparation of CMPs are included in the Appendix of this Guidance Document. These worksheets must be submitted with the CMP for review. Any and all assumptions used in the determination of worksheet values must be stated in that section of the worksheet. These simplified worksheets are included to aid in the capacity evaluation of a typical small water supply system. If your water supply system has a more complex arrangement, please call the Water Supply Program at 410-537-3702 for assistance in completing the capacity evaluation. C. Where to Submit Plans Mail CMPs to:
Water Supply Program Water Management Administration, 4th Floor Maryland Department of the Environment 1800 Washington Blvd. Baltimore, Maryland 21230-1708
6
IV. LEGAL MANDATES AND DEFINITIONS TO MANAGE WATER SUPPLY ALLOCATIONS It is essential for local governments to carefully manage the allocation of water to new residential, commercial, and industrial customers, in conformance with local Comprehensive Plans, County Water and Sewerage Plans, Water Appropriation Permits, and the requirements of the Annotated Code of Maryland pertaining to building permits and subdivision plats. Local governments must ensure that the water supply will be adequate to meet the demand of existing and new users and must allocate any available water in accordance with State as well as local requirements. Water system connections approved through the land development approval process and the issuance of building permits must be closely tied to available water system capacity. The expansion of a water supply system requires demonstrated consistency with the local Comprehensive Plan, inclusion in the County Water and Sewerage Plan, possible modification of the Water Appropriation Permit, compliance with the Water Construction Permit, and compliance with the requirements of the Safe Drinking Water Act. The Environment Article of the Annotated Code of Maryland Title 9 subtitles 2 and 5, sets forth requirements for ensuring the adequacy of a water supply to serve new development as well as the authority of the Secretary of the Department to require Capacity Management Plans. A building permit may not be issued by State or local authorities unless there is an adequate water supply to serve the proposed construction taking into account all existing and approved developments in the service area.
A subdivision plat may not be recorded or approved unless an approved facility for conveying, pumping, storing, or treating water to serve the proposed development would be completed in time to serve the proposed development. The approved facility must be adequate to serve the proposed development, once completed, without overloading any water supply or wastewater system. Each water supply system facility in a subdivision shall conform to the applicable county plan and take into consideration all present and approved subdivision plats and building permits in the service area. Definitions for some key terms found in our guidance are below: 1. A system's legal commitments that are not part of the current demand include the following:
1. All recorded lots that are eligible for receiving building permits; 2. Lots with building permits issued, but without water use to date (taking into account any
redevelopment plans that would change the current demand); 3. Contractual obligations of a water system to provide water to the lot (taking into account
any sunsetting contractual provisions).
2. Building permit – any permit that allows any building construction and is issued by any State or local authority. 3. Lot – a parcel of land, including a part of a subdivision, that:
a. Is used or is intended to be used as a building site; and b. Is not intended to be further subdivided.
7
4. Subdivision – any division of a tract or parcel of land into at least 2 lots, for the purpose of sale or building development. Subdivision includes any change in street lines or lot lines. V. ELEMENTS OF A CMP For the purpose of allocating water system capacity, a CMP consists of six major elements:
A. A determination of the existing water demand;
B. An estimation of the potential additional water demand from approved but
undeveloped subdivisions and building permits;
C. A determination of the water system capacity;
D. An estimation of the excess water system capacity available for allocation;
E. A process to track and control the allocation of new connections to the water supply system; and
F. A process to finance, construct, and operates water supply capital improvements.
This element is not required in CMPs at this time, but is recommended. In addition to the six major elements, basic system and plan information that should be included in the worksheet includes:
• The name of the water supply system that the plan is being completed for; • The County and municipality, as applicable; • The population served by the water system for each year under consideration; • The number of connections to the water system for each year under consideration; • The name of the person completing the plan; and • The date of the plan submittal.
The following sections of this Guidance Document address the first five elements of a CMP. EPA and MDE have provided several other guidance documents on financing, constructing, and operating water supply capital improvements. Local governments and water facility owners are not required to address the capital improvement (sixth) element in their CMP at this time. However, local governments or water facility owners may include descriptions of capital improvements that are planned to remedy the capacity limitations of their water supply systems.
8
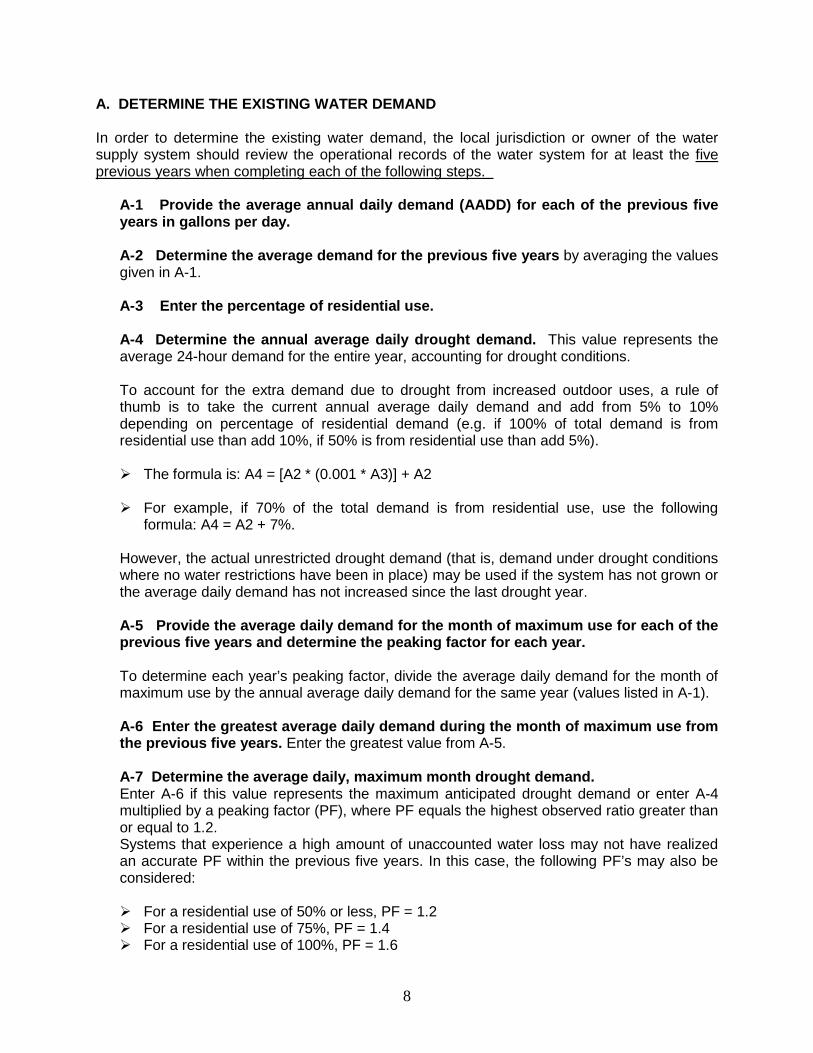
A. DETERMINE THE EXISTING WATER DEMAND
In order to determine the existing water demand, the local jurisdiction or owner of the water supply system should review the operational records of the water system for at least the five previous years when completing each of the following steps.
A-1 Provide the average annual daily demand (AADD) for each of the previous five years in gallons per day. A-2 Determine the average demand for the previous five years by averaging the values given in A-1. A-3 Enter the percentage of residential use. A-4 Determine the annual average daily drought demand. This value represents the average 24-hour demand for the entire year, accounting for drought conditions. To account for the extra demand due to drought from increased outdoor uses, a rule of thumb is to take the current annual average daily demand and add from 5% to 10% depending on percentage of residential demand (e.g. if 100% of total demand is from residential use than add 10%, if 50% is from residential use than add 5%).
The formula is: A4 = [A2 * (0.001 * A3)] + A2 For example, if 70% of the total demand is from residential use, use the following
formula: A4 = A2 + 7%. However, the actual unrestricted drought demand (that is, demand under drought conditions where no water restrictions have been in place) may be used if the system has not grown or the average daily demand has not increased since the last drought year.
A-5 Provide the average daily demand for the month of maximum use for each of the previous five years and determine the peaking factor for each year. To determine each year’s peaking factor, divide the average daily demand for the month of maximum use by the annual average daily demand for the same year (values listed in A-1). A-6 Enter the greatest average daily demand during the month of maximum use from the previous five years. Enter the greatest value from A-5. A-7 Determine the average daily, maximum month drought demand. Enter A-6 if this value represents the maximum anticipated drought demand or enter A-4 multiplied by a peaking factor (PF), where PF equals the highest observed ratio greater than or equal to 1.2. Systems that experience a high amount of unaccounted water loss may not have realized an accurate PF within the previous five years. In this case, the following PF’s may also be considered: For a residential use of 50% or less, PF = 1.2 For a residential use of 75%, PF = 1.4 For a residential use of 100%, PF = 1.6

9
For groundwater systems, use the average daily demand during the month of maximum use under drought conditions. A-8 List the greatest maximum day demand observed within the previous five years and the date.
A-9 Determine the Maximum Day Demand. Enter A-8 if it is considered to be an accurate representation of the worst case scenario excluding days of high demand due to extraordinary circumstances, such as a fire or major leaks and also consider whether or not the worst case scenario was realized in the previous five years. This is the demand on the day with the highest 24-hour demand. This value represents what the system should plan for. If A-8 is not representative of a max day occurring a drought year, it should be adjusted accordingly, possibly by applying peaking factors from previous drought years, and entered in A-9. When A-8 is not reliable, estimate the maximum day drought demand by multiplying A-4 by a PF of no less than 1.6 and provide justification, considering the following values: For a residential use of 50% or less, PF = 1.6 For a residential use of 75%, PF = 2.0 For a residential use of 100%, PF = 2.4
A-10 List the peak-hour demand, if data is available. This is the maximum-hour demand.
A-11 Determine the existing water usage per capita per day.
Water usage per capita = (Population served)
(Annual average daily demand, including system losses)
A-11 = A-2 / F-11
A-12 Determine the existing water usage per connection.
Water usage per connection = ( Annual avg. daily demand, including system losses (Connections served)
)
A-12 = A-2 / F-12
A-13 List the percentage of water demand attributable to the following uses:
1) Residential; 2) Commercial; and 3) Industrial.
A-14 If the data is available, list the approximate amount of water lost due to each of the following:
1) System losses (leaks); 2) Transfers; 3) Meter errors; and 4) Any other known causes (specify in worksheet).
A-15 List the percentage of customers that are metered.
10
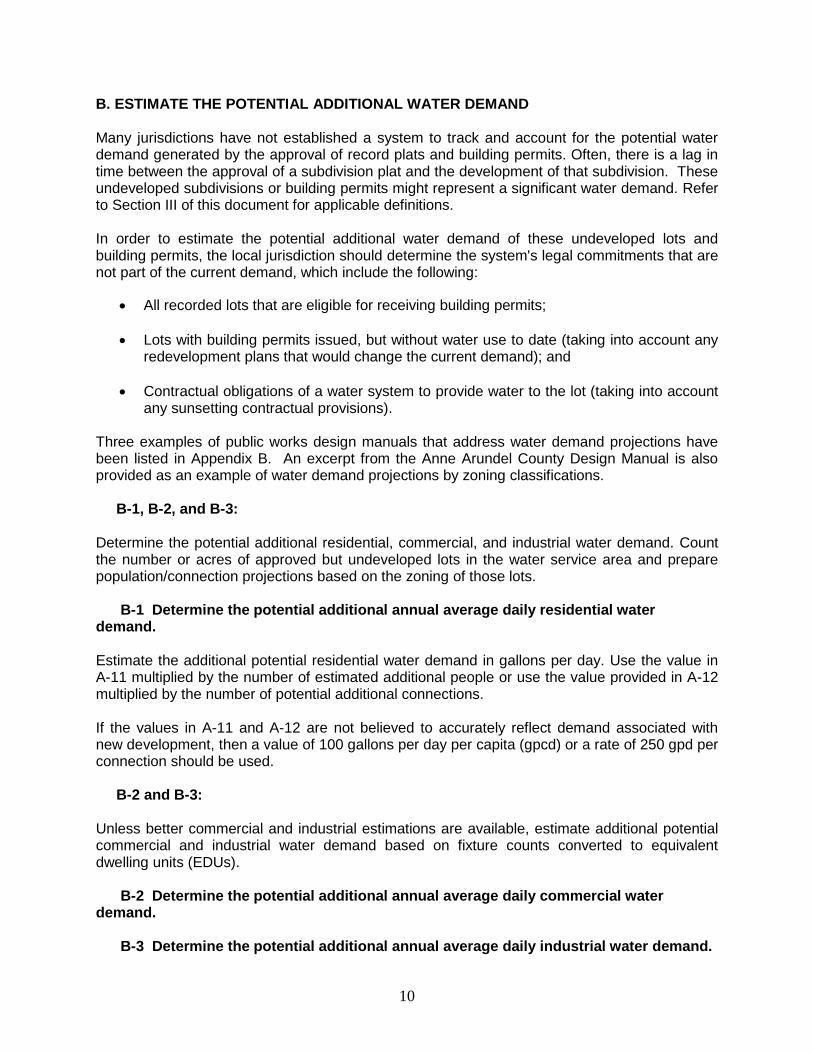
B. ESTIMATE THE POTENTIAL ADDITIONAL WATER DEMAND Many jurisdictions have not established a system to track and account for the potential water demand generated by the approval of record plats and building permits. Often, there is a lag in time between the approval of a subdivision plat and the development of that subdivision. These undeveloped subdivisions or building permits might represent a significant water demand. Refer to Section III of this document for applicable definitions. In order to estimate the potential additional water demand of these undeveloped lots and building permits, the local jurisdiction should determine the system's legal commitments that are not part of the current demand, which include the following:
• All recorded lots that are eligible for receiving building permits; • Lots with building permits issued, but without water use to date (taking into account any
redevelopment plans that would change the current demand); and • Contractual obligations of a water system to provide water to the lot (taking into account
any sunsetting contractual provisions). Three examples of public works design manuals that address water demand projections have been listed in Appendix B. An excerpt from the Anne Arundel County Design Manual is also provided as an example of water demand projections by zoning classifications. B-1, B-2, and B-3: Determine the potential additional residential, commercial, and industrial water demand. Count the number or acres of approved but undeveloped lots in the water service area and prepare population/connection projections based on the zoning of those lots. B-1 Determine the potential additional annual average daily residential water demand. Estimate the additional potential residential water demand in gallons per day. Use the value in A-11 multiplied by the number of estimated additional people or use the value provided in A-12 multiplied by the number of potential additional connections. If the values in A-11 and A-12 are not believed to accurately reflect demand associated with new development, then a value of 100 gallons per day per capita (gpcd) or a rate of 250 gpd per connection should be used. B-2 and B-3: Unless better commercial and industrial estimations are available, estimate additional potential commercial and industrial water demand based on fixture counts converted to equivalent dwelling units (EDUs). B-2 Determine the potential additional annual average daily commercial water demand. B-3 Determine the potential additional annual average daily industrial water demand.
11
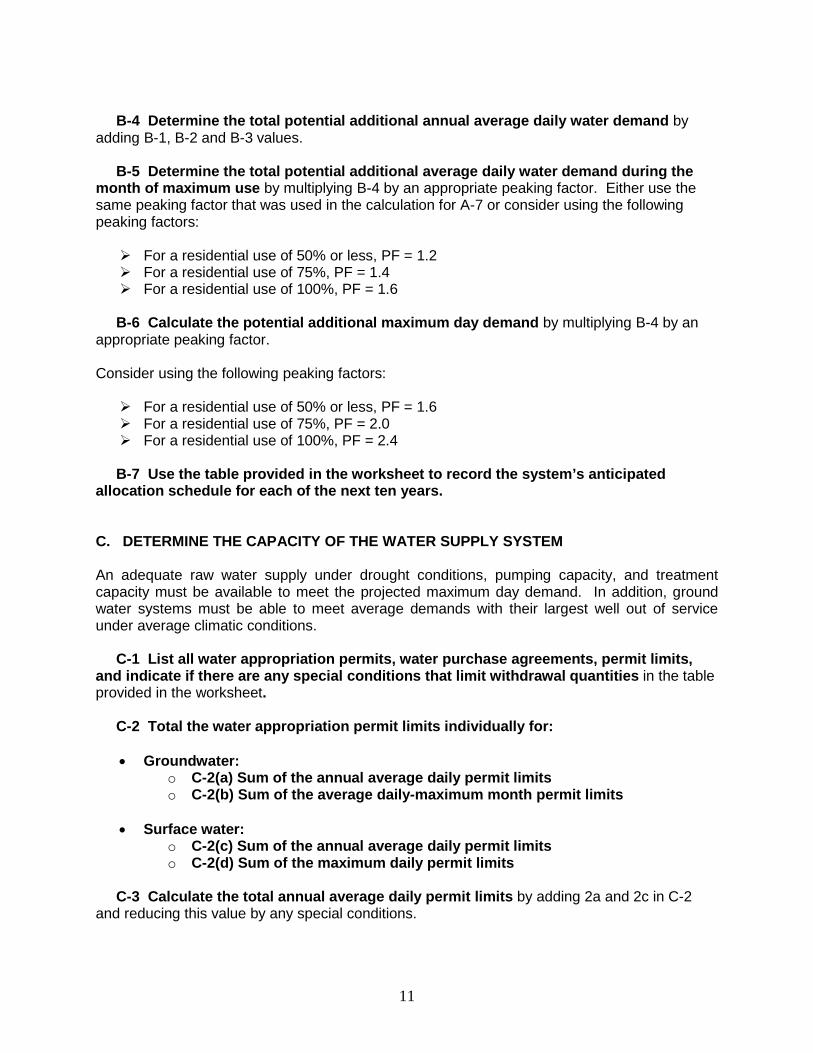
B-4 Determine the total potential additional annual average daily water demand by adding B-1, B-2 and B-3 values. B-5 Determine the total potential additional average daily water demand during the month of maximum use by multiplying B-4 by an appropriate peaking factor. Either use the same peaking factor that was used in the calculation for A-7 or consider using the following peaking factors: For a residential use of 50% or less, PF = 1.2 For a residential use of 75%, PF = 1.4 For a residential use of 100%, PF = 1.6
B-6 Calculate the potential additional maximum day demand by multiplying B-4 by an appropriate peaking factor. Consider using the following peaking factors:
For a residential use of 50% or less, PF = 1.6 For a residential use of 75%, PF = 2.0 For a residential use of 100%, PF = 2.4
B-7 Use the table provided in the worksheet to record the system’s anticipated allocation schedule for each of the next ten years. C. DETERMINE THE CAPACITY OF THE WATER SUPPLY SYSTEM An adequate raw water supply under drought conditions, pumping capacity, and treatment capacity must be available to meet the projected maximum day demand. In addition, ground water systems must be able to meet average demands with their largest well out of service under average climatic conditions. C-1 List all water appropriation permits, water purchase agreements, permit limits, and indicate if there are any special conditions that limit withdrawal quantities in the table provided in the worksheet. C-2 Total the water appropriation permit limits individually for:
• Groundwater: o C-2(a) Sum of the annual average daily permit limits o C-2(b) Sum of the average daily-maximum month permit limits
• Surface water:
o C-2(c) Sum of the annual average daily permit limits o C-2(d) Sum of the maximum daily permit limits
C-3 Calculate the total annual average daily permit limits by adding 2a and 2c in C-2 and reducing this value by any special conditions.
12
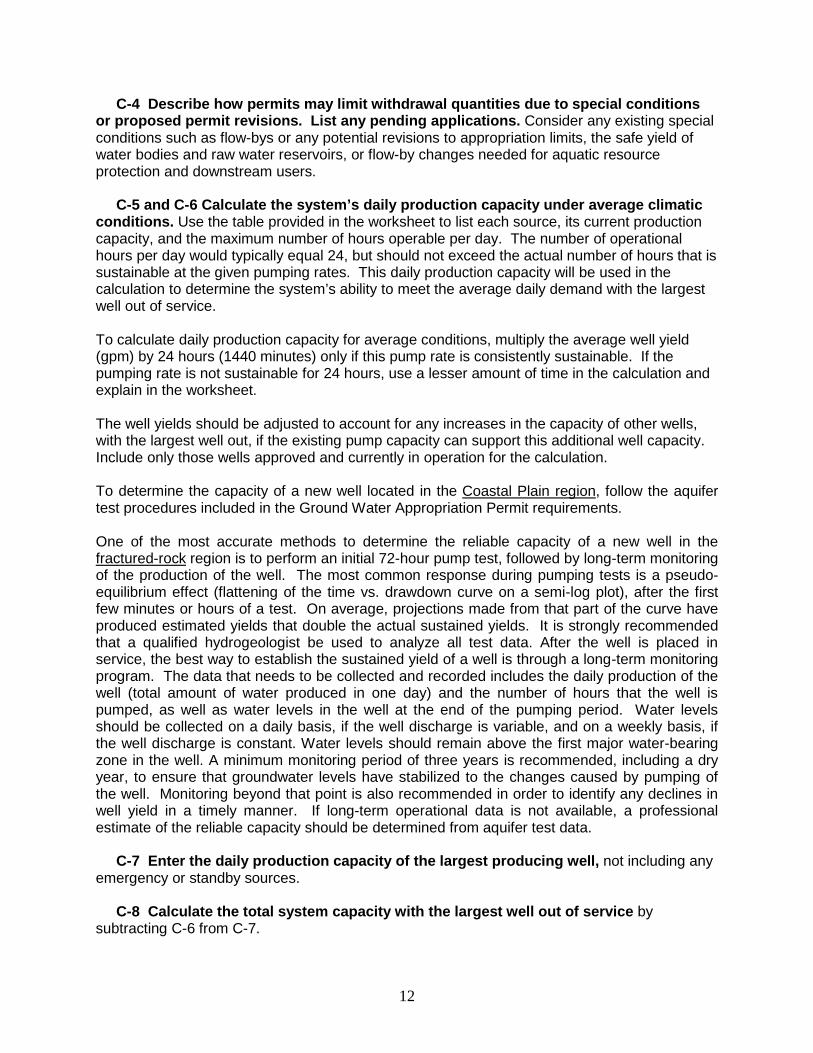
C-4 Describe how permits may limit withdrawal quantities due to special conditions or proposed permit revisions. List any pending applications. Consider any existing special conditions such as flow-bys or any potential revisions to appropriation limits, the safe yield of water bodies and raw water reservoirs, or flow-by changes needed for aquatic resource protection and downstream users. C-5 and C-6 Calculate the system’s daily production capacity under average climatic conditions. Use the table provided in the worksheet to list each source, its current production capacity, and the maximum number of hours operable per day. The number of operational hours per day would typically equal 24, but should not exceed the actual number of hours that is sustainable at the given pumping rates. This daily production capacity will be used in the calculation to determine the system’s ability to meet the average daily demand with the largest well out of service. To calculate daily production capacity for average conditions, multiply the average well yield (gpm) by 24 hours (1440 minutes) only if this pump rate is consistently sustainable. If the pumping rate is not sustainable for 24 hours, use a lesser amount of time in the calculation and explain in the worksheet. The well yields should be adjusted to account for any increases in the capacity of other wells, with the largest well out, if the existing pump capacity can support this additional well capacity. Include only those wells approved and currently in operation for the calculation. To determine the capacity of a new well located in the Coastal Plain region
, follow the aquifer test procedures included in the Ground Water Appropriation Permit requirements.
One of the most accurate methods to determine the reliable capacity of a new well in the fractured-rock
region is to perform an initial 72-hour pump test, followed by long-term monitoring of the production of the well. The most common response during pumping tests is a pseudo-equilibrium effect (flattening of the time vs. drawdown curve on a semi-log plot), after the first few minutes or hours of a test. On average, projections made from that part of the curve have produced estimated yields that double the actual sustained yields. It is strongly recommended that a qualified hydrogeologist be used to analyze all test data. After the well is placed in service, the best way to establish the sustained yield of a well is through a long-term monitoring program. The data that needs to be collected and recorded includes the daily production of the well (total amount of water produced in one day) and the number of hours that the well is pumped, as well as water levels in the well at the end of the pumping period. Water levels should be collected on a daily basis, if the well discharge is variable, and on a weekly basis, if the well discharge is constant. Water levels should remain above the first major water-bearing zone in the well. A minimum monitoring period of three years is recommended, including a dry year, to ensure that groundwater levels have stabilized to the changes caused by pumping of the well. Monitoring beyond that point is also recommended in order to identify any declines in well yield in a timely manner. If long-term operational data is not available, a professional estimate of the reliable capacity should be determined from aquifer test data.
C-7 Enter the daily production capacity of the largest producing well, not including any emergency or standby sources. C-8 Calculate the total system capacity with the largest well out of service by subtracting C-6 from C-7.

13
C-9 Determine the total reliable drought yield of the groundwater sources for the following conditions:
• C-9(a) During the month of maximum use. Enter the total reliable drought yield of the sources listed in C-5, assuming wells operate for 17 to 21 hours per day. State any assumptions in the worksheet.
• C-9(b) During peak day conditions. Enter the total reliable drought yield of all wells listed in C-5 assuming wells operate for 24 hours per day.
The calculated capacity should represent the ability of the all the sources, taking well interference into account. If pump capacity results in pumping water levels below top of screen or below major water bearing zones, then the allowable hours of pump operation must be reduced accordingly. For unconfined wells
, use production data for July through September of the most recent drought year, unless this data does not represent what the wells are capable of under drought conditions. Acquiring accurate data often necessitates communication with the system operator and knowledge of sustainable water levels. If the wells were operational for 17-21 hours during the most recent drought period, judgment is needed to determine whether this capacity is accurately reflective of the source drought capability.
Water levels in confined wells
are affected by increased use under drought conditions in heavy agricultural areas or in areas that experience significant increases in summer population, but are generally not otherwise affected by drought. Rates for wells in confined aquifers should be supported by recent operational records to reflect sustainable rates during peak pumping periods (typically summertime).
C-10 Enter the safe yield of the water system.
For surface water supplies
, determine the water availability during the drought of record from previous unrestricted water use or from a simulated by mass-flow analysis for sources with raw water storage. Permit flow-by conditions and identified back up sources will dictate safe yields of sources using simple intakes.
It may have been determined via mass flow analysis that the reliable yield is different than the permitted use. To document such a case, please use the following guidelines:
C-10(a) and (b) Determine the annual average safe yield of the reservoir system:
• C-10(a) If data is available, enter the calculated (pre-determined) annual average safe yield plus the value for C-8.
• C-10(b) Enter the annual average permit amount for the reservoir plus the value for C-8.
C-10(c) and (d) Determine the maximum month safe yield of the reservoir system:
• C-10(c) If data is available, enter the calculated (pre-determined) maximum month reliable safe yield plus plus the value for C-9(a).
14
• C-10(d) Enter the annual average permit amount for the reservoir multiplied by the PF used in A-7, then add the value for C-9(a).
C-11 Enter the total treatment capacity of the water treatment plant(s) for the number of hours in any day that the plant is available for producing water. C-12 Enter the pump capacity of the water treatment plant. Choose the lesser of either the sum of the well pumps or the high service pump. C-13 Enter the total storage capacity. C-14 Enter the maximum fire flow in hours and duration in gallons per minute. C-15 Enter the storage capacity for fire flow. C-16 Explain how the fire flow and storage values were determined. In what year were these values most recently evaluated? C-17 Discuss the frequency of power outages. C-18 Is there a backup power source for treatment and pumping? If yes, please describe. C-19 Enter the average day capacity for the wastewater treatment system in the service area. Is additional capacity available at the plant? Explain in the worksheet. The owner of the water supply system should also contact the appropriate wastewater treatment system to determine whether there are capacity limitations in the wastewater system. C-20 Are there anticipated future modifications to the appropriation permits? If yes, please explain.
D. ESTIMATE THE EXCESS WATER SUPPLY CAPACITY BY DETERMINING THE LIMITING FACTOR
In order to determine the capacity of the existing water supply system, the local jurisdiction or owner of the water supply system should evaluate the components of the water system to determine which component is the most limiting one. The total water system demand consists of the sum of the existing water demand and the potential additional water demand. This sum must be compared to the capacity of the water supply system, taking into account the most limiting factor. The difference between the capacity of the water system and the total demand (existing and potential demand) is the amount of excess water capacity that is available to allocate to new growth.
The capacity of the water supply system should be evaluated by determining the most limiting factor of the following:
• Treatment capacity;
• Pumping capacity;

15
• Distribution system requirements;
• Storage;
• Power supply;
• System losses and transfers; and
• Fire flow. (See Appendix A). Although MDE does not require that water supply facilities provide fire flow, it is important that the water system account for fire flows and fire storage.
PART I. ESTIMATE THE EXCESS WATER SUPPLY CAPACITY ABOVE EXISTING DEMAND D-1 Average Day Capacity Limitation Determine the average day capacity limitation by identifying the smallest (most limiting) value listed in C-3, C-8, C-10, C-11, and C-12. When entering the safe yield of the system, use the value from C-10(a) if it is available, otherwise, use the value in C-10(b). When determining the limiting factor (D-1) for systems that use a surface water source, consider only the values determined for C-3, C-10(a) or (b), C-11, and C-12 (not the well capacity with the largest well out (C-8)) as limiting factors. D-2 Excess Average Day Capacity Determine the excess average day capacity by subtracting A-4 from D-1. D-3 Average Daily-Maximum Month Capacity Limitation Determine the average daily-maximum month capacity limitation by identifying the smallest (most limiting) value listed in C-2(b), C-9(a) or C-10(c) or (d), C-11, and C-12.
When entering the reliable drought yield of the system during the month of maximum use, use the value from C-9(a) for systems relying only on groundwater or use the value from C-10(c) when there is also a surface water source. If sufficient data is not available to determine C-10(c), use C-10(d) in its place. If the system relies on surface water, do not consider C-2(b) (the total average daily-maximum month groundwater permit limits) to be a limiting factor.
D-4 Excess Average Daily-Maximum Month Capacity Determine the excess average daily-maximum month capacity by subtracting A-7 from D-3. D-5 Maximum Day Capacity Limitation Determine the maximum day capacity limitation by identifying the smallest (most limiting) value considering the water treatment capacity (C-11) and the pump capacity of the treatment plant (C-12) along with the following factors, depending on the system’s sources: For surface water systems that do not also utilize groundwater sources, consider the total maximum day surface water permit limits (C-2(d)) as a limiting factor.
16
For combined surface and groundwater systems, consider the combination of the total maximum day surface water permit limits (C-2(d)) added to the peak day groundwater drought capacity (C-9(b)) as a limiting factor. For groundwater systems that do not also utilize surface water sources, consider the peak day groundwater drought capacity (C-9(b)) as a limiting factor. D-6 Excess Maximum Day Capacity Determine the excess maximum day capacity by subtracting A-9 from D-5. PART II. ESTIMATE THE EXCESS WATER SUPPLY CAPACITY AVAILABLE FOR FUTURE ALLOCATION D-7 Excess Annual Average Daily Capacity Determine the excess annual average daily capacity by subtracting B-4 from D-2. D-8 Excess Average Daily Capacity During Maximum Month Determine the excess average daily capacity during maximum month by subtracting B-5 from D-4. D-9 Excess Maximum Day Capacity Determine the excess maximum day capacity by subtracting B-6 from D-6. E. CONTROL THE ALLOCATION OF NEW CONNECTIONS TO THE WATER SUPPLY SYSTEM
Some jurisdictions have enacted Adequate Public Facilities Ordinances (APFOs) that establish a process to ensure that development approvals do not surpass the available infrastructure in that jurisdiction. These jurisdictions should submit copies of their APFO regulations to MDE as well as copies of their periodic tracking reports concerning the allocation of water supply capacity required by the APFOs. For those jurisdictions that have not enacted an APFO, it is necessary to develop a control and accounting system to manage the allocation of water supply capacity. These jurisdictions should develop and submit descriptions of their allocation systems to MDE for review as well as copies of their periodic tracking reports concerning the allocation of water supply capacity. It is recommended that all jurisdictions include the following steps in their allocation procedures: 1) Check the adequacy of the water supply several times in the development approval
process; 2) Require Public Works Agreements and bonds before final development approval; 3) Require plat restrictions to prevent property transfers until the connections to the water
system are provided; 4) Provide an initial allocation of water system capacity for a fixed period of time
(e.g. two years) and reclaim the allocation if it is not used in that time period; and 5) For proposed development dependent on a new well in the fractured rock areas of
Central and Western Maryland, allocate 50% of the proposed building permits initially

17
and phase the remainder of the building permits as supported by the monitoring of the well. (See page 13 - Determining the Capacity of a New Well).
The attached worksheet has information for completing this section. VI. Cover Letter A cover letter should be submitted with the CMP that summarizes any significant findings of the plan and identifies proposed measures to address them.

18
APPENDICES
APPENDIX A: REFERENCES FOR FIRE FLOW AND FIRE STORAGEExample: Frederick County Water Storage Requirements Example: Frederick County Fire Hydrant Design Flow
Rates
APPENDIX B: REFERENCES FOR WATER DEMAND PROJECTIONSExample: Anne Arundel County - Basis for Residential
Water Demand Projections for Undeveloped or Partially Developed Areas by Zoning
APPENDIX C: WATER SUPPLY CAPACITY MANAGEMENT PLANS -
WORKSHEETS AND SUMMARY

19
(This page is intentionally blank)
20
APPENDIX A: FIRE FLOW AND FIRE STORAGE For small water systems, the demand for fire flow is a significant component of total water
demand and often creates a need for significant water storage. The requirements to provide fire
flow are usually established by local building codes. Although MDE does not have oversight of
fire flow requirements, it is important to account for that portion of the water demand that is
necessary for fire flow.
Examples of manuals for the design of water facilities that address fire flow requirements and a
guide for the determination of needed fire flow are provided below. Please reference the latest
versions of these manuals. Two excerpts from the Frederick County Design Manual are also
provided in order to illustrate the storage requirements for fire flow as well as the required flow
rates for fire hydrants. It is incumbent on local governments and other owners of community water systems to utilize professional engineers in the design and evaluation of their water systems. Design Manual
, Anne Arundel County Department of Public Works. http://www.aacounty.org/DPW/Engineering/DesignManual.cfm )
Design Manual for Water and Sewer Facilities
http://www.co.frederick.md.us/WastePlan/engineering.htm )
, Frederick County Division of Utilities and Solid Waste Management.
Howard County Design Manual Volume II: Water and Sewer
(http://www.co.ho.md.us/DPW/Engineering_Homepage.htm )
, Howard County Department of Public Works.
Guide for Determination of Needed Fire Flow(http://www.isomitigation.com/downloads/ppc3001.pdf )
, ISO.
Recommended Standards for Water WorksGreat Lakes – Upper Mississippi River Board of State and Provincial Public Health and
(“Ten-State Standards”),
Environmental Managers. (www.hes.org)

21
EXAMPLE
FREDERICK COUNTY
WATER STORAGE REQUIREMENTS Required Fire Flow Total Fire Flow Duration Storage Storage
Population (gpm) (hours) (gallons) (gallons) .1,000 1,500 4 360,000 432,000 1,500 1,500 5 450,000 540,000 2,000 1,500 6 540,000 648,000 3,000 1,750 7 735,000 882,000 4,000 2,000 8 960,000 1,152,000 5,000 2,250 9 1,215,000 1,458,000 6,000 2,500 10 1,500,000 1,800,000
10,000 3,000 10 1,800,000 2,160,000 13,000 3,500 10 2,100,000 2,520,000 17,000 4,000 10 2,400,000 2,880,000 22,000 4,500 10 2,700,000 3,240,000 27,000 5,000 10 3,000,000 3,600,000 33,000 5,500 10 3,300,000 3,960,000 40,000 6,000 10 3,600,000 4,320,000 55,000 7,000 10 4,200,000 5,040,000 75,000 8,000 10 4,800,000 5,760,000 95,000 9,000 10 5,400,000 6,480,000
120,000 10,000 10 6,000,000 7,200,000 150,000 11,000 10 6,600,000 7,920,000 200,000 12,000 10 7,200,000 8,640,000
Source: Page C-121, Design Manual for Water and Sewer Facilities
, Frederick County Division of Utilities and Solid Waste Management, 1994.
MDE Note: This table is an example of typical storage requirements. However, if there is
significant fluctuation in water use due to a high proportion of commercial and industrial use, this table might not be appropriate. It is incumbent on local governments and other owners of community water systems to utilize professional engineers in the design and evaluation of their water systems.

22
EXAMPLE
FREDERICK COUNTY
FIRE HYDRANT DESIGN FLOW RATES
USE FLOW RATE (gpm) Residential (one and two-family) 1,000 Residential (multi-family) 1,250 Commercial 1,500 Industrial 1,500 Educational / Institutional 1,500 Notes: 1. Flow rates are to be accommodated with a minimum pressure of 20 psi in the main. 2. Fire flow rates are to be combined with maximum daily rates of flow in the distribution
network. 3. The storage tanks in the system shall be considered at their minimum elevation when
determining the fire flow residual pressure. 4. These flow rates are to be used in the design of public water mains, whether developer or
County funded. The use of a property may require a higher flow rate that is to be accommodated by on-site storage.
Source: Page C-122, Design Manual for Water and Sewer Facilities, Frederick County
Division of Utilities and Solid Waste Management, 1994.

23
(This page is intentionally blank)

24
APPENDIX B: WATER DEMAND PROJECTIONS Examples of manuals for the design of water facilities that address water demand projections are provided below. An excerpt from the Anne Arundel County Design Manual is also provided as an example of water demand projections by zoning classifications. It is incumbent on local governments and other owners of community water systems to utilize professional engineers in the design and evaluation of their water systems. Design Manual(http://www.aacounty.org/DPW/Engineering/DesignManual.cfm)
, Anne Arundel County Department of Public Works, 2001.
Design Manual for Water and Sewer Facilities
(http://www.co.frederick.md.us/WastePlan/engineering.htm)
, Frederick County Division of Utilities and Solid Waste Management, 1994.
Howard County Design Manual Volume II: Water and Sewer
(http://www.co.ho.md.us/DPW/Engineering_Homepage.htm)
, Howard County Department of Public Works, 2003.

25
EXAMPLE
BASIS FOR RESIDENTIAL WATER DEMAND PROJECTIONS FOR UNDEVELOPED OR PARTIALLY DEVELOPED AREAS
BY ZONING
PROJ. PROJ. PROJECTED MAX. MAX. MAX. POP. DWELLING AVG. FLOW DAY DAY HR. ZONING PER UNITS PER PER ACRE PEAKING DEMAND PEAKING ACRE ACRE @ 100 GPCD FACTOR GPD/DU FACTOR LOW
DENSITY RA 0.54 0.14 54 2.7 --- 3.8 RLD 0.54 0.16 54 2.7 --- 3.8 R1 2.59 0.96 259 2.7 729 3.8 R2 4.71 1.74 471 2.7 731 3.8 MEDIUM
DENSITY R5 8.96 3.43 896 2.4 627 3.5 R10 18.81 7.5 1881 2.4 602 3.5 HIGH
DENSITY R15 25.88 12 2588 1.9 410 3.3 TC 21.66 12 2166 1.9 343 3.3 APT. R22 30.68 17 3068 1.6 289 3.1 R44 61.37 34 6137 1.6 289 3.1
Source: Appendix C of Chapter IX, Design Manual
, Anne Arundel County Department of Public Works, 2001.
26
APPENDIX C: WATER SUPPLY
CAPACITY MANAGEMENT PLANS
Worksheets and Summary
These simplified worksheets are included to aid in the capacity evaluation of a small water supply system. If your water supply system has a complex arrangement, please call MDE’s Water Supply Program at 410-537-3702 for assistance in completing the capacity evaluation for your system. In order to determine the existing water demand, local governments or owners of water supply systems should review the operational records of their water systems for at least the five previous years. If records are not available, estimation methods that are provided herein may be used. It is incumbent on local governments and other owners of community water systems to utilize professional engineers and hydrogeologists in the design and evaluation of their water supply systems.
MARYLAND DEPARTMENT OF THE ENVIRONMENT
WATER MANAGEMENT ADMINISTRATION 1800 WASHINGTON BOULEVARD
BALTIMORE, MD 21230