The relation between martensitic phase transformation and ...

Martensitic Transformation during Fatigue Testing of an AISI 301LN Stainless Steel
This article has been downloaded from IOPscience. Please scroll down to see the full text article.
2012 IOP Conf. Ser.: Mater. Sci. Eng. 31 012010
(http://iopscience.iop.org/1757-899X/31/1/012010)
Download details:
IP Address: 147.83.132.21
The article was downloaded on 22/10/2012 at 11:39
Please note that terms and conditions apply.
View the table of contents for this issue, or go to the journal homepage for more
Home Search Collections Journals About Contact us My IOPscience

Martensitic Transformation during Fatigue Testing of an AISI 301LN Stainless Steel
A Mateo1, G Fargas and A Zapata CIEFMA, Departament de Ciència dels Materials i Enginyeria Metal·lúrgica Universitat Politècnica de Catalunya, Avda Diagonal 647, 08028 Barcelona, Spain E-mail: [email protected] Abstract. The plastic deformation accumulated during fatigue testing can induce the transformation of austenite to martensite in metastable austenitic stainless steels. To analyze this issue, a metastable austenitic stainless steel grade AISI 301 LN was studied in two different conditions, i.e. annealed and cold rolled. In the first case, the steel was fully austenitic, whereas cold rolled material had almost 30% of martensite. High cycle fatigue tests at a stress ratio of 0.8 were carried out on flat specimens from both steel conditions. Several characterization techniques, including optical microscopy, X-ray diffraction (XRD) and electron back scattered diffraction (EBSD), were used to detect and quantify the martensite induced by the cyclic deformation.
1. Introduction Metastable stainless steels are currently used in applications where severe forming operations are required due to their high corrosion resistance combined with versatile mechanical properties [1]. In the annealed state, these steels have a totally austenitic microstructure which confers them an excellent ductility although limited strength. Cold deformation generates strain-induced martensite, in addition to ordinary strain hardening of austenite, resulting in a drastic improvement of yield stress but ductility is consequently decreased [2-6].
Two types of martensite can be induced by plastic deformation: hexagonal-close-packed (ε) and body-center-cubic (α’) [7]. Previous studies [2, 3] found that ε-martensite was formed at the beginning of deformation but its volume fraction decreases to almost zero at 20% of plastic strain. On the other hand, α’-martensite increases continuously and at high strain values becomes the only type of martensite present in the steel.
Studies on the fatigue response of metastable stainless steels reported different behaviors depending on the testing conditions [8-12]. The formation of martensite during deformation is known to be harmful in the low cycle fatigue (LCF) regime, i.e. under strain-control, while a small amount of martensite can be beneficial in the high cycle fatigue (HCF) regime, i.e. tests under load-control. Concerning fatigue crack growth (FCG), Chanani and Antolovich [8] concluded that martensite retards crack propagation.
In a previous paper presented by the authors to the last EEIGM International Conference [13], the possibility of improving the fatigue life of an austenitic stainless steel by inducing martensitic transformation via torsion testing was investigated. Continuing with this order of ideas, the present
1 To whom any correspondence should be addressed
6th EEIGM International Conference on Advanced Materials Research IOP PublishingIOP Conf. Series: Materials Science and Engineering 31 (2012) 012010 doi:10.1088/1757-899X/31/1/012010
Published under licence by IOP Publishing Ltd 1
investigation was undertaken with aim of comparing the HCF performance of a metastable austenitic stainless steel under two different initial conditions: annealed and cold rolled.
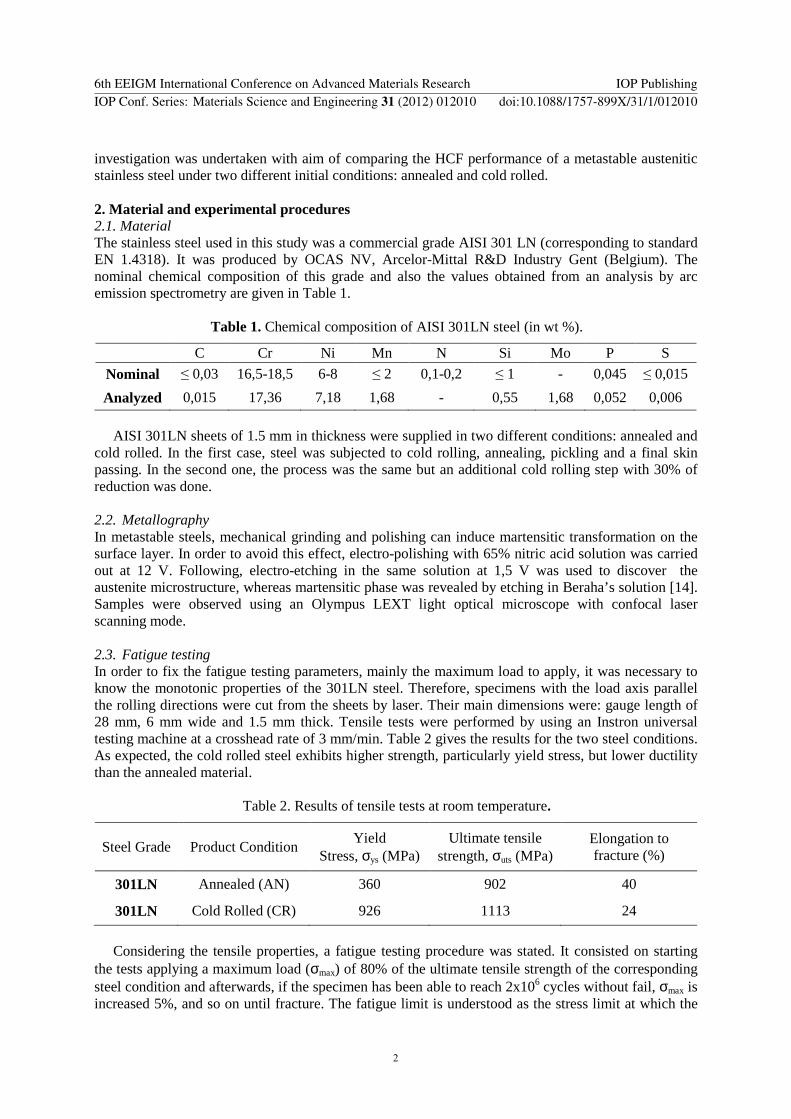
2. Material and experimental procedures 2.1. Material The stainless steel used in this study was a commercial grade AISI 301 LN (corresponding to standard EN 1.4318). It was produced by OCAS NV, Arcelor-Mittal R&D Industry Gent (Belgium). The nominal chemical composition of this grade and also the values obtained from an analysis by arc emission spectrometry are given in Table 1.
Table 1. Chemical composition of AISI 301LN steel (in wt %).
C Cr Ni Mn N Si Mo P S Nominal ≤ 0,03 16,5-18,5 6-8 ≤ 2 0,1-0,2 ≤ 1 - 0,045 ≤ 0,015
Analyzed 0,015 17,36 7,18 1,68 - 0,55 1,68 0,052 0,006
AISI 301LN sheets of 1.5 mm in thickness were supplied in two different conditions: annealed and cold rolled. In the first case, steel was subjected to cold rolling, annealing, pickling and a final skin passing. In the second one, the process was the same but an additional cold rolling step with 30% of reduction was done.
2.2. Metallography In metastable steels, mechanical grinding and polishing can induce martensitic transformation on the surface layer. In order to avoid this effect, electro-polishing with 65% nitric acid solution was carried out at 12 V. Following, electro-etching in the same solution at 1,5 V was used to discover the austenite microstructure, whereas martensitic phase was revealed by etching in Beraha’s solution [14]. Samples were observed using an Olympus LEXT light optical microscope with confocal laser scanning mode. 2.3. Fatigue testing In order to fix the fatigue testing parameters, mainly the maximum load to apply, it was necessary to know the monotonic properties of the 301LN steel. Therefore, specimens with the load axis parallel the rolling directions were cut from the sheets by laser. Their main dimensions were: gauge length of 28 mm, 6 mm wide and 1.5 mm thick. Tensile tests were performed by using an Instron universal testing machine at a crosshead rate of 3 mm/min. Table 2 gives the results for the two steel conditions. As expected, the cold rolled steel exhibits higher strength, particularly yield stress, but lower ductility than the annealed material.
Table 2. Results of tensile tests at room temperature.
Steel Grade Product Condition Yield
Stress, σys (MPa) Ultimate tensile
strength, σuts (MPa) Elongation to fracture (%)
301LN Annealed (AN) 360 902 40
301LN Cold Rolled (CR) 926 1113 24
Considering the tensile properties, a fatigue testing procedure was stated. It consisted on starting
the tests applying a maximum load (σmax) of 80% of the ultimate tensile strength of the corresponding steel condition and afterwards, if the specimen has been able to reach 2x10⁶ cycles without fail, σmax is increased 5%, and so on until fracture. The fatigue limit is understood as the stress limit at which the
6th EEIGM International Conference on Advanced Materials Research IOP PublishingIOP Conf. Series: Materials Science and Engineering 31 (2012) 012010 doi:10.1088/1757-899X/31/1/012010
2

material can be cycled for a sufficiently high number of cycles (usually more than 106 cycles) without fracture. In the present case, fatigue limit was considered as the highest stress level at which a specimen did not fail after 2x10⁶ cycles.
Flat fatigue specimens with hour-glass shape (3.8 mm wide and 1.5 mm thick) were laser machined from the steel sheets. Their load axis coincided with the rolling direction, as in the case of tensile specimens. Tests were conducted under load control in a resonant testing machine Rumul Mikroton, working at frequencies around 150 Hz. The imposed stress ratio (R= σmin/σmax) was 0.8. This value was chosen based on previous investigations carried out by the authors that demonstrated a more significant effect of strain induced martensite for elevated stress ratios [13].
After determining the fatigue limit for each steel condition, values under those limits were chosen in order to perform tests without reaching fracture to analyze the martensite formation during cyclic loading. These tests were stopped after 106 and 3x10⁶ cycles and subsequently the specimens were examined by optical microscopy, XRD and EBSD techniques.
2.4. Diffraction methods 2.4.1. X-ray diffraction. X-ray diffraction measurements were performed by using Copper radiation on a Brucker D8 Advance equipment. Determination of martensite content was carried out by the method corresponding to reference intensity ratio (RIR) (ASTM E975-03 [15]). This method allows determining the mass fractions of austenite and martensite by using Equation (1).
reference
reference
observed
observed
I
I
I
I
RIR
RIR
X
X
,'
,
,
,'
'
'
α
γ
γ
α
α
γ
γ
α ××= (1)
Where “Xα’” and “Xγ” are the mass fractions of α’ -martensite and γ-austenite, respectively; “RIRγ”
and “RIRα’” are their respective reference intensity ratios; “Iobserved” and “Ireference” are the observed and the reference intensities [16].
2.4.2. Electron back scattered diffraction. EBSD scans were performed in a JSM-7001F field emission scanning electron microscope (FESEM) equipped with Channel 5 system (HKL Technology), operating at 20 kV with samples tilted 70 degrees. Before EBSD observations, samples were mechanically and electrolytically polished. Also, after fatigue testing all specimens were again electrolytically polished to reduce its surface roughness which hindered the analysis. 3. Results The fatigue limits obtained following the testing procedure described in subsection 2.3 are given in Table 3. Both maximum load (σmax) and stress amplitude (∆σ/2) are indicated. Fatigue sensitivity, defined as the ratio between σf,max and σuts, is higher than 1 for both material conditions. This means that the steel is able to resist more than one million of cycles despite values higher than its monotonic resistance are reached on each fatigue cycle.
Table 3. Fatigue limits of annealed and cold rolled 301LN steel.
Steel Fatigue Limit, σf,max (MPa)
Fatigue Limit, ∆σ/2 (MPa)
Fatigue Sensitivity, σmax /σuts
AN 969 97 1.07
CR 1197 120 1.08
6th EEIGM International Conference on Advanced Materials Research IOP PublishingIOP Conf. Series: Materials Science and Engineering 31 (2012) 012010 doi:10.1088/1757-899X/31/1/012010
3

Considering the fatigue limits reported in Table 3, the maximum stress values chosen in order to perform tests without reaching fracture were σmax = 720 MPa for annealed steel and 1100 MPa for cold rolled material.
A quite homogeneous microstructure composed of equiaxial austenitic grains (average grain size of 7 µm) with typical annealing twins is observed in Figure 1(a), corresponding to annealed 301LN. Figure 1(c) belongs to the same condition but etched with Beraha’s reagent trying to reveal the presence of martensite, nevertheless almost nothing of this phase is appreciated.
Figure 1(b) shows that after cold rolling the austenitic microstructure had almost not changed. On the other hand, selective etching (Figure 1(d)) revealed a significant proportion of martensite. However, classical light microscope did not allow distinguishing between martensite lathes, slip lines and deformation twins, and therefore it was not possible to quantify the martensite volume fraction by image analysis.
Figure 1. Optical micrographs of AISI 301LN stainless steel in: (a) annealed condition; (b) cold rolled condition; (c) annealed condition with Beraha’s etch to reveal martensite; (d) cold rolled condition with Beraha’s etch to reveal martensite.
Figure 2 (a) and (b) compare the X-ray spectra of AISI 301LN stainless steel in both initial
conditions and also after fatigue testing during 106 cycles. Before cyclic loading, and in agreement with the optical microscopy observations, the annealed steel exhibited a totally austenitic spectrum each spectrum, without peaks associated neither with α’-martensite nor with ε-martensite. The cold rolling condition exhibits, together with austenite peaks, α´-martensite ones corresponding to the phase transformation induced by this forming operation. The proportion of martensite was quantified as 28%.
After fatigue testing, in the spectra corresponding to annealed steel new peaks appeared that were indexed as α´-martensite. Calculations of this phase content gave 44% after 106 cycles and this value increased up to 50% after 3x10⁶ cycles. Concurrently, Figure 2 (b) shows an increase of martensite peaks intensities (mainly in {211} α’ peak) for cold rolled steel after being subjected to fatigue. The
15 µµµµm
15 µµµµm
15 µµµµm
15 µµµµm
(a) (b)
(c) (d)
6th EEIGM International Conference on Advanced Materials Research IOP PublishingIOP Conf. Series: Materials Science and Engineering 31 (2012) 012010 doi:10.1088/1757-899X/31/1/012010
4

initial value of 28% augmented up to 57% and this martensite content remained constant for 1 and 3 millions of fatigue cycles.
Figure 2. XRD spectra of AISI 301LN stainless steel in (a) annealed and (b) cold rolled conditions, before and after fatigue testing during 106 cycles.
Figure 3a shows the EBSD maps of α’-martensite phase corresponding to the annealed steel after
106 cycles. In contrast to optical microscopy, EBSD allows to characterize the present phases. Accordingly, grey areas are γ phase, red lines indicate the twins and the coloured zones are martensite. Figure 3b presents magnifications of selected zones of Figure 3a, to evidence that α’-martensite preferentially nucleates at the austenitic grain boundaries or in connexion with the twins, but also appears covering entire grains. The orientation of martensite variants is in accordance with the colours legend in Figure 3b4. The predominant texture corresponds to direction <111> by the great number of blue and violet grains.
One advantage of EBSD technique is that it gives local information. The local misorientation
component indicates small orientation changes on the map, highlighting the region of higher
40 60 80 100
γ
α' α'
γ
γ
γ
2θθθθ
γ
γ
γα'
γ
1 mc
Inte
nsit
y (a
rbit
rary
)
{111}
{110}{200} {200}
{211}
{220}
{311}
AC40 60 80 100
α' γ
γ
γα'γ
2θθθθ
α'
α'
γ
γ
γα'γ
α'
Inte
nsit
y (a
rbit
rary
)
{311}
{211}
{220}
{200}{200}
{111} {110}
1 mc
CR
=20 µm; Map14; Step=0.2 µm; Grid600x600
20 µµµµm
Figure 3. EBSD orientation map of (a) α’ -martensite phase in the annealed condition after fatigue tested at 1×10⁶ cycles. (b1-3) Grains zoom and (b4) color legend.
(a) (b)
(3)
(2)
(4)
(1)
(a) (b)
N
After fatigue
After fatigue
6th EEIGM International Conference on Advanced Materials Research IOP PublishingIOP Conf. Series: Materials Science and Engineering 31 (2012) 012010 doi:10.1088/1757-899X/31/1/012010
5

deformation. The component calculates the average misorientation between every pixel and its surrounding pixels, and assigns the mean value to that pixel. Figure 4a shows a local misorientation map of austenite in the annealed steel. The homogeneous shade indicates a small misorientation between the different grains and fully austenitic microstructure. As the steel is subjected to deformation, either on cold rolling or during fatigue testing, austenite grains rotate and misorientation angle increases, as plotted in Figure 4b.
0
1
2
3
4
01
23
45
1 mcAN
AN
CR1 mc
Fre
quen
cy
Local m
isorie
ntation
average angle (º)CR
Figure 4. (a) Misorientation map of γ-austenite phase in the annealed condition and (b) histograms of γ-austenite phase for each steel.
4. Conclusions Specimens of metastable austenitic stainless steel AISI 301 LN in two different initial conditions, i.e. annealed and cold rolled, were subjected to high cycle fatigue tests at a stress ratio of 0.8 in order to establish the fatigue limits. In both cases, the determined fatigue limits (in terms of σmax) were higher than the respective ultimate tensile strengths. This surprising fact is due to the gradual microstructural evolution during fatigue testing due to the formation of strain-induced martensite from the original austenite. XRD analysis revealed the presence of only one type of martensite, i.e. α’-martensite, whereas EBSD images showed that preferential sites for α’ nucleation were twins and grain boundaries.
In addition, some tests were performed at cyclic conditions in the stress range below the fatigue limit. Annealed steel was initially fully austenitic, but its capability to be plastically deformed locally, even at stresses well below the fatigue limit, activated the austenite to martensite transformation. The amount of martensite measured by XRD arrived to 50%.
Cold rolled steel had 28% of α’-martensite induced by the rolling process. After cyclic loading below the fatigue limit, it seems that the martensite content reached a saturation level of 57%.
Further investigations are in progress in order to establish if there is a critical amount of martensite to enhance fatigue resistance. 5. References [1] Lamb S 2001 CASTI Publishing Inc. (Canada-ASM International) 473p [2] Mangonon P L and Thomas G 1970 Metall. Trans. 1 1587-94 [3] Seetharaman V and Krishnan 1981 R J. Mater. Sc. 16 523 [4] Tavares S S M, Fruchart D and Miraglia S A 2000 J. All. Comp. 307 311-17.
=20 µm; Map1; Step=0,2 µm; Grid600x600
20 µµµµm
(a) (b)
6th EEIGM International Conference on Advanced Materials Research IOP PublishingIOP Conf. Series: Materials Science and Engineering 31 (2012) 012010 doi:10.1088/1757-899X/31/1/012010
6

[5] Hedström P 2007 Deformation induced martensitic transformation of metastable stainless steel AISI 301 Licentiate Thesis (Luleå-Sweden) 89p
[6] Mertinger V Nagy E, Tranta F and Sólyom J 2008 Mater. Sc. Eng. A A481-A482 718-22 [7] Gey N, Petit B and Humbert M 2005 Metall. Mater. Trans. A 36A 3291-99 [8] Chanani G R, Antolovich S D and Gerberich W W 1972 Metall. Trans. 3 2661-72 [9] Baudry G and Pineau A 1977 Mater. Sc. Eng. 28 229-42 [10] Bathias C and Pelloux R M 1973 Metall. Mater. Trans. B 4 1265-73 [11] Stolarz J, Baffie N and Magnin T 2001 Mater. Sc. Eng. A A319-A321 521-6 [12] Topic M, Tait R B and Allen C 2007 Internal. J. Fatig. 29 656-65 [13] Fargas G, Zapata A, Anglada M and Mateo A 2009 IOP Conf. Ser.: Mater. Sci. Eng. 5 012008 [14] Vander Voort G F 1999 Metallography: principles and practice / George F. Vander Voort
(Ohio-ASM International) p 557 [15] ASTM E 975-03. Standard Practice for X-Ray Determination of Retained Austenite in Steel with
Near Random Crystallographic Orientation. ASTM Internacional, 2003. [16] Beese A M 2008 Quantification of Phase Transformation in Stainless Steel 301LN Sheets M. Sc.
Thesis (Massachusetts-United State) 107p
Acknowlegment This work was carried out in the frame of the research project MAT09-14461 (Ministerio de Ciencia e Innovación). Authors acknowledge the support from the Agència de Gestió d’Ajuts Universitaris I de Recerca (AGAUR). A.Z. thanks FI-DGR for her fellowship. OCAS NV, ArcelorMittal R&D Industry Gent (Belgium) is recognized for supplying the AISI 301LN sheets.
6th EEIGM International Conference on Advanced Materials Research IOP PublishingIOP Conf. Series: Materials Science and Engineering 31 (2012) 012010 doi:10.1088/1757-899X/31/1/012010
7