Mars Science Laboratory: Entry, Descent, and Landing ... · Mars Science Laboratory: Entry,...
39
IEEE Aerospace Conference Big Sky, MT March 3-10, 2006 Paper Number: 1467 Track: Space Missions and Architectures Session: System and Technology Challenges for Landing on the Earth, Moon, and Mars Mars Science Laboratory: Entry, Descent, and Landing System Performance David W. Way Richard W. Powell Allen Chen* Adam D. Steltzner* A. Miguel San Martin* P. Daniel Burkhart* Gavin F. Mendeck** NASA Langley Research Center Hampton, VA 757-864-8149 [email protected] *NASA Jet Propulsion Laboratory, CA **NASA Johnson Space Flight Center, Houston, TX Abstract—In 2010, the Mars Science Laboratory (MSL) mission will pioneer the next generation of robotic Entry, Descent, and Landing (EDL) systems, by delivering the largest and most capable rover to date to the surface of Mars. To do so, MSL will fly a guided lifting entry at a lift-to-drag ratio in excess of that ever flown at Mars, deploy the largest parachute ever at Mars, and perform a novel Sky Crane maneuver. Through improved altitude capability, increased latitude coverage, and more accurate payload delivery, MSL is allowing the science community to consider the exploration of previously inaccessible regions of the planet. The MSL EDL system is a new EDL architecture based on Viking heritage technologies and designed to meet the challenges of landing increasing massive payloads on Mars. In accordance with level-1 requirements, the MSL EDL system is being designed to land an 850 kg rover to altitudes as high as 1 km above the Mars Orbiter Laser Altimeter defined areoid within 10 km of the desired landing site. Accordingly, MSL will enter the largest entry mass, fly the largest 70 degree sphere-cone aeroshell, generate the largest hypersonic lift-to-drag ratio, and deploy the largest Disk-Gap-Band supersonic parachute of any previous mission to Mars. Major EDL events include a hypersonic guided entry, supersonic parachute deploy and inflation, subsonic heatshield jettison, terminal descent sensor acquisition, powered descent initiation, sky crane terminal descent, rover touchdown detection, and descent stage flyaway. Key performance metrics, derived from level-1 requirements and tracked by the EDL design team to indicate performance capability and timeline margins, include altitude and range at parachute deploy, time on radar, and propellant use. The MSL EDL system, which will continue to develop over the next three years, will enable a notable extension in the advancement of Mars surface science by delivering more science capability than ever before to the surface of Mars. This paper describes the current MSL EDL system performance as predicted by end-to-end EDL simulations, highlights the sensitivity of this baseline performance to several key https://ntrs.nasa.gov/search.jsp?R=20090007730 2018-06-17T15:27:58+00:00Z
Transcript of Mars Science Laboratory: Entry, Descent, and Landing ... · Mars Science Laboratory: Entry,...

IEEE Aerospace Conference Big Sky, MT March 3-10, 2006 Paper Number: 1467 Track: Space Missions and Architectures Session: System and Technology Challenges for Landing on the Earth, Moon, and Mars
Mars Science Laboratory: Entry, Descent, and Landing System Performance
David W. Way
Richard W. Powell Allen Chen*
Adam D. Steltzner* A. Miguel San Martin*
P. Daniel Burkhart* Gavin F. Mendeck**
NASA Langley Research Center
Hampton, VA 757-864-8149
*NASA Jet Propulsion Laboratory, CA **NASA Johnson Space Flight Center, Houston, TX
Abstract—In 2010, the Mars Science Laboratory (MSL) mission will pioneer the next generation of robotic Entry, Descent, and Landing (EDL) systems, by delivering the largest and most capable rover to date to the surface of Mars. To do so, MSL will fly a guided lifting entry at a lift-to-drag ratio in excess of that ever flown at Mars, deploy the largest parachute ever at Mars, and perform a novel Sky Crane maneuver. Through improved altitude capability, increased latitude coverage, and more accurate payload delivery, MSL is allowing the science community to consider the exploration of previously inaccessible regions of the planet.
The MSL EDL system is a new EDL architecture based on Viking heritage technologies and designed to meet the challenges of landing increasing massive payloads on Mars. In accordance with level-1 requirements, the MSL EDL system is being designed to land an 850 kg rover to altitudes as high as 1 km above the Mars Orbiter Laser Altimeter defined areoid within 10 km of the desired landing site. Accordingly, MSL will enter the largest entry mass, fly the largest 70 degree sphere-cone aeroshell, generate the largest hypersonic lift-to-drag ratio, and deploy the largest Disk-Gap-Band supersonic parachute of any previous mission to Mars. Major EDL events include a hypersonic guided entry, supersonic parachute deploy and inflation, subsonic heatshield jettison, terminal descent sensor acquisition, powered descent initiation, sky crane terminal descent, rover touchdown detection, and descent stage flyaway. Key performance metrics, derived from level-1 requirements and tracked by the EDL design team to indicate performance capability and timeline margins, include altitude and range at parachute deploy, time on radar, and propellant use.
The MSL EDL system, which will continue to develop over the next three years, will enable a notable extension in the advancement of Mars surface science by delivering more science capability than ever before to the surface of Mars. This paper describes the current MSL EDL system performance as predicted by end-to-end EDL simulations, highlights the sensitivity of this baseline performance to several key
https://ntrs.nasa.gov/search.jsp?R=20090007730 2018-06-17T15:27:58+00:00Z
environmental assumptions, and discusses some of the challenges faced in delivering such an unprecedented rover payload to the surface of Mars.
TABLE OF CONTENTS
1. INTRODUCTION ........................................ 2 1.1 LEVEL I REQUIREMENTS ............................ 2 1.2 COMPARISON WITH PREVIOUS MISSONS .... 2 1.3 LIFTING VS. BALLISTIC ENTRY .................. 3
2. ENTRY, DESCENT, AND LANDING ....... 4 2.1 APPROACH NAVIGATION ........................... 4 2.2 CRUISE STAGE SEPARATION ...................... 4 2.3 HYPERSONIC AEROMANUEVERING ............ 5 2.4 PARACHUTE DEPLOYMENT ........................ 6 2.5 HEATSHIELD JETTISON .............................. 6 2.6 POWERED DESCENT ................................... 7 2.7 SKY CRANE ............................................... 8
3. EDL SYSTEM PERFORMANCE .............. 8 3.1 ALTITUDE PERFORMANCE ......................... 8 3.2 RANGE TO TARGET .................................... 9 3.3 TIME ON RADAR ...................................... 10 3.4 PEAK ENTRY ENVIRONMENTS ................. 11 3.5 WIND SENSITIVITY .................................. 11 3.6 PROPELLANT USE .................................... 13
4. SUMMARY ................................................. 14 ACKNOWLEDGEMENTS ........................... 15 REFERENCES ............................................... 15
1. INTRODUCTION
In 2010, the Mars Science Laboratory (MSL) mission will pioneer the next generation of robotic Entry, Descent, and Landing (EDL) systems, by delivering the largest and most capable rover to date to the surface of Mars. Building on the success of the twin Mars Exploration Rover (MER) rovers, Spirit and Opportunity, which landed in 2004, MSL will collect Martian soil samples and rock cores and analyze them for organic compounds and environmental conditions that could have supported microbial life now or in the past. In doing so, MSL will enter the Martian atmosphere with the largest 70 deg sphere-cone aeroshell ever flown to Mars, fly the first guided lifting entry at Mars, generate a hypersonic lift-to-drag
ratio in excess of any other Mars mission, decelerate behind the largest Disk-Gap-Band (DGB) supersonic parachute ever deployed at Mars, and soft-land the largest scientific payload to ever explore the surface of Mars.
1.1 Level I Requirements
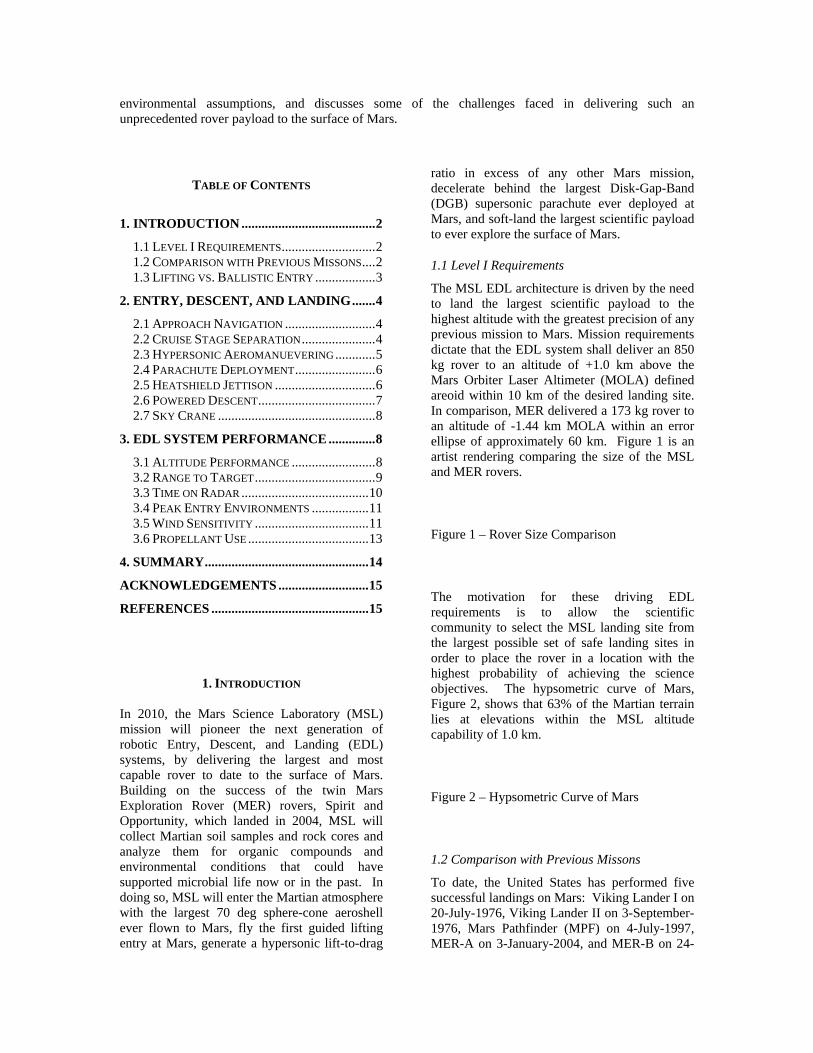
The MSL EDL architecture is driven by the need to land the largest scientific payload to the highest altitude with the greatest precision of any previous mission to Mars. Mission requirements dictate that the EDL system shall deliver an 850 kg rover to an altitude of +1.0 km above the Mars Orbiter Laser Altimeter (MOLA) defined areoid within 10 km of the desired landing site. In comparison, MER delivered a 173 kg rover to an altitude of -1.44 km MOLA within an error ellipse of approximately 60 km. Figure 1 is an artist rendering comparing the size of the MSL and MER rovers.
Figure 1 – Rover Size Comparison
The motivation for these driving EDL requirements is to allow the scientific community to select the MSL landing site from the largest possible set of safe landing sites in order to place the rover in a location with the highest probability of achieving the science objectives. The hypsometric curve of Mars, Figure 2, shows that 63% of the Martian terrain lies at elevations within the MSL altitude capability of 1.0 km.
Figure 2 – Hypsometric Curve of Mars
1.2 Comparison with Previous Missons
To date, the United States has performed five successful landings on Mars: Viking Lander I on 20-July-1976, Viking Lander II on 3-September-1976, Mars Pathfinder (MPF) on 4-July-1997, MER-A on 3-January-2004, and MER-B on 24-
January-2004. One additional landed mission, Phoenix, is scheduled for launch in 2007. These missions form the core EDL heritage technologies on which MSL heavily relies. The MSL EDL design team has constructed an EDL architecture that leverages these proven technologies wherever possible and combines them with novel innovations in order to extend the performance envelope to the maximum extent possible.
Figure 3 – Aeroshell Comparison
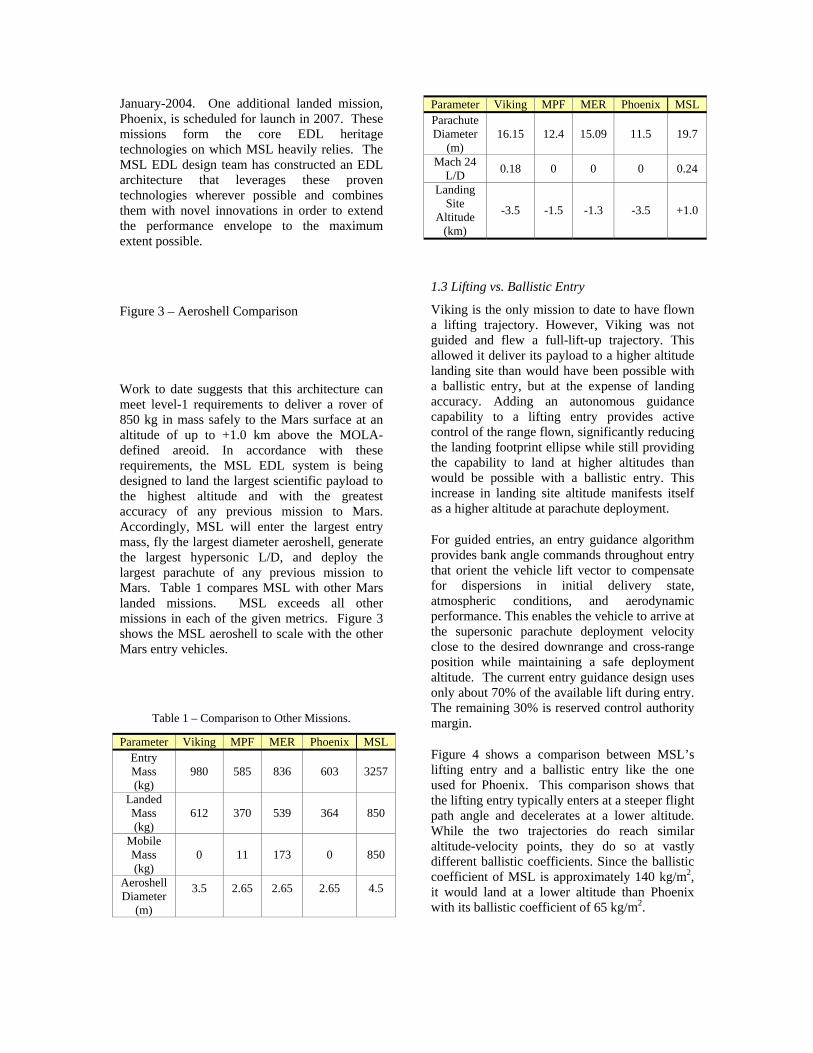
Work to date suggests that this architecture can meet level-1 requirements to deliver a rover of 850 kg in mass safely to the Mars surface at an altitude of up to +1.0 km above the MOLA-defined areoid. In accordance with these requirements, the MSL EDL system is being designed to land the largest scientific payload to the highest altitude and with the greatest accuracy of any previous mission to Mars. Accordingly, MSL will enter the largest entry mass, fly the largest diameter aeroshell, generate the largest hypersonic L/D, and deploy the largest parachute of any previous mission to Mars. Table 1 compares MSL with other Mars landed missions. MSL exceeds all other missions in each of the given metrics. Figure 3 shows the MSL aeroshell to scale with the other Mars entry vehicles.
Table 1 – Comparison to Other Missions.
Parameter Viking MPF MER Phoenix MSL Entry Mass (kg)
980 585 836 603 3257
Landed Mass (kg)
612 370 539 364 850
Mobile Mass (kg)
0 11 173 0 850
Aeroshell Diameter
(m)
3.5 2.65 2.65 2.65 4.5
Parameter Viking MPF MER Phoenix MSL Parachute Diameter
(m) 16.15 12.4 15.09 11.5 19.7
Mach 24 L/D 0.18 0 0 0 0.24
Landing Site
Altitude (km)
-3.5 -1.5 -1.3 -3.5 +1.0
1.3 Lifting vs. Ballistic Entry
Viking is the only mission to date to have flown a lifting trajectory. However, Viking was not guided and flew a full-lift-up trajectory. This allowed it deliver its payload to a higher altitude landing site than would have been possible with a ballistic entry, but at the expense of landing accuracy. Adding an autonomous guidance capability to a lifting entry provides active control of the range flown, significantly reducing the landing footprint ellipse while still providing the capability to land at higher altitudes than would be possible with a ballistic entry. This increase in landing site altitude manifests itself as a higher altitude at parachute deployment.
For guided entries, an entry guidance algorithm provides bank angle commands throughout entry that orient the vehicle lift vector to compensate for dispersions in initial delivery state, atmospheric conditions, and aerodynamic performance. This enables the vehicle to arrive at the supersonic parachute deployment velocity close to the desired downrange and cross-range position while maintaining a safe deployment altitude. The current entry guidance design uses only about 70% of the available lift during entry. The remaining 30% is reserved control authority margin.
Figure 4 shows a comparison between MSL’s lifting entry and a ballistic entry like the one used for Phoenix. This comparison shows that the lifting entry typically enters at a steeper flight path angle and decelerates at a lower altitude. While the two trajectories do reach similar altitude-velocity points, they do so at vastly different ballistic coefficients. Since the ballistic coefficient of MSL is approximately 140 kg/m2, it would land at a lower altitude than Phoenix with its ballistic coefficient of 65 kg/m2.
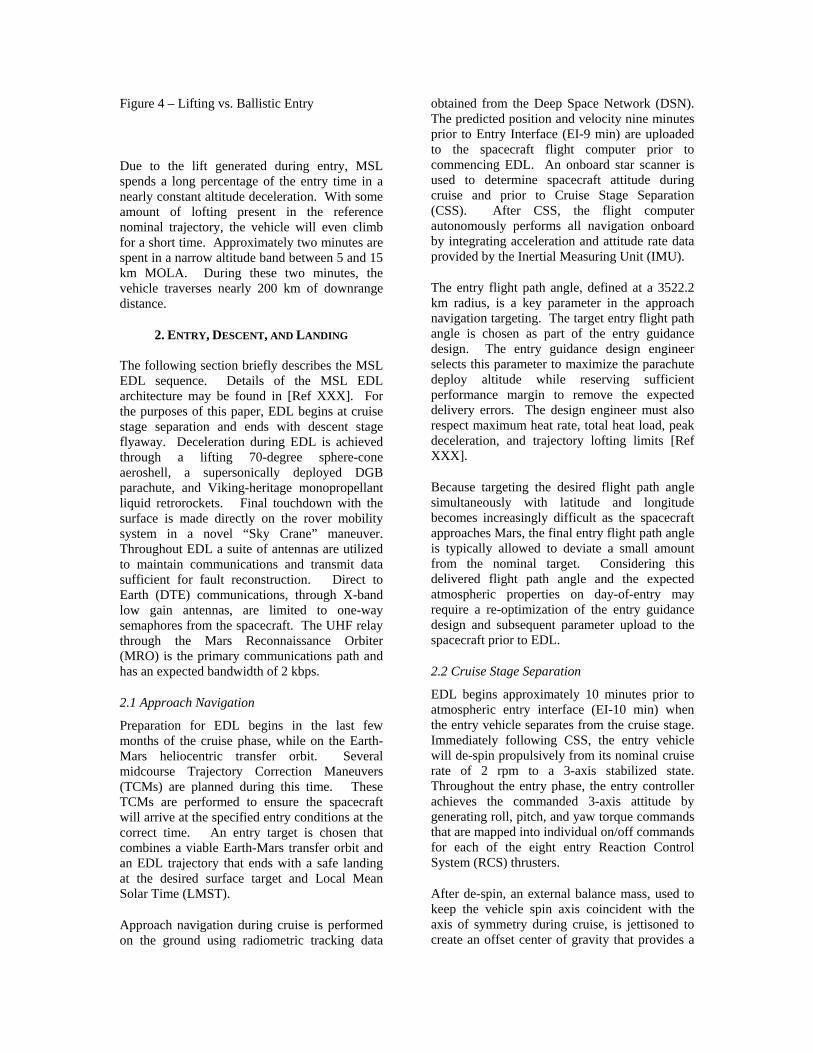
Figure 4 – Lifting vs. Ballistic Entry
Due to the lift generated during entry, MSL spends a long percentage of the entry time in a nearly constant altitude deceleration. With some amount of lofting present in the reference nominal trajectory, the vehicle will even climb for a short time. Approximately two minutes are spent in a narrow altitude band between 5 and 15 km MOLA. During these two minutes, the vehicle traverses nearly 200 km of downrange distance.
2. ENTRY, DESCENT, AND LANDING
The following section briefly describes the MSL EDL sequence. Details of the MSL EDL architecture may be found in [Ref XXX]. For the purposes of this paper, EDL begins at cruise stage separation and ends with descent stage flyaway. Deceleration during EDL is achieved through a lifting 70-degree sphere-cone aeroshell, a supersonically deployed DGB parachute, and Viking-heritage monopropellant liquid retrorockets. Final touchdown with the surface is made directly on the rover mobility system in a novel “Sky Crane” maneuver. Throughout EDL a suite of antennas are utilized to maintain communications and transmit data sufficient for fault reconstruction. Direct to Earth (DTE) communications, through X-band low gain antennas, are limited to one-way semaphores from the spacecraft. The UHF relay through the Mars Reconnaissance Orbiter (MRO) is the primary communications path and has an expected bandwidth of 2 kbps.
2.1 Approach Navigation
Preparation for EDL begins in the last few months of the cruise phase, while on the Earth-Mars heliocentric transfer orbit. Several midcourse Trajectory Correction Maneuvers (TCMs) are planned during this time. These TCMs are performed to ensure the spacecraft will arrive at the specified entry conditions at the correct time. An entry target is chosen that combines a viable Earth-Mars transfer orbit and an EDL trajectory that ends with a safe landing at the desired surface target and Local Mean Solar Time (LMST).
Approach navigation during cruise is performed on the ground using radiometric tracking data
obtained from the Deep Space Network (DSN). The predicted position and velocity nine minutes prior to Entry Interface (EI-9 min) are uploaded to the spacecraft flight computer prior to commencing EDL. An onboard star scanner is used to determine spacecraft attitude during cruise and prior to Cruise Stage Separation (CSS). After CSS, the flight computer autonomously performs all navigation onboard by integrating acceleration and attitude rate data provided by the Inertial Measuring Unit (IMU).
The entry flight path angle, defined at a 3522.2 km radius, is a key parameter in the approach navigation targeting. The target entry flight path angle is chosen as part of the entry guidance design. The entry guidance design engineer selects this parameter to maximize the parachute deploy altitude while reserving sufficient performance margin to remove the expected delivery errors. The design engineer must also respect maximum heat rate, total heat load, peak deceleration, and trajectory lofting limits [Ref XXX].
Because targeting the desired flight path angle simultaneously with latitude and longitude becomes increasingly difficult as the spacecraft approaches Mars, the final entry flight path angle is typically allowed to deviate a small amount from the nominal target. Considering this delivered flight path angle and the expected atmospheric properties on day-of-entry may require a re-optimization of the entry guidance design and subsequent parameter upload to the spacecraft prior to EDL.
2.2 Cruise Stage Separation
EDL begins approximately 10 minutes prior to atmospheric entry interface (EI-10 min) when the entry vehicle separates from the cruise stage. Immediately following CSS, the entry vehicle will de-spin propulsively from its nominal cruise rate of 2 rpm to a 3-axis stabilized state. Throughout the entry phase, the entry controller achieves the commanded 3-axis attitude by generating roll, pitch, and yaw torque commands that are mapped into individual on/off commands for each of the eight entry Reaction Control System (RCS) thrusters.
After de-spin, an external balance mass, used to keep the vehicle spin axis coincident with the axis of symmetry during cruise, is jettisoned to create an offset center of gravity that provides a

nominal lift-to-drag ratio of 0.24 during atmospheric flight. The spacecraft then executes a turn to the predefined entry attitude approximately 7 minutes prior to entry. Entry interface occurs at a defined radius of 3522.2 km and marks the beginning of the entry phase.
2.3 Hypersonic Aeromanuevering
Objectives during the entry phase are to survive the entry environment, including the aeroheating heat pulse and structural g-loading, and arrive at the desired supersonic parachute deploy target by using vehicle lift to compensate for dispersions in initial delivery state, atmosphere, and aerodynamics.[Ref XXX] The entry guidance algorithm modulates the vehicle lift by commanding a bank angle, which is provided by the control system.
Figure 5 – MSL Entry Vehicle
Aerodynamic lift is generated by a center-of-gravity offset from the vehicle axis of symmetry, which causes the 70-deg sphere-cone aeroshell to fly at a non-zero trim angle-of-attack. The current baseline configuration, Figure 5 provides for a hypersonic lift-to-drag ratio (L/D) of 0.24 by means of six balance masses mounted flush with the Outer Mould Line (OML) of the backshell just aft of the heatshield separation plane on the wind side. These balance masses are jettisoned just prior to parachute deploy in order to reduce the angle of attack to be approximately zero degrees at parachute deployment.
The MSL entry guidance algorithm, derived from the Apollo command module Earth reentry guidance design, is broken into three phases: pre-bank, range control, and heading alignment. The entry guidance is initialized in the pre-bank phase (bank attitude hold) until the sensed acceleration exceeds 0.1 Earth g’s. The pre-bank value is chosen to match the reference entry design early bank angle. Once sufficient deceleration is sensed, the range control phase begins.
During the range control phase, the bank angle is commanded to minimize predicted downrange error at parachute deployment. The entry
guidance design determines the required bank angle from a set of influence coefficients, which are derived from a reference entry trajectory. This reference trajectory is designed to achieve the maximum possible altitude over the target parachute deploy location at safe parachute deploy conditions.
Throughout the range control phase, predicted cross-range error is maintained within a manageable dead-band limit by executing bank reversals. Design of the cross-range corridor controls the expected number and location of these bank reversals. Peak environmental conditions for aeroheating, dynamic pressure, and deceleration occur during this guidance phase.
Once the navigated planet-relative velocity drops below a parameterized set-point (currently 1100 m/s), the entry guidance transitions to the heading alignment phase. During this phase, the guidance no longer controls downrange error. Instead, the guidance commands a bank angle to achieve an azimuth that will over-fly the parachute deploy target, minimizing residual cross-range error. However, the bank angle during heading alignment is limited to ensure that sufficient L/D is available to achieve the desired altitude performance. The velocity set-point and bank angle limits of the heading alignment phase provide an entry guidance design trade-off between altitude performance and range error.
Figure 6 – Entry Balance Mass Jettison
Approximately 15 seconds prior to parachute deploy, the six internal balance masses are jettisoned to null the cg-offset used during guided entry. This minimizes the angle of attack at parachute deploy as well as the amount of energy transferred into the capsule wrist-mode due to the parachute inflation loads. Trade studies have shown that altitude performance is not adversely affected because the trade-off between L/D and ballistic coefficient near parachute deploy favors the increased drag. During this maneuver, while reducing the angle of attack from 20 deg, L/D approximately 0.32, to zero, the vehicle executes a bank to the full-lift-down, 180 deg condition. This attitude
preferentially orients the radar beams of the Terminal Descent Sensor (TDS) for favorable ground acquisition later in the timeline.
2.4 Parachute Deployment
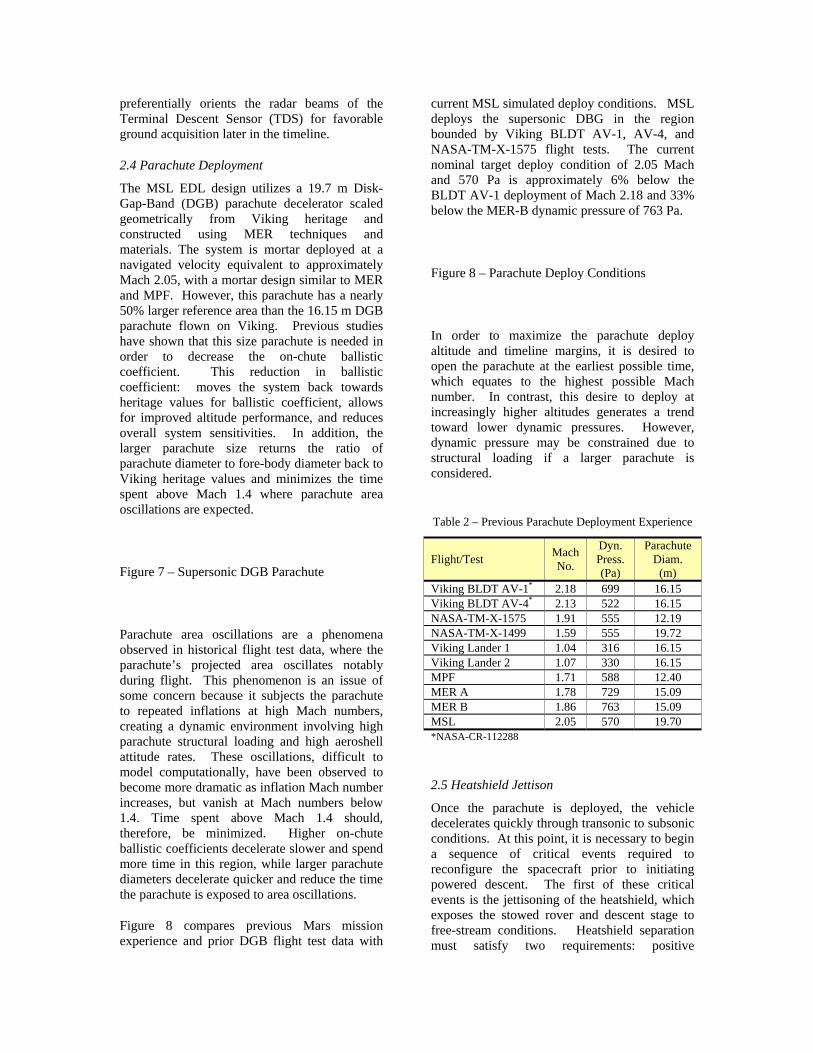
The MSL EDL design utilizes a 19.7 m Disk-Gap-Band (DGB) parachute decelerator scaled geometrically from Viking heritage and constructed using MER techniques and materials. The system is mortar deployed at a navigated velocity equivalent to approximately Mach 2.05, with a mortar design similar to MER and MPF. However, this parachute has a nearly 50% larger reference area than the 16.15 m DGB parachute flown on Viking. Previous studies have shown that this size parachute is needed in order to decrease the on-chute ballistic coefficient. This reduction in ballistic coefficient: moves the system back towards heritage values for ballistic coefficient, allows for improved altitude performance, and reduces overall system sensitivities. In addition, the larger parachute size returns the ratio of parachute diameter to fore-body diameter back to Viking heritage values and minimizes the time spent above Mach 1.4 where parachute area oscillations are expected.
Figure 7 – Supersonic DGB Parachute
Parachute area oscillations are a phenomena observed in historical flight test data, where the parachute’s projected area oscillates notably during flight. This phenomenon is an issue of some concern because it subjects the parachute to repeated inflations at high Mach numbers, creating a dynamic environment involving high parachute structural loading and high aeroshell attitude rates. These oscillations, difficult to model computationally, have been observed to become more dramatic as inflation Mach number increases, but vanish at Mach numbers below 1.4. Time spent above Mach 1.4 should, therefore, be minimized. Higher on-chute ballistic coefficients decelerate slower and spend more time in this region, while larger parachute diameters decelerate quicker and reduce the time the parachute is exposed to area oscillations.
Figure 8 compares previous Mars mission experience and prior DGB flight test data with
current MSL simulated deploy conditions. MSL deploys the supersonic DBG in the region bounded by Viking BLDT AV-1, AV-4, and NASA-TM-X-1575 flight tests. The current nominal target deploy condition of 2.05 Mach and 570 Pa is approximately 6% below the BLDT AV-1 deployment of Mach 2.18 and 33% below the MER-B dynamic pressure of 763 Pa.
Figure 8 – Parachute Deploy Conditions
In order to maximize the parachute deploy altitude and timeline margins, it is desired to open the parachute at the earliest possible time, which equates to the highest possible Mach number. In contrast, this desire to deploy at increasingly higher altitudes generates a trend toward lower dynamic pressures. However, dynamic pressure may be constrained due to structural loading if a larger parachute is considered.
Table 2 – Previous Parachute Deployment Experience
Flight/Test Mach No.
Dyn. Press. (Pa)
Parachute Diam.
(m) Viking BLDT AV-1* 2.18 699 16.15 Viking BLDT AV-4* 2.13 522 16.15 NASA-TM-X-1575 1.91 555 12.19 NASA-TM-X-1499 1.59 555 19.72 Viking Lander 1 1.04 316 16.15 Viking Lander 2 1.07 330 16.15 MPF 1.71 588 12.40 MER A 1.78 729 15.09 MER B 1.86 763 15.09 MSL 2.05 570 19.70 *NASA-CR-112288
2.5 Heatshield Jettison
Once the parachute is deployed, the vehicle decelerates quickly through transonic to subsonic conditions. At this point, it is necessary to begin a sequence of critical events required to reconfigure the spacecraft prior to initiating powered descent. The first of these critical events is the jettisoning of the heatshield, which exposes the stowed rover and descent stage to free-stream conditions. Heatshield separation must satisfy two requirements: positive
separation from the flight system with no re-contact and satisfactory separation to ensure no more than one beam of the Terminal Descent System (TDS) is obscured after activation.
The first of these requirements is met by ensuring that sufficient ballistic coefficient difference exists between the heatshield and the entry vehicle, which in turn requires that heatshield deployment occur below Mach 0.8. Because the determination of Mach number from navigated velocity is very sensitive to attitude errors, MSL has adopted a “dot-product” method for triggering heatshield separation. This trigger provides improved accuracy in deploy Mach number by accounting for an expected rotation in the navigated velocity vector. This rotation, due to the initial attitude error at the start of EDL, can be estimated from the entry geometry. The dot-product trigger velocity is then set to provide for a nominal deploy at Mach 0.7.
The second requirement dictates that a minimum separation distance of 17 meters must occur prior to activating the TDS. At distances beyond 17 m, the TDS beams are sufficiently separated to preclude the obscuration of multiple beams by the heatshield. The heatshield is expected to reach this separation distance within 8 seconds following heatshield jettison. Therefore, the MSL EDL timeline includes an eight second hold following heatshield separation. After the eight second hold, the radar-based Terminal Descent Sensor (TDS) is activated and will begin measuring the vehicle’s altitude and velocity relative to the Martian surface using a 3-axis Doppler velocimeter and a slant range altimeter. Because of the large errors in navigated velocity and altitude accumulated during atmospheric entry, accurate and robust measurements of altitude and velocity are required prior to initiating powered descent.
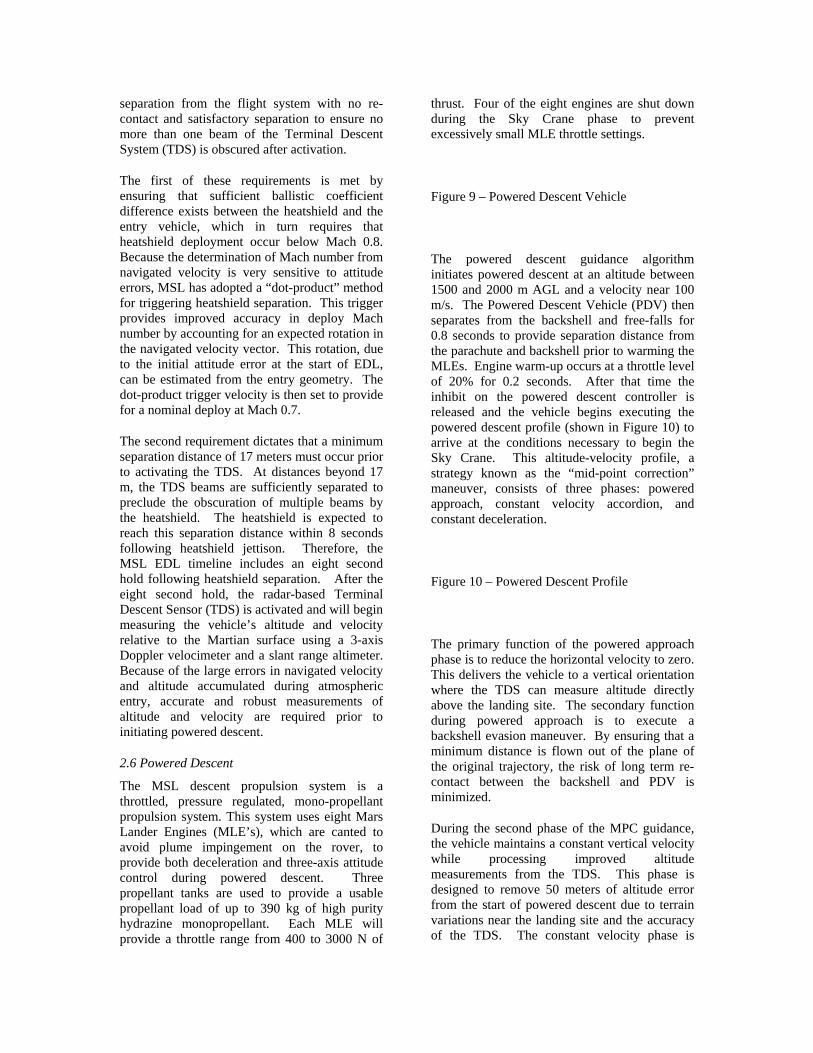
2.6 Powered Descent
The MSL descent propulsion system is a throttled, pressure regulated, mono-propellant propulsion system. This system uses eight Mars Lander Engines (MLE’s), which are canted to avoid plume impingement on the rover, to provide both deceleration and three-axis attitude control during powered descent. Three propellant tanks are used to provide a usable propellant load of up to 390 kg of high purity hydrazine monopropellant. Each MLE will provide a throttle range from 400 to 3000 N of
thrust. Four of the eight engines are shut down during the Sky Crane phase to prevent excessively small MLE throttle settings.
Figure 9 – Powered Descent Vehicle
The powered descent guidance algorithm initiates powered descent at an altitude between 1500 and 2000 m AGL and a velocity near 100 m/s. The Powered Descent Vehicle (PDV) then separates from the backshell and free-falls for 0.8 seconds to provide separation distance from the parachute and backshell prior to warming the MLEs. Engine warm-up occurs at a throttle level of 20% for 0.2 seconds. After that time the inhibit on the powered descent controller is released and the vehicle begins executing the powered descent profile (shown in Figure 10) to arrive at the conditions necessary to begin the Sky Crane. This altitude-velocity profile, a strategy known as the “mid-point correction” maneuver, consists of three phases: powered approach, constant velocity accordion, and constant deceleration.
Figure 10 – Powered Descent Profile
The primary function of the powered approach phase is to reduce the horizontal velocity to zero. This delivers the vehicle to a vertical orientation where the TDS can measure altitude directly above the landing site. The secondary function during powered approach is to execute a backshell evasion maneuver. By ensuring that a minimum distance is flown out of the plane of the original trajectory, the risk of long term re-contact between the backshell and PDV is minimized.
During the second phase of the MPC guidance, the vehicle maintains a constant vertical velocity while processing improved altitude measurements from the TDS. This phase is designed to remove 50 meters of altitude error from the start of powered descent due to terrain variations near the landing site and the accuracy of the TDS. The constant velocity phase is
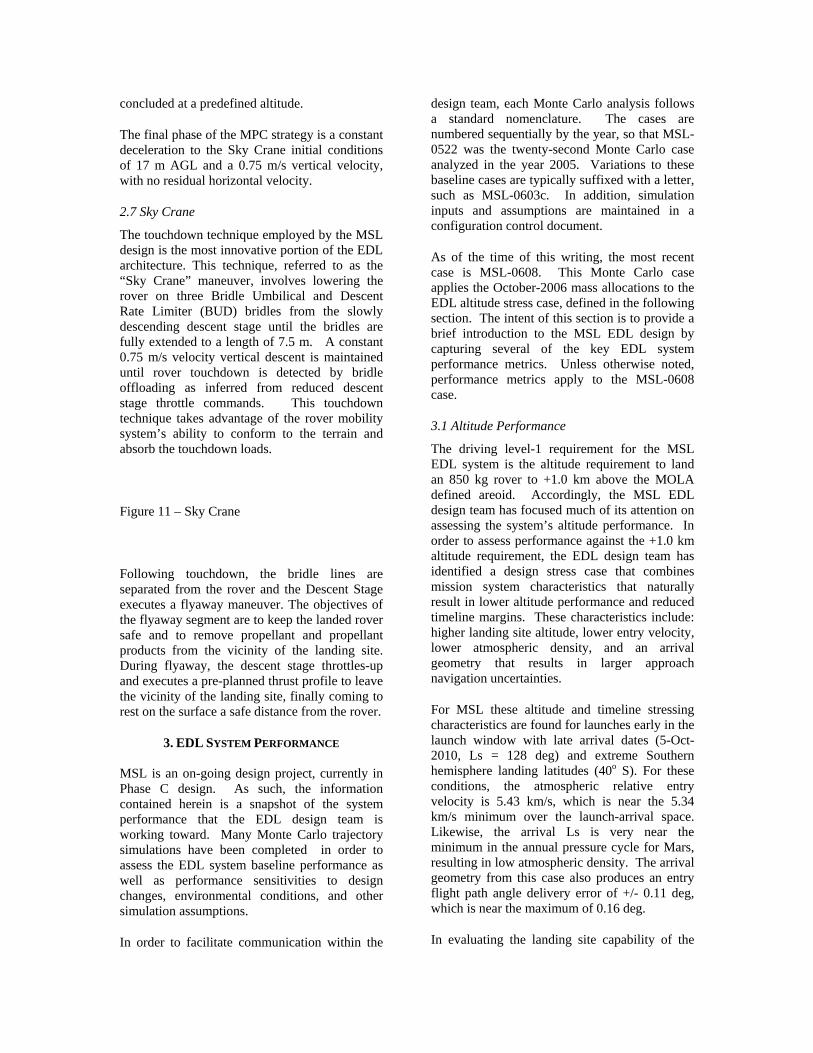
concluded at a predefined altitude.
The final phase of the MPC strategy is a constant deceleration to the Sky Crane initial conditions of 17 m AGL and a 0.75 m/s vertical velocity, with no residual horizontal velocity.
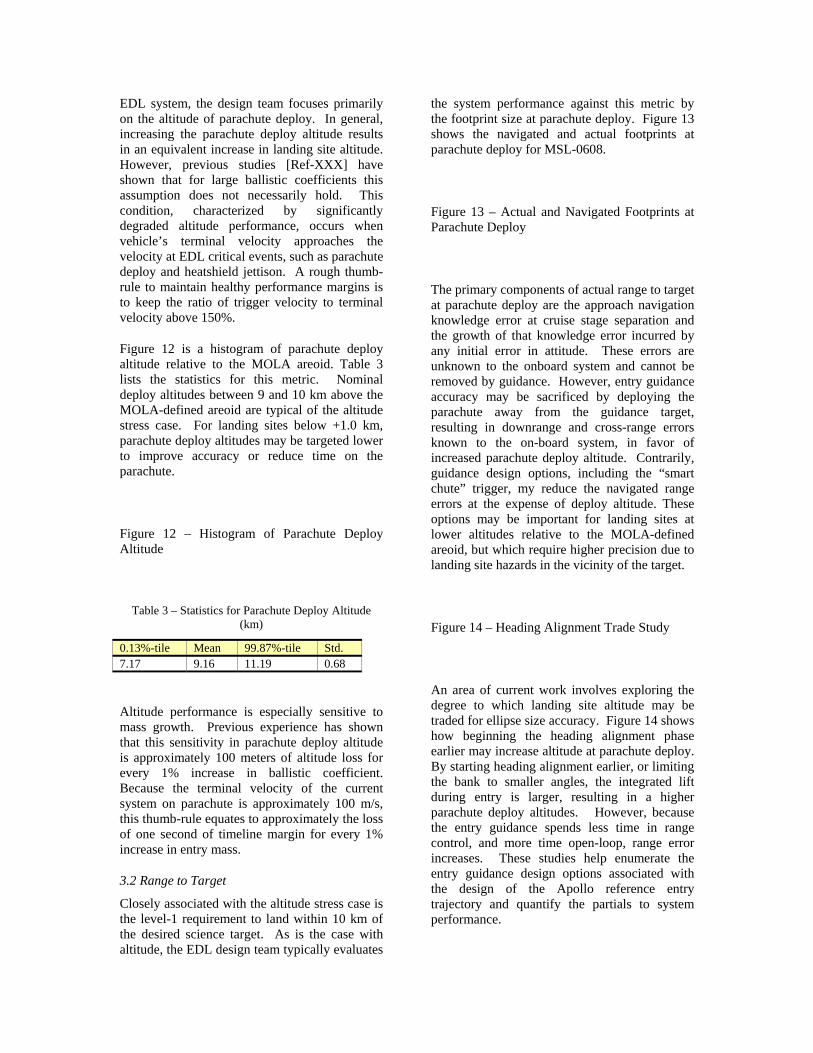
2.7 Sky Crane
The touchdown technique employed by the MSL design is the most innovative portion of the EDL architecture. This technique, referred to as the “Sky Crane” maneuver, involves lowering the rover on three Bridle Umbilical and Descent Rate Limiter (BUD) bridles from the slowly descending descent stage until the bridles are fully extended to a length of 7.5 m. A constant 0.75 m/s velocity vertical descent is maintained until rover touchdown is detected by bridle offloading as inferred from reduced descent stage throttle commands. This touchdown technique takes advantage of the rover mobility system’s ability to conform to the terrain and absorb the touchdown loads.
Figure 11 – Sky Crane
Following touchdown, the bridle lines are separated from the rover and the Descent Stage executes a flyaway maneuver. The objectives of the flyaway segment are to keep the landed rover safe and to remove propellant and propellant products from the vicinity of the landing site. During flyaway, the descent stage throttles-up and executes a pre-planned thrust profile to leave the vicinity of the landing site, finally coming to rest on the surface a safe distance from the rover.
3. EDL SYSTEM PERFORMANCE
MSL is an on-going design project, currently in Phase C design. As such, the information contained herein is a snapshot of the system performance that the EDL design team is working toward. Many Monte Carlo trajectory simulations have been completed in order to assess the EDL system baseline performance as well as performance sensitivities to design changes, environmental conditions, and other simulation assumptions.
In order to facilitate communication within the
design team, each Monte Carlo analysis follows a standard nomenclature. The cases are numbered sequentially by the year, so that MSL-0522 was the twenty-second Monte Carlo case analyzed in the year 2005. Variations to these baseline cases are typically suffixed with a letter, such as MSL-0603c. In addition, simulation inputs and assumptions are maintained in a configuration control document.
As of the time of this writing, the most recent case is MSL-0608. This Monte Carlo case applies the October-2006 mass allocations to the EDL altitude stress case, defined in the following section. The intent of this section is to provide a brief introduction to the MSL EDL design by capturing several of the key EDL system performance metrics. Unless otherwise noted, performance metrics apply to the MSL-0608 case.
3.1 Altitude Performance
The driving level-1 requirement for the MSL EDL system is the altitude requirement to land an 850 kg rover to +1.0 km above the MOLA defined areoid. Accordingly, the MSL EDL design team has focused much of its attention on assessing the system’s altitude performance. In order to assess performance against the +1.0 km altitude requirement, the EDL design team has identified a design stress case that combines mission system characteristics that naturally result in lower altitude performance and reduced timeline margins. These characteristics include: higher landing site altitude, lower entry velocity, lower atmospheric density, and an arrival geometry that results in larger approach navigation uncertainties.
For MSL these altitude and timeline stressing characteristics are found for launches early in the launch window with late arrival dates (5-Oct-2010, Ls = 128 deg) and extreme Southern hemisphere landing latitudes (40o S). For these conditions, the atmospheric relative entry velocity is 5.43 km/s, which is near the 5.34 km/s minimum over the launch-arrival space. Likewise, the arrival Ls is very near the minimum in the annual pressure cycle for Mars, resulting in low atmospheric density. The arrival geometry from this case also produces an entry flight path angle delivery error of +/- 0.11 deg, which is near the maximum of 0.16 deg.
In evaluating the landing site capability of the
EDL system, the design team focuses primarily on the altitude of parachute deploy. In general, increasing the parachute deploy altitude results in an equivalent increase in landing site altitude. However, previous studies [Ref-XXX] have shown that for large ballistic coefficients this assumption does not necessarily hold. This condition, characterized by significantly degraded altitude performance, occurs when vehicle’s terminal velocity approaches the velocity at EDL critical events, such as parachute deploy and heatshield jettison. A rough thumb-rule to maintain healthy performance margins is to keep the ratio of trigger velocity to terminal velocity above 150%.
Figure 12 is a histogram of parachute deploy altitude relative to the MOLA areoid. Table 3 lists the statistics for this metric. Nominal deploy altitudes between 9 and 10 km above the MOLA-defined areoid are typical of the altitude stress case. For landing sites below +1.0 km, parachute deploy altitudes may be targeted lower to improve accuracy or reduce time on the parachute.
Figure 12 – Histogram of Parachute Deploy Altitude
Table 3 – Statistics for Parachute Deploy Altitude (km)
0.13%-tile Mean 99.87%-tile Std. 7.17 9.16 11.19 0.68
Altitude performance is especially sensitive to mass growth. Previous experience has shown that this sensitivity in parachute deploy altitude is approximately 100 meters of altitude loss for every 1% increase in ballistic coefficient. Because the terminal velocity of the current system on parachute is approximately 100 m/s, this thumb-rule equates to approximately the loss of one second of timeline margin for every 1% increase in entry mass.
3.2 Range to Target
Closely associated with the altitude stress case is the level-1 requirement to land within 10 km of the desired science target. As is the case with altitude, the EDL design team typically evaluates
the system performance against this metric by the footprint size at parachute deploy. Figure 13 shows the navigated and actual footprints at parachute deploy for MSL-0608.
Figure 13 – Actual and Navigated Footprints at Parachute Deploy
The primary components of actual range to target at parachute deploy are the approach navigation knowledge error at cruise stage separation and the growth of that knowledge error incurred by any initial error in attitude. These errors are unknown to the onboard system and cannot be removed by guidance. However, entry guidance accuracy may be sacrificed by deploying the parachute away from the guidance target, resulting in downrange and cross-range errors known to the on-board system, in favor of increased parachute deploy altitude. Contrarily, guidance design options, including the “smart chute” trigger, my reduce the navigated range errors at the expense of deploy altitude. These options may be important for landing sites at lower altitudes relative to the MOLA-defined areoid, but which require higher precision due to landing site hazards in the vicinity of the target.
Figure 14 – Heading Alignment Trade Study
An area of current work involves exploring the degree to which landing site altitude may be traded for ellipse size accuracy. Figure 14 shows how beginning the heading alignment phase earlier may increase altitude at parachute deploy. By starting heading alignment earlier, or limiting the bank to smaller angles, the integrated lift during entry is larger, resulting in a higher parachute deploy altitudes. However, because the entry guidance spends less time in range control, and more time open-loop, range error increases. These studies help enumerate the entry guidance design options associated with the design of the Apollo reference entry trajectory and quantify the partials to system performance.
3.3 Time on Radar
The time-on-radar metric is a key indicator of the over-all health of the EDL system and a direct measure of the amount of timeline margin available in the system. EDL designs that stress the system’s altitude performance also stress the EDL timeline. In accordance, it is desired to activate the TDS as soon as possible, facilitating critical measurements of the spacecraft’s altitude and velocity. However, the powered descent phase, in contrast, is not constrained by time, but rather follows a predefined altitude-velocity profile. It is, therefore, the available time between achieving all conditions required for radar acquisition and backshell separation that is the timeline margin in the EDL system. During this time the TDS has acquired the ground and the powered descent guidance is processing TDS data prior to the initiation of powered descent.
For the MSL end-to-end performance simulation, radar acquisition is assumed to occur when three conditions are met: a minimum of eight seconds have elapsed from heatshield jettison, altitude is less than 6500 m, and spacecraft off-nadir angle is less than a curve specified by the altitude-angle pairs in Table 4. The last constraint is an engineering representation of the TDS sensor performance envelope. Actual TDS sensor performance has yet to be characterized, though breadboard testing is currently in progress.
Table 4 – Radar Performance Envelope
Altitude AGL (m)
Off-nadir Angle (deg)
0 65 600 65
1200 60 2400 50 3400 40 4400 30 5300 20 6000 10 6500 0
Figure 15 shows altitude vs. off-nadir angle at eight seconds following heatshield jettision (HS+8s), which is the earliest time at which the heatshield can be expected to not interfere with more than beam of the TDS. This figure illustrates the available timeline margins in the
EDL system by comparing the Monte Carlo cases with the radar performance curve and the powered descent start altitude. Cases which are below and to the left of the radar performance envelope are limited not by the performance of the radar, but by the eight second hold following heatshield jettison, and would benefit from improved altitude performance. Cases above and to the right of the radar performance envelope are constrained by the capabilities of the TDS. These cases possess additional unclaimed timeline margin beyond the time-on-radar metric due to the time spent waiting for radar acquisition. Higher parachute deploy cases correlate with higher altitudes and smaller off-nadir angles.
Figure 15 – Heatshield Jettison +8s Conditions
The time it takes to reach the powered descent start altitude after crossing the radar envelope is the time on radar. For evaluating system performance and timeline margins, the MSL EDL design team assumes a minimum of five seconds of TDS data acquisition is required to safely initiate powered descent. The design team also desires a minimum of an additional five seconds of timeline margin. Combined, these two requirements specify the minimum timeline margin to be 10 seconds between radar acquisition and powered descent initiation.
Figures 16 and 17 are histograms of time-on-radar and unclaimed timeline margin, respectively. Statistics for these metrics are given in Tables 5 and 6. These statistics show little additional time-line margin above the required 10 seconds of time on radar at the 0.13%-tile probability level. This indicates sufficient, but marginal system performance for MSL-0608. However, over 30 seconds of timeline exist between HS+8s and backshell separation in the mean sense.
Figure 16 – Histogram of Time on Radar
Table 5 – Statistics for Time on Radar (s)
0.13%-tile Mean 99.87%-tile Std. 11.6 23.3 34.8 4.1
Figure 17 – Histogram of Unclaimed Timeline Margin
Table 6 – Statistics for Unclaimed Timeline Margin (km)
0.13%-tile Mean 99.87%-tile Std. -1.8 8.4 20.4 3.9
3.4 Peak Entry Environments
In order to assess and bound the peak entry environments, another stress case in addition to the altitude stress case is needed. The EDL design team has identified a design stress case that combines mission system characteristics that result in higher aerothermal environments. These characteristics include higher entry velocity and higher atmospheric density. For MSL these characteristics are found for launches late in the launch window with early arrival dates (12-Jul-2010, Ls = 117 deg) and extreme Northern hemisphere landing latitudes (40o N). For these conditions, the atmospheric relative entry velocity is 5.94 km/s, which is near the 5.96 km/s maximum over the launch-arrival space and nearly 10% higher than the altitude stress case described previously. This stress case is illustrated by the MSL-0605 Monte Carlo.
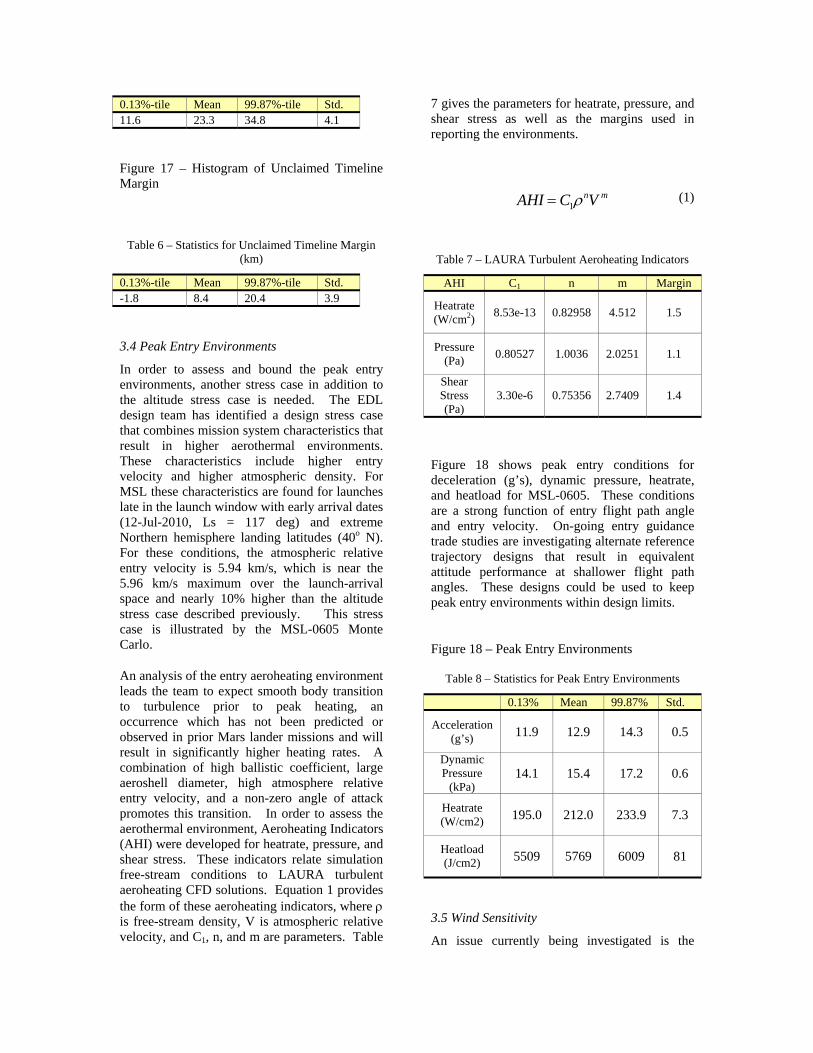
An analysis of the entry aeroheating environment leads the team to expect smooth body transition to turbulence prior to peak heating, an occurrence which has not been predicted or observed in prior Mars lander missions and will result in significantly higher heating rates. A combination of high ballistic coefficient, large aeroshell diameter, high atmosphere relative entry velocity, and a non-zero angle of attack promotes this transition. In order to assess the aerothermal environment, Aeroheating Indicators (AHI) were developed for heatrate, pressure, and shear stress. These indicators relate simulation free-stream conditions to LAURA turbulent aeroheating CFD solutions. Equation 1 provides the form of these aeroheating indicators, where ρ is free-stream density, V is atmospheric relative velocity, and C1, n, and m are parameters. Table
7 gives the parameters for heatrate, pressure, and shear stress as well as the margins used in reporting the environments.
AHI = C1ρnV m (1)
Table 7 – LAURA Turbulent Aeroheating Indicators
AHI C1 n m Margin
Heatrate (W/cm2) 8.53e-13 0.82958 4.512 1.5
Pressure (Pa) 0.80527 1.0036 2.0251 1.1
Shear Stress (Pa)
3.30e-6 0.75356 2.7409 1.4
Figure 18 shows peak entry conditions for deceleration (g’s), dynamic pressure, heatrate, and heatload for MSL-0605. These conditions are a strong function of entry flight path angle and entry velocity. On-going entry guidance trade studies are investigating alternate reference trajectory designs that result in equivalent attitude performance at shallower flight path angles. These designs could be used to keep peak entry environments within design limits.
Figure 18 – Peak Entry Environments
Table 8 – Statistics for Peak Entry Environments
0.13% Mean 99.87% Std.
Acceleration (g’s) 11.9 12.9 14.3 0.5
Dynamic Pressure
(kPa) 14.1 15.4 17.2 0.6
Heatrate (W/cm2) 195.0 212.0 233.9 7.3
Heatload (J/cm2) 5509 5769 6009 81
3.5 Wind Sensitivity
An issue currently being investigated is the
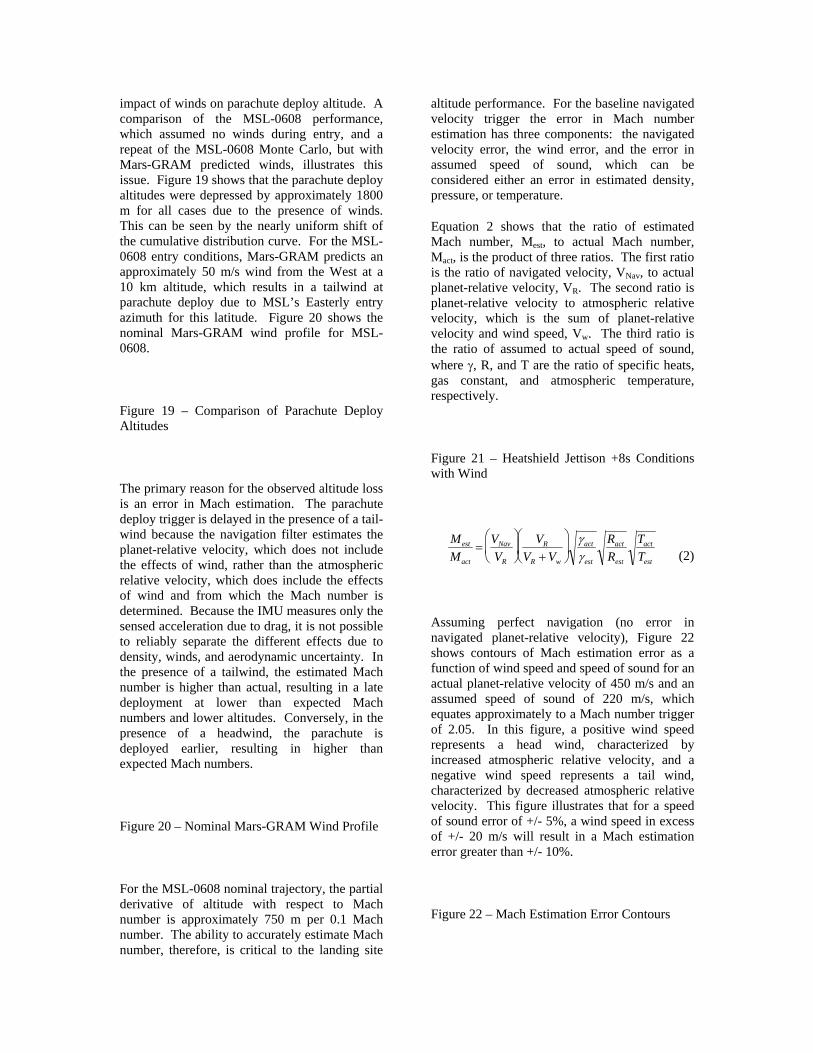
impact of winds on parachute deploy altitude. A comparison of the MSL-0608 performance, which assumed no winds during entry, and a repeat of the MSL-0608 Monte Carlo, but with Mars-GRAM predicted winds, illustrates this issue. Figure 19 shows that the parachute deploy altitudes were depressed by approximately 1800 m for all cases due to the presence of winds. This can be seen by the nearly uniform shift of the cumulative distribution curve. For the MSL-0608 entry conditions, Mars-GRAM predicts an approximately 50 m/s wind from the West at a 10 km altitude, which results in a tailwind at parachute deploy due to MSL’s Easterly entry azimuth for this latitude. Figure 20 shows the nominal Mars-GRAM wind profile for MSL-0608.
Figure 19 – Comparison of Parachute Deploy Altitudes
The primary reason for the observed altitude loss is an error in Mach estimation. The parachute deploy trigger is delayed in the presence of a tail-wind because the navigation filter estimates the planet-relative velocity, which does not include the effects of wind, rather than the atmospheric relative velocity, which does include the effects of wind and from which the Mach number is determined. Because the IMU measures only the sensed acceleration due to drag, it is not possible to reliably separate the different effects due to density, winds, and aerodynamic uncertainty. In the presence of a tailwind, the estimated Mach number is higher than actual, resulting in a late deployment at lower than expected Mach numbers and lower altitudes. Conversely, in the presence of a headwind, the parachute is deployed earlier, resulting in higher than expected Mach numbers.
Figure 20 – Nominal Mars-GRAM Wind Profile
For the MSL-0608 nominal trajectory, the partial derivative of altitude with respect to Mach number is approximately 750 m per 0.1 Mach number. The ability to accurately estimate Mach number, therefore, is critical to the landing site
altitude performance. For the baseline navigated velocity trigger the error in Mach number estimation has three components: the navigated velocity error, the wind error, and the error in assumed speed of sound, which can be considered either an error in estimated density, pressure, or temperature.
Equation 2 shows that the ratio of estimated Mach number, Mest, to actual Mach number, Mact, is the product of three ratios. The first ratio is the ratio of navigated velocity, VNav, to actual planet-relative velocity, VR. The second ratio is planet-relative velocity to atmospheric relative velocity, which is the sum of planet-relative velocity and wind speed, Vw. The third ratio is the ratio of assumed to actual speed of sound, where γ, R, and T are the ratio of specific heats, gas constant, and atmospheric temperature, respectively.
Figure 21 – Heatshield Jettison +8s Conditions with Wind
(2)
Assuming perfect navigation (no error in navigated planet-relative velocity), Figure 22 shows contours of Mach estimation error as a function of wind speed and speed of sound for an actual planet-relative velocity of 450 m/s and an assumed speed of sound of 220 m/s, which equates approximately to a Mach number trigger of 2.05. In this figure, a positive wind speed represents a head wind, characterized by increased atmospheric relative velocity, and a negative wind speed represents a tail wind, characterized by decreased atmospheric relative velocity. This figure illustrates that for a speed of sound error of +/- 5%, a wind speed in excess of +/- 20 m/s will result in a Mach estimation error greater than +/- 10%.
Figure 22 – Mach Estimation Error Contours
Mest
Mact
=VNav
VR
⎛
⎝ ⎜
⎞
⎠ ⎟
VR
VR + Vw
⎛
⎝ ⎜
⎞
⎠ ⎟
γ act
γ est
Ract
Rest
Tact
Test
However, not all of the altitude loss is due to the spoofing of the parachute deploy trigger. A smaller effect is due to the entry guidance reacting to the lower sensed drag accelerations. This causes the guidance to command more lift-down, resulting in lower altitudes where the drag deceleration is closer to the reference design trajectory. Studies have shown this effect to result in only a couple hundred meters of altitude loss relative to the no-wind baseline.
3.6 Propellant Use
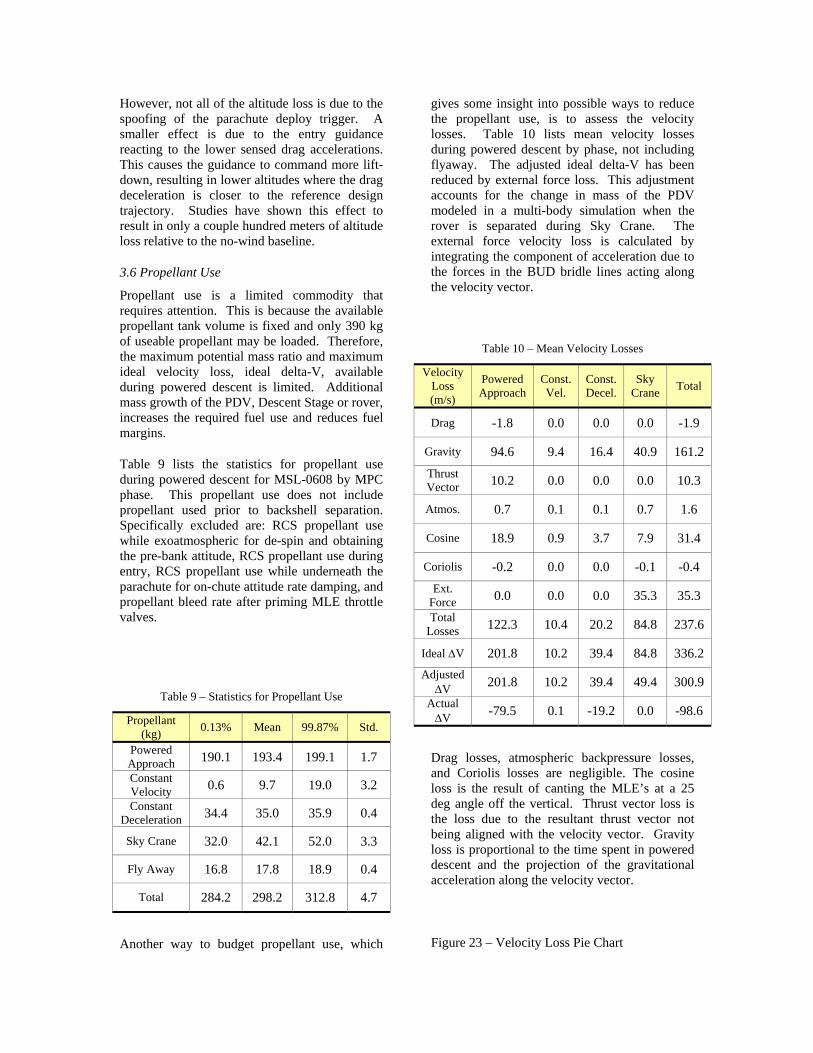
Propellant use is a limited commodity that requires attention. This is because the available propellant tank volume is fixed and only 390 kg of useable propellant may be loaded. Therefore, the maximum potential mass ratio and maximum ideal velocity loss, ideal delta-V, available during powered descent is limited. Additional mass growth of the PDV, Descent Stage or rover, increases the required fuel use and reduces fuel margins.
Table 9 lists the statistics for propellant use during powered descent for MSL-0608 by MPC phase. This propellant use does not include propellant used prior to backshell separation. Specifically excluded are: RCS propellant use while exoatmospheric for de-spin and obtaining the pre-bank attitude, RCS propellant use during entry, RCS propellant use while underneath the parachute for on-chute attitude rate damping, and propellant bleed rate after priming MLE throttle valves.
Table 9 – Statistics for Propellant Use
Propellant (kg) 0.13% Mean 99.87% Std.
Powered Approach 190.1 193.4 199.1 1.7 Constant Velocity 0.6 9.7 19.0 3.2 Constant
Deceleration 34.4 35.0 35.9 0.4
Sky Crane 32.0 42.1 52.0 3.3
Fly Away 16.8 17.8 18.9 0.4
Total 284.2 298.2 312.8 4.7
Another way to budget propellant use, which
gives some insight into possible ways to reduce the propellant use, is to assess the velocity losses. Table 10 lists mean velocity losses during powered descent by phase, not including flyaway. The adjusted ideal delta-V has been reduced by external force loss. This adjustment accounts for the change in mass of the PDV modeled in a multi-body simulation when the rover is separated during Sky Crane. The external force velocity loss is calculated by integrating the component of acceleration due to the forces in the BUD bridle lines acting along the velocity vector.
Table 10 – Mean Velocity Losses
Velocity Loss (m/s)
Powered Approach
Const. Vel.
Const. Decel.
Sky Crane Total
Drag -1.8 0.0 0.0 0.0 -1.9
Gravity 94.6 9.4 16.4 40.9 161.2 Thrust Vector 10.2 0.0 0.0 0.0 10.3
Atmos. 0.7 0.1 0.1 0.7 1.6
Cosine 18.9 0.9 3.7 7.9 31.4
Coriolis -0.2 0.0 0.0 -0.1 -0.4 Ext.
Force 0.0 0.0 0.0 35.3 35.3 Total
Losses 122.3 10.4 20.2 84.8 237.6
Ideal ΔV 201.8 10.2 39.4 84.8 336.2 Adjusted
ΔV 201.8 10.2 39.4 49.4 300.9 Actual
ΔV -79.5 0.1 -19.2 0.0 -98.6
Drag losses, atmospheric backpressure losses, and Coriolis losses are negligible. The cosine loss is the result of canting the MLE’s at a 25 deg angle off the vertical. Thrust vector loss is the loss due to the resultant thrust vector not being aligned with the velocity vector. Gravity loss is proportional to the time spent in powered descent and the projection of the gravitational acceleration along the velocity vector.
Figure 23 – Velocity Loss Pie Chart
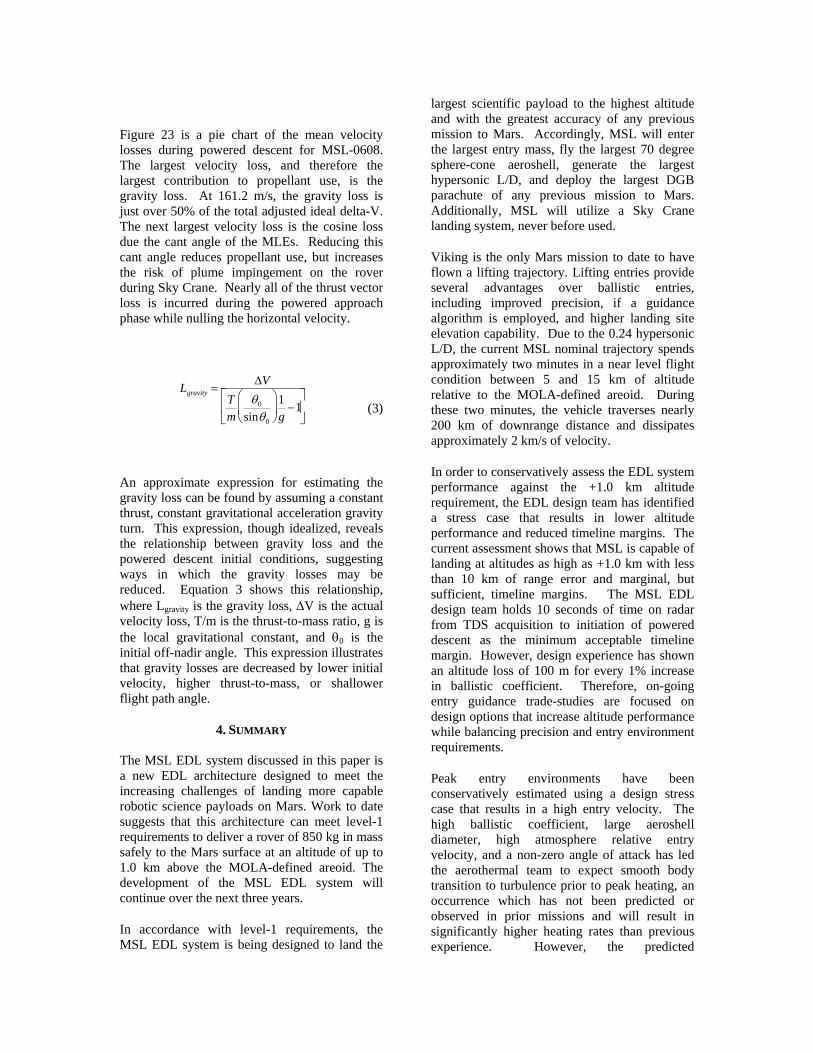
Figure 23 is a pie chart of the mean velocity losses during powered descent for MSL-0608. The largest velocity loss, and therefore the largest contribution to propellant use, is the gravity loss. At 161.2 m/s, the gravity loss is just over 50% of the total adjusted ideal delta-V. The next largest velocity loss is the cosine loss due the cant angle of the MLEs. Reducing this cant angle reduces propellant use, but increases the risk of plume impingement on the rover during Sky Crane. Nearly all of the thrust vector loss is incurred during the powered approach phase while nulling the horizontal velocity.
(3)
An approximate expression for estimating the gravity loss can be found by assuming a constant thrust, constant gravitational acceleration gravity turn. This expression, though idealized, reveals the relationship between gravity loss and the powered descent initial conditions, suggesting ways in which the gravity losses may be reduced. Equation 3 shows this relationship, where Lgravity is the gravity loss, ΔV is the actual velocity loss, T/m is the thrust-to-mass ratio, g is the local gravitational constant, and θ0 is the initial off-nadir angle. This expression illustrates that gravity losses are decreased by lower initial velocity, higher thrust-to-mass, or shallower flight path angle.
4. SUMMARY
The MSL EDL system discussed in this paper is a new EDL architecture designed to meet the increasing challenges of landing more capable robotic science payloads on Mars. Work to date suggests that this architecture can meet level-1 requirements to deliver a rover of 850 kg in mass safely to the Mars surface at an altitude of up to 1.0 km above the MOLA-defined areoid. The development of the MSL EDL system will continue over the next three years.
In accordance with level-1 requirements, the MSL EDL system is being designed to land the
largest scientific payload to the highest altitude and with the greatest accuracy of any previous mission to Mars. Accordingly, MSL will enter the largest entry mass, fly the largest 70 degree sphere-cone aeroshell, generate the largest hypersonic L/D, and deploy the largest DGB parachute of any previous mission to Mars. Additionally, MSL will utilize a Sky Crane landing system, never before used.
Viking is the only Mars mission to date to have flown a lifting trajectory. Lifting entries provide several advantages over ballistic entries, including improved precision, if a guidance algorithm is employed, and higher landing site elevation capability. Due to the 0.24 hypersonic L/D, the current MSL nominal trajectory spends approximately two minutes in a near level flight condition between 5 and 15 km of altitude relative to the MOLA-defined areoid. During these two minutes, the vehicle traverses nearly 200 km of downrange distance and dissipates approximately 2 km/s of velocity.
In order to conservatively assess the EDL system performance against the +1.0 km altitude requirement, the EDL design team has identified a stress case that results in lower altitude performance and reduced timeline margins. The current assessment shows that MSL is capable of landing at altitudes as high as +1.0 km with less than 10 km of range error and marginal, but sufficient, timeline margins. The MSL EDL design team holds 10 seconds of time on radar from TDS acquisition to initiation of powered descent as the minimum acceptable timeline margin. However, design experience has shown an altitude loss of 100 m for every 1% increase in ballistic coefficient. Therefore, on-going entry guidance trade-studies are focused on design options that increase altitude performance while balancing precision and entry environment requirements.
Peak entry environments have been conservatively estimated using a design stress case that results in a high entry velocity. The high ballistic coefficient, large aeroshell diameter, high atmosphere relative entry velocity, and a non-zero angle of attack has led the aerothermal team to expect smooth body transition to turbulence prior to peak heating, an occurrence which has not been predicted or observed in prior missions and will result in significantly higher heating rates than previous experience. However, the predicted
Lgravity =ΔV
Tm
θ0
sinθ0
⎛
⎝ ⎜
⎞
⎠ ⎟
1g
−1⎡
⎣ ⎢
⎤
⎦ ⎥
environments are within the design requirements of the heatshield and aeroshell.
An issue currently being investigated is the impact of winds on parachute deploy altitude. The parachute deploy trigger is delayed in the presence of tail-winds, resulting in altitude loss, due to an error in Mach estimation. Mach number estimation has three components of error: the navigated velocity error, the wind error, and the error in assumed speed of sound. Wind speeds in excess of 20 m/s combined with 5% errors in predicted speed of sound result in Mach estimation errors greater than 10%.
Because the available propellant tank volume is fixed, and only 390 kg of useable propellant may be loaded, propellant use is closely tracked and budgeted by the EDL design team. Gravity losses during powered descent, which account for approximately half of the consumed propellant, are decreased by lower initial velocity, higher thrust-to-mass, or shallower flight path angle. Current estimates of fuel use are within propulsion system capability.
ACKNOWLEDGEMENTS
The work described in this paper was carried out by the NASA Langley Research Center and by the Jet Propulsion Laboratory, California Institute of Technology, under contract with the National Aeronautics and Space Administration. The authors would like to recognize the contributions of the entire EDL design team members from JPL, JSC, ARC, and LaRC.
REFERENCES
[1] Lockwood, M. K., Sutton, K., Prabhu, R., and Powell, R. W., “Entry Configurations and Performance Comparisons for the Mars Smart Lander,” AIAA Paper 2002-4407, AIAA Atmospheric Flight Mechanics Conference & Exhibit, Monterey, CA, Aug. 2002.
[2] Braun, R.D. and Manning, R.M., “Mars Exploration Entry, Descent and Landing Challenges,” IEEE Aerospace Conference Paper No. 2006-1076, Big Sky, MT, Mar. 2006.
[3] Way, D.W., Powell R.W., Chen A., Steltzner, A.D., “Asymptotic Parachute Performance Sensitivity”, IEEEAC #1465, IEEE Aerospace Conference, March 4-11, 2006, Big Sky, MT.
[4] Moog, R. D. and Michel, F. C.: Ballon Launched Decelerator Test Program Summary Report, NASA-CR-112288, 1973.
[5] Bendura, R. J., Coltrane, L. C., and Huckins, E. K., II: Performance of a 19.7 meter Diamter Disk-Gap-Band Parachute in a Simulated Martian Environment, NASA-TM-X-1499, 1968.
[6] Anon.: Viking Lander “As Built” Performance Capabilities, Martin Marietta Corporation Denver Division, Denver, Colorado, June 1976.
[7] Program to Optimize Simulated Trajectories: Volume II, Utilization Manual, prepared by: R.W. Powell, S.A. Striepe, P.N. Desai, P.V. Tartabini, E.M. Queen; NASA Langley Research Center, and by: G.L. Brauer, D.E. Cornick, D.W. Olson, F.M. Petersen, R. Stevenson, M.C. Engel, S.M. Marsh; Lockheed Martin Corporation. Version 1.1.1.G, May 2000.
[8] G. Carman, D. Ives, and D. Geller, Apollo-Derived Mars Precision Lander Guidance, AIAA 98-4570, AIAA Atmospheric Flight Mechanics Conference, August 10-12, 1998, Boston, MA.
[9] Justus, C. G., Johnson, D. L., “Mars Global Reference Atmospheric Model 2001 Version (Mars-GRAM 2001): Users Guide,” NASA TM-2001-210961, April 2001.
[10] Edquist, K. T., Liechty, D. S., Hollis, B. R., Alter, S. J., and Loomis, M. P., “Aeroheating Environments for a Mars Smart Lander,” Journal of Spacecraft and Rockets, Vol. 43, No. 2, Mar.-Apr., 2006, pp. 330-339.
[11] Edquist, K. T., and Alter, S. J., “Computational Aeroheating Predictions for Mars Lander Configurations,” AIAA Paper 2003-3639, June 2003.
[12] Golombeck, M.P. et al., “Selection of the Mars Exploration Rover landing sites”, Journal of Geophysical Research, Volume 108, Issue E12, pp. ROV 13-1, 2003.
[13] Steltzner, A.D., Kipp, D.M., Chen, A., Burkhart, P.D., Guernsey, C.S., Mendeck, G.F., Mitcheltree, R.A., Powell, R.W., Rivellini, T.P., San Martin, A.M., Way, D.W., “Mars Science Laboratory Entry, Descent, and Landing System”, IEEAC #1497, IEEE Aerospace Conference, March 4-11, 2006, Big Sky, MT.
[14] Mendeck, G.F. and Carman, G.L., “Guidance Design for Mars Smart Landers Using The Entry Terminal Point Controller”, AIAA-2002-4502 AIAA Atmospheric Flight Mechanics Conference and Exhibit, Monterey, California, Aug. 5-8, 2002.
BIOGRAPHY
David Way is an Aerospace Engineer in the Exploration Systems Engineering Branch at the NASA Langley Research Center. His areas of expertise are flight mechanics, trajectory simulation, and entry system performance. He holds a BS from the United States Naval Academy, a MS from the Georgia Institute of Technology, and a PhD from the Georgia Institute of Technology.
Dick Powell is ...
Allen Chen is ...
Adam Steltzner joined JPL in 1991 and has worked on flight projects including Galileo, Cassini, Mars Pathfinder, and the Mars Exploration Rovers. Adam holds a BS from University of California, Davis, and MS from the
California Institute of Technology and a PhD from the University of Wisconsin, Madison. Adam was the mechanical systems lead for EDL on MER and is currently the Chief Engineer for EDL on MSL
Miguel San Martin is ...
Dan Burkhart is ...
Gavin Mendeck is ...
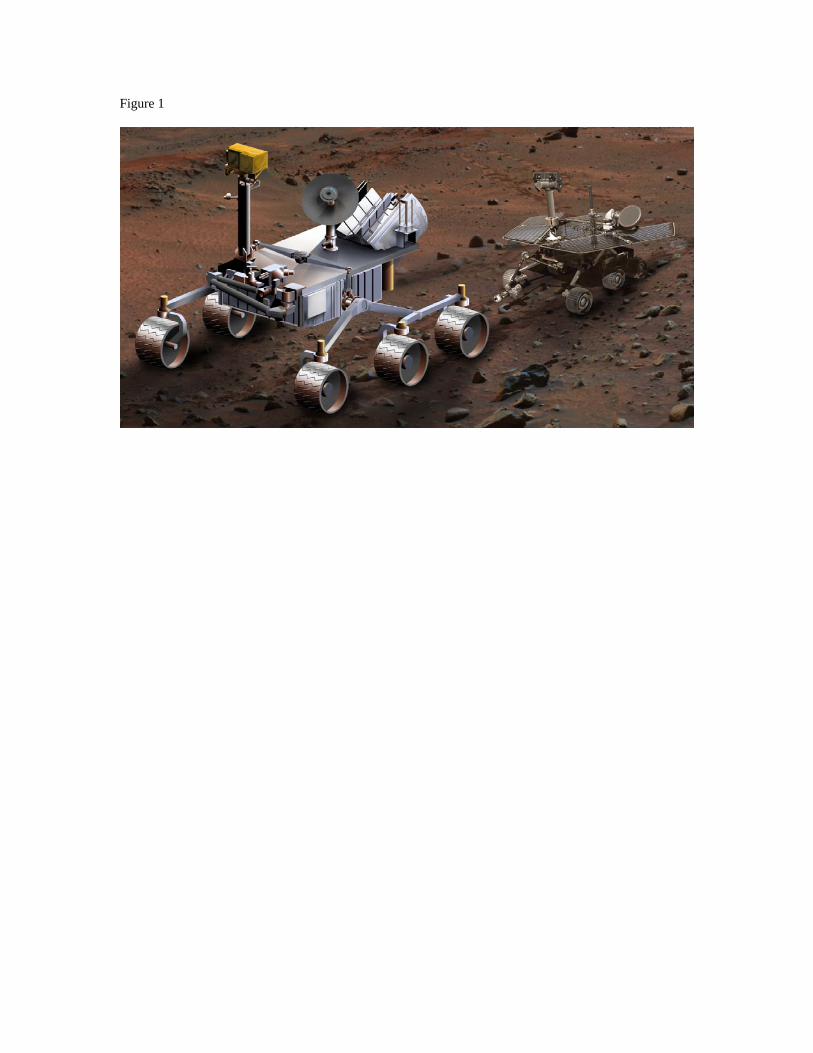
Figure 1

Figure 2

Figure 3
Viking MPF MER Phoenix MSL
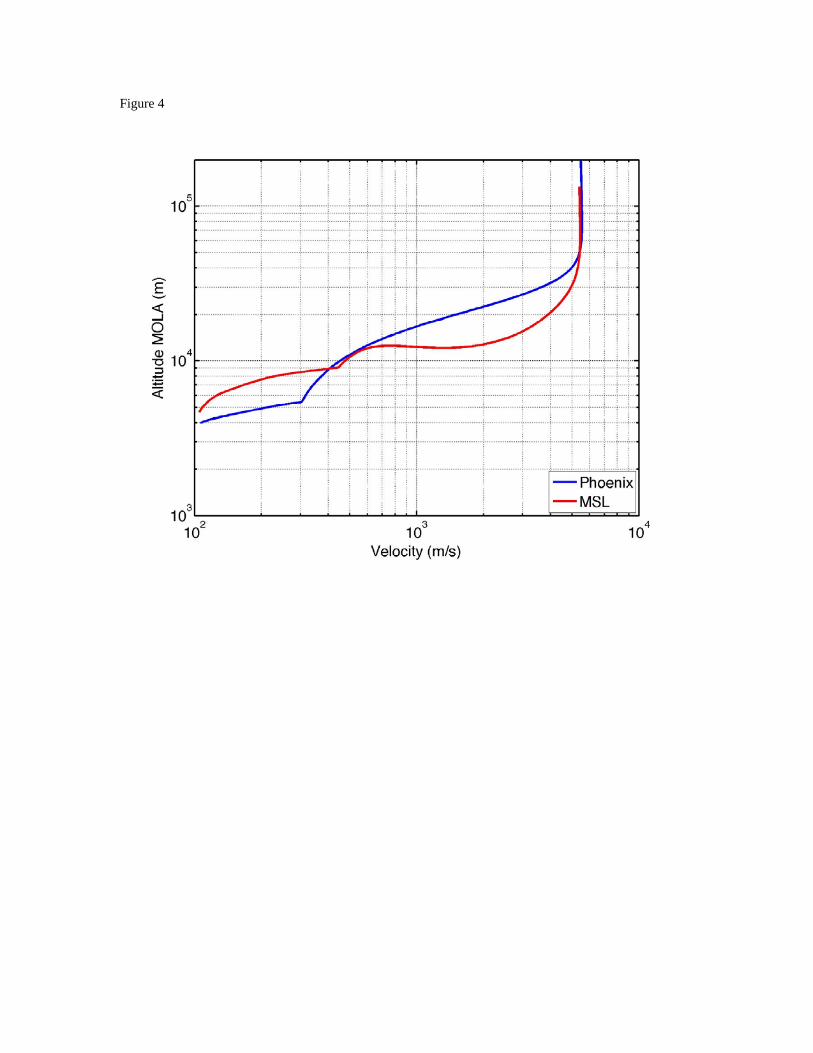
Figure 4
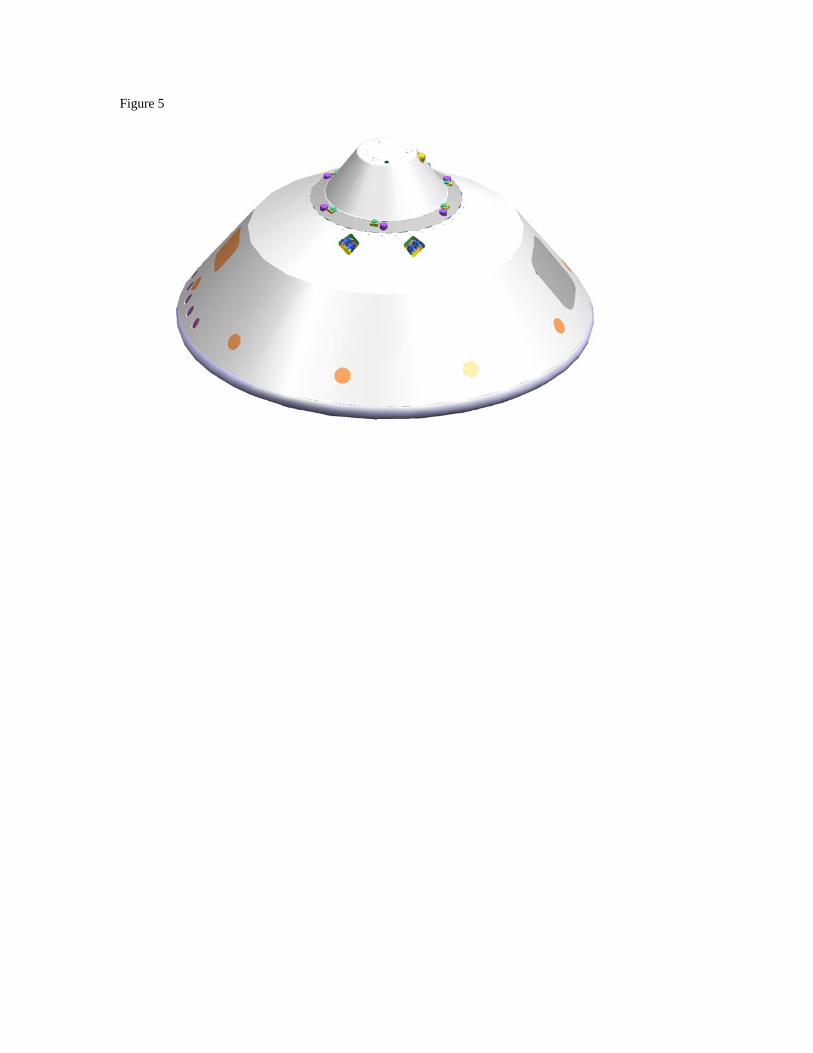
Figure 5
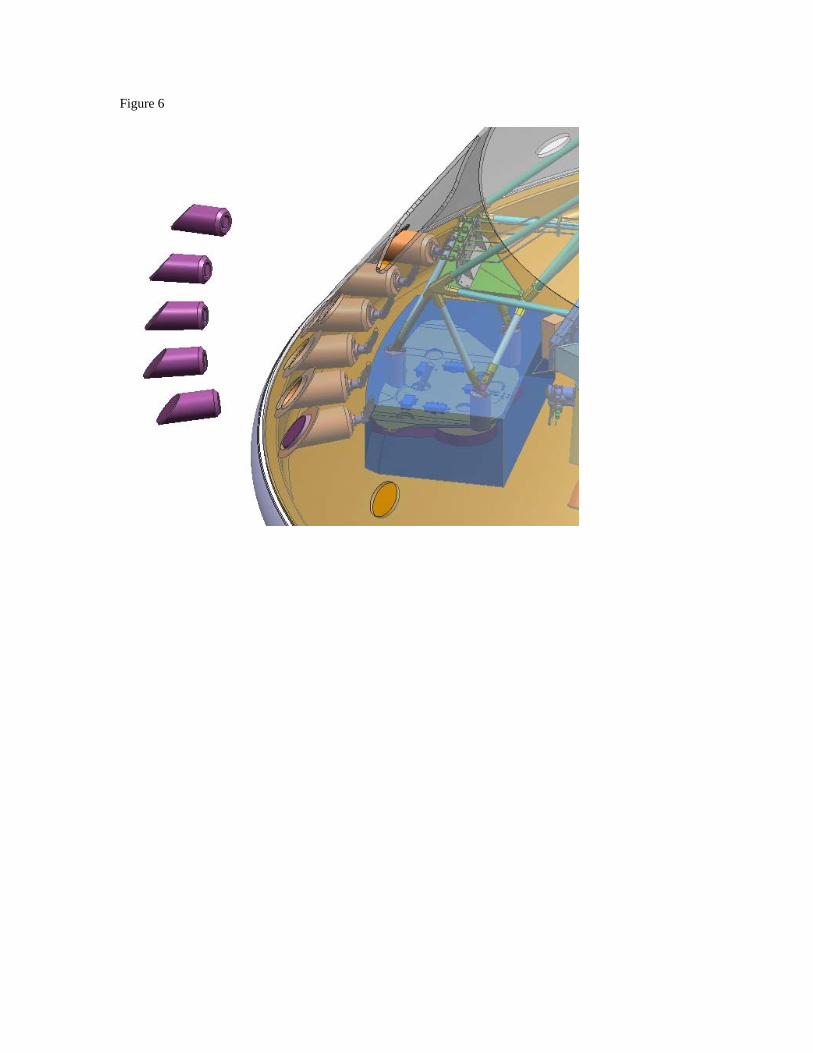
Figure 6
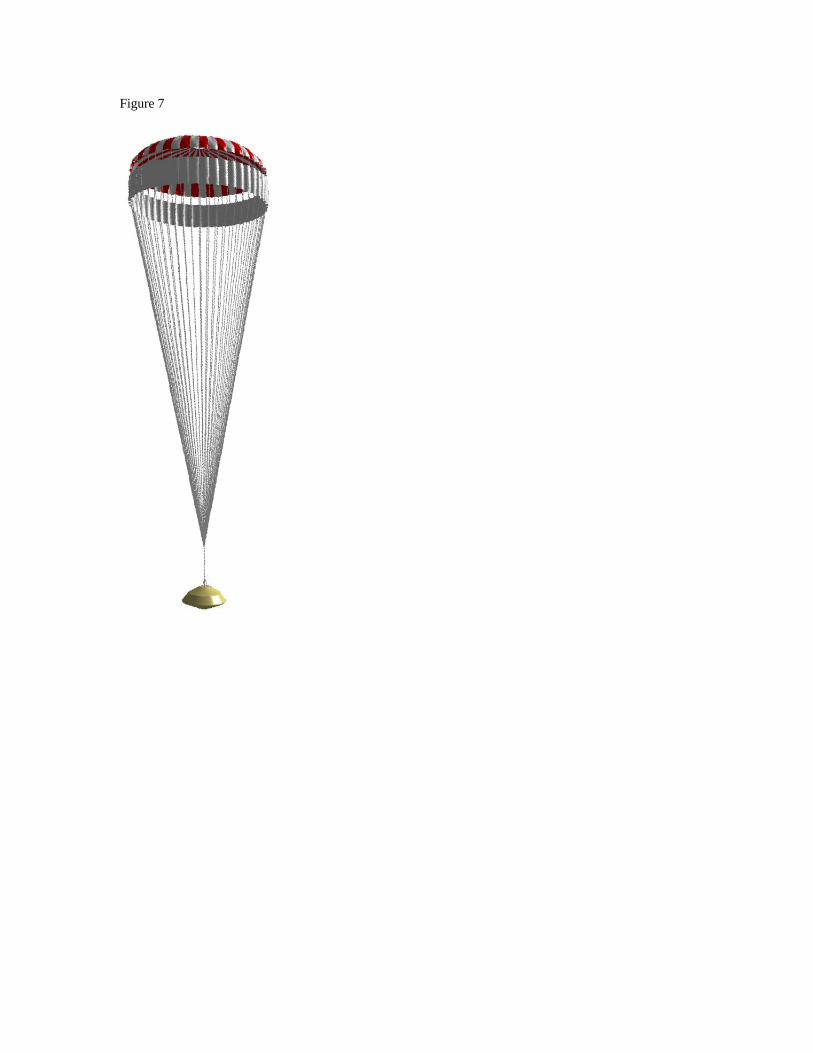
Figure 7
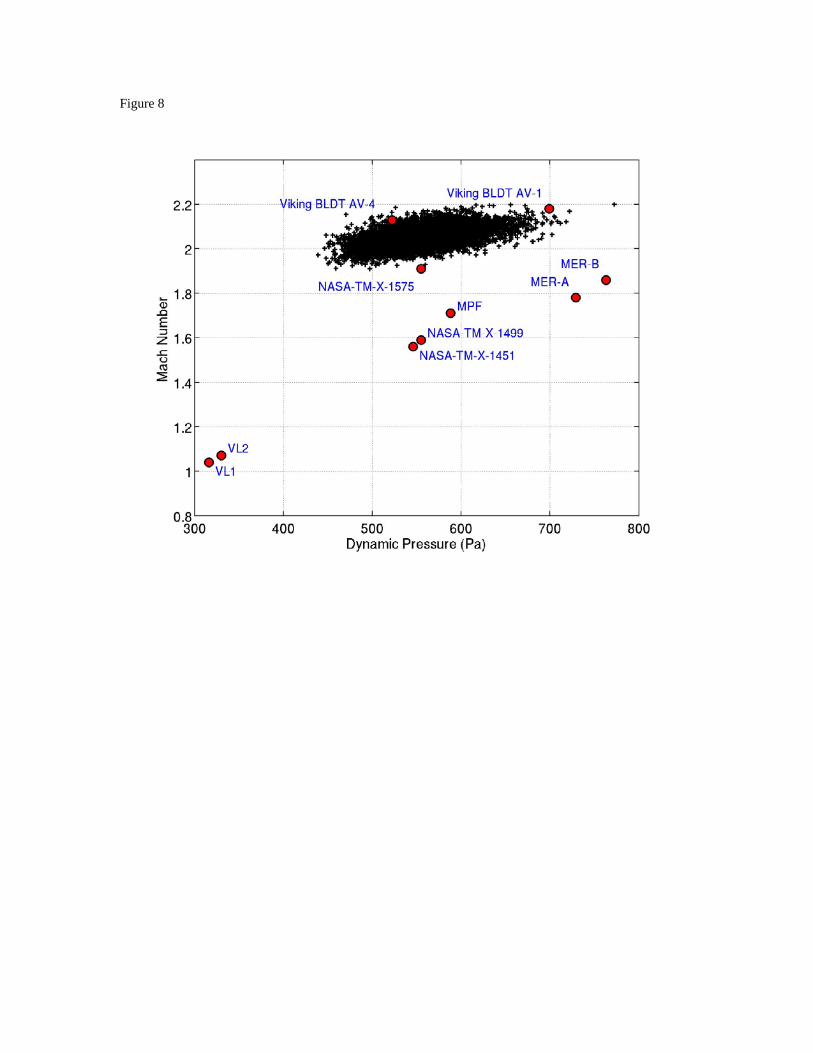
Figure 8
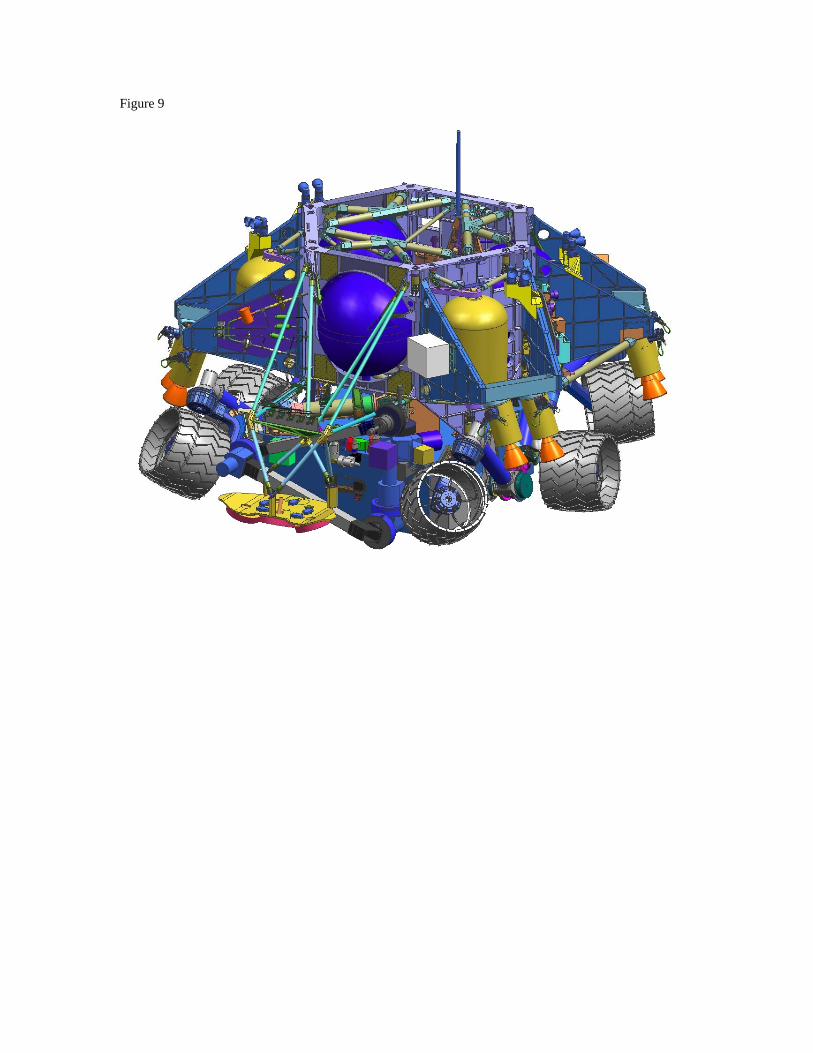
Figure 9
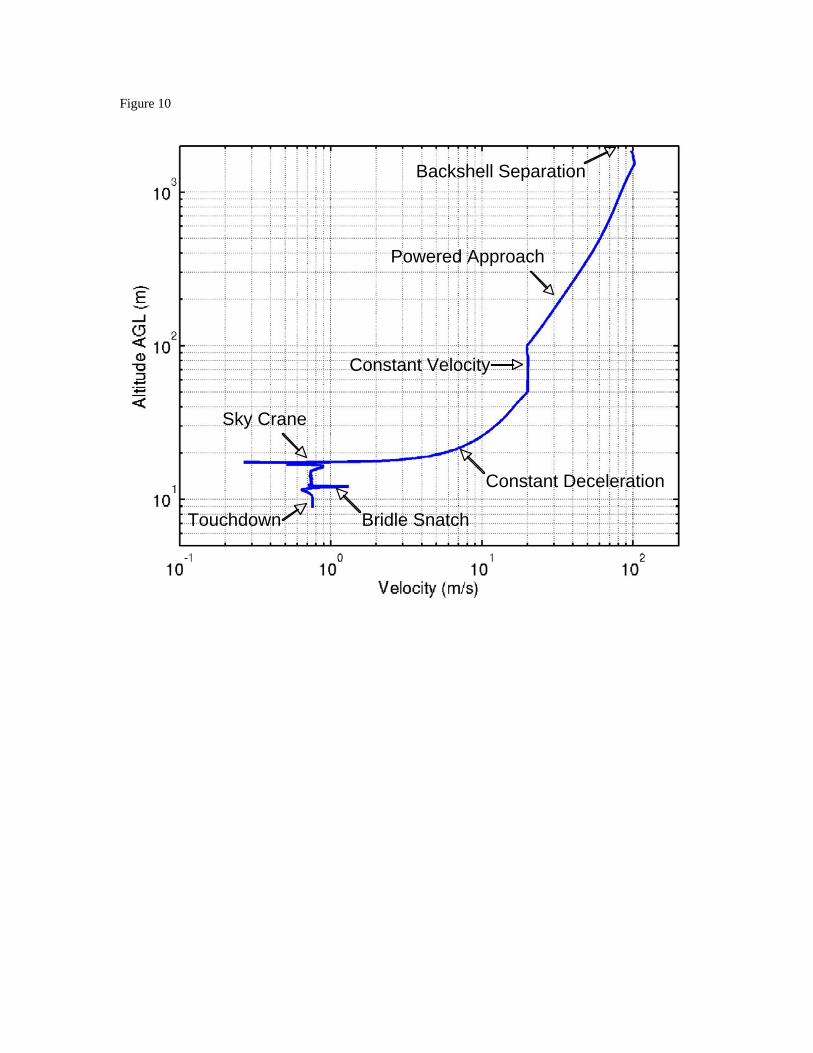
Figure 10
Backshell Separation
Powered Approach
Constant Velocity
Constant Deceleration
Sky Crane
Bridle SnatchTouchdown
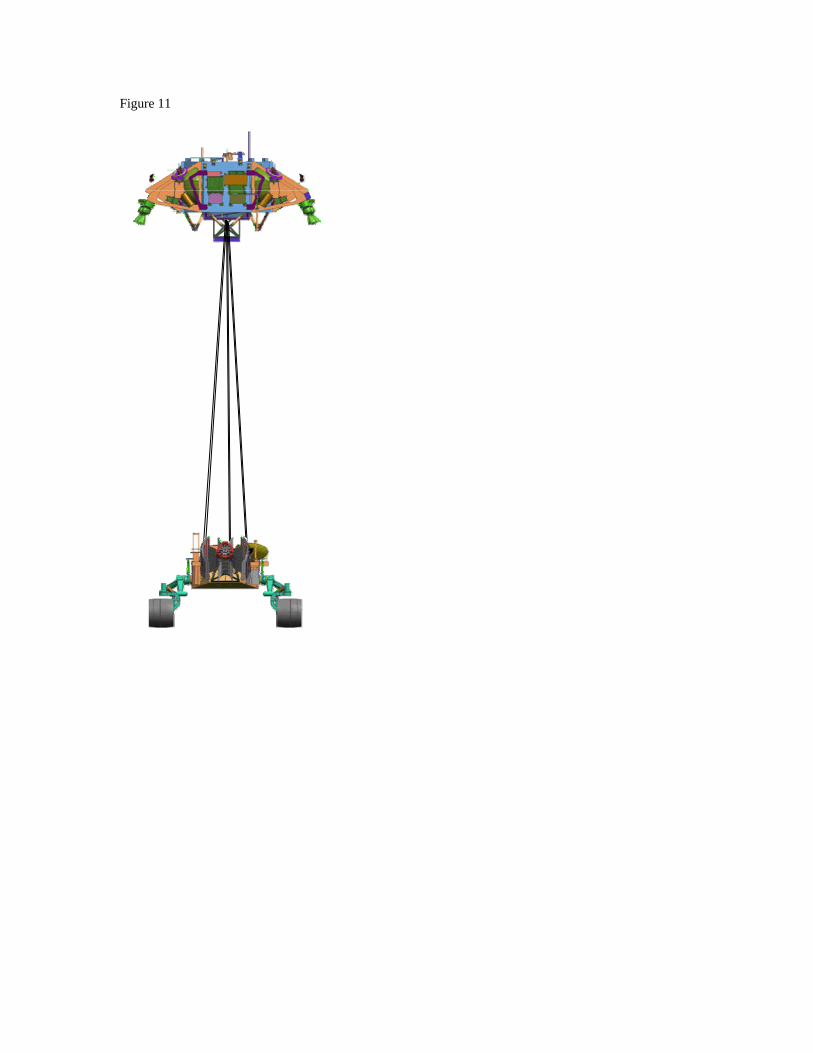
Figure 11
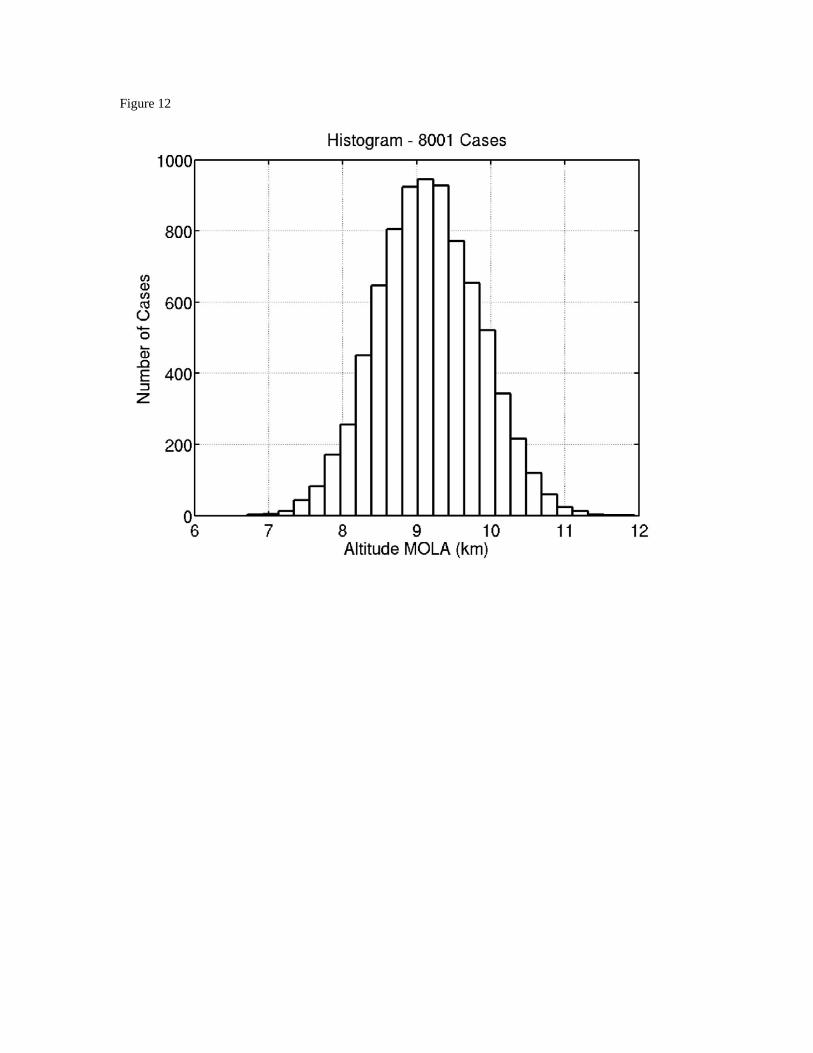
Figure 12
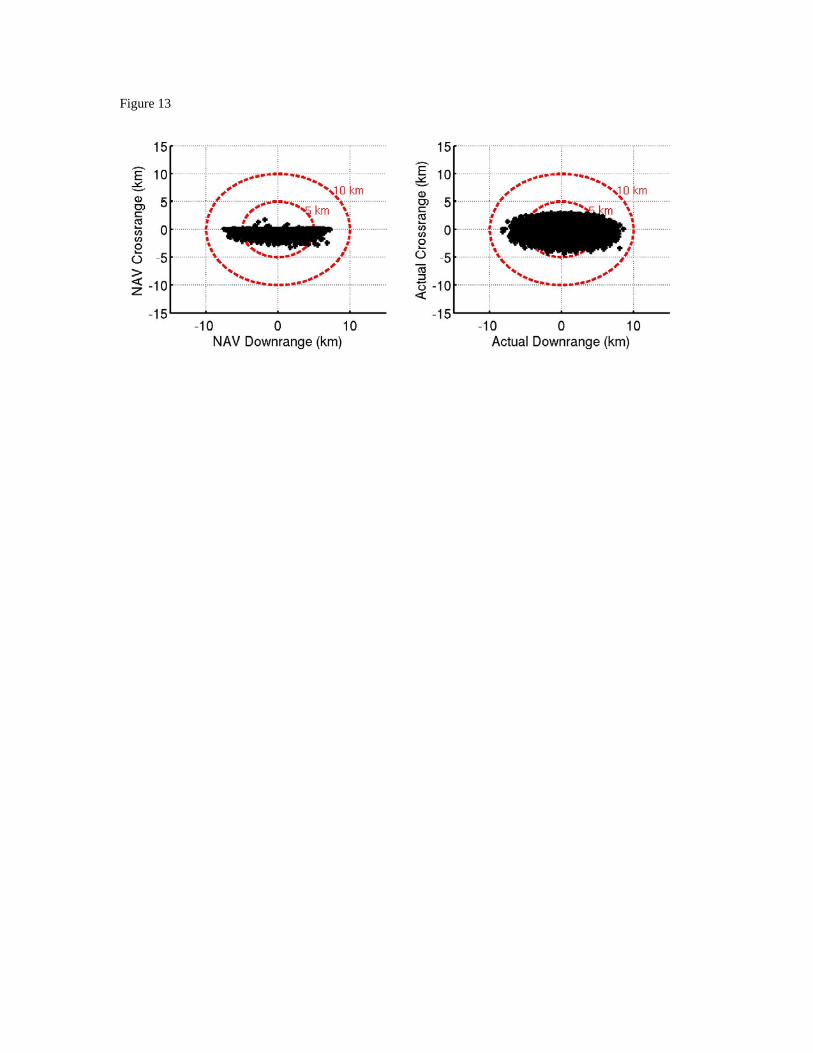
Figure 13
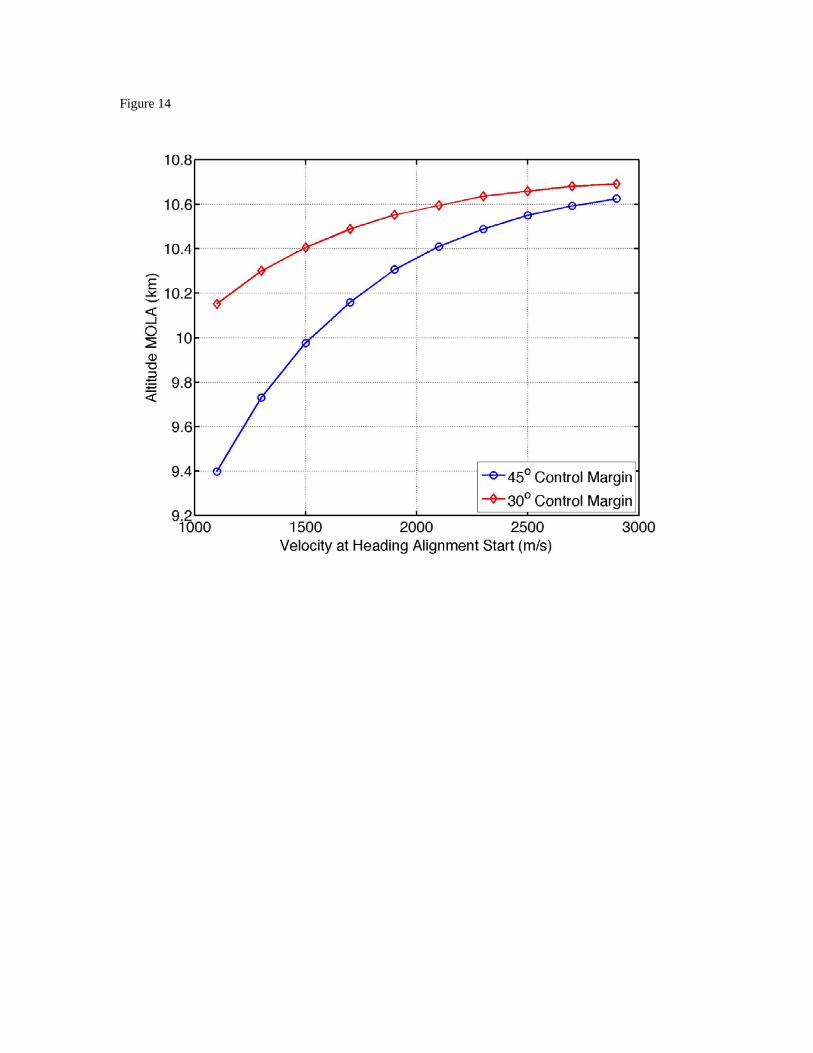
Figure 14
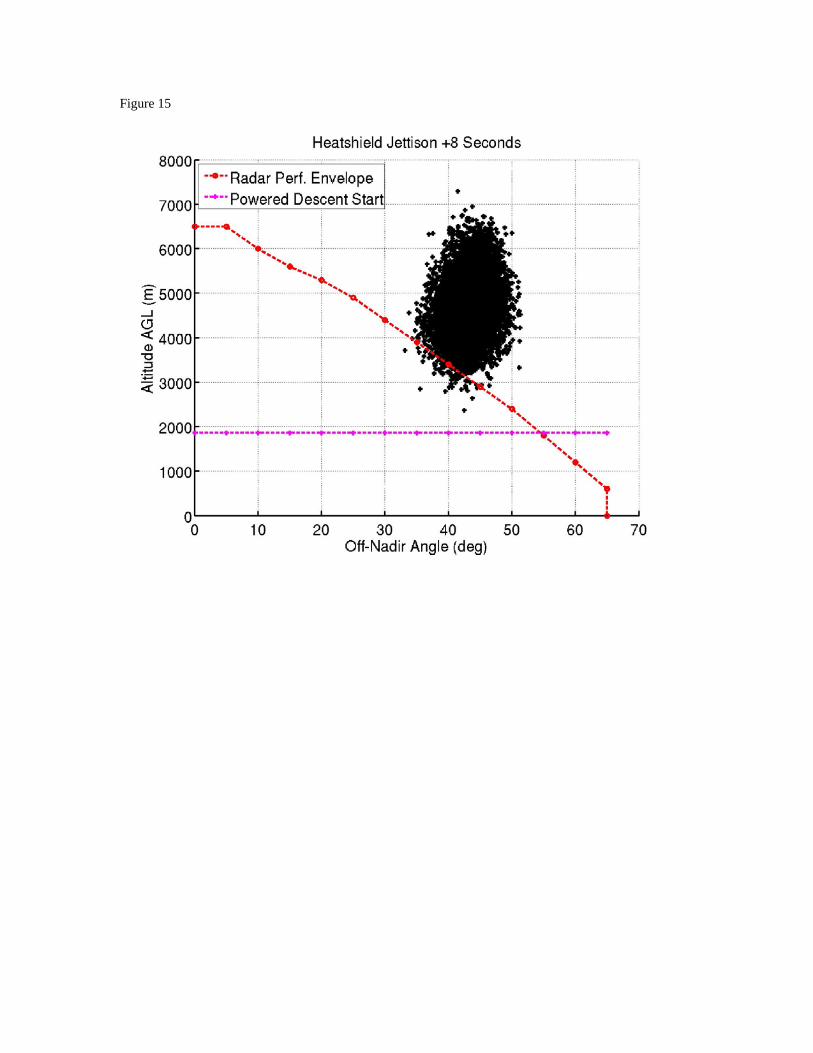
Figure 15
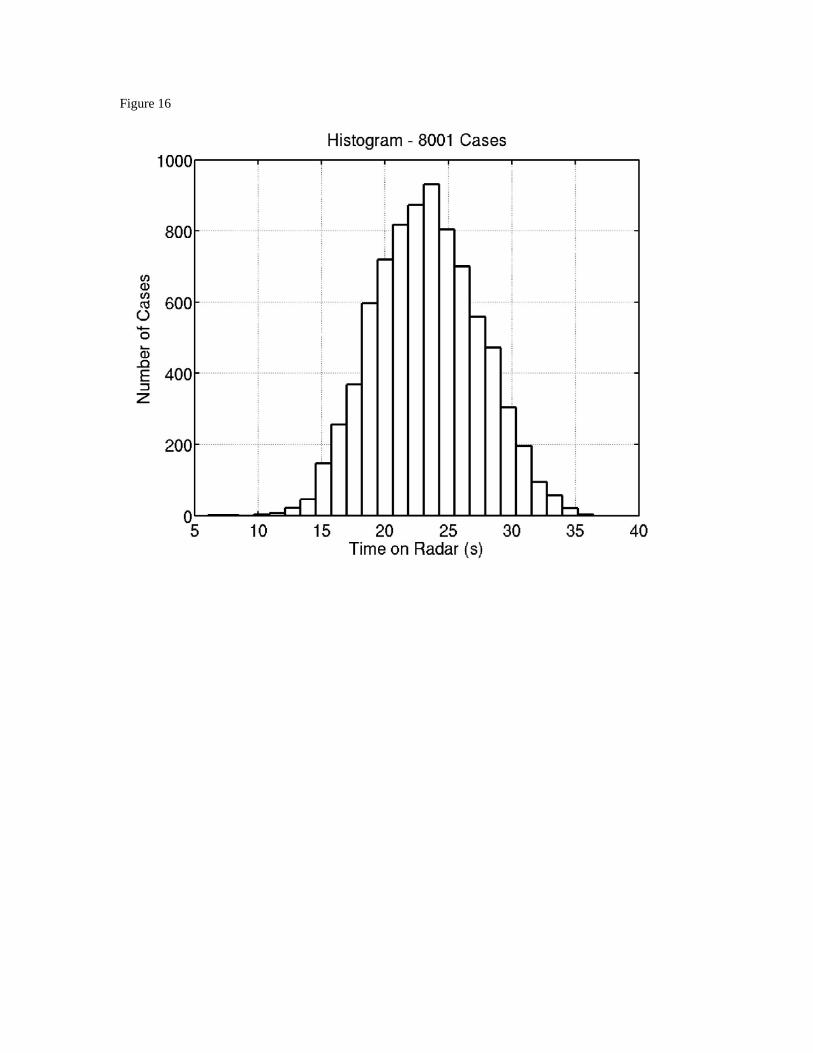
Figure 16
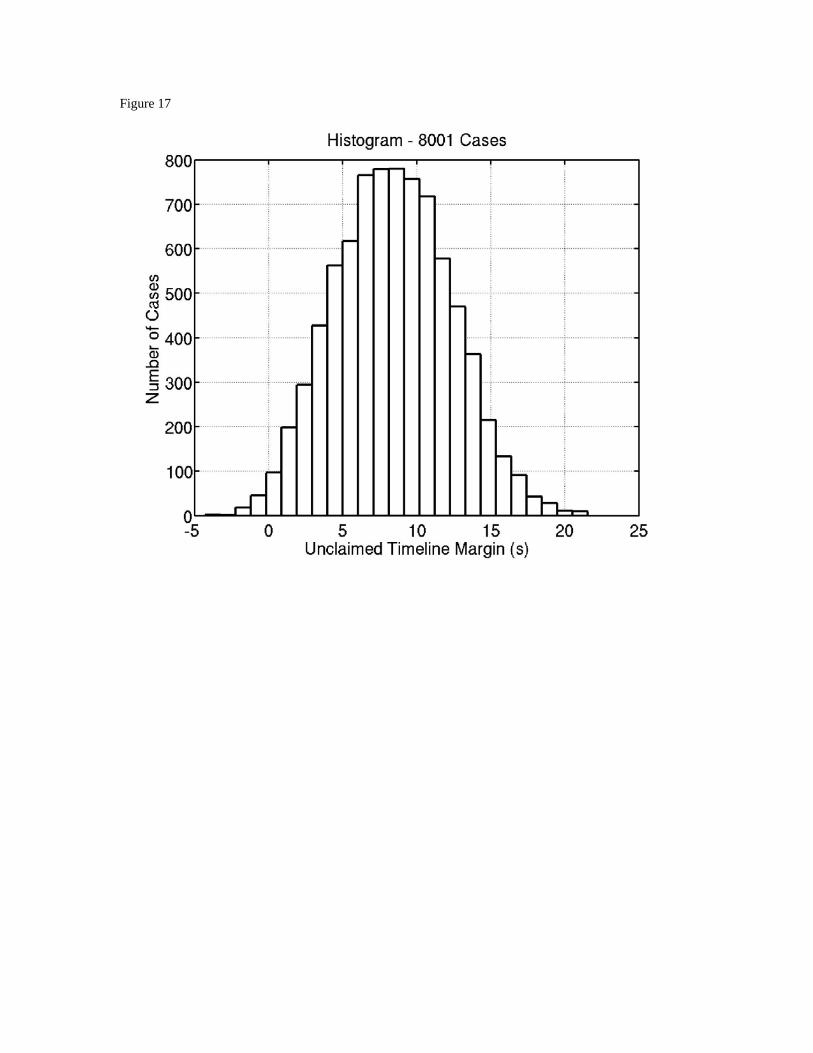
Figure 17
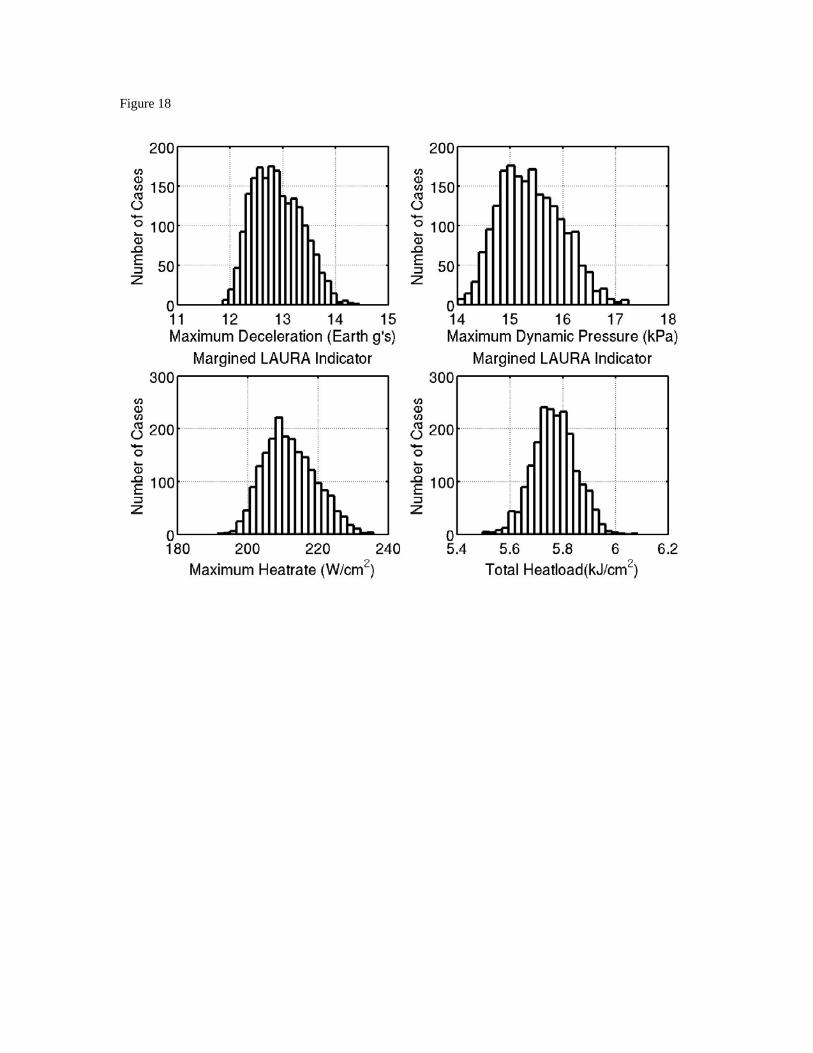
Figure 18
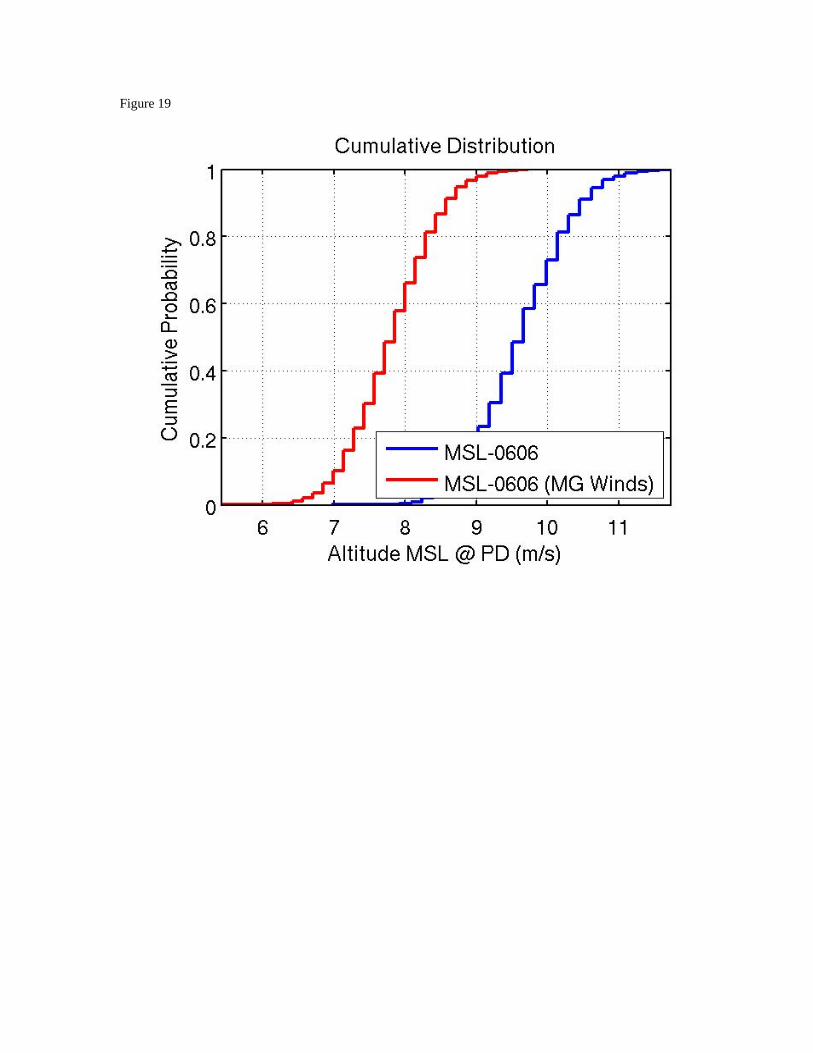
Figure 19
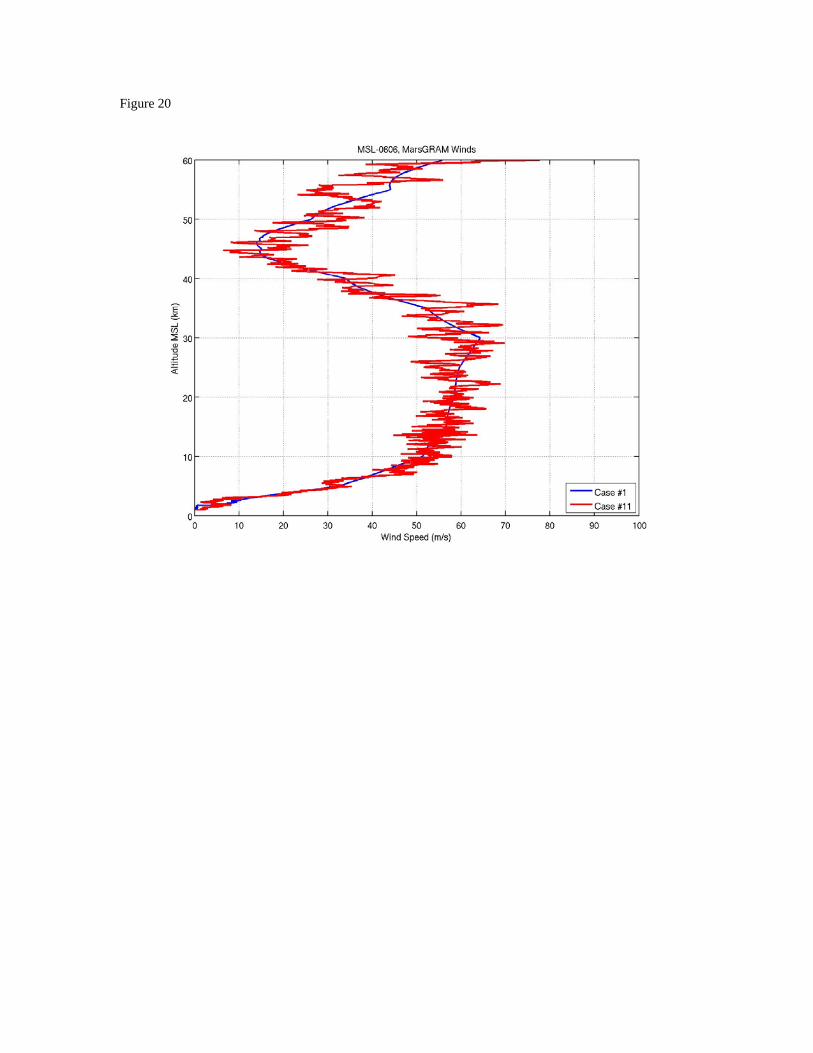
Figure 20
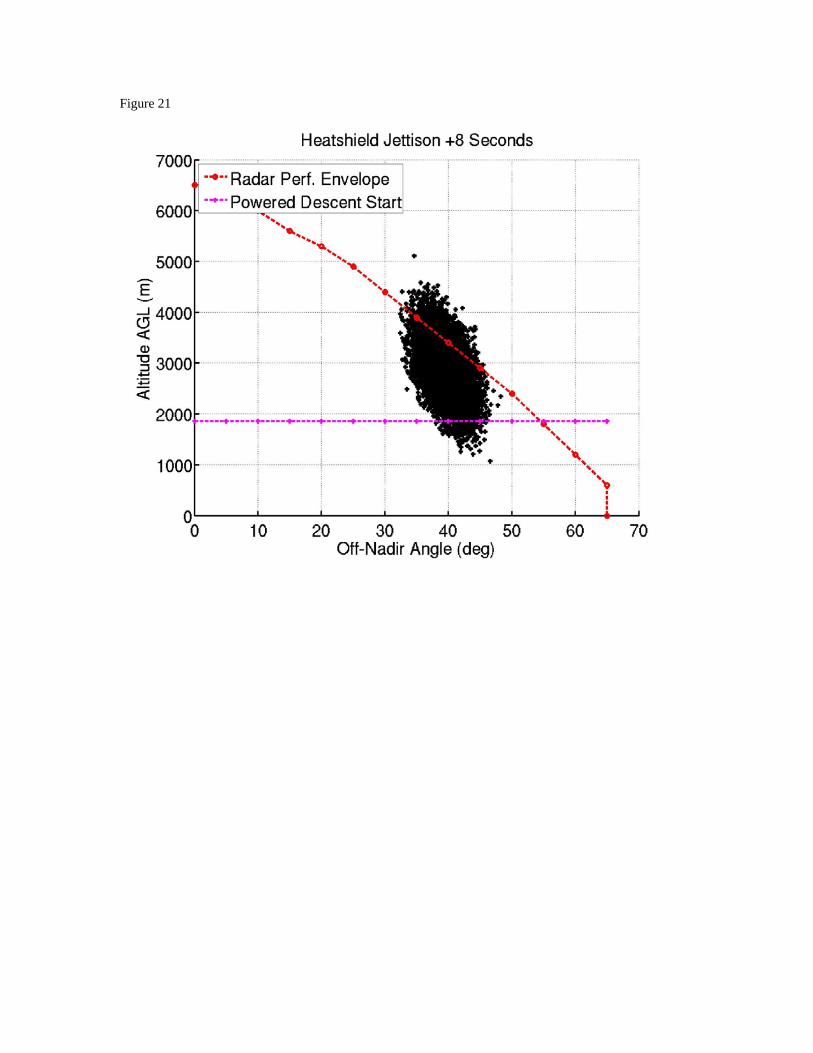
Figure 21
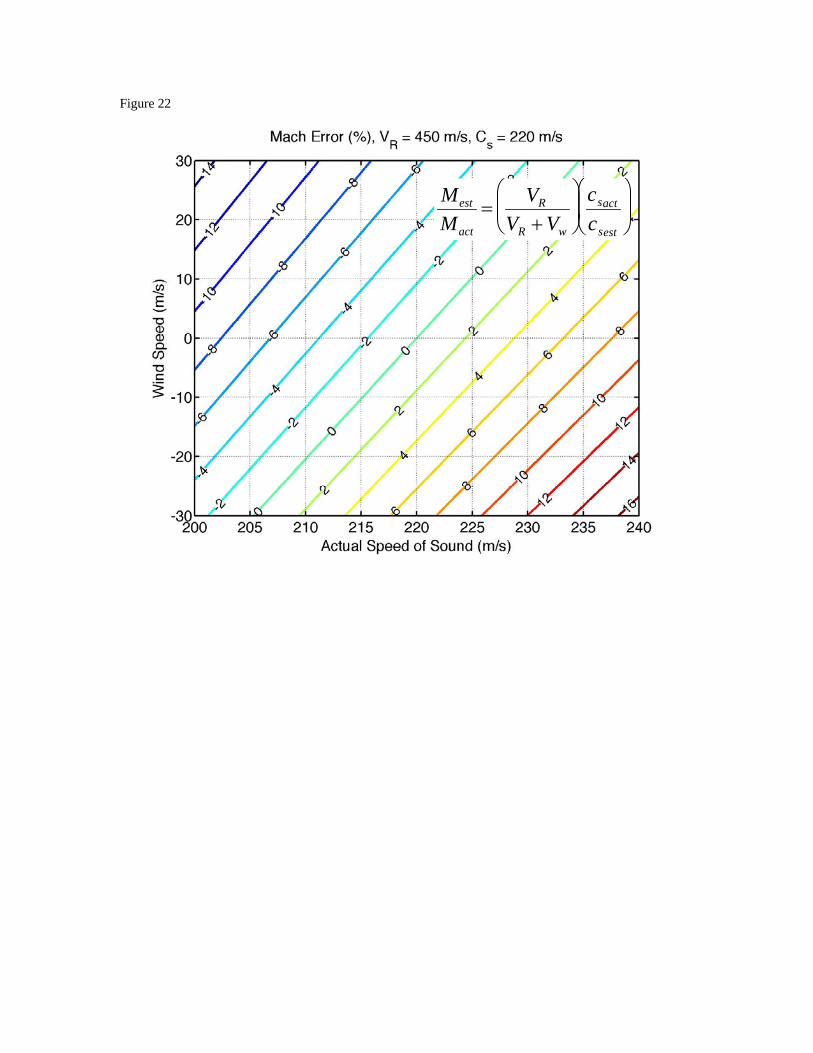
Figure 22
Mest
Mact
=VR
VR + Vw
⎛
⎝ ⎜
⎞
⎠ ⎟
csact
csest
⎛
⎝ ⎜
⎞
⎠ ⎟
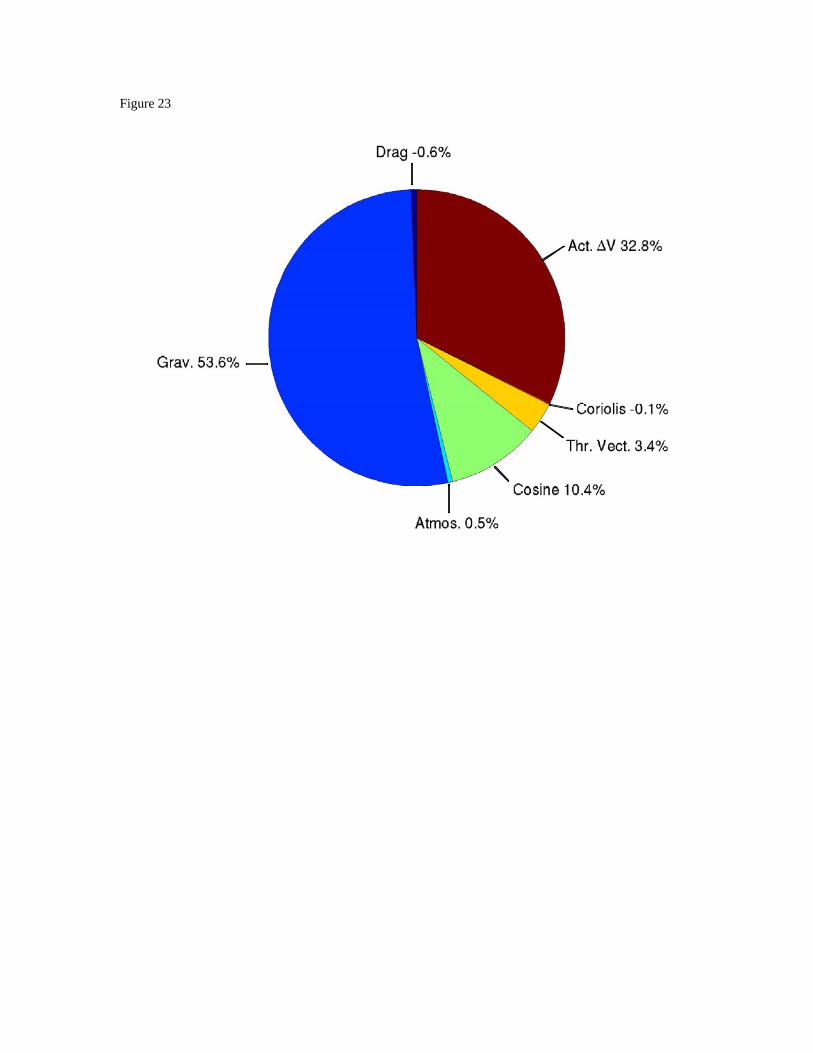
Figure 23