Markus Von Prause (EAP, Ecology) - whatcom.wsu.edu€¦ · Markus Von Prause (EAP, Ecology) A...
35
Markus Von Prause (EAP, Ecology) A review of long term freshwater quality trends in the Nooksack River at Brennan.
-
Upload
truongdieu -
Category
Documents
-
view
214 -
download
0
Transcript of Markus Von Prause (EAP, Ecology) - whatcom.wsu.edu€¦ · Markus Von Prause (EAP, Ecology) A...

Markus Von Prause (EAP, Ecology)A review of long term freshwater quality trends in the Nooksack River at Brennan.
Presentation OverviewThis presentation includes:
• An overview of WA Ecology’s freshwater ambient monitoring program.
• A review of current water quality index trends (1994-2013) for 01A050 (Nooksack River @ Brennan).
• A summary of annual and seasonal nitrogen /phosphorus concentrations, flux/yield trends (1994-2013) residing in the Nooksack River at Brennan.
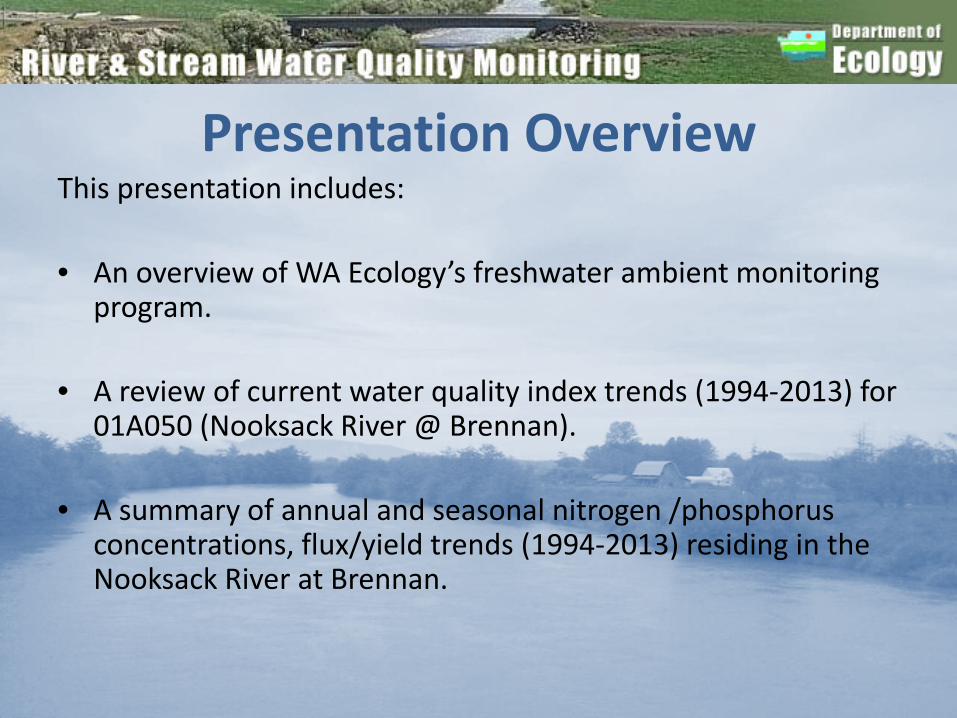
Overall Program Objectives: • Provide water quality information in order to determine
which water bodies are exceeding water quality standards and to evaluate baseline conditions/trends.

We collect data at the following station types:• Sixty-six "long-term" stations are monitored every year primarily for trends.• Eight "sentinel" stations are monitored every year for reference conditions, trends due to
climate change, and to support other types of monitoring.• Eight "basin" stations are monitored for one year to support Ecology's "Water Quality
Assessment" and especially to help refine category assignments.• We may monitor another 10 to 20 stations annually to support special projects.• Routinely measured indicators of water quality (and methods) are listed in the table, below.
We occasionally sample additional constituents to meet special needs.• Our routine monitoring data are summarized by a technique called the "Water Quality Index"
(WQI).
The Washington State Department of Ecology conducts monthly water quality monitoring (October through September) at hundreds of stream stations throughout the state for nearly 50 years.
ammonia (SM4500NH3H) nitrate plus nitrite (SM4500NO3I) phosphorus, total (SM4500PH)
conductivity (SM2510B) nitrogen, total (SM4500NB) suspended solids (SM2540D)
flow (at most stations) pH (EPA150.1) temperature (thermistor)
metals (bimonthly, at a few stations) (EPA200.8, 245.7)
phosphorus, soluble reactive (SM4500PG)
turbidity (SM2130)
Background

Puget Sound Region
• 38 monitoring stations in the PS Region.
• 13 stations have a record of 20 + years data to infer WQI trends.
Station Station Name01A050 Nooksack R @ Brennan03A060 Skagit R nr Mount Vernon03B050 Samish R nr Burlington04A100 Skagit R @ Marblemount05A070 Stillaguamish R nr Silvana07A090 Snohomish R @ Snohomish07C070 Skykomish R @ Monroe08C110 Cedar R nr Landsburg09A080 Green R @ Tukwila 10A070 Puyallup R @ Meridian St11A070 Nisqually R @ Nisqually13A060 Deschutes R @ E St Bridge18B070 Elwha R nr Port Angeles

Site Background
N

• Routine monitoring data are summarized.• The WQI ranges from 1 (poor quality) to 100 (good quality).• To answer non-technical question about water quality at our monitoring stations.• To provide a general interpretation of raw data for our web presentation.• A tool for the management of water quality and public reporting.• The WQI also allows "drilling down" from the overall score to scores for individual parameters
(what parameters are of particular concern?) and scores for individual months (during what months are problems most common?). The index can even be used to evaluate trends (is overall water quality getting better or worse?).
0
10
20
30
40
50
60
70
80
90
100
WQ
I Sco
re
Station
What is the Water Quality Index?

• Average index scores at 13 long-term monitoring stations• Current Freshwater Quality Index scores for major rivers in Puget Sound are in the mid 70s( > 0.34 units per year
(p<0.10)). Variability in WQI scores have also decreased since 1995 (> 6.0 units per year p<0.05)
WQI Reporting: Puget Sound Partnership & WA Governor's Salmon Recovery Office
0
10
20
30
40
50
60
70
80
90
100
1995 1996 1997 1998 1999 2000 2001 2002 2003 2004 2005 2006 2007 2008 2009 2010 2011 2012 2013
WQ
I Sco
res
Water YearRed line : water quality met expectations (good)
Trend slope 0.05 -0.00 0.83 0.07 0.11 0.04 0.02 0.30 0.18 0.51 0.20 -0.02 -0.26Average 57 76 69 69 69 83 94 64 55 72 72 87 77Sig. Trend N+ N- N+ N+ N+ YES+ YES+ N+ YES+ YES+ N- YES-
Nooksack Lower Skagit Samish Upper
Skagit Stillaguamish Snohomish Cedar Green Puyallup Deschutes Nisqually SkokomishElwah

Station Staname Year OverallWQI WQIFC WQIOxy WQIpH WQITSS WQITemp WQITPN WQITP WQITurb
01A050 Nooksack R @ Brennan 1995 56 75 80 96 29 73 53 28 24
01A050 Nooksack R @ Brennan 1996 49 66 80 96 54 71 52 51 51
01A050 Nooksack R @ Brennan 1997 41 63 73 93 36 82 43 29 34
01A050 Nooksack R @ Brennan 1998 62 78 78 96 68 80 54 69 63
01A050 Nooksack R @ Brennan 1999 42 82 88 96 36 89 34 34 33
01A050 Nooksack R @ Brennan 2000 65 75 85 96 55 83 63 58 54
01A050 Nooksack R @ Brennan 2001 68 80 82 94 60 83 63 69 68
01A050 Nooksack R @ Brennan 2002 58 86 81 96 51 77 46 52 55
01A050 Nooksack R @ Brennan 2003 57 81 79 96 42 76 70 52 44
01A050 Nooksack R @ Brennan 2004 52 78 79 96 15 78 64 18 12
01A050 Nooksack R @ Brennan 2005 54 78 78 97 39 78 61 49 33
01A050 Nooksack R @ Brennan 2006 61 84 81 98 43 82 58 51 35
01A050 Nooksack R @ Brennan 2007 51 78 83 97 48 84 57 55 39
01A050 Nooksack R @ Brennan 2008 60 84 88 97 31 87 61 16 24
01A050 Nooksack R @ Brennan 2009 69 79 85 97 47 71 72 42 47
01A050 Nooksack R @ Brennan 2010 56 81 79 95 34 79 73 22 28
01A050 Nooksack R @ Brennan 2011 55 71 90 96 37 88 62 11 32
01A050 Nooksack R @ Brennan 2012 62 80 80 97 38 85 69 42 48
01A050 Nooksack R @ Brennan 2013 61 84 85 93 40 83 54 45 48
Annual Mean 57 78 82 96 42 80 58 42 41
Nutrient and sediment scores drive overall annual mean scores down for this site.
WQI <40 Poor
WQI 40-70 Moderate
WQI > 80 Good
WQI scores for the Nooksack River at Brennan 1995-2013.
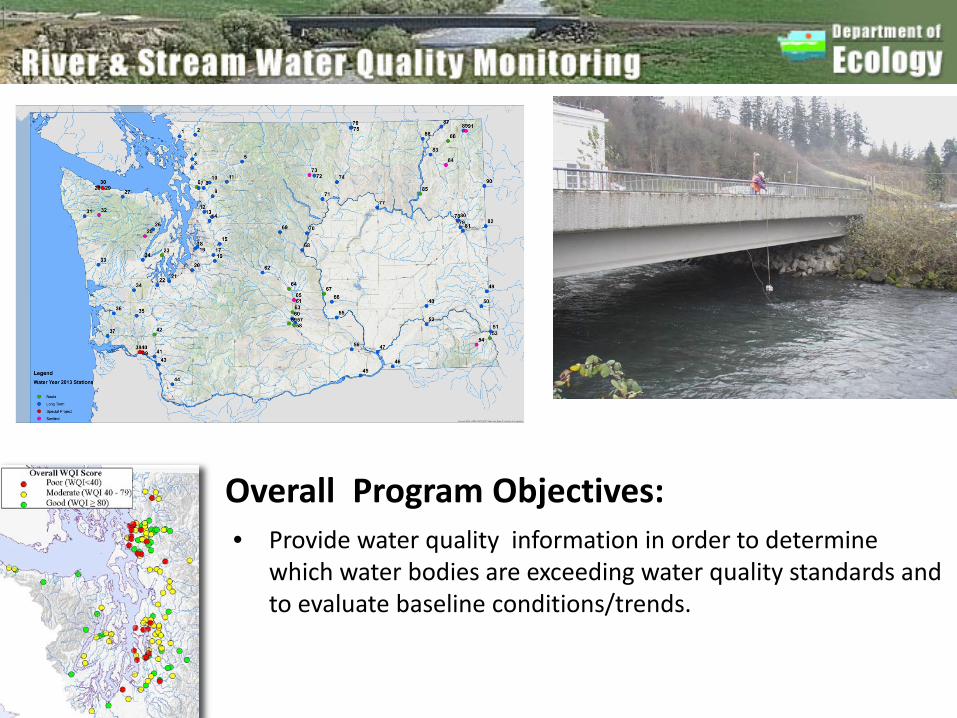
Concentration trendstime span change slope change slope
mg/L mg/L/yr % %/yr
1998 to 2003 -0.042 -0.0084 -8.4 -1.71998 to 2008 -0.078 -0.0078 -16 -1.61998 to 2013 -0.096 -0.0064 -19 -1.32003 to 2008 -0.036 -0.0072 -7.8 -1.62003 to 2013 -0.054 -0.0054 -12 -1.22008 to 2013 -0.018 -0.0035 -4.2 -0.83
Flux Trendstime span change slope change slope
kg/day kg/day /yr % %/yr1998 to 2003 -419 -84 -8.2 -1.61998 to 2008 -795 -79 -16 -1.61998 to 2013 -890 -59 -17 -1.22003 to 2008 -375 -75 -8 -1.62003 to 2013 -471 -47 -10 -12008 to 2013 -95 -19 -2.2 -0.44
Years N Slope 2*P Signif
1995-2013 236 -0.004 0.012 YES-

Seasonal concentration variability for Total Nitrogen (TN) is less during January, April and July.
TN m
g/L

Puget Sound Freshwater Nitrogen Yields 1995-2013• Annual nitrogen yields in Puget Sound continue to be the highest in the Samish, Nooksack, and Stillaguamish watersheds. Summer nitrogen yields were highest in the Nooksack and Deschutes watersheds.
• Among the major rivers, the Snohomish River and the Nooksack River represents the largest sources of freshwater nitrogen contribution to Puget Sound.
StationTN(all)
NO23(all)
TN (Summer)
NO23(Summer)
01A050 90.54 64.43 19.74 14.7101A120 41.39 32.35 10.27 7.7503A060 23.56 15.93 8.13 4.7803B050 81.3 64.15 10.15 8.704A100 13.48 9.4 7.81 5.6305A070 92.04 49.2 12.8 8.3705B070 56.18 44.74 10.28 6.8905B110 54.24 41.24 6.12 4.4707A090 52.89 41.4 11.75 8.1407C070 36.63 28.61 8.08 5.0607D050 53.37 41.44 11.06 8.2607D130 45.36 37.39 13.03 10.408C070 40.39 53.49 7.52 4.4708C110 26.78 23 14.17 12.6309A080 52.1 36.17 12.41 8.8209A190 21.7 16.81 3.9 2.1310A070 36.46 23.47 14.21 7.5311A070 29.05 19.19 6.9 4.3913A060 49.7 41.22 17.95 15.4716A070 34.56 13.03 4.57 2.6916C090 9.78 5.01 2.64 1.1318B070 10.4 4.23 3.62 0.95

WY 13 Annual Report : Nitrogen in Puget Sound Rivers Update
• Freshwater contributions to nitrogen in the marine environment have not increased since 1995. Furthermore, there is overall slight decreasing trend for total TN flux from freshwater systems in the Puget Sound from 1995-2013.
• Among the major rivers, the Snohomish River and the Nooksack River represents the largest sources of freshwater nitrogen contribution to Puget Sound.
T o t a l
N i t r
o g e n
F l u x
( k g / m
o n t h
* 1 0 - 6
)
YEAR
0
1
2
3
4
5
6
7
8
9
10
11
All Seasons Seasonal Sen Slope
94 95 96 97 98 99 00 01 02 03 04 05 06 07 08 09 10 11 12 13
Seasonal Kendall (SKC)Slope = -0.00666Z = -1.536 Signif 80%2xP = 0.1245

Total Phosphorus
Concentration trendstime span change slope change slope
mg/L mg/L/yr % %/yr1998 to 2003 -0.0084 -0.0017 -12 -2.51998 to 2008 0.0048 0.00048 7 0.71998 to 2013 0.024 0.0016 35 2.32003 to 2008 0.013 0.0026 22 4.42003 to 2013 0.032 0.0032 54 5.42008 to 2013 0.019 0.0038 26 5.2
Flux Trendstime span change slope change slope
kg/day kg/day /yr % %/yr1998 to 2003 -144 -29 -11 -2.11998 to 2008 84 8.4 6.1 0.611998 to 2013 417 28 31 22003 to 2008 228 46 19 3.72003 to 2013 561 56 46 4.62008 to 2013 333 67 23 4.6

TP m
g/L
YEAR
01A050 TP Concentrations 2005-2013
0.01
0.020.030.040.05
0.1
0.2 0.3 0.4 0.5
All Seasons Seasonal Sen Slope
2005 2006 2007 2008 2009 2010 2011 2012 2013
Seasonal Kendall (SK) Slope = 0.00264 Z = 2.816 Signif 99% 2xP = 0.0049

Significant seasonal shifts in N to P Ratios observed during July and September

Decrease in Turbidity from 2005-2013 Concentration trendstime span change slope change slope
ntuL ntu/yr % %/yr
1998 to 2003 3.6 0.73 7.8 1.61998 to 2008 4.1 0.41 8.9 0.891998 to 2013 -7.2 -0.48 -15 -12003 to 2008 0.5 0.1 1 0.22003 to 2013 -11 -1.1 -22 -2.22008 to 2013 -11 -2.3 -22 -4.5
Flux Trendstime span change slope change slope
kg/day kg/day /yr % %/yr1998 to 2003 131463 26293 9.9 21998 to 2008 54859 5486 4.1 0.411998 to 2013 -339096 -22606 -26 -1.72003 to 2008 -76604 -15321 -5.2 -12003 to 2013 -470559 -47056 -32 -3.22008 to 2013 -393955 -78791 -28 -5.7

There are significant (p <0.05) correlations between total phosphorus (TP) concentrations and turbidity measurements at 01A050.
y = 427.36x + 5.1456R² = 0.737
1
10
100
1000
0.001 0.01 0.1 1
01A050 Log NTUSeries1 Linear (Series1)
01A0
50 L
og To
tal P
hosp
horu
s mg/
L
Coefficients Standard Error t Stat P-valueIntercept 0.0103 0.0053 1.92 0.05
NTU 0.00172 7.74 22.25 3.64

There are non significant (p <0.05) correlations between total nitrogen concentrations and with turbidity measurements.
y = -29.034x + 44.862R² = 0.0129
1
10
100
1000
0.01 0.1 101A050 Log NTUSeries1 Linear (Series1)
01A0
50 L
og To
tal N
itrog
en (m
g/L)
Coefficients
Standard Error t Stat P-value
Intercept 0.314 0.020 15.56 5.70E-35ntu -0.00044 0.00 -1.52 0.12

• Increase in the magnitude of high flow events since 2002.

01A050Season Consisting of Apr May Junmean daily
Streamflow Trendstime span change slope change slope
cms cms/yr % %/yr1998 to 2003 12 2.3 10 21998 to 2008 24 2.4 21 2.11998 to 2013 38 2.5 34 2.22003 to 2008 13 2.6 10 22003 to 2013 27 2.7 21 2.12008 to 2013 14 2.8 10 2
Spring Seasonal Discharge(Q)
1994-2013 significant increase mean dischargeP value =0.01
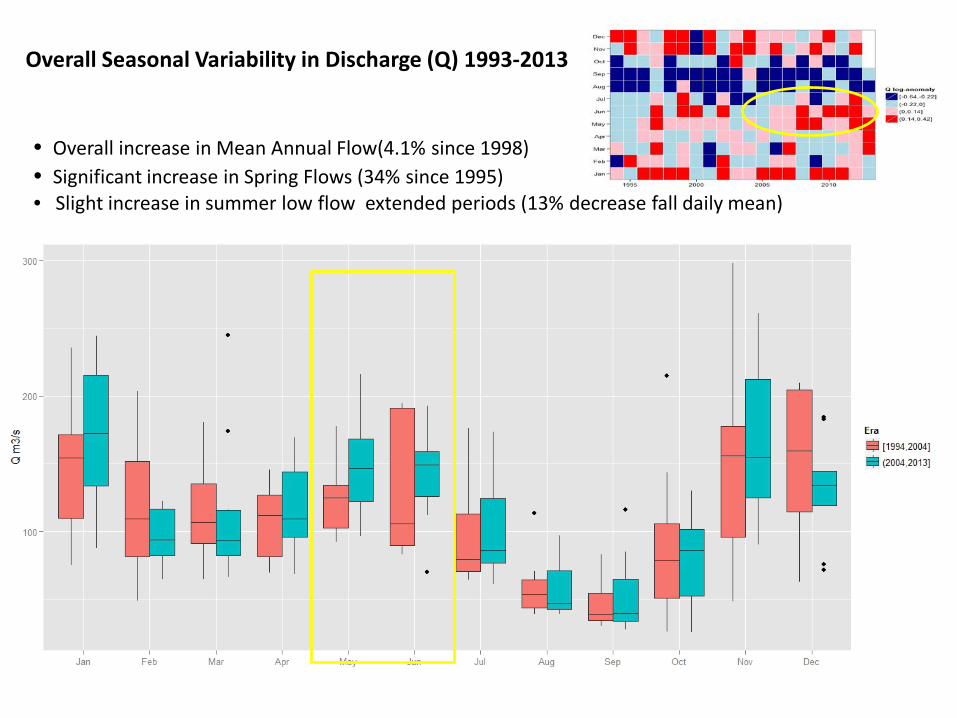
Overall Seasonal Variability in Discharge (Q) 1993-2013
• Overall increase in Mean Annual Flow(4.1% since 1998) • Significant increase in Spring Flows (34% since 1995)• Slight increase in summer low flow extended periods (13% decrease fall daily mean)

Seasonal changes in turbidity concentrations as a function of discharge.
Concentration trendstime span change slope change slope
mg/L mg/L/yr % %/yr
1998 to 2003 3.6 0.73 7.8 1.61998 to 2008 4.1 0.41 8.9 0.891998 to 2013 -7.2 -0.48 -15 -12003 to 2008 0.5 0.1 1 0.22003 to 2013 -11 -1.1 -22 -2.22008 to 2013 -11 -2.3 -22 -4.5
Flux Trendstime span change slope change slope
10^6 kg/yr 10^6 kg/yr /yr % %/yr1998 to 2003 48 9.6 9.9 21998 to 2008 20 2 4.1 0.411998 to 2013 -124 -8.3 -26 -1.72003 to 2008 -28 -5.6 -5.2 -12003 to 2013 -172 -17 -32 -3.2
• Higher turbidity concentrations are observed during the spring season at flows under 50 m³/s
• Sediment mobilization is more frequent during the Spring since 2003 as spring seasonal flows increase.
Contour Plot 1. Difference Contours for turbidity concentrations as a function of discharge (Nooksack River at Brennan, for period of 1994-2013).

• Change in total nitrogen concentrations may be due to changes in Spring and Summer and fall flow conditions.
Changes in seasonal total nitrogen concentration as a function of discharge.
Contour Plot 2. Difference Contours for total nitrogen concentrations as a function of discharge (Nooksack River at Brennan, for period of 1994-2013).

Changes in seasonal total phosphorus concentration as a function of discharge.
• Higher concentrations of total phosphorus are present during summer and fall low flow conditions.
Contour Plot 3. Difference Contours for total phosphorus concentrations as a function of discharge (Nooksack River at Brennan, for period of 1994-2013).
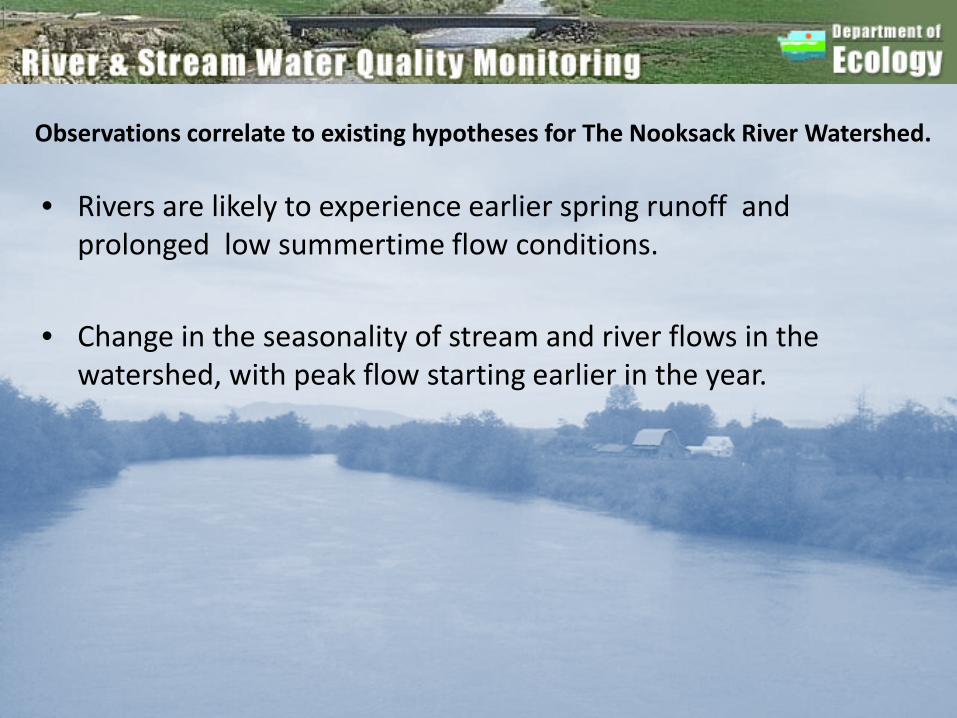
• Rivers are likely to experience earlier spring runoff and prolonged low summertime flow conditions.
• Change in the seasonality of stream and river flows in the watershed, with peak flow starting earlier in the year.
Observations correlate to existing hypotheses for The Nooksack River Watershed.

• Higher turbidity concentrations are observed during the spring season at flows under 50 m³/s.
• Total nitrogen concentration and flux have decreased since 1994 while total phosphorus levels have increased .
• Higher concentrations of phosphorus observed during the Summer and Fall low flow periods with potential longer residence times in the stream channel.
Preliminary Conclusions:
Related Challenges and Priority Gaps • To determine what drivers are responsible for the uptake and
release of freshwater nitrogen in the Nooksack River (Regional Modeling)
• To determine the mechanisms responsible for the overall processing of nitrogen in the Nooksack River. Are watershed processes playing a significant role in the reduction of nitrogen and concentration and flux observed near Brennan?
• A need for continuous monitoring for turbidity and nutrients at Brennan to understand the transport dynamics associated with changes in seasonal flows.
Q and A

Reference Slides For Q&A

• ConstituentsTemperature pHdissolved oxygen fecal coliform bacteria
total suspended solids turbiditytotal phosphorus total nitrogen
• Group stations by “expectations” (beneficial use, ecoregion, season)• Transform individual results to WQI scores (using curves for each constituent
and group)• Aggregate scores
WQI Methodology

WQI: Converting results to an index score
1. Long term data are aggregated into percentiles. Percentile WQI Score pH data
0.1 100 7.5
0.8 80 8.5
0.85 40 9.5
0.99 20 9.9
pH > 7.5, iWQI(pH)=-343 (b) + 129*pH (c1) – 9.33*pH2 (c2)
Percentile WQI Score pH data y=b+c1x+c2x^2 pH
0.1 100 7.5 b -343
0.8 80 8.5 c1 129
0.85 40 9.5 c2 -9.36
2. Percentiles are transformed in to curves with a polynomial function.

0
20
40
60
80
100
120
4 5 6 7 8 9 10 11
i-WQ
I (pH
) sco
re
pH (std. units)
WQS Criteria
pH > 7.5, iWQI(pH)=-343 (b) + 129*pH (c1) – 9.33*pH2 (c2)
WQI: Converting results to an index score
WQS is based on criteria in Washington’s Water Quality Standards, WAC 173-201A.

Individual parameters are transformed to a common scale• Results at the Water Quality
Standard = 80 Results at the 80th percentile = 80
(stratified by geography and season)
Transformed scores are aggregated by parameter, time, location
Freshwater Water Quality Index
Fecal coliform bacteria, pH, dissolved oxygen, temperature
Total phosphorus, total nitrogen, suspended sediment, turbidity
0.1
1
10
100
1000
100000
20
40
60
80
100
1994 1995 1996 1997 1998 1999 2000 2001 2002 2003 2004 2005 2006 2007 2008 2009 2010
FC B
act (
col./
100m
L)
Ove
rall
WQ
I

UW/ FMU Isotope Study Data Update 10/13/2014: Atmospheric Sources of Nitrate in the Puget Sound
-5
-3
-1
1
3
5
7
-6.5 -4.5 -2.5 -0.5 1.5 3.5 5.5
δ17O
δ18O
Atmospheric Deposition Signal!!!
Skagit and Stillaguamish (April)Skagit, Snohomish, Duckabush, Skykomish, SF Stillaguamish and Elwha (June)Equation for predicted atmospheric signal (black line): Blackline: Δ17O NO3 = δ17O NO3 - 0.52 (δ18ONO3)Freshwater = Red, Marine = blue
The Skagit and Stillaguamish provide background information on atmospheric sources of nitrate. Many rivers are near or just above zero, but rivers like the Skagit and Stillaguamish are on the order of 15% atmospheric deposition.


![ISTVAN PRAUSE Abstract. arXiv:1611.06734v2 [math.CV] 31 ...](https://static.fdocuments.net/doc/165x107/62b52518ebbd12386f504fe9/istvan-prause-abstract-arxiv161106734v2-mathcv-31-.jpg)