Markov Decision Processes for Chronic Diseases · Markov Decision Processes for Chronic Diseases...
37
Markov Decision Processes for Chronic Diseases Lessons learned from modeling type 2 diabetes Brian Denton Department of Industrial and Operations Engineering University of Michigan
Transcript of Markov Decision Processes for Chronic Diseases · Markov Decision Processes for Chronic Diseases...

Markov Decision Processes for Chronic Diseases Lessons learned from modeling type 2 diabetes Brian Denton Department of Industrial and Operations Engineering University of Michigan

Agenda
• Models for study of diabetes
treatment decisions
• Methods for sensitivity analysis
• Examples: • HbA1C control
• Cholesterol and blood pressure control

IOE Department Statistics:
Awarded over 6,500 bachelor's degrees
Awarded more than 2,577 master's degrees
Awarded 476 doctoral degrees
528 undergraduates
208 graduate students
31 faculty members (many interested in healthcare)
Department ranked #2 in US News
Industrial and Operations Engineering
My Research Interests
• Development and validation of quantitative models for comparative effectiveness
• Cost-Effectiveness of new technologies
• Predictive models for medical decision making

Privacy, Ethics, and Cost
Why resort to models?

0
1000
2000
3000
4000
5000
6000
7000
8000
PubMed Search Results

What is a Markov Decision Process?
• Starts with a Markov model for a disease (states,
transition probabilities, rewards)
• Overlays a decision process on the model that:
• Defines allowable “actions” at each time period and
each state
• Goal is to find the optimal action in each state at
each period to maximize “rewards”

Health States
before an event
has occurred.
State Transition Diagram
L
Non-Fatal
Events On Treatment
Death
r(L,W) r(M,W)
r(H,W)
r(S,I) r(E,I)
r(D,D)
r(V,W)
V M H
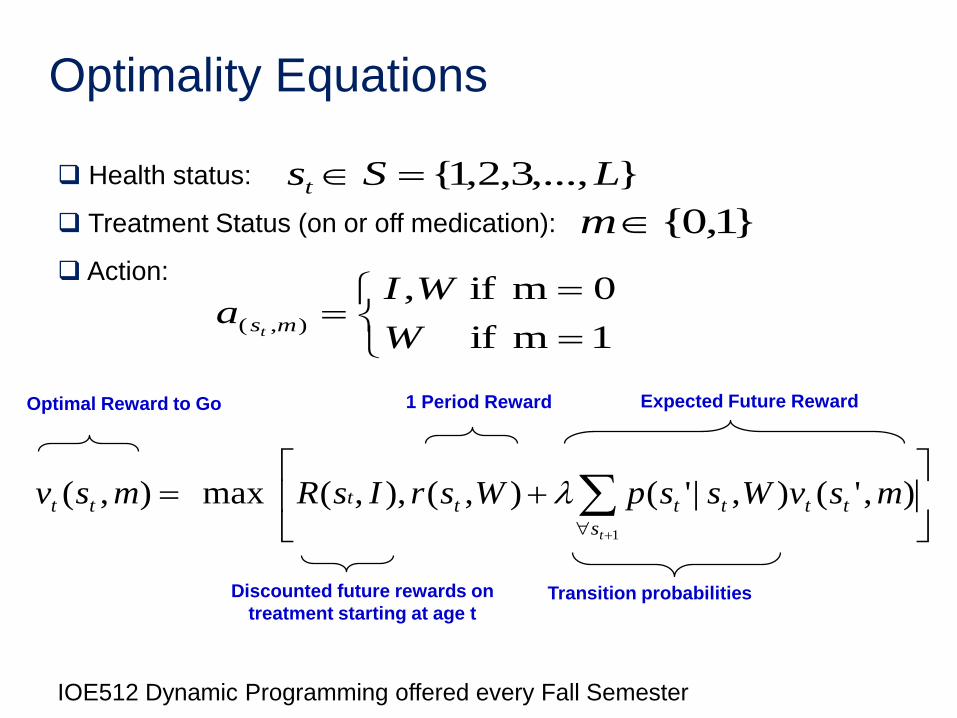
Optimality Equations
1
),'(),|'(),(),,(max),(ts
tttttttt msvWsspWsrIsRmsv
Expected Future Reward
Discounted future rewards on
treatment starting at age t Transition probabilities
Health status:
Treatment Status (on or off medication):
Action:
1m if
0m if,),(
W
WIa mst
}1,0{m
},...,3,2,1{ LSst
1 Period Reward Optimal Reward to Go
IOE512 Dynamic Programming offered every Fall Semester

Decision Process
Choose the best action each year to achieve a goal such as the following:
(Willingness to Pay)∙(Life Years) – Costs
Initiate or Delay
Treatment?
Expected benefit of treatment
Initiate or Delay
Treatment?
Expected benefit of treatment
Change in Health
Status
Change in Health Status
Initiate or Delay
Treatment?
Expected benefit of treatment
Change in Health Status
Age 40
Age 41
Age 42

States for Diabetes
HbA1c
Cholesterol: Total Cholesterol
HDL
Triglycerides
LDL
Blood Pressure
Health History
Medication History

Example: Cholesterol States
L / L L / M L / H L / V M / L V / V . . .
Total Cholesterol
Level High-density
Lipoprotein Level
TC and HDL have four possible levels each, so there
are 16 states in total.
L M H V
TC <160 160-200 200-240 >240
HDL < 40 40-50 50-60 >60

Example: Total Cholesterol

Computing Treatment Effects
Treatment options: Statins
Fibrates
Ace Inhibitors
ARBs
Calcium Channel Blockers
Thiazide
Time
Ch
ole
ste
rol
Treatment Initiation
Treatment Effect
𝜇𝑁𝑇
𝜇𝑇

Computing Treatment Effects
Electronic medical record data
– Selection bias
Published randomized trials
– Adherence bias
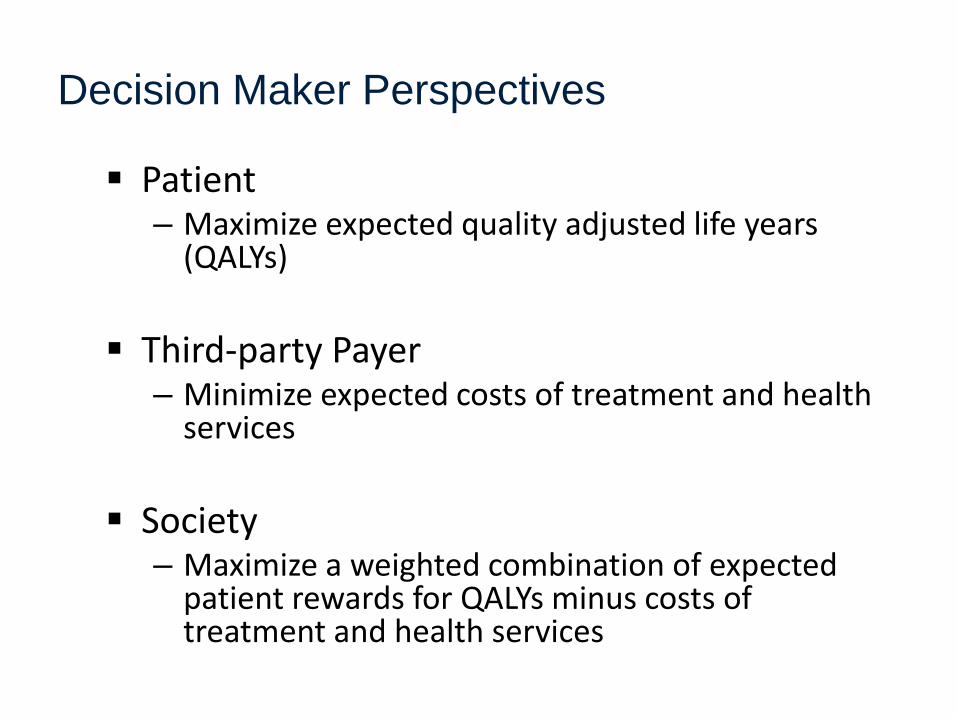
Decision Maker Perspectives
Patient – Maximize expected quality adjusted life years
(QALYs)
Third-party Payer
– Minimize expected costs of treatment and health services
Society
– Maximize a weighted combination of expected patient rewards for QALYs minus costs of treatment and health services

Societal Perspective
• Objective function includes rewards for quality adjusted life years (QALYs) and costs
Weighted
Benefit
Statin
Cost
One-time
Costs
Follow-up
Costs
ST
t
CHD
t
S
t
CHD
t
S
tttt mCsCFsCFsCsCasRasr ))()(())()((),(),(

Weighted Annual Benefit to the Patient
Stroke Decrement
Factor
Medication
Decrement Factor
CHD Decrement
Factor
Reward in
Dollars, i.e.
“Willingness
to Pay
0( , ) (1 ( ))(1 ( ))(1 ( ))S CHD ST
t t t t tR s a R d s d s d a

Reward Parameters
Systematic review of the literature via Pubmed
Insurance claims data
Pharmacy Redbook drug costs
Cost Effectiveness Registry: https://research.tufts-nemc.org/cear4/Home.aspx

Study Cohort
• Practice setting: Type 2 diabetes patients seen in 6 primary care sites at Mayo Clinic Rochester
• Sample definition: 663 patients with:
–Research authorization
–No prior hx: stroke-CHD
–10+ years of follow-up
Patient Attribute Study Cohort
Age, years 52.46 (8.83)
Diagnosis, years 3.24 (5.33)
% Female 39.67
Total Chol mgm% 216.27 (51.61)
HDL mgm% 43.65 (11.58)
LDL mgm% 126.98 (37.31)
SBP mm Hg 139.11 (19.75)
HbA1c 8.01 (2.38)

Treatment Effect
Metabolic Factors
Therapy SBP DBP Tot Chol HDL
ACEI/ARB -3.72 -5.48
Thiazide -4.97 -3.73
β Blocker -4.64 -4.17
CCBlocker -2.49 -4.76
Statin -13.97 7.28
Fibrate -3.91 4.73
• Mean treatment effects for study cohort
• Costs based on 2010 Redbook

U.S. ATP III Guideline
Diabetes is a “CHD risk equivalent”
Source: Third report on the National Cholesterol Education Program Expert
Panel on Detection, Evaluation, and Treatment of High Blood Cholesterol in
Adults (Adult Treatment Panel III), NIH Publication No. 01-3670, 2001

U.S. JNC 7
Source: The Seventh Report of the Joint National Committee on Prevention,
Detection, Evaluation, and Treatment of High Blood Pressure, NIH Publication
No. 03-5233, 2003

Policy Evaluation
Males
66.5
67
67.5
68
68.5
69
69.5
70
70.5
0 5000 10000 15000 20000 25000 30000 35000
Lif
e Y
ears
to
Ev
en
t (y
rs.)
Cost ($)
Canadian
U.S.
U.S. (ATPIII*)
European
Australian
No Treatment

Optimal policy for varying willingness to
pay Males
66.5
67
67.5
68
68.5
69
69.5
70
70.5
0 5000 10000 15000 20000 25000 30000 35000
Lif
e Y
ears
to
Ev
en
t (y
rs.)
Medication Costs ($)
MDP Optimal Tradeoff Curve
Maximum LYs Canadian
U.S.
U.S. (ATPIII*)
European
Australian
No Treatment

71.5
72
72.5
73
73.5
74
74.5
0 5000 10000 15000 20000 25000 30000 35000
Lif
e Y
ears
to
Ev
en
t (y
rs.)
Medication Costs ($)
Optimal policy for varying willingness to
pay
Females
No Treatment
MDP Optimal Tradeoff Curve
Maximum LYs Canadian
U.S.
U.S. (ATPIII*)
European
Australian


Are Newer Drugs Better?

Are Newer Drugs Better?
Men Women

TPM Sampling Method
Basic idea:
• Random-direction algorithm1 for sampling random vectors over convex region
• Sample each row of the TPM independently from intersection of uncertainty set, 𝑈, and standard simplex, Δ
1: Smith, R.L, Efficient Monte Carlo procedures for generating points uniformly distributed over bounded regions, Operations Research, 32(6) p 1296-
1308, 1984

Algorithm 𝐶ℎ𝑜𝑜𝑠𝑒 𝑖𝑛𝑖𝑡𝑖𝑎𝑙 𝑝𝑜𝑖𝑛𝑡 𝑿𝟎 𝑖𝑛 𝑡ℎ𝑒 𝑢𝑛𝑐𝑒𝑟𝑡𝑎𝑖𝑛𝑡𝑦 𝑠𝑒𝑡, 𝒰 𝐹𝑜𝑟 𝑗 = 1,… ,𝑊 +𝑀 𝑠𝑎𝑚𝑝𝑙𝑒𝑠
S𝑎𝑚𝑝𝑙𝑒 𝒅 𝑠𝑢𝑐ℎ 𝑡ℎ𝑎𝑡 𝑿𝒋−𝟏 + 𝜆𝒅 ∈ Δ
𝐹𝑖𝑛𝑑 𝜆 𝑎𝑛𝑑 𝜆 𝑠𝑢𝑐ℎ 𝑡ℎ𝑎𝑡 𝑿𝒋−𝟏 + 𝜆𝒅 ∈ 𝒰 S𝑎𝑚𝑝𝑙𝑒 𝜆 𝑢𝑛𝑖𝑓𝑜𝑟𝑚𝑙𝑦 𝑖𝑛 𝑖𝑛𝑡𝑒𝑟𝑣𝑎𝑙 [𝜆, 𝜆 ]
𝑊ℎ𝑖𝑙𝑒(𝑿𝒋−𝟏 + 𝜆𝒅 ∉ 𝒰)
𝑖𝑓 𝜆 ≥ 0 𝑡ℎ𝑒𝑛 𝜆 ← 𝜆 𝑒𝑙𝑠𝑒 𝜆 ← 𝜆
S𝑎𝑚𝑝𝑙𝑒 𝜆 𝑢𝑛𝑖𝑓𝑜𝑟𝑚𝑙𝑦 𝑖𝑛 𝑖𝑛𝑡𝑒𝑟𝑣𝑎𝑙 [𝜆, 𝜆 ] E𝑛𝑑 𝑊ℎ𝑖𝑙𝑒
𝑿𝒋 ← 𝑿𝒋−𝟏 + 𝜆𝒅; 𝑗 ← 𝑗 + 1
𝐸𝑛𝑑 𝐹𝑜𝑟

Sensitivity Analysis TPM for Glycemic Control
64.34
64.36
64.38
64.4
64.42
64.44
27 27.5 28 28.5 29 29.5 30
Esti
mat
ed e
xpec
ted
QA
LYs
Estimated expected total medication costs ($,in thousands)
Working paper and Matlab code available for use upon request

Sensitivity Analysis
0.00
0.01
0.03
0.05
0.00
0.01
0.04
0.06
0.00
-0.01
-0.04
-0.05
0.00
-0.01
-0.04
-0.06
-0.08 -0.06 -0.04 -0.02 0.00 0.02 0.04 0.06 0.08
Monthly Medication Cost
Medication Effect on HbA1c
HbA1c TPM
Medication Disutility
Absolute changes in the Expected QALYs (QALYs)

Conclusions
Treating risk instead of risk factors has the
potential for better health outcomes
Low variation in optimal sequence of medication;
optimal tradeoff differentiated by timing of
treatment for men and women
Treatment significantly influenced by individual
risk factors

Acknowledgements
Jennifer Mason, University of Virginia
Lauren Steimle, University of Michigan
Jim Wilson, NC State University
Yuanhui Zhang, CDC
Nilay Shah, Mayo Clinic
Steven Smith, Mayo Clinic
This work was supported by the National Science Foundation CMMI
1462060. Any opinions, findings, and conclusions or recommendations
expressed in this material are those of the authors and do not
necessarily reflect the views of the National Science Foundation.

Brian Denton
Industrial and Operations Engineering
University of Michigan
Thank You
Slides posted on my website:
http://umich.edu/~btdenton
Steimle, L.N., Denton, B.T., “Markov
Decision Processes for Screening and
Treatment of Chronic Diseases,”
Working Paper
36
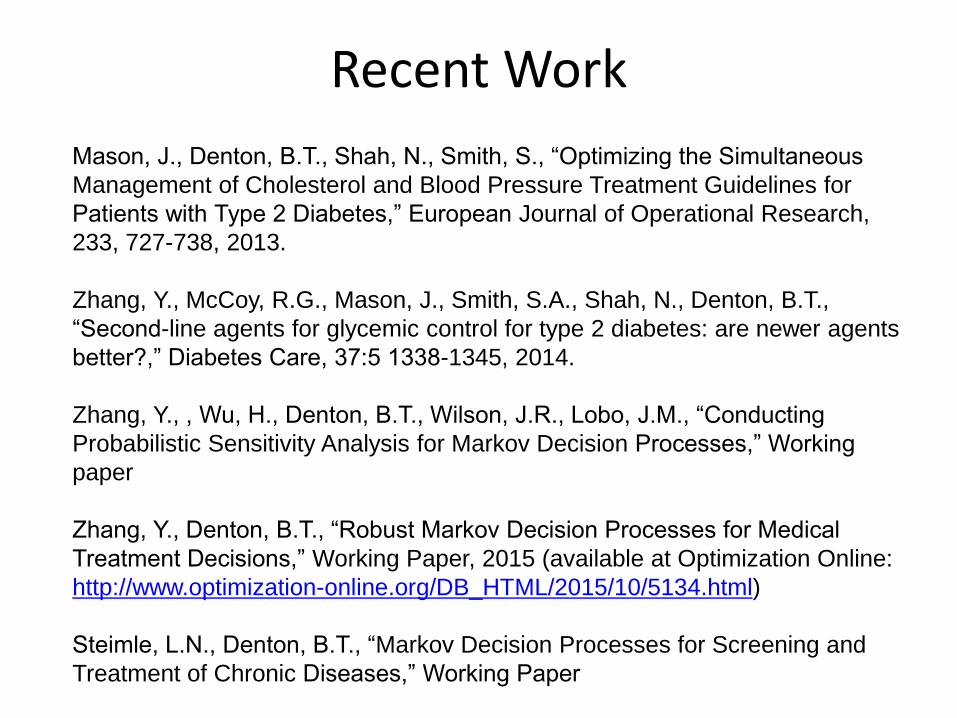
Recent Work
Mason, J., Denton, B.T., Shah, N., Smith, S., “Optimizing the Simultaneous
Management of Cholesterol and Blood Pressure Treatment Guidelines for
Patients with Type 2 Diabetes,” European Journal of Operational Research,
233, 727-738, 2013.
Zhang, Y., McCoy, R.G., Mason, J., Smith, S.A., Shah, N., Denton, B.T.,
“Second-line agents for glycemic control for type 2 diabetes: are newer agents
better?,” Diabetes Care, 37:5 1338-1345, 2014.
Zhang, Y., , Wu, H., Denton, B.T., Wilson, J.R., Lobo, J.M., “Conducting
Probabilistic Sensitivity Analysis for Markov Decision Processes,” Working
paper
Zhang, Y., Denton, B.T., “Robust Markov Decision Processes for Medical
Treatment Decisions,” Working Paper, 2015 (available at Optimization Online:
http://www.optimization-online.org/DB_HTML/2015/10/5134.html)
Steimle, L.N., Denton, B.T., “Markov Decision Processes for Screening and
Treatment of Chronic Diseases,” Working Paper