Markov Chain Topological Route Selection - … Chain Topological Route Selection E.J. Manley1, T....
6
Markov Chain Topological Route Selection E.J. Manley 1 , T. Cheng 1 , J. Haworth 1 1 SpaceTimeLab, University College London, Gower Street, London, United Kingdom. Telephone: +44 (0) 20 7679 7224 Email: [email protected] 1. Introduction Urban transport systems are intrinsically defined by the behaviours of many thousands or millions of individuals. It is thus vital, that where one seeks to model transport systems under change or shock, individual behaviour is well understood. Yet recent research into one core spatial behaviour – route selection – suggests that conventional models of such behaviour are poorly conceived (Manley et al. 2012b). Existing models of route-choice suggest that individuals select routes based predominantly on a principle of economic rationality, namely that they will always aim to minimise travel time or distance. However, research is growing that suggests that such assumptions are unrealistic (Golledge 1995, Wiener et al. 2004, Zhu & Levinson 2010), and result in inaccurate predictions of road transport flows (Manley et al. 2012a). Rather, behaviours are influenced by subjective representations of space and estimations of prospective travel times. Furthermore, it has been established that individuals do not necessarily remember specific routes or paths, but rather maintain a topological network within the brain of salient places through which a route is constructed (Golledge 1978, Passini 1984, Winter et al. 2007). Such findings help better explain the observable heterogeneity in behaviours observed in route selection, and the presence of non-linearity in choice, in that certain areas of the network appear to attract and repel traffic significantly more than might be expected (Manley et al. 2012b). In aiming to more accurately model road transport flows, one must therefore seek to incorporate the full extent of this behavioural heterogeneity within a model of route-choice. The Markov chain Monte Carlo (MCMC) method is a statistical approach to modelling and predicting behavioural heterogeneity. Through MCMC, rather than specifying a set of parameters and making predictions on the relative contribution of each in determining behaviour, prior actions – described through data – are used to make predictions on future behaviours. In this research, an MCMC model is applied to describing route-choice behaviour across a topological representation of the road network. In using the MCMC approach, we are able to capture all relevant behaviours that may be difficult to accurately specify using alternative methods. While this approach does not offer any explanatory power in describing individual route selection, it does enable the improved statistical description of the full heterogeneity of choice among a population of individual travellers. 2. MCMC Route Choice Structure and Definition The traditional Markov chain model can be thought of as a network of nodes, connected according to their probability of sequential selection. The probability of
Transcript of Markov Chain Topological Route Selection - … Chain Topological Route Selection E.J. Manley1, T....
Markov Chain Topological Route Selection
E.J. Manley1, T. Cheng1, J. Haworth1
1 SpaceTimeLab, University College London,Gower Street, London, United Kingdom.
Telephone: +44 (0) 20 7679 7224Email: [email protected]
1. Introduction
Urban transport systems are intrinsically defined by the behaviours of manythousands or millions of individuals. It is thus vital, that where one seeks to modeltransport systems under change or shock, individual behaviour is well understood.Yet recent research into one core spatial behaviour – route selection – suggests thatconventional models of such behaviour are poorly conceived (Manley et al. 2012b).
Existing models of route-choice suggest that individuals select routes basedpredominantly on a principle of economic rationality, namely that they will alwaysaim to minimise travel time or distance. However, research is growing that suggeststhat such assumptions are unrealistic (Golledge 1995, Wiener et al. 2004, Zhu &Levinson 2010), and result in inaccurate predictions of road transport flows (Manleyet al. 2012a). Rather, behaviours are influenced by subjective representations ofspace and estimations of prospective travel times. Furthermore, it has beenestablished that individuals do not necessarily remember specific routes or paths, butrather maintain a topological network within the brain of salient places through whicha route is constructed (Golledge 1978, Passini 1984, Winter et al. 2007). Suchfindings help better explain the observable heterogeneity in behaviours observed inroute selection, and the presence of non-linearity in choice, in that certain areas of thenetwork appear to attract and repel traffic significantly more than might be expected(Manley et al. 2012b).
In aiming to more accurately model road transport flows, one must thereforeseek to incorporate the full extent of this behavioural heterogeneity within a model ofroute-choice. The Markov chain Monte Carlo (MCMC) method is a statisticalapproach to modelling and predicting behavioural heterogeneity. Through MCMC,rather than specifying a set of parameters and making predictions on the relativecontribution of each in determining behaviour, prior actions – described through data– are used to make predictions on future behaviours. In this research, an MCMCmodel is applied to describing route-choice behaviour across a topologicalrepresentation of the road network. In using the MCMC approach, we are able tocapture all relevant behaviours that may be difficult to accurately specify usingalternative methods. While this approach does not offer any explanatory power indescribing individual route selection, it does enable the improved statisticaldescription of the full heterogeneity of choice among a population of individualtravellers.
2. MCMC Route Choice Structure and Definition
The traditional Markov chain model can be thought of as a network of nodes,connected according to their probability of sequential selection. The probability of

moving from one node to another is defined according prior observed behaviours,usually captured through data. In the case of the route-choice model described here,the network nodes are intended to represent salient locations on the road network, andthe probability of moving between two given points specified according to a largedataset of cab routes in London. For the purposes of this model, an adapted versionof the traditional Markov chain is developed, incorporating higher-level strategicchoice behaviours that shape movement towards a target destination.
2.1. Node Specification
The MCMC model is applied to a topological representation of the road network. Thenodes within the MCMC model are intended to represent locations on the roadnetwork at which route selection choices are likely to be made. As such, a structureof nodes is developed from the points of junctions between major thoroughfares. Itmay be assumed that, as these locations represent points of likely route deviation,individuals are more likely to maintain a memory of them. Route choice, therefore,rather than being executed on a link-by-link basis, is modelled through a node-to-nodeselection process.
2.2. Inter-Nodal Probability Specification
The probability of connection between given nodes on the road network are drawnfrom the route choice behaviours during around 700000 private hire cab journeysthrough London, United Kingdom. In our approach, unlike traditional Markov chainrepresentations, node selection is dependent on the connection with the current nodegiven the node selected prior to the current node. This allows for a sense of linearpath continuity to be incorporated into the selection process, so that if an individual isapproaching a node from one direction, they are most likely to continue broadly insame direction. This process is best demonstrated in the model in Figure 1, where anindividual’s choice from node j is shaped by the fact that they’d previously visitednode k.
Figure 1. Markov chain network structure, where k is the previous node, j is thecurrent node and i is an optional next node, showing the probability of
connections between node i and a range of sequential nodes.
0.010.325
0.6
0.015
0.05
k ji
Using the routes identified within the dataset, theconnectionrepresentsprevious node
2.3.
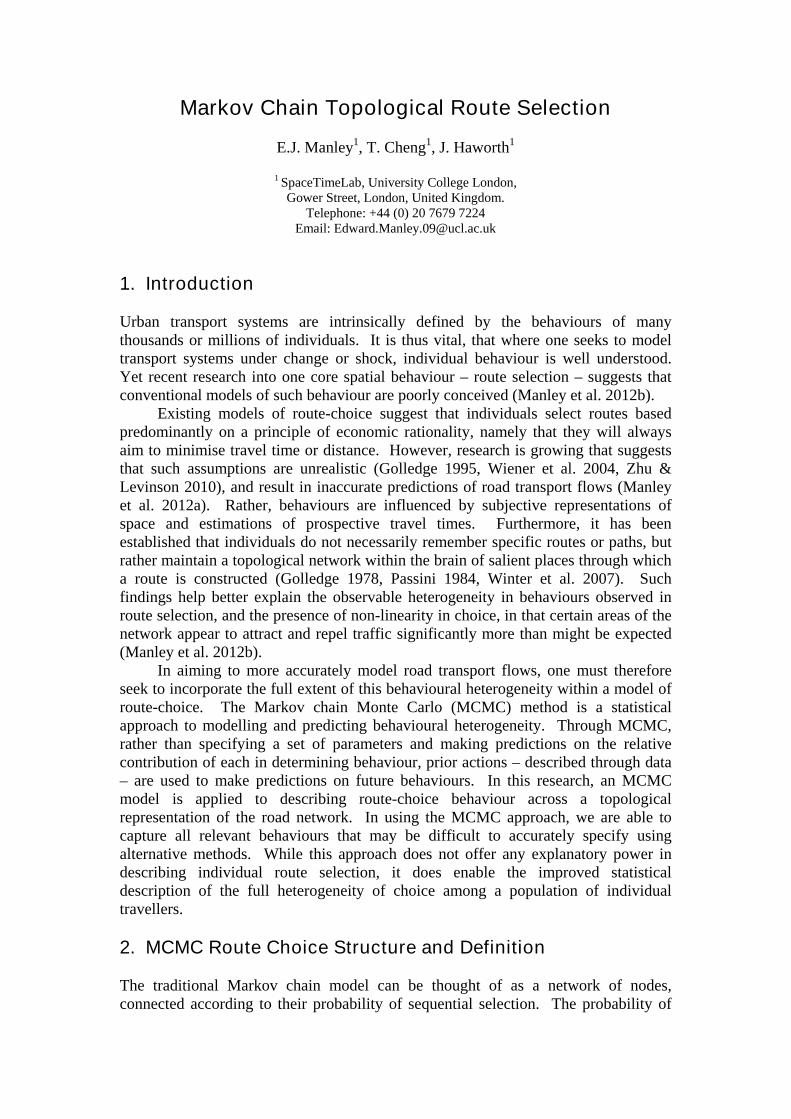
Node specification and the identification of probability of connections between nodesdoes not present complete picture of routing behaviour, however. Whileprocess is already abstracted to a coarser spatial scale, in line withfindings, it is apparent that higherapproach therefore implements an additional facet of behaviour, describing thprobability of deviating away fromdestination. A probability is generated again from the data, describing the probabilityof selecting a node of a given deviation from the straight line towards a target. Fi2 describes the relationship between angular deviation and probability of nodeselection.
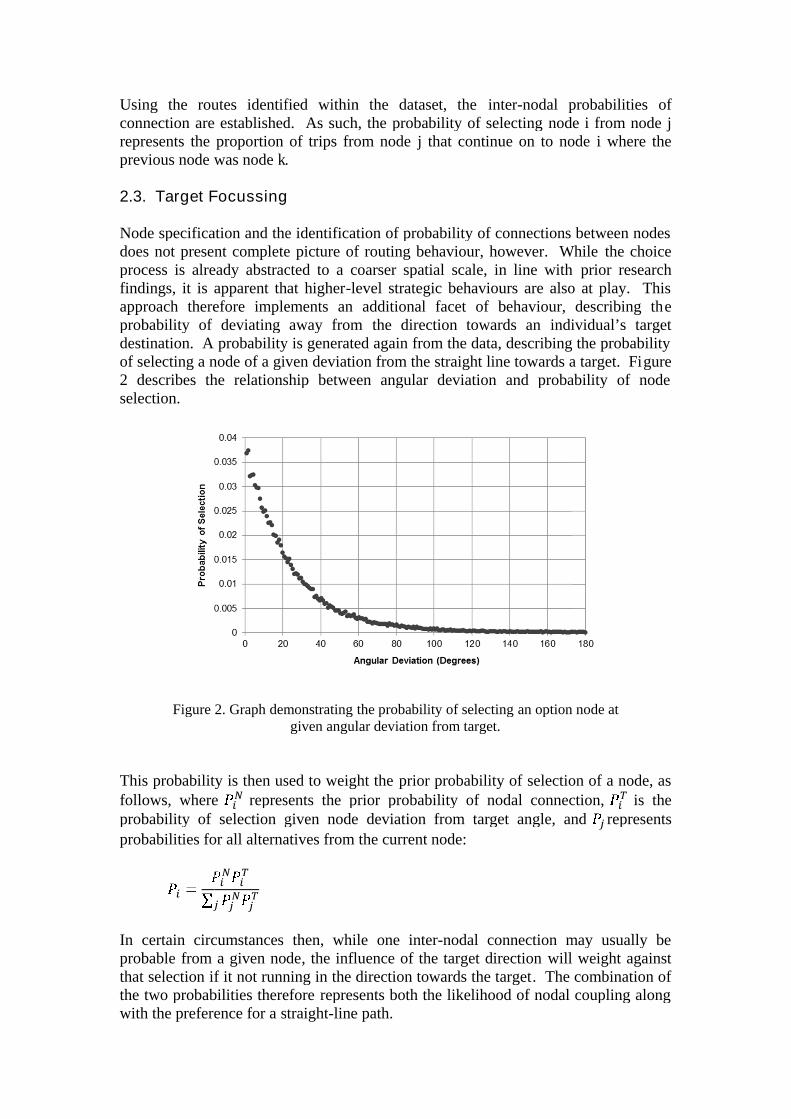
This probability is then used to weight thefollows, whereprobabilit
probabilities for all alternatives from the current node:
In certain circumstancesprobablethat selectionthe two probabilities thereforewith the preference for a
Using the routes identified within the dataset, theconnection are established.represents the propoprevious node was node
2.3. Target Focussing
Node specification and the identification of probability of connections between nodesdoes not present complete picture of routing behaviour, however. Whileprocess is already abstracted to a coarser spatial scale, in line withfindings, it is apparent that higherapproach therefore implements an additional facet of behaviour, describing thprobability of deviating away fromdestination. A probability is generated again from the data, describing the probabilityof selecting a node of a given deviation from the straight line towards a target. Fi2 describes the relationship between angular deviation and probability of nodeselection.
Figure
This probability is then used to weight thefollows, whereprobability of selection given node deviation from target angle
probabilities for all alternatives from the current node:
certain circumstancesprobable from a given nodethat selection if it not running in the direction towards the targetthe two probabilities thereforewith the preference for a
Using the routes identified within the dataset, theare established.
the proportion of trips from nodewas node k.
Target Focussing
Node specification and the identification of probability of connections between nodesdoes not present complete picture of routing behaviour, however. Whileprocess is already abstracted to a coarser spatial scale, in line withfindings, it is apparent that higherapproach therefore implements an additional facet of behaviour, describing thprobability of deviating away fromdestination. A probability is generated again from the data, describing the probabilityof selecting a node of a given deviation from the straight line towards a target. Fi2 describes the relationship between angular deviation and probability of node
Figure 2. Graph demonstrating
This probability is then used to weight thefollows, where
ே represents the prior probability of nodal connection,y of selection given node deviation from target angle
probabilities for all alternatives from the current node:
ே
ே
certain circumstancesfrom a given node
if it not running in the direction towards the targetthe two probabilities thereforewith the preference for a straight
Using the routes identified within the dataset, theare established. As such, the
rtion of trips from node.
Target Focussing
Node specification and the identification of probability of connections between nodesdoes not present complete picture of routing behaviour, however. Whileprocess is already abstracted to a coarser spatial scale, in line withfindings, it is apparent that higher-level strategic behaviours are also at play. Thisapproach therefore implements an additional facet of behaviour, describing thprobability of deviating away fromdestination. A probability is generated again from the data, describing the probabilityof selecting a node of a given deviation from the straight line towards a target. Fi2 describes the relationship between angular deviation and probability of node
demonstrating the pgiven angular deviation from target.
This probability is then used to weight therepresents the prior probability of nodal connection,
y of selection given node deviation from target angle
probabilities for all alternatives from the current node:
then, whilefrom a given node, the influence of the target direction
if it not running in the direction towards the targetthe two probabilities therefore represents both the likelihood of nodal coupling along
straight-line
Using the routes identified within the dataset, theAs such, the probability of selecting
rtion of trips from node j that continue on to node
Node specification and the identification of probability of connections between nodesdoes not present complete picture of routing behaviour, however. Whileprocess is already abstracted to a coarser spatial scale, in line with
level strategic behaviours are also at play. Thisapproach therefore implements an additional facet of behaviour, describing thprobability of deviating away from the direction towards andestination. A probability is generated again from the data, describing the probabilityof selecting a node of a given deviation from the straight line towards a target. Fi2 describes the relationship between angular deviation and probability of node
the probability of selectinggiven angular deviation from target.
This probability is then used to weight the priorrepresents the prior probability of nodal connection,
y of selection given node deviation from target angle
probabilities for all alternatives from the current node:
then, while one inter, the influence of the target direction
if it not running in the direction towards the targetrepresents both the likelihood of nodal coupling along
line path.
Using the routes identified within the dataset, the interprobability of selecting
that continue on to node
Node specification and the identification of probability of connections between nodesdoes not present complete picture of routing behaviour, however. Whileprocess is already abstracted to a coarser spatial scale, in line with
level strategic behaviours are also at play. Thisapproach therefore implements an additional facet of behaviour, describing th
the direction towards andestination. A probability is generated again from the data, describing the probabilityof selecting a node of a given deviation from the straight line towards a target. Fi2 describes the relationship between angular deviation and probability of node
robability of selectinggiven angular deviation from target.
prior probability ofrepresents the prior probability of nodal connection,
y of selection given node deviation from target angle
probabilities for all alternatives from the current node:
inter-nodal connection may usually be, the influence of the target direction
if it not running in the direction towards the targetrepresents both the likelihood of nodal coupling along
inter-nodal probabilitiesprobability of selecting node
that continue on to node
Node specification and the identification of probability of connections between nodesdoes not present complete picture of routing behaviour, however. Whileprocess is already abstracted to a coarser spatial scale, in line with
level strategic behaviours are also at play. Thisapproach therefore implements an additional facet of behaviour, describing th
the direction towards an individual’s targetdestination. A probability is generated again from the data, describing the probabilityof selecting a node of a given deviation from the straight line towards a target. Fi2 describes the relationship between angular deviation and probability of node
robability of selecting an optiongiven angular deviation from target.
probability of selection of a node, asrepresents the prior probability of nodal connection,
y of selection given node deviation from target angle, and
nodal connection may usually be, the influence of the target direction will
if it not running in the direction towards the target. The combination ofrepresents both the likelihood of nodal coupling along
probabilitiesnode i from node
that continue on to node i where the
Node specification and the identification of probability of connections between nodesdoes not present complete picture of routing behaviour, however. While the choiceprocess is already abstracted to a coarser spatial scale, in line with prior research
level strategic behaviours are also at play. Thisapproach therefore implements an additional facet of behaviour, describing th
individual’s targetdestination. A probability is generated again from the data, describing the probabilityof selecting a node of a given deviation from the straight line towards a target. Figure2 describes the relationship between angular deviation and probability of node
option node at
selection of a node, asrepresents the prior probability of nodal connection,
is theand represents
nodal connection may usually bewill weight againstThe combination of
represents both the likelihood of nodal coupling along
probabilities offrom node j
where the
Node specification and the identification of probability of connections between nodesthe choice
researchlevel strategic behaviours are also at play. This
approach therefore implements an additional facet of behaviour, describing theindividual’s target
destination. A probability is generated again from the data, describing the probabilitygure
2 describes the relationship between angular deviation and probability of node
selection of a node, asis the
represents
nodal connection may usually beweight against
The combination ofrepresents both the likelihood of nodal coupling along

3.
The model was applied to the prediction of a number of originLondon.to destination.according to the weighted probabilities of each option.pair the selectionheterogeneous behaviour
At thissubsequent roadnot incorporated.by-node path between an origin and destination.datasets,this approachdestinatio
3. Model Output
The model was applied to the prediction of a number of originLondon. The route selection process proceeds ito destination.according to the weighted probabilities of each option.pair the selectionheterogeneous behaviour
At this initial stage, in order to demonstrate with clarity the selection process, thesubsequent roadnot incorporated.
node path between an origin and destination.datasets, the resultsthis approach todestination.
Figure
Model Output
The model was applied to the prediction of a number of originThe route selection process proceeds i
to destination. Nodes are selected through uniform weighted random selectionaccording to the weighted probabilities of each option.pair the selection process isheterogeneous behaviours
initial stage, in order to demonstrate with clarity the selection process, thesubsequent road-level selections, that would ordinarily follow the node selections, isnot incorporated. The results therefore show the
node path between an origin and destination.the results provided here
to identify the range of feasible route selections from an origin to a
Figure 3. Node selection percentages from
The model was applied to the prediction of a number of originThe route selection process proceeds i
Nodes are selected through uniform weighted random selectionaccording to the weighted probabilities of each option.
process is executed.
initial stage, in order to demonstrate with clarity the selection process, thelevel selections, that would ordinarily follow the node selections, isThe results therefore show the
node path between an origin and destination.provided here are
identify the range of feasible route selections from an origin to a
Node selection percentages fromin London, United Kingdom
The model was applied to the prediction of a number of originThe route selection process proceeds i
Nodes are selected through uniform weighted random selectionaccording to the weighted probabilities of each option.
executed 1000
initial stage, in order to demonstrate with clarity the selection process, thelevel selections, that would ordinarily follow the node selections, isThe results therefore show the
node path between an origin and destination.are merely intended to
identify the range of feasible route selections from an origin to a
Node selection percentages fromin London, United Kingdom
B
The model was applied to the prediction of a number of originThe route selection process proceeds in a node-to
Nodes are selected through uniform weighted random selectionaccording to the weighted probabilities of each option. For each origin
times, ensuring
initial stage, in order to demonstrate with clarity the selection process, thelevel selections, that would ordinarily follow the node selections, isThe results therefore show the percentages
node path between an origin and destination. As such,intended to
identify the range of feasible route selections from an origin to a
Node selection percentages from location A to location B,in London, United Kingdom.
The model was applied to the prediction of a number of origin-destination pairs into-node fashion from origin
Nodes are selected through uniform weighted random selectionFor each origin
nsuring full
initial stage, in order to demonstrate with clarity the selection process, thelevel selections, that would ordinarily follow the node selections, is
ages of trips selecting a nodeAs such, without comparable
demonstrate the abiliidentify the range of feasible route selections from an origin to a
location A to location B,
A
destination pairs innode fashion from origin
Nodes are selected through uniform weighted random selectionFor each origin-destination
exploration of
initial stage, in order to demonstrate with clarity the selection process, thelevel selections, that would ordinarily follow the node selections, is
of trips selecting a nodewithout comparable
demonstrate the ability ofidentify the range of feasible route selections from an origin to a
location A to location B,
destination pairs innode fashion from origin
Nodes are selected through uniform weighted random selection,destination
exploration of
initial stage, in order to demonstrate with clarity the selection process, thelevel selections, that would ordinarily follow the node selections, is
of trips selecting a node-without comparable
ty ofidentify the range of feasible route selections from an origin to a

4. Discussion and Conclusions
The process by which an individual selects a route from an origin to a destination ishighly complex, influenced by experience, subjectivity andWhat is clear from previous wortopological framework, whereby salientstructure. The route choice model presented in this paper represents a movementtowards a realistic representation of this
Figure
Figure
4. Discussion and Conclusions
The process by which an individual selects a route from an origin to a destination ishighly complex, influenced by experience, subjectivity andWhat is clear from previous wortopological framework, whereby salientstructure. The route choice model presented in this paper represents a movementtowards a realistic representation of this
Figure 4. Node selection percentages from
Figure 5. Node selection percentages from
4. Discussion and Conclusions
The process by which an individual selects a route from an origin to a destination ishighly complex, influenced by experience, subjectivity andWhat is clear from previous wortopological framework, whereby salientstructure. The route choice model presented in this paper represents a movementtowards a realistic representation of this
A
B
Node selection percentages fromin London, United Kingdom
Node selection percentages fromin London, United Kingdom
4. Discussion and Conclusions
The process by which an individual selects a route from an origin to a destination ishighly complex, influenced by experience, subjectivity andWhat is clear from previous work is that this decision process takes place within atopological framework, whereby salientstructure. The route choice model presented in this paper represents a movementtowards a realistic representation of this
Node selection percentages fromin London, United Kingdom
Node selection percentages fromin London, United Kingdom
4. Discussion and Conclusions
The process by which an individual selects a route from an origin to a destination ishighly complex, influenced by experience, subjectivity and
k is that this decision process takes place within atopological framework, whereby salient locationsstructure. The route choice model presented in this paper represents a movementtowards a realistic representation of this cognitive
Node selection percentages from location A to location B,in London, United Kingdom.
Node selection percentages from location A to location B,in London, United Kingdom.
The process by which an individual selects a route from an origin to a destination ishighly complex, influenced by experience, subjectivity and
k is that this decision process takes place within alocations are linked within a network
structure. The route choice model presented in this paper represents a movementcognitive mechanism
location A to location B,
location A to location B,
The process by which an individual selects a route from an origin to a destination ishighly complex, influenced by experience, subjectivity and spatial
k is that this decision process takes place within aare linked within a network
structure. The route choice model presented in this paper represents a movementmechanism.
B
location A to location B,
location A to location B,
The process by which an individual selects a route from an origin to a destination isspatial non-linearity
k is that this decision process takes place within aare linked within a network
structure. The route choice model presented in this paper represents a movement
A
The process by which an individual selects a route from an origin to a destination islinearity.
k is that this decision process takes place within aare linked within a network
structure. The route choice model presented in this paper represents a movement

Through the specification of the Markov chain model, using a rarely seen wealth inrouting data, we have been able to effectively describe the heterogeneity inherentacross a population of individuals making a route selection between an origin anddestination. Although this approach does not yet offer any explanatory power as tothe nature of the decisions being taken by the individual, it does provide a picture ofpopulation route choice that – given it is drawn from previous route selections – mustbroadly represent the choices of a population of individuals.
There are some clear avenues for further work with respect to this research. Firstly,there must be some work carried out into the validation of this approach, withidentification of whether the selections are broadly in line with the real data forspecific origin-destination pairs. Second, further work should be carried out intoidentifying how effective the current node specification is in capturing key routedecision points, and whether certain nodes may be added or removed from thisrepresentation. And finally, as hinted at above, the model currently lacks explanatorypower, thus further analysis should be carried out into identifying the importantinfluencing parameters causing node-to-node linkage.
5. Acknowledgements
This work is part of the STANDARD project – Spatio-Temporal Analysis of NetworkData and Road Developments, supported by the UK Engineering and PhysicalSciences Research Council (EP/G023212/1) and Transport for London (TfL). Thedata for this work was kindly provided by Addison Lee Private Hire Taxi Company.
6. References
Golledge, R.G. 1978. Learning about urban environments. In T. Carlstein, D.N. Parkes, & N.J. Thrift(eds). Assessing the Economic Impact of Retail Centres: Issues, Methods and Implications forGovernment Policy.
Golledge, R.G., 1995. Path Selection and Route Preference in Human Navigation: A Progress Report(UCTC No. 277). Berkeley, California: The University of California Transportation Center.
Manley, E.J., Cheng, T., Penn. 2012a. Modelling Movement in the City: The Influence of Individuals.AGILE Workshop on Complexity Modelling for Urban Structure and Dynamics. April 2012.
Manley, E.J., Addison, J.D., Cheng, T., Penn, A. 2012b. Understanding Urban Traffic Patterns Using (Big) Data and Agent-Based Simulation. COSMIC Satellite Meeting at ECCS, September 2012.
Passini, R. 1984. Spatial Representations, a Wayfinding Perspective. Environmental Psychology.4:152-164.
Wiener, J.M., Schnee, A., & Mallot, H.A. 2004. Use and interaction of navigation strategies inregionalized environments. Environmental Psychology. 24. 475-493.
Winter, S., Tomko, M., Elias, B., Sester, M. 2007. Landmark Hierarchies in Context. Environment andPlanning B. 35:381-398.
Zhu, S., & Levinson, D. 2010. Do people use the shortest path? An empirical test of Wardrop’s firstprinciple. Working paper. Available at: http://nexus.umn.edu/Papers/ShortestPath.pdf.