Marketization, Globalization, Financialization: The ... · Marketization, Globalization,...
50
Marketization, Globalization, Financialization: The Fragility of the US Economy in an Era of Global Change William Lazonick University of Massachusetts and University of Bordeaux Revised March 2010 This paper has been written for the project on “National Adjustments to a Changing Global Economy,” led by Dan Breznitz and John Zysman, funded by the Alfred P. Sloan Foundation. This paper builds on research in William Lazonick, Sustainable Prosperity in the New Economy? Business Organization and High-Tech Employment in the United States, Upjohn Institute for Employment Research, 2009; “The New Economy Business Model and the Crisis of US Capitalism,” Capitalism and Society, 4, 2, 2009; and “The Explosion of Executive Pay and the Erosion of American Prosperity,” Entreprises et Histoire , 57, 2010 (forthcoming). The most recent research contained in this paper was funded by FINNOV project through Theme 8 of the Seventh Framework Programme of the European Commission (Socio-Economic Sciences and Humanities), under the topic “The role of finance for growth, employment and competitiveness in Europe” (SSH-2007-1.2- 03) as well as the Ford Foundation project on “Financial institutions for innovation and development.” I am grateful to Ebru Bekaslan, Yin Li, and Mustafa Erdem Sakinç for research assistance. Business History Conference, March 2010. This is a work in progress, not to be quoted without the permission of the author.
Transcript of Marketization, Globalization, Financialization: The ... · Marketization, Globalization,...

Marketization, Globalization, Financialization: The Fragility of the US Economy
in an Era of Global Change
William Lazonick
University of Massachusetts and
University of Bordeaux
Revised March 2010
This paper has been written for the project on “National Adjustments to a Changing Global Economy,” led by Dan Breznitz and John Zysman, funded by the Alfred P. Sloan Foundation. This paper builds on research in William Lazonick, Sustainable Prosperity in the New Economy? Business Organization and High-Tech Employment in the United States, Upjohn Institute for Employment Research, 2009; “The New Economy Business Model and the Crisis of US Capitalism,” Capitalism and Society, 4, 2, 2009; and “The Explosion of Executive Pay and the Erosion of American Prosperity,” Entreprises et Histoire, 57, 2010 (forthcoming). The most recent research contained in this paper was funded by FINNOV project through Theme 8 of the Seventh Framework Programme of the European Commission (Socio-Economic Sciences and Humanities), under the topic “The role of finance for growth, employment and competitiveness in Europe” (SSH-2007-1.2-03) as well as the Ford Foundation project on “Financial institutions for innovation and development.” I am grateful to Ebru Bekaslan, Yin Li, and Mustafa Erdem Sakinç for research assistance.
Business History Conference, March 2010. This is a work in progress, not to be quoted without the permission of the author.

Lazonick: Marketization, Globalization, Financialization
1. Fragile The United States has the world’s largest economy in terms of GDP. In 2008 it was the home base of 140 of the world’s top 500 business corporations by revenues. In the first decade of the 21st century, it is the world’s only superpower. At the same time, the US economy is fragile because of a failure of its leading corporations to make sufficient investments in innovation and job creation in the United States in a new age of global competition. The superpower-to-be is the fast-rising China. As a sign of China’s growing economic and political power as well as America’s fragility, in September 2008 China for the first time surpassed Japan as the largest foreign holder of US government debt. At that time, China and Japan each held 22.1 percent of the US government debt of $2,800 billion in the hands of foreigners. By November 2009 that figure had risen to $3,597 billion, of which China held 22.0 percent and Japan 21.1 percent. Then in December 2009, China sold off $34 billion in US short-term debt as it flexed its political muscle, putting Japan back on top temporarily as the US government’s largest foreign creditor (US Treasury Department 2009; Parameswaran 2010). This foreign debt helps to finance the trade deficit in goods and services that the United States has been running in every year since 1976. During the 1980s and 1990s the most formidable competitor to the United States was Japan, and until 2000, the largest US trade deficits were with Japan. Since 2001 the largest trade deficits have been with China. Moreover, China has become the world’s most important exporter to the United States of goods classified as Advanced Technology Products (ATP). In 2000 17.8 percent of US ATP imports were from Japan and 5.5 percent from China; in 2009 only 6.6 percent were from Japan while China’s share had grown to 29.8 percent. Of US ATP imports from China in 2009, 88.1 percent were in the information and communications sub-classification, and another 7.3 percent in opto-electronics. China accounted for 46.5 percent of the value of all information and communications products and 28.0 percent of the value of all opto-electronics imported into the United States (US Census Bureau 2010). To a considerable extent these ATP imports from China reflect the importance of foreign direct investment (FDI) in China by US-based information and communication technology (ICT) companies. Since the last half of the 1990s leading US-based ICT companies such as Cisco Systems, International Business Machines (IBM), Hewlett-Packard (HP), Intel, Microsoft, Motorola, and Texas Instruments (TI) have been making major investments in manufacturing, and increasingly R&D, in China. In addition the indigenous Chinese ICT industry has been undergoing a process of continual upgrading, led by companies such as Lenovo, Founder, Huawei Technologies, and ZTE. Whether the employer in China be foreign or indigenous, increasingly the capabilities of Chinese high-tech personnel are the equal of their counterparts in the United States, and at a much lower cost. In an interview in Beijing in 2004, Craig Barrett, at the time Intel’s CEO, pronounced without too much hyperbole that people in China “are capable of doing any engineering job, any software job, and managerial job that people in the US are capable
2
Lazonick: Marketization, Globalization, Financialization
of doing” (quoted in Heim 2004). And the capabilities of the Chinese high-tech labor force have advanced continuously since that statement was made. China’s upgrading of its industrial capability has enabled its GDP per capita to grow rapidly. In 2006 China’s GDP per capita was 19 percent of that of the United States, while Japan’s was 72 percent (Maddison 2010). Japan reached the 72 percent level in 1980, just as China’s growth took off. In 1980 China’s GDP per capita was only 6 percent of that of the United States, but grew to 8 percent in 1990 and 12 percent in 2000. In the 2000s China has regularly had annual growth rates in real GDP of 8-11 percent. One is tempted to compare China’s growth process of the last two decades with Japan’s “era of high-speed growth” from the mid-1950s to the early 1970s. The difference is that Japan’s population in, say, 1969 was 102 million, or just under 3 percent of the world’s population, while China’s population in 2008 was 1,325 million, almost 20 percent of the world’s population. Given the rapid increases in China’s GDP per capita, its economic transformation is much more portentous for global economics and politics than Japan’s emergence as the world’s second largest economy in the 1960s. What is the capacity of the United States to respond to the challenges of a new global economy in which China, and Asia more generally, are playing increasingly more dominant roles? Orthodox economic analyses of this question, still mired in the static framework of the theory of comparative advantage, focus on the policy responses of the US government with respect to international trade agreements, international taxation, and international financial flows. In contrast, some academics who recognize the critical role that state investment plays in the transformation of “comparative advantage” call upon the US government to play the role of the “developmental state” (see Block 2008; Block and Keller 2009). Such calls for an activist industrial policy on the part of the US government are on target. Indeed, it is nothing new for the US government to play such a role. In the 1980s the term “developmental state” gained currency as an explanation of the so-called “Japanese miracle”. Yet in the 20th century it was the United States, not Japan, that was the foremost developmental state (Lazonick 2008). Building on a 19th-century legacy of industrial policies for railroads, agriculture, and manufacturing, US government support in the 20th century ranged from telecommunications to aviation to computers to the Internet to biotech. A prime reason why in the last half of the 20th century Japan was able to challenge the United States successfully in industries such as steel, machine tools, semiconductors, consumer electronics, and automobiles – industries in which the United States had previously been the world leader – was because of the transfer of technological knowledge to Japan that the US developmental state, in combination with US business enterprises, had helped bring into existence. At the same, anyone who has studied the foundations of Japanese success knows that it was the mode of business organization that the Japanese put in place that enabled them, in a few strategic industries, to develop and utilize technologies (ostensibly available to the rest of the world) to generate products that were higher quality and lower cost than anywhere else in the world. So too, in the first half of the 20th century the United States
3
Lazonick: Marketization, Globalization, Financialization
put in place a business system that enabled US industry to generate what were at the time, given prevailing factor costs, higher quality and lower cost products than elsewhere. Critical to US success were business enterprises that could develop and utilize the knowledge base that US government investment put in place. In the process, per capita GDP in the United States grew to the highest level among the world’s industrialized nations. The business system that enabled the United States to become the world pre-eminent industrial economy by the mid-20th century was, as I will describe in more detail in the next section of this paper, a highly collectivized corporate economy based on what I call in historical retrospect the “Old Economy business model” (OEBM). With that business system in place, and supported by government investment, government regulation, and a progressive tax system, the United States experienced relatively equitable and stable economic growth from the late 1940s to the early 1970s. From the late 1970s, however, OEBM ran into problems as it faced the increasingly superior productive capabilities of Japanese competition in industries that had been central to US innovation, employment, and growth. The particular impacts of Japanese competition varied markedly across US industries. It virtually wiped out the US-based consumer electronics industry. For example, in 1981 RCA was the one of the leading consumer electronics company in the world, and the 44th largest US industrial company by revenues with employment of 119,000. By 1986 it had been taken over by General Electric and sold off in pieces (Chandler 2001, ch. 2 and 3). During the 1980s the US automobile manufacturers attempted to learn from the Japanese, but in the 2000s they were still producing lower quality, higher cost cars, and, not surprisingly, had lost significant market share (Platzer and Harrison 2009; WardsAuto.com 2009). In the machine tool industry, the overwhelming success of the Japanese against the major US companies was followed from the 1990s by the emergence of export-oriented small- and medium-sized enterprises producing for specialized niche markets (Kalafsky and MacPherson 2002). In the steel industry, the innovative response of the United States was the emergence of independent minimills, using electric arc furnaces and scrap metal. In the 1980s, the minimills only had the technological capability to manufacture long products, but, led by Nucor, the introduction of compact strip production technology from 1989 enabled the minimills to compete with integrated mills in flat products as well (Giarratani et al. 2007). The most important and successful US response to Japanese competition was in the semiconductor industry. By the middle of the 1980s, the Japanese had used their integrated skill bases to lower defects and raise yields in the production of memory chips, forcing major US semiconductor companies to retreat from this segment of the market (Burgelman 1994; Okimoto and Nishi 1994). Led by Intel and its microprocessor for the IBM PC and its clones, US companies became world leaders in chip design. Indeed, the IBM PC and its “Wintel” architecture laid the basis for the rise of what I have called the “New Economy business model” (NEBM), which by the 2000s had relegated OEBM to history (Lazonick 2009a and 2009b).
4
Lazonick: Marketization, Globalization, Financialization
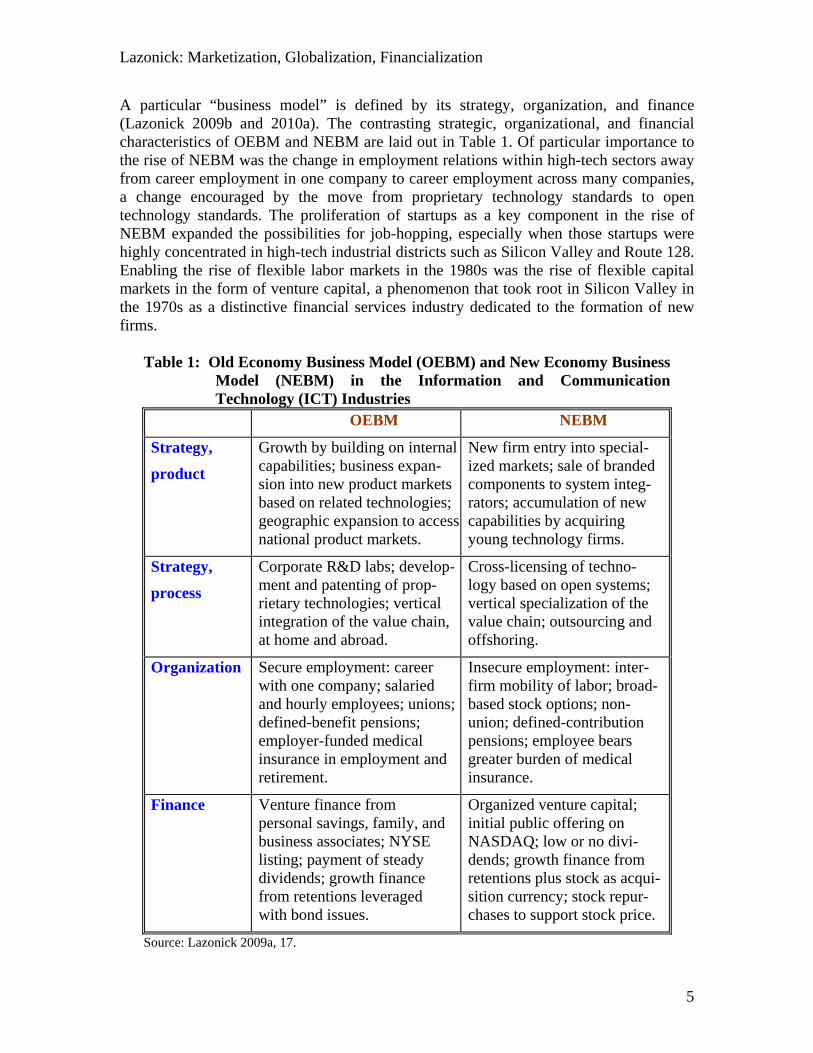
A particular “business model” is defined by its strategy, organization, and finance (Lazonick 2009b and 2010a). The contrasting strategic, organizational, and financial characteristics of OEBM and NEBM are laid out in Table 1. Of particular importance to the rise of NEBM was the change in employment relations within high-tech sectors away from career employment in one company to career employment across many companies, a change encouraged by the move from proprietary technology standards to open technology standards. The proliferation of startups as a key component in the rise of NEBM expanded the possibilities for job-hopping, especially when those startups were highly concentrated in high-tech industrial districts such as Silicon Valley and Route 128. Enabling the rise of flexible labor markets in the 1980s was the rise of flexible capital markets in the form of venture capital, a phenomenon that took root in Silicon Valley in the 1970s as a distinctive financial services industry dedicated to the formation of new firms.
Table 1: Old Economy Business Model (OEBM) and New Economy Business Model (NEBM) in the Information and Communication Technology (ICT) Industries
OEBM NEBM
Strategy,
product
Growth by building on internal capabilities; business expan-sion into new product markets based on related technologies; geographic expansion to access national product markets.
New firm entry into special-ized markets; sale of branded components to system integ-rators; accumulation of new capabilities by acquiring young technology firms.
Strategy,
process
Corporate R&D labs; develop-ment and patenting of prop-rietary technologies; vertical integration of the value chain, at home and abroad.
Cross-licensing of techno-logy based on open systems; vertical specialization of the value chain; outsourcing and offshoring.
Organization Secure employment: career with one company; salaried and hourly employees; unions; defined-benefit pensions; employer-funded medical insurance in employment and retirement.
Insecure employment: inter-firm mobility of labor; broad-based stock options; non-union; defined-contribution pensions; employee bears greater burden of medical insurance.
Finance Venture finance from personal savings, family, and business associates; NYSE listing; payment of steady dividends; growth finance from retentions leveraged with bond issues.
Organized venture capital; initial public offering on NASDAQ; low or no divi-dends; growth finance from retentions plus stock as acqui-sition currency; stock repur-chases to support stock price.
Source: Lazonick 2009a, 17.
5
Lazonick: Marketization, Globalization, Financialization
I will argue in this paper, however, that the ways in which these flexible labor and capital markets were created to put NEBM in place had by the 2000s resulted in institutions for the allocation of labor and capital that are at the root of the current fragility of the US economy, both in terms of its own internal socioeconomic dynamics and its capability to respond to new global challenges. Specifically, as is indicated under the categories “Organization” and “Finance” in Table 1, the rise of NEBM elevated the stock market to a position of far greater importance in the allocation of resources to innovative enterprise than it had played before (Lazonick 2009a).1 Under OEBM, the role of the stock market had been to separate ownership from control; the fragmentation of share ownership of publicly listed companies left salaried managers in positions of strategic control over the allocation of corporate resources. The separation of ownership from control occurs to some extent under NEBM when companies list on the stock market.2 Under NEBM, however, the stock market also performs compensation and combination functions. Through the offer of what came to be known as “broad-based” stock-option plans, the rise of NEBM relied on prospective stock-market gains to induce professional, technical, and administrative labor to leave secure employment at established companies for insecure employment at startups. Through the possibility for doing an IPO or a merger-and-acquisition (M&A) deal, the rise of NEBM also relied on prospective stock-market gains to induce financial capital accumulated in the Old Economy to be transferred to the New Economy in the form of venture capital. In the process, as I will show in this paper, even the most innovative sectors of the US economy have become highly financialized, with the allocation of corporate resources being driven by the ideology of “maximizing shareholder value”. By financialization, I mean the evaluation of the performance of a company by a financial measure such as earnings per share. The manifestation of the financialization of the US economy is the obsession of corporate executives with distributing “value” to shareholders, especially in the form of stock repurchases, even if it is at the expense of investment in innovation and the creation of US employment opportunities. In the 1980s and 1990s the rise of NEBM, characterized by marketization and globalization, enhanced the potential of the US economy to upgrade its innovative capability in response to international competition. By marketization, I mean that competitive market processes play a heightened role in the allocation of inputs to a company and the sale of outputs by a company. By globalization, I mean the breaking down of national barriers that face a company to the movement of goods, people, and money around the world. The marketization of both capital and labor permitted the
1 The stock market can perform five functions in the operation of the company that can be summarized as
creation, control, combination, compensation, and cash (see Lazonick 2009b). 2 Under NEBM, most companies list on NASDAQ, which has less stringent listing requirements than the
New York Stock Exchange (NYSE), thus tending to shorten the duration of time from company formation to initial public offering (IPO), which in turn tends to increase the prevalence of owner-entrepreneurs who still exercise a degree of control over the allocation of resources of the company after the IPO. Nevertheless, the participation of venture capital and the use of broad-based stock option plans in NEBM contribute to the separation of ownership from control at the IPO, and the tendency remains for the complete separation of ownership from control over time under NEBM.
6

Lazonick: Marketization, Globalization, Financialization
reallocation of resources to new innovative firms. The globalization of capital and labor permitted US-based companies to focus their investments in the United States on higher value-added activities while offshoring lower value-added activities to lower wage areas of the world. In the presence of marketization and globalization, however, the achievement of equitable and stable economic growth in the United States required more, not less, coordinated investment by business and government in developing the capabilities of the US labor force as a whole and in ensuring the availability of new employment opportunities to make use of those capabilities. In the 2000s the financialization of the US business corporation undermined the innovative potential of marketization and globalization, thus not only exacerbating inequity and instability but also restricting the potential for economic growth. Despite the financial meltdown of 2008, there are scant signs in the 2010s of institutional changes that will constrain the destructive behavior of financialized corporations. In the next two sections of the paper, I will analyze how the marketization and the globalization of corporate resource allocation, and in particular the marketization and globalization of labor, contributed to the success of NEBM in international competition. In the following section I will show how the financialization of corporate resource allocation under the dominant US business model that arose out of the processes of marketization and globalization is now resulting in a massive misallocation of resources in the US economy, manifested especially in the practice of stock buybacks. As a result, as I will argue in the concluding section of this paper, the US economy has become a very fragile economy. Under OEBM, the industrial corporation performed critical collective functions in ensuring economic security in employment and retirement to US households that it no longer performs. Given marketization and globalization, under NEBM there is a much greater need for the government to perform these collective functions. Yet, with the financialization of corporate resource allocation, the trend of government involvement in the provision of economic security has moved in just the opposite direction. It will require, I contend, a radical transformation of US economic institutions and government policies to provide equitable and stable growth to the US economy. In the interim, US policy-makers should mark the US economy “fragile”, and take measures to restore its vitality that bear the warning “handle with care”. 2. Marketization The retrospectively-labeled Old Economy business model was the dominant form of business organization in the post-World War II decades through the 1980s. A small number of corporations dominated a variety of industries in the US economy. In the 1950s and 1960s foreign competition did not yet loom large. As part of what President Dwight Eisenhower called “the military-industrial complex”, the US government played an important role in funding high-tech research. At most of the major industrial corporations on which the US economy depended for productive investment, shareholding was widely dispersed, leaving top executives and
7

Lazonick: Marketization, Globalization, Financialization
their appointed boards with control over resource allocation. Within these corporations, a “retain-and-reinvest” resource-allocation regime prevailed. Corporations retained, on average, about 60 percent of their after-tax profits for possible reinvestment in productive capabilities. If necessary, corporations augmented the financial resources available for investment purposes by prudently leveraging retained earnings with long-term bond issues at favorable rates. Bank loans were used almost exclusively for working capital. Companies made only limited use of the stock market as a source of investment funds. In addition to retaining a portion of their earnings, these corporations also retained their managerial personnel, giving them the realistic expectation of a career with one company. In the unionized companies of, for example, the automobile and steel industries, seniority provisions gave “hourly” production workers the expectation of permanent employment. In 1958 International Business Machines (IBM), a non-union company that was already dominating the newly emerging computer industry, placed all of its employees on salaries in order to fend off the unionization of its blue-collar workers, and touted its system of “lifelong employment” as a foundation for its corporate success (Lazonick 2009a, 83-89). So too at Hewlett-Packard (HP), an electronics engineering company founded next to Stanford University in 1939, where “The HP Way” provided a high level of employment security until the late 1990s (Lazonick 2009a, 89-97). Whether union or non-union, hourly or salaried, Old Economy companies also provided their career employees with company-sponsored heath insurance plans as well as defined-benefit pensions that would provide them with economic security in retirement. An Old Economy company valued career employees because they had experience in the development and utilization of the company’s proprietary technologies. At many of the leading companies, the corporate R&D lab was the leading source of this intellectual property. Investment in new products and processes was often done on military contracts, with the adaptation of the technologies to commercial production as process technologies improved and potential unit costs declined. As these companies passed on some of their productivity gains to their employees in the forms of higher wages, they supported the growth of mass markets on which they could attain high capacity utilization of their existing productive capabilities and for which they could develop new products. Under OEBM, major business corporations controlled product, labor, and capital markets rather than being controlled by them. The Old Economy retain-and-reinvest regime fostered equity in income distribution and stability in employment for corporate participants. At the same time, not all participants in the US labor force were included in this world of corporate employment. In particular, blacks were largely excluded until the late 1960s when upward mobility of whites from blue-collar families into salaried jobs combined with equal opportunity legislation to open up union-sector jobs to blacks. The growth of the Old Economy corporation began to reach its limits, however, in the conglomerate movement of the 1960s. From the 1920s through the 1950s, through what became known as the multidivisional structure, US industrial corporations had grown through diversification into new lines of business that were technologically related to their existing lines of business (Chandler 1962). During the 1950s, however, an ideology
8

Lazonick: Marketization, Globalization, Financialization
of corporate governance emerged that a well-trained executive could manage anything, and by the 1960s this ideology justified the widespread movement, typically through debt-financed acquisitions, into lines of business that had no technological relation to one another (Lazonick 2004). In the 1970s the failure of such unrelated diversification became apparent. Downgraded conglomerate debt, known as “fallen angels”, formed the foundation for a market in “junk bonds”. Subsequently, newly issued junk bonds came into use to finance the unwinding of these faltering conglomerates, often through management buyouts. By the mid-1980s, during what became known as the “deal decade”, the process of selling and buying companies had become thoroughly marketized and financialized as junk-bond financed leveraged buyouts became a distinctive feature of a new greed-driven style of American capitalism (Lazonick 2004). In the process, for the sake of financial gain, plant closings and the permanent layoffs of workers became an accepted norm in the United States (Uchitelle 2006). At the same time, the challenge of Japanese competition was encouraging many corporate executives to view their employees, and especially their blue-collar workers, as expendable. In some US conglomerates, those who exercised strategic control over the corporate allocation of resources had little if any understanding of the new investments that would be required to respond to the Japanese challenge (see Holland 1989 for a case study). But the real vulnerability of US industry to Japanese competition was on the shop floor (Lazonick 1990, chs. 7-10). Even though unionized “hourly” workers had a high degree of job security in the post-World War II decades, they had historically been excluded from the processes of organizational learning that occurred within the managerial organization. In sharp contrast, the integration of shop floor workers into the organizational learning processes was the prime source of Japanese competitive advantage (Lazonick 1998). The adverse impact of Japanese competition on US employment became particularly harsh in the recession of 1980-1981 when, as it turned out, large numbers of good blue-collar jobs disappeared permanently from US industry. Black workers were the group most severely affected; many of them had recently moved into unionized jobs, and last hired, they were the first fired (see Kletzer 1991; Sharpe 1993; Fairlie and Kletzer 1998). The recovery from the recession of 1980-1981 saw the emergence of what would become the Wintel architecture around the IBM PC. In 1982 IBM’s PC sales were $500 million and just two years later 11 times that amount, more than triple the 1984 revenues of its nearest competitor, Apple, and about equal to the revenues of IBM’s top eight rivals. Subsequently, the very success of the IBM PC combined with open access to the Microsoft operating system and Intel microprocessor meant that, in the last half of the 1980s and beyond, IBM lost market share to lower priced PC clones such as Compaq, Gateway, and Dell (Chandler 2001, pp. 118–119, 142–143). Nevertheless IBM’s strategy for entering the microcomputer market had consolidated and reinforced the vertically specialized structure of the industry in line with what can be
9

Lazonick: Marketization, Globalization, Financialization
viewed as the Silicon Valley model (Langlois 1992; Grove 1996, ch. 3). The subsequent domination by Intel and Microsoft of the product markets for microprocessors and operating software respectively created an immense barrier to entry to actual and potential competitors who would directly confront the New Economy giants. At the same time, however, by defining the “open access” standards for the computer industry, Intel and Microsoft opened up countless opportunities for new entrants to develop specialized niche products that conformed to the “Wintel” architecture (Pollack 1985; Borrus and Zysman 1997). A number of Silicon Valley design-oriented chip companies that entered the industry in the 1980s, and even more so in the 1990s, did so without investing in the manufacture of semiconductors. For example, many producers of programmable logic devices and graphics processors such as Altera, NVIDIA, and Xilinx turned to foundries to manufacture their chips. The Taiwanese in particular took advantage of the opportunity, as the Taiwan Semiconductor Manufacturing Company (TSMC) and United Microelectronics Corporation (UMC) became the largest semiconductor contract manufacturers in the world (Zerega 1999; Leachman and Leachman 2004; Taiwan Industry Semiconductor Association 2007). If a layer of vertical specialization emerged in the manufacture of chips, so too did it emerge in the assembly of chip sets, printed circuit boards, and, increasingly, even finished products (Sturgeon 2002). In the 1980s and early 1990s contract manufacturers, also known as electronic manufacturing service (EMS) providers, operated as job shops that took on extra work from integrated original equipment manufacturers (OEMs) in periods of peak demand. Then, during the mid-1990s, a few Old Economy companies – particularly IBM, HP, and Ericsson (in Sweden) – took the lead in selling existing plants to EMS providers (Lazonick 2009a, ch. 3). Indeed, in the mid-1990s IBM spun off its manufacturing subsidiary, IBM Canada, as an independent EMS provider, Celestica. Meanwhile the newest New Economy companies such as Cisco and 3Com that engaged in internetworking outsourced almost all of their manufacturing from the outset. In the Internet boom of the late 1990s, the demand for EMS capacity soared. New Economy companies that did no manufacturing relied on EMS providers for not only assembly but also an increasing array of services including testing, design, documentation, and shipping (Curran 1997). Old Economy telecommunications equipment companies such as Motorola, Lucent, and Nortel also undertook major outsourcing programs to EMS providers; by 2000 there was a rush by these companies to offload manufacturing plants. In the process, five of the largest EMS providers with roots in North America – Celestica, Flextronics, Jabil Circuit, Solectron, and Sanmina-SCI – emerged with total employment of 90,000 people in 1999, 268,000 in 2004, 356,000 in 2007 and 280,000 in 2008 (Carbone 2000, 2002, 2004).3
3 Flextronics was founded in Silicon Valley in 1969, but moved its headquarters to Singapore in 1990. In
October 2007 Flextronics acquired Solectron, and in 2008 had 160,000 employees worldwide. By far the largest contract manufacturer in electronics manufacture is Taiwan-based Hon Hai Precision Industry, also known as Foxconn, which increased its revenues from $1.2 billion in 1998 to $10.7 billion in 2003 to $61.8 billion in 2008, at which point it had 550,000 employees.
10

Lazonick: Marketization, Globalization, Financialization
For companies such as IBM and HP, the outsourcing of components to EMS providers was a direct result of their moves from proprietary system to open system architectures during the 1980s.4 More than any other company, IBM was responsible for the rise of open systems through its sponsorship of what would become Wintelism as the architecture for the IBM PC. In 1984, with the PC revolution in full swing, HP made a strategic decision to manufacture its computer products, including printers which would become its mainstay, to comply with the open systems that had emerged in the information technology industry (Hewlett-Packard 1984, 11). Based largely on this open-systems strategy, from 1983 to 1998 HP’s revenues increased from $4.7 billion to $47.1 billion, representing an expansion of 6.1 times in real dollars. Through sales of high-margin print cartridges and outsourcing of manufacturing, HP achieved this six-fold increase in real revenues with an expansion in employment of only 1.7 times – from 72,000 to 142,600 – with the result that sales per employee in 1998 dollars increased by 3.5 times, from $107,000 to $378,000. During the 1990s IBM pursued a strategy of shifting its business out of hardware into services. Continuing a trend that began in the late 1980s, the share of revenues from hardware declined from 48 percent in 1996 to 25 percent in 2006, while the services share increased from 29 percent to 53 percent.5 In December 2004 there was considerable publicity concerning IBM’s sale of its PC business to Lenovo, an indigenous Chinese computer company formerly known as Legend. IBM’s new emphasis on services and software as well as the vertically specialized structure of the ICT industry that IBM itself had played a major role in creating rendered the use of a mobile and flexible high-tech labor force much more desirable and possible for the company than had been the case in the 1980s. Given the absence of in-house investments in proprietary systems, the technological rationale for Old Economy lifelong employment no longer existed at IBM. The company now favored younger employees whose higher education was up-to-date and who had work experience at other companies within the ICT industries over older employees who had spent their careers with IBM. From 1990 to 1994, IBM cut employment from 373,816 to 219,839, reducing its labor force to only 59 percent of its year-end 1990 level. During this period, much of IBM’s downsizing continued to be accomplished by making it attractive for its employees to accept voluntary severance packages, including early retirement at age 55. In 1993 and 1994, however, after recruiting CEO Louis V. Gerstner, Jr. from RJR Nabisco to get the job done, many thousands of IBM employees were fired outright. In 1995 IBM rescinded the early-retirement offer that had helped downsize its labor force; the offer had
4 The following summaries of the transitions of IBM and HP from OEBM to NEBM are based on Lazonick
2009a, ch. 3. This chapter also provides an analysis of the failed transition from OEBM and NEBM of Lucent Technologies, the largest communication equipment company in the world as late as 2000 (see also Lazonick and March 2010).
5 As of 2007 IBM changed its segment classification scheme so that one can no longer identify hardware sales.
11
Lazonick: Marketization, Globalization, Financialization
accomplished its purpose, and in any case, IBM no longer wanted to encourage all employees to remain with the company even until the age of 55. Of IBM’s losses of $15.9 billion in 1991-1993 (including an $8.1 billion deficit in 1993, the largest annual loss in US corporate history at the time), 86 percent came from workforce-related restructuring charges (including the cost of employee separations and relocations) – in effect the cost to the company of ridding itself of its once-hallowed tradition of lifelong employment. Other restructuring charges, mainly for the consolidation of manufacturing capacity and elimination of excess space – both part and parcel of the massive downsizing process – amounted to $10.6 billion over the three years. Ignoring restructuring charges, IBM recorded positive net incomes before taxes of $939 million in 1991, $2,619 million in 1992, and $148 million in 1993. Although IBM continued to downsize at a torrid pace in 1994, most of it was done outside the United States and without voluntary severance provisions. During 1994 the company booked no restructuring charges and had after-tax profits of $3,021 million. By that time, lifelong employment at IBM was a thing of the past. Unlike IBM, which deliberately and dramatically made the transition to New Economy employment relations in the first half of the 1990s, HP sustained its commitment to employment security through the 1990s. That this commitment lasted as long as it did is testimony to the legacy of “The HP Way”, a corporate philosophy whose life at the company was probably prolonged by co-founder David Packard’s 1995 publication of the best-selling autobiography with this title.6 By the mid-2000s, however, HP, with 150,000 employees, had become what Packard would have called a “hire-and-fire” company. As was the case at IBM, HP’s transition to NEBM, including the employment of a more mobile and flexible labor force, was encouraged by the shift from proprietary to open technology standards that had begun to take root in the early 1980s. In the 1980s and 1990s HP found itself at the center of the microelectronics revolution not only because of its location in Palo Alto, California, where it acquired iconic status as the pioneering Silicon Valley firm, but also because of a business strategy that focused increasingly on consumer-oriented computer products and peripherals. In building its competitive strategy around open systems, HP acquired a greater interest in employing a labor force with industry-wide experience as distinct from one that had in-house experience in proprietary technology. HP’s major Route 128 rivals in the minicomputer industry – Digital Equipment Corporation (DEC), Wang Laboratories, and Data General – all continued to adhere to proprietary systems, and all ceased to exist in the 1990s. In 1984 DEC had $1,527 million in minicomputer sales to HP’s $950 million. In the 1990s, however, DEC fell victim to competition from ever more powerful and functional open-systems computers, and in 1998 was acquired by Compaq – a company that, by cloning the IBM PC, had become a global leader in personal computers. What
6 Packard, who retired as HP’s chairman of the board in 1993, died in March 1996. Co-founder William
Hewlett, who retired as CEO of HP in 1978 and as vice-chairman of the board in 1987, died in January 2001.
12
Lazonick: Marketization, Globalization, Financialization
was left of DEC, a company that had a peak employment of 126,000 people, ultimately became a part of HP when HP merged with Compaq in 2002. HP’s 1999 spinoff of Agilent Technologies, which included the electronic testing and measurement devices business on which HP had been founded, marked the beginning of the end of “The HP Way”. A few months after the Agilent spinoff, HP hired a new CEO, Cara Carleton S. Fiorina, an apostle of the New Economy recruited from Lucent Technologies. In the recession of 2001 HP eliminated 10,700 jobs, leaving displaced employees with dim prospects of finding new positions within HP. While HP’s management never officially announced the demise of “The HP Way”, neither would it henceforth invoke it as the prevailing corporate philosophy. As Old Economy companies like IBM and HP made the transition from OEBM to NEBM in the 1990s, they instituted broad-based stock options plans, a mode of compensation for non-executive employees that had in the 1970s and 1980s become a characteristic feature of employment at New Economy firms. The executive stock option had its origins in the United States from the late 1930s as high-level corporate executives sought a form of compensation that would be subject to the 25 percent capital-gains tax rate rather than personal-income tax rates on the highest income brackets that reached 92 percent in the 1950s (Lazonick 2010c). The Revenue Act of 1950 transformed this possibility into reality, and over the course of the 1950s, top executives of U.S. corporations saw income from options become an important component of their total remuneration (Lewellen 1968). The significant use of stock options for non-executive employees originated in the 1960s when high-tech start-ups began to offer them to scientists, engineers, and managerial personnel at all levels, not just top executives, to lure them away from employment at established companies. Old Economy corporations could credibly promise secure employment to professional, technical, and administrative employees with superior compensation taking the form of pay increases tied to promotion up the managerial hierarchy. Start-ups, their futures highly uncertain, could not realistically hold out the expectation of employment security. They could, however, use stock options, with exercise prices often at pennies a share, to attract well-educated and experienced personnel. If the start-up did an IPO or was sold to an already listed company in an M&A deal, these stock options would become very valuable. The high concentration of start-ups in Silicon Valley meant that increasingly in the 1980s new ventures used stock options not only to induce high-tech labor to leave secure employment with established corporations, but also to compete among themselves for personnel. Besides attracting “talent” and giving them a stake in getting the start-up to an IPO, ample stock options could substitute to some extent for cash salaries. The growing importance of stock options to attract new employees placed pressure on high-tech firms to use options to retain them as well. For this reason, the practice evolved in New Economy firms of making annual option grants, with the vesting period for any annual block of option grants being 25 percent of the grants at the end of each of the first four years after the grant date. Once the options were vested, they could typically be exercised
13
Lazonick: Marketization, Globalization, Financialization
for a period of 10 years from the grant date, so long as one remained with the company. Without creating the Old Economy expectation among employees of “lifelong careers” with the company, the perpetual pipeline of unvested options functions as a tangible retention mechanism. Indeed, for most employees, the amount of options that an individual can expect to receive is tied to his or her position in the firm’s hierarchical and functional division of labor, so that the retention function of stock options is integrally related to the employee’s career progress within the particular company. During the Internet boom, at companies like Microsoft, Cisco, and Intel, income from broad-based stock options soared with speculative stock prices (see Lazonick 2009a, pp. 54-66). I have estimated that in 2000 the average gains per employee (not including the five highest paid executives) from exercising stock options were $449,000 at Microsoft (across 39,000 employees worldwide), $291,000 at Cisco (across 34,000 employees worldwide), and $112,000 at Intel (across 86,000 employees worldwide) (Lazonick 2009a, 64). We have no information on how these stock-option gains were distributed across a company’s employees. We do know that for all employees of these three companies, any stock options that they were awarded at the peak of the Internet boom would have expired, deeply “under water”, 10 years later. In the very changed economic environment of the 2000s the key issue for many high-tech employees in the United States was not how much extra earnings they would get from their stock-based compensation but whether they would have a job that would make use of, and provide them with returns to, their education and experience. In the economic recoveries that followed each of the recessions in the US economy in the early 1980s, early 1990s, and early 2000s, college-educated members of the US labor force discovered that a new structural change – related as we can see in historical retrospect to the transition from OEBM to NEBM – had taken place in the quality and quantity of employment opportunities available to them in the United States. In the aftermath of the “blue-collar” recession of 1981-1982, during the “deal decade” of the 1980s, plant closings in the “rust belt” hit mainly blue-collar workers. Meanwhile college-educated entrants to the US labor force found a whole new range of opportunities in choosing between either secure employment in OEBM or flexible and potentially more lucrative employment in NEBM. Even then a 1986 BusinessWeek cover story signaled the danger that a softening of career employment with one company held out for older, and hence generally more expensive, managerial and professional corporate employees. In “The End of Corporate Loyalty?” (Nussbaum 1986), BusinessWeek observed:
Of course, eliminating jobs is an old story for U. S. companies. What’s new is the growing willingness of some of the most successful corporations to slash management and professional jobs. In troubled industries, these staff reductions are often needed to survive. But plenty of healthy companies are paring away, too. Their motives: getting expenses in line with foreign rivals, pleasing Wall Street, or streamlining unresponsive bureaucracies.
14

Lazonick: Marketization, Globalization, Financialization
In the aftermath of the “white-collar” recession of the early 1990s, the United States economy experienced its first “jobless recovery”. As Lori Kletzer (1998, 117) wrote in a 1998 survey article on “job displacement”:
Job loss rates fell steadily from the 1981–83 rate, which encompassed the recession of 1981–82, through the expansion period of 1983–89. Job loss rates then rose again in 1989–91 as the economy weakened. The latest job loss figures are surprising. In the midst of a sustained (if uneven) expansion, 1993–95 job loss rates are the highest of the 14-year period: about 15 percent of U.S. workers were displaced from a job at some time during this three-year period. These high rates of job loss are consistent with public perceptions of rising job insecurity.
The first jobless recovery in the early 1990s reflected the marketization of the employment relation that was integral to the transition from OEBM to NEBM. Given its size, reputation, and central position in the ICT industries, IBM’s transformation from OEBM to NEBM from 1990 to 1994 marked a fundamental juncture in the transition from employment security to employment insecurity in the US corporate economy. In line with the IBM experience, for the period of 1992 to 1997, John Abowd and his co-authors (2007) found a general shift in US employment from older experienced workers to younger skilled workers related to the adoption of computer technologies. Using Current Population Survey data, Charles Schultze (1999, 10–11) discovered that “[m]iddle-aged and older men, for whatever reason, are not staying as long with their employers as they once did.” He went on to show, moreover, that the job displacement rate for white-collar workers relative to blue-collar workers had risen substantially in the 1980s and 1990s, starting at 33 percent in 1981–1982 and increasing to about 80 percent in the 1990s. In a more recent survey of changes in job security, Henry Farber (2008, 1) stated that “[t]here is ample evidence that long-term employment [with one company] is on the decline in the United States.” Using Current Population Survey data for 1973–2006, Farber (2008, 27) showed that in the 1990s and 2000s members of the US labor force experienced shortened job tenure, with the impact being most pronounced for males. Moreover, education and experience are no longer the guarantors of employment security that they once were. Using Displaced Worker Survey data to analyze rates of job loss, Farber (2008, 35) found that those with college educations had job loss rates 22 percent lower than those with high school educations in the 1980s, but only 12 percent lower in the 2000s. He also found that workers aged 45–54 had job-loss rates 19 percent higher than workers aged 20–24 in the 1980s, whereas the job-loss rates of the older age-group were 58 percent higher than those of the younger age group in the 2000s. In the aftermath of the recession of 2001-2002, the United States experienced its second jobless recovery (Groshen and Potter 2003). In February 2003 the headline of a BusinessWeek cover story asked: “Is your job next?”. The story subhead went on to warn: “The new round of globalization is sending upscale jobs offshore. They include chip design, engineering, basic research – even financial analysis. Can America lose these jobs and still prosper?” (Engardio et al. 2003). Now college-educated members of
15
Lazonick: Marketization, Globalization, Financialization
the US labor force found that workers in China and India were qualified to do jobs that most had thought could not be done abroad, and they could be employed at a fraction of the cost. In a 2008 article, “Trends in Wage Inequality”, David H. Autor and co-authors (2008, 300) highlighted “a puzzling deceleration in relative demand growth for college workers in the early 1990s, also visible in a recent ‘polarization’ of skill demands in which employment has expanded in high-wage and low-wage work at the expense of middle-wage jobs.” They also found that “[t]he return to college for younger workers has increased much more substantially since 1980 than for older workers” (Autor et al. 2008, 309). In my view, these changes in the relative position of experienced college-educated workers in the US wage structure are outcomes of the marketization of the employment relation and the globalization of the labor force, with the significant impact of marketization occurring from the early 1990s and of globalization from the early 2000s. 3. Globalization Under OEBM, multinational companies (MNCs) tended to locate branch facilities in the geographic locations of their product markets. Decisions to go multinational could be the result of many factors: to jump tariff barriers, to reduce transportation costs of intermediate and final goods, to cater to local cultural norms. In general, MNCs reproduced their vertically integrated structures in the host nations. The preponderance of FDI by MNCs was in the advanced economies where they could access large markets. In the Old Economy, the majority of FDI in less developed countries was for purposes of resource extraction, and did little to generate linkages that encouraged the development of manufacturing, let alone R&D, capabilities (Cantwell and Vertova 2004; Jones 2006). In contrast, under NEBM, FDI has entailed investments in global value chains that, especially in Asia, have had a profound impact on the development of manufacturing, and increasingly R&D, capabilities in many emerging economies (Lazonick 2007 and 2009a, ch. 5). In 1963 Fairchild Semiconductor, the 1957 startup that seeded the semiconductor industry in what would become known as Silicon Valley, was the first company to set up chip assembly operations in Asia. By 1971 a United Nations research report could state: “Every established United States semiconductor firm appears to be engaged in some offshore assembly without exception” (Chang 1971, 17). The report listed 33 offshore facilities established during 1963-1971 by 22 different US semiconductor companies, of which eight, with 16 offshore plants among them, were based in Silicon Valley (Chang 1971, 19-20). From 1972 Malaysia became a favored location for semiconductor assembly, with HP and Intel being among the first to open plants in the new Free Trade Zone in Penang. In 1974 Malaysia hosted 11 US-owned semiconductor facilities, South Korea nine, Hong Kong eight, Taiwan three, and the rest of Asia six, while there were 15 US facilities in Latin American countries, primarily Mexico (Davis and Hatano 1985, 129). US tariff policy facilitated the offshoring movement. Sections 806.30 and 807 of the Tariff Schedule of the United States permitted goods that had been exported from the
16
Lazonick: Marketization, Globalization, Financialization
United States for foreign assembly to be imported with duty charged only on the value-added abroad. In 1967 dollars, “806/807” imports of semiconductors to the United States increased from $130 million in 1969 (accounting for 95 percent of all semiconductor imports into the United States) to $2,267 million in 1979 (79 percent) to $3,368 in 1983 (69 percent) (Flamm 1985, 74). As late as 1974 Mexico was the most important single national location for 806/807 semiconductor exports, but from 1975 its share eroded sharply (Flamm 1985, 76). In 1970 the average hourly wage in semiconductor assembly in Singapore, Hong Kong, and South Korea was less than one-tenth that in the United States, and about half that in Mexico (Chang 1971, 27; Sharpston 1975, 105). The relatively high value and low weight of semiconductor products meant that the proximity of Mexico to the United States did not offer an appreciable transportation advantage over an Asian location (Moxon 1974, 35-36; Flamm 1985; Davis and Hatano 1985, 129). Within Asia during the 1970s and early 1980s there was a marked shift of 806/807 activity from Hong Kong to Malaysia and the Philippines, while South Korea and Singapore sustained substantial market shares. In 1985 there were 63 US semiconductor plants in East Asia, employing just under 100,000 people (Scott 1987, 145, 147; Henderson 1989, 54, 59). In the 1960s and 1970s, as offshoring of semiconductor operations to Asia was accelerating, nations such as South Korea and Taiwan were experiencing a brain drain of college graduates, with most of them going to the United States. While the impetus to offshoring was a search for low-wage labor (typically female) to do routine work, the facilities in which this work was performed also employed managers and engineers (typically male). In late 1960s these offshore plants provided some of first employment opportunities in high-tech industry in places like Korea and Taiwan. The emergence of these domestic employment opportunities at MNCs helped set in motion a process of government investment in research institutes and the emergence of indigenous enterprises that by the late 1980s enabled Korea and Taiwan to reverse the brain drain (Lazonick 2009a, ch.5). As the capabilities of high-tech labor were developing in Asia, the United States was making it easier for college-educated Asians to come to the United States for further education and employment. During the 1980s a growing number of Asian high-tech workers had entered the United States on temporary H-1 visas. This nonimmigrant visa category was created in 1952 to permit people of “distinguished merit and ability” to work in the United States for several years at a time. In 1989 a special category of H-1 visa – the H-1A – was created to deal with a shortage of nurses. All others who worked in the United States under the H-1 program henceforth were categorized as H-1B. At the time, there was no specific cap on the number of H-1 visas that could be issued, and it reached 49,000 per year in the late 1980s. Labor interests then sought to have the H-1B capped at 25,000 visas per year, but, arguing that US competitiveness was at stake, the high-tech business lobby, supported by the immigration lawyers lobby, secured a very different outcome. The Immigration Act of 1990 set the cap at 65,000. The American Competitiveness and Workforce Improvement Act raised the cap to 115,000 for fiscal
17
Lazonick: Marketization, Globalization, Financialization
years 1999 and 2000, and the American Competitiveness for the 21st Century Act of 2000 raised it to 195,000 for fiscal years 2001 through 2003. As of October 1, 2003 the annual cap of 65,000 was restored, but with an extra 20,000 visas available to foreign-born professionals who have an advanced degree from a US institution of higher education. The H-1B visa is a prime way by which college graduates from abroad get work experience in the United States. According to data released in the early 2000s, 98 percent of those admitted under the program had at least a bachelor’s degree and 48 percent at least a master’s degree, while 39 percent had qualifications in computer-related fields. The average age of H-1B workers admitted in 2003 was 32, with 65 percent between the ages of 25 and 34 (US Department of Homeland Security 2002-2004). Companies apply for the visas, and then can hire the temporary immigrants for an initial period of up to three years, with a renewal possible for another three years. The employer may opt to sponsor the H-1B employee to become a permanent resident of the United States, and the employee can remain with the company until the permanent residency process is completed.
Indians dominate as recipients of H-1B visas. Over the decade 2000-2009, Indians received 46.5 percent of the H-1B visas issued, followed by the Chinese with 6.3 percent and the British with 4.3 percent. In 2007 Indians received a record total of 83,464 H-1B visas, 54.0 percent of the total (US Department of State 1997-2009). Indians have also come to dominate as recipients of L-1 visas, which permit a company to bring a foreign employee who has worked for the company for at least one year to the United States for a period of five to seven years. There is no cap on the number of L-1 visas granted; the number issued rose from 36,589 in 1997 to 54,963 in 2000 to 84,532 in 2007 and 84,078 in 2008 before declining to 64,696 in 2009. In 1997 Japanese received 19.5 percent of the L-1 visas, British 16.0 percent, Chinese 8.3 percent, Germans 6.7 percent, Mexicans 6.4 percent, and Indians 4.4 percent. By 2000, however, Indians had become the leading group with 16.9 percent, followed by British with 15.6 percent and Japanese with 13.0 percent. The Indian proportion kept rising to 48.5 percent in 2007, when Indians received 41,011 visas, a record number. In the period 2005-2009, 44.9 percent of all L-1 visas went to Indians, 8.5 percent to British, and 6.7 percent to Japanese, with Chinese in 7th place with 2.6 percent. Many of the largest corporate users of H-1B and L-1 visas are Indian IT services companies such as TCS, Infosys, Wipro, and Satyam doing business in the United States (Lazonick 2009a, ch. 5; Hira 2010). There has been considerable debate concerning the impact of the H-1B visa program on the employment opportunities available to permanent members of the US labor force (see Hira 2010). Companies often hire H-1B workers instead of members of the US labor force with the same skills; indeed, there are many stories of US workers about to be laid off who have had to train workers on H-1B visas to be their replacements. Companies are supposed to pay H-1B workers the same wages and benefits as comparable US workers, but compliance has not been enforced. The holders of H-1B visas are highly dependent on their current employer for continuing employment that will allow them to remain in the United States. Especially given the marketization of the employment relation in US
18
Lazonick: Marketization, Globalization, Financialization
industry, the barriers to interfirm labor mobility faced by workers on non-immigrant visas mean that they have far less power than regular members of the US labor force to use the threat of “exit” to influence their conditions of work and pay. Data are lacking on the extent to which workers on non-immigrant visas ultimately take their human capital, enhanced by work experience in the United States, back home (Wadhwa et al. 2009). It would appear, however, that relatively few end up staying permanently in the United States (Hira 2010). At the same time, even in the case of India, the nation that makes the most use of non-immigrant visas, the vast majority of the nation’s employees in the burgeoning IT services sector never leave home for study or work. The 2000s saw the phenomenal growth of indigenous IT services companies in India, led by Tata Consultancy Services (TCS), Infosys, and Wipro. From 2001 to 2009, TCS increased its number of employees from 16,800 to 143,761, Infosys from 5,389 to 104,850, and Wipro from 14,181 to 96,965. These companies have been joined by US-based multinationals such as IBM, HP, and Accenture in the IT services business. At the beginning of 2010 IBM had about 80,000 employees in India, HP about 60,000, and Accenture about 50,000 (Tripathi 2009; Singh 2010). In the debate over the cap on H-1B visas, many employers say that if they cannot find qualified workers in the United States, they will go abroad to find these employees. The offshoring alternative is far from an empty threat. Most US ICT companies provide little if any information on the global composition of their workforces. As summarized in Table 2, however, in their global citizenship/responsibility reports IBM, HP, and Intel have published data on the diversity (gender, race, and ethnicity) of their US labor forces, from which (with the exception of HP’s most recent report) it is possible to track the relative proportions of employees located in the United States and abroad (see Lazonick 2009b, 29-31). The available data on US employees (USE) as a proportion of worldwide employees (WWE) for HP begin in 2002, subsequent to its merger with Compaq. USE declined from 48 percent in 2002 to 31 percent in 2007. In 1985 HP was the first US company to have a joint venture in China under its economic reforms, and two decades later the company employed about 5,000 people in China. In early 2009 HP had about 3,600 employees at five software outsourcing centers in China as well as call centers in Shanghai, Dalian, and Chongqing. In early 2010 HP began to manufacture PCs for the Chinese market at a new plant in Chongqing, and also announced the acquisition of network equipment maker 3Com, with most of its 5,800 employees in China (Luttrell 2009; SinoCast 2010). HP set up its first Indian research lab in 2002, and employed 2,200 people in India just before its merger with Compaq. At the end of 2003, after making an Indian affiliate, Digital Globalsoft, a wholly-owned subsidiary, HP found itself with more than 10,000 employees in India, making it the nation’s largest foreign employer, temporarily surpassing IBM. By the end of 2006 HP had doubled Indian employment to about 20,000, or about 13 percent of its global labor force. In May 2008 HP announced the acquisition of the US-based IT services company EDS, which included its Bangalore-based subsidiary, MphasiS, with 28,000 employees in India. In September 2008 HP
19

Lazonick: Marketization, Globalization, Financialization
announced that it would cut 24,600 jobs worldwide – 7.7 percent of the HP/EDS global labor force – with about half of the workforce reductions in the United States. During 2009 HP’s Indian employment reached 60,000, including 34,000 at MphasiS (Menon 2009; Mint 2009). Table 2: Worldwide Employees (WWE) and US Employees (USE), IBM (1996-
2008), HP (2002-2007), and Intel (2001-2008) IBM HP INTEL WWE USE %
USE WWE USE %
USE WWE USE %
USE 1996 240,615 125,618 52 112,000 na na 48,500 na na
1997 269,465 136,487 51 121,900 na na 63,700 na na
1998 291,067 147,491 51 124,600 na na 64,500 na na
1999 307,401 150,600 49 84,400 na na 70,200 na na
2000 316,303 153,587 49 88,500 na na 86,100 na na
2001 319,876 152,195 48 86,200 na na 83,400 54,219 65
2002 315,889 145,705 46 141,000 67,350 48 78,700 50,036 64
2003 319,273 141,022 44 142,000 63,708 45 79,379 48,181 61
2004 329,001 139,899 43 151,000 64,038 42 84,629 48,655 58
2005 329,373 133,967 41 150,000 60,374 40 98,020 53,961 55
2006 355,766 133,973 (127,000)
38 (36)
156,000 54,085 35 92,573 50,348 54
2007 386,558 126,804 (121,000)
33 (31)
172,000 53,519 31 85,187 46,186 54
2008 398,445 120,227 (115,000)
30 (29)
321,000 na na 83,580 44,755 54
NOTES: 1) %USE, US employees as a percent of worldwide employees (note that WWE and USE data were not
necessarily collected on the same dates for any given year). 2) For IBM, USE data for 1996-2008 are from its annual diversity reports, except for the 2006, 2007, and 2008 data
in parentheses, which are year-end employment levels taken from the company’s annual reports, thus suggesting that the diversity data are not year-end figures.
3) na, not available Sources: Company 10-K filings; IBM diversity data at http://www-03.ibm.com/employment/us/diverse/employment_data.shtml;
HP, Global Citizenship Reports, 2002-2008; Intel, Corporate Responsibility Reports, 2001-2008.
Intel reduced USE as a proportion of WWE from 65 percent in 2001 to 54 percent in 2008, representing a net decline of about 9,500 employees in the United States. Of Intel’s 83,580 WWE in 2008, the largest foreign concentration – 11.7 percent of the total – was in Malaysia, where Intel had set up its first offshore assembly plant in 1972. Intel’s next largest employment location was in China, with 8.5 percent of Intel WWE (up from 2.9 percent in 2003), followed by Israel with 6.2 percent, Ireland 4.2 percent, Costa Rica 3.5 percent, the Philippines 3.3 percent, and India 2.9 percent (up from 1.9 percent in 2003). After downsizing from 374,000 employees in 1990 to 220,000 in 1994, IBM increased WWE to 316,000 in 2000, the final year of the Internet boom. During this period IBM increased USE by almost 28,000, but USE as a proportion of WWE fell from 52 percent
20

Lazonick: Marketization, Globalization, Financialization
to 49 percent. From 2000 to 2008 IBM employment outside the United States rose by 116,000 people while USE fell by 33,000. In 2005-2008, IBM had an increase in employment outside the United States of 83,000 people, while the decrease in USE was 14,000, with the share of USE of WWE dropping from 41 percent to 30 percent. In 2007 98,000, or 25 percent, of IBM’s worldwide employees were in Brazil, Russia, India, and China (BRIC), with 74,000, or 19 percent, of all IBM employees, in India alone (IBM 2007, 50). In 2008 BRIC employees increased to 113,000, or 28 percent, of IBM employees worldwide (IBM 2008, 53).
In 2008 IBM was highly profitable, with net income of $12.3 billion (up 18 percent from 2007) on revenues of $103.6 billion (up 5 percent from 2007). The company was particularly profitable in the fourth quarter of 2008 (ending December 31), with net income of $4.4 billion on revenues of $27.0 billion. Yet in January 2009, as part of a process of the transfer of jobs to lower wage countries, IBM terminated the employment of about 4,600 people in the United States and Canada (Lohr 2009). In April IBM announced another 5,000 North American layoffs as part of its offshoring strategy (Bulkeley 2009; Doran 2009). At the beginning of February IBM presented these displaced workers with “Project Match”. As described in an internal document, the purpose of Project Match is to “help you locate potential job opportunities in growth markets where your skills are in demand.” The document goes on to say: “Should you accept a position in one of these countries, IBM offers financial assistance to offset moving costs, provides immigration support, such as visa assistance, and other support to help ease the transition of an international move.” Eligible for Project Match are “satisfactory performers who have been notified of separation from IBM U.S. or Canada and are willing to work on local terms and conditions” (quoted in McDougall 2009). That is, an eligible laid-off worker could apply to IBM for a job in, for example, India, and, if rehired by IBM, would be paid the wages prevailing there. While it was replacing high-wage North American labor with low-wage Asian labor, IBM was using much of its profits to buy back its own stock. As I discuss in detail in the section on financialization that follows, stock repurchases a mode of corporate financial behavior that became pervasive in the 2000s. For the period 2000-2008 IBM repurchased $72.9 billion of its own stock, equivalent to 96 percent of its net income, making it the 3rd largest repurchaser of stock in the United States, behind Exxon Mobil with $144.0 billion and Microsoft with $94.3 billion (Lazonick 2009b). In 2009, while it was laying off close to 10,000 people in North America, IBM recorded record profits of $13.4 billion, and distributed $10.3 billion to shareholders, including $7.4 billion as stock buybacks (IBM 2010). Microsoft did $2.8 billion in buybacks in the fourth quarter of 2008, but then did none in the first and second quarters of 2009. But in September 2008 Microsoft’s board authorized up to $6 billion in debt issues, some or all of which could be used for buybacks (PR Newswire 2008). In May 2009 Microsoft did a $3.75 billion bond issue – its first ever long-term debt offering – with a view to doing buybacks (PR Newswire
21
Lazonick: Marketization, Globalization, Financialization
2009). In the same month, as part of the process, also unprecedented in its history, to reduce its payroll by 5,000, Microsoft was doing its second round of layoffs in 2009 (eWeek 2009). Similarly, Intel did $2.1 billion in buybacks in the third quarter of 2008, but none for the following three quarters. In January 2009 the company announced that it would do 5,000-6,000 layoffs over the course of the year (Deffree 2009). Then in July 2009 Intel announced a $1.75 billion convertible debt issue, of which $1.5 billion would be used to buy back shares (Associated Press Newswires 2009). Why were companies like Microsoft and Intel borrowing money to buy back stock? At the end of June 2009 Microsoft had total cash and near-cash investments of $31.4 billion, up from $23.7 billion a year before, while Intel had $11.3 billion in cash and near-cash, just slightly down from $11.5 billion a year before. Like many other US MNCs, these two companies held much of their cash abroad, encouraged to do so by a longstanding tax loophole that permits US companies to defer tax payments on profits made abroad until such time as those profits are repatriated to the United States. If Microsoft and Intel brought back this cash to do buybacks, they would have incurred taxation at a rate of 35 percent. It was much more cost effective to borrow the money. The relation between this tax deferment and investment in jobs in the United States has not gone unnoticed in Washington. As part of the American Jobs Creation Act of 2004, Congress gave US corporations a one-time, one-year tax holiday on profits repatriated from abroad in 2005, ostensibly in an effort to promote job creation in the United States (Dharmapala et al. 2010; see also Norris 2009). US corporations responded by repatriating $299 billion in profits in 2005, up from an average of $62 billion in 2000-2004, with a decline to $102 billion in 2006 when the tax holiday was no longer in effect. What did US corporations do with the money that they brought back, tax-free, to the United States? In an analysis of the impact of the tax holiday on corporate resource allocation, Dhammika Dharmapala and co-authors (2010, 3) note:
The U.S. Treasury Department issued explicit guidelines on how earnings returned to the United States under the tax holiday could be spent. The funds were to be used for “permitted investments,” which included hiring U.S. workers, U.S. investment, R&D, and certain acquisitions. Repatriations used for certain other purposes, such as executive compensation, dividends, and stock redemptions, would not qualify for the holiday.
Yet in their statistical analysis of the uses of the repatriated profits Dharmapala et al. (2010, 3) found:
Rather than being associated with increased expenditures on domestic investment or employment, repatriations were associated with significantly higher levels of shareholder payouts, mainly through share repurchases. The estimates imply that a $1 increase in repatriations was associated with a $0.79 increase in share repurchases and a $0.15 increase in dividends.
22
Lazonick: Marketization, Globalization, Financialization
Notwithstanding this apparent violation of the Treasury Department’s guidelines for “permitted investments”, the companies that repatriated profits reaped the benefits of the tax holiday. How did they do it? Dharmapala et al. (2010, 4) suggest that it was not rocket science: “[F]irms may have used funds repatriated at the lower tax rate to pay for investment, hiring, or R&D that was already planned, thereby releasing cash that had previously been allocated for these purposes to be used in payouts to shareholders” (see also Graham et al, 2008; Milberg 2008). In his 2008 presidential campaign, Barack Obama vowed to end the tax deferral on profits made abroad, arguing that it encouraged US corporations to “ship jobs overseas” (US Congress 2007; Wilde 2007; Aaron 2008). From the time Obama took office in January 2009, the closing of this tax loophole became central to his administration’s plans to increase tax revenues, to the tune of a projected $210,000 billion over ten years (Sasseen and Epstein 200; Condon 2009). On May 4 Obama announced his administration’s intention to end the tax deferral beginning in 2011. As he put it: “It’s a tax code that says you should pay lower taxes if you create a job in Bangalore, India, than if you create one in Buffalo, N.Y.” (quoted in Ohlemacher 2009). The proposed tax change evoked a strong negative reaction from corporate executives (King and Williamson 2009; McKinnon and Drucker 2009; Mintz and Sasseen 2009). Among them was Microsoft CEO Steve Ballmer who was quoted in an interview as saying that, if the Obama administration succeeded in ending the corporate overseas income tax deferral, it would make “US jobs more expensive”, and that Microsoft would be “better off taking lots of people and moving them out of the US” (Hassett 2009). After a contingent of Silicon Valley executives visited Washington in September 2009, the Obama administration reportedly decided that it would be best to set aside for the time being its plans to rescind the overseas tax deferral law (King and Williamson 2009). Nevertheless, the issue has not quite gone away. In his State of the Union address of January 27, 2010 President Obama declared that “it is time to finally slash the tax breaks for companies that ship our jobs overseas and give those tax breaks to companies that create jobs right here in the United States of America” (The White House 2010). 4. Financialization Business corporations dominate the US economy. In 2008 the top 1000 US-based companies by revenues had combined sales of $12.1 trillion and employed 30.9 billion people worldwide. The ways in which the executives who control these corporations choose to allocate corporate resources have a profound impact on innovation, employment, income distribution and growth in the United States. What matters is not simply or even primarily the extent to which they invest and reinvest in the tangible assets that show up on the corporation’s balance sheet. Especially in a “knowledge economy”, more fundamental to economic performance are the decisions to allocate resources to investments in organizations – or intangible assets – that can engage in collective and cumulative learning and then ensure that the high fixed costs of these developmental investments are transformed into low unit costs by accessing a large extent of the market.
23
Lazonick: Marketization, Globalization, Financialization
Investments in innovation are inherently uncertain; if one knew how to innovate at the time when one commits resources to an investment strategy, then it would not be innovation. Any business executive who allocates resources to an innovative investment strategy faces three types of uncertainty: technological, market, and competitive. Technological uncertainty exists because the firm may be incapable of developing the higher-quality processes and products envisaged in its innovative investment strategy. Market uncertainty exists because, even if the firm succeeds in its development effort, future reductions in product prices and increases in factor prices may lower the returns that can be generated by the investments. Finally, even if a firm overcomes technological and market uncertainty, it still faces competitive uncertainty: the possibility that an innovative competitor will have invested in a strategy that generates an even higher-quality, lower-cost product that enables it to win market share. Given uncertainty, the decision to pursue an innovative investment strategy inherently depends on the judgments of those who exercise strategic control about the corporation’s organizational capability to confront and overcome the technological, market, and competitive challenges that lie ahead. A strategic decision-maker must have the ability to make these judgments; he or she must have an intimate understanding of the capabilities of the corporation, given the technological, market, and competitive conditions that it faces. A strategic decision-maker must have the incentive to invest in innovation; his or her personal interests must depend on achieving value creation through innovative enterprise rather than value extraction through personal remuneration. From this perspective, the financialized corporation is one in which the abilities and incentives of business executives who exercise allocative control lead them to view the corporation as a financial asset from which value can be extracted rather than as a productive asset through which value can be created. The neoclassical economic rule that a business executive should seek to “maximize profit” is tantamount to treating the business enterprise as a financial asset rather than a productive asset (see Lazonick 1991, 2010a). In practice, the use of financial tools that see business investment as a profit maximization problem will have the same result (see e.g., Baldwin and Clark 1992; Christensen et al. 2008). In the extreme, in the financialized corporation, executives may use profit maximization as a justification for extracting rents for themselves. Especially since the 1980s in the United States, that justification has been that executives should “maximize shareholder value” (MSV), an objective that in practice means that a company tries to achieve quarterly earnings per share targets on a consistent basis so that executives will not, as they say, “surprise Wall Street”. The expectation is that by meeting these targets their companies will be rewarded with a steadily increasing stock price. MSV gained currency in both business and academia in the early 1980s and, aided by “agency theory” that encouraged executives to disgorge the so-called “free cash flow”, became completely dominant as an ideology for corporate resource allocation by the 1990s (Lazonick and O’Sullivan 2000; Lazonick 2009b and 2010a). In the remainder of this section I will argue that MSV is a managerial ideology that has served to legitimize value extraction by top executives rather than value creation by the corporations over which they exercise
24
Lazonick: Marketization, Globalization, Financialization
allocative control. Indeed, I will argue that through the instrument of stock buybacks, it has become an ideology that may also legitimize value destruction, thereby contributing to not only inequity but also instability in the US economy. In the 1970s inflation was eroding the savings that Americans had accumulated in the post-World War II decades. Wall Street responded by reshaping US financial institutions to support the search for higher yields on savings through the trading of financial securities rather than investment in productive assets. The emergence of the National Association of Security Dealers Automated Quotation system, or NASDAQ, in 1971, and its growth thereafter, provided portfolio investors with a national stock market that had much less stringent listing requirements and therefore was much more speculative than the New York Stock Exchange (NYSE). The Employment Retirement Income Security Act (ERISA) of 1974 encouraged defined-benefit pension funds to invest in the stock market, especially after the clarification of ERISA by the Department of Labor in July 1979 that assured fund managers that they could invest in risky financial assets without violating the “prudent man” rule. The addition of section 401(k) to the US tax code in 1978 led to the rapid and sustained growth of defined-contribution pensions, large portions of which were invested in the stock market (Lazonick 2009a, chs. 3 and 4). As shown in Table 3, during the 1980s and 1990s the US stock market boomed. The prime source of two-digit average annual real stock yields was price yield, which can only be captured by selling one’s stock, rather than dividend yield, which can only be captured by holding one’s stock.7 In the 1970s inflation wiped out both types of stock yields, while over the course of the 2000s price yields were on average negative. High stock-price yields reflect a combination of three distinct forces at work in the US corporate economy: 1) innovation, especially by newer technology companies, that, as a result of generating higher-quality, lower-cost products, boosted earnings per share; and 2) speculation by stock market investors, encouraged, initially at least, by stock-price increases due to the combination of manipulation and innovation; and 3) manipulation of the distribution of income in favor of shareholders, especially by older corporations, through a combination of downsizing of the labor force and increased distributions to shareholders in the forms of cash dividends and stock repurchases. Manipulation occurs when those who exercise control over corporate resource allocation do so in a way that increases earnings per share despite the absence of innovation.
7 US corporations were not skimping on dividends in the 1980s and 1990s. It is simply that when a
company’s stock price increases, its dividend yield – the amount of dividends paid out as a percentage of the stock price – will fall unless the amount of dividends increases at least proportionately. In the 1980s dividends paid out by US corporations increased by an annual average of 10.8 percent while after-tax corporate profits increased by an annual average of 8.7 percent. In the 1990s these figures were 8.0 percent for dividends (including an absolute decline in dividends of 4.0 percent in 1999, the first decline since 1975) and 8.1 percent for profits. The dividend payout ratio – the amount of dividends as a proportion of after-tax corporate profits (with inventory evaluation and capital consumption adjustments) – was 48.9 percent in the 1980s and 55.0 percent in the 1990s compared with 39.5 percent in the 1960s and 41.6 percent in the 1970s. From 2000 to 2009 the dividend payout ratio was 61.5 percent, including a record 70.4 percent in 2007.
25
Lazonick: Marketization, Globalization, Financialization
Table 3: Average annual US corporate stock and bond yields (%), 1960-2009
1960-1969
1970-1979
1980-1989
1990-1999
2000-2009
Real stock yield 6.63 -1.66 11.67 15.01 -3.08 Price yield 5.80 1.35 12.91 15.54 -2.30 Dividend yield 3.19 4.08 4.32 2.47 1.79 Change in CPI 2.36 7.09 5.55 3.00 2.57 Real bond yield 2.65 1.14 5.79 4.72 3.41
Stock yields are for Standard and Poor's composite index of 500 US corporate stocks. Bond yields are for Moody's Aaa-rated US corporate bonds.
Sources: Updated from Lazonick and O'Sullivan 2000, 27, using US Congress 2010, Tables B-62, B-73, B-95, B-96.
Figure 1 charts the roles of innovation, speculation, and manipulation as primary drivers of US stock-price movements from the mid-1980s to the late 2000s. In the last half of the 1980s Old Economy companies that had run into trouble because of conglomeration in the United States and/or competition from the Japanese sought to manipulate stock prices through a “downsize-and-distribute” resource-allocation strategy (Lazonick 2004). The corporation sought to boost stock prices by downsizing the labor force and distributing corporate revenues to shareholders in the forms of dividends and stock repurchases. This redistribution of corporate revenues from labor incomes to capital incomes often occurred through debt-financed hostile takeovers, with post-takeover downsizing enabling the servicing and retirement of the massive debt that a company had taken on. In addition, from the mid-1980s, many Old Economy companies engaged for the first time in large-scale stock repurchases in an attempt to support their stock prices. While Old Economy companies were manipulating stock prices in the 1980s and early 1990s, New Economy companies such as Intel, AMD, Microsoft, Oracle, Solectron, EMC, Sun Microsystems, Cisco Systems, Dell, and Qualcomm were reinvesting virtually all of their incomes to finance the growth of their companies, neither paying dividends nor, once they had gone public, repurchasing stock (Lazonick 2009a, ch. 2). It was innovation by New Economy companies, most of them traded on NASDAQ, that culminated in the Internet revolution that provided a real foundation for the rising stock market in the 1980s and first half of the 1990s. In the late 1990s, however, the US stock market became highly speculative as the public discovered the existence of innovative New Economy firms, and then began making bets on many dot.com startups that had little in the way of innovative capability. The extent of the speculative bubble is displayed in Figure 1. The rise and fall of the NASDAQ Composite Index between 1998 and 2001 make the movements of the Dow Jones Industrial Average (DJIA), which at the time included Intel and Microsoft as the NASDAQ representatives among its 30 stocks, and the S&P 500 Index, the composition of which is over 80 percent NYSE and under 20 percent NASDAQ, look like mere blips. Between March 1998 and March 2000, the NASDAQ Composite Index of over 3,000 stocks rose by 149 percent compared with 21 percent for the DJIA and 36 percent for the S&P 500 (US Congress 2010, Table B-90).
26
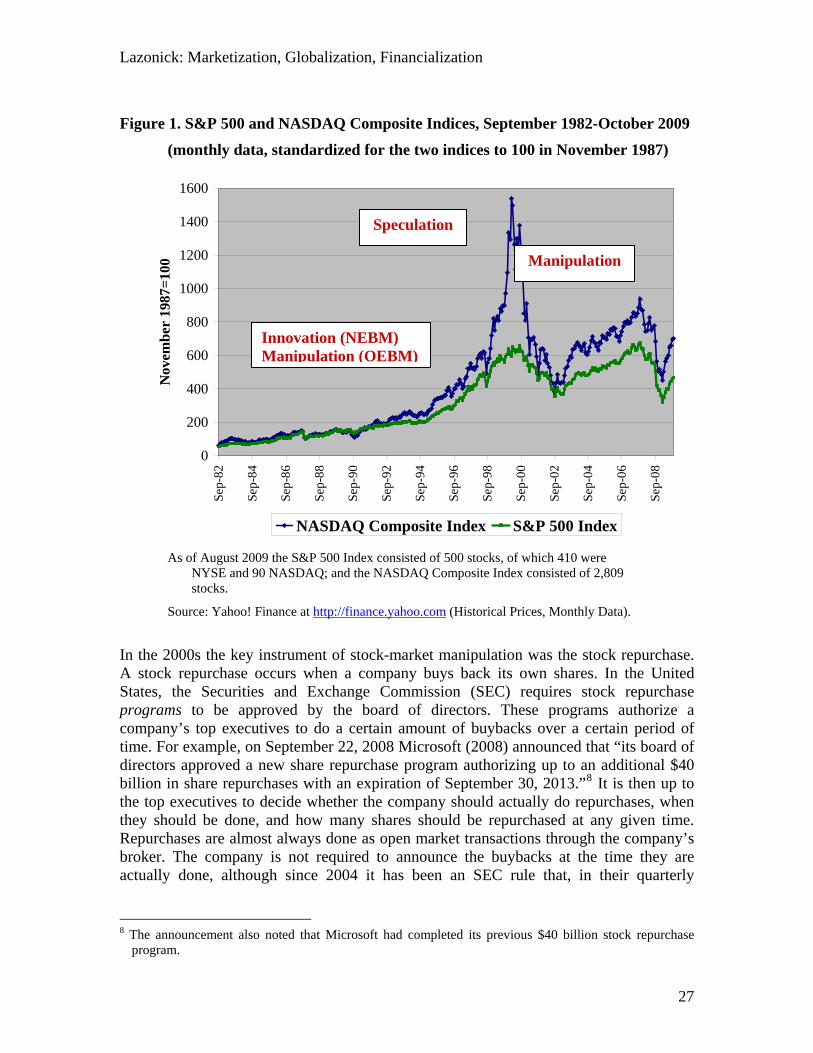
Lazonick: Marketization, Globalization, Financialization
Figure 1. S&P 500 and NASDAQ Composite Indices, September 1982-October 2009
(monthly data, standardized for the two indices to 100 in November 1987)
0
200
400
600
800
1000
1200
1400
1600
Sep-
82
Sep-
84
Sep-
86
Sep-
88
Sep-
90
Sep-
92
Sep-
94
Sep-
96
Sep-
98
Sep-
00
Sep-
02
Sep-
04
Sep-
06
Sep-
08
Nov
embe
r 19
87=1
00
NASDAQ Composite Index S&P 500 Index
Speculation
Manipulation
Innovation (NEBM) Manipulation (OEBM)
As of August 2009 the S&P 500 Index consisted of 500 stocks, of which 410 were NYSE and 90 NASDAQ; and the NASDAQ Composite Index consisted of 2,809 stocks.
Source: Yahoo! Finance at http://finance.yahoo.com (Historical Prices, Monthly Data).
In the 2000s the key instrument of stock-market manipulation was the stock repurchase. A stock repurchase occurs when a company buys back its own shares. In the United States, the Securities and Exchange Commission (SEC) requires stock repurchase programs to be approved by the board of directors. These programs authorize a company’s top executives to do a certain amount of buybacks over a certain period of time. For example, on September 22, 2008 Microsoft (2008) announced that “its board of directors approved a new share repurchase program authorizing up to an additional $40 billion in share repurchases with an expiration of September 30, 2013.”8 It is then up to the top executives to decide whether the company should actually do repurchases, when they should be done, and how many shares should be repurchased at any given time. Repurchases are almost always done as open market transactions through the company’s broker. The company is not required to announce the buybacks at the time they are actually done, although since 2004 it has been an SEC rule that, in their quarterly
8 The announcement also noted that Microsoft had completed its previous $40 billion stock repurchase
program.
27
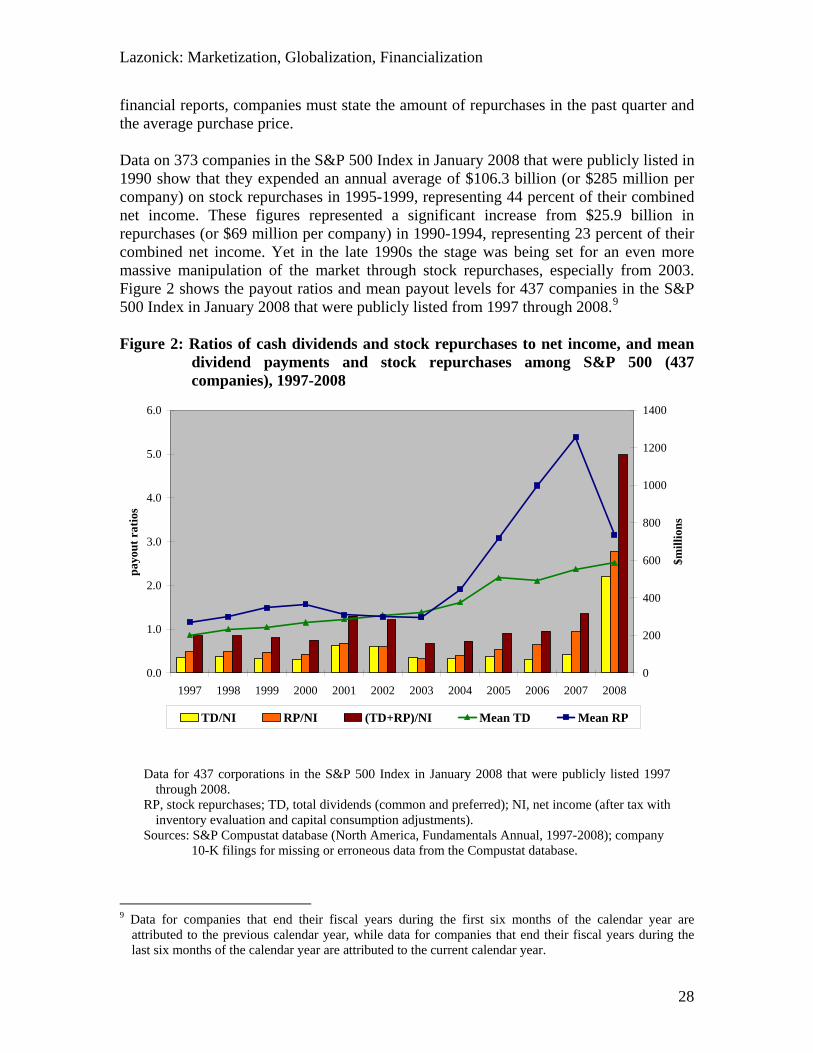
Lazonick: Marketization, Globalization, Financialization
financial reports, companies must state the amount of repurchases in the past quarter and the average purchase price. Data on 373 companies in the S&P 500 Index in January 2008 that were publicly listed in 1990 show that they expended an annual average of $106.3 billion (or $285 million per company) on stock repurchases in 1995-1999, representing 44 percent of their combined net income. These figures represented a significant increase from $25.9 billion in repurchases (or $69 million per company) in 1990-1994, representing 23 percent of their combined net income. Yet in the late 1990s the stage was being set for an even more massive manipulation of the market through stock repurchases, especially from 2003. Figure 2 shows the payout ratios and mean payout levels for 437 companies in the S&P 500 Index in January 2008 that were publicly listed from 1997 through 2008.9 Figure 2: Ratios of cash dividends and stock repurchases to net income, and mean
dividend payments and stock repurchases among S&P 500 (437 companies), 1997-2008
0.0
1.0
2.0
3.0
4.0
5.0
6.0
1997 1998 1999 2000 2001 2002 2003 2004 2005 2006 2007 2008
payo
ut r
atio
s
0
200
400
600
800
1000
1200
1400
$mill
ions
TD/NI RP/NI (TD+RP)/NI Mean TD Mean RP
Data for 437 corporations in the S&P 500 Index in January 2008 that were publicly listed 1997
through 2008. RP, stock repurchases; TD, total dividends (common and preferred); NI, net income (after tax with
inventory evaluation and capital consumption adjustments). Sources: S&P Compustat database (North America, Fundamentals Annual, 1997-2008); company
10-K filings for missing or erroneous data from the Compustat database.
9 Data for companies that end their fiscal years during the first six months of the calendar year are
attributed to the previous calendar year, while data for companies that end their fiscal years during the last six months of the calendar year are attributed to the current calendar year.
28
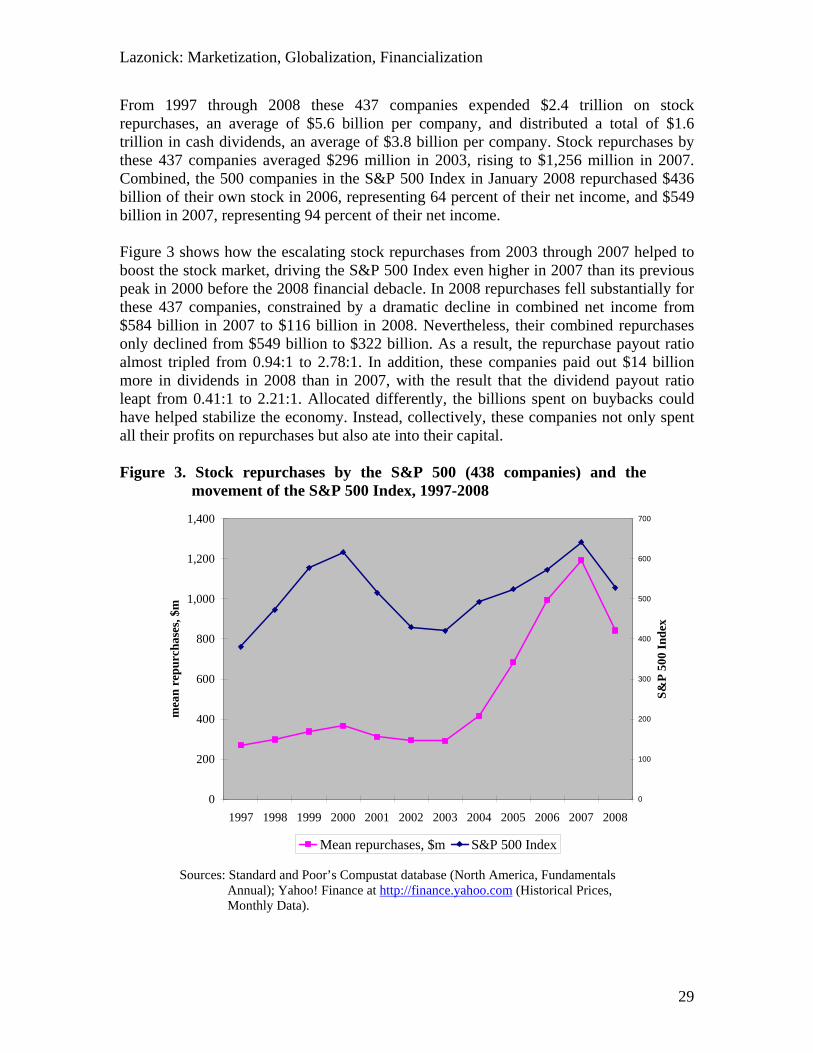
Lazonick: Marketization, Globalization, Financialization
From 1997 through 2008 these 437 companies expended $2.4 trillion on stock repurchases, an average of $5.6 billion per company, and distributed a total of $1.6 trillion in cash dividends, an average of $3.8 billion per company. Stock repurchases by these 437 companies averaged $296 million in 2003, rising to $1,256 million in 2007. Combined, the 500 companies in the S&P 500 Index in January 2008 repurchased $436 billion of their own stock in 2006, representing 64 percent of their net income, and $549 billion in 2007, representing 94 percent of their net income. Figure 3 shows how the escalating stock repurchases from 2003 through 2007 helped to boost the stock market, driving the S&P 500 Index even higher in 2007 than its previous peak in 2000 before the 2008 financial debacle. In 2008 repurchases fell substantially for these 437 companies, constrained by a dramatic decline in combined net income from $584 billion in 2007 to $116 billion in 2008. Nevertheless, their combined repurchases only declined from $549 billion to $322 billion. As a result, the repurchase payout ratio almost tripled from 0.94:1 to 2.78:1. In addition, these companies paid out $14 billion more in dividends in 2008 than in 2007, with the result that the dividend payout ratio leapt from 0.41:1 to 2.21:1. Allocated differently, the billions spent on buybacks could have helped stabilize the economy. Instead, collectively, these companies not only spent all their profits on repurchases but also ate into their capital. Figure 3. Stock repurchases by the S&P 500 (438 companies) and the
movement of the S&P 500 Index, 1997-2008
0
200
400
600
800
1,000
1,200
1,400
1997 1998 1999 2000 2001 2002 2003 2004 2005 2006 2007 2008
mea
n re
purc
hase
s, $m
0
100
200
300
400
500
600
700
S&P
500
Inde
x
Mean repurchases, $m S&P 500 Index Sources: Standard and Poor’s Compustat database (North America, Fundamentals
Annual); Yahoo! Finance at http://finance.yahoo.com (Historical Prices, Monthly Data).
29

Lazonick: Marketization, Globalization, Financialization
Why do corporations repurchase stock? Companies often state explicitly in their financial statements that they are doing stock repurchases to offset dilution from their stock-option programs, especially if, like many ICT companies, these programs are broad-based, extending to most of their employees. The economic rationale for this argument is not clear. If, from the shareholder-value perspective, a company deems it worthwhile to remunerate employees partially with stock options, it should see that remuneration as adding to rather than subtracting from earnings per share. True, these additions to earnings per share may be expected to accrue in years to come; but then the issue is simply one of whether remuneration in the form of stock options (or any other mode of compensation) is expected to yield positive net present value of future earnings at the appropriate discount rate. In any case, for many leading ICT companies, the number of shares repurchased over the period 2000-2008 was well in excess of the number of stock options exercised, and hence the number needed to offset dilution. For example, at IBM this ratio was 3.97:1, Texas Instruments 3.53:1, Intel 3.15:1, HP 3.02:1, Dell 2.30:1, Oracle 2.24:1, Cisco Systems 2.19:1, Motorola 1.69:1, Microsoft (which ended its stock option program in 2003) 1.92:1, and Sun Microsystems (which, constrained by losses, did not do repurchases from 2004 through 2006) 1.19:1. Executives often claim that buybacks are financial investments that signal confidence in the future of the company and its stock-price performance (Louis and White 2007; Vermaelen 2005, ch. 3). In fact, however, companies that do buybacks never sell the shares at higher prices to cash in on these investments. To do so would be to signal to the market that its stock price had peaked. According to the “signaling” argument, we should have seen massive sales of corporate stock in the speculative boom of the late 1990s, as was in fact the case of US industrial corporations in the speculative boom of the late 1920s when corporations took advantage of the speculative stock market to pay off corporate debt or bolster their corporate treasuries (O’Sullivan 2004). Instead, in the boom of the late 1990s corporate executives as personal investors sold their own stock to reap speculative gains (often to the tune of tens of millions). Yet, if anything, these same corporate executives as corporate decision-makers used corporate funds to repurchase their companies’ shares in the attempt to bolster their stock prices – to their own personal gain. The extent of that personal gain has been enormous. Since the 1970s there has been an explosion of executive pay (Crystal 1990; Lazonick 2010c). A prime cause of the growing inequity and instability in the US economic system is the stock-based compensation of the executives who run the nation’s leading industrial and financial corporations. In allocating corporate resources, top executives have a personal interest in maximizing their own stock-based pay. A prime way in which they have been able to do so is by allocating corporate resources to large-scale repurchases of the stock of the corporations for which they work and over which they exercise allocative control. The result has been not only the extraction of massive rents by these executives but also a misallocation of resources compared to the types of resource allocation that could generate innovation at the company level and contribute to equitable and stable growth in the economy as a whole.
30

Lazonick: Marketization, Globalization, Financialization
According to AFL-CIO Executive Paywatch (2009), the ratio of the average pay of CEOs of 200 large US corporations to the pay of the average full-time US worker was 42:1 in 1980, 107:1 in 1990, 525:1 in 2000, and 319:1 in 2008. As shown in Table 4, the average annual real compensation in 2008 dollars of the 100 highest paid corporate executives named in company proxy statements was $20.7 million in 1992-1995, $78.2 million in 1998-2001, and $62.0 million in 2004-2007. Table 4. Total compensation of top executives of US-based corporations, average
for 100, 500, 1500, and 3000 highest-paid executives, and the proportion of total compensation derived from gains from exercising stocks options
Mean compensation in millions of 2008 US dollars
Top 100 Top 500 Top 1500 Top 3000 S&P 500
Index
NAS-DAQ Index
NAS-DAQ/ S&P
Mean$m.
% SO
Mean$m.
% SO
Mean$m.
% SO
Mean $m.
% SO
1992 100 100 1.00 22.8 71 9.2 59 4.7 48 2.9 42 1993 109 119 1.10 21.0 63 9.0 51 4.7 42 3.1 36 1994 111 125 1.13 18.3 57 8.0 45 4.3 35 2.9 29 1995 131 155 1.18 20.6 59 9.6 48 5.2 40 3.4 34 1996 162 195 1.20 31.9 64 13.7 54 7.1 47 4.5 41 1997 210 243 1.16 43.5 72 18.3 61 9.3 55 5.8 49 1998 261 300 1.15 77.2 67 26.9 65 12.5 59 7.5 54 1999 319 462 1.45 69.0 82 27.5 71 13.2 63 7.9 57 2000 341 614 1.80 104.1 87 40.4 80 18.7 73 10.8 67 2001 284 332 1.17 62.3 77 23.7 66 11.3 58 6.8 53 2002 237 252 1.06 37.4 57 16.8 49 8.6 43 5.4 38 2003 232 275 1.18 48.4 64 21.0 55 10.7 48 6.7 43 2004 272 330 1.21 54.6 75 24.6 62 12.8 55 8.0 50 2005 290 348 1.20 66.5 78 28.2 63 14.3 56 8.9 51 2006 316 463 1.47 67.3 68 29.0 58 15.1 51 9.5 46 2007 354 428 1.21 59.6 69 27.4 58 14.6 50 9.3 45 2008 291 356 1.22 39.2 62 16.6 48 8.3 38 5.0 33
The S&P 500 Index and the NASDAQ Composite Index have each been set to 100 in 1992 for purposes of comparison.
Total compensation (TDC2 in the Compustat database) is defined as “Total compensation for the individual year comprised of the following: Salary, Bonus, Other Annual, Total Value of Restricted Stock Granted, Net Value of Stock Options Exercised, Long-Term Incentive Payouts, and All Other Total” (http://wrds-web.wharton.upenn.edu/wrds/ds/documentation/comp/legacy/tdc2.cfm).
%SO means the percent of total compensation that the whole set (100, 500, 1,500, or 3,000) of highest-paid executives derived from gains from exercising stock options.
Note that company proxy statements (DEF 14A SEC filings) report the compensation of the company’s CEO and four other highest paid executives. It is therefore possible that some of the highest-paid executives who should be included in each of the “top” categories are excluded. The mean compensation calculations are therefore lower bounds of actual average compensation of the highest paid corporate executives in the United States.
Sources: Standard and Poor’s Compustat database (Executive Compensation, Annual); Yahoo! Finance at http://finance.yahoo.com (Historical Prices, Monthly Data).
31
Lazonick: Marketization, Globalization, Financialization
As can be seen in Table 4, large proportions of these enormous incomes of top executives have come from gains from cashing in on the ample stock option awards that their boards of directors have bestowed on them.10 The higher the “top pay” group, the greater the proportion of the pay of that group that was derived from gains from exercising stock options. For the top 100 group in the years 1992-2008, this proportion ranged from a low of 57 percent in 1994, when the mean pay of the group was also at its lowest level in real terms, to 87 percent in 2000, when the mean pay was at its highest. In 2000 the mean pay of the top 3000 was, at $10.8 million, only 10 percent of the mean pay of the top 100. Nevertheless, gains from exercising stock options accounted for 67 percent of the total pay of the top 3000 group. Note in Table 4 how the average pay of the highest paid corporate executives has risen and fallen with the fluctuations of major stock market indices. In the 1980s and 1990s, as shown in Table 3, high real stock yields characterized the US corporate economy. These high yields came mainly from stock-price appreciation as distinct from dividend yields, which were low in the 1990s despite high dividend payout ratios. With the S&P 500 Index rising almost 1,400 percent from March 1982 to August 2000, the availability of gains from exercising stock options became almost automatic. As argued above, important contributors to the stock-market boom of the 1980s and 1990s were, first, innovation by New Economy companies such as Intel, Microsoft, and Cisco Systems, and then in the last half of the 1990s rampant speculation in their stocks. A characteristic feature of NEBM is the broad-based stock option program that extends to non-executive employees. As indicated earlier in this paper, in the Internet boom from the mid-1990s to 2000, the average gains per employee from exercising stock options could be multiples of their salaried compensation. The largest gains were made by the people at the top: the CEO and four other highest paid executives whose remuneration companies are compelled to “name” in their proxy statements to shareholders. In 2000, for example, the five “named” Microsoft executives averaged $50.7 million in gains from exercising stock options – a ratio of “top5” gains to average worker gains of 113:1, while at Cisco the “top5” averaged $51.3 million for a ratio of 176:1, and at Intel $32.1 for a ratio of 286:1. What makes it possible for US corporate executive to realize such outsized stock-option gains? There are a number of ways in which stock options as a mode of executive compensation can be abused. A company might reprice options that are underwater by cancelling an existing option and replacing it with a new option with a lower exercise price (Chance et al. 2000; Ellig 2007, 434-435). As a result, an executive may be able to
10 A stock option award gives an employee the non-transferable right to purchase a certain number of
shares of the company for which he or she works at a pre-set “exercise” price between the date the option “vests” and the date it “expires”. Typically in US option grants, the exercise price is the market price of the stock at the date that the option is granted; vesting of the option occurs in 25% installments at each of the first four anniversaries from the date of the grant; and the expiration date of the option is ten years from the date of the grant. Unvested options usually lapse 90 days after termination of employment with the company. If the market price of the stock is above the exercise price, an option is said to be “in the money”. If the market price of the stock is below the exercise price, the option is said to be “underwater”.
32

Lazonick: Marketization, Globalization, Financialization
reap gains from stock-option grants even when the company’s stock price declines. In 2006 a scandal broke out over the practice of backdating stock options – that is, granting option awards today as if they were granted at an earlier date when the market price of the stock and hence the exercise price of the options were lower (Lie 2005; Forelle and Bandler 2006; Bernile and Jarrell 2009). Abuses can also occur in the timing of the exercise of options. Given the fact that in the United States companies are not required to announce the dates on which they actually do open market repurchases, there is an opportunity for top executives who know when repurchase are being executed to engage in insider trading by using this information to time option exercises and stock sales (see Fried 2000 and 2001). The more fundamental problem with US-style stock options, however, lies in way they are structured rather than in the ways they are abused. US-style stock options virtually never carry any performance criteria that would prevent an executive from gaining from speculative and manipulative stock-price increases when exercising stock options (Bebchuk and Fried 2004). As a result, an executive, or any other employee with stock options, can gain from a speculative stock market as distinct from an improvement in the company’s productive performance. In addition, as I have argued, executives can augment their stock-option gains by allocating corporate resources to do buybacks, the sole purpose of which is to manipulate the company’s stock price. Some of the stock-based compensation of US executives is undoubtedly attributable to innovation, although even then there is the question of whether the stock-based compensation that these executives secure for themselves is equitable relative to other contributors to the innovation process. Be that as it may, since the last half of the 1990s it has been speculation and manipulation that have been the main drivers of the explosion in the pay of US corporate executives. In the United States, there has never been a legislative attempt to eliminate the possibility of speculative gains from exercising stock options.11 Historically, US legislation concerning the gains from exercising stock options has focused on the appropriate tax treatment for this income (see Lazonick 2010c). In 1945, with the personal tax rate on income over $200,000 at 94 percent and the capital gains tax rate at 25 percent, the Internal Revenue Service ruled that gains from the exercise of stock options had to be taxed as personal income. After intensive corporate lobbying however, the Revenue Act of 1950 ruled that the income from the exercise of restricted stock options was subject to capital gains treatment.12 In 1950 the capital gains tax rate was still 25 percent, while the
11 In the United Kingdom, the Cadbury (promulgated in 1992), Greenbury (1995), and Hampel (1998)
reports subjected the income that executives could reap from stock-based compensation to performance criteria that `reduced the gains from speculation and manipulation (Main 1999). See also Financial Reporting Council 2008, 23.
12 A restricted stock option was non-transferable, had an exercise price of at least 85% of the fair market value of the stock at the time it was granted, and could expire up to ten years from the date of the grant. To be eligible for capital gains treatment, the stock acquired through the exercise of the option could not be sold for at least two years from the option grant date and for at least six months from the exercise date. For a comprehensive documentation of changes in the tax laws relating to stock options, see Ellig 2007, ch. 8 and Appendix B.
33

Lazonick: Marketization, Globalization, Financialization
personal tax rate on income over $200,000 was 84.4 percent. From 1951 through 1964 this top personal tax rate stood at 91 percent (Citizens for Tax Justice 2004). The capital gains tax was levied on the difference between the exercise price and the market price of the acquired stock at the time the stock was actually sold. In contrast, when option gains were taxed at the personal income tax rate, the executive had to pay tax in the year that the option was exercised. An executive who held on to the acquired stock was then exposed to the risk that a subsequent decline in the stock price would reduce the gains on which taxes had already been paid. Originally, therefore, executive stock options were fundamentally a tax dodge. Stock option awards helped to focus a corporate executive on his company’s stock price. Like public stock market investors whose main interest was capital gains from selling shares rather than dividend yields from holding shares, stock options gave top executives a personal interest in capitalizing on speculative stock-price movements (Livingston 1958, ch. 16). With the gains on the exercise of stock options taxed as capital gains, executive stock options became very widespread among US corporations. They averaged 36 percent of the total compensation of top executives of 50 large US corporations over 1955-1963 (Lewellen 1968, 137). In the late 1950s and early 1960s, however, there was a public-opinion backlash against this enrichment of top managers (for an initial critique, see AFL-CIO 1959). In a 1960 Harvard Business Review article entitled “Are Stock Options Getting Out of Hand?”, Erwin Griswold, Dean of Harvard Law School, criticized the tax rules on stock options for favoring a special class of people who did not in any case make investments that justified capital gains. He argued that option grants focused the minds of executives more on the gamble of holding publicly traded stocks than on the requirements of managing large corporations. Griswold’s article provoked a vigorous debate that included academic articles in Harvard Business Review and elsewhere (Campbell 1961; Holland and Lewellen 1962; Lent and Menge 1962; Baker 1963); and whose non-academic participants included Henry Ford II, CEO of Ford Motor Company; Thomas Watson, Jr., CEO of IBM; Nelson Rockefeller, Governor of New York; and Albert Gore, US Senator from Tennessee. In 1961 Gore introduced a bill in Congress to rescind the tax privileges of executive stock options, arguing that the 1950 legislation permitted a “glaring loophole” in the tax law that had resulted in “flagrant abuses” (Washington Post 1961). In 1964 Congress revised the tax code pertaining to stock options. The “restricted” stock option of the 1950 Act became a “qualified” stock option; to qualify for capital gains treatment, the option had to be exercised within five rather than ten years, and, upon exercise, the acquired stock had to be held for three years rather than six months. Qualified options also had to be exercised in the order in which they were granted (Ellig 2006, 57). Each of these changes reduced the probability that the executive would realize benefits from stock options. Nevertheless, in a New York Times article, “How to be rich without paying taxes”, published in 1965, Gore continued his attack on executive stock options, noting that
34

Lazonick: Marketization, Globalization, Financialization
“Congress made some changes in the law last year, but its action fell far short of need” (Gore 1965, 29). Over the next decade, changes in relative tax rates served to erode the special tax privilege of the stock-option gains of corporate executives. Congress lowered the personal income tax rate on income over $200,000 to 70 percent in 1965, and progressively raised the capital gains tax rate to a high of 39.9 percent in 1976, thus vastly reducing, but not eliminating, the tax advantage of qualified stock options. The Tax Reform Act of 1969 included the introduction of the Alternative Minimum Tax that meant that some executives would have to pay higher effective tax rates on their stock-option income even when it was eligible for the capital gains tax rate. Then, under the Tax Reform Act of 1976, Congress eliminated the capital gains treatment of all future employee stock options grants. In 1978 Graef Crystal (1978, 145) – a compensation consultant who would later become a vocal critic of excessive executive pay (Crystal 1991) – stated that qualified stock options, “once the most popular of all executive compensation devices, . . . have been given the last rites by Congress.” In the Economic Recovery Act of 1981, however, Congress restored the qualified stock option that was subject to capital gains tax treatment, now called the “incentive stock option”. To qualify for this tax treatment, the stock option had to be awarded under a shareholder approved plan, have an exercise price of at least 100 percent of the market value of the stock at the date of the grant, expire no more than 10 years from the date of the grant, and, when exercised, the acquired stock had to be held for at least two years after the grant date and one year after the exercise date. In addition, Congress decreed that the value of the exercisable grant (that is, the number of shares in the grant times the exercise price) be no more than $100,000 in a given year (Ellig 2006, 58). While resuscitating the executive stock option with its capital gains tax benefit, therefore, the 1981 Act also limited their use by placing what was, from the perspective of top executives, a very low limit on the value of the annual awards that they could receive as incentive stock options. In the 1980s, however, the much lower tax rates characteristic of “Reaganomics” made both incentive and nonqualified stock options popular as modes of employee compensation. The 1981 Act lowered the highest bracket personal income tax rate to 50 percent on income over (initially in 1982) $85,600, and in 1988 it was lowered much further to 28 percent on income over $30,050. It now stands at 35 percent on incomes over $360,050.13 As a result, the vast majority of stock options grants that corporate executives receive are of the “non-qualified” (that is “non-incentive”) variety that are subject to the personal income tax rate and on which the tax must be paid at the time that the option is exercised.14
13 Meanwhile Congress lowered the capital gains tax rate to 20 percent in 1982, raised it to 28 percent in
1987, and lowered it again to 20 percent in 1997. The Job and Growth Tax Relief Reconciliation Act of 2003 (that is, the “Bush tax cuts”) further reduced the capital gains tax rate to 15 percent.
14 When an employee exercises a non-qualified stock option, the company withholds the estimated tax and receives a dollar-for-dollar tax credit known as the “stock-option income tax benefit”, which is typically
35

Lazonick: Marketization, Globalization, Financialization
Since the Reagan tax revolution of the 1980s, therefore, the popularity of executive stock options has had little to do with the tax treatment that they receive. In the process of focusing solely on the types of stock options that would be eligible for capital gains tax treatment, Congress failed to initiate, much less pass, any legislation that would limit the gains that executives could make on stock options more generally. While in the early 1980s US Congress was making executive stock options more attractive by lowering personal tax rates, the Securities and Exchange Commission, which regulates the stock market, was clearing the way for corporate executives to manipulate stock prices by allocating substantial corporate resources to stock repurchases. Under the Securities Exchange Act of 1934, stock repurchases could be construed as an attempt to manipulate a company’s stock price. In 1982, however, with the promulgation of Rule 10b-18, the SEC provided companies with a “safe harbor” that manipulation charges would not be filed if each day’s open-market repurchases were not greater than 25 percent of the stock’s average daily trading volume and if the company refrained from doing buybacks at the beginning and end of the trading day.15 According to a contemporary news report, Rule 10b-18 “made it easier for companies to buy back their shares on the open market without fear of stock-manipulation charges” (Hudson 1982). SEC Chairman John Shad was an advocate of the rule change, arguing that large-scale open market purchases would fuel an increase in stock prices that would be beneficial to shareholders. One of the SEC Commissioners, John Evans, argued that as a result of Rule 10-18b some manipulation would go unprosecuted, but then agreed to make the Commission’s vote for the rule change unanimous. In his 2008 book, Supercapitalism, Robert Reich (2008, 105-114), former Secretary of Labor in the Clinton administration, justifies the explosion in executive pay by arguing that intense competition makes it much more difficult than it used to be to find the talent who can manage a large corporation. Without going so far, others might argue that while this concentration of income at the top is highly inequitable, its impact on the performance of the US economy is neutral.16 The problem with these arguments is that they do not actually analyze the relation between the incentives inherent in different types of executive compensation – in this case, stock-based compensation, particularly in the form of stock-option grants – and the ways in which the executives who receive these incentives allocate corporate resources.
reported on the company’s cash-flow statement. In 2000, for example, at the peak of the Internet boom, Cisco Systems had a stock-option income tax benefit of $5.5 billion, more than offsetting its actual 2000 federal and state income tax liability of $4.7 billion (Pender 2000).
15 In 2003 the SEC amended Rule 10b-18 “to simplify and update the safe harbor provisions in light of market developments since the Rule’s adoption.” The amendments also required that in their 10-Q filings with the SEC companies report the number and value of share repurchased in the previous quarter and the average price paid per share. See http://www.sec.gov/rules/final/33-8335.htm.
16 For example, in their articles on the concentration of income at the top, Thomas Piketty and Emmanuel Saez (2004 and 2007) do not raise, let alone analyze, the impact of the distribution of income on the performance of the economy.
36
Lazonick: Marketization, Globalization, Financialization
My analyses of different industries (some of which I have studied in more depth than others) strongly suggest that the explosions in executive pay are coming at the expense of innovation and the upgrading of employment opportunities in the US economy. In what follows, I present some pertinent evidence from key sectors of the US economy.17 Among the biggest stock repurchasers in the years prior to the financial crisis were many of banks that were responsible for the meltdown and were bailed out under the Troubled Asset Relief Program. They included Citigroup ($41.8 billion repurchased in 2000-2007), Goldman Sachs ($30.1 billion), Wells Fargo ($23.2 billion), JP Morgan Chase ($21.2 billion), Merrill Lynch ($21.0 billion) Morgan Stanley ($19.1 billion), American Express ($17.6 billion), and US Bancorp ($12.3 billion). In the eight years before it went bankrupt in 2008, Lehman Brothers repurchased $16.8 billion, including $5.3 billion in 2006-2007. Washington Mutual, which also went bankrupt in 2008, expended $13.3 billion on buybacks in 2000-2007, including $6.5 billion in 2006-2007. Wachovia, ranked 38th among the Fortune 500 in 2007, did $15.7 billion in buybacks in 2000-2007, including $5.7 billion in 2006-2007, before its fire sale to Wells Fargo at the end of 2008. Other major financial services companies that did substantial repurchases in the 2000s before running into financial distress in 2008 were AIG ($10.2 billion), Fannie Mae ($8.4 billion), Bear Stearns ($7.2 billion), and Freddie Mac ($4.7 billion). By spending money on buybacks during boom years, these financial corporations reduced their ability to withstand the crash of the derivatives market in 2008, thus exacerbating the jeopardy that they created for the economy as a whole. There has been virtually no public policy debate in the United States over the practice of buybacks, its acceleration in recent years, or the implications for innovation, employment, income distribution, and economic growth. Exceptionally, in the summer of 2008 four Congressional Democrats – Rep. Rahm Emanuel (IL), Rep. Edward Markey (MA), Sen. Robert Menendez (NJ), and Sen. Charles Schumer (NY) – took aim at stock repurchases by the big oil companies, after Exxon Mobil, by far the largest repurchaser of stock ($144 billion in 2000-2008), had announced record second quarter profits of $11.7 billion, of which $8.8 billion went to stock buybacks (US Congress 2008; see also Hays and Ivanovich 2008). In a letter to oil industry executives, the Congressmen asked them to “pledge to greatly increase the ratio of investments in production and alternatives to the amount of stock buybacks this year and next by investing much more of your profits into exploration and production on the leases you have been awarded in the U.S., and in the research and development of promising alternative energy sources” (US Congress 2008). Exxon Mobil did not pay much attention to this plea; in the last half of 2008 it repurchased another $17.5 billion for a total of $35.7 billion, or 79 percent of its net income, on the year. In the first three-quarters of 2009 Exxon Mobil did another $17.3 billion in buybacks, equivalent to 131 percent of its net income. Among the top ten repurchasers of stock in 2000-2008 were five of the leading ICT companies: Microsoft (the #2 repurchaser with $94.3 billion in buybacks), IBM (#3, $72.9 billion), Cisco Systems (#5, $53.6 billion), Intel (#8, $48.8 billion), and Hewlett- 17 I am currently engaged in ongoing studies of the relation between executive pay and innovative
performance in these sectors.
37

Lazonick: Marketization, Globalization, Financialization
Packard (#10, $43.3 billion). All of these companies spent more on buybacks than they spent on R&D in 2000-2008. In the 2000s, as we have seen, all of these companies have been globalizing employment, and profiting through the creation of high-tech jobs in lower wage parts of the world such as China and India while using the profits of globalization to do stock buybacks at home (Milberg 2008; Lazonick 2009b). Meanwhile, US high-tech companies lobby the US government for more public investment in the US high-technology knowledge base, even as the companies allocate their own profits to huge stock buybacks. For example, in the 2000s Intel along with the Semiconductor Industry Association (SIA) pressured the US Congress to increase spending on the National Nanotechnology Initiative (NNI). At a press conference that the SIA organized in Washington DC in March 2005, Intel CEO Craig Barrett warned: “U.S. leadership in the nanoelectronics era is not guaranteed. It will take a massive, coordinated U.S. research effort involving academia, industry, and state and federal governments to ensure that America continues to be the world leader in information technology” (Electronic News 2005). Yet in 2005 the annual NNI budget was $1.2 billion, just 11 percent of the $10.6 billion that Intel spent on stock repurchases in that year alone. Indeed, Intel’s 2005 expenditures on stock buybacks exceeded the total of $10.1 billion that the US government spent on NNI since its inception in 2001 through 2009.18 Given the extent to which the ICT industry in general, and a company like Intel in particular, has benefited from decades of government investments in the high-tech knowledge base, one might ask whether a portion of the massive funds that Intel allocates to buying back its own stock could not be more productively allocated “to ensure that America continues to be the world leader in information technology.” Among the largest repurchasers of stock in the 2000s have been pharmaceutical companies. For 2000-2008 Pfizer was the #7 repurchaser with $50.6 billion in buybacks, Johnson & Johnson #12 with $33.3 billion, Amgen #24 with $22.6 billion, and Merck #31 with $18.7 billion. These and other US pharmaceutical companies charge higher drug prices in the United States than in other rich nations such as Japan, Canada, and France because, their executives argue, they need the higher earnings to fund their R&D efforts in the United States. Yet the very same companies do massive stock buybacks for the sole purpose of manipulating their stock prices. Meanwhile, the United States is the world leader in biopharmaceuticals in large part because of $31 billion per annum that the National Institutes of Health spend in support of the life sciences knowledge base, as well as numerous government subsidies to the pharmaceutical industry, including those under the Orphan Drug Act of 1983 (see Lazonick and Tulum 2009). Instead of doing stock buybacks, the pharmaceutical companies could be contributing to the national life sciences effort, or lowering their drug prices to make their products more affordable to the American public. Currently, the United States is in the midst of a major, and momentous, debate over health care reform, with the companies that provide health insurance in the forefront of opposition to progressive change, including the availability of a “public option” that 18 In 2008 the NNI budget was $1,554 million with an estimated budget for 2009 of $1,657 million, and a
proposed $1,640 million for 2010 (www.nano.gov/html/about/funding.html).
38

Lazonick: Marketization, Globalization, Financialization
would provide households with an alternative source of health insurance to that offered by the business corporations. Among the top 50 repurchasers for 2000-2008 were the two largest corporate health insurers: UnitedHealth Group at #23 with $23.7 billion in buybacks and Wellpoint at #39 with $14.9 billion. For each of these companies, repurchases represented 104 percent of net income for 2000-2008. Over this period, repurchases by the third largest insurer, Aetna, were $9.7 billion, or 137 percent of net income, and the fifth largest, Cigna, $9.8 billion, or 125 percent of net income. When these health insurance companies increase their profits by raising their rates and excluding coverage to high-risk people, they tend to use the extra income to do stock buybacks in an attempt to boost their stock prices. Meanwhile, as shown in Table 5, the top executives of these companies typically reap millions of dollars, and in some years tens of millions of dollars, in gains from exercising stock options (Lazonick 2010c). Table 5, which does not require much commentary, shows the average annual compensation for the five highest paid executives for the years 2000-2008 for the seven leading health insurers by revenues in 2008. Table 5. Average total compensation and percent of total from stock-option gains
for the five highest paid executives at the seven leading US health care insurers by revenues, 2000-2008
2008 revenues: UnitedHealth $81.2 billion; Wellpoint $61.3 billion; Aetna $31.0 billion; Humana $28.9
billion; Cigna $19.1 billion; Health Net $15.4 billion; Coventry Health Care $11.9 billion. Stock repurchases, 2000-2008: UnitedHealth $23.4 billion; Wellpoint $14.9 billion; Aetna $9.7 billion;
Humana $0.4 billion; Cigna $9.8 billion; Health Net $1.3 billion; Coventry Health Care $1.4 billion. Source: Standard and Poor’s Compustat Database, annual executive compensation
39

Lazonick: Marketization, Globalization, Financialization
A serious attempt at health care reform would seek to eliminate the profits of these health insurers, given that these profits are used solely to manipulate stock prices and enrich a small number of people at the top. Unfortunately, the need to control this type of financial behavior on the part of the nation’s largest health insurers has not yet entered the Washington debate. Nor, more generally, has the problem of the financialization of the US corporate economy, legitimized by the ideology of maximizing shareholder value and manifested by the allocation of corporate resources to stock buybacks and the ongoing explosion of executive pay. 5. Handle with Care The scope of the economic debate in and around the US Congress is solely about what the US government should or should not do to resuscitate a sick economy without an adequate diagnosis of why the economy is sick. The fundamental economic problem is not with the way in which the US government allocates resources but with the way in which US business, and in particular leading US-based corporations, allocate resources. The conservative opposition to government intervention is based on the theory of the market economy that posits that economic prosperity is best achieved when government refrains from trying to influence business decisions about how to allocate the economy’s resources. This perspective is the essence of neoclassical economic theory, an ideology of the US economy that most liberal American economists share (Lazonick 1991 and 2003). It is an ideology that dominates every graduate program at every elite economics department in the United States, and, not surprisingly, the view of the world of the professors of economics who spend time in Washington as advisors to US presidents, Democrats and Republicans alike. Liberal proponents of the free-market economy base their support for government intervention on the existence of “market failure”. What they lack is a theory of how, in combination, government and business investments in productive capabilities can result in “organizational success” (Lazonick 2010a and 2010b). Government investment in the economy remains critical for the quality of productive resources available to businesses to allocate. Indeed, the study of comparative industrial development shows that, especially in terms of investment in the “knowledge base”, the US government has been and, free-market ideology notwithstanding in many respects remains, the world’s leading developmental state (Lazonick 2008; Block 2009). US government investments in physical and human infrastructure go back to the mid-19th century when land was the federal government’s most abundant “currency”. Land grants financed not only the building of the railroads, and with them a continental nation state, but also the building of a public system of higher education relevant to the needs of industrial development (Ferleger and Lazonick 1993 and 1994). Government investment was critical for raising the productivity of the agricultural sector as the frontier disappeared and for preparing scientists and engineers for the science-based electrical and
40
Lazonick: Marketization, Globalization, Financialization
chemical industries that were at the core of the emergence of the United States as a world economic power in the first decades of the 20th century. Over the course of the last century, US government investment has continuously supported advances in knowledge in aviation, computers, and biotechnology, sectors that remain at the core of the US “knowledge economy”. The regular annual budget for life sciences research of the National Institutes of Health (NIH) was $30.6 billion in 2009, bringing total NIH funding in 2009 dollars to $696 billion since this government agency was founded in 1938. In 2009 the NIH budget was increased by another $10.4 billion as part of the American Recovery and Reinvestment Act. Over the 2000s, the NIH budget averaged $29.0 billion in 2009 dollars, which was in real terms 189 percent greater than the NIH budget in the 1980s and 84 percent greater than in the 1990s (NIH Office of the Budget 2010; see, more generally, Lazonick and Tulum 2009). Ultimately, however, it is the role of business enterprises (even if they may be state-owned) to transform the knowledge base into products that people want at prices that they can afford. To do so, business enterprises need to integrate their investment strategies with organizational learning, and they need to respond to innovative competition, increasingly on a global scale. What is at stake is not just the success of the particular enterprises, but the standard of living of the populations in the nations and regions in which those enterprises invest. The world of innovation and competition does not stand still. Business enterprises need to transform their “business models” to respond to new technological, market, and competitive challenges. The marketization and globalization of corporate resource allocation that characterized the transition from OEBM to NEBM reflected organizational responses to these challenges that enabled US corporations to remain competitive on a global scale. In most industries OEBM simply will not work in global competition, even when it can generate innovation on a national scale.19 It must be recognized, however, that in terms of equity, stability, and economic security in the United States, OEBM performed collective functions that, as a business model, NEBM is unable to perform. For the sake of sustainable prosperity, governments at the federal, state, and local levels have to assume these collective functions, including not only retirement security, health security, and housing security, but also employment security that ensures that the education and experience of older but able members of the labor force contribute to the wealth of the nation even when the nation’s business corporations deem it to be “inefficient” to continue to employ these productive resources.20
19 For the case of the Japanese wireless communications industry, see Kushida 2008. 20 For an initiative to address these issues in cross-national perspective, see the papers and policy briefs
from the Conference on Financial Institutions and Economic Security that I co-organized with Mariana Mazzucato in London in May 2009 (http://www.open.ac.uk/ikd/events/financial-institutions-and-economic-security/).
41

Lazonick: Marketization, Globalization, Financialization
As the government assumes these collective functions, the financialization of corporate resource allocation must be brought under control. Corporate stock repurchases should be banned as a mode of resource allocation that seeks to manipulate the market. If stock-based compensation is to be used, the gains from it should be dependent on corporate contributions to innovation; that is to real productivity gains. Instead of spending corporate resources on stock buybacks, the business corporation should allocate resources, either directly or through taxation, to support the further development and utilization of the human capital of the people who have helped the company generate innovation and profits but whom the company now chooses not to employ. It is inherent in the definition of a business enterprise that it must over the long run be profitable if it is going to survive. It is, however, innovation, not “maximizing shareholder value”, that paves the way for sustained profitability. Indeed, as John F. Welch, Jr., ex-CEO of General Electric – a man who according to his 2001 autobiography speaks “straight from the gut” (Welch 2001) – told a Financial Times reporter in March 2009: “On the face of it, shareholder value is the dumbest idea in the world. Shareholder value is a result, not a strategy…your main constituencies are your employees, your customers and your products.” Just in case the interviewer had missed the point, Welch went on to reiterate: “It is a dumb idea. The idea that shareholder value is a strategy is insane. It is the product of your combined efforts – from the management to the employees.” (Guerrera 2009) This “dumb idea” governs corporate resource allocation in the US economy. Micro actions have macro consequences – especially when the micro unit is a business corporation that employs tens of thousands, or even hundreds of thousands, of people. Entering the second decade of the 21st century, Americans find themselves in the midst of the third “jobless recovery” since the early 1990s. In the first jobless recovery after the recession of 1990-1991, healthy companies shed experienced workers, many of them salaried, as marketization became the corporate resource-allocation norm. In the second jobless recovery after the recession of 2001-2002 globalization joined marketization in hastening the disappearance of good US jobs. Now, in the third jobless recovery following the recession of 2008-2009, the financialization of corporate resource allocation exploits the vulnerabilities of a marketized and globalized labor force – while those who have savings left wait for the stock market to rebound.
42
Lazonick: Marketization, Globalization, Financialization
References: Aaron, Lawrence, 2008, “Obama rocks Jersey City,” The Record, January 11. Abowd, John, John Haltiwanger, Julia Lane, Kevin L. McKinney, and Kristin Sandusky,
2007, “Technology and the Demand for Skill: An Analysis of Within and Between Firm Differences,” NBER Working Paper no. 13043, National Bureau of Economic Research.
AFL-CIO, 1959, The Stock Option Scandal, Industrial Union Department AFL-CIO. AFL-CIO, 2009, “Executive PayWatch,” at
http://www.aflcio.org/corporatewatch/paywatch/pay/index.cfm. Associated Press Newswires, 2009, “Intel sells $1.75 billion of 3.25 percent notes, plans
stock buyback,” Associated Press Newswires, July 22. Autor, David H., Lawrence F. Katz, and Melissa S. Kearney, 2008, “Trends in U.S. Wage
Inequality: Revising the Revisionists,” Review of Economics and Statistics, 90, 2: 300–325. Baker, John C., 1963, “Stock Options at the Crossroads,” Harvard Business Review, 41, 1: 22–
29, 164–166. Baldwin, Carliss, and Kim Clark, 1992, “Capabilities and Capital Investment: New
Perspectives on Capital Budgeting,” Journal of Applied Corporate Finance, 5, 2: 67-87. Bebchuk, Lucian, and Jesse Fried, 2004, Pay without Performance: The Unfulfilled
Promise of Executive Compensation, Harvard University Press. Bernile, Gennaro, and Gregg A. Jarrell, 2009, “The Impact of the Options Backdating
Scandal on Shareholders,” Journal of Accounting and Economics, 47, 1-2: 2-26. Block, Fred, 2009, “Swimming Against the Current: The Rise of a Hidden
Developmental State in the United States,” Politics & Society, 36, 2:169-206. Block, Fred, and Matthew R. Keller, 2009, “Where Do Innovations Come From?
Transformations in the US Economy, 1970-2006,” Socio-Economic Review, 7, 3: 459-483.
Borrus, Michael, and John Zysman, 1997, “Wintelism and the Changing Terms of Global Competition: Prototype of the Future?” BRIE Working Paper no. 96B, University of California, Berkeley.
Bulkeley, William M., 2009, “IBM to cut U.S. jobs, expand in India,” Wall Street Journal Online, March 26.
Burgelmann, Robert A., 1994, “Fading Memories: A Process Theory of Strategic Exit in Dynamic Environments,” Administrative Science Quarterly, 39, 1: 24-56.
Campbell, Erwin D., 1961, “Stock Options Should Be Valued,” Harvard Business Review, 39, 4: 52–58.
Cantwell, John, and Giovanna Vertova, 2004, “Historical Evolution of Technological Diversification,” Research Policy, 33, 3: 511-529.
Carbone, James, 2000, “Growth Means More Consolidation, More Services,” Purchasing, 129, 7: 48–55.
Carbone, James, 2002, “Design Moves into EMS Spotlight,” Purchasing, 131, 1: 36, 38, 40. Carbone, James, 2004, “Targeting Design,” Purchasing,133, 17: 30, 32, 34, 36. Chance, Don M., Raman Kumar, and Rebecca B. Todd, 2000, “The ‘Repricing’ of
Executive Stock Options,” Journal of Financial Economics, 57, 1: 129-154. Chandler, Jr., Alfred D., 2001, Inventing the Electronic Century: The Epic Story of the
Consumer Electronic and Computer Industries, Free Press.
43
Lazonick: Marketization, Globalization, Financialization
Chang, Y. S., 1971, “The Transfer of Technology: Economics of Offshore Assembly, The Case of the Semiconductor Industry,” UNITAR Research Report no. 11. Geneva: United Nations Institute for Training and Research.
Christensen, Clayton M, Stephen P. Kaufman, and Willy C. Shih, 2008, “Innovation Killers: How Financial Tools Destroy Your Capacity to Do New Things,” Harvard Business Review, 86, 1: 98-105.
Citizens for Tax Justice, 2004, “Top Federal Income Tax Rates on Regular Income and Capital Gains since 1916,” May, at http://www.ctj.org/pdf/regcg.pdf.
Condon, Stephanie, 2009, “Washington leaders meet with tech execs,” CNET News.com, March 25.
Crystal, Graef, 1978, Executive Compensation: Money, Motivation, and Imagination, American Management Association.
Crystal, Graef, 1991, In Search of Excess: The Overcompensation of American Executives, W. W. Norton.
Curran, Lawrence J., 1997, “An Expanding Universe (Growth of Electronics Contract Manufacturers),” Electronic Business Today, 23, August 1: 57–58.
Davis, Warren E., and Daryl G. Hatano, 1985, “The American Semiconductor Industry and the Ascendancy of East Asia,” California Management Review, 27, 1: 128–143.
Deffree, Suzanne, 2009, “Intel closes factories, slashes up to 6000 jobs,” Electronic News, January 26.
Dharmapala, Dhammika, C. Fritz Foley, and Kristin J, Forbes, 2010, “Watch What I Do, Not What I Say: The Unintended Consequences of the Homeland Investment Act,” MIT Sloan Research Paper No. 4641-09, February, available at http://papers.ssrn.com/sol3/papers.cfm?abstract_id=1337206.
Doran, James, 2009, “IBM set to axe thousands in move to cheap labour abroad,” The Observer, April 12.
Electronic News, 2005, “US could lose race for nanotech leadership, SIA panel says,” Electronic News, March 16.
Ellig, Bruce R., 2006, “The Evolution of Executive Pay in the United States,” Compensation & Benefits Review, January/February: 55-61.
Ellig, Bruce R., 2007, The Complete Guide to Executive Compensation, McGraw-Hill. Engardio, Pete, Aaron Bernstein, and Manjeet Kripalani, 2003, BusinessWeek, February
3. eWeek, 2009, “Microsoft announces round two of layoffs,” eWeek, May 5. Farber, Henry, 2008, “Job Loss and the Decline of Job Security in the United States,”
Princeton University Industrial Relations Section Working Paper no. 520, Princeton University, June 4; at http://www.irs.princeton.edu/pubs/pdfs/520revised.pdf.
Fairlie, Ronald, and Lori Kletzer, 1998, “Jobs Lost, Jobs Regained: An Analysis of Black/White Differences in Job Displacement in the 1980s,” Industrial Relations, 37, 4: 460–477,
Ferleger, Louis, and William Lazonick, 1993, “The Managerial Revolution and the Developmental State: The Case of U.S. Agriculture,” Business and Economic History, 22, 2: 67-98.
Ferleger, Louis, and William Lazonick, 1994, “Higher Education for an Innovative Economy: Land-Grant Colleges and the Managerial Revolution in America,” Business and Economic History, 23, 1: 116-128.
44
Lazonick: Marketization, Globalization, Financialization
Financial Reporting Council, 2008, “The Combined Code on Corporate Governance,” June 2008, available at http://www.frc.org.uk/documents/pagemanager/frc/Combined_Code_June_2008/Combined%20Code%20Web%20Optimized%20June%202008(2).pdf.
Flamm, Kenneth, 1985, “Internationalization in the Semiconductor Industry,” in Joseph Grunwald and Kenneth Flamm eds., The Global Factory: Foreign Assembly in International Trade, Brookings Institution: 38-136.
Forelle, Charles, and James Bandler, 2006, “The perfect payday: Some CEOs reap millions by landing stock options when they are most valuable; Luck – or something else?” Wall Street Journal, March 18.
Fortune, 2008, “Fortune 500 Largest U.S. Corporations,” Fortune 157, 9, at http://money.cnn.com/magazines/fortune/fortune500/2008/index.html.
Fried, Jesse M., 2000, “Insider Signaling and Insider Trading with Repurchase Tender Offers.” University of Chicago Law Review, 67, 2: 421–477.
Fried, Jesse M., 2001, “Open Market Repurchases: Signaling or Market Opportunism?” Theoretical Inquiries in Law, 2, 2: 1–30.
Giarratani, Frank, Gene Gruver, and Randall Jackson, 2007, “Clusters, Agglomeration, and Economic Development Potential: Empirical Evidence Based on the Advent of Slab Casting by U.S. Steel Minimills,” Economic Development Quarterly, 21, 2: 148-164.
Gore, Albert, 1965, “How to be rich without paying taxes,” New York Times, April 11. Graham, John R., Michelle Hanlon, and Terry Shevlin, 2008, “Barriers to Mobility: The
Lockout Effect of U.S. Taxation of Worldwide Corporate Profits,” December 15, available at http://papers.ssrn.com/sol3/papers.cfm?abstract_id=1316576.
Griswold, Erwin N, 1960, “Are Stock Options Getting Out of Hand?” Harvard Business Review, 38, 6: 49–55.
Groshen, Erica, and Simon Potter, 2003, “Has Structural Change Contributed to a Jobless Recovery?” Current Issues in Economics and Finance, 9, 8: 1–7.
Grove, Andrew S., 1996, Only the Paranoid Survive: How to Exploit the Crisis Points that Challenge Every Company, Doubleday Business.
Guerrera, Francesco, 2009, “Welch rues short-term profit ‘obsession’,” Financial Times, March 12.
Hassett, Kevin A., 2009, “Obama's corporate takeover plan,” Financial Post, June 9. Hays, Kristen, and David Ivanovich, 2008, “Politicians fume as Exxon profits,” Houston
Chronicle, August 1. Heim, Kristi, 2004, “U.S. high-tech giants invest in future competitor,” San Jose Mercury
News, March 15. Henderson, Jeffrey, 1989, The Globalisation of High Technology Production: Society, Space,
and Semiconductors in the Restructuring of the Modern World, Routledge. Hewlett-Packard, 1984, Annual Report. Hira, Ron, 2010, “Bridge to Immigration Policy or Cheap Temporary Labor? The H-1B
and L1 Visa Programs are a Source of Both,” Economic Policy Institute Briefing Paper #257, February 17.
Holland, Daniel M., and Wilbur G. Lewellen, 1962, “Probing the Record of Stock Options,” Harvard Business Review, 40, 2: 132–150.
Holland, Max, 1989, When the Machine Stopped: A cautionary Tale from Industrial America, Harvard Business School Press.
45
Lazonick: Marketization, Globalization, Financialization
Hudson, Richard L., 1982, “SEC eases way for repurchase of firms’ stock: Agency assures it won’t file charges of manipulation if certain rules are met,” Wall Street Journal, November 10.
IBM, 2007, Annual Report. IBM, 2008, Annual Report. IBM, 2010, “Fourth-quarter and full-year earnings announcement” at
http://www.ibm.com/investor/4q09/press.phtml Jones, Geoffrey, 2006, Multinationals and Global Capitalism: From the Nineteenth to the
Twenty-First Century, Oxford University Press. Kalafsky, Ronald V., and Alan D. MacPherson, 2002, “The Competitive Characteristics of
the U.S. Machine Tool Industry,” Small Business Economics, 19, 4:355-369. King, Neil, Jr., and Elizabeth Williamson, 2009, “Business fends off tax hit: Obama
administration shelves plan to change how U.S. treats overseas profits,” Wall Street Journal, October 13.
Kletzer, Lori G., 1991, “Job Displacement, 1979–1986: How Blacks Fared Relative to Whites,” Monthly Labor Review, 114, 7: 17–25.
Kletzer, Lori, 1998, “Job Displacement,” Journal of Economic Perspectives, 12, 1: 115-136. Langlois, Richard N., 1992, “External Economies and Economic Progress: The Case of the Microcomputer Industry,” Business History Review, 66, 1: 1–50.
Kushida, Kenji, 2008, Leading Without Followers: Innovation, Competition, and the Political Economy of Japan’s Telecommunications Sector, revised version of a paper prepared for the Conference on Innovation and Competition in the Global Communications Technology Industry, Fontainebleau, France, August 2007,
Lazonick, William, 1990, Competitive Advantage on the Shop Floor, Harvard University Press.
Lazonick, William, 1991, Business Organization and the Myth of the Market Economy, Cambridge University Press.
Lazonick, William, 1998, “Organizational Learning and International Competition,” in Jonathan Michie and John Grieve Smith, eds., Globalization, Growth, and Governance, Oxford University Press: 204-238
Lazonick, William, 2003, “The Theory of the Market Economy and the Social Foundations of Innovative Enterprise,” Economic and Industrial Democracy, 24, 1: 9-44.
Lazonick, William, 2004, “Corporate Restructuring,” in Stephen Ackroyd, Rose Batt, Paul Thompson, and Pamela Tolbert, eds., The Oxford Handbook of Work and Organization, Oxford University Press: 577-601.
Lazonick, William, 2007, “Globalization of the ICT Labor Force,” in Robin Mansell, Chrisanthi Avgerou, Danny Quah, and Roger Silverstone, eds., The Oxford Handbook of Information and Communication Technologies, Oxford University Press: 75-99.
Lazonick, William, 2008, “Entrepreneurial Ventures and the Developmental State: Lessons from the Advanced Economies,” World Institute of Development Economics Research Discussion Paper dp2008-01, at http://www.wider.unu.edu/publications/working-papers/discussion-papers/2008/en_GB/dp2008-01/_files/78805634425684379/default/dp2008-01.pdf.
46

Lazonick: Marketization, Globalization, Financialization
Lazonick, William, 2009a, Sustainable Prosperity in the New Economy? Business Organization and High-Tech Employment in the United States, Upjohn Institute for Employment Research.
Lazonick, William, 2009b, “The New Economy Business Model and the Crisis of U.S. Capitalism,” Capitalism and Society, 4, 2.
Lazonick, William, 2010a, “Social Conditions of Innovative Enterprise,” Center for Industrial Competitiveness Working Paper, January.
Lazonick, William, 2010b, “The Chandlerian Corporation and the Theory of Innovative Enterprise,” Industrial and Corporate Change, 19, 1 (forthcoming).
Lazonick, William, 2010c, “The Explosion of Executive Pay and the Erosion of American Prosperity,” Entreprises et Histoire, 57 (forthcoming).
Lazonick, William, and Edward March, 2010, “The Rise and Demise of Lucent Technologies,” Center for Industrial Competitiveness Working Paper, February.
Lazonick, William, and Mary O’Sullivan, 2000, “Maximizing Shareholder Value: A New Ideology for Corporate Governance,” Economy and Society, 29, 1: 13-35.
Lazonick, William, and Öner Tulum, 2009, “US Biopharmaceutical Finance and the Sustainability of the Biotech Boom,” University of Massachusetts Lowell Center for Industrial Competitiveness, paper presented at the Sloan Industry Studies Conference, Chicago, May 29 (revised July).
Leachman, Robert C., and Chien H. Leachman, 2004, “Globalization of Semiconductors: Do Real Men Have Fabs, or Virtual Fabs?” in Martin Kenney with Richard Florida, eds., Locating Global Advantage: Industry Dynamics in the International Economy, Stanford University Press: 203–231.
Lent, George E., and John A. Menge, 1962, “The Importance of Restricted Stock Options in Executive Compensation,” Management Record, June: 6–13.
Lewellen, Wilbur, 1968, Executive Compensation in Large Industrial Corporations, Columbia University Press.
Lie, Erik, 2005, “On the Timing of CEO Stock Option Awards,” Management Science, 51, 5: 802–812.
Livingston, J. A., 1958, The American Stockholder, J. B. Lippincott. Lohr, Steve, 2009, “Quiet layoffs sting workers without notice,” New York Times,
March 6. Louis, Henock, and Hal White, 2007, “Do Managers Intentionally Use Repurchase
Tender Offers to Signal Private Information? Evidence from Firm Financial Reporting Behavior,” Journal of Financial Economics, 85, 1: 205-233.
Luttrell, Martin, 2009, “3Com to be sold to Hewlett-Packard,” Worcester Telegram & Gazette, November 12.
Maddison, Angus, 2010, “Statistics on World Population, GDP, and Per Capita GDP, 1-2006 AD,” at http://www.ggdc.net/maddison/
Main, Brian G. M., 1999, “The Rise and Fall of Executive Share Options in Britain,” in Jennifer Carpenter and David Yermack, eds., Executive Compensation and Shareholder Value, Kluwer Academic Publishers.
McDougall, Paul, 2009, “IBM offers to move laid off workers to India,” Information Week, February 2.
47
Lazonick: Marketization, Globalization, Financialization
McKinnon, John D., and Jesse Drucker, 2009, “Firms face new tax curbs: Obama plan aims to limit use of offshore havens by multinationals and the wealthy,” Wall Street Journal, May 4.
Menon, Ravi, 2009, “HP pay cuts not to affect ex-EDS employees,” Business Standard, March 2.
Microsoft, 2008, “Microsoft announces share repurchase program and increases quarterly dividend,” at http://www.microsoft.com/presspass/press/2008/sep08/09-22dividend.mspx.
Milberg, William, 2008, “Shifting Sources and Uses of Profits: Sustaining U.S. Financialization with Global Value Chains,” Economy and Society, 37, 3: 420-451.
Mint 2009, “Business is not handed out to MphasiS on a platter,” Mint, December 9. Mintz, Phil, and Jane Sasseen, 2009, “Changing corporate tax rules: A tough road ahead,”
BusinessWeek.com, May 5. Moxon, Richard, 1974, “Offshore Production in the Less Developed Countries: A Case Study
of Multinationality in the Electronics Industry,” Institute of Finance Bulletin nos. 98–99, New York University.
NIH Office of the Budget, 2010, “Current Year” and “History”, at http://officeofbudget.od.nih.gov/.
Norris, Floyd, 2009, “Tax breaks for profits went awry,” New York Times, June 5. Nussbaum, Bruce, 1986, “The end of corporate loyalty?” BusinessWeek, August 4. Ohlemacher, Stephen, 2009, “Obama targets US firms’ overseas tax loopholes,”
Associated Press Newswires, May 4. Okimoto, Daniel I., and Yoshio Nishi, 1994, “R&D Organization in Japanese and
American Semiconductor Firms,” in Masahiko Aoki and Ronald Dore, eds., The Japanese Firm: The Sources of Competitive Strength, Oxford University Press: 178-208.
O’Sullivan, Mary, 2004, “What Drove the U.S. Stock Market in the Last Century?” INSEAD Working Paper, Fontainebleau, France.
Packard, David, 1995, The HP Way: How Bill Hewlett and I Built Our Company, HarperBusiness: New York.
Parameswaran, P., 2010, “China seen flexing financial muscle amid US tensions,” Agence France Presse, February 17.
Pender, Kathleen, 2000, “Giant Cisco didn’t pay any federal income tax: Businesses get break on employee stock options,” San Francisco Chronicle, October 9.
Piketty, Thomas, and Emmanuel Saez, 2004, “Income Inequality in the United States, 1913-2002,” in A. B. Atkinson and Thomas Piketty, eds., Top Incomes over the Twentieth Century: A Contrast between European and English-Speaking Countries, Oxford University Press.
Piketty, Thomas, and Emmanuel Saez, 2007, “The Evolution of Top Incomes: A Historical and International Perspective,” American Economic Review, 96, 2: 200-205.
Platzer, Michaela D., and Glennon J. Harrison, 2009, “The U.S. Auto Industry: National State Trends in Manufacturing Employment,” Congressional Record Service Report, 7-5700, August 3.
Pollack, Andrew, 1985, “The Daunting Power of IBM.” New York Times, January 20. PR Newswire, 2008, “Microsoft announces share repurchase program and increases
quarterly dividend,” PR Newswire, September 22. PR Newswire, 2009, “Microsoft announces debt offering,” PR Newswire, May 11.
48
Lazonick: Marketization, Globalization, Financialization
Reich, Robert B., 2008, Supercapitalism: The Transformation of Business, Democracy, and Everyday Life, Vintage Books.
Sasseen, Jane, and Keith Epstein, “A backlash against Obama’s budget,” BusinessWeek, March 16.
Schultze, Charles L., 1999, “Downsized & Out: Job Security and American Workers,” Brookings Review, 17, 4: 9-17.
Scott, A. J., 1987, “The Semiconductor Industry in South-East Asia: Organization, Location, and the International Division of Labour,” Regional Studies, 21, 2: 143–160.
Sharpe, Rochelle, 1993, “Losing ground: In latest recession, only blacks suffered net employment loss,” Wall Street Journal, September 14.
Singh, Shelley, 2010, “TCS, Infosys, Wipro give local flavour to foreign operations,” Economic Times, January 2.
SinoCast, 2010, “HP Chongqing plant to commence operation,” SinoCast Computers & Electronics Beat, January 13.
Sturgeon, Timothy J., 2002, “Modular Production Networks: A New American Model of Industrial Organization,” Industrial and Corporate Change,11, 3: 451–496
The White House, 2010, “Remarks by the President in the State of the Union Address,” Office of the Press Secretary, January 27, at http://www.whitehouse.gov/the-press-office/remarks-president-state-union-address.
Tripathi, Amit, 2009, “Accenture wants to learn Indian growth trick,” Daily News & Analysis, November 12.
Uchitelle, Louis, 2006, The Disposable American: Layoffs and Their Consequences, Vintage.
US Census Bureau, 2010, “Foreign Trade: Country and Product Trade Data,” at http://www.census.gov/foreign-trade/statistics/country/index.html.
US Congress, 2007, “Senators Durbin, Obama & Brown and Representative Schakowsky introduce legislation to reward “patriot” employers,” Congressional Documents and Publications, August 2.
US Congress, 2008, “Democrats tell big oil: Spend more on production and renewable energy, less on stock buybacks before making demands for new drilling leases,” US Congressional Documents and Publications, July 31.
US Congress, 2010, Economic Report of the President, US Government Printing Office. US Department of Homeland Security, 2002–2004, “Characteristics of Specialty
Occupation Workers (H-1B),” US Government Printing Office: Washington, DC, at http://www.uscis.gov/files/article/FY2002Charact.pdf,
http://www.uscis.gov/files/article/FY03H1BFnlCharRprt.pdf, http://www.uscis.gov/files/nativedocuments/H1B_FY04_Characteristics.pdf. US Department of State, 1997-2009, “Visa Statistics: Reports of the Visa Office.” U.S.
Department of State, Bureau of Consular Affairs, at http://travel.state.gov/visa/frvi/statistics/statistics_4582.html.
US Treasury Department, 2009, “Major Foreign Holders of Treasury Securities,” at http://www.ustreas.gov/tic/mfh.txt.
Vermaelen, Theo, 2005. Share Repurchases: Foundations and Trends in Finance, Now Publishers: Hanover, MA.
Wadhwa, Vivek, AnnaLee Saxenian, Richard Freeman, Gary Gereffi, and Alex Salkever. 2009, “America’s Loss is the World’s Gain: America’s New Immigrant Entrepreneurs,
49
Lazonick: Marketization, Globalization, Financialization
50
Part IV, Kauffman Foundation, March, at http://www.kauffman.org/uploadedFiles/americas_loss.pdf
WardsAuto.com, 2009, “U.S. Vehicle Sales Market Share by Company, 1961-2008,” at http://wardsauto.com/keydata/.
Washington Post, 1961, “Gore bill would end stock option plans,” Washington Post, April 15. Welch, Jack, with John A, Byrne, 2001, Jack; Straight from the Gut, Warner Books. Wilde, Matthew, 2007, “Obama, in Waterloo, calls for greater toy safety,” Waterloo-Cedar
Falls Courier, December 15. Zerega, Blaise, 1999, “Real Men Hire Fabs: Chip Companies are Cutting Costs by
Outsourcing,” Red Herring, March 1.