Marketing Research: Toothpaste Industry* - ijert.org · a directed campaign at Colgate to emphasis...
25
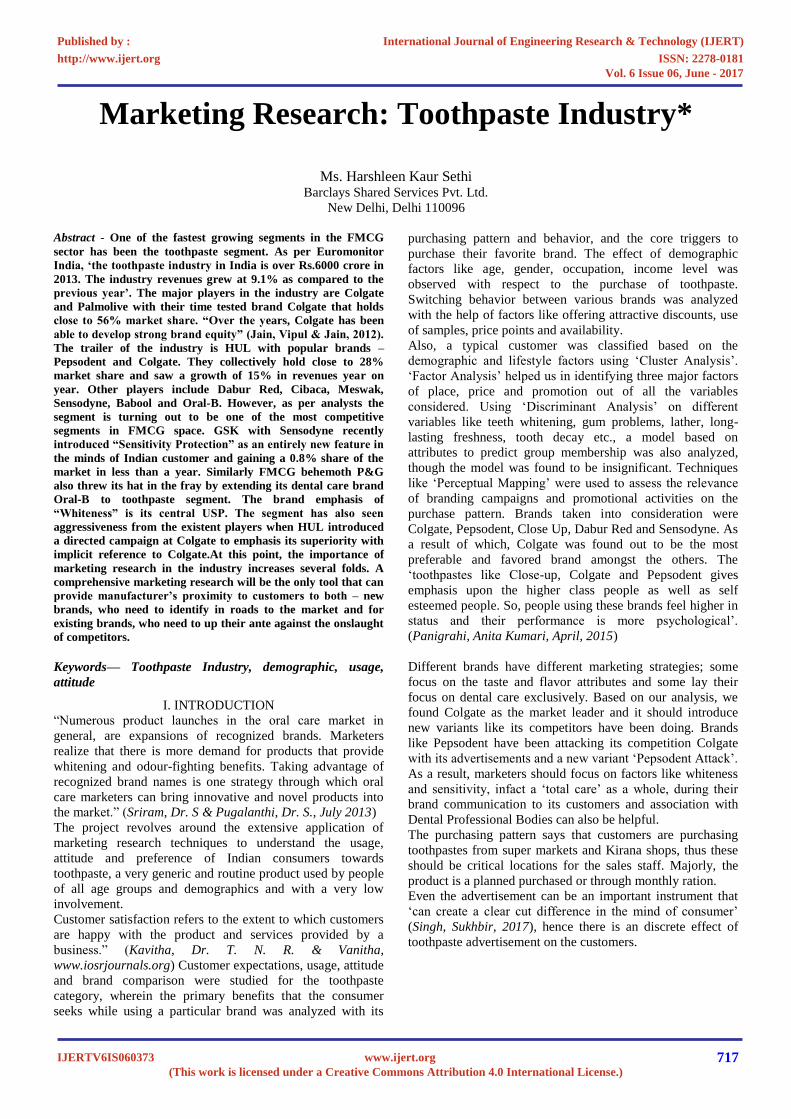
Marketing Research: Toothpaste Industry* Ms. Harshleen Kaur Sethi Barclays Shared Services Pvt. Ltd. New Delhi, Delhi 110096 Abstract - One of the fastest growing segments in the FMCG sector has been the toothpaste segment. As per Euromonitor India, ‘the toothpaste industry in India is over Rs.6000 crore in 2013. The industry revenues grew at 9.1% as compared to the previous year’. The major players in the industry are Colgate and Palmolive with their time tested brand Colgate that holds close to 56% market share. “Over the years, Colgate has been able to develop strong brand equity” (Jain, Vipul & Jain, 2012). The trailer of the industry is HUL with popular brands – Pepsodent and Colgate. They collectively hold close to 28% market share and saw a growth of 15% in revenues year on year. Other players include Dabur Red, Cibaca, Meswak, Sensodyne, Babool and Oral-B. However, as per analysts the segment is turning out to be one of the most competitive segments in FMCG space. GSK with Sensodyne recently introduced “Sensitivity Protection” as an entirely new feature in the minds of Indian customer and gaining a 0.8% share of the market in less than a year. Similarly FMCG behemoth P&G also threw its hat in the fray by extending its dental care brand Oral-B to toothpaste segment. The brand emphasis of “Whiteness” is its central USP. The segment has also seen aggressiveness from the existent players when HUL introduced a directed campaign at Colgate to emphasis its superiority with implicit reference to Colgate.At this point, the importance of marketing research in the industry increases several folds. A comprehensive marketing research will be the only tool that can provide manufacturer’s proximity to customers to both – new brands, who need to identify in roads to the market and for existing brands, who need to up their ante against the onslaught of competitors. Keywords— Toothpaste Industry, demographic, usage, attitude I. INTRODUCTION “Numerous product launches in the oral care market in general, are expansions of recognized brands. Marketers realize that there is more demand for products that provide whitening and odour-fighting benefits. Taking advantage of recognized brand names is one strategy through which oral care marketers can bring innovative and novel products into the market.” (Sriram, Dr. S & Pugalanthi, Dr. S., July 2013) The project revolves around the extensive application of marketing research techniques to understand the usage, attitude and preference of Indian consumers towards toothpaste, a very generic and routine product used by people of all age groups and demographics and with a very low involvement. Customer satisfaction refers to the extent to which customers are happy with the product and services provided by a business.” (Kavitha, Dr. T. N. R. & Vanitha, www.iosrjournals.org) Customer expectations, usage, attitude and brand comparison were studied for the toothpaste category, wherein the primary benefits that the consumer seeks while using a particular brand was analyzed with its purchasing pattern and behavior, and the core triggers to purchase their favorite brand. The effect of demographic factors like age, gender, occupation, income level was observed with respect to the purchase of toothpaste. Switching behavior between various brands was analyzed with the help of factors like offering attractive discounts, use of samples, price points and availability. Also, a typical customer was classified based on the demographic and lifestyle factors using ‘Cluster Analysis’. ‘Factor Analysis’ helped us in identifying three major factors of place, price and promotion out of all the variables considered. Using ‘Discriminant Analysis’ on different variables like teeth whitening, gum problems, lather, long- lasting freshness, tooth decay etc., a model based on attributes to predict group membership was also analyzed, though the model was found to be insignificant. Techniques like ‘Perceptual Mapping’ were used to assess the relevance of branding campaigns and promotional activities on the purchase pattern. Brands taken into consideration were Colgate, Pepsodent, Close Up, Dabur Red and Sensodyne. As a result of which, Colgate was found out to be the most preferable and favored brand amongst the others. The ‘toothpastes like Close-up, Colgate and Pepsodent gives emphasis upon the higher class people as well as self esteemed people. So, people using these brands feel higher in status and their performance is more psychological’. (Panigrahi, Anita Kumari, April, 2015) Different brands have different marketing strategies; some focus on the taste and flavor attributes and some lay their focus on dental care exclusively. Based on our analysis, we found Colgate as the market leader and it should introduce new variants like its competitors have been doing. Brands like Pepsodent have been attacking its competition Colgate with its advertisements and a new variant ‘Pepsodent Attack’. As a result, marketers should focus on factors like whiteness and sensitivity, infact a ‘total care’ as a whole, during their brand communication to its customers and association with Dental Professional Bodies can also be helpful. The purchasing pattern says that customers are purchasing toothpastes from super markets and Kirana shops, thus these should be critical locations for the sales staff. Majorly, the product is a planned purchased or through monthly ration. Even the advertisement can be an important instrument that ‘can create a clear cut difference in the mind of consumer’ (Singh, Sukhbir, 2017), hence there is an discrete effect of toothpaste advertisement on the customers. International Journal of Engineering Research & Technology (IJERT) ISSN: 2278-0181 http://www.ijert.org IJERTV6IS060373 (This work is licensed under a Creative Commons Attribution 4.0 International License.) Published by : www.ijert.org Vol. 6 Issue 06, June - 2017 717
Transcript of Marketing Research: Toothpaste Industry* - ijert.org · a directed campaign at Colgate to emphasis...
Marketing Research: Toothpaste Industry*
Ms. Harshleen Kaur Sethi
Barclays Shared Services Pvt. Ltd.
New Delhi, Delhi 110096
Abstract - One of the fastest growing segments in the FMCG
sector has been the toothpaste segment. As per Euromonitor
India, ‘the toothpaste industry in India is over Rs.6000 crore in
2013. The industry revenues grew at 9.1% as compared to the
previous year’. The major players in the industry are Colgate
and Palmolive with their time tested brand Colgate that holds
close to 56% market share. “Over the years, Colgate has been
able to develop strong brand equity” (Jain, Vipul & Jain, 2012).
The trailer of the industry is HUL with popular brands –
Pepsodent and Colgate. They collectively hold close to 28%
market share and saw a growth of 15% in revenues year on
year. Other players include Dabur Red, Cibaca, Meswak,
Sensodyne, Babool and Oral-B. However, as per analysts the
segment is turning out to be one of the most competitive
segments in FMCG space. GSK with Sensodyne recently
introduced “Sensitivity Protection” as an entirely new feature in
the minds of Indian customer and gaining a 0.8% share of the
market in less than a year. Similarly FMCG behemoth P&G
also threw its hat in the fray by extending its dental care brand
Oral-B to toothpaste segment. The brand emphasis of
“Whiteness” is its central USP. The segment has also seen
aggressiveness from the existent players when HUL introduced
a directed campaign at Colgate to emphasis its superiority with
implicit reference to Colgate.At this point, the importance of
marketing research in the industry increases several folds. A
comprehensive marketing research will be the only tool that can
provide manufacturer’s proximity to customers to both – new
brands, who need to identify in roads to the market and for
existing brands, who need to up their ante against the onslaught
of competitors.
Keywords— Toothpaste Industry, demographic, usage,
attitude
I. INTRODUCTION
“Numerous product launches in the oral care market in
general, are expansions of recognized brands. Marketers
realize that there is more demand for products that provide
whitening and odour-fighting benefits. Taking advantage of
recognized brand names is one strategy through which oral
care marketers can bring innovative and novel products into
the market.” (Sriram, Dr. S & Pugalanthi, Dr. S., July 2013)
The project revolves around the extensive application of
marketing research techniques to understand the usage,
attitude and preference of Indian consumers towards
toothpaste, a very generic and routine product used by people
of all age groups and demographics and with a very low
involvement.
Customer satisfaction refers to the extent to which customers
are happy with the product and services provided by a
business.” (Kavitha, Dr. T. N. R. & Vanitha,
www.iosrjournals.org) Customer expectations, usage, attitude
and brand comparison were studied for the toothpaste
category, wherein the primary benefits that the consumer
seeks while using a particular brand was analyzed with its
purchasing pattern and behavior, and the core triggers to
purchase their favorite brand. The effect of demographic
factors like age, gender, occupation, income level was
observed with respect to the purchase of toothpaste.
Switching behavior between various brands was analyzed
with the help of factors like offering attractive discounts, use
of samples, price points and availability.
Also, a typical customer was classified based on the
demographic and lifestyle factors using ‘Cluster Analysis’.
‘Factor Analysis’ helped us in identifying three major factors
of place, price and promotion out of all the variables
considered. Using ‘Discriminant Analysis’ on different
variables like teeth whitening, gum problems, lather, long-
lasting freshness, tooth decay etc., a model based on
attributes to predict group membership was also analyzed,
though the model was found to be insignificant. Techniques
like ‘Perceptual Mapping’ were used to assess the relevance
of branding campaigns and promotional activities on the
purchase pattern. Brands taken into consideration were
Colgate, Pepsodent, Close Up, Dabur Red and Sensodyne. As
a result of which, Colgate was found out to be the most
preferable and favored brand amongst the others. The
‘toothpastes like Close-up, Colgate and Pepsodent gives
emphasis upon the higher class people as well as self
esteemed people. So, people using these brands feel higher in
status and their performance is more psychological’.
(Panigrahi, Anita Kumari, April, 2015)
Different brands have different marketing strategies; some
focus on the taste and flavor attributes and some lay their
focus on dental care exclusively. Based on our analysis, we
found Colgate as the market leader and it should introduce
new variants like its competitors have been doing. Brands
like Pepsodent have been attacking its competition Colgate
with its advertisements and a new variant ‘Pepsodent Attack’.
As a result, marketers should focus on factors like whiteness
and sensitivity, infact a ‘total care’ as a whole, during their
brand communication to its customers and association with
Dental Professional Bodies can also be helpful.
The purchasing pattern says that customers are purchasing
toothpastes from super markets and Kirana shops, thus these
should be critical locations for the sales staff. Majorly, the
product is a planned purchased or through monthly ration.
Even the advertisement can be an important instrument that
‘can create a clear cut difference in the mind of consumer’
(Singh, Sukhbir, 2017), hence there is an discrete effect of
toothpaste advertisement on the customers.
International Journal of Engineering Research & Technology (IJERT)
ISSN: 2278-0181http://www.ijert.org
IJERTV6IS060373(This work is licensed under a Creative Commons Attribution 4.0 International License.)
Published by :
www.ijert.org
Vol. 6 Issue 06, June - 2017
717
II. OBJECTIVES
The objectives of this research paper are:
a) To understand the usage and preference of Indian
consumers towards ‘toothpaste’ category products.
b) Consumer Expectations
a. Primary benefits that a consumer associates
with a toothpaste
c) Usages and Attitude
a. Various usage patterns linked with
toothpaste
b. Purchase behavior connected with
toothpaste
c. Affect of demographic factors on the
purchase of toothpaste
d. Analyzing the switching behavior
e. Identifying the various parameters that
affect the purchase behavior
f. Classifying the customers based on
demographic and lifestyle parameters
g. Develop a model based on attributes to
predict group membership
d) Brand Awareness and Comparison
a. Feature specific association with brands
b. Effect of branding campaigns and
promotional schemes on usage patterns
III. RESEARCH METHODOLOGY
Due to a constraint on the cost and time aspects of the
research a convenience sampling approach was employed.
The survey was distributed to 83 respondents that were
spread across the varied demographic profile. The
questionnaire was coded on Qualtrics– a professional
marketing research platform and was distributed to
respondents primarily via email.
IV. OVERVIEW
DEMOGRAPHIC PROFILE
A. CONSUMER EXPECTATIONS
Primary benefits that a consumer associates with a
toothpaste
(One-Sample t-test)
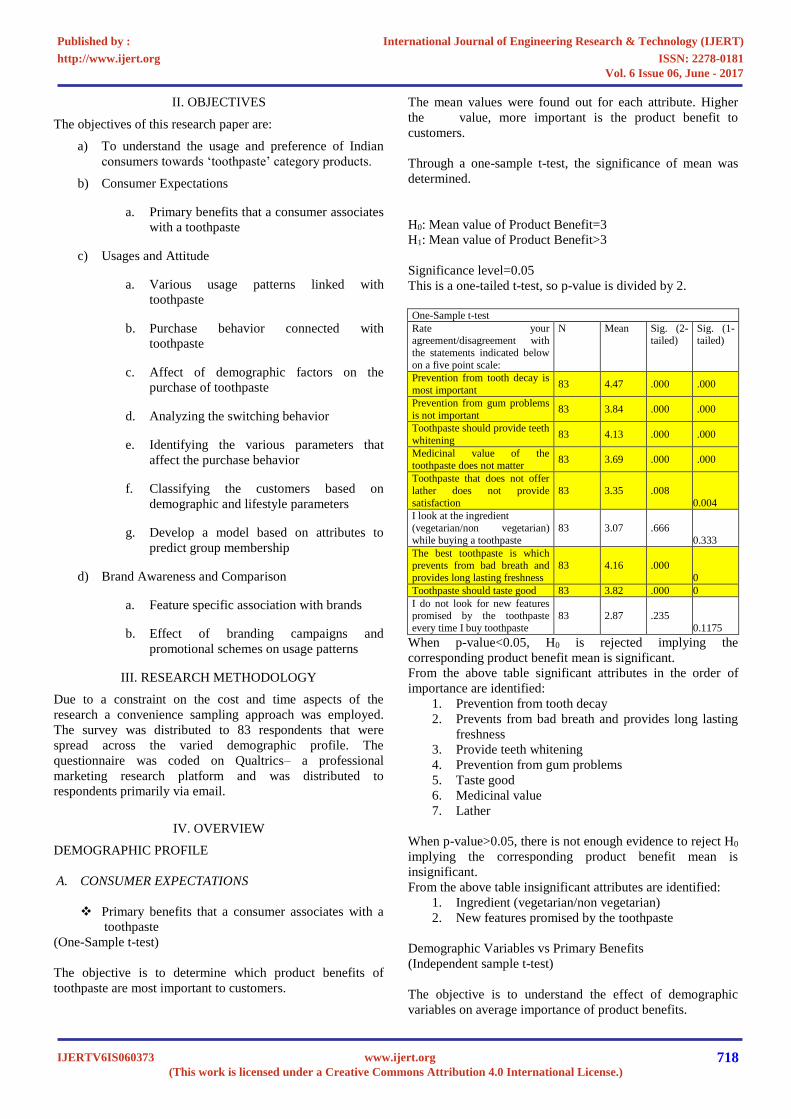
The objective is to determine which product benefits of
toothpaste are most important to customers.
The mean values were found out for each attribute. Higher
the value, more important is the product benefit to
customers.
Through a one-sample t-test, the significance of mean was
determined.
H0: Mean value of Product Benefit=3
H1: Mean value of Product Benefit>3
Significance level=0.05
This is a one-tailed t-test, so p-value is divided by 2.
One-Sample t-test
Rate your agreement/disagreement with
the statements indicated below
on a five point scale:
N Mean Sig. (2-tailed)
Sig. (1-tailed)
Prevention from tooth decay is
most important 83 4.47 .000 .000
Prevention from gum problems
is not important 83 3.84 .000 .000
Toothpaste should provide teeth
whitening 83 4.13 .000 .000
Medicinal value of the toothpaste does not matter
83 3.69 .000 .000
Toothpaste that does not offer
lather does not provide
satisfaction
83 3.35 .008
0.004
I look at the ingredient
(vegetarian/non vegetarian)
while buying a toothpaste
83 3.07 .666
0.333
The best toothpaste is which prevents from bad breath and
provides long lasting freshness
83 4.16 .000
0
Toothpaste should taste good 83 3.82 .000 0
I do not look for new features promised by the toothpaste
every time I buy toothpaste
83 2.87 .235
0.1175
When p-value<0.05, H0 is rejected implying the
corresponding product benefit mean is significant.
From the above table significant attributes in the order of
importance are identified:
1. Prevention from tooth decay
2. Prevents from bad breath and provides long lasting
freshness
3. Provide teeth whitening
4. Prevention from gum problems
5. Taste good
6. Medicinal value
7. Lather
When p-value>0.05, there is not enough evidence to reject H0
implying the corresponding product benefit mean is
insignificant.
From the above table insignificant attributes are identified:
1. Ingredient (vegetarian/non vegetarian)
2. New features promised by the toothpaste
Demographic Variables vs Primary Benefits
(Independent sample t-test)
The objective is to understand the effect of demographic
variables on average importance of product benefits.
International Journal of Engineering Research & Technology (IJERT)
ISSN: 2278-0181http://www.ijert.org
IJERTV6IS060373(This work is licensed under a Creative Commons Attribution 4.0 International License.)
Published by :
www.ijert.org
Vol. 6 Issue 06, June - 2017
718
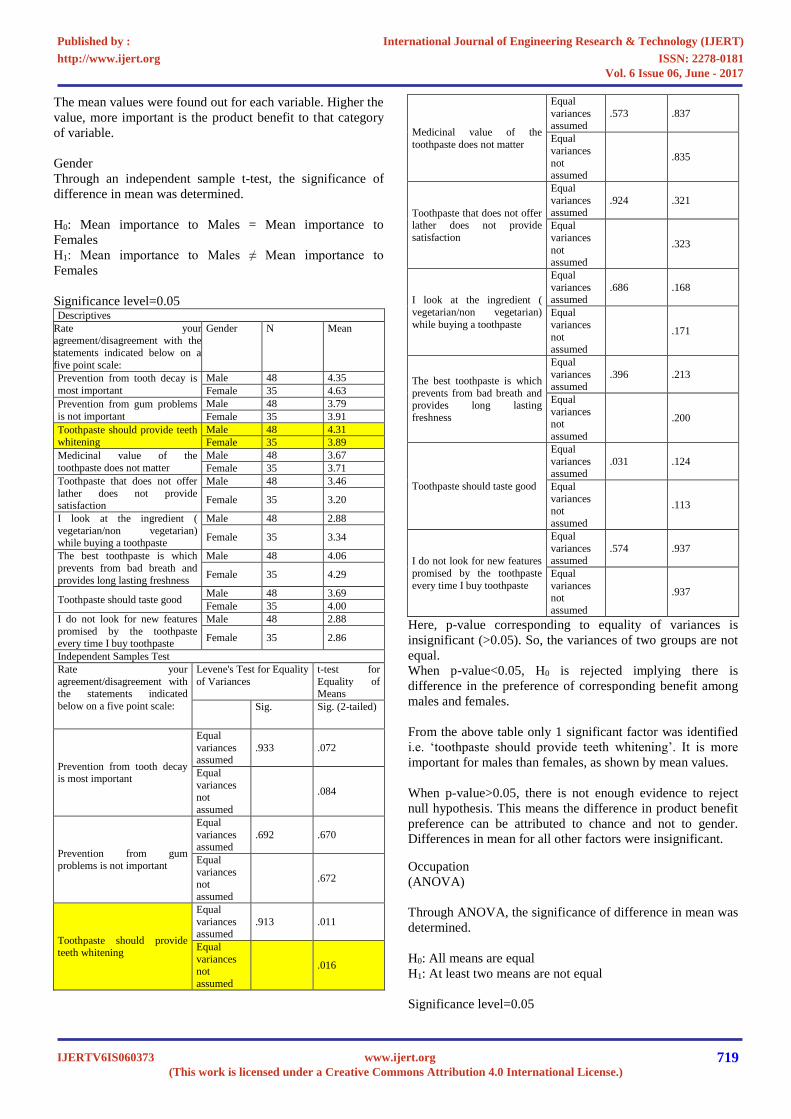
The mean values were found out for each variable. Higher the
value, more important is the product benefit to that category
of variable.
Gender
Through an independent sample t-test, the significance of
difference in mean was determined.
H0: Mean importance to Males = Mean importance to
Females
H1: Mean importance to Males ≠ Mean importance to
Females
Significance level=0.05 Descriptives
Rate your agreement/disagreement with the
statements indicated below on a
five point scale:
Gender N Mean
Prevention from tooth decay is
most important
Male 48 4.35
Female 35 4.63
Prevention from gum problems
is not important
Male 48 3.79
Female 35 3.91
Toothpaste should provide teeth whitening
Male 48 4.31
Female 35 3.89
Medicinal value of the
toothpaste does not matter
Male 48 3.67
Female 35 3.71
Toothpaste that does not offer
lather does not provide satisfaction
Male 48 3.46
Female 35 3.20
I look at the ingredient (
vegetarian/non vegetarian) while buying a toothpaste
Male 48 2.88
Female 35 3.34
The best toothpaste is which
prevents from bad breath and
provides long lasting freshness
Male 48 4.06
Female 35 4.29
Toothpaste should taste good Male 48 3.69
Female 35 4.00
I do not look for new features
promised by the toothpaste every time I buy toothpaste
Male 48 2.88
Female 35 2.86
Independent Samples Test
Rate your
agreement/disagreement with the statements indicated
below on a five point scale:
Levene's Test for Equality
of Variances
t-test for
Equality of Means
Sig. Sig. (2-tailed)
Prevention from tooth decay is most important
Equal
variances assumed
.933 .072
Equal
variances not
assumed
.084
Prevention from gum problems is not important
Equal
variances assumed
.692 .670
Equal
variances not
assumed
.672
Toothpaste should provide teeth whitening
Equal
variances assumed
.913 .011
Equal
variances not
assumed
.016
Medicinal value of the
toothpaste does not matter
Equal
variances assumed
.573 .837
Equal
variances
not assumed
.835
Toothpaste that does not offer lather does not provide
satisfaction
Equal
variances assumed
.924 .321
Equal
variances
not assumed
.323
I look at the ingredient (
vegetarian/non vegetarian)
while buying a toothpaste
Equal
variances assumed
.686 .168
Equal
variances
not assumed
.171
The best toothpaste is which
prevents from bad breath and provides long lasting
freshness
Equal
variances assumed
.396 .213
Equal
variances not
assumed
.200
Toothpaste should taste good
Equal
variances assumed
.031 .124
Equal
variances not
assumed
.113
I do not look for new features
promised by the toothpaste
every time I buy toothpaste
Equal
variances assumed
.574 .937
Equal
variances not
assumed
.937
Here, p-value corresponding to equality of variances is
insignificant (>0.05). So, the variances of two groups are not
equal.
When p-value<0.05, H0 is rejected implying there is
difference in the preference of corresponding benefit among
males and females.
From the above table only 1 significant factor was identified
i.e. ‘toothpaste should provide teeth whitening’. It is more
important for males than females, as shown by mean values.
When p-value>0.05, there is not enough evidence to reject
null hypothesis. This means the difference in product benefit
preference can be attributed to chance and not to gender.
Differences in mean for all other factors were insignificant.
Occupation
(ANOVA)
Through ANOVA, the significance of difference in mean was
determined.
H0: All means are equal
H1: At least two means are not equal
Significance level=0.05
International Journal of Engineering Research & Technology (IJERT)
ISSN: 2278-0181http://www.ijert.org
IJERTV6IS060373(This work is licensed under a Creative Commons Attribution 4.0 International License.)
Published by :
www.ijert.org
Vol. 6 Issue 06, June - 2017
719
ANOVA
Rate your
agreement/disagreement with the statements
indicated below on a five
point scale-
Sum of
Squares
df Mean
Square
F Sig.
Prevention from tooth
decay is most important
Between
Groups 1.118 4 .279 .580 .678
Within
Groups 37.557 78 .481
Total 38.675 82
Prevention
from gum problems is
not important
Between
Groups 22.927 4 5.732 3.990 .005
Within Groups
112.037 78 1.436
Total 134.964 82
Toothpaste
should provide teeth
whitening
Between
Groups 3.737 4 .934 1.663 .167
Within Groups
43.806 78 .562
Total 47.542 82
Medicinal
value of the
toothpaste does not
matter
Between
Groups 11.008 4 2.752 2.793 .032
Within
Groups 76.848 78 .985
Total 87.855 82
Toothpaste that does not
offer lather
does not
provide
satisfaction
Between Groups
2.802 4 .701 .506 .732
Within
Groups 108.065 78 1.385
Total 110.867 82
I look at the
ingredient ( vegetarian/non
vegetarian)
while buying a toothpaste
Between
Groups 53.226 4 13.307 7.613 .000
Within
Groups 136.340 78 1.748
Total 189.566 82
which
prevents from
bad breath and
Between Groups
4.457 4 1.114 1.792 .139
provides long
lasting freshness
Within
Groups 48.507 78 .622
Total 52.964 82
Toothpaste should taste
good
Between
Groups 2.174 4 .544 .641 .635
Within
Groups 66.115 78 .848
Total 68.289 82
I do not look for new
features
promised by the toothpaste
every time I
buy toothpaste
Between
Groups 2.520 4 .630 .606 .659
Within
Groups 81.023 78 1.039
Total 83.542 82
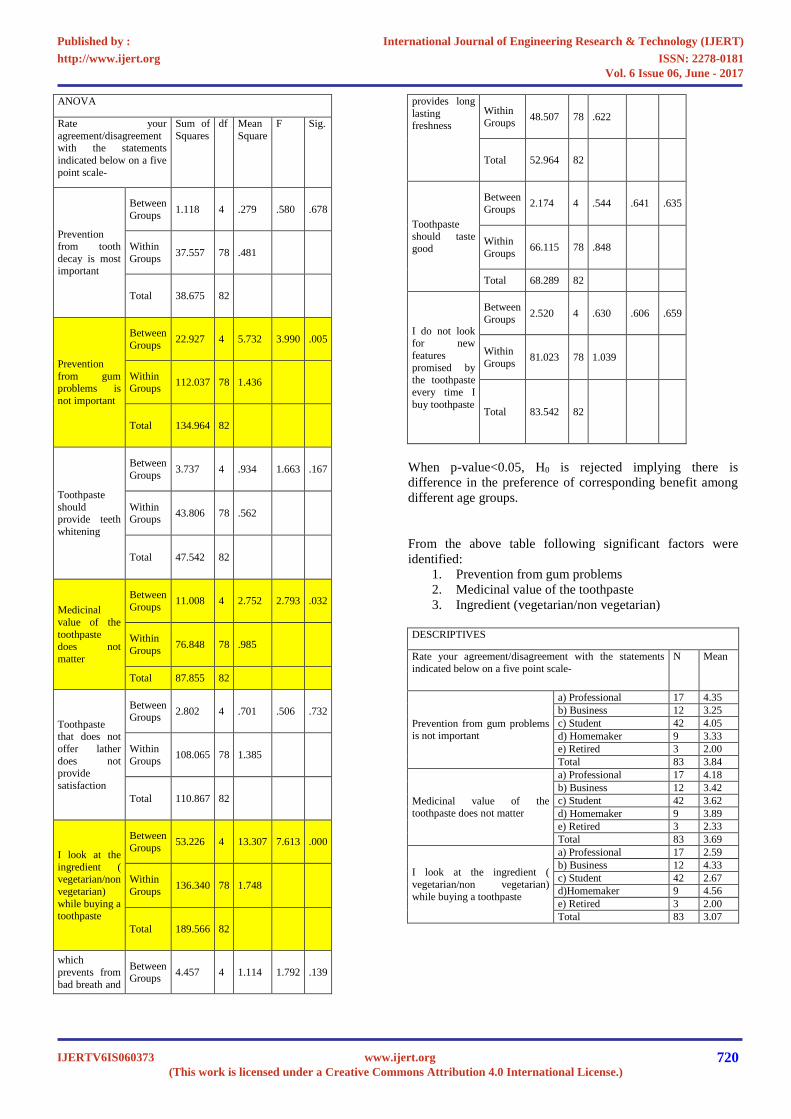
When p-value<0.05, H0 is rejected implying there is
difference in the preference of corresponding benefit among
different age groups.
From the above table following significant factors were
identified:
1. Prevention from gum problems
2. Medicinal value of the toothpaste
3. Ingredient (vegetarian/non vegetarian)
DESCRIPTIVES
Rate your agreement/disagreement with the statements
indicated below on a five point scale-
N Mean
Prevention from gum problems is not important
a) Professional 17 4.35
b) Business 12 3.25
c) Student 42 4.05
d) Homemaker 9 3.33
e) Retired 3 2.00
Total 83 3.84
Medicinal value of the toothpaste does not matter
a) Professional 17 4.18
b) Business 12 3.42
c) Student 42 3.62
d) Homemaker 9 3.89
e) Retired 3 2.33
Total 83 3.69
I look at the ingredient (
vegetarian/non vegetarian)
while buying a toothpaste
a) Professional 17 2.59
b) Business 12 4.33
c) Student 42 2.67
d)Homemaker 9 4.56
e) Retired 3 2.00
Total 83 3.07
International Journal of Engineering Research & Technology (IJERT)
ISSN: 2278-0181http://www.ijert.org
IJERTV6IS060373(This work is licensed under a Creative Commons Attribution 4.0 International License.)
Published by :
www.ijert.org
Vol. 6 Issue 06, June - 2017
720
It is most important for those respondents where mean>3 in
that occupation in decreasing order:
BENEFIT CATEGORY
Medicinal value of the
toothpaste
1. Professional
2. Homemaker
3. Student 4. Business
Ingredient (vegetarian/non
vegetarian)
1. Homemaker
2. Business
Prevention from gum problems 1. Professional 2. Student
3. Homemaker
4. Business
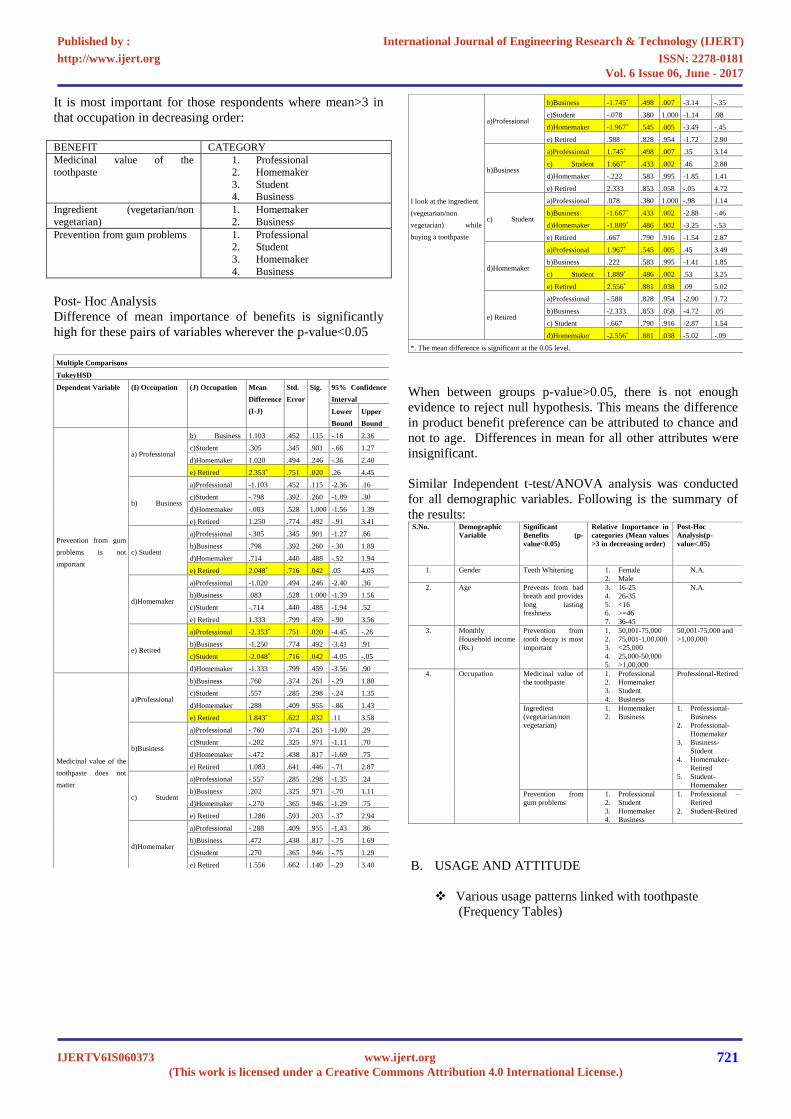
Post- Hoc Analysis
Difference of mean importance of benefits is significantly
high for these pairs of variables wherever the p-value<0.05
Multiple Comparisons
TukeyHSD
Dependent Variable (I) Occupation (J) Occupation Mean
Difference
(I-J)
Std.
Error
Sig. 95% Confidence
Interval
Lower
Bound
Upper
Bound
Prevention from gum
problems is not
important
a) Professional
b) Business 1.103 .452 .115 -.16 2.36
c)Student .305 .345 .901 -.66 1.27
d)Homemaker 1.020 .494 .246 -.36 2.40
e) Retired 2.353* .751 .020 .26 4.45
b) Business
a)Professional -1.103 .452 .115 -2.36 .16
c)Student -.798 .392 .260 -1.89 .30
d)Homemaker -.083 .528 1.000 -1.56 1.39
e) Retired 1.250 .774 .492 -.91 3.41
c) Student
a)Professional -.305 .345 .901 -1.27 .66
b)Business .798 .392 .260 -.30 1.89
d)Homemaker .714 .440 .488 -.52 1.94
e) Retired 2.048* .716 .042 .05 4.05
d)Homemaker
a)Professional -1.020 .494 .246 -2.40 .36
b)Business .083 .528 1.000 -1.39 1.56
c)Student -.714 .440 .488 -1.94 .52
e) Retired 1.333 .799 .459 -.90 3.56
e) Retired
a)Professional -2.353* .751 .020 -4.45 -.26
b)Business -1.250 .774 .492 -3.41 .91
c)Student -2.048* .716 .042 -4.05 -.05
d)Homemaker -1.333 .799 .459 -3.56 .90
Medicinal value of the
toothpaste does not
matter
a)Professional
b)Business .760 .374 .261 -.29 1.80
c)Student .557 .285 .298 -.24 1.35
d)Homemaker .288 .409 .955 -.86 1.43
e) Retired 1.843* .622 .032 .11 3.58
b)Business
a)Professional -.760 .374 .261 -1.80 .29
c)Student -.202 .325 .971 -1.11 .70
d)Homemaker -.472 .438 .817 -1.69 .75
e) Retired 1.083 .641 .446 -.71 2.87
c) Student
a)Professional -.557 .285 .298 -1.35 .24
b)Business .202 .325 .971 -.70 1.11
d)Homemaker -.270 .365 .946 -1.29 .75
e) Retired 1.286 .593 .203 -.37 2.94
d)Homemaker
a)Professional -.288 .409 .955 -1.43 .86
b)Business .472 .438 .817 -.75 1.69
c)Student .270 .365 .946 -.75 1.29
e) Retired 1.556 .662 .140 -.29 3.40
I look at the ingredient
(vegetarian/non
vegetarian) while
buying a toothpaste
a)Professional
b)Business -1.745* .498 .007 -3.14 -.35
c)Student -.078 .380 1.000 -1.14 .98
d)Homemaker -1.967* .545 .005 -3.49 -.45
e) Retired .588 .828 .954 -1.72 2.90
b)Business
a)Professional 1.745* .498 .007 .35 3.14
c) Student 1.667* .433 .002 .46 2.88
d)Homemaker -.222 .583 .995 -1.85 1.41
e) Retired 2.333 .853 .058 -.05 4.72
c) Student
a)Professional .078 .380 1.000 -.98 1.14
b)Business -1.667* .433 .002 -2.88 -.46
d)Homemaker -1.889* .486 .002 -3.25 -.53
e) Retired .667 .790 .916 -1.54 2.87
d)Homemaker
a)Professional 1.967* .545 .005 .45 3.49
b)Business .222 .583 .995 -1.41 1.85
c) Student 1.889* .486 .002 .53 3.25
e) Retired 2.556* .881 .038 .09 5.02
e) Retired
a)Professional -.588 .828 .954 -2.90 1.72
b)Business -2.333 .853 .058 -4.72 .05
c) Student -.667 .790 .916 -2.87 1.54
d)Homemaker -2.556* .881 .038 -5.02 -.09
*. The mean difference is significant at the 0.05 level.
When between groups p-value>0.05, there is not enough
evidence to reject null hypothesis. This means the difference
in product benefit preference can be attributed to chance and
not to age. Differences in mean for all other attributes were
insignificant.
Similar Independent t-test/ANOVA analysis was conducted
for all demographic variables. Following is the summary of
the results: S.No. Demographic
Variable
Significant
Benefits (p-
value<0.05)
Relative Importance in
categories (Mean values
>3 in decreasing order)
Post-Hoc
Analysis(p-
value<.05)
1. Gender Teeth Whitening 1. Female
2. Male
N.A.
2. Age Prevents from bad
breath and provides
long lasting
freshness
3. 16-25
4. 26-35
5. <16
6. >=46
7. 36-45
N.A.
3. Monthly
Household income
(Rs.)
Prevention from
tooth decay is most
important
1. 50,001-75,000
2. 75,001-1,00,000
3. <25,000
4. 25,000-50,000
5. >1,00,000
50,001-75,000 and
>1,00,000
4. Occupation Medicinal value of
the toothpaste
1. Professional
2. Homemaker
3. Student
4. Business
Professional-Retired
Ingredient
(vegetarian/non
vegetarian)
1. Homemaker
2. Business
1. Professional-
Business
2. Professional-
Homemaker
3. Business-
Student
4. Homemaker-
Retired
5. Student-
Homemaker
Prevention from
gum problems
1. Professional
2. Student
3. Homemaker
4. Business
1. Professional –
Retired
2. Student-Retired
B. USAGE AND ATTITUDE
Various usage patterns linked with toothpaste
(Frequency Tables)
International Journal of Engineering Research & Technology (IJERT)
ISSN: 2278-0181http://www.ijert.org
IJERTV6IS060373(This work is licensed under a Creative Commons Attribution 4.0 International License.)
Published by :
www.ijert.org
Vol. 6 Issue 06, June - 2017
721
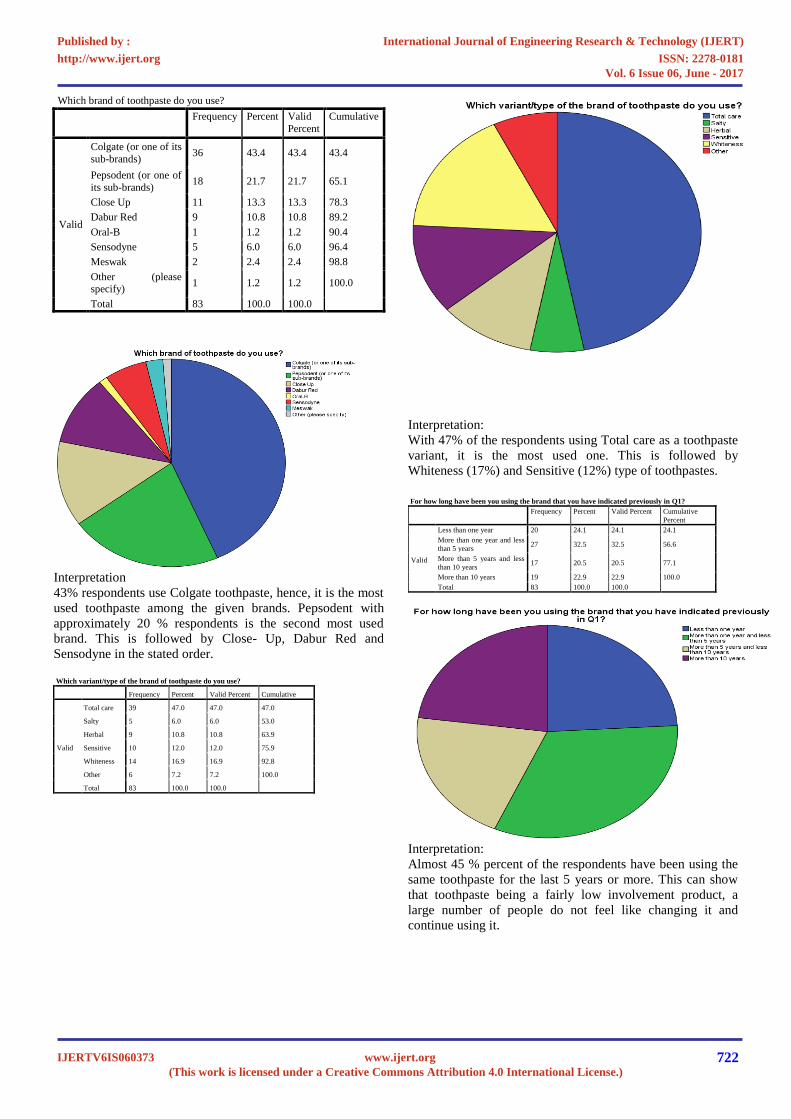
Which brand of toothpaste do you use?
Frequency Percent Valid
Percent
Cumulative
Valid
Colgate (or one of its
sub-brands) 36 43.4 43.4 43.4
Pepsodent (or one of
its sub-brands) 18 21.7 21.7 65.1
Close Up 11 13.3 13.3 78.3
Dabur Red 9 10.8 10.8 89.2
Oral-B 1 1.2 1.2 90.4
Sensodyne 5 6.0 6.0 96.4
Meswak 2 2.4 2.4 98.8
Other (please specify)
1 1.2 1.2 100.0
Total 83 100.0 100.0
Interpretation
43% respondents use Colgate toothpaste, hence, it is the most
used toothpaste among the given brands. Pepsodent with
approximately 20 % respondents is the second most used
brand. This is followed by Close- Up, Dabur Red and
Sensodyne in the stated order.
Which variant/type of the brand of toothpaste do you use?
Frequency Percent Valid Percent Cumulative
Valid
Total care 39 47.0 47.0 47.0
Salty 5 6.0 6.0 53.0
Herbal 9 10.8 10.8 63.9
Sensitive 10 12.0 12.0 75.9
Whiteness 14 16.9 16.9 92.8
Other 6 7.2 7.2 100.0
Total 83 100.0 100.0
Interpretation:
With 47% of the respondents using Total care as a toothpaste
variant, it is the most used one. This is followed by
Whiteness (17%) and Sensitive (12%) type of toothpastes.
For how long have been you using the brand that you have indicated previously in Q1?
Frequency Percent Valid Percent Cumulative
Percent
Valid
Less than one year 20 24.1 24.1 24.1
More than one year and less
than 5 years 27 32.5 32.5 56.6
More than 5 years and less
than 10 years 17 20.5 20.5 77.1
More than 10 years 19 22.9 22.9 100.0
Total 83 100.0 100.0
Interpretation:
Almost 45 % percent of the respondents have been using the
same toothpaste for the last 5 years or more. This can show
that toothpaste being a fairly low involvement product, a
large number of people do not feel like changing it and
continue using it.
International Journal of Engineering Research & Technology (IJERT)
ISSN: 2278-0181http://www.ijert.org
IJERTV6IS060373(This work is licensed under a Creative Commons Attribution 4.0 International License.)
Published by :
www.ijert.org
Vol. 6 Issue 06, June - 2017
722
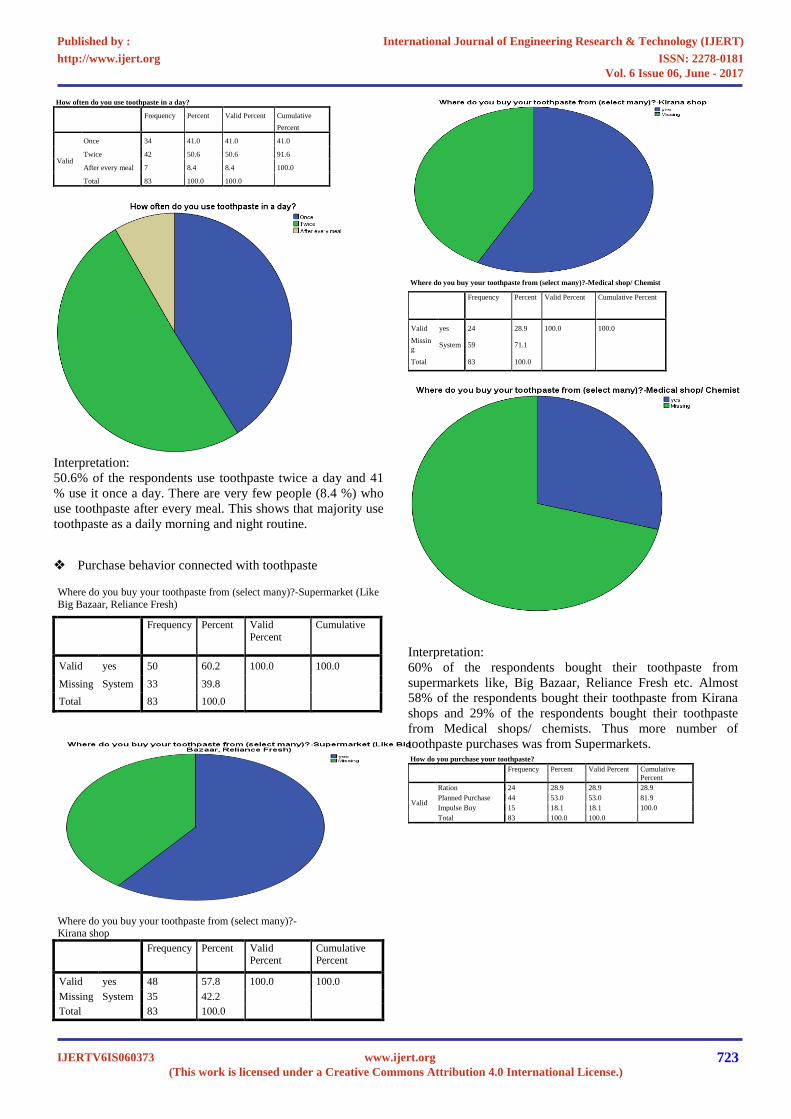
How often do you use toothpaste in a day?
Frequency Percent Valid Percent Cumulative
Percent
Valid
Once 34 41.0 41.0 41.0
Twice 42 50.6 50.6 91.6
After every meal 7 8.4 8.4 100.0
Total 83 100.0 100.0
Interpretation:
50.6% of the respondents use toothpaste twice a day and 41
% use it once a day. There are very few people (8.4 %) who
use toothpaste after every meal. This shows that majority use
toothpaste as a daily morning and night routine.
Purchase behavior connected with toothpaste
Where do you buy your toothpaste from (select many)?-Supermarket (Like
Big Bazaar, Reliance Fresh)
Frequency Percent Valid
Percent
Cumulative
Valid yes 50 60.2 100.0 100.0
Missing System 33 39.8
Total 83 100.0
Where do you buy your toothpaste from (select many)?- Kirana shop
Frequency Percent Valid Percent
Cumulative Percent
Valid yes 48 57.8 100.0 100.0
Missing System 35 42.2
Total 83 100.0
Where do you buy your toothpaste from (select many)?-Medical shop/ Chemist
Frequency Percent Valid Percent Cumulative Percent
Valid yes 24 28.9 100.0 100.0
Missin
g System 59 71.1
Total 83 100.0
Interpretation:
60% of the respondents bought their toothpaste from
supermarkets like, Big Bazaar, Reliance Fresh etc. Almost
58% of the respondents bought their toothpaste from Kirana
shops and 29% of the respondents bought their toothpaste
from Medical shops/ chemists. Thus more number of
toothpaste purchases was from Supermarkets. How do you purchase your toothpaste?
Frequency Percent Valid Percent Cumulative
Percent
Valid
Ration 24 28.9 28.9 28.9
Planned Purchase 44 53.0 53.0 81.9
Impulse Buy 15 18.1 18.1 100.0
Total 83 100.0 100.0
International Journal of Engineering Research & Technology (IJERT)
ISSN: 2278-0181http://www.ijert.org
IJERTV6IS060373(This work is licensed under a Creative Commons Attribution 4.0 International License.)
Published by :
www.ijert.org
Vol. 6 Issue 06, June - 2017
723
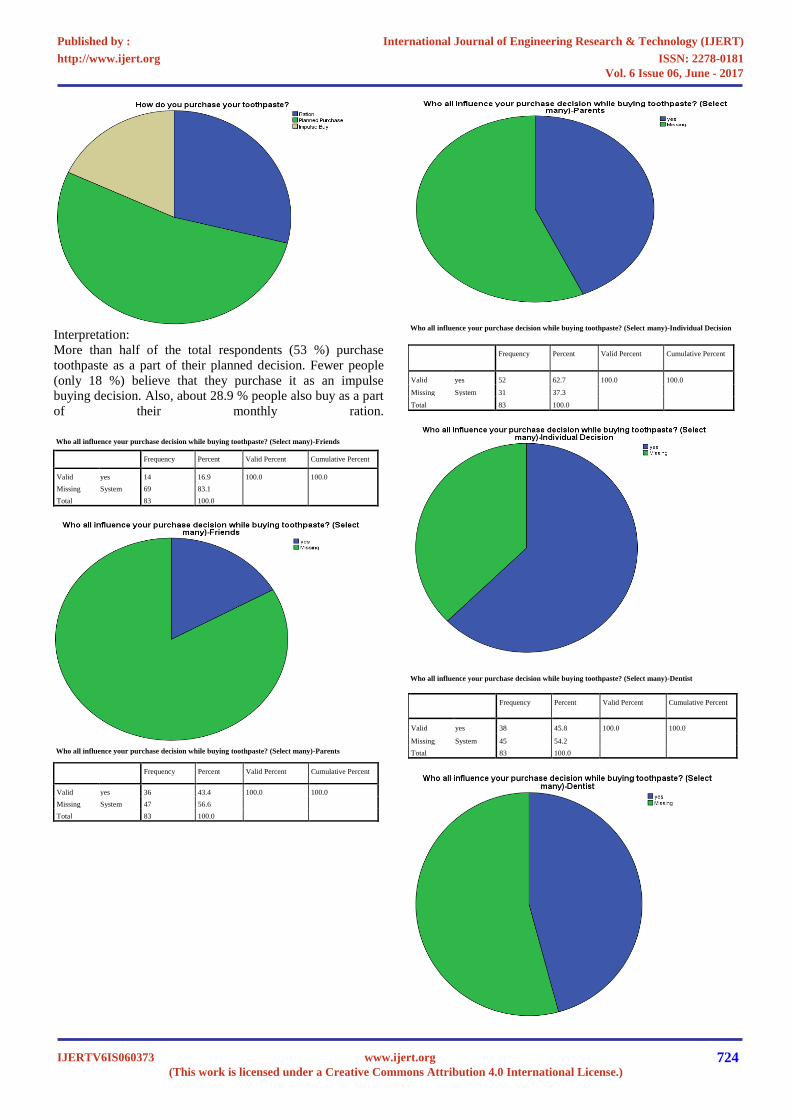
Interpretation:
More than half of the total respondents (53 %) purchase
toothpaste as a part of their planned decision. Fewer people
(only 18 %) believe that they purchase it as an impulse
buying decision. Also, about 28.9 % people also buy as a part
of their monthly ration.
Who all influence your purchase decision while buying toothpaste? (Select many)-Friends
Frequency Percent Valid Percent Cumulative Percent
Valid yes 14 16.9 100.0 100.0
Missing System 69 83.1
Total 83 100.0
Who all influence your purchase decision while buying toothpaste? (Select many)-Parents
Frequency Percent Valid Percent Cumulative Percent
Valid yes 36 43.4 100.0 100.0
Missing System 47 56.6
Total 83 100.0
Who all influence your purchase decision while buying toothpaste? (Select many)-Individual Decision
Frequency Percent Valid Percent Cumulative Percent
Valid yes 52 62.7 100.0 100.0
Missing System 31 37.3
Total 83 100.0
Who all influence your purchase decision while buying toothpaste? (Select many)-Dentist
Frequency Percent Valid Percent Cumulative Percent
Valid yes 38 45.8 100.0 100.0
Missing System 45 54.2
Total 83 100.0
International Journal of Engineering Research & Technology (IJERT)
ISSN: 2278-0181http://www.ijert.org
IJERTV6IS060373(This work is licensed under a Creative Commons Attribution 4.0 International License.)
Published by :
www.ijert.org
Vol. 6 Issue 06, June - 2017
724
Who all influence your purchase decision while buying toothpaste? (Select many)-
Shopkeeper/Salesperson
Frequency Percent Valid Percent Cumulative Percent
Valid yes 11 13.3 100.0 100.0
Missing System 72 86.7
Total 83 100.0
Who all influence your purchase decision while buying toothpaste? (Select many)-Spouse
Frequency Percent Valid Percent Cumulative Percent
Valid yes 11 13.3 100.0 100.0
Missing System 72 86.7
Total 83 100.0
Who all influence your purchase decision while buying toothpaste? (Select many)-Kids
Frequency Percent Valid Percent Cumulative Percent
Valid yes 12 14.5 100.0 100.0
Missing System 71 85.5
Total 83 100.0
Who all influence your purchase decision while buying toothpaste? (Select many)-Others(Please
Specify)
Frequency Percent Valid Percent Cumulative Percent
Valid yes 1 1.2 100.0 100.0
Missing System 82 98.8
Total 83 100.0
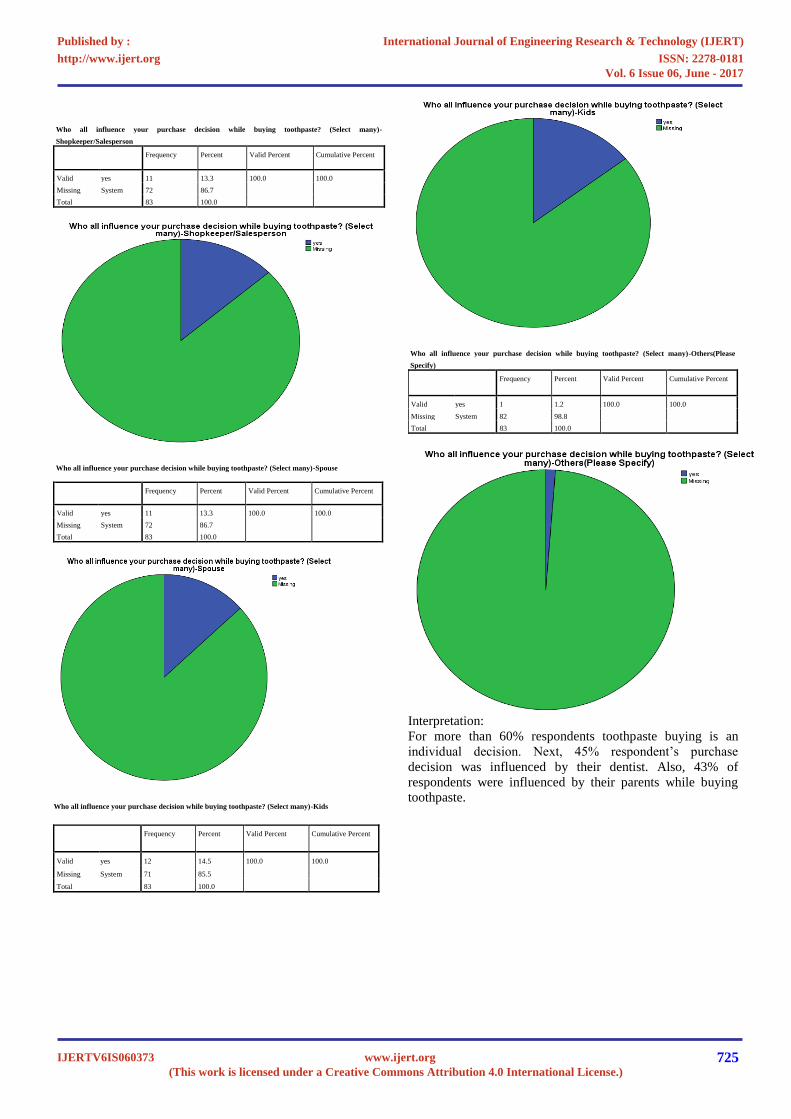
Interpretation:
For more than 60% respondents toothpaste buying is an
individual decision. Next, 45% respondent’s purchase
decision was influenced by their dentist. Also, 43% of
respondents were influenced by their parents while buying
toothpaste.
International Journal of Engineering Research & Technology (IJERT)
ISSN: 2278-0181http://www.ijert.org
IJERTV6IS060373(This work is licensed under a Creative Commons Attribution 4.0 International License.)
Published by :
www.ijert.org
Vol. 6 Issue 06, June - 2017
725
How much are you willing to spend on a regular size (150 gm) of toothpaste? (Rs.)
Frequency Percent Valid Percent Cumulative Percent
Valid
a)<50 13 15.7 15.7 15.7
b) 50-75 46 55.4 55.4 71.1
c) 76-100 20 24.1 24.1 95.2
d) >100 4 4.8 4.8 100.0
Total 83 100.0 100.0
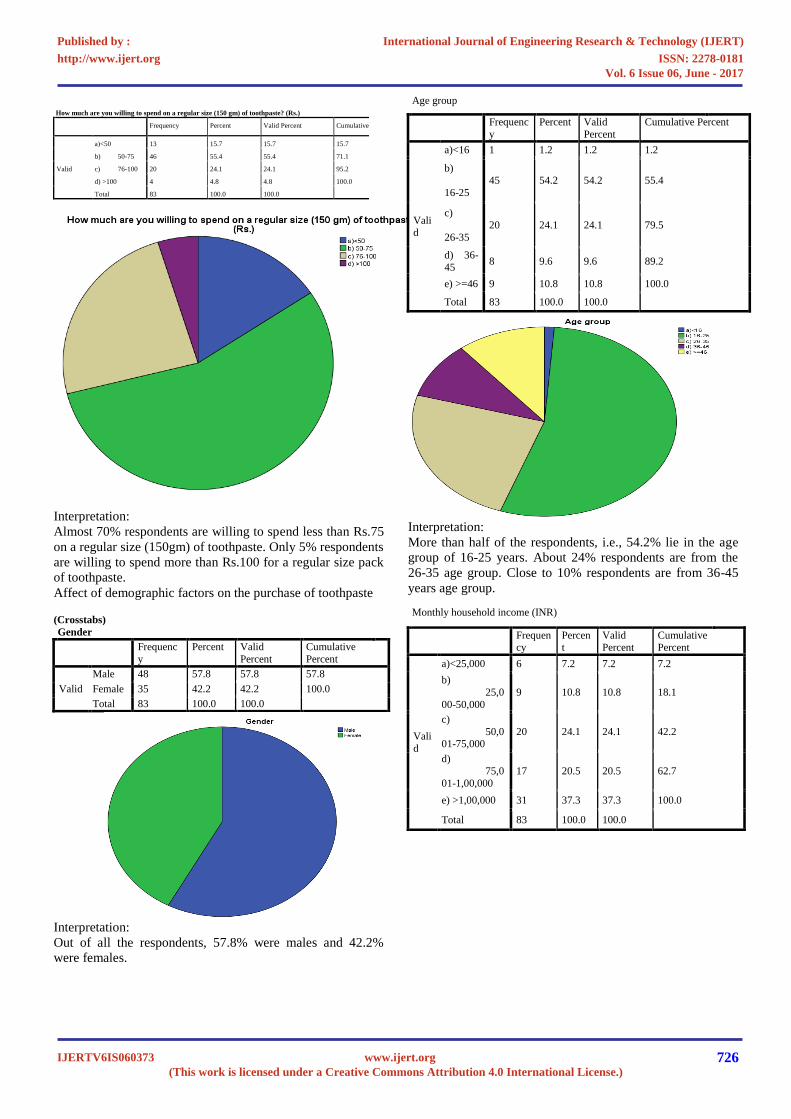
Interpretation:
Almost 70% respondents are willing to spend less than Rs.75
on a regular size (150gm) of toothpaste. Only 5% respondents
are willing to spend more than Rs.100 for a regular size pack
of toothpaste.
Affect of demographic factors on the purchase of toothpaste
(Crosstabs)
Gender
Frequenc
y
Percent Valid
Percent
Cumulative
Percent
Valid
Male 48 57.8 57.8 57.8
Female 35 42.2 42.2 100.0
Total 83 100.0 100.0
Interpretation:
Out of all the respondents, 57.8% were males and 42.2%
were females.
Age group
Frequenc
y
Percent Valid
Percent
Cumulative Percent
Valid
a)<16 1 1.2 1.2 1.2
b)
16-25
45 54.2 54.2 55.4
c)
26-35
20 24.1 24.1 79.5
d) 36-
45 8 9.6 9.6 89.2
e) >=46 9 10.8 10.8 100.0
Total 83 100.0 100.0
Interpretation:
More than half of the respondents, i.e., 54.2% lie in the age
group of 16-25 years. About 24% respondents are from the
26-35 age group. Close to 10% respondents are from 36-45
years age group.
Monthly household income (INR)
Frequency
Percent
Valid Percent
Cumulative Percent
Vali
d
a)<25,000 6 7.2 7.2 7.2
b)
25,0
00-50,000
9 10.8 10.8 18.1
c)
50,001-75,000
20 24.1 24.1 42.2
d)
75,0
01-1,00,000
17 20.5 20.5 62.7
e) >1,00,000 31 37.3 37.3 100.0
Total 83 100.0 100.0
International Journal of Engineering Research & Technology (IJERT)
ISSN: 2278-0181http://www.ijert.org
IJERTV6IS060373(This work is licensed under a Creative Commons Attribution 4.0 International License.)
Published by :
www.ijert.org
Vol. 6 Issue 06, June - 2017
726
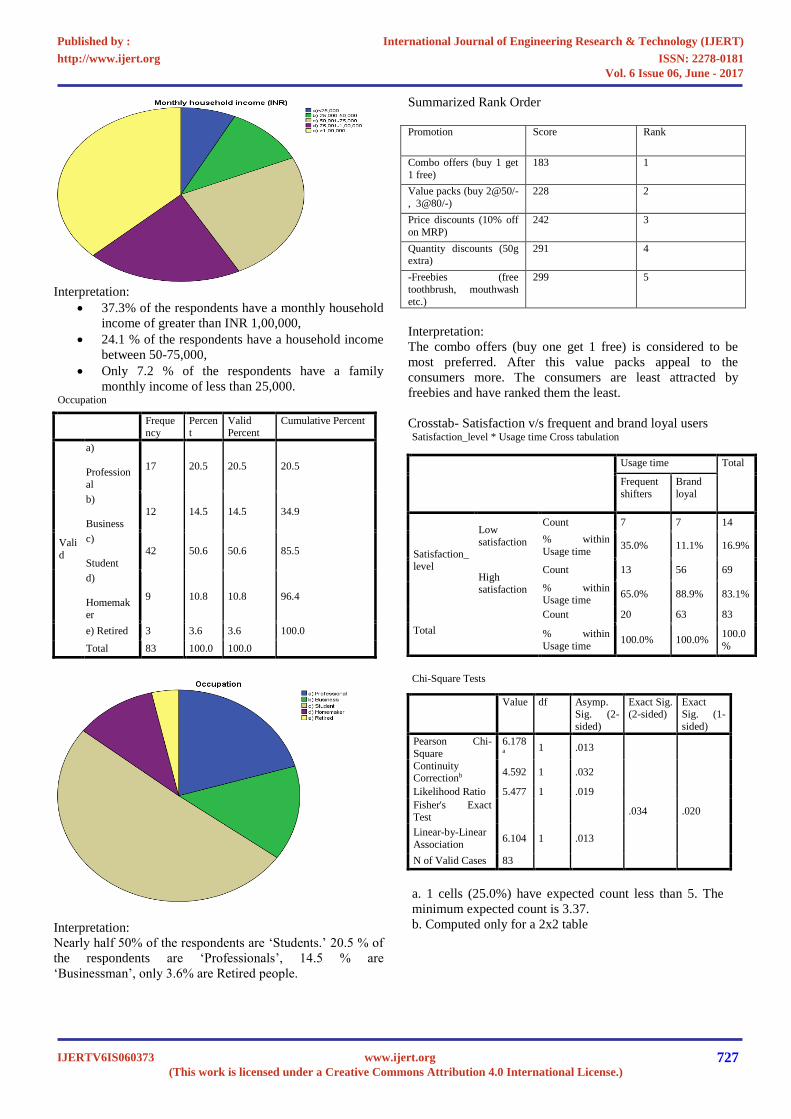
Interpretation:
37.3% of the respondents have a monthly household
income of greater than INR 1,00,000,
24.1 % of the respondents have a household income
between 50-75,000,
Only 7.2 % of the respondents have a family
monthly income of less than 25,000. Occupation
Frequency
Percent
Valid Percent
Cumulative Percent
Vali
d
a)
Profession
al
17 20.5 20.5 20.5
b)
Business
12 14.5 14.5 34.9
c)
Student
42 50.6 50.6 85.5
d)
Homemaker
9 10.8 10.8 96.4
e) Retired 3 3.6 3.6 100.0
Total 83 100.0 100.0
Interpretation:
Nearly half 50% of the respondents are ‘Students.’ 20.5 % of
the respondents are ‘Professionals’, 14.5 % are
‘Businessman’, only 3.6% are Retired people.
Summarized Rank Order
Promotion Score Rank
Combo offers (buy 1 get
1 free)
183 1
Value packs (buy 2@50/-
, 3@80/-)
228 2
Price discounts (10% off
on MRP)
242 3
Quantity discounts (50g extra)
291 4
-Freebies (free
toothbrush, mouthwash
etc.)
299 5
Interpretation:
The combo offers (buy one get 1 free) is considered to be
most preferred. After this value packs appeal to the
consumers more. The consumers are least attracted by
freebies and have ranked them the least.
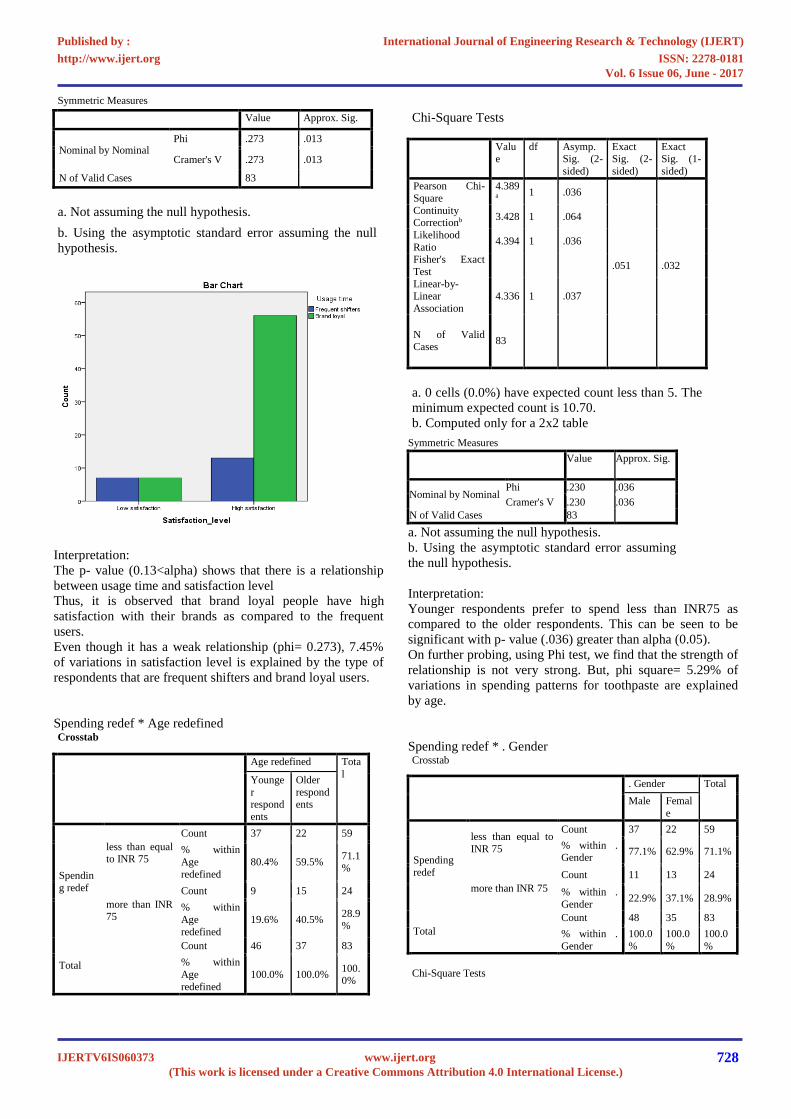
Crosstab- Satisfaction v/s frequent and brand loyal users Satisfaction_level * Usage time Cross tabulation
Usage time Total
Frequent
shifters
Brand
loyal
Satisfaction_
level
Low
satisfaction
Count 7 7 14
% within
Usage time 35.0% 11.1% 16.9%
High satisfaction
Count 13 56 69
% within Usage time
65.0% 88.9% 83.1%
Total
Count 20 63 83
% within
Usage time 100.0% 100.0%
100.0
%
Chi-Square Tests
Value df Asymp. Sig. (2-
sided)
Exact Sig. (2-sided)
Exact Sig. (1-
sided)
Pearson Chi-
Square
6.178a
1 .013
Continuity Correctionb
4.592 1 .032
Likelihood Ratio 5.477 1 .019
Fisher's Exact Test
.034 .020
Linear-by-Linear
Association 6.104 1 .013
N of Valid Cases 83
a. 1 cells (25.0%) have expected count less than 5. The
minimum expected count is 3.37.
b. Computed only for a 2x2 table
International Journal of Engineering Research & Technology (IJERT)
ISSN: 2278-0181http://www.ijert.org
IJERTV6IS060373(This work is licensed under a Creative Commons Attribution 4.0 International License.)
Published by :
www.ijert.org
Vol. 6 Issue 06, June - 2017
727
Symmetric Measures
Value Approx. Sig.
Nominal by Nominal Phi .273 .013
Cramer's V .273 .013
N of Valid Cases 83
a. Not assuming the null hypothesis.
b. Using the asymptotic standard error assuming the null
hypothesis.
Interpretation:
The p- value (0.13<alpha) shows that there is a relationship
between usage time and satisfaction level
Thus, it is observed that brand loyal people have high
satisfaction with their brands as compared to the frequent
users.
Even though it has a weak relationship (phi= 0.273), 7.45%
of variations in satisfaction level is explained by the type of
respondents that are frequent shifters and brand loyal users.
Spending redef * Age redefined Crosstab
Age redefined Tota
l Younge
r respond
ents
Older
respondents
Spendin
g redef
less than equal to INR 75
Count 37 22 59
% within
Age
redefined
80.4% 59.5% 71.1%
more than INR 75
Count 9 15 24
% within
Age
redefined
19.6% 40.5% 28.9%
Total
Count 46 37 83
% within
Age
redefined
100.0% 100.0% 100.0%
Chi-Square Tests
Value
df Asymp. Sig. (2-
sided)
Exact Sig. (2-
sided)
Exact Sig. (1-
sided)
Pearson Chi-
Square
4.389a
1 .036
Continuity Correctionb
3.428 1 .064
Likelihood
Ratio 4.394 1 .036
Fisher's Exact
Test
.051 .032
Linear-by-Linear
Association
4.336 1 .037
N of Valid Cases
83
a. 0 cells (0.0%) have expected count less than 5. The
minimum expected count is 10.70.
b. Computed only for a 2x2 table
Symmetric Measures
Value Approx. Sig.
Nominal by Nominal Phi .230 .036
Cramer's V .230 .036
N of Valid Cases 83
a. Not assuming the null hypothesis.
b. Using the asymptotic standard error assuming
the null hypothesis.
Interpretation:
Younger respondents prefer to spend less than INR75 as
compared to the older respondents. This can be seen to be
significant with p- value (.036) greater than alpha (0.05).
On further probing, using Phi test, we find that the strength of
relationship is not very strong. But, phi square= 5.29% of
variations in spending patterns for toothpaste are explained
by age.
Spending redef * . Gender Crosstab
. Gender Total
Male Femal
e
Spending
redef
less than equal to
INR 75
Count 37 22 59
% within . Gender
77.1% 62.9% 71.1%
more than INR 75
Count 11 13 24
% within .
Gender 22.9% 37.1% 28.9%
Total
Count 48 35 83
% within .
Gender
100.0
%
100.0
%
100.0
%
Chi-Square Tests
International Journal of Engineering Research & Technology (IJERT)
ISSN: 2278-0181http://www.ijert.org
IJERTV6IS060373(This work is licensed under a Creative Commons Attribution 4.0 International License.)
Published by :
www.ijert.org
Vol. 6 Issue 06, June - 2017
728
Value df Asymp.
Sig. (2-
sided)
Exact Sig.
(2-sided)
Exact Sig.
(1-sided)
Pearson Chi-Square
1.993a 1 .158
Continuity
Correctionb 1.361 1 .243
Likelihood Ratio 1.978 1 .160
Fisher's Exact Test .220 .122
Linear-by-Linear Association
1.969 1 .161
N of Valid Cases 83
a. 0 cells (0.0%) have expected count less than 5. The minimum expected count is 10.12.
b. Computed only for a 2x2 table
Interpretation:
More males prefer spending less than INR 75 on toothpaste
as compared to females. But, the results are insignificant as
shown by chi square test.
Spending redef * Monthly household income (INR) Crosstab
Monthly household income (INR)
Total
a)<25,
00
0
b)
25,0
00-50,0
00
c)
50,0
01-75,0
00
d)
75,0
01-1,00,
000
e) >1,0
0,00
0
Spen
ding
redef
less than equal to
INR 75
Count 5 9 15 12 18 59
% within
Monthly
household income
(INR)
83.
3%
100.
0%
75.0
%
70.6
%
58.1
%
71
.1%
more than INR 75
Count 1 0 5 5 13 24
% within
Monthly household
income
(INR)
16.
7% 0.0%
25.0
%
29.4
%
41.9
%
28.9
%
Total
Count 6 9 20 17 31 83
% within
Monthly
household income
(INR)
10
0.0%
100.
0%
100.
0%
100.
0%
100.
0%
100.
0
%
Chi-Square Tests
Valu
e
df Asymp. Sig. (2-
sided)
Pearson Chi-Square
6.807a
4 .146
Likelihood
Ratio 9.169 4 .057
Linear-by-
Linear
Association
5.385 1 .020
N of Valid Cases
83
a. 4 cells (40.0%) have expected count less than 5. The minimum expected count is 1.73.
Interpretation:
Respondents with monthly household income between
INR25001 and INR50000 prefer to spend less than INR75 on
toothpaste purchase. But, chi square test is not valid here as 4
cells have expected count less than 5, so, no further analysis
is done.
Spending redef * Occupation Crosstab
Occupation To
tal a) Profe
ssion
al
b) Busi
ness
c) Stu
den
t
d) Home
maker
e) Retir
ed
Spend
ing redef
less than
equal to
INR 75
Count 11 7 33 5 3 59
%
within
Occupation
64.7
%
58.3
%
78.
6% 55.6%
100.
0%
71.1
%
more than
INR 75
Count 6 5 9 4 0 24
% within
Occupat
ion
35.3
%
41.7
%
21.
4% 44.4% 0.0%
28.
9%
Total
Count 17 12 42 9 3 83
% within
Occupat
ion
100.0
%
100.
0%
10
0.0%
100.0
%
100.
0%
10
0.0%
Chi-Square Tests
Value
df Asymp. Sig. (2-sided)
Pearson Chi-
Square
4.70
7a 4 .319
Likelihood
Ratio
5.44
6 4 .244
Linear-by-
Linear
Association
.876 1 .349
N of Valid
Cases 83
a. 5 cells (50.0%) have expected count less than 5.
The minimum expected count is .87.
Interpretation:
Mostly retired people and students prefer spending less than
INR75 on toothpaste. But, chi square test is not valid here as
5 cells have expected count less than 5, so, no further analysis
is done.
International Journal of Engineering Research & Technology (IJERT)
ISSN: 2278-0181http://www.ijert.org
IJERTV6IS060373(This work is licensed under a Creative Commons Attribution 4.0 International License.)
Published by :
www.ijert.org
Vol. 6 Issue 06, June - 2017
729
Crosstabs
How do you purchase your toothpaste? * Age redefined
Crosstab
Age redefined Total Younge
r respond
ents
Older
respondents
How do you
purchase your toothpaste?
Ration
Count 11 13 24
% within Age redefined
23.9% 35.1% 28.9%
Planned
Purchase
Count 23 21 44
% within Age
redefined 50.0% 56.8%
53.0
%
Impulse
Buy
Count 12 3 15
% within Age
redefined 26.1% 8.1%
18.1
%
Total
Count 46 37 83
% within Age
redefined 100.0% 100.0%
100.
0%
Chi-Square Tests
Valu
e
Df Asymp. Sig. (2-
sided)
Pearson Chi-
Square
4.737a
2 .094
Likelihood Ratio 5.062 2 .080 Linear-by-Linear
Association 3.771 1 .052
N of Valid Cases 83
a. 0 cells (0.0%) have expected count less than
5. The minimum expected count is 6.69.
Interpretation:
Older respondents generally go for a planned purchase or
ration as compared to younger respondents. Impulse buying
behavior in case of toothpaste is shown more by the younger
respondents. But, the results are insignificant as shown by chi
square test.
How do you purchase your toothpaste? * . Gender Crosstab
. Gender Total
Male Female
How do you purchase your toothpaste?
Ration
Count 13 11 24
% within .
Gender 27.1% 31.4% 28.9%
Planned Purchase
Count 26 18 44
% within .
Gender 54.2% 51.4% 53.0%
Impulse Buy
Count 9 6 15
% within . Gender
18.8% 17.1% 18.1%
Total
Count 48 35 83
% within .
Gender 100.0% 100.0% 100.0%
Chi-Square Tests
Value df Asymp. Sig. (2-sided)
Pearson Chi-Square .190a 2 .909 Likelihood Ratio .189 2 .910
Linear-by-Linear
Association .155 1 .694
N of Valid Cases 83
a. 0 cells (0.0%) have expected count less than 5. The
minimum expected count is 6.33.
Interpretation:
Males generally go for a planned purchase or impulse buy for
toothpaste whereas females purchase it with the monthly
ration. But, the results are insignificant as shown by chi
square test.
How do you purchase your toothpaste? * Monthly household
income (INR) Crosstab
Monthly household income (INR) To
tal a)<25,
000
b)
25,00
0-
50,00
0
c)
50,00
1-
75,00
0
d)
75,00
1-
1,00,
000
e) >1,0
0,00
0
How do you
purchase
your toothpaste
?
Ration
Count 0 3 7 6 8 24
% within Monthly
household
income (INR)
0.0%
33.3%
35.0%
35.3%
25.8%
28.
9
%
Planne
d
Purchase
Count 4 4 9 10 17 44
% within Monthly
household
income (INR)
66.7%
44.4%
45.0%
58.8%
54.8%
53.
0
%
Impuls
e Buy
Count 2 2 4 1 6 15
% within
Monthly
household
income
(INR)
33.
3%
22.2
%
20.0
% 5.9%
19.4
%
18.
1
%
Total
Count 6 9 20 17 31 83
% within Monthly
household
income (INR)
100
.0
%
100.0%
100.0%
100.0%
100.0%
10
0.0
%
Chi-Square Tests
Value df Asymp.
Sig. (2-
sided)
Pearson Chi-
Square
5.426a
8 .711
Likelihood Ratio 7.469 8 .487
Linear-by-Linear
Association .527 1 .468
N of Valid Cases 83
a. 9 cells (60.0%) have expected count less than 5. The minimum expected count is 1.08.
Interpretation:
Chi square test is not valid here as 9 cells have expected
count less than 5, so, no further analysis is done.
How do you purchase your toothpaste? * Occupation
International Journal of Engineering Research & Technology (IJERT)
ISSN: 2278-0181http://www.ijert.org
IJERTV6IS060373(This work is licensed under a Creative Commons Attribution 4.0 International License.)
Published by :
www.ijert.org
Vol. 6 Issue 06, June - 2017
730
Crosstab
Occupation Total
a)
Pr
ofessional
b)
Business
c)
Studen
t
d)
H
omemaker
e)
Retired
How do you
purchase your
toothpaste?
Ration
Count 8 3 9 3 1 24
% within
Occupation 47.1% 25.0% 21.4% 33.3% 33.3% 28.9%
Planned
Purchase
Count 5 6 25 6 2 44
% within
Occupation 29.4% 50.0% 59.5% 66.7% 66.7% 53.0%
Impulse Buy
Count 4 3 8 0 0 15
% within
Occupation 23.5% 25.0% 19.0% 0.0% 0.0% 18.1%
Total
Count 17 12 42 9 3 83
% within
Occupation 100.0% 100.0%
100.0
% 100.0%
100.0
%
100.0
%
Chi-Square Tests
Value df Asymp. Sig. (2-
sided)
Pearson Chi-Square 8.248a 8 .410
Likelihood Ratio 10.428 8 .236
Linear-by-Linear
Association .003 1 .955
N of Valid Cases 83
a. 10 cells (66.7%) have expected count less than 5. The minimum
expected count is .54.
Interpretation:
Chi square test is not valid here as 10 cells have expected
count less than 5, so, no further analysis is done.
Switching Behavior
(One- Sample t-test, Independent sample t-test,
ANOVA)
The objective is to determine which factors are most
important for switching or replacement among brands of
toothpastes.
The mean values were found out for each factor. Higherthe
value, more important is that factor for customers for
replacement.
Through a one-sample t-test, the significance of mean was
determined.
H0: Mean value of Replacement Factor = 3
H1: Mean value of Replacement Factor > 3
Significance level=0.05
This is a one-tailed t-test, so p-value is divided by 2.
If you have changed your toothpaste,
please rate your agreement/disagreement
with the following factors
N Mean Sig. (2-
tailed)
Sig. (1-
tailed)
I was dissatisfied with the previous brand 83 2.86 .176 0.088
I had a new dental problem that the
previous brand did not address 83 3.04 .789
0.3945
It was recommended by someone from my social circle
83 2.89 .405 0.2025
The advertisements of the new brand
attracted me 83 3.10 .472
0.236
I used the free sample of the new brand
and liked it 83 2.64 .007
0.0035
I was offered an attractive discount on the
new brand (includes 1+1, or free gifts) 83 2.75 .058
0.029
My dentist strongly recommended the
brand 83 3.13 .332
0.166
The other brand was cheaper 83 2.42 .000 0
The previous brand was not easily
available at stores 83 2.24 .000
0
When p-value<0.05, H0 is rejected implying the
corresponding switching factor mean is significant.
From the above table significant factors in the order of
importance are identified:
1. Offered an attractive discount on the new brand
2. Used the sample of the new brand and liked it.
3. The other brand was cheaper
4. The previous brand was not easily available at stores
When p-value>0.05, there is not enough evidence to reject H0
implying the corresponding brand replacement factor mean is
insignificant.
From the above table insignificant factors are identified:
1. Dissatisfaction with the previous brand
2. A new dental problem not addressed by previous
brand
3. Recommendation by someone from social circle
4. Attractive advertisements of the new brand
5. Dentist recommendation
Demographic Variables vs Switching Behavior
The objective is to understand the effect of demographic
variables on factors considered most important for switching
or replacement among different brands of toothpastes.
The mean values were found out for each factor across each
variable category. Higher the value, more important is the
factor to that category of variable.
Gender
Through an independent sample t-test, the significance of
difference in mean was determined.
H0: Mean importance to Males = Mean importance to
Females
H1: Mean importance to Males ≠ Mean importance to
Females
Significance level=0.05
Decsriptives
If you have changed your
toothpaste , please rate your agreement/disagreement with the
following factors
. Gender N Mean
I was dissatisfied with the
previous brand
Male 48 2.75
Female 35 3.00
had a new dental problem that the previous brand did not
address
Male 48 2.81
Female 35 3.34
It was recommended by someone from my social circle
Male 48 3.00
Female 35 2.74
The advertisements of the new
brand attracted me
Male 48 3.02
Female 35 3.20
I used the free sample of the
new brand and liked it
Male 48 2.56
Female 35 2.74
I was offered an attractive Male 48 2.65
International Journal of Engineering Research & Technology (IJERT)
ISSN: 2278-0181http://www.ijert.org
IJERTV6IS060373(This work is licensed under a Creative Commons Attribution 4.0 International License.)
Published by :
www.ijert.org
Vol. 6 Issue 06, June - 2017
731
discount on the new brand
(includes 1+1, or free gifts) Female 35 2.89
My dentist strongly recommended the brand
Male 48 2.90
Female 35 3.46
The other brand was cheaper Male 48 2.40
Female 35 2.46
The previous brand was not
easily available at stores
Male 48 2.25
Female 35 2.23
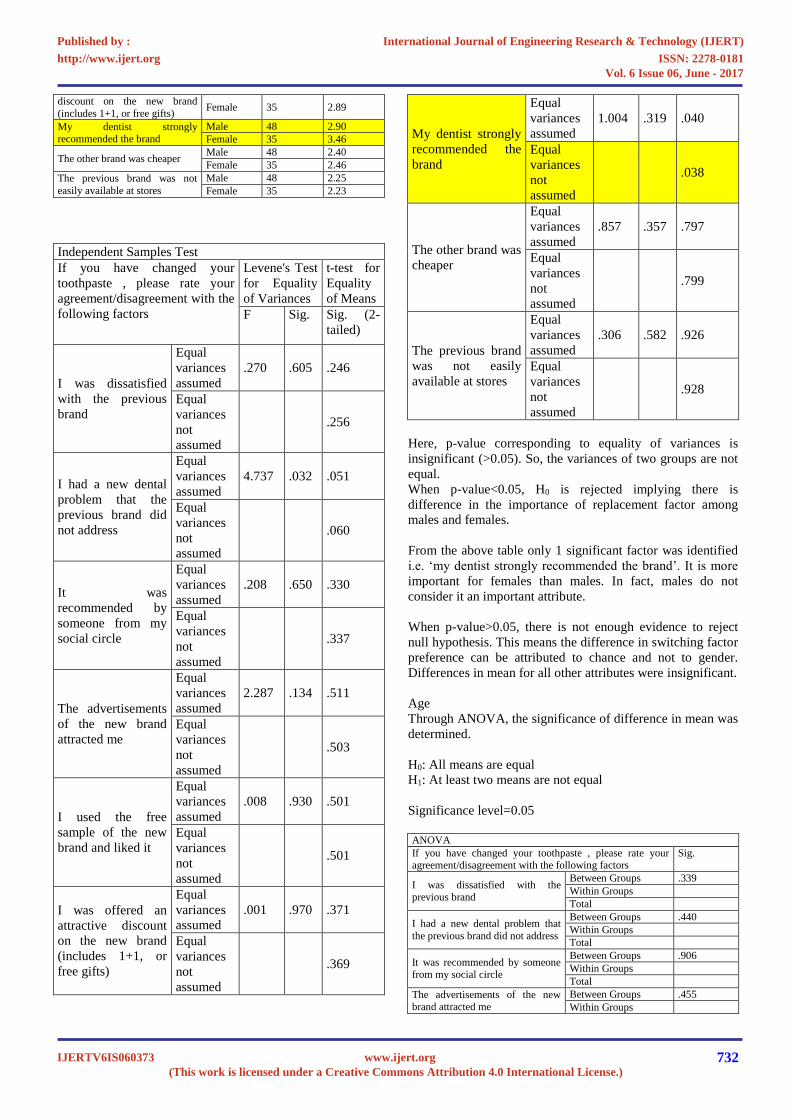
Independent Samples Test
If you have changed your
toothpaste , please rate your
agreement/disagreement with the
following factors
Levene's Test
for Equality
of Variances
t-test for
Equality
of Means
F Sig. Sig. (2-
tailed)
I was dissatisfied
with the previous
brand
Equal
variances
assumed
.270 .605 .246
Equal
variances
not
assumed
.256
I had a new dental
problem that the
previous brand did
not address
Equal
variances
assumed
4.737 .032 .051
Equal
variances
not
assumed
.060
It was
recommended by
someone from my
social circle
Equal
variances
assumed
.208 .650 .330
Equal
variances
not
assumed
.337
The advertisements
of the new brand
attracted me
Equal
variances
assumed
2.287 .134 .511
Equal
variances
not
assumed
.503
I used the free
sample of the new
brand and liked it
Equal
variances
assumed
.008 .930 .501
Equal
variances
not
assumed
.501
I was offered an
attractive discount
on the new brand
(includes 1+1, or
free gifts)
Equal
variances
assumed
.001 .970 .371
Equal
variances
not
assumed
.369
My dentist strongly
recommended the
brand
Equal
variances
assumed
1.004 .319 .040
Equal
variances
not
assumed
.038
The other brand was
cheaper
Equal
variances
assumed
.857 .357 .797
Equal
variances
not
assumed
.799
The previous brand
was not easily
available at stores
Equal
variances
assumed
.306 .582 .926
Equal
variances
not
assumed
.928
Here, p-value corresponding to equality of variances is
insignificant (>0.05). So, the variances of two groups are not
equal.
When p-value<0.05, H0 is rejected implying there is
difference in the importance of replacement factor among
males and females.
From the above table only 1 significant factor was identified
i.e. ‘my dentist strongly recommended the brand’. It is more
important for females than males. In fact, males do not
consider it an important attribute.
When p-value>0.05, there is not enough evidence to reject
null hypothesis. This means the difference in switching factor
preference can be attributed to chance and not to gender.
Differences in mean for all other attributes were insignificant.
Age
Through ANOVA, the significance of difference in mean was
determined.
H0: All means are equal
H1: At least two means are not equal
Significance level=0.05
ANOVA
If you have changed your toothpaste , please rate your agreement/disagreement with the following factors
Sig.
I was dissatisfied with the previous brand
Between Groups .339
Within Groups
Total
I had a new dental problem that
the previous brand did not address
Between Groups .440
Within Groups
Total
It was recommended by someone from my social circle
Between Groups .906
Within Groups
Total
The advertisements of the new brand attracted me
Between Groups .455
Within Groups
International Journal of Engineering Research & Technology (IJERT)
ISSN: 2278-0181http://www.ijert.org
IJERTV6IS060373(This work is licensed under a Creative Commons Attribution 4.0 International License.)
Published by :
www.ijert.org
Vol. 6 Issue 06, June - 2017
732
Total
I used the free sample of the new
brand and liked it
Between Groups .572
Within Groups
Total
I was offered an attractive discount on the new brand
(includes 1+1, or free gifts)
Between Groups .133
Within Groups
Total
My dentist strongly recommended
the brand
Between Groups .985
Within Groups
Total
The other brand was cheaper
Between Groups .064
Within Groups
Total
The previous brand was not easily
available at stores
Between Groups .785
Within Groups
Total
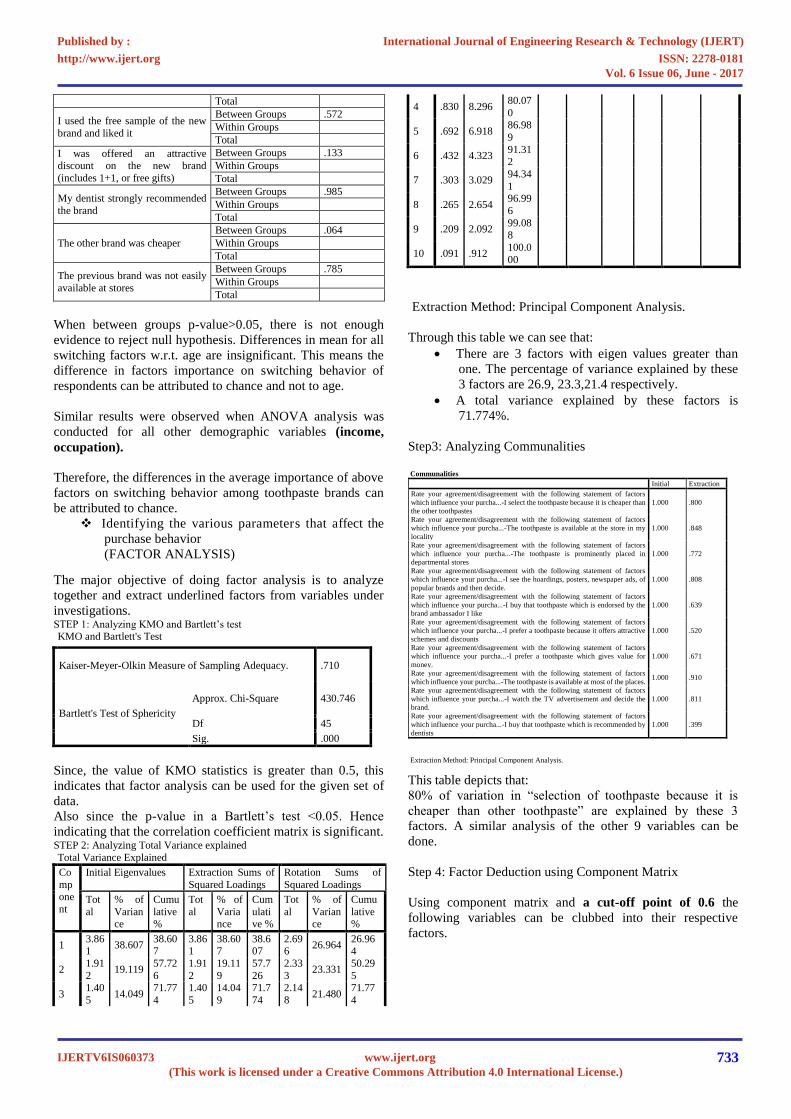
When between groups p-value>0.05, there is not enough
evidence to reject null hypothesis. Differences in mean for all
switching factors w.r.t. age are insignificant. This means the
difference in factors importance on switching behavior of
respondents can be attributed to chance and not to age.
Similar results were observed when ANOVA analysis was
conducted for all other demographic variables (income,
occupation).
Therefore, the differences in the average importance of above
factors on switching behavior among toothpaste brands can
be attributed to chance.
Identifying the various parameters that affect the
purchase behavior
(FACTOR ANALYSIS)
The major objective of doing factor analysis is to analyze
together and extract underlined factors from variables under
investigations. STEP 1: Analyzing KMO and Bartlett’s test KMO and Bartlett's Test
Kaiser-Meyer-Olkin Measure of Sampling Adequacy. .710
Bartlett's Test of Sphericity
Approx. Chi-Square 430.746
Df 45
Sig. .000
Since, the value of KMO statistics is greater than 0.5, this
indicates that factor analysis can be used for the given set of
data.
Also since the p-value in a Bartlett’s test <0.05. Hence
indicating that the correlation coefficient matrix is significant. STEP 2: Analyzing Total Variance explained
Total Variance Explained
Co
mpone
nt
Initial Eigenvalues Extraction Sums of
Squared Loadings
Rotation Sums of
Squared Loadings
Tot
al
% of
Variance
Cumu
lative %
Tot
al
% of
Variance
Cum
ulative %
Tot
al
% of
Variance
Cumu
lative %
1 3.861
38.607 38.607
3.861
38.607
38.607
2.696
26.964 26.964
2 1.91
2 19.119
57.72
6
1.91
2
19.11
9
57.7
26
2.33
3 23.331
50.29
5
3 1.40
5 14.049
71.77
4
1.40
5
14.04
9
71.7
74
2.14
8 21.480
71.77
4
4 .830 8.296 80.07
0
5 .692 6.918 86.98
9
6 .432 4.323 91.312
7 .303 3.029 94.34
1
8 .265 2.654 96.99
6
9 .209 2.092 99.088
10 .091 .912 100.0
00
Extraction Method: Principal Component Analysis.
Through this table we can see that:
There are 3 factors with eigen values greater than
one. The percentage of variance explained by these
3 factors are 26.9, 23.3,21.4 respectively.
A total variance explained by these factors is
71.774%.
Step3: Analyzing Communalities
Communalities
Initial Extraction
Rate your agreement/disagreement with the following statement of factors
which influence your purcha...-I select the toothpaste because it is cheaper than
the other toothpastes
1.000 .800
Rate your agreement/disagreement with the following statement of factors
which influence your purcha...-The toothpaste is available at the store in my
locality
1.000 .848
Rate your agreement/disagreement with the following statement of factors
which influence your purcha...-The toothpaste is prominently placed in
departmental stores
1.000 .772
Rate your agreement/disagreement with the following statement of factors
which influence your purcha...-I see the hoardings, posters, newspaper ads, of
popular brands and then decide.
1.000 .808
Rate your agreement/disagreement with the following statement of factors
which influence your purcha...-I buy that toothpaste which is endorsed by the
brand ambassador I like
1.000 .639
Rate your agreement/disagreement with the following statement of factors
which influence your purcha...-I prefer a toothpaste because it offers attractive
schemes and discounts
1.000 .520
Rate your agreement/disagreement with the following statement of factors
which influence your purcha...-I prefer a toothpaste which gives value for
money.
1.000 .671
Rate your agreement/disagreement with the following statement of factors
which influence your purcha...-The toothpaste is available at most of the places. 1.000 .910
Rate your agreement/disagreement with the following statement of factors
which influence your purcha...-I watch the TV advertisement and decide the
brand.
1.000 .811
Rate your agreement/disagreement with the following statement of factors
which influence your purcha...-I buy that toothpaste which is recommended by
dentists
1.000 .399
Extraction Method: Principal Component Analysis.
This table depicts that:
80% of variation in “selection of toothpaste because it is
cheaper than other toothpaste” are explained by these 3
factors. A similar analysis of the other 9 variables can be
done.
Step 4: Factor Deduction using Component Matrix
Using component matrix and a cut-off point of 0.6 the
following variables can be clubbed into their respective
factors.
International Journal of Engineering Research & Technology (IJERT)
ISSN: 2278-0181http://www.ijert.org
IJERTV6IS060373(This work is licensed under a Creative Commons Attribution 4.0 International License.)
Published by :
www.ijert.org
Vol. 6 Issue 06, June - 2017
733
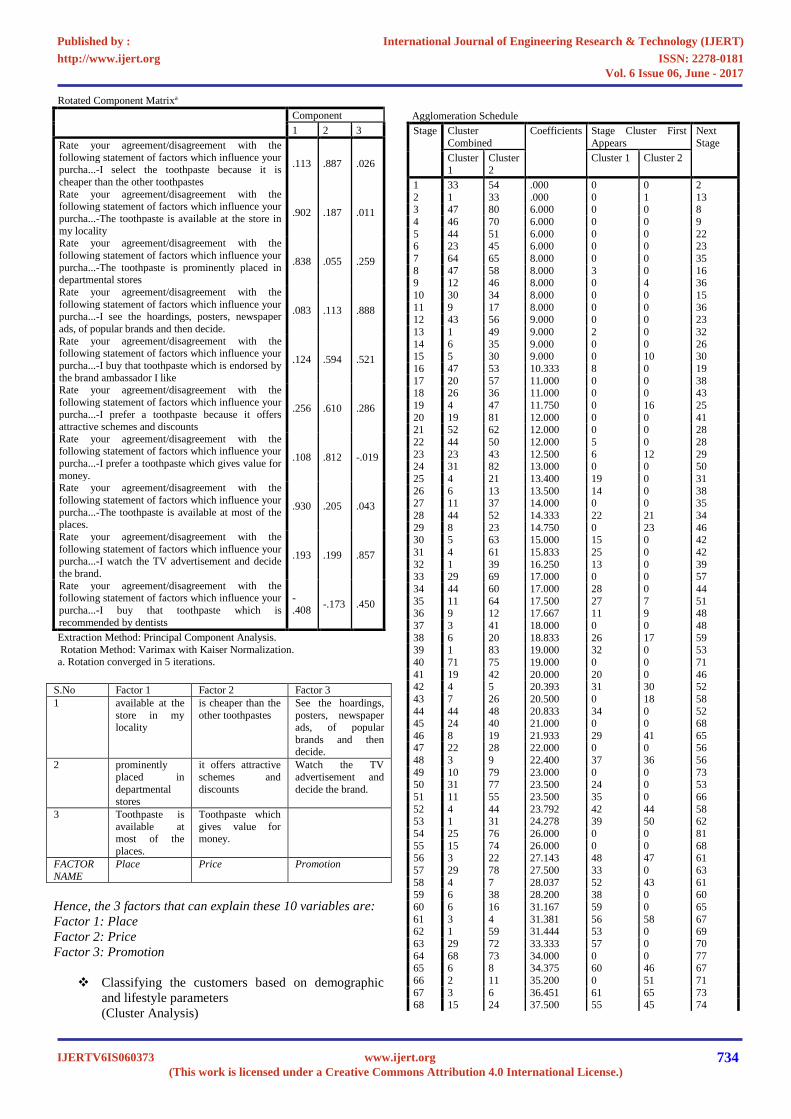
Rotated Component Matrixa
Component
1 2 3
Rate your agreement/disagreement with the
following statement of factors which influence your purcha...-I select the toothpaste because it is
cheaper than the other toothpastes
.113 .887 .026
Rate your agreement/disagreement with the following statement of factors which influence your
purcha...-The toothpaste is available at the store in
my locality
.902 .187 .011
Rate your agreement/disagreement with the
following statement of factors which influence your
purcha...-The toothpaste is prominently placed in departmental stores
.838 .055 .259
Rate your agreement/disagreement with the
following statement of factors which influence your purcha...-I see the hoardings, posters, newspaper
ads, of popular brands and then decide.
.083 .113 .888
Rate your agreement/disagreement with the following statement of factors which influence your
purcha...-I buy that toothpaste which is endorsed by
the brand ambassador I like
.124 .594 .521
Rate your agreement/disagreement with the
following statement of factors which influence your
purcha...-I prefer a toothpaste because it offers attractive schemes and discounts
.256 .610 .286
Rate your agreement/disagreement with the following statement of factors which influence your
purcha...-I prefer a toothpaste which gives value for
money.
.108 .812 -.019
Rate your agreement/disagreement with the
following statement of factors which influence your
purcha...-The toothpaste is available at most of the places.
.930 .205 .043
Rate your agreement/disagreement with the
following statement of factors which influence your purcha...-I watch the TV advertisement and decide
the brand.
.193 .199 .857
Rate your agreement/disagreement with the following statement of factors which influence your
purcha...-I buy that toothpaste which is
recommended by dentists
-
.408 -.173 .450
Extraction Method: Principal Component Analysis.
Rotation Method: Varimax with Kaiser Normalization. a. Rotation converged in 5 iterations.
S.No Factor 1 Factor 2 Factor 3
1 available at the
store in my locality
is cheaper than the
other toothpastes
See the hoardings,
posters, newspaper ads, of popular
brands and then decide.
2 prominently
placed in
departmental stores
it offers attractive
schemes and
discounts
Watch the TV
advertisement and
decide the brand.
3 Toothpaste is
available at most of the
places.
Toothpaste which
gives value for money.
FACTOR
NAME
Place Price Promotion
Hence, the 3 factors that can explain these 10 variables are:
Factor 1: Place
Factor 2: Price
Factor 3: Promotion
Classifying the customers based on demographic
and lifestyle parameters
(Cluster Analysis)
Agglomeration Schedule
Stage Cluster
Combined
Coefficients Stage Cluster First
Appears
Next
Stage
Cluster
1
Cluster
2
Cluster 1 Cluster 2
1 33 54 .000 0 0 2
2 1 33 .000 0 1 13 3 47 80 6.000 0 0 8
4 46 70 6.000 0 0 9
5 44 51 6.000 0 0 22 6 23 45 6.000 0 0 23
7 64 65 8.000 0 0 35
8 47 58 8.000 3 0 16 9 12 46 8.000 0 4 36
10 30 34 8.000 0 0 15
11 9 17 8.000 0 0 36 12 43 56 9.000 0 0 23
13 1 49 9.000 2 0 32
14 6 35 9.000 0 0 26 15 5 30 9.000 0 10 30
16 47 53 10.333 8 0 19
17 20 57 11.000 0 0 38 18 26 36 11.000 0 0 43
19 4 47 11.750 0 16 25
20 19 81 12.000 0 0 41 21 52 62 12.000 0 0 28
22 44 50 12.000 5 0 28
23 23 43 12.500 6 12 29 24 31 82 13.000 0 0 50
25 4 21 13.400 19 0 31
26 6 13 13.500 14 0 38 27 11 37 14.000 0 0 35
28 44 52 14.333 22 21 34
29 8 23 14.750 0 23 46 30 5 63 15.000 15 0 42
31 4 61 15.833 25 0 42
32 1 39 16.250 13 0 39 33 29 69 17.000 0 0 57
34 44 60 17.000 28 0 44
35 11 64 17.500 27 7 51 36 9 12 17.667 11 9 48
37 3 41 18.000 0 0 48
38 6 20 18.833 26 17 59 39 1 83 19.000 32 0 53
40 71 75 19.000 0 0 71
41 19 42 20.000 20 0 46 42 4 5 20.393 31 30 52
43 7 26 20.500 0 18 58
44 44 48 20.833 34 0 52 45 24 40 21.000 0 0 68
46 8 19 21.933 29 41 65 47 22 28 22.000 0 0 56
48 3 9 22.400 37 36 56
49 10 79 23.000 0 0 73 50 31 77 23.500 24 0 53
51 11 55 23.500 35 0 66
52 4 44 23.792 42 44 58 53 1 31 24.278 39 50 62
54 25 76 26.000 0 0 81
55 15 74 26.000 0 0 68 56 3 22 27.143 48 47 61
57 29 78 27.500 33 0 63
58 4 7 28.037 52 43 61 59 6 38 28.200 38 0 60
60 6 16 31.167 59 0 65
61 3 4 31.381 56 58 67 62 1 59 31.444 53 0 69
63 29 72 33.333 57 0 70
64 68 73 34.000 0 0 77 65 6 8 34.375 60 46 67
66 2 11 35.200 0 51 71
67 3 6 36.451 61 65 73 68 15 24 37.500 55 45 74
International Journal of Engineering Research & Technology (IJERT)
ISSN: 2278-0181http://www.ijert.org
IJERTV6IS060373(This work is licensed under a Creative Commons Attribution 4.0 International License.)
Published by :
www.ijert.org
Vol. 6 Issue 06, June - 2017
734
69 1 18 39.100 62 0 72
70 29 67 41.500 63 0 80 71 2 71 42.333 66 40 78
72 1 66 42.818 69 0 75
73 3 10 44.189 67 49 74 74 3 15 44.399 73 68 75
75 1 3 48.358 72 74 76
76 1 14 51.317 75 0 77 77 1 68 56.578 76 64 78
78 1 2 59.981 77 71 80
79 27 32 63.000 0 0 82 80 1 29 66.195 78 70 81
81 1 25 95.848 80 54 82
82 1 27 98.920 81 79 0
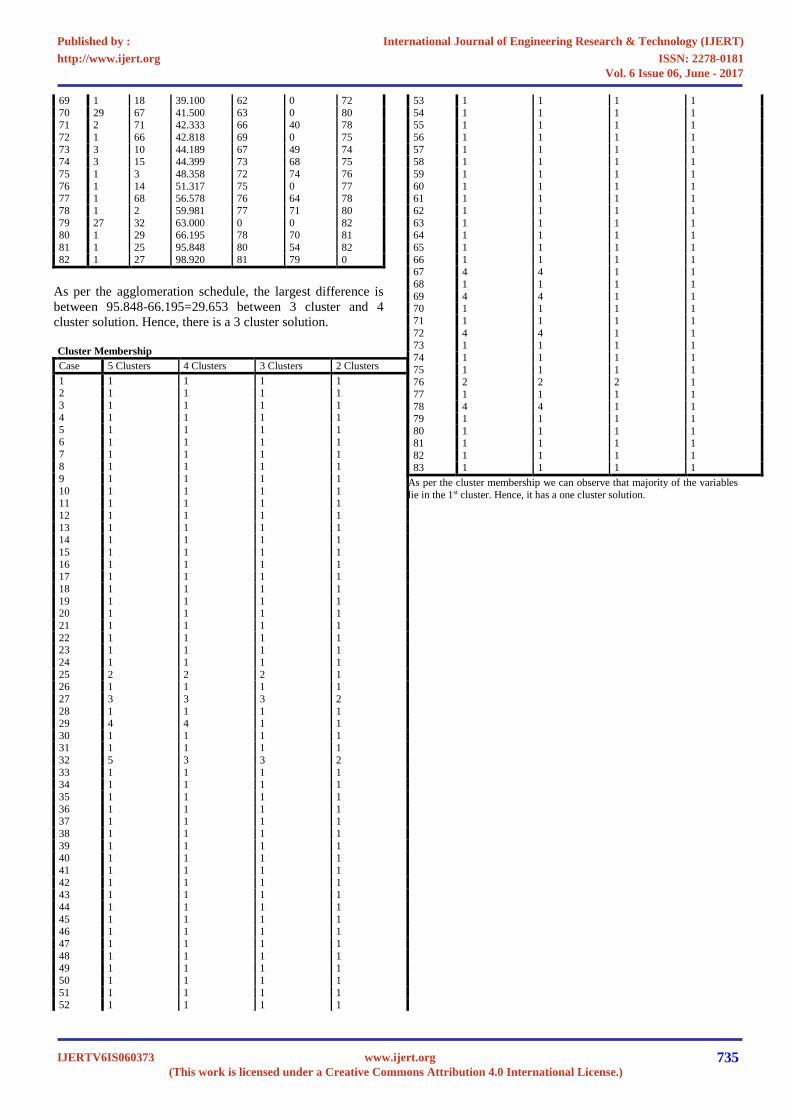
As per the agglomeration schedule, the largest difference is
between 95.848-66.195=29.653 between 3 cluster and 4
cluster solution. Hence, there is a 3 cluster solution.
Cluster Membership
Case 5 Clusters 4 Clusters 3 Clusters 2 Clusters
1 1 1 1 1 2 1 1 1 1
3 1 1 1 1
4 1 1 1 1 5 1 1 1 1
6 1 1 1 1
7 1 1 1 1 8 1 1 1 1
9 1 1 1 1
10 1 1 1 1 11 1 1 1 1
12 1 1 1 1
13 1 1 1 1 14 1 1 1 1
15 1 1 1 1
16 1 1 1 1 17 1 1 1 1
18 1 1 1 1
19 1 1 1 1 20 1 1 1 1
21 1 1 1 1
22 1 1 1 1 23 1 1 1 1
24 1 1 1 1
25 2 2 2 1 26 1 1 1 1
27 3 3 3 2
28 1 1 1 1 29 4 4 1 1
30 1 1 1 1 31 1 1 1 1
32 5 3 3 2
33 1 1 1 1 34 1 1 1 1
35 1 1 1 1
36 1 1 1 1 37 1 1 1 1
38 1 1 1 1
39 1 1 1 1 40 1 1 1 1
41 1 1 1 1
42 1 1 1 1 43 1 1 1 1
44 1 1 1 1
45 1 1 1 1 46 1 1 1 1
47 1 1 1 1
48 1 1 1 1 49 1 1 1 1
50 1 1 1 1
51 1 1 1 1 52 1 1 1 1
53 1 1 1 1
54 1 1 1 1 55 1 1 1 1
56 1 1 1 1
57 1 1 1 1 58 1 1 1 1
59 1 1 1 1
60 1 1 1 1 61 1 1 1 1
62 1 1 1 1
63 1 1 1 1 64 1 1 1 1
65 1 1 1 1
66 1 1 1 1 67 4 4 1 1
68 1 1 1 1
69 4 4 1 1 70 1 1 1 1
71 1 1 1 1
72 4 4 1 1 73 1 1 1 1
74 1 1 1 1
75 1 1 1 1 76 2 2 2 1
77 1 1 1 1
78 4 4 1 1 79 1 1 1 1
80 1 1 1 1 81 1 1 1 1
82 1 1 1 1
83 1 1 1 1
As per the cluster membership we can observe that majority of the variables
lie in the 1st cluster. Hence, it has a one cluster solution.
International Journal of Engineering Research & Technology (IJERT)
ISSN: 2278-0181http://www.ijert.org
IJERTV6IS060373(This work is licensed under a Creative Commons Attribution 4.0 International License.)
Published by :
www.ijert.org
Vol. 6 Issue 06, June - 2017
735
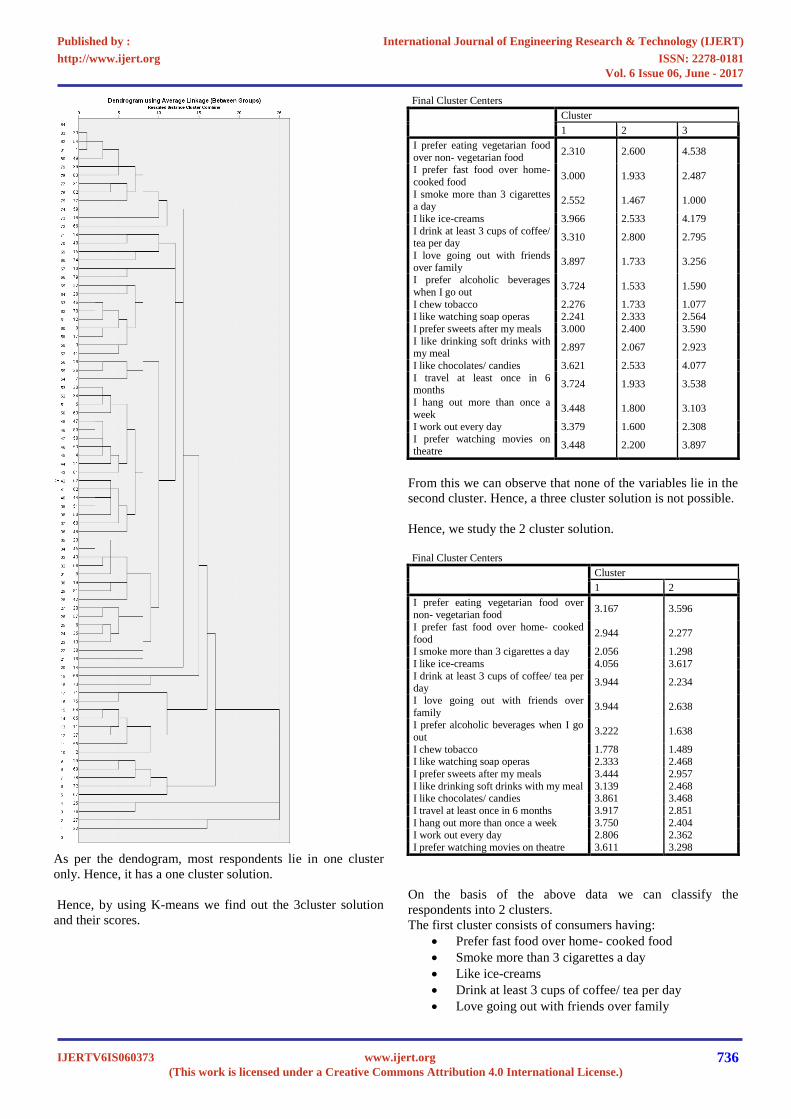
As per the dendogram, most respondents lie in one cluster
only. Hence, it has a one cluster solution.
Hence, by using K-means we find out the 3cluster solution
and their scores.
Final Cluster Centers
Cluster
1 2 3
I prefer eating vegetarian food
over non- vegetarian food 2.310 2.600 4.538
I prefer fast food over home-
cooked food 3.000 1.933 2.487
I smoke more than 3 cigarettes a day
2.552 1.467 1.000
I like ice-creams 3.966 2.533 4.179
I drink at least 3 cups of coffee/ tea per day
3.310 2.800 2.795
I love going out with friends
over family 3.897 1.733 3.256
I prefer alcoholic beverages
when I go out 3.724 1.533 1.590
I chew tobacco 2.276 1.733 1.077 I like watching soap operas 2.241 2.333 2.564
I prefer sweets after my meals 3.000 2.400 3.590
I like drinking soft drinks with my meal
2.897 2.067 2.923
I like chocolates/ candies 3.621 2.533 4.077
I travel at least once in 6 months
3.724 1.933 3.538
I hang out more than once a
week 3.448 1.800 3.103
I work out every day 3.379 1.600 2.308
I prefer watching movies on theatre
3.448 2.200 3.897
From this we can observe that none of the variables lie in the
second cluster. Hence, a three cluster solution is not possible.
Hence, we study the 2 cluster solution.
Final Cluster Centers
Cluster
1 2
I prefer eating vegetarian food over non- vegetarian food
3.167 3.596
I prefer fast food over home- cooked
food 2.944 2.277
I smoke more than 3 cigarettes a day 2.056 1.298
I like ice-creams 4.056 3.617
I drink at least 3 cups of coffee/ tea per day
3.944 2.234
I love going out with friends over
family 3.944 2.638
I prefer alcoholic beverages when I go
out 3.222 1.638
I chew tobacco 1.778 1.489 I like watching soap operas 2.333 2.468
I prefer sweets after my meals 3.444 2.957
I like drinking soft drinks with my meal 3.139 2.468 I like chocolates/ candies 3.861 3.468
I travel at least once in 6 months 3.917 2.851
I hang out more than once a week 3.750 2.404 I work out every day 2.806 2.362
I prefer watching movies on theatre 3.611 3.298
On the basis of the above data we can classify the
respondents into 2 clusters.
The first cluster consists of consumers having:
Prefer fast food over home- cooked food
Smoke more than 3 cigarettes a day
Like ice-creams
Drink at least 3 cups of coffee/ tea per day
Love going out with friends over family
International Journal of Engineering Research & Technology (IJERT)
ISSN: 2278-0181http://www.ijert.org
IJERTV6IS060373(This work is licensed under a Creative Commons Attribution 4.0 International License.)
Published by :
www.ijert.org
Vol. 6 Issue 06, June - 2017
736
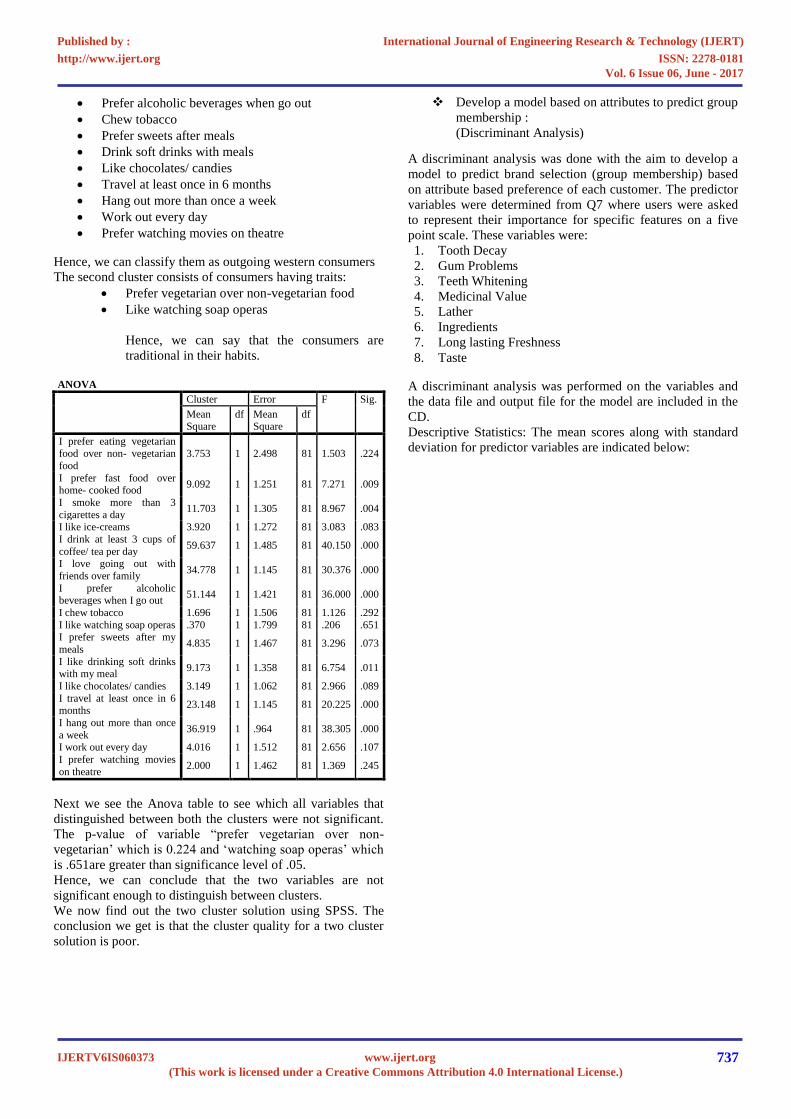
Prefer alcoholic beverages when go out
Chew tobacco
Prefer sweets after meals
Drink soft drinks with meals
Like chocolates/ candies
Travel at least once in 6 months
Hang out more than once a week
Work out every day
Prefer watching movies on theatre
Hence, we can classify them as outgoing western consumers
The second cluster consists of consumers having traits:
Prefer vegetarian over non-vegetarian food
Like watching soap operas
Hence, we can say that the consumers are
traditional in their habits.
ANOVA
Cluster Error F Sig.
Mean Square
df Mean Square
df
I prefer eating vegetarian food over non- vegetarian
food
3.753 1 2.498 81 1.503 .224
I prefer fast food over home- cooked food
9.092 1 1.251 81 7.271 .009
I smoke more than 3
cigarettes a day 11.703 1 1.305 81 8.967 .004
I like ice-creams 3.920 1 1.272 81 3.083 .083
I drink at least 3 cups of
coffee/ tea per day 59.637 1 1.485 81 40.150 .000
I love going out with
friends over family 34.778 1 1.145 81 30.376 .000
I prefer alcoholic beverages when I go out
51.144 1 1.421 81 36.000 .000
I chew tobacco 1.696 1 1.506 81 1.126 .292
I like watching soap operas .370 1 1.799 81 .206 .651 I prefer sweets after my
meals 4.835 1 1.467 81 3.296 .073
I like drinking soft drinks with my meal
9.173 1 1.358 81 6.754 .011
I like chocolates/ candies 3.149 1 1.062 81 2.966 .089
I travel at least once in 6 months
23.148 1 1.145 81 20.225 .000
I hang out more than once
a week 36.919 1 .964 81 38.305 .000
I work out every day 4.016 1 1.512 81 2.656 .107
I prefer watching movies
on theatre 2.000 1 1.462 81 1.369 .245
Next we see the Anova table to see which all variables that
distinguished between both the clusters were not significant.
The p-value of variable “prefer vegetarian over non-
vegetarian’ which is 0.224 and ‘watching soap operas’ which
is .651are greater than significance level of .05.
Hence, we can conclude that the two variables are not
significant enough to distinguish between clusters.
We now find out the two cluster solution using SPSS. The
conclusion we get is that the cluster quality for a two cluster
solution is poor.
Develop a model based on attributes to predict group
membership :
(Discriminant Analysis)
A discriminant analysis was done with the aim to develop a
model to predict brand selection (group membership) based
on attribute based preference of each customer. The predictor
variables were determined from Q7 where users were asked
to represent their importance for specific features on a five
point scale. These variables were:
1. Tooth Decay
2. Gum Problems
3. Teeth Whitening
4. Medicinal Value
5. Lather
6. Ingredients
7. Long lasting Freshness
8. Taste
A discriminant analysis was performed on the variables and
the data file and output file for the model are included in the
CD.
Descriptive Statistics: The mean scores along with standard
deviation for predictor variables are indicated below:
International Journal of Engineering Research & Technology (IJERT)
ISSN: 2278-0181http://www.ijert.org
IJERTV6IS060373(This work is licensed under a Creative Commons Attribution 4.0 International License.)
Published by :
www.ijert.org
Vol. 6 Issue 06, June - 2017
737
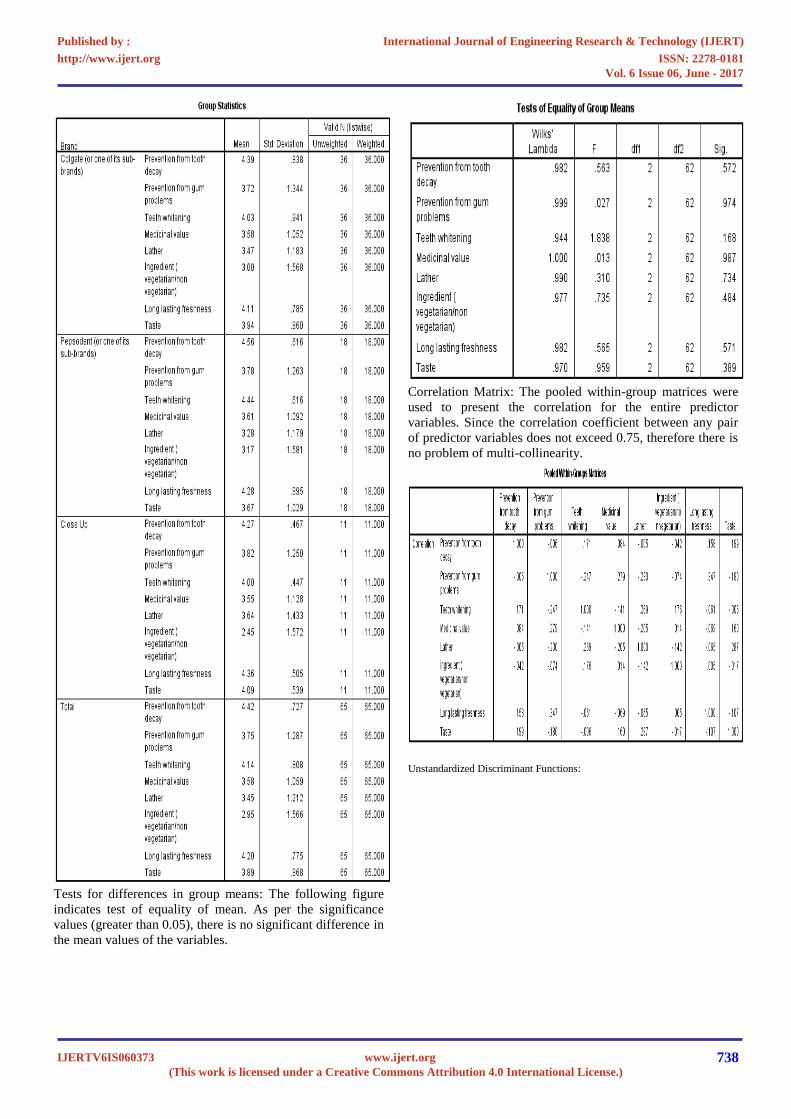
Tests for differences in group means: The following figure
indicates test of equality of mean. As per the significance
values (greater than 0.05), there is no significant difference in
the mean values of the variables.
Correlation Matrix: The pooled within-group matrices were
used to present the correlation for the entire predictor
variables. Since the correlation coefficient between any pair
of predictor variables does not exceed 0.75, therefore there is
no problem of multi-collinearity.
Unstandardized Discriminant Functions:
International Journal of Engineering Research & Technology (IJERT)
ISSN: 2278-0181http://www.ijert.org
IJERTV6IS060373(This work is licensed under a Creative Commons Attribution 4.0 International License.)
Published by :
www.ijert.org
Vol. 6 Issue 06, June - 2017
738
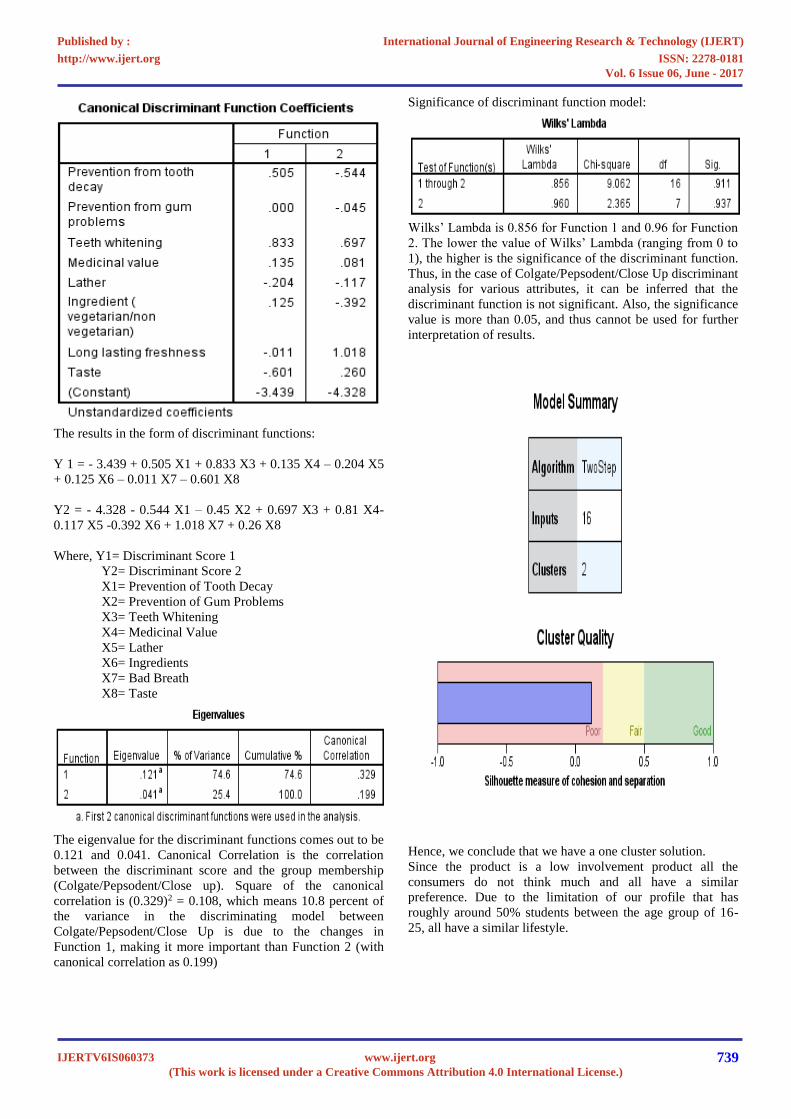
The results in the form of discriminant functions:
Y 1 = - 3.439 + 0.505 X1 + 0.833 X3 + 0.135 X4 – 0.204 X5
+ 0.125 X6 – 0.011 X7 – 0.601 X8
Y2 = - 4.328 - 0.544 X1 – 0.45 X2 + 0.697 X3 + 0.81 X4-
0.117 X5 -0.392 X6 + 1.018 X7 + 0.26 X8
Where, Y1= Discriminant Score 1
Y2= Discriminant Score 2
X1= Prevention of Tooth Decay
X2= Prevention of Gum Problems
X3= Teeth Whitening
X4= Medicinal Value
X5= Lather
X6= Ingredients
X7= Bad Breath
X8= Taste
The eigenvalue for the discriminant functions comes out to be
0.121 and 0.041. Canonical Correlation is the correlation
between the discriminant score and the group membership
(Colgate/Pepsodent/Close up). Square of the canonical
correlation is (0.329)2 = 0.108, which means 10.8 percent of
the variance in the discriminating model between
Colgate/Pepsodent/Close Up is due to the changes in
Function 1, making it more important than Function 2 (with
canonical correlation as 0.199)
Significance of discriminant function model:
Wilks’ Lambda is 0.856 for Function 1 and 0.96 for Function
2. The lower the value of Wilks’ Lambda (ranging from 0 to
1), the higher is the significance of the discriminant function.
Thus, in the case of Colgate/Pepsodent/Close Up discriminant
analysis for various attributes, it can be inferred that the
discriminant function is not significant. Also, the significance
value is more than 0.05, and thus cannot be used for further
interpretation of results.
Hence, we conclude that we have a one cluster solution.
Since the product is a low involvement product all the
consumers do not think much and all have a similar
preference. Due to the limitation of our profile that has
roughly around 50% students between the age group of 16-
25, all have a similar lifestyle.
International Journal of Engineering Research & Technology (IJERT)
ISSN: 2278-0181http://www.ijert.org
IJERTV6IS060373(This work is licensed under a Creative Commons Attribution 4.0 International License.)
Published by :
www.ijert.org
Vol. 6 Issue 06, June - 2017
739
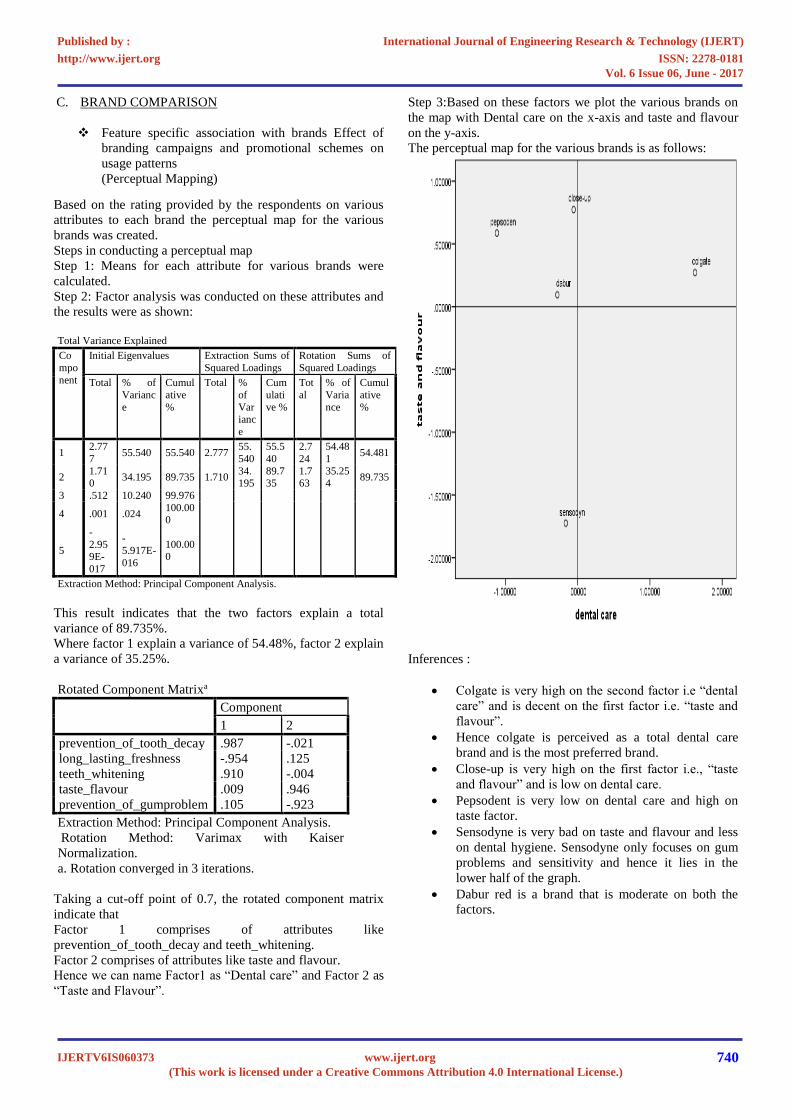
C. BRAND COMPARISON
Feature specific association with brands Effect of
branding campaigns and promotional schemes on
usage patterns
(Perceptual Mapping)
Based on the rating provided by the respondents on various
attributes to each brand the perceptual map for the various
brands was created.
Steps in conducting a perceptual map
Step 1: Means for each attribute for various brands were
calculated.
Step 2: Factor analysis was conducted on these attributes and
the results were as shown:
Total Variance Explained
Co
mpo
nent
Initial Eigenvalues Extraction Sums of
Squared Loadings
Rotation Sums of
Squared Loadings
Total % of
Varianc
e
Cumul
ative
%
Total %
of
Varianc
e
Cum
ulati
ve %
Tot
al
% of
Varia
nce
Cumul
ative
%
1 2.77
7 55.540 55.540 2.777
55.
540
55.5
40
2.7
24
54.48
1 54.481
2 1.710
34.195 89.735 1.710 34.195
89.735
1.763
35.254
89.735
3 .512 10.240 99.976
4 .001 .024 100.000
5
-
2.959E-
017
-
5.917E-
016
100.000
Extraction Method: Principal Component Analysis.
This result indicates that the two factors explain a total
variance of 89.735%.
Where factor 1 explain a variance of 54.48%, factor 2 explain
a variance of 35.25%.
Rotated Component Matrixa
Component
1 2
prevention_of_tooth_decay .987 -.021
long_lasting_freshness -.954 .125
teeth_whitening .910 -.004
taste_flavour .009 .946
prevention_of_gumproblem .105 -.923
Extraction Method: Principal Component Analysis.
Rotation Method: Varimax with Kaiser
Normalization.
a. Rotation converged in 3 iterations.
Taking a cut-off point of 0.7, the rotated component matrix
indicate that
Factor 1 comprises of attributes like
prevention_of_tooth_decay and teeth_whitening.
Factor 2 comprises of attributes like taste and flavour.
Hence we can name Factor1 as “Dental care” and Factor 2 as
“Taste and Flavour”.
Step 3:Based on these factors we plot the various brands on
the map with Dental care on the x-axis and taste and flavour
on the y-axis.
The perceptual map for the various brands is as follows:
Inferences :
Colgate is very high on the second factor i.e “dental
care” and is decent on the first factor i.e. “taste and
flavour”.
Hence colgate is perceived as a total dental care
brand and is the most preferred brand.
Close-up is very high on the first factor i.e., “taste
and flavour” and is low on dental care.
Pepsodent is very low on dental care and high on
taste factor.
Sensodyne is very bad on taste and flavour and less
on dental hygiene. Sensodyne only focuses on gum
problems and sensitivity and hence it lies in the
lower half of the graph.
Dabur red is a brand that is moderate on both the
factors.
International Journal of Engineering Research & Technology (IJERT)
ISSN: 2278-0181http://www.ijert.org
IJERTV6IS060373(This work is licensed under a Creative Commons Attribution 4.0 International License.)
Published by :
www.ijert.org
Vol. 6 Issue 06, June - 2017
740
V. MARKETING IMPLICATIONS & CONCLUSION
Colgate is the market leader, so it should try and
maintain its strategy. People for whom taste and
flavour is an important parameter are also buying
Colgate, hence Colgate should introduce new
variants depending on taste to increase its market
share.
Pepsodent with its recent ads is trying to attack the
market leader Colgate by its new variant “Pepsodent
attack”.
People, who prefer taste the most, are purchasing
Close-up but it is not perceived as a dental care
product. Hence if it wishes to improve its market
share, it has to improve on the dental care factor.
Also it needs to be beware of Pepsodent which is
trying big time to move closer to colagte.
Sensodyne is a new brand and is targeting an
entirely new problem-sensitivity. It right now lies in
the lower half. Currently if we look at its market
share it is decent keeping in mind a new brand.
People are accepting this brand and have a positive
attitude towards it. If this attitude continues it can
move up the map.
Colgate (43.4%) is the market leader, Pepsodent
trailing at 20%. Colgate’s success can be attributed
to Total Care Product and can be visualized in the
Perceptual Map.
Whiteness and Sensitivity are important parameters
also with a combined preference of 28%.
Toothpaste usage pattern indicates medium brand
loyalty.
While 45% of customers have been using the current
toothpaste for more than 5 years, 55% of
respondents indicated changing their brand in last 5
years. The reasons for changing were :
o Unavailability of the previous brand
o Free sample of the new brand.
o Attractive discounts
o New cheaper brands
Aforementioned factors could be important avenues
for a new brand looking for roadway into the market
Customers are purchasing toothpastes from super
markets (60%) and Kirana shops (58%)
These should be critical locations for the sales staff.
Product is being is a planned purchased (53%) or
through monthly ration (28.9%). Impulse while
small is still a considerable part (18%) and point of
sale merchandise will be important for new brands
45% respondents consider there Dentist’s
recommendation on toothpaste. Association with
Dental Professional Bodies can be helpful
Less than Rs 75 for 150g pack is the preferred price
range (75%)
REFERENCES [1] Jain, Vipul & Jain, Arvind Kumar, The Mantra of Branding-A Case
Analysis of Colgate Toothpaste in Dehradun, Asian Journal of Business
and Economics, Volume 2, No.2.1 Quarter I 2012 ISSN: 2231-3699 1
[2] Kavitha, Dr.T.N.R. & Vanitha, A., ‘A Study On Customer Satisfaction
Towards Toothpaste With Special Reference To Colgate’, IOSR Journal of Business and Management (IOSR-JBM) e-ISSN : 2278-
487X, p-ISSN : 2319-7668, PP 08-12 www.iosrjournals.org)
[3] Panigrahi, Anita Kumari, ‘Brand Usership Of Toothpaste Buyers: A Study On Berhampur City’, Abhinav National Monthly Refereed
Journal of Research in Commerce & Management, Volume 4, Issue 4
(April, 2015) Online ISSN-2277-1166, Published by: Abhinav Publication)
[4] Singh, Sukhbir, ‘Effectiveness of Advertisement on Toothpaste Product: A Case Study in Jhajjar District’, International Journal of
Applied Research 2017; 3(1): 403-405, ISSN Online: 2394-5869
International Journal of Engineering Research & Technology (IJERT)
ISSN: 2278-0181http://www.ijert.org
IJERTV6IS060373(This work is licensed under a Creative Commons Attribution 4.0 International License.)
Published by :
www.ijert.org
Vol. 6 Issue 06, June - 2017
741