Marketing Plan: AMP Energy
43
DEVELOPING A MARKETING PLAN FALL 2013 COLUMBIA COLLEGE CHICAGO AMP ENERGY Zanah Thirus [email protected] 11/10/13
-
date post
18-Oct-2014 -
Category
Business
-
view
713 -
download
2
description
Columbia College Chicago 2013
Transcript of Marketing Plan: AMP Energy
DEVELOPING A MARKETING PLAN
FALL 2013
COLUMBIA COLLEGE CHICAGO
AMP ENERGY
Zanah Thirus
11/10/13
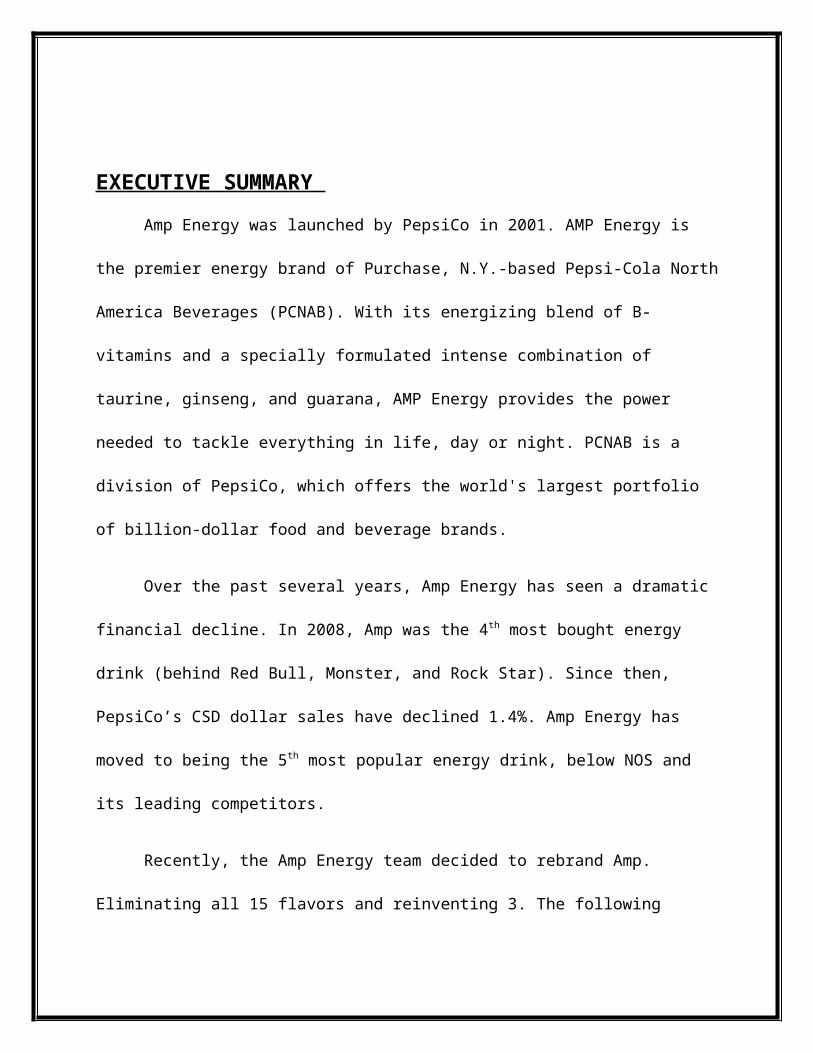
EXECUTIVE SUMMARY
Amp Energy was launched by PepsiCo in 2001. AMP Energy is the premier energy brand
of Purchase, N.Y.-based Pepsi-Cola North America Beverages (PCNAB). With its energizing
blend of B-vitamins and a specially formulated intense combination of taurine, ginseng, and
guarana, AMP Energy provides the power needed to tackle everything in life, day or night.
PCNAB is a division of PepsiCo, which offers the world's largest portfolio of billion-dollar food
and beverage brands.
Over the past several years, Amp Energy has seen a dramatic financial decline. In 2008,
Amp was the 4th most bought energy drink (behind Red Bull, Monster, and Rock Star). Since
then, PepsiCo’s CSD dollar sales have declined 1.4%. Amp Energy has moved to being the 5th
most popular energy drink, below NOS and its leading competitors.
Recently, the Amp Energy team decided to rebrand Amp. Eliminating all 15 flavors and
reinventing 3. The following marketing plan contains a market summary, competitive overview,
demographic summary, a financial analysis, and a media plan for the newly revamped brand
strategy.
The purpose of the marketing plan is to restructure Amp’s current marketing strategy to
target its current primary consumer base (families and young professionals). Demographic charts
and competitive overview charts are from Spectra and MRI.
TABLE OF CONTENTS
Table of Contents p.1
Company Overview p.2
Market Summary p. 4
Competitive Analysis p.7- AMP p.7- Red Bull p.9- Monster p.11- Rock Star p.13
Competitive Analysis Summary p. 15
Channel Summary p.16
GAP Analysis p.18
SWOT Analysis p.20
Cultural Issues p. 22
Market Strategy & Programs p.23-34- Marketing objectives- Financial Objectives- Target markets & Target Audiences - Positioning Strategy - Marketing Budget and Calendar
Bibliography p.35
History of Amp: A PepsiCo Brand
Amp Energy is the energy drink version of Mountain Dew, created by PepsiCo, and
released in 2001. AMP Energy is the premier energy brand of Purchase, N.Y.-based Pepsi-Cola
North America Beverages (PCNAB). With its energizing blend of B-vitamins and a specially
formulated intense combination of taurine, ginseng, and guarana, AMP Energy provides the
power needed to tackle everything in life, day or night. PCNAB is a division of PepsiCo, which
offers the world's largest portfolio of billion-dollar food and beverage brands
Amp Energy was launched by PepsiCo in 2001. PepsiCo is one of the world’s leading
food and beverage companies with over 65 billion in net revenue in 2012. Pepsi Co has a global
portfolio of diverse and beloved brands including Pepsi, Gatorade, Lays, Amp, and Quaker.
Pepsi Co employs over 250,000 employees in 200 countries across the globe, and the reported
revenue growth in the beverage division was 4.5% in 2012. According to Pepsi Co’s website,
80% of the current executive team was promoted from within. The company headquarters is
located in Purchase, NY. The current CEO is Indra Nooyi. Pepsi Co Brands are organized into
the four global business units:
Pepsi Co American Foods
Pepsi Co American Beverages (Including Amp)
Pepsi Co Europe
Pepsi Co Asia, Middle East, and Africa (AMEA)
According to Pepsi Co’s 2012 annual report, the company objectives include:
Building and retaining top talent
To focus on driving cost savings and other productivity enhancements derived from our
complimentary food and beverage portfolio.
Reinforce our existing value drivers (refocusing efforts on most popular global brands).
PepsiCo’s original strategy for Amp was to position it to compete with leading energy drink
brands like Red Bull and Monster.
PepsiCo repositions AMP:
In 2008, AMP was America’s 4th most popular Energy drink (behind Red Bull and
Monster). That year, PepsiCo decided to “amp up” Amp’s media budget and positioning
strategy. PepsiCo launched a massive campaign starring Nascar driver dale Earnheardt Jr., three
new flavors, a high profile summer promotion, and a slew of packaging variations. This was all
in an attempt to increase Amp’s presence in the Energy Drink market, and to compete with the
leading brands, Red Bull and Monster.
Since the major campaign in 2008, Sales for Amp have taken a major drop. In the last
year, PepsiCo’s CSD dollar sales have declined 1.4% amounting to “The Worst performance of
PepsiCo in over a year”, according to Wells Fargo’s senior analyst, Bonnie Herzog.
Amp is now sitting below Rockstar, NOS, and Starbucks Double Shot. Those three
brands are sitting below Red Bull, and Monster. Something had to be done. This year, PepsiCo
decided to rebrand and reposition Amp Energy. PepsiCo eliminated all 15 of Amps categories
and created a product line of 3 with all new formulations and designs.
“Our New line of innovative products provides a kick of energy to match anything the day brings. So tell your Monday morning to bring it on, your Friday night to wait up for you, and everything else in between to be ready. You’re on your way”- Amp Energy Team
I. MARKET SUMMARY
According to www.energyfiend.com, Energy Drinks are a billion dollar industry. Red Bull sold US$3.4
billion dollars of energy drink product in the 52 weeks prior to July 2013. Monster sold US$3.1 billion
worth. A huge part of energy drink popularity is in the sponsorship efforts, with top brands spending large
sums of money to achieve brand placement. Several energy drinks have definitely been lifting
their marketing efforts and it’s paying off with their recent entrance into the top 15 energy drinks ranking.
The leading energy drinks are Red Bull and Monster. Red Bull sold US$3.4 BILLION
dollars of energy drink product in the 52 weeks prior to July 2013. Monster sold US$3.1
BILLION worth. The third leading energy drink is Rock Star. NOS is in fourth place, and
AMP Energy is in 5th place. The energy drink market continues to grow even in light
of the tough economy and increased health scrutiny . Soda sales have been declining
steadily over the same period, while energy drink sales have been booming.
Despite recent FDA scrutiny regarding the safety of these beverages, 2013 energy drink sales are
up 6.7% over last year in the USA alone.
FIG. 1
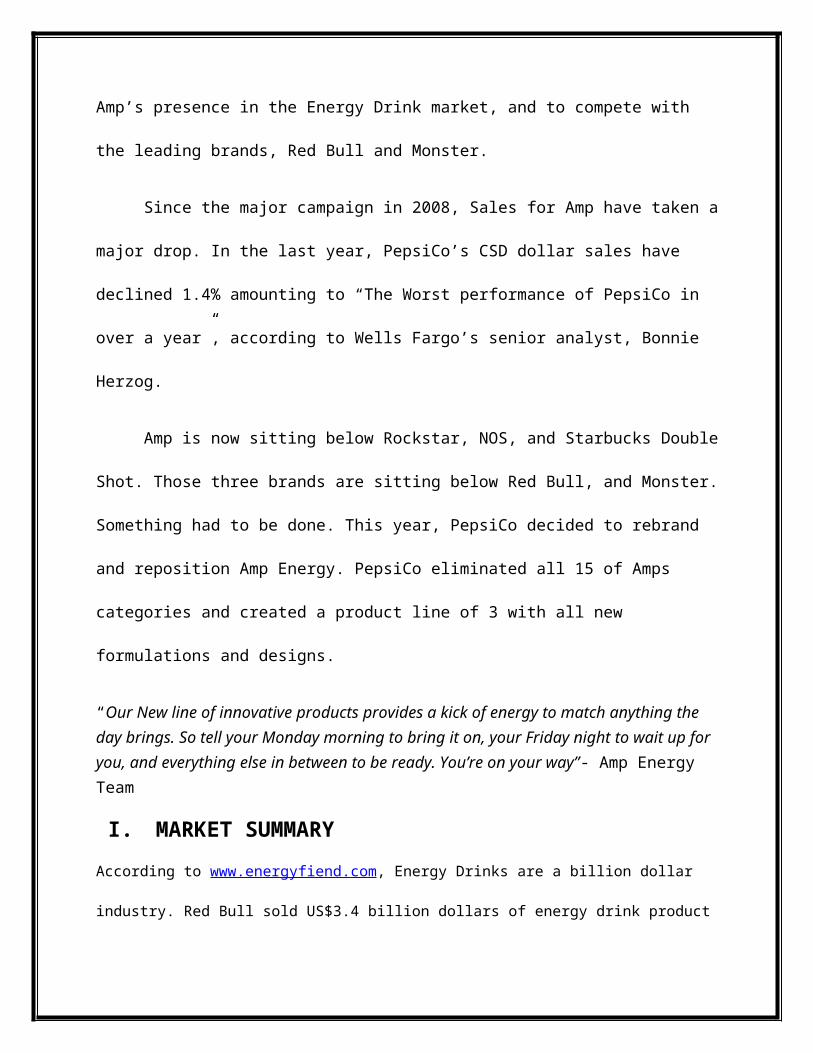
CARBONATED BEVERAGE (INCLUDING ENERGY DRINKS) DEMOGRAPHIC
SUMMARY – 2013 Spectra Reports
The following four charts are 2013 consumer demographic from spectra. The charts show index
numbers and total volume among the heaviest carbonated beverage consumers. Charts include
data on race of head of household, household structure, household demographics, occupation of
head of household and average household income.
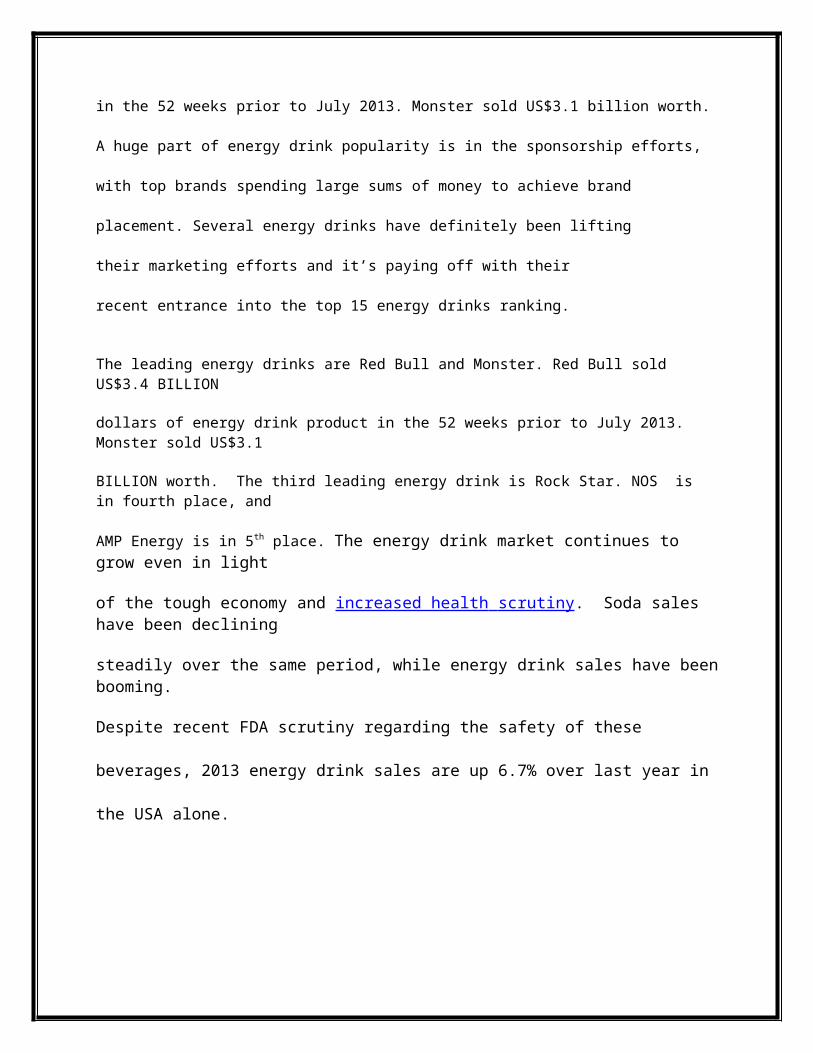
FIG. 2
Total Consumption Index
4% 17818% 16525% 15820% 15127% 1461% 145
11% 14415% 1414% 1409% 138
Demographic SkewsMale Head Only with Children5+ Person HouseholdsOldest Child 12 - 17Not a High School GraduatePresence of Only Children 6 - 17Farming, Fishing & Forestry OccupationsFemale Head Only with ChildrenPrecision Production, Craft & Repair OccupationsStruggling Rural MixPresence of Both Children Under 6 and 6 - 17 FIG. 3
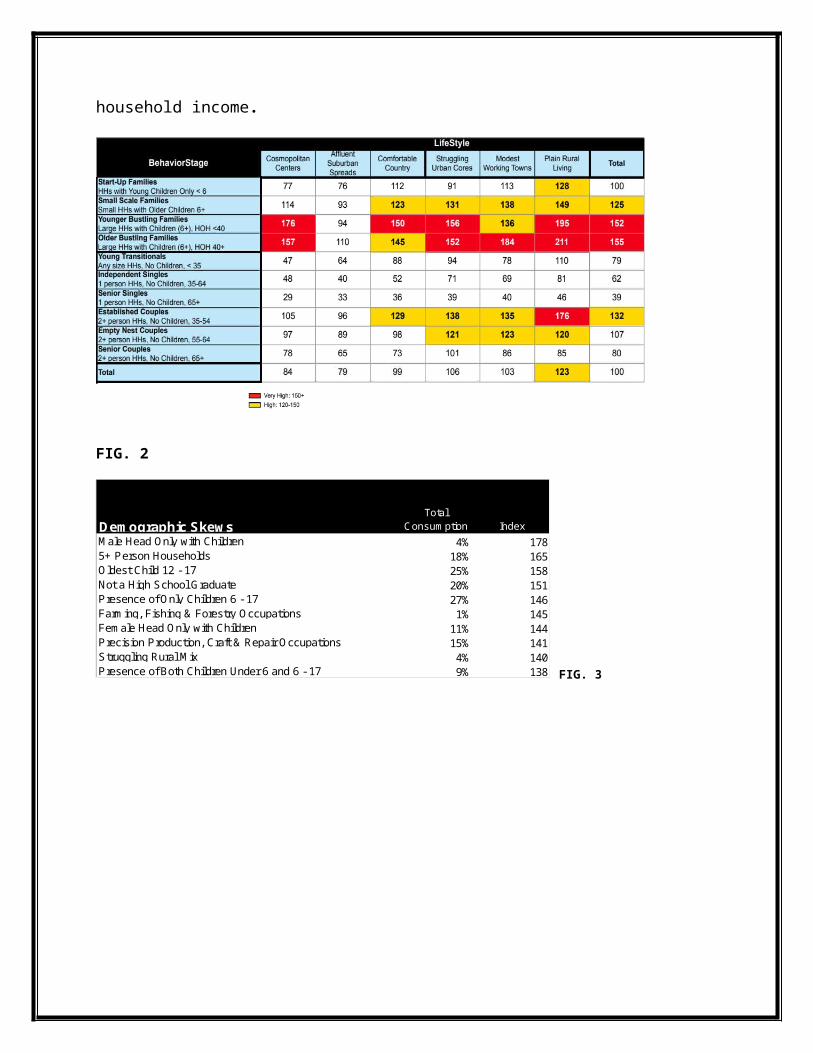
Race of Head of Household-Total Consumption Index
Source: Homescan Product Library 2013 Sep (Spectra)
0
50
100
150
White Black Hispanic Asian Other
FIG 4
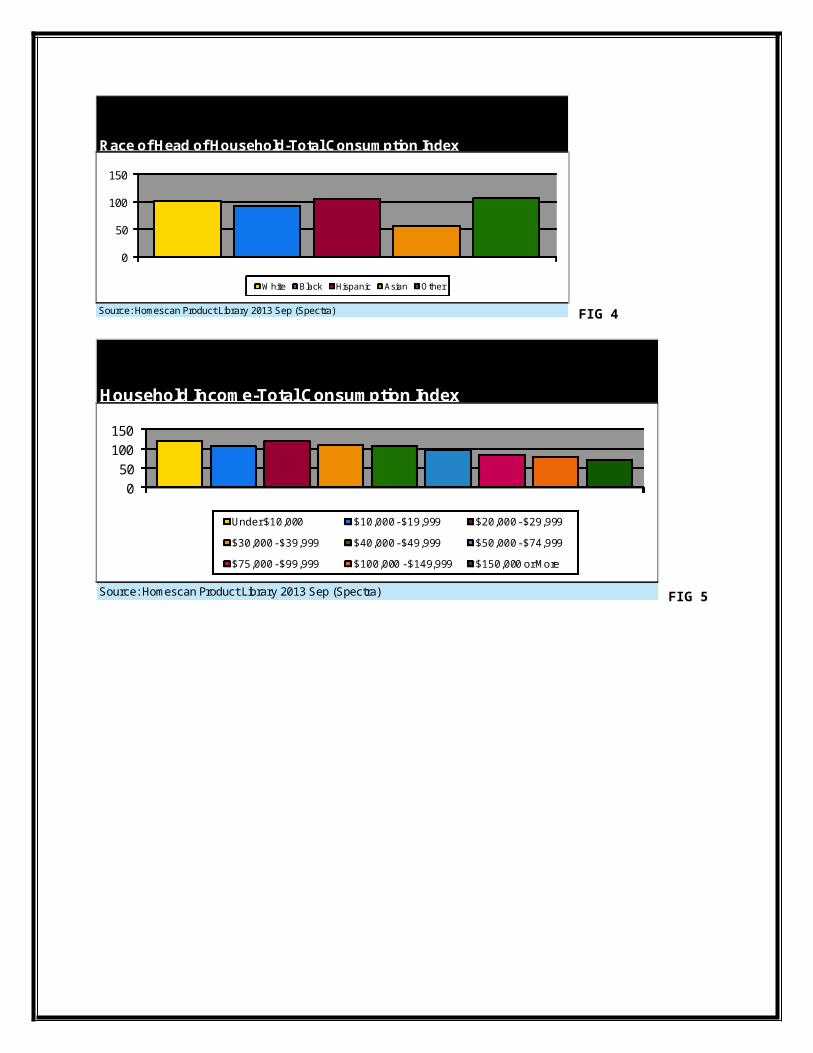
Household Income-Total Consumption Index
Source: Homescan Product Library 2013 Sep (Spectra)
0
50
100
150
Under $10,000 $10,000 - $19,999 $20,000 - $29,999
$30,000 - $39,999 $40,000 - $49,999 $50,000 - $74,999
$75,000 - $99,999 $100,000 - $149,999 $150,000 or More
FIG 5

II. Competitive Analysis- AMP/ RED BULL/ MONSTER/ ROCKSTAR
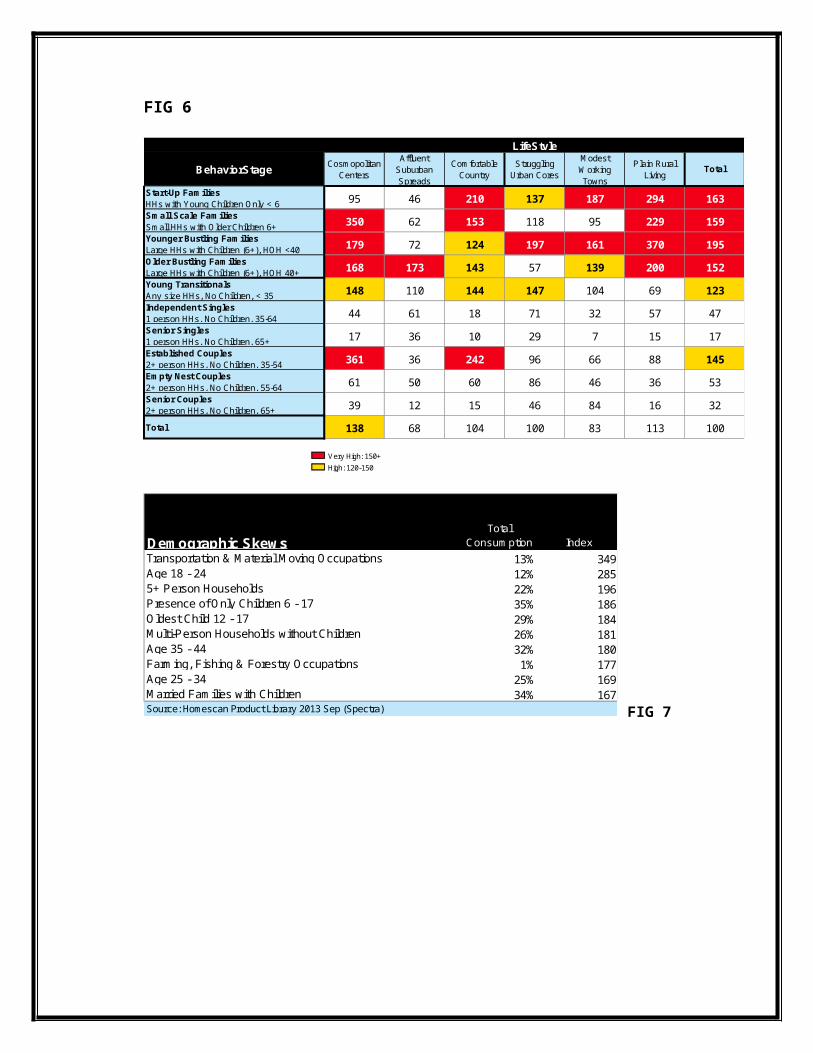
A. AMP ENERGY
The following four charts are 2013 consumer demographic from spectra. The charts show index
numbers and total volume among the heaviest AMP ENERGY consumers . Charts include data
on race of head of household, household structure, household demographics, occupation of head
of household and average household income.
FIG 6
Very High: 150+
High: 120-150
Affluent Suburban Spreads
Cosmopolitan Centers
Young TransitionalsAny size HHs, No Children, < 35
Older Bustling FamiliesLarge HHs with Children (6+), HOH 40+
Younger Bustling FamiliesLarge HHs with Children (6+), HOH <40
Small Scale FamiliesSmall HHs with Older Children 6+
Start-Up FamiliesHHs with Young Children Only < 6
TotalPlain Rural
Living
Modest Working Towns
Struggling Urban Cores
Comfortable Country
Total
Senior Couples2+ person HHs, No Children, 65+
Empty Nest Couples2+ person HHs, No Children, 55-64
Established Couples2+ person HHs, No Children, 35-54
Senior Singles1 person HHs, No Children, 65+
Independent Singles1 person HHs, No Children, 35-64
145
53
32
100138 68 104 100 83 113
159
195
152
123
47
17
39 12 15 46 84 16
61 50 60 86 46 36
361 36 242 96 66 88
17 36 10 29 7 15
44 61 18 71 32 57
148 110 144 147 104 69
168 173 143 57 139 200
179 72 124 197 161 370
350 62 153 118 95 229
LifeStyle
BehaviorStage
95 46 210 137 187 294 163
Total Consumption Index
13% 34912% 28522% 19635% 18629% 18426% 18132% 1801% 177
25% 16934% 167Married Families with Children
Source: Homescan Product Library 2013 Sep (Spectra)
Demographic SkewsTransportation & Material Moving OccupationsAge 18 - 245+ Person HouseholdsPresence of Only Children 6 - 17Oldest Child 12 - 17Multi-Person Households without ChildrenAge 35 - 44Farming, Fishing & Forestry OccupationsAge 25 - 34
FIG 7
FIG 8
Household Income-Total Consumption Index
Source: Homescan Product Library 2013 Sep (Spectra)
0
100
200
Under $10,000 $10,000 - $19,999 $20,000 - $29,999
$30,000 - $39,999 $40,000 - $49,999 $50,000 - $74,999
$75,000 - $99,999 $100,000 - $149,999 $150,000 or More
FIG 9
Race of Head of Household-Total Consumption Index
Source: Homescan Product Library 2013 Sep (Spectra)
0
50
100
150
White Black Hispanic Asian Other
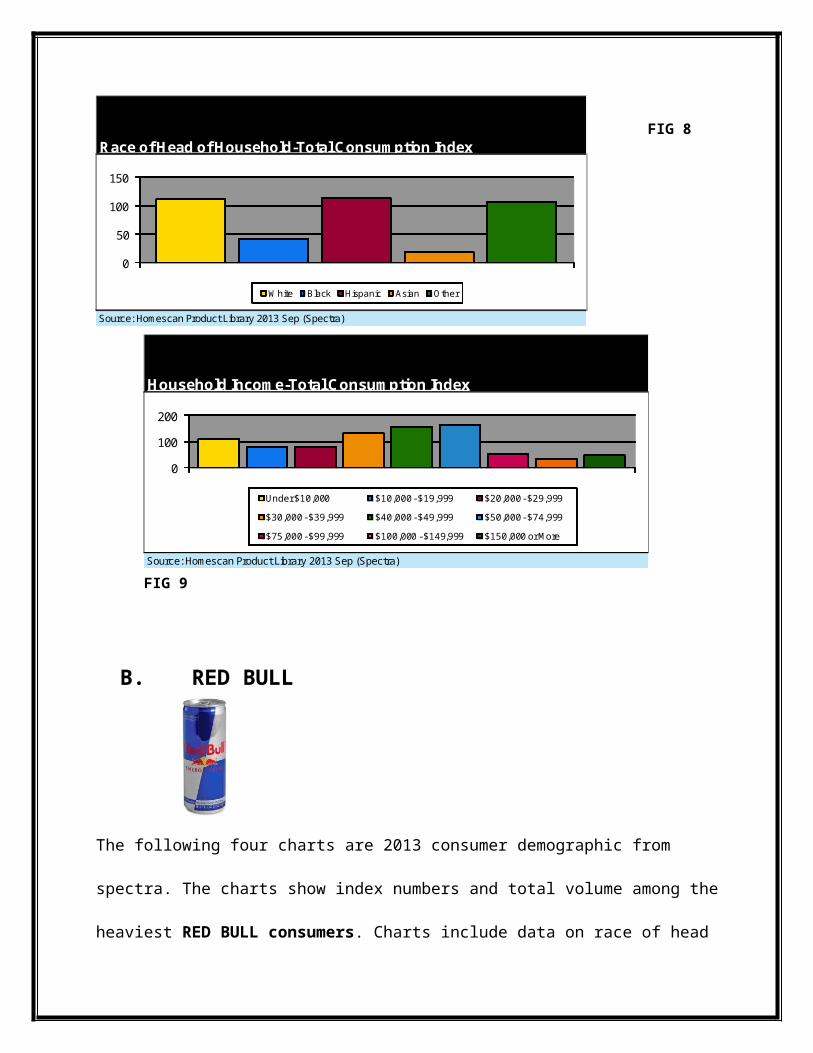
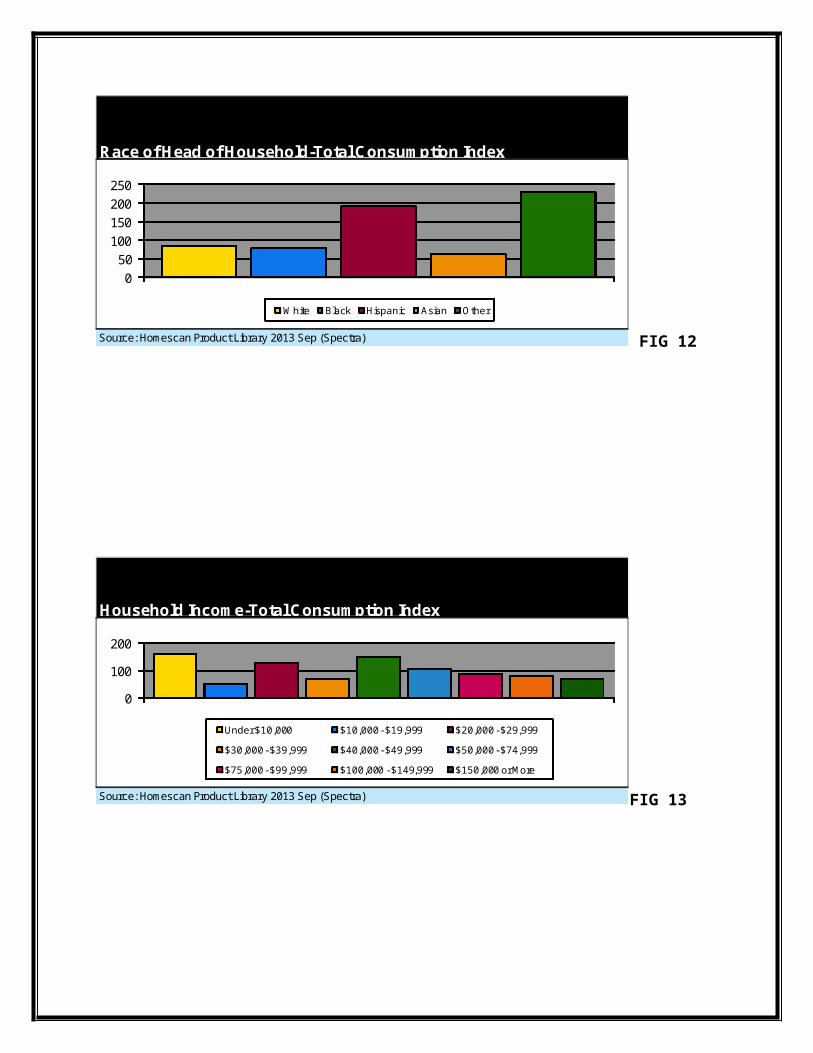
B. RED BULL
The following four charts are 2013 consumer demographic from spectra. The charts show index
numbers and total volume among the heaviest RED BULL consumers. Charts include data on
race of head of household, household structure, household demographics, occupation of head of
household and average household income.
FIG 10
Total Consumption Index
18% 2696% 2595% 231
23% 21532% 2128% 205
23% 20318% 19524% 19214% 192
Transportation & Material Moving Occupations5+ Person HouseholdsOldest Child 6 - 11HispanicsOldest Child Under 6
Demographic SkewsPresence of Both Children Under 6 and 6 - 17Male Head Only with ChildrenOther RacesPrecision Production, Craft & Repair OccupationsAge 25 - 34
FIG 11

Race of Head of Household-Total Consumption Index
Source: Homescan Product Library 2013 Sep (Spectra)
0
50
100
150
200
250
White Black Hispanic Asian Other
FIG 12
Household Income-Total Consumption Index
Source: Homescan Product Library 2013 Sep (Spectra)
0
100
200
Under $10,000 $10,000 - $19,999 $20,000 - $29,999
$30,000 - $39,999 $40,000 - $49,999 $50,000 - $74,999
$75,000 - $99,999 $100,000 - $149,999 $150,000 or More
FIG 13
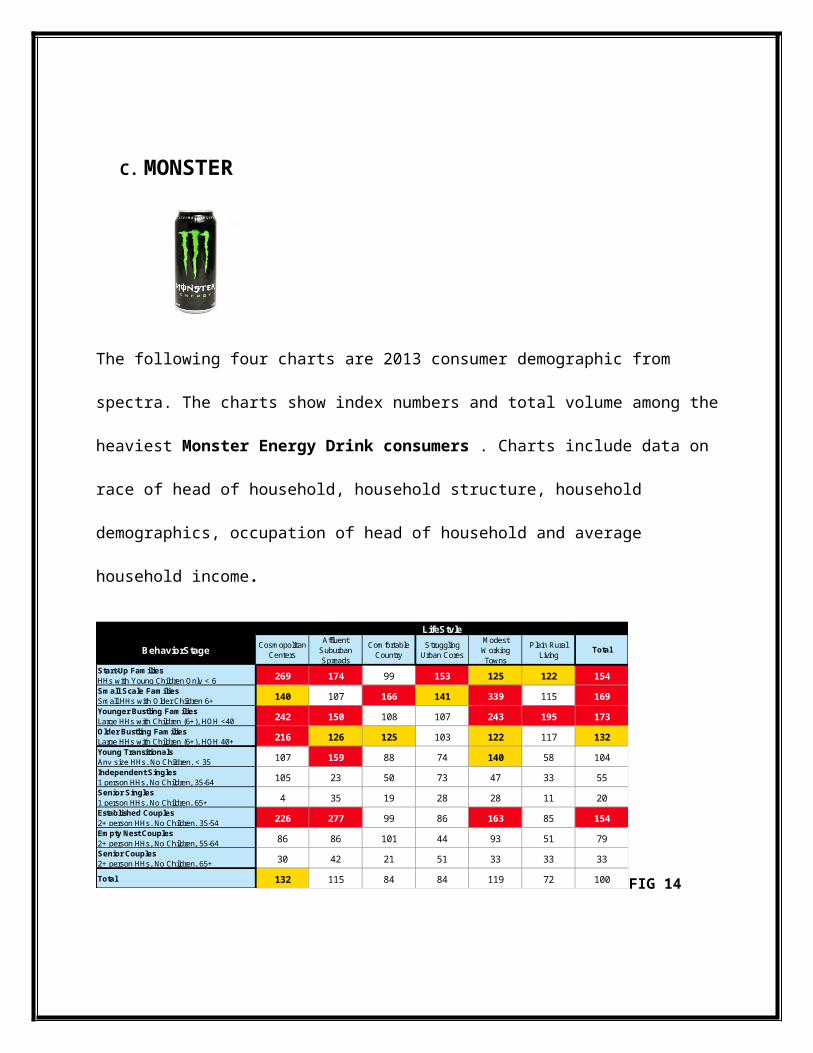
C. MONSTER
The following four charts are 2013 consumer demographic from spectra. The charts show index
numbers and total volume among the heaviest Monster Energy Drink consumers . Charts
include data on race of head of household, household structure, household demographics,
occupation of head of household and average household income.
Affluent Suburban Spreads
Cosmopolitan Centers
Young TransitionalsAny size HHs, No Children, < 35
Older Bustling FamiliesLarge HHs with Children (6+), HOH 40+
Younger Bustling FamiliesLarge HHs with Children (6+), HOH <40
Small Scale FamiliesSmall HHs with Older Children 6+
Start-Up FamiliesHHs with Young Children Only < 6
TotalPlain Rural
Living
Modest Working Towns
Struggling Urban Cores
Comfortable Country
Total
Senior Couples2+ person HHs, No Children, 65+
Empty Nest Couples2+ person HHs, No Children, 55-64
Established Couples2+ person HHs, No Children, 35-54
Senior Singles1 person HHs, No Children, 65+
Independent Singles1 person HHs, No Children, 35-64
154
79
33
100132 115 84 84 119 72
169
173
132
104
55
20
30 42 21 51 33 33
86 86 101 44 93 51
226 277 99 86 163 85
4 35 19 28 28 11
105 23 50 73 47 33
107 159 88 74 140 58
216 126 125 103 122 117
242 150 108 107 243 195
140 107 166 141 339 115
LifeStyle
BehaviorStage
269 174 99 153 125 122 154
FIG 14
Total Consumption Index
4% 19814% 1957% 186
27% 1726% 171
32% 17013% 16913% 16711% 16622% 165
Presence of Only Children Under 6
Male Head Only with ChildrenFemale Head Only with ChildrenTransportation & Material Moving OccupationsOldest Child 12 - 17Striving Small City LivingPresence of Only Children 6 - 17
Oldest Child Under 6Administrative Support Occupations4 Person Households
Demographic Skews
FIG 15
Race of Head of Household-Total Consumption Index
0
50
100
150
200
White Black Hispanic Asian Other
FIG 16
Household Income-Total Consumption Index
0
100
200
Under $10,000 $10,000 - $19,999 $20,000 - $29,999
$30,000 - $39,999 $40,000 - $49,999 $50,000 - $74,999
$75,000 - $99,999 $100,000 - $149,999 $150,000 or More
FIG 17

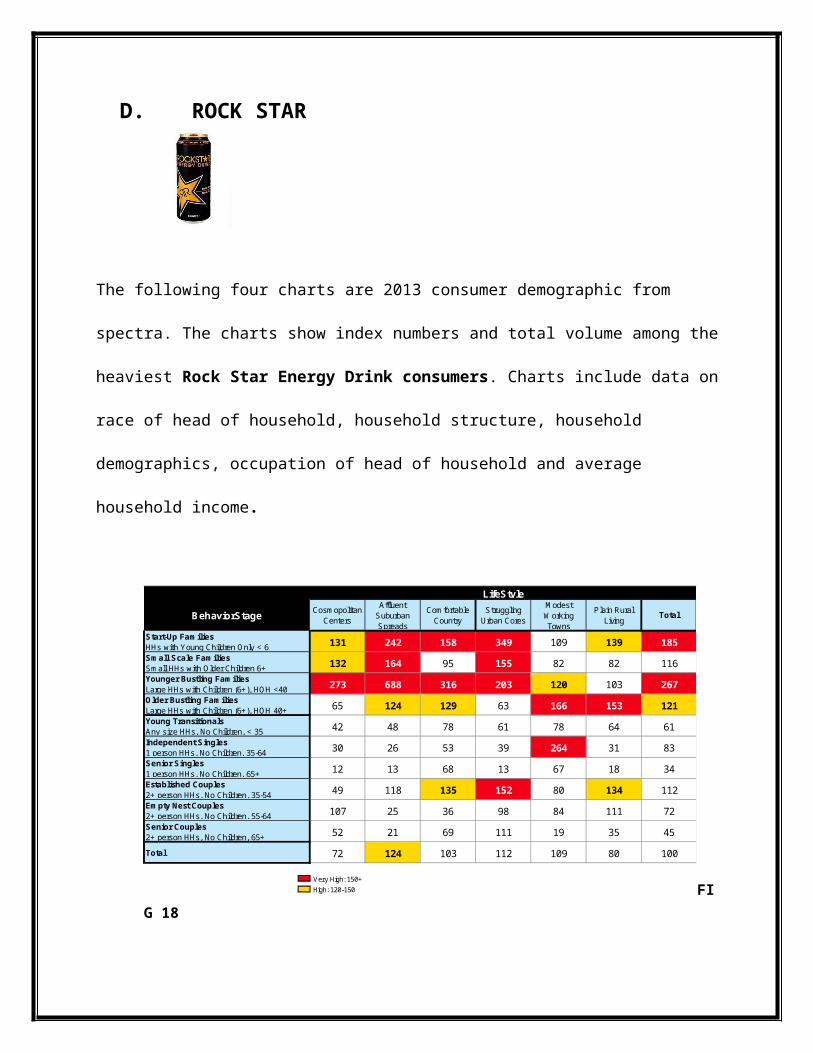
D. ROCK STAR
The following four charts are 2013 consumer demographic from spectra. The charts show index
numbers and total volume among the heaviest Rock Star Energy Drink consumers. Charts
include data on race of head of household, household structure, household demographics,
occupation of head of household and average household income.
Very High: 150+
High: 120-150
Affluent Suburban Spreads
Cosmopolitan Centers
Young TransitionalsAny size HHs, No Children, < 35
Older Bustling FamiliesLarge HHs with Children (6+), HOH 40+
Younger Bustling FamiliesLarge HHs with Children (6+), HOH <40
Small Scale FamiliesSmall HHs with Older Children 6+
Start-Up FamiliesHHs with Young Children Only < 6
TotalPlain Rural
Living
Modest Working Towns
Struggling Urban Cores
Comfortable Country
Total
Senior Couples2+ person HHs, No Children, 65+
Empty Nest Couples2+ person HHs, No Children, 55-64
Established Couples2+ person HHs, No Children, 35-54
Senior Singles1 person HHs, No Children, 65+
Independent Singles1 person HHs, No Children, 35-64
112
72
45
10072 124 103 112 109 80
116
267
121
61
83
34
52 21 69 111 19 35
107 25 36 98 84 111
49 118 135 152 80 134
12 13 68 13 67 18
30 26 53 39 264 31
42 48 78 61 78 64
65 124 129 63 166 153
273 688 316 203 120 103
132 164 95 155 82 82
LifeStyle
BehaviorStage
131 242 158 349 109 139 185
FIG 18
Total Consumption Index
4% 19814% 1957% 186
27% 1726% 171
32% 17013% 16913% 16711% 16622% 165
Presence of Only Children Under 6
Male Head Only with ChildrenFemale Head Only with ChildrenTransportation & Material Moving OccupationsOldest Child 12 - 17Striving Small City LivingPresence of Only Children 6 - 17
Oldest Child Under 6Administrative Support Occupations4 Person Households
Demographic Skews
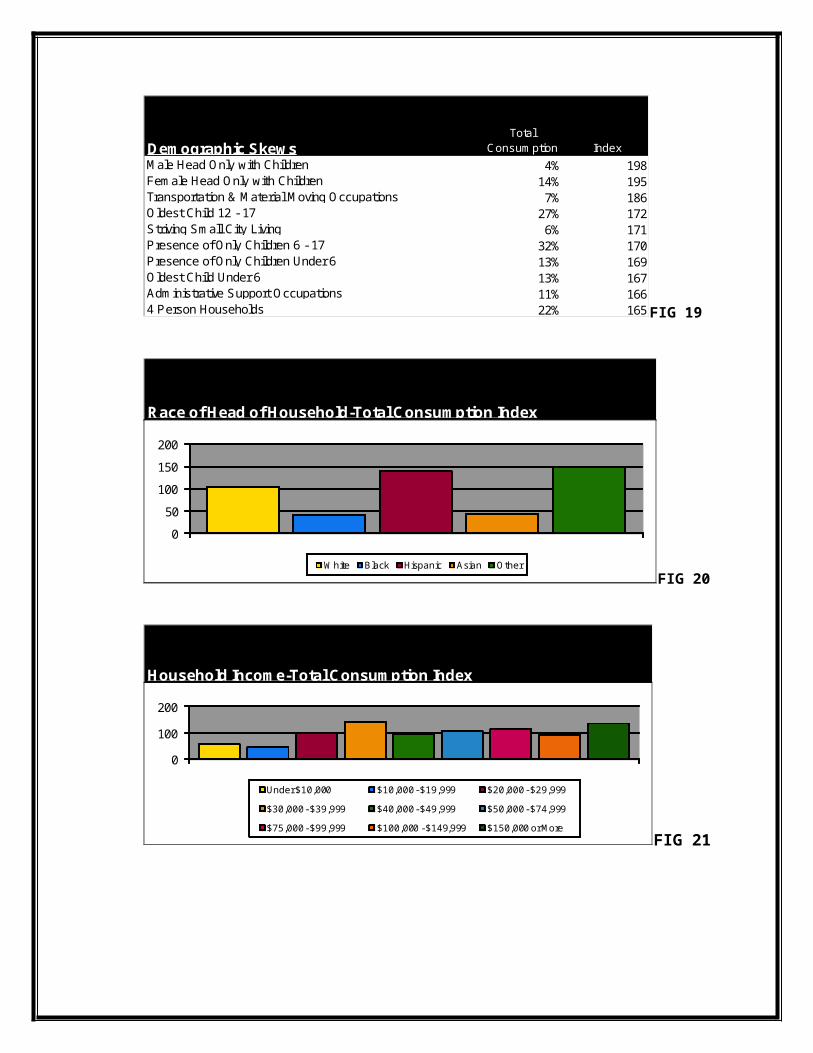
FIG 19
Race of Head of Household-Total Consumption Index
0
50
100
150
200
White Black Hispanic Asian Other
FIG 20
Household Income-Total Consumption Index
0
100
200
Under $10,000 $10,000 - $19,999 $20,000 - $29,999
$30,000 - $39,999 $40,000 - $49,999 $50,000 - $74,999
$75,000 - $99,999 $100,000 - $149,999 $150,000 or More
FIG 21
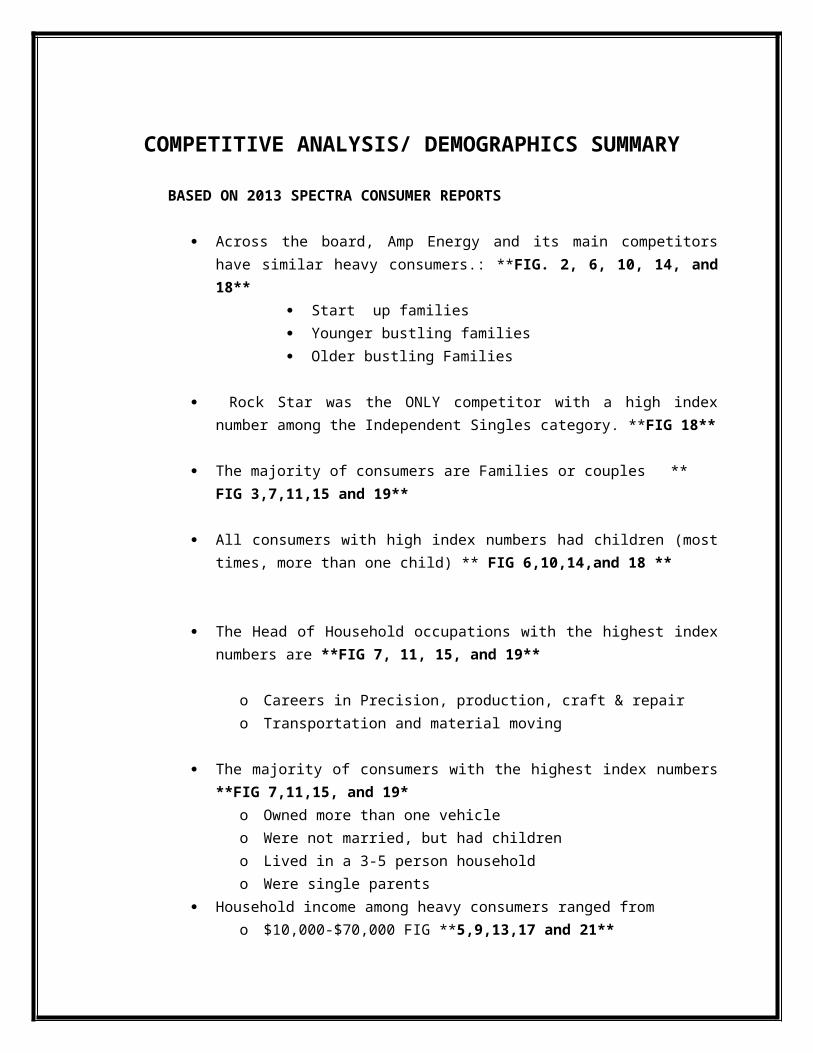
COMPETITIVE ANALYSIS/ DEMOGRAPHICS SUMMARY
BASED ON 2013 SPECTRA CONSUMER REPORTS
Across the board, Amp Energy and its main competitors have similar heavy consumers.: **FIG. 2, 6, 10, 14, and 18**
Start up families Younger bustling families Older bustling Families
Rock Star was the ONLY competitor with a high index number among the Independent Singles category. **FIG 18**
The majority of consumers are Families or couples ** FIG 3,7,11,15 and 19**
All consumers with high index numbers had children (most times, more than one child) ** FIG 6,10,14,and 18 **
The Head of Household occupations with the highest index numbers are **FIG 7, 11, 15, and 19**
o Careers in Precision, production, craft & repair
o Transportation and material moving
The majority of consumers with the highest index numbers **FIG 7,11,15, and 19*o Owned more than one vehicle
o Were not married, but had children
o Lived in a 3-5 person household
o Were single parents
Household income among heavy consumers ranged from o $10,000-$70,000 FIG **5,9,13,17 and 21**
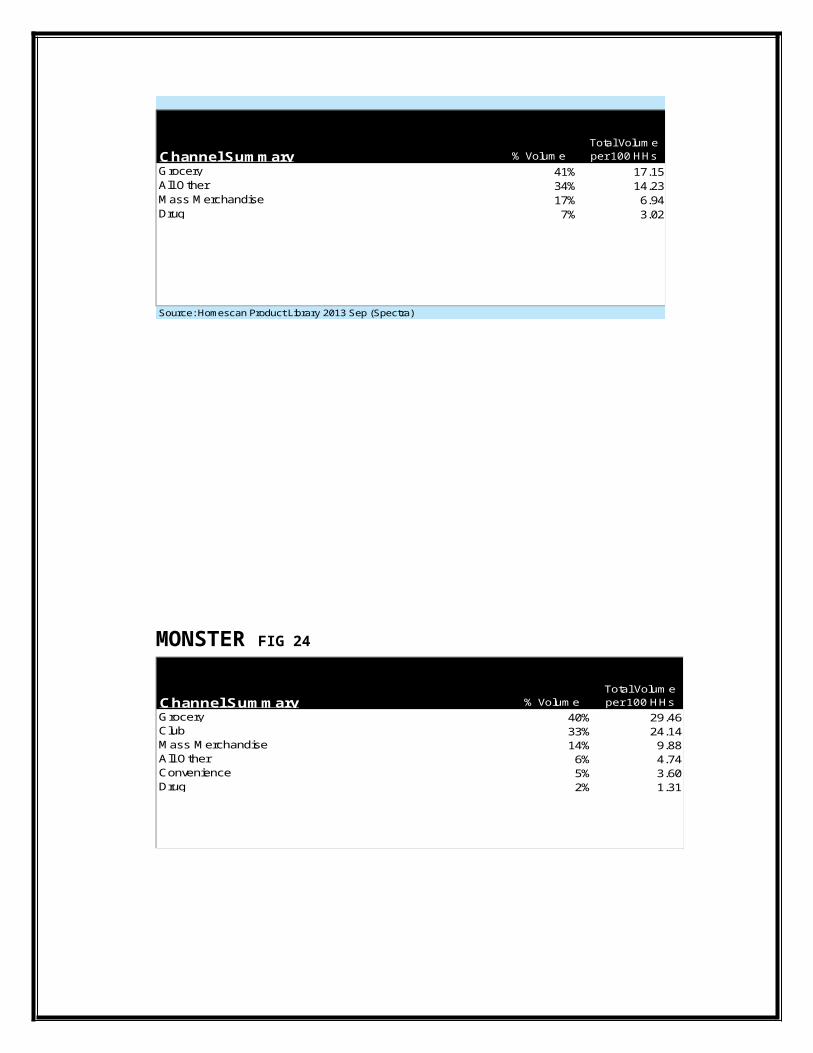
Majority of consumers purchased energy drinks from grocery stores (based on channel summary) ** FIG 22-25
Majority of consumers are Hispanic or Mixed races.

III. Channel Summary
AMP FIG 22
% VolumeTotal Volume per 100 HHs
59% 7.2119% 2.2717% 2.045% 0.64
Channel SummaryGroceryMass MerchandiseAll OtherDrug
RED BULL FIG 23
% VolumeTotal Volume per 100 HHs
41% 17.1534% 14.2317% 6.947% 3.02
Channel SummaryGroceryAll OtherMass MerchandiseDrug
Source: Homescan Product Library 2013 Sep (Spectra)
MONSTER FIG 24
% VolumeTotal Volume per 100 HHs
40% 29.4633% 24.1414% 9.886% 4.745% 3.602% 1.31
Channel SummaryGroceryClubMass MerchandiseAll OtherConvenienceDrug
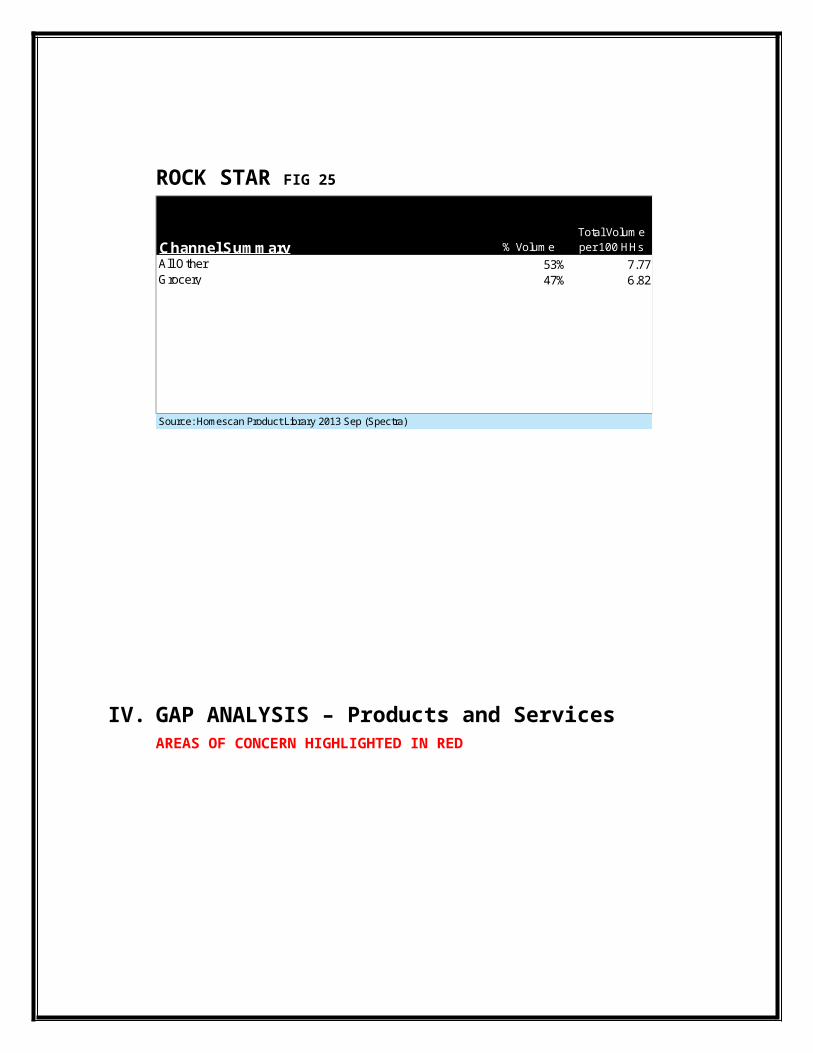
ROCK STAR FIG 25
% VolumeTotal Volume per 100 HHs
53% 7.7747% 6.82
Channel SummaryAll OtherGrocery
Source: Homescan Product Library 2013 Sep (Spectra)
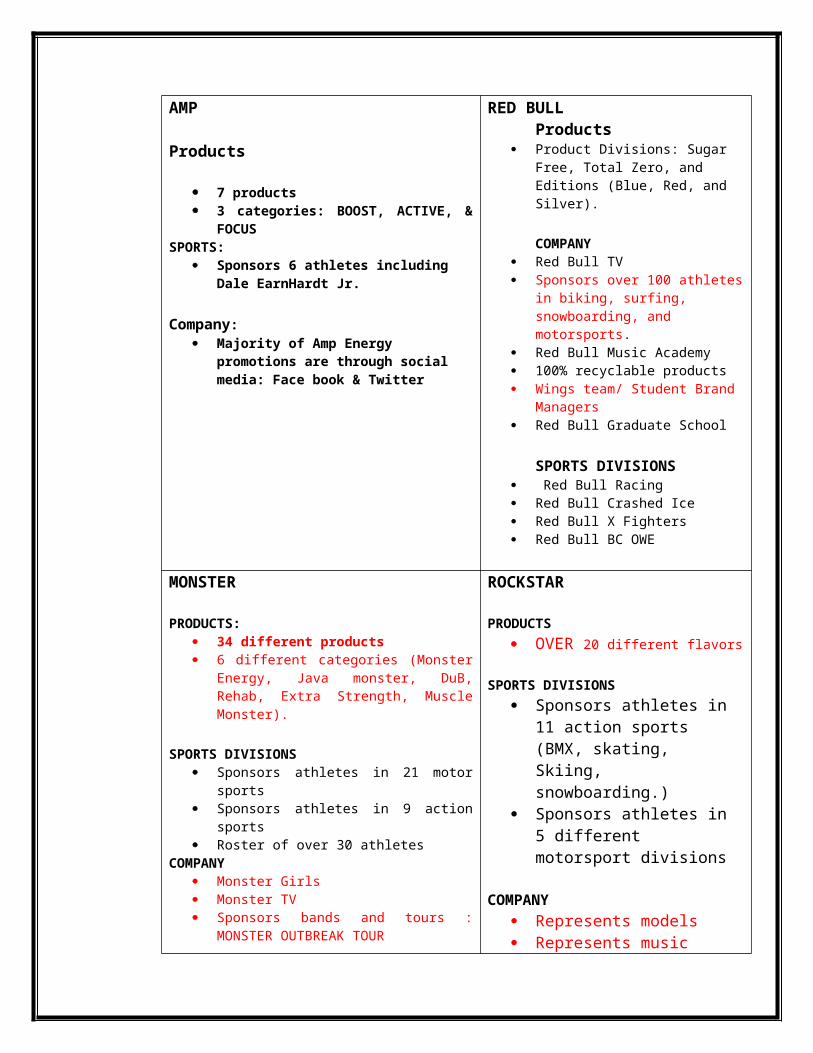
IV. GAP ANALYSIS – Products and Services AREAS OF CONCERN HIGHLIGHTED IN RED
AMP
Products
7 products 3 categories: BOOST, ACTIVE, & FOCUS
SPORTS: Sponsors 6 athletes including Dale
EarnHardt Jr.
Company: Majority of Amp Energy promotions are
through social media: Face book & Twitter
RED BULLProducts
Product Divisions: Sugar Free, Total Zero, and Editions (Blue, Red, and Silver).
COMPANY Red Bull TV Sponsors over 100 athletes in biking,
surfing, snowboarding, and motorsports.
Red Bull Music Academy 100% recyclable products Wings team/ Student Brand Managers Red Bull Graduate School
SPORTS DIVISIONS Red Bull Racing Red Bull Crashed Ice Red Bull X Fighters Red Bull BC OWE
MONSTER
PRODUCTS: 34 different products 6 different categories (Monster Energy, Java
monster, DuB, Rehab, Extra Strength, Muscle Monster).
SPORTS DIVISIONS Sponsors athletes in 21 motor sports Sponsors athletes in 9 action sports Roster of over 30 athletes
COMPANY Monster Girls Monster TV Sponsors bands and tours : MONSTER
OUTBREAK TOUR
ROCKSTAR
PRODUCTS OVER 20 different flavors
SPORTS DIVISIONS
Sponsors athletes in 11 action sports (BMX, skating, Skiing, snowboarding.)
Sponsors athletes in 5 different motorsport divisions
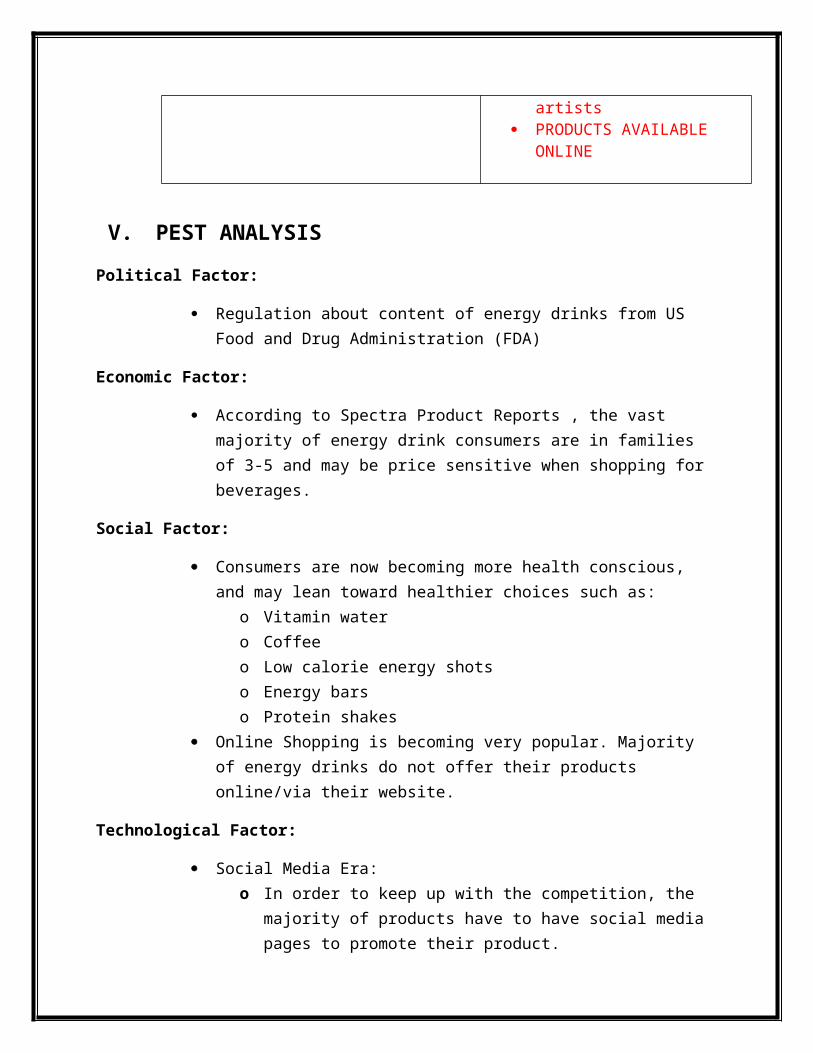
COMPANY Represents models Represents music artists PRODUCTS AVAILABLE ONLINE
V. PEST ANALYSIS
Political Factor:
Regulation about content of energy drinks from US Food and Drug Administration (FDA)
Economic Factor:
According to Spectra Product Reports , the vast majority of energy drink consumers are in families of 3-5 and may be price sensitive when shopping for beverages.
Social Factor:
Consumers are now becoming more health conscious, and may lean toward healthier choices such as:
o Vitamin water
o Coffee
o Low calorie energy shots
o Energy bars
o Protein shakes
Online Shopping is becoming very popular. Majority of energy drinks do not offer their products online/via their website.
Technological Factor:
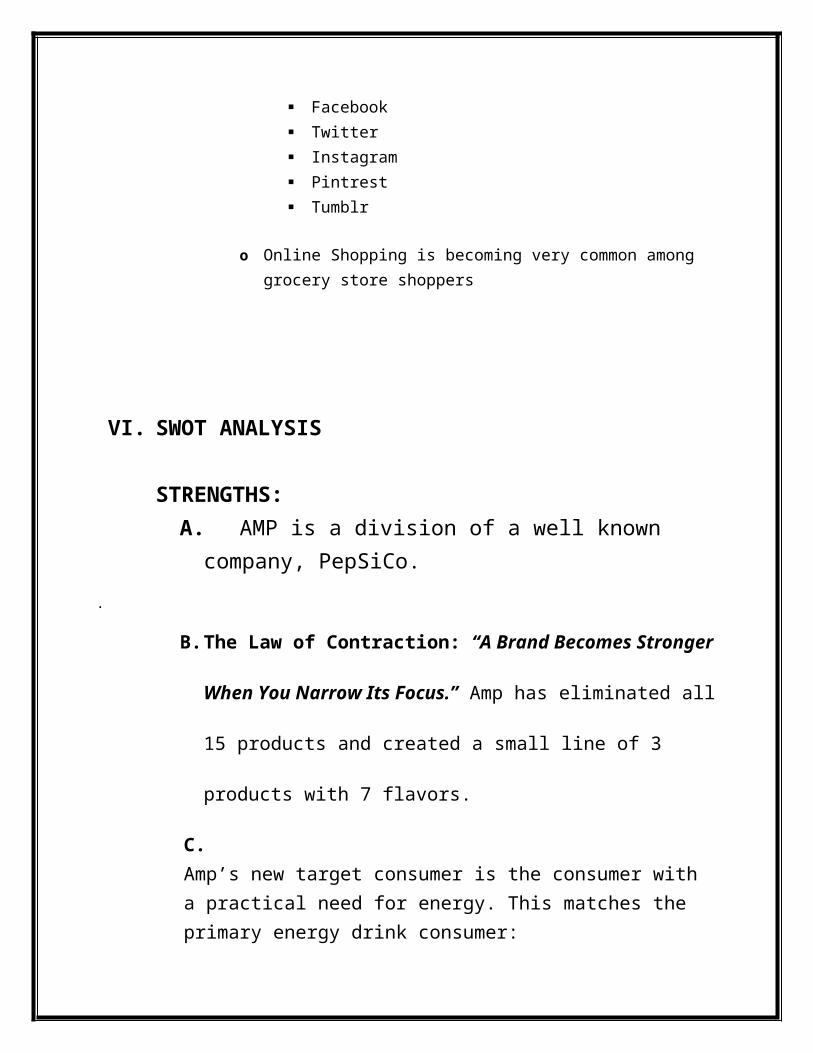
Social Media Era: o In order to keep up with the competition, the majority of products have
to have social media pages to promote their product. Facebook Twitter Instagram Pintrest Tumblr
o Online Shopping is becoming very common among grocery store shoppers

VI. SWOT ANALYSIS
STRENGTHS: A. AMP is a division of a well known company, PepSiCo.
.
B. The Law of Contraction: “A Brand Becomes Stronger When You
Narrow Its Focus.” Amp has eliminated all 15 products and created
a small line of 3 products with 7 flavors.
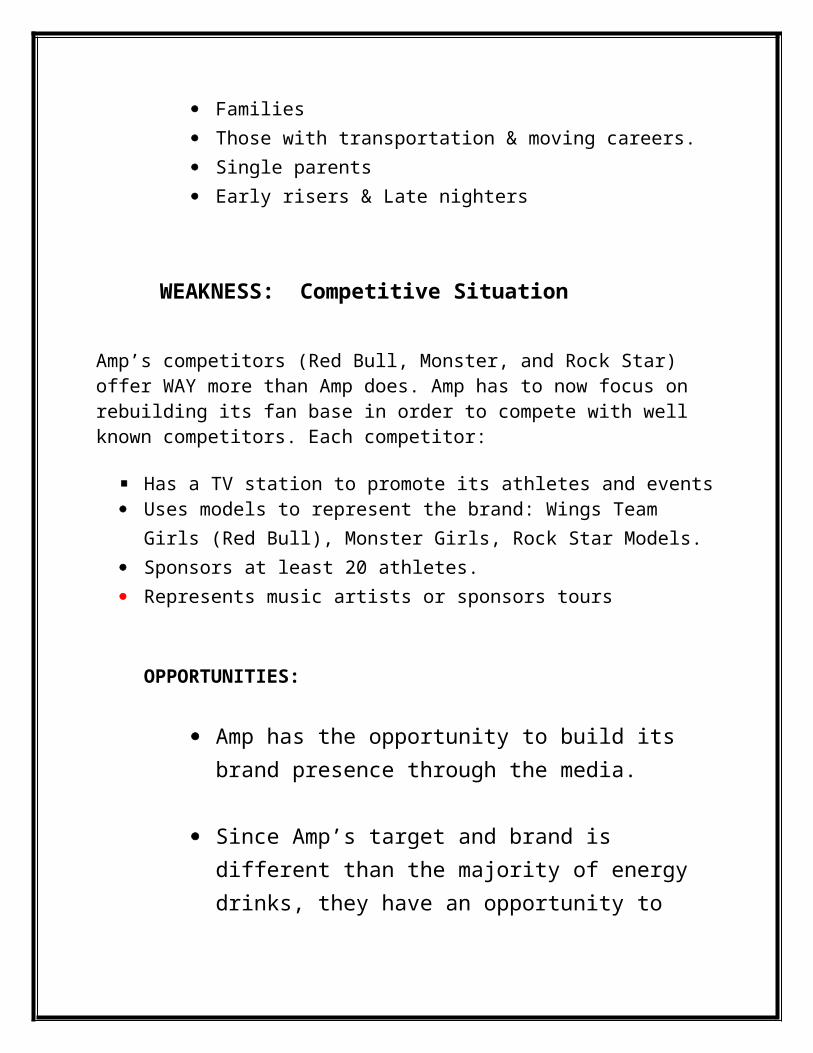
C. Amp’s new target consumer is the consumer with a practical need for energy. This matches the primary energy drink consumer: Families Those with transportation & moving careers. Single parents Early risers & Late nighters
WEAKNESS: Competitive Situation
Amp’s competitors (Red Bull, Monster, and Rock Star) offer WAY more than Amp does. Amp has to now focus on rebuilding its fan base in order to compete with well known competitors. Each competitor:
Has a TV station to promote its athletes and events Uses models to represent the brand: Wings Team Girls (Red Bull), Monster
Girls, Rock Star Models. Sponsors at least 20 athletes. Represents music artists or sponsors tours
OPPORTUNITIES:
Amp has the opportunity to build its brand presence through the media.
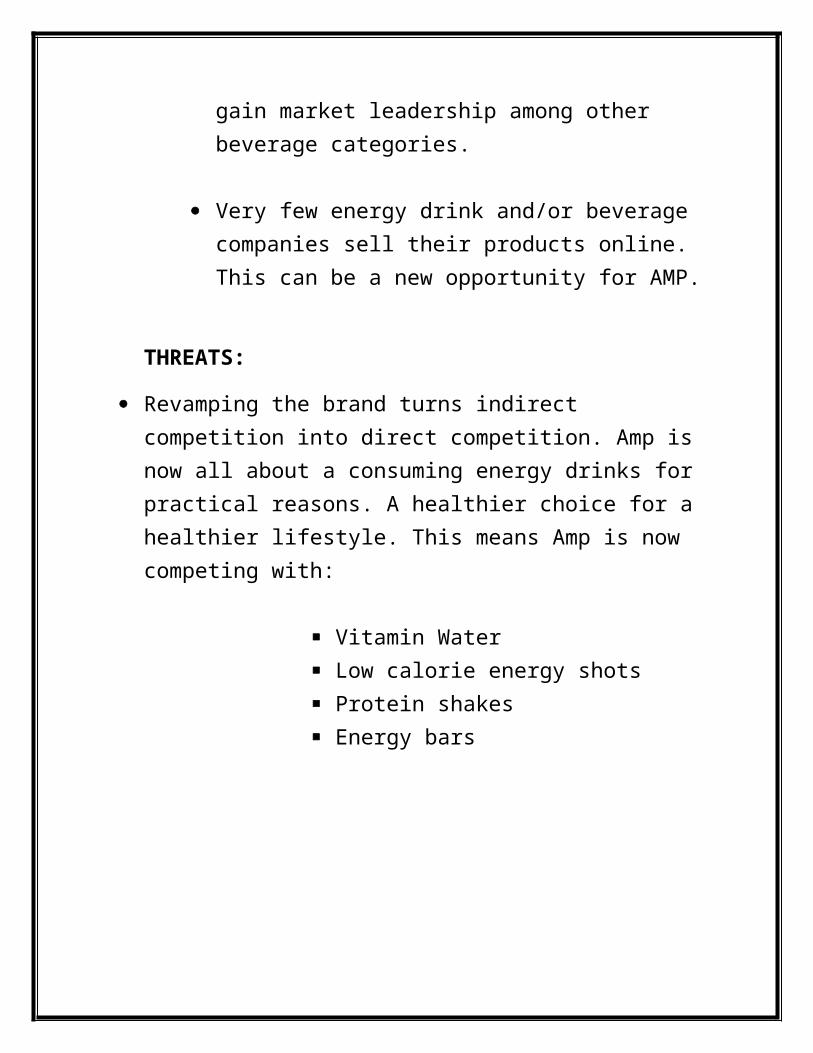
Since Amp’s target and brand is different than the majority of energy drinks, they have an opportunity to gain market leadership among other beverage categories.
Very few energy drink and/or beverage companies sell their products online. This can be a new opportunity for AMP.
THREATS:
Revamping the brand turns indirect competition into direct competition. Amp is now all about a consuming energy drinks for practical reasons. A healthier choice for a healthier lifestyle. This means Amp is now competing with:
Vitamin Water Low calorie energy shots Protein shakes Energy bars
VII. CRITICAL ISSUES
“Things changed. We're not just playing hard, we're working hard, too. So we need energy for
different reasons: To get a hop in our step, fuel our passions, or to get in the "zone". That's why
AMP Energy is rethinking energy. Our full lineup of innovative products provides a kick of
energy to match anything the day brings. So tell Monday Morning to bring it on, Friday Night to
wait up for you, and everything in-between to be ready. You're on your way.” – The AMP
Energy Team
Amp Energy has completely revamped its brand. Although this decision has its advantages, it
may put Amp on thinner ice.
Amp is now competing with two different sets of competitors since they revamped their brand:
Energy Drinks: Red Bull, Monster, Rock Star, etc
Healthy Energy Choices : Vitamin water, protein shakes, etc
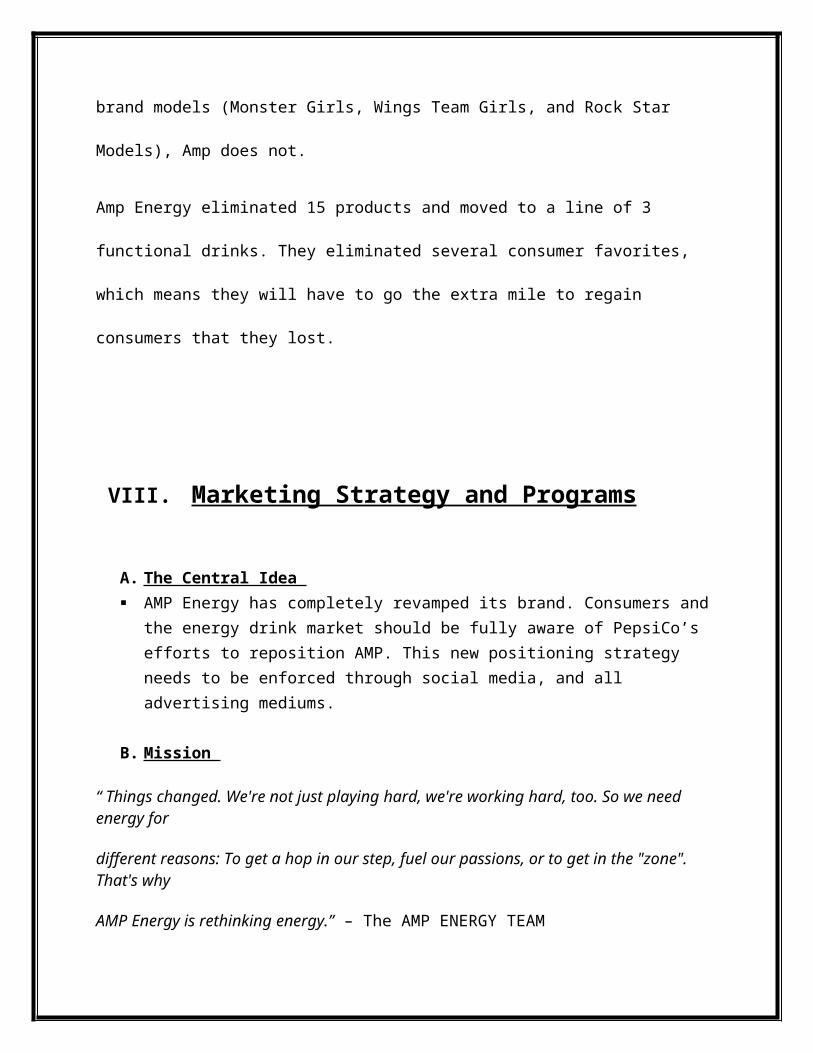
Amp’s brand does not offer as many elements as its competitors. Amp sponsors less than half of
the athletes that its leading competitors sponsor. Red Bull, Monster, and Rock Star all have brand
models (Monster Girls, Wings Team Girls, and Rock Star Models), Amp does not.
Amp Energy eliminated 15 products and moved to a line of 3 functional drinks. They eliminated
several consumer favorites, which means they will have to go the extra mile to regain consumers
that they lost.
VIII.Marketing Strategy and Programs
A. The Central Idea AMP Energy has completely revamped its brand. Consumers and the energy drink
market should be fully aware of PepsiCo’s efforts to reposition AMP. This new positioning strategy needs to be enforced through social media, and all advertising mediums.
B. Mission
“ Things changed. We're not just playing hard, we're working hard, too. So we need energy for
different reasons: To get a hop in our step, fuel our passions, or to get in the "zone". That's why
AMP Energy is rethinking energy.” – The AMP ENERGY TEAM
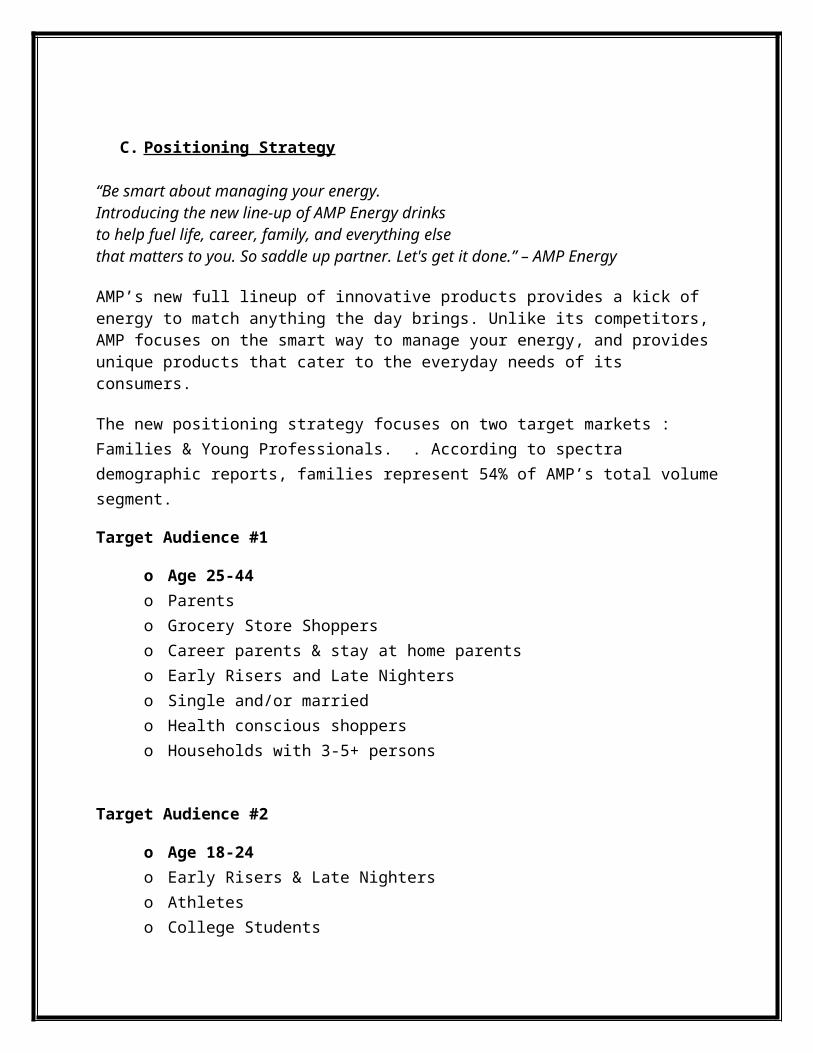
C. Positioning Strategy
“Be smart about managing your energy.Introducing the new line-up of AMP Energy drinksto help fuel life, career, family, and everything elsethat matters to you. So saddle up partner. Let's get it done.” – AMP Energy
AMP’s new full lineup of innovative products provides a kick of energy to match anything the day brings. Unlike its competitors, AMP focuses on the smart way to manage your energy, and provides unique products that cater to the everyday needs of its consumers.
The new positioning strategy focuses on two target markets : Families & Young Professionals. . According to spectra demographic reports, families represent 54% of AMP’s total volume segment.
Target Audience #1
o Age 25-44
o Parents
o Grocery Store Shoppers
o Career parents & stay at home parents
o Early Risers and Late Nighters
o Single and/or married
o Health conscious shoppers
o Households with 3-5+ persons
Target Audience #2
o Age 18-24
o Early Risers & Late Nighters
o Athletes
o College Students
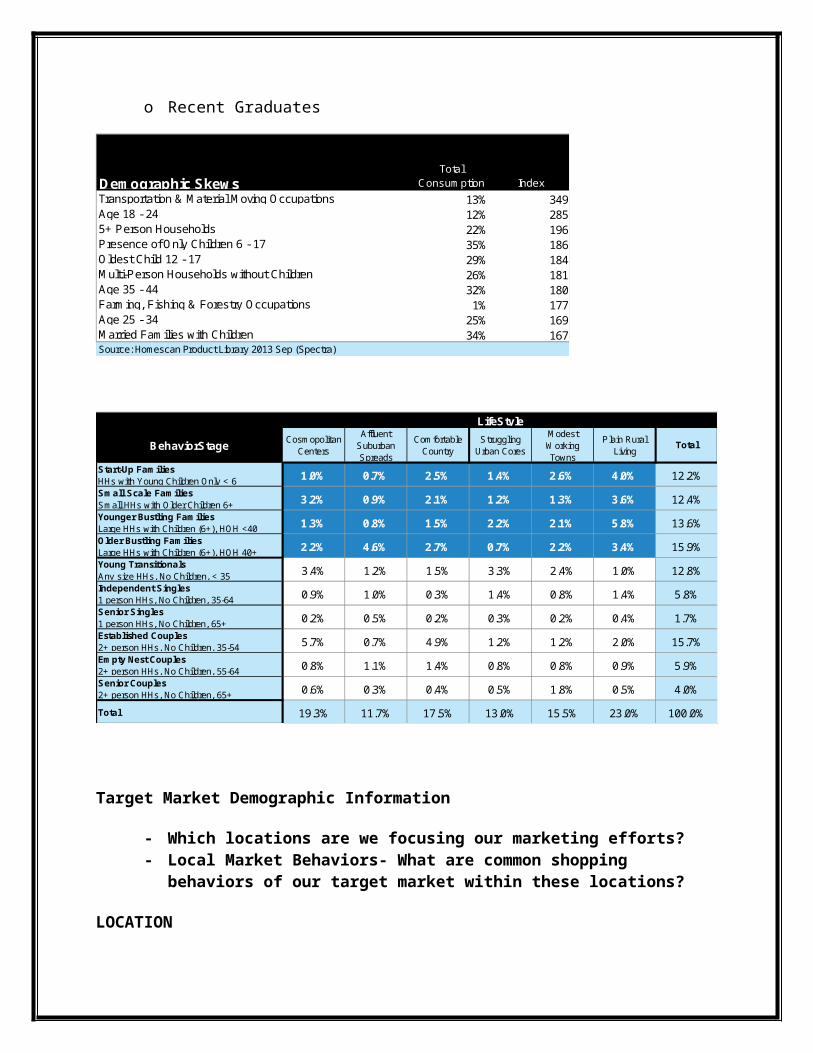
o Recent Graduates
Total Consumption Index
13% 34912% 28522% 19635% 18629% 18426% 18132% 1801% 177
25% 16934% 167Married Families with Children
Source: Homescan Product Library 2013 Sep (Spectra)
Demographic SkewsTransportation & Material Moving OccupationsAge 18 - 245+ Person HouseholdsPresence of Only Children 6 - 17Oldest Child 12 - 17Multi-Person Households without ChildrenAge 35 - 44Farming, Fishing & Forestry OccupationsAge 25 - 34
2.2% 4.6% 2.7% 0.7% 2.2% 3.4%
1.3% 0.8% 1.5% 2.2% 2.1% 5.8%
2.6% 4.0%
3.2% 0.9% 2.1% 1.2% 1.3% 3.6%
Affluent Suburban Spreads
Cosmopolitan Centers
1.0% 0.7% 2.5% 1.4%
Young TransitionalsAny size HHs, No Children, < 35
Older Bustling FamiliesLarge HHs with Children (6+), HOH 40+
Younger Bustling FamiliesLarge HHs with Children (6+), HOH <40
Small Scale FamiliesSmall HHs with Older Children 6+
Start-Up FamiliesHHs with Young Children Only < 6
TotalPlain Rural
Living
Modest Working Towns
Struggling Urban Cores
Comfortable Country
Total
Senior Couples2+ person HHs, No Children, 65+
Empty Nest Couples2+ person HHs, No Children, 55-64
Established Couples2+ person HHs, No Children, 35-54
Senior Singles1 person HHs, No Children, 65+
Independent Singles1 person HHs, No Children, 35-64
15.7%
5.9%
4.0%
100.0%19.3% 11.7% 17.5% 13.0% 15.5% 23.0%
12.4%
13.6%
15.9%
12.8%
5.8%
1.7%
0.6% 0.3% 0.4% 0.5% 1.8% 0.5%
0.8% 1.1% 1.4% 0.8% 0.8% 0.9%
5.7% 0.7% 4.9% 1.2% 1.2% 2.0%
0.2% 0.5% 0.2% 0.3% 0.2% 0.4%
0.9% 1.0% 0.3% 1.4% 0.8% 1.4%
LifeStyle
BehaviorStage
3.4% 1.2% 1.5% 3.3% 2.4% 1.0%
12.2%
Target Market Demographic Information
- Which locations are we focusing our marketing efforts?
- Local Market Behaviors- What are common shopping behaviors of our target market within these locations?
LOCATION
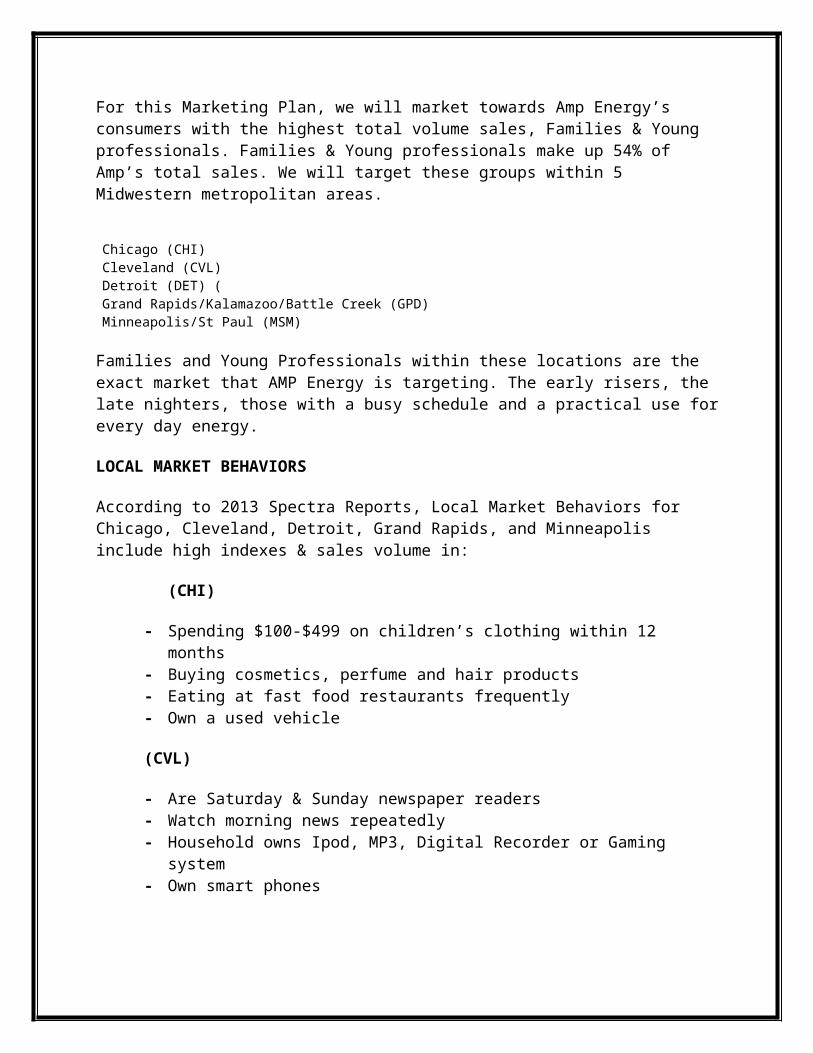
For this Marketing Plan, we will market towards Amp Energy’s consumers with the highest total volume sales, Families & Young professionals. Families & Young professionals make up 54% of Amp’s total sales. We will target these groups within 5 Midwestern metropolitan areas.
Chicago (CHI)Cleveland (CVL)Detroit (DET) (Grand Rapids/Kalamazoo/Battle Creek (GPD)Minneapolis/St Paul (MSM)
Families and Young Professionals within these locations are the exact market that AMP Energy is targeting. The early risers, the late nighters, those with a busy schedule and a practical use for every day energy.
LOCAL MARKET BEHAVIORS
According to 2013 Spectra Reports, Local Market Behaviors for Chicago, Cleveland, Detroit, Grand Rapids, and Minneapolis include high indexes & sales volume in:
(CHI)
- Spending $100-$499 on children’s clothing within 12 months- Buying cosmetics, perfume and hair products - Eating at fast food restaurants frequently - Own a used vehicle
(CVL)
- Are Saturday & Sunday newspaper readers- Watch morning news repeatedly - Household owns Ipod, MP3, Digital Recorder or Gaming system- Own smart phones
(DET)
- Shop at Hardware stores frequently - Shop at Mass Merchandise stores frequently - Social Media users (Facebook, Twitter, Instagram)- Household owns video game system -
(GPD)
- Health conscious eaters- Eco Friendly activities done on a regular basis - Online Shoppers - Typically watch late night programs
D. Financial Objectives
AMP Energy’s sales dropped from 300 million to 239 million in 2013. AMP Energy went from being the 4th most popular energy drink, to the 5th most popular.
Our sales goal is to increase sales by 5% in each quarter of 2014. Our profitability goal is to increase profits by 5%.
Sales Goals 2014
Q1 - $250,950,000
Q2- $263,497,500
Q3-$276,672,375
Q4- $290,505,993
E. Marketing Objectives
OBJECTIVE #1: Increase Market Awareness by 18% in 12 months
STRATEGY: MEDIA AWARENESS:
o Rapid Penetration- low price/high promotion
o AMP Energy could benefit from a national advertising campaign titled “Rethinking Energy”. Consumers and the energy drink market should be fully aware of PepsiCo’s decision to rebrand AMP. AMP’s new positioning strategy is clear through their website, but nowhere else. Not many consumers are aware of AMP’s new lineup of drinks, or their new strategy. The new AMP needs to be advertised via television, radio, and magazine.
- PROGRAMS : Media Mix TV:
Early News ($7,700 CPP) Late Fringe ($20,000 CPP) Primetime ($25,300 CPP)
Radio Network Radio ($8,500 CPP)
Outdoor Ads

Downtown Coverage/Parking lot displays -$60,000 x 30% increase due to National campaign.
Wrapped Train -$30,589 x 30% increase due to national campaign
Taxi tops - $120,000 x 30% increase due to national campaign
Internet ads Banner ads Social Media Websites Youtube
- Budget Plan $10,000,000 National Campaign 35% on TV – $3,500,000
Early Morning News (parents, professionals, and college students tend to be awake and getting ready, needing energy.)
Late Fridge (Settling down to watch tv, late night “studyers”, procrastinators)
30% on Outdoor advertising $3,000,000 Outdoors in common city areas Downtown on taxis and in parking lots On public transportation
20% on Radio $2,000,000 Pandora Radio Early morning radio
15% on internet ads $1,500,000 Facebook banner ads TV websites where the commercials aired YouTube
STRATEGY: SOCIAL MEDIA
AMP Energy should also run sweepstakes and contests through their various social media handles:
CONTESTS FACEBOOK: Show us how you “Rethink Energy”
Similar to Red Bull’s “Gives You Wings” campaign.
Facebook users can upload photos demonstrating how they consume Amp Energy for every day needs.
The first user to reach 1,000 likes is rewarded
CROSS PROMOTION THROUGH SOCIAL MEDIA AMP should use social media pages as a cross promotion tool. Following
brands on twitter and retweeting their posts, and well as “liking” their face book pages. (Vitamin Water, Energy Bars, Sports Magazines, Special Olympics etc)
OBJECTIVE #2: CHANGE BRAND PERCEPTION FROM EXTREME to EVERYDAY
ATHLETES/ SPONSORSHIP / ADVERTISEMENTS
o AMP has repositioned its brand to cater to the everyday needs of everyday consumers. To
avoid brand confusion, AMP Energy should look into new sponsors and endorsees outside of extreme sports athletics. The new faces of AMP should reflect AMP’s new brand, and match their new line of innovative products.
o PepsiCo eliminated all 15 of Amps categories and created a product line of 3 with all new formulations and designs: AMP BOOST, AMP ACTIVE, and AMP FOCUS. AMP has now reentered the introductory stage of the product lifecycle.
o AMP FOCUS:
A college student during an exam A young professional prepping for an interview
o AMP ACTIVE
An NBA/NFL/MLB Player An Olympic gymnast A college athlete
o AMP BOOST
A stay at home mom or dad A college student pulling an all night study session
IX. BUDGET & CALENDAR
2014 Marketing Plan Calendar
- January through April o Launch National Media Campaign in select cities
Topic: Initial Campaign launch “Rethinking Energy” CHI, DET, GPD, CLV, and MSM
o Winter Promotions
Face book and Twitter contests and giveaways
- May through Julyo National Media Campaign in select cities
Topic: Summer Break/ Vacation Cool off with AMP
o Spring Promotions
Bikini Body! Stay in shape for the summer!
Partnering with fitness clubs and protein bars
- August through October o National Media Campaign in select cities
Topic: Back to School Busy moms, working dads, college students, etc
o Fall promotions
Partnering with back pack giveaways and educational charities
- October through December o National Media Campaign in select cities
Topic: Holidays! Black Friday Shopping Thanksgiving Dinner Frenzy Santa needs Amp to fly across the world…duh!
Marketing Budget for 2014: Total $15,000,000
- Media plan: $10,000,000 National Campaign 35% on TV – $3,500,000
Early Morning News (parents, professionals, and college students tend to be awake and getting ready, needing energy.)
Late Fridge (Settling down to watch tv, late night “studyers”, procrastinators)
30% on Outdoor advertising $3,000,000 Outdoors in common city areas Downtown on taxis and in parking lots On public transportation
20% on Radio $2,000,000 Pandora Radio Early morning radio
15% on internet ads $1,500,000 Facebook banner ads TV websites where the commercials aired YouTube
- Promotions : $5,000,000o Cross promotions with various brands
Vitamin Water
Energy Bars
Granola Bars
o Contests and sweepstakes Social Media contests
o Product Launch events Major cities where national campaign airs
CHI, DET, GPD, CLV, MSM
o Endorsements and Sponsorships
BIBLIOGRAPHY
"The Top 15 Energy Drink Brands." The Top 15 Energy Drink Brands. N.p., n.d. Web. 14 Nov. 2013.
"Energy Drinks in C-stores: Strong Summer for Red Bull, Monster, NOS, Full Throttle, Weaker Performance from AMP, Rockstar." FoodNavigator-USA.com. N.p., n.d. Web. 14 Nov. 2013.
"Sales of Energy Drinks Surge, along with Controversy over Health Effects | The Salt Lake Tribune." The Salt Lake Tribune. N.p., n.d. Web. 14 Nov. 2013.
"America’s Most Popular Energy Drinks." 247wallst.com. N.p., n.d. Web. 14 Nov. 2013.
"Top Selling Energy Drinks." Statistic Brain RSS. N.p., n.d. Web. 14 Nov. 2013.
"Energy Drinks: An Assessment of Their Market Size, Consumer Demographics, Ingredient Profile, Functionality, and Regulations in the United States." - Heckman. N.p., n.d. Web. 14 Nov. 2013.
"Global Sports and Fitness Nutrition Foods and Drinks Industry." MarketWatch. N.p., n.d. Web. 14 Nov. 2013.
www.spectrainfinet.com