MARKET WATCH HOUSTON MULTIFAMILY - Texas … · WASHINGTON DC FORT DALLAS WORTH HOUSTON ......
34
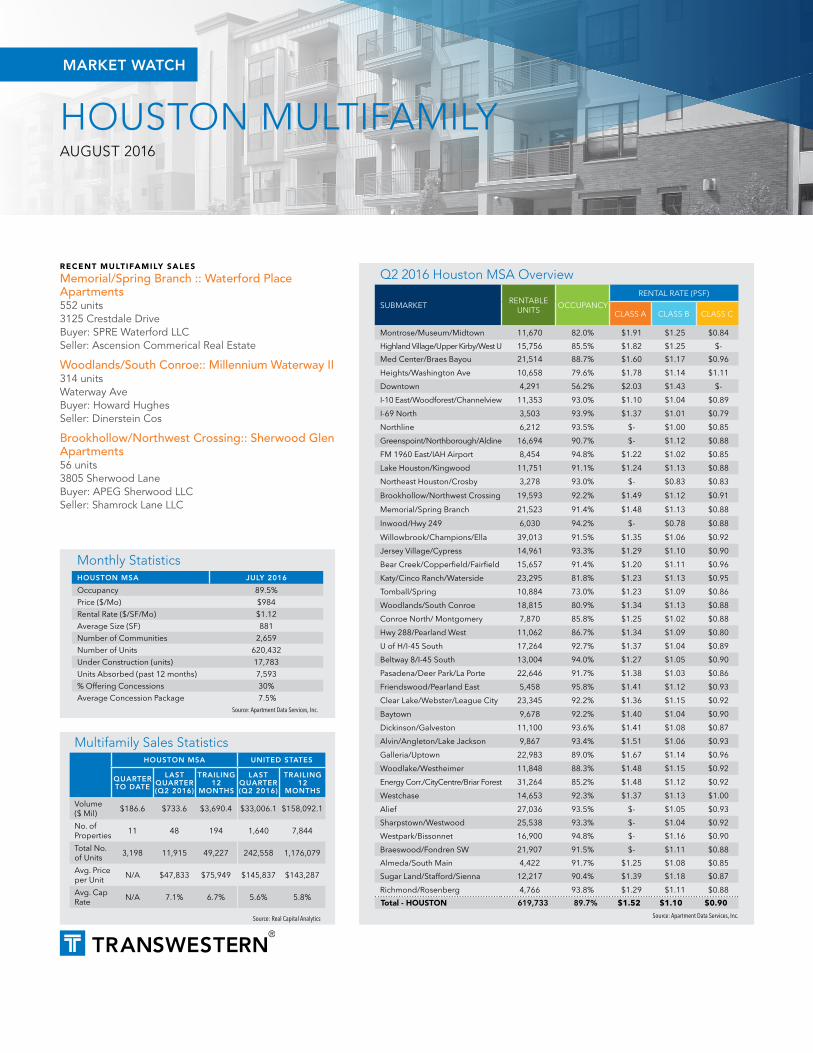
HOUSTON MULTIFAMILY AUGUST 2016 MARKET WATCH RECENT MULTIFAMILY SALES Memorial/Spring Branch :: Waterford Place Apartments 552 units 3125 Crestdale Drive Buyer: SPRE Waterford LLC Seller: Ascension Commerical Real Estate Woodlands/South Conroe:: Millennium Waterway II 314 units Waterway Ave Buyer: Howard Hughes Seller: Dinerstein Cos Brookhollow/Northwest Crossing:: Sherwood Glen Apartments 56 units 3805 Sherwood Lane Buyer: APEG Sherwood LLC Seller: Shamrock Lane LLC Monthly Statistics HOUSTON MSA JULY 2016 Occupancy 89.5% Price ($/Mo) $984 Rental Rate ($/SF/Mo) $1.12 Average Size (SF) 881 Number of Communities 2,659 Number of Units 620,432 Under Construction (units) 17,783 Units Absorbed (past 12 months) 7,593 % Offering Concessions 30% Average Concession Package 7.5% Source: Apartment Data Services, Inc. Multifamily Sales Statistics HOUSTON MSA UNITED STATES QUARTER TO DATE LAST QUARTER (Q2 2016) TRAILING 12 MONTHS LAST QUARTER (Q2 2016) TRAILING 12 MONTHS Volume ($ Mil) $186.6 $733.6 $3,690.4 $33,006.1 $158,092.1 No. of Properties 11 48 194 1,640 7,844 Total No. of Units 3,198 11,915 49,227 242,558 1,176,079 Avg. Price per Unit N/A $47,833 $75,949 $145,837 $143,287 Avg. Cap Rate N/A 7.1% 6.7% 5.6% 5.8% Source: Real Capital Analytics Q2 2016 Houston MSA Overview SUBMARKET RENTABLE UNITS OCCUPANCY RENTAL RATE (PSF) CLASS A CLASS B CLASS C Montrose/Museum/Midtown 11,670 82.0% $1.91 $1.25 $0.84 Highland Village/Upper Kirby/West U 15,756 85.5% $1.82 $1.25 $- Med Center/Braes Bayou 21,514 88.7% $1.60 $1.17 $0.96 Heights/Washington Ave 10,658 79.6% $1.78 $1.14 $1.11 Downtown 4,291 56.2% $2.03 $1.43 $- I-10 East/Woodforest/Channelview 11,353 93.0% $1.10 $1.04 $0.89 I-69 North 3,503 93.9% $1.37 $1.01 $0.79 Northline 6,212 93.5% $- $1.00 $0.85 Greenspoint/Northborough/Aldine 16,694 90.7% $- $1.12 $0.88 FM 1960 East/IAH Airport 8,454 94.8% $1.22 $1.02 $0.85 Lake Houston/Kingwood 11,751 91.1% $1.24 $1.13 $0.88 Northeast Houston/Crosby 3,278 93.0% $- $0.83 $0.83 Brookhollow/Northwest Crossing 19,593 92.2% $1.49 $1.12 $0.91 Memorial/Spring Branch 21,523 91.4% $1.48 $1.13 $0.88 Inwood/Hwy 249 6,030 94.2% $- $0.78 $0.88 Willowbrook/Champions/Ella 39,013 91.5% $1.35 $1.06 $0.92 Jersey Village/Cypress 14,961 93.3% $1.29 $1.10 $0.90 Bear Creek/Copperfield/Fairfield 15,657 91.4% $1.20 $1.11 $0.96 Katy/Cinco Ranch/Waterside 23,295 81.8% $1.23 $1.13 $0.95 Tomball/Spring 10,884 73.0% $1.23 $1.09 $0.86 Woodlands/South Conroe 18,815 80.9% $1.34 $1.13 $0.88 Conroe North/ Montgomery 7,870 85.8% $1.25 $1.02 $0.88 Hwy 288/Pearland West 11,062 86.7% $1.34 $1.09 $0.80 U of H/I-45 South 17,264 92.7% $1.37 $1.04 $0.89 Beltway 8/I-45 South 13,004 94.0% $1.27 $1.05 $0.90 Pasadena/Deer Park/La Porte 22,646 91.7% $1.38 $1.03 $0.86 Friendswood/Pearland East 5,458 95.8% $1.41 $1.12 $0.93 Clear Lake/Webster/League City 23,345 92.2% $1.36 $1.15 $0.92 Baytown 9,678 92.2% $1.40 $1.04 $0.90 Dickinson/Galveston 11,100 93.6% $1.41 $1.08 $0.87 Alvin/Angleton/Lake Jackson 9,867 93.4% $1.51 $1.06 $0.93 Galleria/Uptown 22,983 89.0% $1.67 $1.14 $0.96 Woodlake/Westheimer 11,848 88.3% $1.48 $1.15 $0.92 Energy Corr./CityCentre/Briar Forest 31,264 85.2% $1.48 $1.12 $0.92 Westchase 14,653 92.3% $1.37 $1.13 $1.00 Alief 27,036 93.5% $- $1.05 $0.93 Sharpstown/Westwood 25,538 93.3% $- $1.04 $0.92 Westpark/Bissonnet 16,900 94.8% $- $1.16 $0.90 Braeswood/Fondren SW 21,907 91.5% $- $1.11 $0.88 Almeda/South Main 4,422 91.7% $1.25 $1.08 $0.85 Sugar Land/Stafford/Sienna 12,217 90.4% $1.39 $1.18 $0.87 Richmond/Rosenberg 4,766 93.8% $1.29 $1.11 $0.88 Total - HOUSTON 619,733 89.7% $1.52 $1.10 $0.90 Source: Apartment Data Services, Inc.
Transcript of MARKET WATCH HOUSTON MULTIFAMILY - Texas … · WASHINGTON DC FORT DALLAS WORTH HOUSTON ......
HOUSTON MULTIFAMILYAUGUST 2016
MARKET WATCH
RECENT MULTIFAMILY SALES
Memorial/Spring Branch :: Waterford Place Apartments 552 units3125 Crestdale DriveBuyer: SPRE Waterford LLCSeller: Ascension Commerical Real Estate
Woodlands/South Conroe:: Millennium Waterway II314 units Waterway AveBuyer: Howard HughesSeller: Dinerstein Cos
Brookhollow/Northwest Crossing:: Sherwood Glen Apartments56 units3805 Sherwood LaneBuyer: APEG Sherwood LLC Seller: Shamrock Lane LLC
Monthly StatisticsHOUSTON MSA JULY 2016
Occupancy 89.5%
Price ($/Mo) $984
Rental Rate ($/SF/Mo) $1.12
Average Size (SF) 881
Number of Communities 2,659
Number of Units 620,432
Under Construction (units) 17,783
Units Absorbed (past 12 months) 7,593
% Offering Concessions 30%
Average Concession Package 7.5%Source: Apartment Data Services, Inc.
Multifamily Sales StatisticsHOUSTON MSA UNITED STATES
QUARTER TO DATE
LAST QUARTER (Q2 2016)
TRAILING 12
MONTHS
LAST QUARTER (Q2 2016)
TRAILING 12
MONTHS
Volume ($ Mil)
$186.6 $733.6 $3,690.4 $33,006.1 $158,092.1
No. of Properties
11 48 194 1,640 7,844
Total No. of Units
3,198 11,915 49,227 242,558 1,176,079
Avg. Price per Unit
N/A $47,833 $75,949 $145,837 $143,287
Avg. Cap Rate
N/A 7.1% 6.7% 5.6% 5.8%
Source: Real Capital Analytics
Q2 2016 Houston MSA Overview
SUBMARKET RENTABLE
UNITSOCCUPANCY
RENTAL RATE (PSF)
CLASS A CLASS B CLASS C
Montrose/Museum/Midtown 11,670 82.0% $1.91 $1.25 $0.84
Highland Village/Upper Kirby/West U 15,756 85.5% $1.82 $1.25 $-
Med Center/Braes Bayou 21,514 88.7% $1.60 $1.17 $0.96
Heights/Washington Ave 10,658 79.6% $1.78 $1.14 $1.11
Downtown 4,291 56.2% $2.03 $1.43 $-
I-10 East/Woodforest/Channelview 11,353 93.0% $1.10 $1.04 $0.89
I-69 North 3,503 93.9% $1.37 $1.01 $0.79
Northline 6,212 93.5% $- $1.00 $0.85
Greenspoint/Northborough/Aldine 16,694 90.7% $- $1.12 $0.88
FM 1960 East/IAH Airport 8,454 94.8% $1.22 $1.02 $0.85
Lake Houston/Kingwood 11,751 91.1% $1.24 $1.13 $0.88
Northeast Houston/Crosby 3,278 93.0% $- $0.83 $0.83
Brookhollow/Northwest Crossing 19,593 92.2% $1.49 $1.12 $0.91
Memorial/Spring Branch 21,523 91.4% $1.48 $1.13 $0.88
Inwood/Hwy 249 6,030 94.2% $- $0.78 $0.88
Willowbrook/Champions/Ella 39,013 91.5% $1.35 $1.06 $0.92
Jersey Village/Cypress 14,961 93.3% $1.29 $1.10 $0.90
Bear Creek/Copperfield/Fairfield 15,657 91.4% $1.20 $1.11 $0.96
Katy/Cinco Ranch/Waterside 23,295 81.8% $1.23 $1.13 $0.95
Tomball/Spring 10,884 73.0% $1.23 $1.09 $0.86
Woodlands/South Conroe 18,815 80.9% $1.34 $1.13 $0.88
Conroe North/ Montgomery 7,870 85.8% $1.25 $1.02 $0.88
Hwy 288/Pearland West 11,062 86.7% $1.34 $1.09 $0.80
U of H/I-45 South 17,264 92.7% $1.37 $1.04 $0.89
Beltway 8/I-45 South 13,004 94.0% $1.27 $1.05 $0.90
Pasadena/Deer Park/La Porte 22,646 91.7% $1.38 $1.03 $0.86
Friendswood/Pearland East 5,458 95.8% $1.41 $1.12 $0.93
Clear Lake/Webster/League City 23,345 92.2% $1.36 $1.15 $0.92
Baytown 9,678 92.2% $1.40 $1.04 $0.90
Dickinson/Galveston 11,100 93.6% $1.41 $1.08 $0.87
Alvin/Angleton/Lake Jackson 9,867 93.4% $1.51 $1.06 $0.93
Galleria/Uptown 22,983 89.0% $1.67 $1.14 $0.96
Woodlake/Westheimer 11,848 88.3% $1.48 $1.15 $0.92
Energy Corr./CityCentre/Briar Forest 31,264 85.2% $1.48 $1.12 $0.92
Westchase 14,653 92.3% $1.37 $1.13 $1.00
Alief 27,036 93.5% $- $1.05 $0.93
Sharpstown/Westwood 25,538 93.3% $- $1.04 $0.92
Westpark/Bissonnet 16,900 94.8% $- $1.16 $0.90
Braeswood/Fondren SW 21,907 91.5% $- $1.11 $0.88
Almeda/South Main 4,422 91.7% $1.25 $1.08 $0.85
Sugar Land/Stafford/Sienna 12,217 90.4% $1.39 $1.18 $0.87
Richmond/Rosenberg 4,766 93.8% $1.29 $1.11 $0.88
Total - HOUSTON 619,733 89.7% $1.52 $1.10 $0.90
Source: Apartment Data Services, Inc.
MARKET WATCH HOUSTON MULTIFAMILY MARKET AUGUST 2016
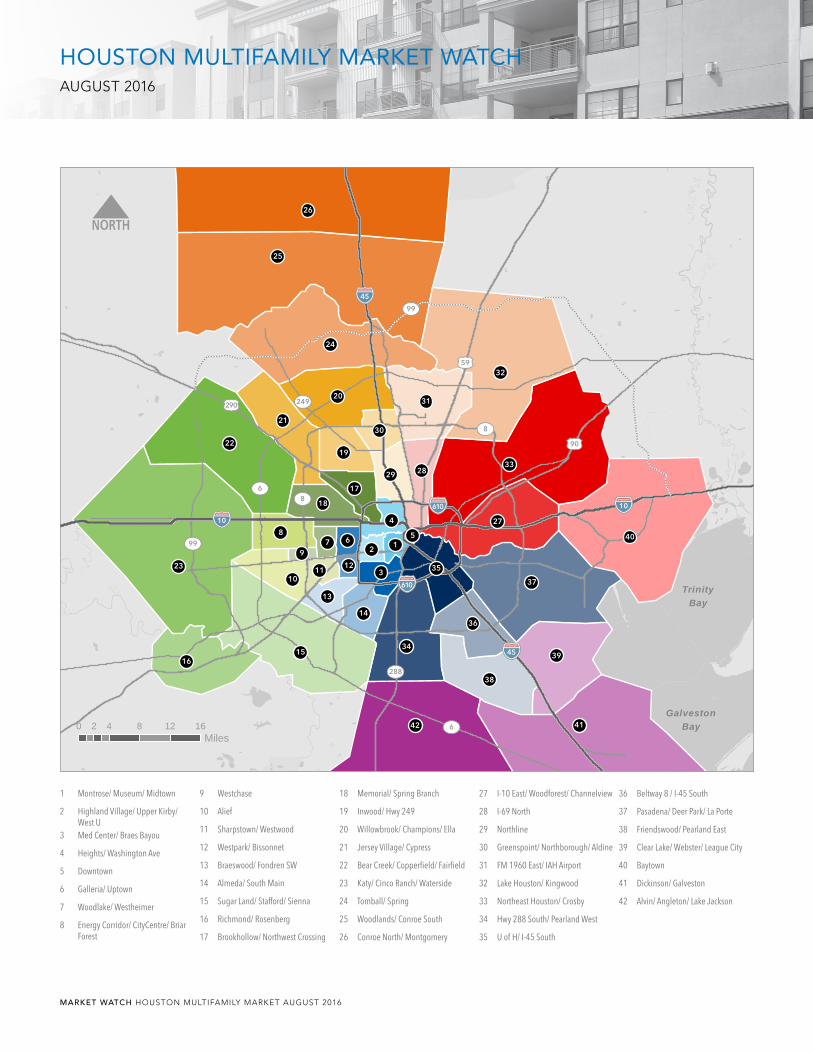
HOUSTON MULTIFAMILY MARKET WATCHAUGUST 2016
42 41
39
38
37
40
27
33
32
31
2829
30
36
34
35
1516
23
10
13
14
8
97
18
22
21
20
24
25
26
19
17
1112
3
4
21
56
TrinityBay
GalvestonBay
59
290
90
288
249
99
99
6
6
8
8
610
10
45
610
10
45
0 4 8 12 162Miles
1 Montrose/ Museum/ Midtown
2 Highland Village/ Upper Kirby/ West U
3 Med Center/ Braes Bayou
4 Heights/ Washington Ave
5 Downtown
6 Galleria/ Uptown
7 Woodlake/ Westheimer
8 Energy Corridor/ CityCentre/ Briar Forest
9 Westchase
10 Alief
11 Sharpstown/ Westwood
12 Westpark/ Bissonnet
13 Braeswood/ Fondren SW
14 Almeda/ South Main
15 Sugar Land/ Stafford/ Sienna
16 Richmond/ Rosenberg
17 Brookhollow/ Northwest Crossing
18 Memorial/ Spring Branch
19 Inwood/ Hwy 249
20 Willowbrook/ Champions/ Ella
21 Jersey Village/ Cypress
22 Bear Creek/ Copperfield/ Fairfield
23 Katy/ Cinco Ranch/ Waterside
24 Tomball/ Spring
25 Woodlands/ Conroe South
26 Conroe North/ Montgomery
27 I-10 East/ Woodforest/ Channelview
28 I-69 North
29 Northline
30 Greenspoint/ Northborough/ Aldine
31 FM 1960 East/ IAH Airport
32 Lake Houston/ Kingwood
33 Northeast Houston/ Crosby
34 Hwy 288 South/ Pearland West
35 U of H/ I-45 South
36 Beltway 8 / I-45 South
37 Pasadena/ Deer Park/ La Porte
38 Friendswood/ Pearland East
39 Clear Lake/ Webster/ League City
40 Baytown
41 Dickinson/ Galveston
42 Alvin/ Angleton/ Lake Jackson

Copyright © 2016 Transwestern. All rights reserved. No part of this work may be reproduced or distributed to third parties without written permission of the copyright owner. The information contained in this report was gathered by Transwestern from CoStar and other primary and secondary sources believed to be reliable. Transwestern, however, makes no representation concerning the accuracy or completeness of such information and expressly disclaims any responsibility for any inaccuracy contained herein.
HOUSTON MULTIFAMILY MARKET WATCHAUGUST 2016
SEATTLE
WALNUT CREEK
LOS ANGELES
SALT LAKECITY
DENVER
MINNEAPOLIS
MILWAUKEE
ST. LOUIS
CHICAGO
DETROIT GREENWICHNEW YORK
NEW JERSEY
BALTIMORENORTHERNVIRGINIA
BETHESDAWASHINGTON DC
DALLASFORTWORTH
HOUSTONAUSTIN
SAN ANTONIO
OKLAHOMACITY
NEW ORLEANS
ATLANTA
FORT LAUDERDALEORLANDO
MIAMI-DADE
SANFRANCISCO
PHOENIXORANGE COUNTY
SAN DIEGO
BOSTON
SILICONVALLEY
TRANSWESTERNLOCATIONS
HOUSTON MULTIFAMILY TEAM
Ed CumminsSenior Vice [email protected]
Guadalupe OlivaresAssistant Vice [email protected]
METHODOLOGY
The information in this report is the result of a compilation of publicly available data from a variety of commercial and government sources.
T 713.270.7700 F 713.270.6285www.transwestern.net/houston
1900 West Loop South, Suite 1300Houston, Texas 77027
Ryan MendezSenior [email protected]
ABOUT TR ANSWESTERN
Transwestern is a privately held real estate firm specializing in agency leasing, property and facilities management, tenant advisory, capital markets, research and sustainability. The fully integrated global enterprise leverages competencies in office, industrial, retail, multifamily and healthcare properties to add value for investors, owners and occupiers of real estate. As a member of the Transwestern family of companies, the firm capitalizes on market insights and operational expertise of independent affiliates specializing in development, real estate investment management and research. Transwestern has 34 U.S. offices and assists clients through more than 180 offices in 37 countries as part of a strategic alliance with Paris-based BNP Paribas Real Estate.
Transwestern was founded in Houston, Texas in 1978, and Houston remains the corporate headquarters today. As one of the preeminent commercial real estate firms in Houston, we offer a comprehensive menu of real estate services designed to provide owners, tenants and investors with the optimum solutions for their unique requirements. Transwestern has seasoned veterans in every area of expertise with the integrity, experience and creativity to be the best partner for its clients. Transwestern’s Houston office currently employs over 400 team members and has been an innovator in the Houston market for 38 years.
Tim GregorySenior Vice [email protected]
Michael SnodgrassManaging Director - Structured [email protected]
Jan SparksManaging Director - Structured [email protected]
Kevin RobertsPresident, [email protected]
Kenady DavisVice [email protected]
CONTACT
Rachel AndraeResearch [email protected]
HOUSTON MULTIFAMILYMAY 2016
MARKET WATCH
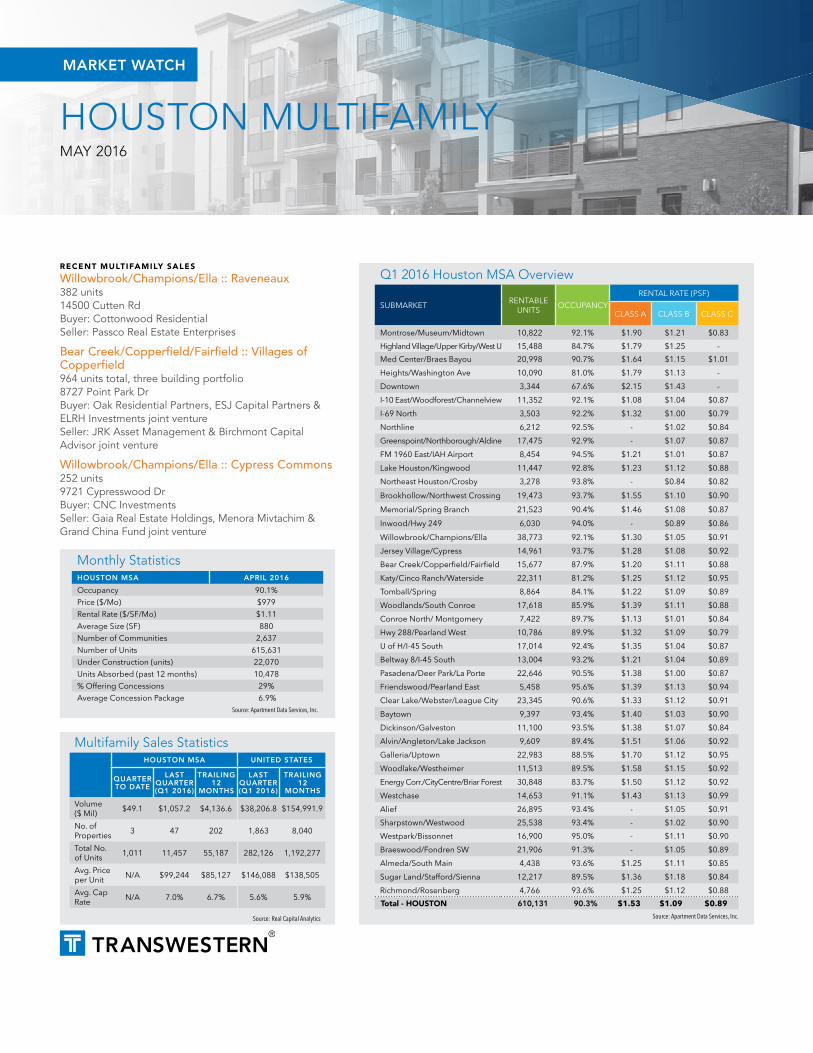
RECENT MULTIFAMILY SALES
Willowbrook/Champions/Ella :: Raveneaux 382 units14500 Cutten RdBuyer: Cottonwood Residential Seller: Passco Real Estate Enterprises
Bear Creek/Copperfield/Fairfield :: Villages of Copperfield 964 units total, three building portfolio8727 Point Park DrBuyer: Oak Residential Partners, ESJ Capital Partners & ELRH Investments joint ventureSeller: JRK Asset Management & Birchmont Capital Advisor joint venture
Willowbrook/Champions/Ella :: Cypress Commons252 units9721 Cypresswood DrBuyer: CNC InvestmentsSeller: Gaia Real Estate Holdings, Menora Mivtachim & Grand China Fund joint venture
Monthly StatisticsHOUSTON MSA APRIL 2016
Occupancy 90.1%
Price ($/Mo) $979
Rental Rate ($/SF/Mo) $1.11
Average Size (SF) 880
Number of Communities 2,637
Number of Units 615,631
Under Construction (units) 22,070
Units Absorbed (past 12 months) 10,478
% Offering Concessions 29%
Average Concession Package 6.9%Source: Apartment Data Services, Inc.
Multifamily Sales StatisticsHOUSTON MSA UNITED STATES
QUARTER TO DATE
LAST QUARTER (Q1 2016)
TRAILING 12
MONTHS
LAST QUARTER (Q1 2016)
TRAILING 12
MONTHS
Volume ($ Mil)
$49.1 $1,057.2 $4,136.6 $38,206.8 $154,991.9
No. of Properties
3 47 202 1,863 8,040
Total No. of Units
1,011 11,457 55,187 282,126 1,192,277
Avg. Price per Unit
N/A $99,244 $85,127 $146,088 $138,505
Avg. Cap Rate
N/A 7.0% 6.7% 5.6% 5.9%
Source: Real Capital Analytics
Q1 2016 Houston MSA Overview
SUBMARKET RENTABLE
UNITSOCCUPANCY
RENTAL RATE (PSF)
CLASS A CLASS B CLASS C
Montrose/Museum/Midtown 10,822 92.1% $1.90 $1.21 $0.83
Highland Village/Upper Kirby/West U 15,488 84.7% $1.79 $1.25 -
Med Center/Braes Bayou 20,998 90.7% $1.64 $1.15 $1.01
Heights/Washington Ave 10,090 81.0% $1.79 $1.13 -
Downtown 3,344 67.6% $2.15 $1.43 -
I-10 East/Woodforest/Channelview 11,352 92.1% $1.08 $1.04 $0.87
I-69 North 3,503 92.2% $1.32 $1.00 $0.79
Northline 6,212 92.5% - $1.02 $0.84
Greenspoint/Northborough/Aldine 17,475 92.9% - $1.07 $0.87
FM 1960 East/IAH Airport 8,454 94.5% $1.21 $1.01 $0.87
Lake Houston/Kingwood 11,447 92.8% $1.23 $1.12 $0.88
Northeast Houston/Crosby 3,278 93.8% - $0.84 $0.82
Brookhollow/Northwest Crossing 19,473 93.7% $1.55 $1.10 $0.90
Memorial/Spring Branch 21,523 90.4% $1.46 $1.08 $0.87
Inwood/Hwy 249 6,030 94.0% - $0.89 $0.86
Willowbrook/Champions/Ella 38,773 92.1% $1.30 $1.05 $0.91
Jersey Village/Cypress 14,961 93.7% $1.28 $1.08 $0.92
Bear Creek/Copperfield/Fairfield 15,677 87.9% $1.20 $1.11 $0.88
Katy/Cinco Ranch/Waterside 22,311 81.2% $1.25 $1.12 $0.95
Tomball/Spring 8,864 84.1% $1.22 $1.09 $0.89
Woodlands/South Conroe 17,618 85.9% $1.39 $1.11 $0.88
Conroe North/ Montgomery 7,422 89.7% $1.13 $1.01 $0.84
Hwy 288/Pearland West 10,786 89.9% $1.32 $1.09 $0.79
U of H/I-45 South 17,014 92.4% $1.35 $1.04 $0.87
Beltway 8/I-45 South 13,004 93.2% $1.21 $1.04 $0.89
Pasadena/Deer Park/La Porte 22,646 90.5% $1.38 $1.00 $0.87
Friendswood/Pearland East 5,458 95.6% $1.39 $1.13 $0.94
Clear Lake/Webster/League City 23,345 90.6% $1.33 $1.12 $0.91
Baytown 9,397 93.4% $1.40 $1.03 $0.90
Dickinson/Galveston 11,100 93.5% $1.38 $1.07 $0.84
Alvin/Angleton/Lake Jackson 9,609 89.4% $1.51 $1.06 $0.92
Galleria/Uptown 22,983 88.5% $1.70 $1.12 $0.95
Woodlake/Westheimer 11,513 89.5% $1.58 $1.15 $0.92
Energy Corr./CityCentre/Briar Forest 30,848 83.7% $1.50 $1.12 $0.92
Westchase 14,653 91.1% $1.43 $1.13 $0.99
Alief 26,895 93.4% - $1.05 $0.91
Sharpstown/Westwood 25,538 93.4% - $1.02 $0.90
Westpark/Bissonnet 16,900 95.0% - $1.11 $0.90
Braeswood/Fondren SW 21,906 91.3% - $1.05 $0.89
Almeda/South Main 4,438 93.6% $1.25 $1.11 $0.85
Sugar Land/Stafford/Sienna 12,217 89.5% $1.36 $1.18 $0.84
Richmond/Rosenberg 4,766 93.6% $1.25 $1.12 $0.88
Total - HOUSTON 610,131 90.3% $1.53 $1.09 $0.89
Source: Apartment Data Services, Inc.

MARKET WATCH HOUSTON MULTIFAMILY MARKET MAY 2016
HOUSTON MULTIFAMILY MARKET WATCHMAY 2016
42 41
39
38
37
40
27
33
32
31
2829
30
36
34
35
1516
23
10
13
14
8
97
18
22
21
20
24
25
26
19
17
1112
3
4
21
56
TrinityBay
GalvestonBay
59
290
90
288
249
99
99
6
6
8
8
610
10
45
610
10
45
0 4 8 12 162Miles
1 Montrose/ Museum/ Midtown
2 Highland Village/ Upper Kirby/ West U
3 Med Center/ Braes Bayou
4 Heights/ Washington Ave
5 Downtown
6 Galleria/ Uptown
7 Woodlake/ Westheimer
8 Energy Corridor/ CityCentre/ Briar Forest
9 Westchase
10 Alief
11 Sharpstown/ Westwood
12 Westpark/ Bissonnet
13 Braeswood/ Fondren SW
14 Almeda/ South Main
15 Sugar Land/ Stafford/ Sienna
16 Richmond/ Rosenberg
17 Brookhollow/ Northwest Crossing
18 Memorial/ Spring Branch
19 Inwood/ Hwy 249
20 Willowbrook/ Champions/ Ella
21 Jersey Village/ Cypress
22 Bear Creek/ Copperfield/ Fairfield
23 Katy/ Cinco Ranch/ Waterside
24 Tomball/ Spring
25 Woodlands/ Conroe South
26 Conroe North/ Montgomery
27 I-10 East/ Woodforest/ Channelview
28 I-69 North
29 Northline
30 Greenspoint/ Northborough/ Aldine
31 FM 1960 East/ IAH Airport
32 Lake Houston/ Kingwood
33 Northeast Houston/ Crosby
34 Hwy 288 South/ Pearland West
35 U of H/ I-45 South
36 Beltway 8 / I-45 South
37 Pasadena/ Deer Park/ La Porte
38 Friendswood/ Pearland East
39 Clear Lake/ Webster/ League City
40 Baytown
41 Dickinson/ Galveston
42 Alvin/ Angleton/ Lake Jackson

Copyright © 2016 Transwestern. All rights reserved. No part of this work may be reproduced or distributed to third parties without written permission of the copyright owner. The information contained in this report was gathered by Transwestern from CoStar and other primary and secondary sources believed to be reliable. Transwestern, however, makes no representation concerning the accuracy or completeness of such information and expressly disclaims any responsibility for any inaccuracy contained herein.
HOUSTON MULTIFAMILY MARKET WATCHMAY 2016
SEATTLE
WALNUT CREEK
LOS ANGELES
SALT LAKECITY
DENVER
MINNEAPOLIS
MILWAUKEE
ST. LOUIS
CHICAGO
DETROIT GREENWICHNEW YORK
NEW JERSEY
BALTIMORENORTHERNVIRGINIA
BETHESDAWASHINGTON DC
DALLASFORTWORTH
HOUSTONAUSTIN
SAN ANTONIO
OKLAHOMACITY
NEW ORLEANS
ATLANTA
FORT LAUDERDALEORLANDO
MIAMI-DADE
SANFRANCISCO
PHOENIXORANGE COUNTY
SAN DIEGO
BOSTON
SILICONVALLEY
TRANSWESTERNLOCATIONS
HOUSTON MULTIFAMILY TEAM
Ed CumminsSenior Vice [email protected]
Guadalupe OlivaresAssistant Vice [email protected]
METHODOLOGY
The information in this report is the result of a compilation of publicly available data from a variety of commercial and government sources.
CONTACT
Rachel AlexanderDirector of Market [email protected]
T 713.270.7700 F 713.270.6285www.transwestern.net/houston
1900 West Loop South, Suite 1300Houston, Texas 77027
Ryan MendezSenior [email protected]
ABOUT TR ANSWESTERN
Transwestern is a privately held real estate firm specializing in agency leasing, property and facilities management, tenant advisory, capital markets, research and sustainability. The fully integrated global enterprise leverages competencies in office, industrial, retail, multifamily and healthcare properties to add value for investors, owners and occupiers of real estate. As a member of the Transwestern family of companies, the firm capitalizes on market insights and operational expertise of independent affiliates specializing in development, real estate investment management and research. Transwestern has 34 U.S. offices and assists clients through more than 180 offices in 37 countries as part of a strategic alliance with Paris-based BNP Paribas Real Estate.
Transwestern was founded in Houston, Texas in 1978, and Houston remains the corporate headquarters today. As one of the preeminent commercial real estate firms in Houston, we offer a comprehensive menu of real estate services designed to provide owners, tenants and investors with the optimum solutions for their unique requirements. Transwestern has seasoned veterans in every area of expertise with the integrity, experience and creativity to be the best partner for its clients. Transwestern’s Houston office currently employs over 400 team members and has been an innovator in the Houston market for 38 years.
Tim GregorySenior Vice [email protected]
Michael SnodgrassManaging Director - Structured [email protected]
Jan SparksManaging Director - Structured [email protected]
Kevin RobertsPresident, [email protected]
Kenady DavisVice [email protected]

HOUSTON MULTIFAMILYFebrUArY 2016
Market Watch
Recent multifamily sales
Brookhollow/Northwest Crossing :: Retreat on Rosslyn 364 units5801 N Houston Rosslyn RdBuyer: Rosslyn2016, LLC Seller: Westfield Capital Group
Friendswood/Pearland East :: Emerson Park354 units1799 FM 528Buyer: Milestone Apartments REITSeller: Landmark Apartment Trust
Katy/Cinco Ranch/Waterside :: Haven on Westgreen225 units510 WestgreenBuyer: CAF Capital Partners & Blue Vista Capital joint ventureSeller: Guefen Development
Monthly StatisticshOUStON MSa FebrUary 2016
Occupancy 90.4%
Price ($/Mo) $967
Rental Rate ($/SF/Mo) $1.10
Average Size (SF) 879
Number of Communities 2,611
Number of Units 607,605
Under Construction (units) 27,941
Units Absorbed (past 12 months) 11,749
% Offering Concessions 29%
Average Concession Package 6.6%Source: Apartment Data Services, Inc.
Multifamily Sales StatisticshOUStON MSa UNIteD StateS
QUarter tO Date
LaSt QUarter (Q4 2015)
traILING 12
MONthS
LaSt QUarter (Q4 2015)
traILING 12
MONthS
Volume ($ Mil)
$293.6 $741.5 $4,229.6 $50,548.1 $149,050.2
No. of Properties
15 41 212 2,072 7,894
Total No. of Units
3,483 9,903 58,840 342,379 1,166,740
Avg. Price per Unit
$154,733 $65,270 $85,477 $150,437 $136,429
Avg. Cap Rate
N/A 6.8% 6.7% 5.8% 5.9%
Source: Real Capital Analytics
2015 Houston MSA Overview
SUBMARKET RENTABLE
UNITSOCCUPANCY
RENTAL RATE (PSF)
CLASS A CLASS B CLASS C
Montrose/Museum/Midtown 10,822 92.1% $1.94 $1.29 $0.72
Highland Village/Upper Kirby/West U 15,209 85.2% $1.79 $1.21 -
Med Center/Braes Bayou 20,998 90.4% $1.64 $1.16 $0.95
Heights/Washington Ave 9,466 85.3% $1.74 $1.10 -
Downtown 2,428 90.6% $1.99 - -
I-10 East/Woodforest/Channelview 11,352 92.5% $1.14 $1.02 $0.88
I-69 North 3,503 91.5% $1.32 $0.99 $0.80
Northline 6,212 94.7% - $0.99 $0.83
Greenspoint/Northborough/Aldine 17,475 93.4% - $1.04 $0.86
FM 1960 East/IAH Airport 8,454 93.0% $1.26 $0.99 $0.82
Lake Houston/Kingwood 11,447 92.7% $1.25 $1.11 $0.86
Northeast Houston/Crosby 3,278 93.1% - $0.82 $0.81
Brookhollow/Northwest Crossing 19,421 93.8% $1.54 $1.08 $0.87
Memorial/Spring Branch 21,276 91.0% $1.49 $1.08 $0.86
Inwood/Hwy 249 6,030 94.7% - $0.80 $0.89
Willowbrook/Champions/Ella 38,773 92.2% $1.32 $1.06 $0.90
Jersey Village/Cypress 14,961 94.2% $1.23 $1.09 $0.91
Bear Creek/Copperfield/Fairfield 15,677 87.1% $1.17 $1.09 $0.93
Katy/Cinco Ranch/Waterside 22,311 80.7% $1.26 $1.09 $0.88
Tomball/Spring 8,864 82.2% $1.23 $1.09 $0.86
Woodlands/South Conroe 16,804 88.9% $1.38 $1.11 $0.88
Conroe North/ Montgomery 7,114 93.3% $1.12 $1.00 $0.84
Hwy 288/Pearland West 10,786 88.4% $1.31 $1.09 $0.78
U of H/I-45 South 17,014 92.4% $1.39 $1.05 $0.86
Beltway 8/I-45 South 13,004 93.6% - $1.04 $0.88
Pasadena/Deer Park/La Porte 22,646 90.6% $1.40 $1.02 $0.86
Friendswood/Pearland East 5,458 94.1% $1.31 $1.09 $0.93
Clear Lake/Webster/League City 23,345 90.9% $1.33 $1.13 $0.93
Baytown 9,397 93.7% $1.35 $1.03 $0.88
Dickinson/Galveston 11,100 93.1% $1.37 $1.04 $0.86
Alvin/Angleton/Lake Jackson 9,609 88.4% $1.42 $1.03 $0.90
Galleria/Uptown 22,983 88.7% $1.73 $1.14 $0.93
Woodlake/Westheimer 11,513 89.9% $1.51 $1.05 $0.95
Energy Corr./CityCentre/Briar Forest 30,700 83.1% $1.51 $1.13 $0.89
Westchase 14,653 89.3% $1.50 $1.14 $0.97
Alief 26,895 93.5% $1.19 $1.04 $0.90
Sharpstown/Westwood 25,538 93.5% $1.03 $0.89 $0.71
Westpark/Bissonnet 16,900 95.4% $1.35 - $0.90
Braeswood/Fondren SW 21,906 91.9% - $1.09 $0.88
Almeda/South Main 4,438 94.0% $1.17 $1.12 $0.82
Sugar Land/Stafford/Sienna 11,905 91.4% $1.38 $1.17 $0.84
Richmond/Rosenberg 4,766 94.2% $1.30 $1.04 $0.86
total - HOustOn 606,431 90.6% $1.53 $1.08 $0.88
Source: Apartment Data Services, Inc.

MARKET WATCH HOUSTON MULTIFAMILY MARKET FEbRUARY 2016
HOUSTON MULTIFAMILY MARKET WATCHFebrUArY 2016
42 41
39
38
37
40
27
33
32
31
2829
30
36
34
35
1516
23
10
13
14
8
97
18
22
21
20
24
25
26
19
17
1112
3
4
21
56
TrinityBay
GalvestonBay
59
290
90
288
249
99
99
6
6
8
8
610
10
45
610
10
45
0 4 8 12 162Miles
1 Montrose/ Museum/ Midtown
2 Highland Village/ Upper Kirby/ West U
3 Med Center/ Braes Bayou
4 Heights/ Washington Ave
5 Downtown
6 Galleria/ Uptown
7 Woodlake/ Westheimer
8 Energy Corridor/ CityCentre/ Briar Forest
9 Westchase
10 Alief
11 Sharpstown/ Westwood
12 Westpark/ Bissonnet
13 Braeswood/ Fondren SW
14 Almeda/ South Main
15 Sugar Land/ Stafford/ Sienna
16 Richmond/ Rosenberg
17 Brookhollow/ Northwest Crossing
18 Memorial/ Spring Branch
19 Inwood/ Hwy 249
20 Willowbrook/ Champions/ Ella
21 Jersey Village/ Cypress
22 Bear Creek/ Copperfield/ Fairfield
23 Katy/ Cinco Ranch/ Waterside
24 Tomball/ Spring
25 Woodlands/ Conroe South
26 Conroe North/ Montgomery
27 I-10 East/ Woodforest/ Channelview
28 I-69 North
29 Northline
30 Greenspoint/ Northborough/ Aldine
31 FM 1960 East/ IAH Airport
32 Lake Houston/ Kingwood
33 Northeast Houston/ Crosby
34 Hwy 288 South/ Pearland West
35 U of H/ I-45 South
36 Beltway 8 / I-45 South
37 Pasadena/ Deer Park/ La Porte
38 Friendswood/ Pearland East
39 Clear Lake/ Webster/ League City
40 Baytown
41 Dickinson/ Galveston
42 Alvin/ Angleton/ Lake Jackson

Copyright © 2016 Transwestern. All rights reserved. No part of this work may be reproduced or distributed to third parties without written permission of the copyright owner. The information contained in this report was gathered by Transwestern from CoStar and other primary and secondary sources believed to be reliable. Transwestern, however, makes no representation concerning the accuracy or completeness of such information and expressly disclaims any responsibility for any inaccuracy contained herein.
HOUSTON MULTIFAMILY MARKET WATCHFebrUArY 2016
SEATTLE
WALNUT CREEK
LOS ANGELES
SALT LAKECITY
DENVER
MINNEAPOLIS
MILWAUKEE
ST. LOUIS
CHICAGO
DETROIT GREENWICHNEW YORK
NEW JERSEY
BALTIMORENORTHERNVIRGINIA
BETHESDAWASHINGTON DC
DALLASFORTWORTH
HOUSTONAUSTIN
SAN ANTONIO
OKLAHOMACITY
NEW ORLEANS
ATLANTA
FORT LAUDERDALEORLANDO
MIAMI-DADE
SANFRANCISCO
PHOENIXORANGE COUNTY
SAN DIEGO
BOSTON
SILICONVALLEY
TRANSWESTERNLOCATIONS
HOustOn multifamily team
Ed CumminsSenior Vice [email protected]
Guadalupe OlivaresAssistant Vice [email protected]
MethODOLOGy
The information in this report is the result of a compilation of publicly available data from a variety of commercial and government sources.
cONtact
Rachel AlexanderDirector of Market [email protected]
t 713.270.7700 f 713.270.6285www.transwestern.net/houston
1900 West Loop South, Suite 1300Houston, Texas 77027
Ryan MendezSenior [email protected]
aBOut tR ansWesteRn
Transwestern is a privately held real estate firm specializing in agency leasing, property and facilities management, tenant advisory, capital markets, research and sustainability. The fully integrated global enterprise leverages competencies in office, industrial, retail, multifamily and healthcare properties to add value for investors, owners and occupiers of real estate. As a member of the Transwestern family of companies, the firm capitalizes on market insights and operational expertise of independent affiliates specializing in development, real estate investment management and research. Transwestern has 34 U.S. offices and assists clients through more than 180 offices in 37 countries as part of a strategic alliance with Paris-based BNP Paribas Real Estate.
Transwestern was founded in Houston, Texas in 1978, and Houston remains the corporate headquarters today. As one of the preeminent commercial real estate firms in Houston, we offer a comprehensive menu of real estate services designed to provide owners, tenants and investors with the optimum solutions for their unique requirements. Transwestern has seasoned veterans in every area of expertise with the integrity, experience and creativity to be the best partner for its clients. Transwestern’s Houston office currently employs over 400 team members and has been an innovator in the Houston market for 38 years.
Tim GregorySenior Vice [email protected]
Michael SnodgrassManaging Director - Structured [email protected]
Jan SparksManaging Director - Structured [email protected]
Kevin RobertsPresident, [email protected]
Kenady DavisVice [email protected]

HOUSTON MULTIFAMILYDeceMber 2015
Market Watch
Recent multifamily sales
Clear Lake :: The Falls at Clear Lake 400 units801 E NASA Rd 1Buyer: Oak Coast Properties Seller: Bascom Group
Braeswood/Fondren SW :: West Hollow Apartments207 units10001 Fondren RdBuyer: Laxmana Investment, LLCSeller: TPN Investments
Fort Bend :: The Villas at Sienna Plantation190 units8585 Sienna Springs BlvdBuyer: Sun HoldingsSeller: Watermark Residential & JSQ Commercial, LLC joint venture
Monthly StatisticshOUStON MSa DeceMber 2015
Occupancy 90.8%
Price ($/Mo) $968
Rental Rate ($/SF/Mo) $1.10
Average Size (SF) 878
Number of Communities 2,602
Number of Units 605,107
Under Construction (units) 30,054
Units Absorbed (past 12 months) 13,063
% Offering Concessions 28%
Average Concession Package 5.9%Source: Apartment Data Services, Inc.
Multifamily Sales StatisticshOUStON MSa UNIteD StateS
QUarter tO Date
LaSt QUarter (Q3 2015)
traILING 12
MONthS
LaSt QUarter (Q3 2015)
traILING 12
MONthS
Volume ($ Mil)
$265.1 $963.2 $5,149.4 $33,577.3 $133,070.9
No. of Properties
18 52 252 2,009 7,620
Total No. of Units
4,631 14,522 69,003 271,552 1,121,451
Avg. Price per Unit
$31,953 $80,296 $89,261 $133,678 $131,464
Avg. Cap Rate
7.2% 7.1% 7.0% 5.8% 6.0%
Source: Real Capital Analytics
Q3 2015 Houston MSA Overview
SUBMARKET RENTABLE
UNITSOCCUPANCY
RENTAL RATE (PSF)
CLASS A CLASS B CLASS C
Montrose/Museum District 13,784 92.5% $1.90 $1.27 $0.71
Inner Loop West/Greenway Plaza 16,567 85.4% $1.84 $1.21 -
Medical Center/Bellaire 21,080 92.0% $1.65 $1.14 $0.96
Heights 4,414 79.9% $1.81 $1.17 -
Inner Loop East 8,424 93.6% $1.90 $1.03 $0.86
Northshore/Wood Forest 8,646 92.0% - $1.01 $0.88
Eastex Frwy/Near Northeast 5,503 94.4% - $0.93 $0.78
Northline/Aldine 10,110 94.6% $1.75 $0.93 $0.85
Greenspoint 9,473 93.0% $1.15 $0.85 $0.77
FM 1960 East/IAH Airport 8,930 91.9% $1.21 $1.01 $0.88
Lake Houston/Kingwood 11,446 93.3% $1.23 $1.12 $0.86
Far East 4,833 90.7% $1.11 $0.94 $0.79
Brookhollow 20,518 91.8% $1.57 $1.08 $0.87
Spring Branch 18,319 93.7% $1.40 $1.06 $0.87
Inwood/Northwest 7,383 95.3% - $0.95 $0.88
FM 1960 West/Champions 37,600 92.4% $1.23 $1.07 $0.89
FM 1960 West/Steeplechase 19,323 94.7% $1.26 $1.07 $0.87
Bear Creek/Copperfield 13,903 88.5% $1.24 $1.10 $0.86
Katy/ Far West 20,171 82.3% $1.26 $1.09 $0.91
Tomball/Far Northwest 5,871 78.7% $1.27 $1.07 $0.83
Woodlands/Far North 16,495 89.6% $1.38 $1.14 $0.89
Conroe/Montgomery 7,598 94.1% $1.15 $0.99 $0.83
Hwy 288/South 13,577 89.6% $1.33 $0.98 $0.81
Gulfgate/Almeda Mall 22,083 92.9% $1.24 $1.05 $0.85
Galena Park/Jacinto City 362 97.2% - $1.11 $0.81
Pasadena/Deer Park 22,121 91.7% $1.40 $1.01 $0.86
Friendswood/Pearland 5,909 90.0% $1.28 $1.10 $0.95
Clear Lake 24,936 93.5% $1.35 $1.12 $0.92
Baytown 9,397 92.9% $1.34 $1.03 $0.88
Galveston/Brazoria 20,709 91.4% $1.37 $1.03 $0.87
Galleria 24,346 90.1% $1.69 $1.15 $0.93
Woodlake/Westheimer 12,293 89.6% $1.52 $1.06 $0.93
West Memorial/Briar Forest 27,194 86.0% $1.53 $1.14 $0.90
Westchase 14,653 90.5% $1.48 $1.15 $0.98
Alief 27,276 94.4% $1.20 $1.05 $0.90
Sharpstown/Westwood 25,538 92.7% - $1.02 $0.88
Gulfton/ Bissonnet 16,900 95.1% $1.44 $1.02 $0.89
Braeswood/Fondren SW 21,937 88.9% $1.24 $1.00 $0.88
Almeda/South Main 4,283 93.4% $1.32 $1.09 $0.84
Fort Bend 14,488 87.8% $1.34 $1.15 $0.88
Richmond/Rosenburg 4,536 94.4% $1.33 $1.09 $0.86
total - HOustOn 602,929 91.1% $1.53 $1.08 $0.88
Source: Apartment Data Services, Inc.

MARKET WATCH HOUSTON MULTIFAMILY MARKET DEcEMbER 2015
HOUSTON MULTIFAMILY MARKET WATCHDeceMber 2015
CBDCBD
45
45
1010
610
290
59
90
288
99
249
8
35
6
11
11 22
33
44
55
66
77
88
11
11
11
22
22
22
22
33
33
44
44
55
55 66 77
88
99
1010
1111
6677
88
99
1010
33
33
44
44
55
55
66
77
Montrose/Museum District
Inner Loop West/Greenway Plaza
Medical Center/Bellaire
Heights
Inner Loop East
Northshore/Wood Forest
Eastex Fwy/Near Northeast
Northline/Aldine
Greenspoint
FM 1960 East/IAH Airport
Lake Houston/Kingwood
Far East
1
2
3
4
5
1
2
6
7
3
4
5
CENTR
AL
Brookhollow
Spring Branch
Inwood/Northwest
FM 1960 West/Champions
FM 1960 West/Steeplechase
Bear Creek/Copperfield
Katy/Far West
Tomball/Far Northwest
The Woodlands/Far North
Conroe/Montgomery
1
2
3
4
5
6
7
8
9
10
NORTH
WEST
Hwy 288/South
Gulfgate/Almeda Mall
Galena Park/Jacinto City
Pasadena/Deer Park
Friendswood/Pearland
Clear Lake
Baytown
Galveston/Brazoria
1
2
3
4
5
6
7
8
SOUTH
EAST
Galleria
Woodlake/Westheimer
West Memorial/Briar Forest
Westchase
Alief
Sharpstown/Westwood
Gulfton/Bissonnet
Braeswood/Fondren SW
Almeda/South Main
Fort Bend
Richmond/Rosenberg
1
2
3
4
5
6
7
8
9
10
11
SOUTH
WEST
NORTH
EAST
Houston | MULTIFAMILY SUBMARKETS
centR al
1. Montrose/Museum District2. Inner Loop West/Greenway Plaza3. Medical Center/Bellaire4. Heights5. Inner Loop East
nORtHeast
1. Northshore/Wood Forest2. Eastex Fwy/Near Northeast3. Northline/Aldine
4. Greenspoint5. FM 1960 East/IAH Airport6. Lake Houston/Kingwood7. Far East
nORtHwest
1. Brookhollow2. Spring Branch3. Inwood/Northwest4. FM 1960 West/Champions5. FM 1960 West/Steeplechase
6. Bear Creek/Copperfield7. Katy/Far West8. Tomball/Far Northwest9. The Woodlands/Far North10. Conroe/Montgomery
sOutHwest
1. Galleria2. Woodlake/Westheimer3. West Memorial/Briar Forest4. Westchase
5. Alief6. Sharpstown/Westwood7. Gulfton/Bissonnet8. Braeswood/Fondren SW9. Almeda/South Main10. Fort Bend11. Richmond/Rosenberg
sOutHeast
1. Hwy 288/South2. Gulfgate/Almeda Mall
3. Galena Park/Jacinto City4. Pasadena/Deer Park5. Friendswood/Pearland6. Clear Lake7. Baytown8. Galveston/Brazoria

Copyright © 2015 Transwestern. All rights reserved. No part of this work may be reproduced or distributed to third parties without written permission of the copyright owner. The information contained in this report was gathered by Transwestern from CoStar and other primary and secondary sources believed to be reliable. Transwestern, however, makes no representation concerning the accuracy or completeness of such information and expressly disclaims any responsibility for any inaccuracy contained herein.
HOUSTON MULTIFAMILY MARKET WATCHDeceMber 2015
SEATTLE
WALNUT CREEK
LOS ANGELES
SALT LAKECITY
DENVER
MINNEAPOLIS
MILWAUKEE
ST. LOUIS
CHICAGO
DETROIT GREENWICHNEW YORK
NEW JERSEY
BALTIMORENORTHERNVIRGINIA
BETHESDAWASHINGTON DC
DALLASFORTWORTH
HOUSTONAUSTIN
SAN ANTONIO
OKLAHOMACITY
NEW ORLEANS
ATLANTA
FORT LAUDERDALEORLANDO
MIAMI-DADE
SANFRANCISCO
PHOENIXORANGE COUNTY
SAN DIEGO
BOSTON
SILICONVALLEY
TRANSWESTERNLOCATIONS
HOustOn multifamily team
Ed CumminsSenior Vice [email protected]
Guadalupe OlivaresAssistant Vice [email protected]
MethODOLOGy
The information in this report is the result of a compilation of publicly available data from a variety of commercial and government sources.
cONtact
Rachel AlexanderDirector of Market [email protected]
t 713.270.7700 f 713.270.6285www.transwestern.net/houston
1900 West Loop South, Suite 1300Houston, Texas 77027
Ryan MendezSenior [email protected]
aBOut tR answesteRn
Transwestern is a privately held real estate firm specializing in agency leasing, property and facilities management, tenant advisory, capital markets, research and sustainability. The fully integrated global enterprise leverages competencies in office, industrial, retail, multifamily and healthcare properties to add value for investors, owners and occupiers of real estate. As a member of the Transwestern family of companies, the firm capitalizes on market insights and operational expertise of independent affiliates specializing in development, real estate investment management and research. Transwestern has 34 U.S. offices and assists clients through more than 180 offices in 38 countries as part of a strategic alliance with Paris-based BNP Paribas Real Estate.
Transwestern was founded in Houston, Texas in 1978, and Houston remains the corporate headquarters today. As one of the preeminent commercial real estate firms in Houston, we offer a comprehensive menu of real estate services designed to provide owners, tenants and investors with the optimum solutions for their unique requirements. Transwestern has seasoned veterans in every area of expertise with the integrity, experience and creativity to be the best partner for its clients. Transwestern’s Houston office currently employs over 400 team members and has been an innovator in the Houston market for 37 years.
Tim GregorySenior Vice [email protected]
Michael SnodgrassManaging Director - Structured [email protected]
Jan SparksManaging Director - Structured [email protected]
Kevin RobertsPresident, [email protected]

HOUSTON MULTIFAMILYSepTeMber 2015
Market Watch
Recent multifamily sales
Fort Bend :: Buena Vista Apartments250 units11505 Keegans Ridge RdBuyer: Buena Vista Apartments, LLCSeller: 11505 Keegans Ridge Partners, LLC
Baytown :: Villas At Rollingbrook204 units3717 Emmet Hutto BlvdBuyer: Ergas GroupSeller: Momentum Acquisitions
Spring Branch :: Spring Gardens & Johanna Square117 units1754 Wirt RdBuyer: Diesof Investments CorpSeller: OSD, LLC
Monthly StatisticshOUStON MSa SepteMber 2015
Occupancy 91.2%
Price ($/Mo) $970
Rental Rate ($/SF/Mo) $1.11
Average Size (SF) 878
Number of Communities 2,591
Number of Units 602,054
Under Construction (units) 22,899
Units Absorbed (past 12 months) 14,613
% Offering Concessions 22%
Average Concession Package 5.6%Source: Apartment Data Services, Inc.
Multifamily Sales StatisticshOUStON MSa UNIteD StateS
QUarter tO Date
LaSt QUarter (Q2 2015)
traILING 12
MONthS
LaSt QUarter (Q2 2015)
traILING 12
MONthS
Volume ($ Mil)
$706.9 $1,181.8 $5,583.8 $30,501.2 $130,589.1
No. of Properties
40 52 279 1,863 7,395
Total No. of Units
11,035 16,999 75,218 265,738 1,117,144
Avg. Price per Unit
$94,928 $82,478 $93,764 $125,536 $130,616
Avg. Cap Rate
7.3% 7.4% 6.9% 6.0% 6.0%
Source: Real Capital Analytics
Q2 2015 Houston MSA Overview
SUBMARKET RENTABLE
UNITSOCCUPANCY
RENTAL RATE (PSF)
CLASS A CLASS B CLASS C
Montrose/Museum District 13,569 92.2% $1.90 $1.24 $0.76
Inner Loop West/Greenway Plaza 16,361 82.4% $1.86 $1.25 -
Medical Center/Bellaire 21,080 92.1% $1.66 $1.17 $0.94
Heights 4,132 82.3% $1.84 $1.17 $1.06
Inner Loop East 8,424 92.9% $2.05 $1.02 $0.84
Northshore/Wood Forest 8,646 92.1% - $1.02 $0.88
Eastex Frwy/Near Northeast 5,503 95.0% - $0.93 $0.79
Northline/Aldine 9,944 94.4% - $0.91 $0.82
Greenspoint 9,473 93.4% - $1.08 $0.84
FM 1960 East/IAH Airport 8,930 92.1% $1.10 $1.03 $0.87
Lake Houston/Kingwood 11,446 93.7% $1.24 $1.12 $0.80
Far East 4,833 88.7% $1.13 $0.95 $0.78
Brookhollow 20,302 93.6% 1.706 1.094 0.856
Spring Branch 18,313 94.1% $1.42 $1.04 $0.85
Inwood/Northwest 7,383 95.3% $1.19 $0.94 $0.86
FM 1960 West/Champions 37,600 92.5% $1.24 $1.06 $0.88
FM 1960 West/Steeplechase 19,323 95.2% $1.27 $1.07 $0.88
Bear Creek/Copperfield 13,573 90.1% $1.28 $1.13 $0.87
Katy/ Far West 21,016 77.7% $1.27 $1.09 $0.90
Tomball/Far Northwest 5,511 77.4% $1.28 $1.05 $0.83
Woodlands/Far North 16,497 86.4% $1.38 $1.13 $0.89
Conroe/Montgomery 7,598 93.6% $1.12 $0.99 $0.82
Hwy 288/South 13,192 92.9% $1.35 $1.02 $0.77
Gulfgate/Almeda Mall 22,083 95.1% $1.20 $1.03 $0.85
Galena Park/Jacinto City 362 98.9% - $1.03 $0.76
Pasadena/Deer Park 21,858 93.3% $1.34 $1.01 $0.86
Friendswood/Pearland 5,541 96.8% $1.32 $1.08 $0.95
Clear Lake 24,520 95.5% $1.30 $1.10 $0.93
Baytown 9,397 92.2% $1.31 $1.02 $0.86
Galveston/Brazoria 20,709 92.1% $1.42 $1.03 $0.87
Galleria 23,916 90.4% $1.76 $1.14 $0.93
Woodlake/Westheimer 11,917 91.8% $1.47 $1.05 $0.93
West Memorial/Briar Forest 26,780 86.8% $1.52 $1.11 $0.89
Westchase 14,357 91.8% $1.40 $1.12 $0.97
Alief 27,276 94.0% $1.20 $1.04 $0.89
Sharpstown/Westwood 25,536 92.3% - $0.99 $0.88
Gulfton/ Bissonnet 16,900 95.4% $1.43 $1.04 $0.85
Braeswood/Fondren SW 21,937 88.9% $1.21 $1.07 $0.85
Almeda/South Main 4,280 93.9% $1.37 $0.98 $0.83
Fort Bend 13,520 88.2% $1.36 $1.14 $0.88
Richmond/Rosenburg 4,536 94.8% $1.27 $1.07 $0.85
total - HOustOn 598,074 91.4% $1.53 $1.07 $0.87
Source: Apartment Data Services, Inc.

MARKET WATCH HOUSTON MULTIFAMILY MARKET SEpTEMbER 2015
HOUSTON MULTIFAMILY MARKET WATCHSepTeMber 2015
CBDCBD
45
45
1010
610
290
59
90
288
99
249
8
35
6
11
11 22
33
44
55
66
77
88
11
11
11
22
22
22
22
33
33
44
44
55
55 66 77
88
99
1010
1111
6677
88
99
1010
33
33
44
44
55
55
66
77
Montrose/Museum District
Inner Loop West/Greenway Plaza
Medical Center/Bellaire
Heights
Inner Loop East
Northshore/Wood Forest
Eastex Fwy/Near Northeast
Northline/Aldine
Greenspoint
FM 1960 East/IAH Airport
Lake Houston/Kingwood
Far East
1
2
3
4
5
1
2
6
7
3
4
5
CENTR
AL
Brookhollow
Spring Branch
Inwood/Northwest
FM 1960 West/Champions
FM 1960 West/Steeplechase
Bear Creek/Copperfield
Katy/Far West
Tomball/Far Northwest
The Woodlands/Far North
Conroe/Montgomery
1
2
3
4
5
6
7
8
9
10
NORTH
WEST
Hwy 288/South
Gulfgate/Almeda Mall
Galena Park/Jacinto City
Pasadena/Deer Park
Friendswood/Pearland
Clear Lake
Baytown
Galveston/Brazoria
1
2
3
4
5
6
7
8
SOUTH
EAST
Galleria
Woodlake/Westheimer
West Memorial/Briar Forest
Westchase
Alief
Sharpstown/Westwood
Gulfton/Bissonnet
Braeswood/Fondren SW
Almeda/South Main
Fort Bend
Richmond/Rosenberg
1
2
3
4
5
6
7
8
9
10
11
SOUTH
WEST
NORTH
EAST
Houston | MULTIFAMILY SUBMARKETS
centR al
1. Montrose/Museum District2. Inner Loop West/Greenway Plaza3. Medical Center/Bellaire4. Heights5. Inner Loop East
nORtHeast
1. Northshore/Wood Forest2. Eastex Fwy/Near Northeast3. Northline/Aldine
4. Greenspoint5. FM 1960 East/IAH Airport6. Lake Houston/Kingwood7. Far East
nORtHwest
1. Brookhollow2. Spring Branch3. Inwood/Northwest4. FM 1960 West/Champions5. FM 1960 West/Steeplechase
6. Bear Creek/Copperfield7. Katy/Far West8. Tomball/Far Northwest9. The Woodlands/Far North10. Conroe/Montgomery
sOutHwest
1. Galleria2. Woodlake/Westheimer3. West Memorial/Briar Forest4. Westchase
5. Alief6. Sharpstown/Westwood7. Gulfton/Bissonnet8. Braeswood/Fondren SW9. Almeda/South Main10. Fort Bend11. Richmond/Rosenberg
sOutHeast
1. Hwy 288/South2. Gulfgate/Almeda Mall
3. Galena Park/Jacinto City4. Pasadena/Deer Park5. Friendswood/Pearland6. Clear Lake7. Baytown8. Galveston/Brazoria

Copyright © 2015 Transwestern. All rights reserved. No part of this work may be reproduced or distributed to third parties without written permission of the copyright owner. The information contained in this report was gathered by Transwestern from CoStar and other primary and secondary sources believed to be reliable. Transwestern, however, makes no representation concerning the accuracy or completeness of such information and expressly disclaims any responsibility for any inaccuracy contained herein.
HOUSTON MULTIFAMILY MARKET WATCHSepTeMber 2015
SEATTLE
WALNUT CREEK
LOS ANGELES
SALT LAKECITY
DENVER
MINNEAPOLIS
MILWAUKEE
ST. LOUIS
CHICAGO
DETROIT GREENWICHNEW YORK
NEW JERSEY
BALTIMORENORTHERNVIRGINIA
BETHESDAWASHINGTON DC
DALLASFORTWORTH
HOUSTONAUSTIN
SAN ANTONIO
OKLAHOMACITY
NEW ORLEANS
ATLANTA
FORT LAUDERDALEORLANDO
MIAMI-DADE
SANFRANCISCO
PHOENIXORANGE COUNTY
SAN DIEGO
BOSTON
SILICONVALLEY
TRANSWESTERNLOCATIONS
HOustOn multifamily team
Ed CumminsSenior Vice [email protected]
Guadalupe OlivaresAssistant Vice [email protected]
MethODOLOGy
The information in this report is the result of a compilation of publicly available data from a variety of commercial and government sources.
cONtact
Rachel AlexanderDirector of Market [email protected]
t 713.270.7700 f 713.270.6285www.transwestern.net/houston
1900 West Loop South, Suite 1300Houston, Texas 77027
Ryan MendezSenior [email protected]
aBOut tR answesteRn
Transwestern is a privately held real estate firm specializing in agency leasing, property and facilities management, tenant advisory, capital markets, research and sustainability. The fully integrated global enterprise leverages competencies in office, industrial, retail, multifamily and healthcare properties to add value for investors, owners and occupiers of real estate. As a member of the Transwestern family of companies, the firm capitalizes on market insights and operational expertise of independent affiliates specializing in development, real estate investment management and research. Transwestern has 34 U.S. offices and assists clients through more than 180 offices in 38 countries as part of a strategic alliance with Paris-based BNP Paribas Real Estate.
Transwestern was founded in Houston, Texas in 1978, and Houston remains the corporate headquarters today. As one of the preeminent commercial real estate firms in Houston, we offer a comprehensive menu of real estate services designed to provide owners, tenants and investors with the optimum solutions for their unique requirements. Transwestern has seasoned veterans in every area of expertise with the integrity, experience and creativity to be the best partner for its clients. Transwestern’s Houston office currently employs over 400 team members and has been an innovator in the Houston market for 37 years.
Tim GregorySenior Vice [email protected]
Michael SnodgrassManaging Director - Structured [email protected]
Jan SparksManaging Director - Structured [email protected]
Kevin RobertsPresident, [email protected]

HOUSTON MULTIFAMILYAUGUST 2015
MARKET WATCH
RECENT MULTIFAMILY SALES
Galleria :: The Palms on Westheimer798 units6425 Westheimer RdBuyer: Vende CapitalSeller: BRT Realty Trust & White Oak Partners joint venture
West Memorial/Briar Forest:: Monte Carlo592 units10950 Briar ForestBuyer: Oro Capital AdvisorsSeller: ROC/Bridge Partners
Spring Branch :: Hunters Chase328 units10000 Hammerly BlvdBuyer: Thorpe Family TrustSeller: Besyata Investment Group
Monthly StatisticsHOUSTON MSA JULY 2015
Occupancy 91.3%
Price ($/Mo) $965
Rental Rate ($/SF/Mo) $1.10
Average Size (SF) 878
Number of Communities 2,583
Number of Units 599,529
Under Construction (units) 23,901
Units Absorbed (past 12 months) 14,995
% Offering Concessions 22%
Average Concession Package 5.5%Source: Apartment Data Services, Inc.
Multifamily Sales StatisticsHOUSTON MSA UNITED STATES
QUARTER TO DATE
LAST QUARTER (Q2 2015)
TRAILING 12
MONTHS
LAST QUARTER (Q2 2015)
TRAILING 12
MONTHS
Volume ($ Mil)
$368.6 $1,181.8 $5,583.8 $30,651.7 $130,601.7
No. of Properties
18 52 279 1,829 7,347
Total No. of Units
6,236 16,999 75,218 262,898 1,112,657
Avg. Price per Unit
$109,244 $82,478 $93,764 $127,347 $131,122
Avg. Cap Rate
N/A 7.4% 6.9% 5.9% 6.0%
Source: Real Capital Analytics
Q2 2015 Houston MSA Overview
SUBMARKET RENTABLE
UNITSOCCUPANCY
RENTAL RATE (PSF)
CLASS A CLASS B CLASS C
Montrose/Museum District 13,569 92.2% $1.90 $1.24 $0.76
Inner Loop West/Greenway Plaza 16,361 82.4% $1.86 $1.25 -
Medical Center/Bellaire 21,080 92.1% $1.66 $1.17 $0.94
Heights 4,132 82.3% $1.84 $1.17 $1.06
Inner Loop East 8,424 92.9% $2.05 $1.02 $0.84
Northshore/Wood Forest 8,646 92.1% - $1.02 $0.88
Eastex Frwy/Near Northeast 5,503 95.0% - $0.93 $0.79
Northline/Aldine 9,944 94.4% - $0.91 $0.82
Greenspoint 9,473 93.4% - $1.08 $0.84
FM 1960 East/IAH Airport 8,930 92.1% $1.10 $1.03 $0.87
Lake Houston/Kingwood 11,446 93.7% $1.24 $1.12 $0.80
Far East 4,833 88.7% $1.13 $0.95 $0.78
Brookhollow 20,302 93.6% 1.706 1.094 0.856
Spring Branch 18,313 94.1% $1.42 $1.04 $0.85
Inwood/Northwest 7,383 95.3% $1.19 $0.94 $0.86
FM 1960 West/Champions 37,600 92.5% $1.24 $1.06 $0.88
FM 1960 West/Steeplechase 19,323 95.2% $1.27 $1.07 $0.88
Bear Creek/Copperfield 13,573 90.1% $1.28 $1.13 $0.87
Katy/ Far West 21,016 77.7% $1.27 $1.09 $0.90
Tomball/Far Northwest 5,511 77.4% $1.28 $1.05 $0.83
Woodlands/Far North 16,497 86.4% $1.38 $1.13 $0.89
Conroe/Montgomery 7,598 93.6% $1.12 $0.99 $0.82
Hwy 288/South 13,192 92.9% $1.35 $1.02 $0.77
Gulfgate/Almeda Mall 22,083 95.1% $1.20 $1.03 $0.85
Galena Park/Jacinto City 362 98.9% - $1.03 $0.76
Pasadena/Deer Park 21,858 93.3% $1.34 $1.01 $0.86
Friendswood/Pearland 5,541 96.8% $1.32 $1.08 $0.95
Clear Lake 24,520 95.5% $1.30 $1.10 $0.93
Baytown 9,397 92.2% $1.31 $1.02 $0.86
Galveston/Brazoria 20,709 92.1% $1.42 $1.03 $0.87
Galleria 23,916 90.4% $1.76 $1.14 $0.93
Woodlake/Westheimer 11,917 91.8% $1.47 $1.05 $0.93
West Memorial/Briar Forest 26,780 86.8% $1.52 $1.11 $0.89
Westchase 14,357 91.8% $1.40 $1.12 $0.97
Alief 27,276 94.0% $1.20 $1.04 $0.89
Sharpstown/Westwood 25,536 92.3% - $0.99 $0.88
Gulfton/ Bissonnet 16,900 95.4% $1.43 $1.04 $0.85
Braeswood/Fondren SW 21,937 88.9% $1.21 $1.07 $0.85
Almeda/South Main 4,280 93.9% $1.37 $0.98 $0.83
Fort Bend 13,520 88.2% $1.36 $1.14 $0.88
Richmond/Rosenburg 4,536 94.8% $1.27 $1.07 $0.85
Total - HOUSTON 598,074 91.4% $1.53 $1.07 $0.87
Source: Apartment Data Services, Inc.
MARKET WATCH HOUSTON MULTIFAMILY MARKET AUGUST 2015
HOUSTON MULTIFAMILY MARKET WATCHAUGUST 2015
CBDCBD
45
45
1010
610
290
59
90
288
99
249
8
35
6
11
11 22
33
44
55
66
77
88
11
11
11
22
22
22
22
33
33
44
44
55
55 66 77
88
99
1010
1111
6677
88
99
1010
33
33
44
44
55
55
66
77
Montrose/Museum District
Inner Loop West/Greenway Plaza
Medical Center/Bellaire
Heights
Inner Loop East
Northshore/Wood Forest
Eastex Fwy/Near Northeast
Northline/Aldine
Greenspoint
FM 1960 East/IAH Airport
Lake Houston/Kingwood
Far East
1
2
3
4
5
1
2
6
7
3
4
5
CENTR
AL
Brookhollow
Spring Branch
Inwood/Northwest
FM 1960 West/Champions
FM 1960 West/Steeplechase
Bear Creek/Copperfield
Katy/Far West
Tomball/Far Northwest
The Woodlands/Far North
Conroe/Montgomery
1
2
3
4
5
6
7
8
9
10
NORTH
WEST
Hwy 288/South
Gulfgate/Almeda Mall
Galena Park/Jacinto City
Pasadena/Deer Park
Friendswood/Pearland
Clear Lake
Baytown
Galveston/Brazoria
1
2
3
4
5
6
7
8
SOUTH
EAST
Galleria
Woodlake/Westheimer
West Memorial/Briar Forest
Westchase
Alief
Sharpstown/Westwood
Gulfton/Bissonnet
Braeswood/Fondren SW
Almeda/South Main
Fort Bend
Richmond/Rosenberg
1
2
3
4
5
6
7
8
9
10
11
SOUTH
WEST
NORTH
EAST
Houston | MULTIFAMILY SUBMARKETS
CENTR AL
1. Montrose/Museum District2. Inner Loop West/Greenway Plaza3. Medical Center/Bellaire4. Heights5. Inner Loop East
NORTHEAST
1. Northshore/Wood Forest2. Eastex Fwy/Near Northeast3. Northline/Aldine
4. Greenspoint5. FM 1960 East/IAH Airport6. Lake Houston/Kingwood7. Far East
NORTHWEST
1. Brookhollow2. Spring Branch3. Inwood/Northwest4. FM 1960 West/Champions5. FM 1960 West/Steeplechase
6. Bear Creek/Copperfield7. Katy/Far West8. Tomball/Far Northwest9. The Woodlands/Far North10. Conroe/Montgomery
SOUTHWEST
1. Galleria2. Woodlake/Westheimer3. West Memorial/Briar Forest4. Westchase
5. Alief6. Sharpstown/Westwood7. Gulfton/Bissonnet8. Braeswood/Fondren SW9. Almeda/South Main10. Fort Bend11. Richmond/Rosenberg
SOUTHEAST
1. Hwy 288/South2. Gulfgate/Almeda Mall
3. Galena Park/Jacinto City4. Pasadena/Deer Park5. Friendswood/Pearland6. Clear Lake7. Baytown8. Galveston/Brazoria

Copyright © 2015 Transwestern. All rights reserved. No part of this work may be reproduced or distributed to third parties without written permission of the copyright owner. The information contained in this report was gathered by Transwestern from CoStar and other primary and secondary sources believed to be reliable. Transwestern, however, makes no representation concerning the accuracy or completeness of such information and expressly disclaims any responsibility for any inaccuracy contained herein.
HOUSTON MULTIFAMILY MARKET WATCHAUGUST 2015
SEATTLE
WALNUT CREEK
LOS ANGELES
SALT LAKECITY
DENVER
MINNEAPOLIS
MILWAUKEE
ST. LOUIS
CHICAGO
DETROIT GREENWICHNEW YORK
NEW JERSEY
BALTIMORENORTHERNVIRGINIA
BETHESDAWASHINGTON DC
DALLASFORTWORTH
HOUSTONAUSTIN
SAN ANTONIO
OKLAHOMACITY
NEW ORLEANS
ATLANTA
FORT LAUDERDALEORLANDO
MIAMI-DADE
SANFRANCISCO
PHOENIXORANGE COUNTY
SAN DIEGO
BOSTON
SILICONVALLEY
TRANSWESTERNLOCATIONS
HOUSTON MULTIFAMILY TEAM
Ed CumminsSenior Vice [email protected]
Guadalupe OlivaresAssistant Vice [email protected]
METHODOLOGY
The information in this report is the result of a compilation of publicly available data from a variety of commercial and government sources.
CONTACT
Rachel AlexanderDirector of Market [email protected]
T 713.270.7700 F 713.270.6285www.transwestern.net/houston
1900 West Loop South, Suite 1300Houston, Texas 77027
Ryan MendezSenior [email protected]
ABOUT TR ANSWESTERN
Transwestern is a privately held real estate firm specializing in agency leasing, property and facilities management, tenant advisory, capital markets, research and sustainability. The fully integrated global enterprise leverages competencies in office, industrial, retail, multifamily and healthcare properties to add value for investors, owners and occupiers of real estate. As a member of the Transwestern family of companies, the firm capitalizes on market insights and operational expertise of independent affiliates specializing in development, real estate investment management and research. Transwestern has 34 U.S. offices and assists clients through more than 180 offices in 38 countries as part of a strategic alliance with Paris-based BNP Paribas Real Estate.
Transwestern was founded in Houston, Texas in 1978, and Houston remains the corporate headquarters today. As one of the preeminent commercial real estate firms in Houston, we offer a comprehensive menu of real estate services designed to provide owners, tenants and investors with the optimum solutions for their unique requirements. Transwestern has seasoned veterans in every area of expertise with the integrity, experience and creativity to be the best partner for its clients. Transwestern’s Houston office currently employs over 400 team members and has been an innovator in the Houston market for 37 years.
Tim GregorySenior Vice [email protected]
Michael SnodgrassManaging Director - Structured [email protected]
Jan SparksManaging Director - Structured [email protected]
Kevin RobertsPresident, [email protected]

HOUSTON MULTIFAMILYJUNE 2015
MARKET WATCH
RECENT MULTIFAMILY SALES
West Memorial/Briar Forest :: Renaissance Village at Shadow Lake624 units2920 Shadowbriar DrBuyer: Olympus PropertySeller: Angelo Gordon
West Memorial/Briar Forest :: Morgan West Oaks671 units2400 Briarwest BlvdBuyer: Panther Group & ComCapp joint ventureSeller: Morgan Management
Galleria :: Broadstone Post Oak272 units3100 Post Oak BlvdBuyer: China Construction America, IncSeller: Alliance Residential
Monthly StatisticsHOUSTON MSA JUNE 2015
Occupancy 91.2%
Price ($/Mo) $956
Rental Rate ($/SF/Mo) $1.09
Average Size (SF) 877
Number of Communities 2,580
Number of Units 597,732
Under Construction (units) 21,035
Units Absorbed (past 12 months) 13,428
% Offering Concessions 23%
Average Concession Package 5.4%Source: Apartment Data Services, Inc.
Multifamily Sales StatisticsHOUSTON MSA UNITED STATES
QUARTER TO DATE
LAST QUARTER
(1Q15)
TRAILING 12
MONTHS
LAST QUARTER
(1Q15)
TRAILING 12
MONTHS
Volume ($ Mil)
$578.8 $1,256.2 $5,634.7 $33,526.7 $125,746.4
No. of Properties
29 60 293 1,783 7,113
Total No. of Units
10,558 16,061 73,693 279,289 1,076,712
Avg. Price per Unit
$87,674 $95,524 $103,829 $134,618 $128,897
Avg. Cap Rate
7.5% 7.1% 7.0% 5.9% 6.1%
Source: Real Capital Analytics
1Q 2015 Houston MSA Overview
SUBMARKET RENTABLE
UNITSOCCUPANCY
RENTAL RATE (PSF)
CLASS A CLASS B CLASS C
Alief 27,276 93.8% $1.19 $1.03 $0.86
Almeda/South Main 4,280 94.7% $1.33 $1.01 $0.80
Baytown 9,157 94.5% $1.28 $0.99 $0.84
Bear Creek/Copperfield 13,363 91.9% $1.27 $1.11 $0.85
Braeswood/Fondren SW 21,937 89.9% $1.02 $0.83 $0.65
Brookhollow 20,299 93.4% $1.59 $1.07 $0.84
Clear Lake 24,520 94.6% $1.27 $1.08 $0.92
Conroe/Montgomery 7,598 93.4% $1.13 $0.97 $0.82
Eastex Frwy/Near Northeast 5,503 94.8% $0.91 $0.79
Far East 4,823 87.2% $1.18 $0.83 $0.76
FM 1960 East/IAH Airport 8,600 95.5% $1.24 $0.98 $0.84
FM 1960 West/Champions 37,693 92.2% $1.22 $1.05 $0.86
FM 1960 West/Steeplechase 19,332 94.0% $1.28 $1.07 $0.83
Fort Bend 13,520 96.0% $1.32 $1.12 $0.84
Friendswood/Pearland 5,541 96.3% $1.29 $1.06 $0.92
Galena Park/Jacinto City 362 96.1% $0.97
Galleria 23,656 90.2% $1.74 $1.11 $0.90
Galveston/Brazoria 20,715 91.1% $1.32 $0.99 $0.84
Greenspoint 9,473 92.3% $0.98 $0.85
Gulfgate/Almeda Mall 21,956 95.1% $1.00 $0.83
Gulfton/Bissonnet 16,900 95.1% $1.32 $1.11 $0.84
Heights 4,132 78.9% $1.77 $1.13
Highway 288/South 13,192 91.1% $1.26 $0.99 $0.76
Inner Loop East 8,424 92.2% $1.86 $0.94 $0.83
Inner Loop West/Greenway Plaza 15,725 82.7% $1.80 $1.26 $0.93
Inwood/Northwest 7,256 94.5% $1.27 $0.88 $0.82
Katy/Far West 20,403 78.8% $1.27 $1.09 $0.85
Lake Houston/Kingwood 11,850 92.0% $1.22 $1.09 $0.80
Medical Center/Bellaire 20,516 94.6% $1.62 $1.13 $0.94
Montrose/Museum District 13,533 90.5% $1.87 $1.23 $0.71
Northline/Aldine 9,946 94.5% $1.04 $0.89 $0.82
Northshore/Wood Forest 8,646 92.4% $0.98 $0.83
Pasadena/Deer Park 21,862 92.6% $1.33 $1.01 $0.82
Richmond/Rosenburg 4,536 94.6% $1.27 $1.03 $0.84
Sharpstown/Westwood 25,414 92.0% $0.97 $0.84
Spring Branch 18,427 93.6% $1.44 $1.00 $0.83
Tomball/Far Northwest 5,127 74.7% $1.27 $1.05 $0.82
West Memorial/Briar Forest 26,401 86.7% $1.49 $1.07 $0.88
Westchase 14,357 91.7% $1.42 $1.11 $0.93
Woodlake/Westheimer 11,803 91.1% $1.48 $1.07 $0.88
Woodlands/Far North 16,189 83.9% $1.34 $1.11 $0.86
Total - HOUSTON 594,243 91.1% $1.50 $1.05 $0.85
Source: Apartment Data Services, Inc.

MARKET WATCH HOUSTON MULTIFAMILY MARKET JUNE 2015
HOUSTON MULTIFAMILY MARKET WATCHJUNE 2015
CBDCBD
45
45
1010
610
290
59
90
288
99
249
8
35
6
11
11 22
33
44
55
66
77
88
11
11
11
22
22
22
22
33
33
44
44
55
55 66 77
88
99
1010
1111
6677
88
99
1010
33
33
44
44
55
55
66
77
Montrose/Museum District
Inner Loop West/Greenway Plaza
Medical Center/Bellaire
Heights
Inner Loop East
Northshore/Wood Forest
Eastex Fwy/Near Northeast
Northline/Aldine
Greenspoint
FM 1960 East/IAH Airport
Lake Houston/Kingwood
Far East
1
2
3
4
5
1
2
6
7
3
4
5
CENTR
AL
Brookhollow
Spring Branch
Inwood/Northwest
FM 1960 West/Champions
FM 1960 West/Steeplechase
Bear Creek/Copperfield
Katy/Far West
Tomball/Far Northwest
The Woodlands/Far North
Conroe/Montgomery
1
2
3
4
5
6
7
8
9
10
NORTH
WEST
Hwy 288/South
Gulfgate/Almeda Mall
Galena Park/Jacinto City
Pasadena/Deer Park
Friendswood/Pearland
Clear Lake
Baytown
Galveston/Brazoria
1
2
3
4
5
6
7
8
SOUTH
EAST
Galleria
Woodlake/Westheimer
West Memorial/Briar Forest
Westchase
Alief
Sharpstown/Westwood
Gulfton/Bissonnet
Braeswood/Fondren SW
Almeda/South Main
Fort Bend
Richmond/Rosenberg
1
2
3
4
5
6
7
8
9
10
11
SOUTH
WEST
NORTH
EAST
Houston | MULTIFAMILY SUBMARKETS
CENTR AL
1. Montrose/Museum District2. Inner Loop West/Greenway Plaza3. Medical Center/Bellaire4. Heights5. Inner Loop East
NORTHEAST
1. Northshore/Wood Forest2. Eastex Fwy/Near Northeast3. Northline/Aldine
4. Greenspoint5. FM 1960 East/IAH Airport6. Lake Houston/Kingwood7. Far East
NORTHWEST
1. Brookhollow2. Spring Branch3. Inwood/Northwest4. FM 1960 West/Champions5. FM 1960 West/Steeplechase
6. Bear Creek/Copperfield7. Katy/Far West8. Tomball/Far Northwest9. The Woodlands/Far North10. Conroe/Montgomery
SOUTHWEST
1. Galleria2. Woodlake/Westheimer3. West Memorial/Briar Forest4. Westchase
5. Alief6. Sharpstown/Westwood7. Gulfton/Bissonnet8. Braeswood/Fondren SW9. Almeda/South Main10. Fort Bend11. Richmond/Rosenberg
SOUTHEAST
1. Hwy 288/South2. Gulfgate/Almeda Mall
3. Galena Park/Jacinto City4. Pasadena/Deer Park5. Friendswood/Pearland6. Clear Lake7. Baytown8. Galveston/Brazoria

Copyright © 2015 Transwestern. All rights reserved. No part of this work may be reproduced or distributed to third parties without written permission of the copyright owner. The information contained in this report was gathered by Transwestern from CoStar and other primary and secondary sources believed to be reliable. Transwestern, however, makes no representation concerning the accuracy or completeness of such information and expressly disclaims any responsibility for any inaccuracy contained herein.
HOUSTON MULTIFAMILY MARKET WATCHJUNE 2015
SEATTLE
WALNUT CREEK
LOS ANGELES
SALT LAKECITY
DENVER
MINNEAPOLIS
MILWAUKEE
ST. LOUIS
CHICAGO
DETROIT GREENWICHNEW YORK
NEW JERSEY
BALTIMORENORTHERNVIRGINIA
BETHESDAWASHINGTON DC
DALLASFORTWORTH
HOUSTONAUSTIN
SAN ANTONIO
OKLAHOMACITY
NEW ORLEANS
ATLANTA
FORT LAUDERDALEORLANDO
MIAMI-DADE
SANFRANCISCO
PHOENIXORANGE COUNTY
SAN DIEGO
BOSTON
SILICONVALLEY
TRANSWESTERNLOCATIONS
HOUSTON MULTIFAMILY TEAM
Ed CumminsSenior Vice [email protected]
Guadalupe OlivaresAssistant Vice [email protected]
METHODOLOGY
The information in this report is the result of a compilation of publicly available data from a variety of commercial and government sources.
CONTACT
Rachel AlexanderDirector of Market [email protected]
T 713.270.7700 F 713.270.6285www.transwestern.net/houston
1900 West Loop South, Suite 1300Houston, Texas 77027
Ryan MendezSenior [email protected]
ABOUT TR ANSWESTERN
Transwestern is a privately held real estate firm specializing in agency leasing, property and facilities management, tenant advisory, capital markets, research and sustainability. The fully integrated global enterprise leverages competencies in office, industrial, retail, multifamily and healthcare properties to add value for investors, owners and occupiers of real estate. As a member of the Transwestern family of companies, the firm capitalizes on market insights and operational expertise of independent affiliates specializing in development, real estate investment management and research. Transwestern has 34 U.S. offices and assists clients through more than 180 offices in 38 countries as part of a strategic alliance with Paris-based BNP Paribas Real Estate.
Transwestern was founded in Houston, Texas in 1978, and Houston remains the corporate headquarters today. As one of the preeminent commercial real estate firms in Houston, we offer a comprehensive menu of real estate services designed to provide owners, tenants and investors with the optimum solutions for their unique requirements. Transwestern has seasoned veterans in every area of expertise with the integrity, experience and creativity to be the best partner for its clients. Transwestern’s Houston office currently employs over 400 team members and has been an innovator in the Houston market for 37 years.
Tim GregorySenior Vice [email protected]
Michael SnodgrassManaging Director - Structured [email protected]
Jan SparksManaging Director - Structured [email protected]

HOUSTON MULTIFAMILYMArcH 2015
Market Watch
Recent multifamily sales
Gulfgate/Almeda Mall :: The Alcove292 units77 E EdgebrookBuyer: GWR Equities, LLCSeller: Resource REIT
FM 1960 West/Steeplechase:: The Avenues at Northpointe280 units11740 Northpointe BlvdBuyer: Preferred Apt CommunitiesSeller: Davis Development
FM 1960 West/Champions :: San Antigua277 units15300 Cutten RdBuyer: Ergas GroupSeller: Sueba Commercial
Monthly StatisticshOUStON MSa febrUary 2015
Occupancy 91.2%
Price ($/Mo) $933
Rental Rate ($/SF/Mo) 106.4
Average Size (SF) 877
Number of Communities 2,557
Number of Units 590,879
Under Construction (units) 28,212
Units Absorbed (past 12 months) 15,912
% Offering Concessions 25%
Average Concession Package 5.3%Source: Apartment Data Services, Inc.
Sales StatisticshOUStON MSa UNIteD StateS
QUarter tO Date
LaSt QUarter
(4Q14)
traILING 12
MONthS
LaSt QUarter
(4Q14)
traILING 12
MONthS
Volume ($ Mil)
$940.3 $1,600.2 $5,223.0 $34,540.0 $111,385.3
No. of Properties
44 84 280 1,845 6,715
Total No. of Units
11,894 20,564 69,541 285,094 990,766
Avg. Price per Unit
N/A $94,884 $101,748 $132,845 $123,688
Avg. Cap Rate
7.5% 7.4% 7.1% 6.0% 6.1%
Source: Real Capital Analytics
4Q 2014 Houston MSA Overview
SUBMARKETRENTABLE
UNITSOCCUPANCY
RENTAL RATE (PSF)
CLASS A CLASS B CLASS C
Alief 27,276 93.7% 122.2 100.4 83.6
Almeda/South Main 4,280 94.5% 129.6 101.2 82.1
Baytown 9,157 92.5% 124.6 100.4 82.2
Bear Creek/Copperfield 13,021 94.8% 116.2 107.8 84.5
Braeswood/Fondren SW 21,937 89.2% 110.9 99.6 81
Brookhollow 20,432 93.0% 155.7 98.8 81.5
Clear Lake 24,520 97.0% 124.3 104.8 89.2
Conroe/Montgomery 7,598 92.5% 109.5 96.2 80.6
Eastex Frwy/Near Northeast 5,503 95.0% 89.1 76.4
Far East 4,743 89.2% 119.2 80 74.7
FM 1960 East/IAH Airport 8,600 94.6% 122.3 93.7 84.3
FM 1960 West/Champions 37,294 92.6% 120.1 101.8 82.3
FM 1960 West/Steeplechase 19,332 93.1% 122.8 104.1 83
Fort Bend 13,056 97.3% 129.6 107.8 84.4
Friendswood/Pearland 5,541 95.8% 126.1 103 89.4
Galena Park/Jacinto City 362 96.4% 96.9
Galleria 23,463 90.5% 172.6 110.4 90.7
Galveston/Brazoria 20,715 89.9% 120 96.7 82.1
Greenspoint 9,473 89.1% 84 83.9
Gulfgate/Almeda Mall 21,956 94.0% 114.8 96.1 79.6
Gulfton/Bissonnet 16,901 95.1% 145.6 100.3 80.3
Heights 3,744 85.3% 172.7 110.4
Highway 288/South 13,216 89.6% 125.9 97.6 75
Inner Loop East 8,424 91.7% 189 90 81.2
Inner Loop West/Greenway Plaza 15,826 80.6% 179.1 120.5 93.4
Inwood/Northwest 7,256 94.6% 115.4 92.2 81.4
Katy/Far West 18,332 86.6% 126.7 104.5 85.8
Lake Houston/Kingwood 11,586 93.7% 120 106.5 81.5
Medical Center/Bellaire 20,516 93.9% 158.8 113.7 91.3
Montrose/Museum District 13,344 90.5% 184.1 120.8 69.5
Northline/Aldine 9,956 94.1% 94 87 79.4
Northshore/Wood Forest 8,646 91.1% 97 83.5
Pasadena/Deer Park 21,862 91.9% 127.2 97.9 79.3
Richmond/Rosenburg 4,536 93.8% 123.2 97.7 81.5
Sharpstown/Westwood 25,194 91.2% 92.5 82.6
Spring Branch 18,466 92.8% 144.2 100.2 81.8
Tomball/Far Northwest 5,127 69.0% 128.7 101.3 81.1
West Memorial/Briar Forest 25,775 87.8% 152.4 109.6 84.2
Westchase 14,092 92.2% 142.8 108.3 92
Woodlake/Westheimer 11,989 91.5% 144.6 104.8 86.8
Woodlands/Far North 15,799 83.9% 132.5 109.3 87.2
total - HOustOn 588,846 91.1% 147.2 102.2 82.3
Source: Apartment Data Services, Inc.

MARKET WATCH HOUSTON MULTIFAMILY MARKET MARcH 2015
HOUSTON MULTIFAMILY MARKET WATCHMArcH 2015
CBDCBD
45
45
1010
610
290
59
90
288
99
249
8
35
6
11
11 22
33
44
55
66
77
88
11
11
11
22
22
22
22
33
33
44
44
55
55 66 77
88
99
1010
1111
6677
88
99
1010
33
33
44
44
55
55
66
77
Montrose/Museum District
Inner Loop West/Greenway Plaza
Medical Center/Bellaire
Heights
Inner Loop East
Northshore/Wood Forest
Eastex Fwy/Near Northeast
Northline/Aldine
Greenspoint
FM 1960 East/IAH Airport
Lake Houston/Kingwood
Far East
1
2
3
4
5
1
2
6
7
3
4
5
CENTR
AL
Brookhollow
Spring Branch
Inwood/Northwest
FM 1960 West/Champions
FM 1960 West/Steeplechase
Bear Creek/Copperfield
Katy/Far West
Tomball/Far Northwest
The Woodlands/Far North
Conroe/Montgomery
1
2
3
4
5
6
7
8
9
10
NORTH
WEST
Hwy 288/South
Gulfgate/Almeda Mall
Galena Park/Jacinto City
Pasadena/Deer Park
Friendswood/Pearland
Clear Lake
Baytown
Galveston/Brazoria
1
2
3
4
5
6
7
8
SOUTH
EAST
Galleria
Woodlake/Westheimer
West Memorial/Briar Forest
Westchase
Alief
Sharpstown/Westwood
Gulfton/Bissonnet
Braeswood/Fondren SW
Almeda/South Main
Fort Bend
Richmond/Rosenberg
1
2
3
4
5
6
7
8
9
10
11
SOUTH
WEST
NORTH
EAST
Houston | MULTIFAMILY SUBMARKETS
centR al
1. Montrose/Museum District2. Inner Loop West/Greenway Plaza3. Medical Center/Bellaire4. Heights Inner Loop East
nORtHeast
1. Northshore/Wood Forest2. Eastex Fwy/Near Northeast3. Northline/Aldine4. Greenspoint
5. FM 1960 East/IAH Airport6. Lake Houston/Kingwood7. Far East
nORtHwest
1. Brookhollow2. Spring Branch3. Inwood/Northwest4. FM 1960 West/Champions5. FM 1960 West/Steeplechase6. Bear Creek/Copperfield
7. Katy/Far West8. Tomball/Far Northwest9. The Woodlands/Far North10. Conroe/Montgomery
sOutHwest
1. Galleria2. Woodlake/Westheimer3. West Memorial/Briar Forest4. Westchase5. Alief
6. Sharpstown/Westwood7. Gulfton/Bissonnet8. Braeswood/Fondren SW9. Almeda/South Main10. Fort Bend11. Richmond/Rosenberg
sOutHeast
1. Hwy 288/South2. Gulfgate/Almeda Mall3. Galena Park/Jacinto City
4. Pasadena/Deer Park5. Friendswood/Pearland6. Clear Lake7. Baytown8. Galveston/Brazoria

Copyright © 2015 Transwestern. All rights reserved. No part of this work may be reproduced or distributed to third parties without written permission of the copyright owner. The information contained in this report was gathered by Transwestern from CoStar and other primary and secondary sources believed to be reliable. Transwestern, however, makes no representation concerning the accuracy or completeness of such information and expressly disclaims any responsibility for any inaccuracy contained herein.
HOUSTON MULTIFAMILY MARKET WATCHMArcH 2015
SEATTLE
WALNUT CREEK
LOS ANGELES
SALT LAKECITY
DENVER
MINNEAPOLIS
MILWAUKEE
ST. LOUIS
CHICAGO
DETROIT GREENWICHNEW YORK
NEW JERSEY
BALTIMORENORTHERNVIRGINIA
BETHESDAWASHINGTON DC
DALLASFORTWORTH
HOUSTONAUSTIN
SAN ANTONIO
OKLAHOMACITY
NEW ORLEANS
ATLANTA
FORT LAUDERDALEORLANDO
MIAMI-DADE
SANFRANCISCO
PHOENIXORANGE COUNTY
SAN DIEGO
BOSTON
SILICONVALLEY
TRANSWESTERNLOCATIONS
HOustOn multifamily team
Ed CumminsSenior Vice [email protected]
Guadalupe OlivaresAssistant Vice [email protected]
MethODOLOGy
The information in this report is the result of a compilation of publicly available data from a variety of commercial and government sources.
cONtact
Rachel AlexanderDirector of Market [email protected]
t 713.270.7700 f 713.270.6285www.transwestern.net/houston
1900 West Loop South, Suite 1300Houston, Texas 77027
Ryan MendezSenior [email protected]
aBOut tR answesteRn
Transwestern is a privately held real estate firm specializing in agency leasing, property and facilities management, tenant advisory, capital markets, research and sustainability. The fully integrated global enterprise leverages competencies in office, industrial, retail, multifamily and healthcare properties to add value for investors, owners and occupiers of real estate. As a member of the Transwestern family of companies, the firm capitalizes on market insights and operational expertise of independent affiliates specializing in development, real estate investment management and research. Transwestern has 34 U.S. offices and assists clients through more than 180 offices in 38 countries as part of a strategic alliance with Paris-based BNP Paribas Real Estate.
Transwestern was founded in Houston, Texas in 1978, and Houston remains the corporate headquarters today. As one of the preeminent commercial real estate firms in Houston, we offer a comprehensive menu of real estate services designed to provide owners, tenants and investors with the optimum solutions for their unique requirements. Transwestern has seasoned veterans in every area of expertise with the integrity, experience and creativity to be the best partner for its clients. Transwestern’s Houston office currently employs over 400 team members and has been an innovator in the Houston market for 37 years.
Tim GregorySenior Vice [email protected]
Michael SnodgrassManaging Director - Structured [email protected]
Jan SparksManaging Director - Structured [email protected]
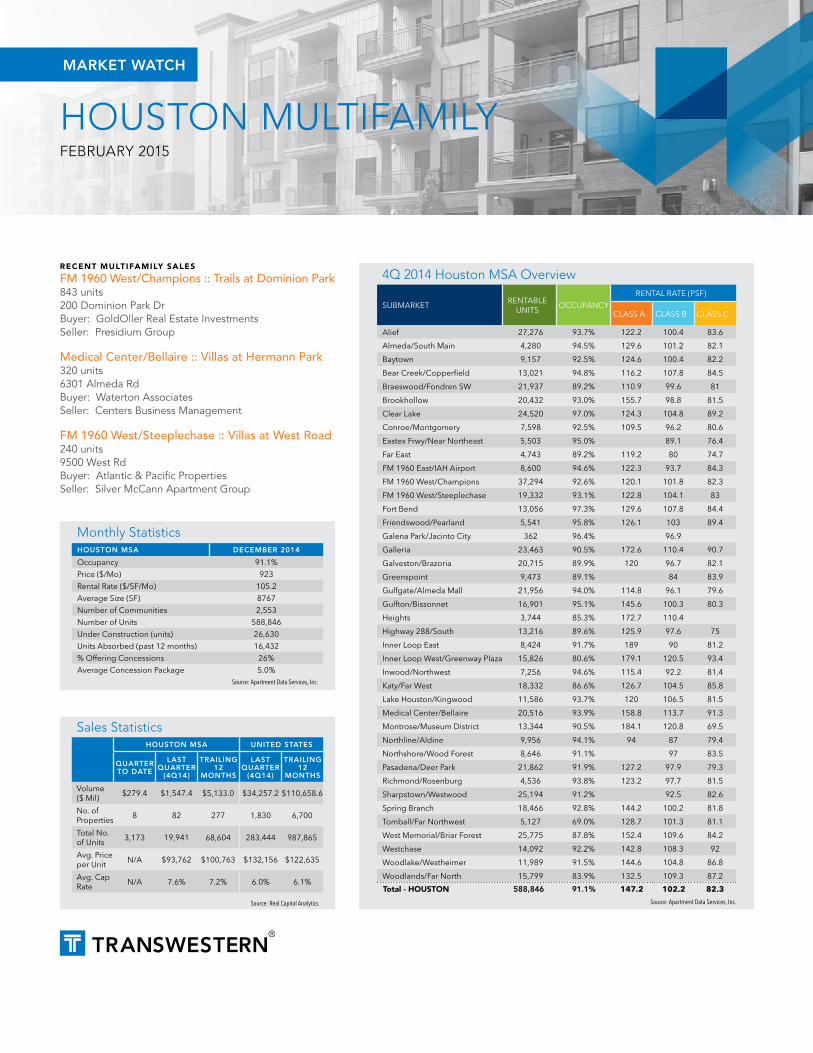
HOUSTON MULTIFAMILYFebrUArY 2015
Market Watch
recent multifamily sales
FM 1960 West/Champions :: Trails at Dominion Park843 units200 Dominion Park DrBuyer: GoldOller Real Estate InvestmentsSeller: Presidium Group
Medical Center/Bellaire :: Villas at Hermann Park320 units6301 Almeda RdBuyer: Waterton AssociatesSeller: Centers Business Management
FM 1960 West/Steeplechase :: Villas at West Road240 units9500 West RdBuyer: Atlantic & Pacific PropertiesSeller: Silver McCann Apartment Group
Monthly StatisticshOUStON MSa DeceMber 2014
Occupancy 91.1%
Price ($/Mo) 923
Rental Rate ($/SF/Mo) 105.2
Average Size (SF) 8767
Number of Communities 2,553
Number of Units 588,846
Under Construction (units) 26,630
Units Absorbed (past 12 months) 16,432
% Offering Concessions 26%
Average Concession Package 5.0%Source: Apartment Data Services, Inc.
Sales StatisticshOUStON MSa UNIteD StateS
QUarter tO Date
LaSt QUarter
(4Q14)
traILING 12
MONthS
LaSt QUarter
(4Q14)
traILING 12
MONthS
Volume ($ Mil)
$279.4 $1,547.4 $5,133.0 $34,257.2 $110,658.6
No. of Properties
8 82 277 1,830 6,700
Total No. of Units
3,173 19,941 68,604 283,444 987,865
Avg. Price per Unit
N/A $93,762 $100,763 $132,156 $122,635
Avg. Cap Rate
N/A 7.6% 7.2% 6.0% 6.1%
Source: Real Capital Analytics
4Q 2014 Houston MSA Overview
SUBMARKETRENTABLE
UNITSOCCUPANCY
RENTAL RATE (PSF)
CLASS A CLASS B CLASS C
Alief 27,276 93.7% 122.2 100.4 83.6
Almeda/South Main 4,280 94.5% 129.6 101.2 82.1
Baytown 9,157 92.5% 124.6 100.4 82.2
Bear Creek/Copperfield 13,021 94.8% 116.2 107.8 84.5
Braeswood/Fondren SW 21,937 89.2% 110.9 99.6 81
Brookhollow 20,432 93.0% 155.7 98.8 81.5
Clear Lake 24,520 97.0% 124.3 104.8 89.2
Conroe/Montgomery 7,598 92.5% 109.5 96.2 80.6
Eastex Frwy/Near Northeast 5,503 95.0% 89.1 76.4
Far East 4,743 89.2% 119.2 80 74.7
FM 1960 East/IAH Airport 8,600 94.6% 122.3 93.7 84.3
FM 1960 West/Champions 37,294 92.6% 120.1 101.8 82.3
FM 1960 West/Steeplechase 19,332 93.1% 122.8 104.1 83
Fort Bend 13,056 97.3% 129.6 107.8 84.4
Friendswood/Pearland 5,541 95.8% 126.1 103 89.4
Galena Park/Jacinto City 362 96.4% 96.9
Galleria 23,463 90.5% 172.6 110.4 90.7
Galveston/Brazoria 20,715 89.9% 120 96.7 82.1
Greenspoint 9,473 89.1% 84 83.9
Gulfgate/Almeda Mall 21,956 94.0% 114.8 96.1 79.6
Gulfton/Bissonnet 16,901 95.1% 145.6 100.3 80.3
Heights 3,744 85.3% 172.7 110.4
Highway 288/South 13,216 89.6% 125.9 97.6 75
Inner Loop East 8,424 91.7% 189 90 81.2
Inner Loop West/Greenway Plaza 15,826 80.6% 179.1 120.5 93.4
Inwood/Northwest 7,256 94.6% 115.4 92.2 81.4
Katy/Far West 18,332 86.6% 126.7 104.5 85.8
Lake Houston/Kingwood 11,586 93.7% 120 106.5 81.5
Medical Center/Bellaire 20,516 93.9% 158.8 113.7 91.3
Montrose/Museum District 13,344 90.5% 184.1 120.8 69.5
Northline/Aldine 9,956 94.1% 94 87 79.4
Northshore/Wood Forest 8,646 91.1% 97 83.5
Pasadena/Deer Park 21,862 91.9% 127.2 97.9 79.3
Richmond/Rosenburg 4,536 93.8% 123.2 97.7 81.5
Sharpstown/Westwood 25,194 91.2% 92.5 82.6
Spring Branch 18,466 92.8% 144.2 100.2 81.8
Tomball/Far Northwest 5,127 69.0% 128.7 101.3 81.1
West Memorial/Briar Forest 25,775 87.8% 152.4 109.6 84.2
Westchase 14,092 92.2% 142.8 108.3 92
Woodlake/Westheimer 11,989 91.5% 144.6 104.8 86.8
Woodlands/Far North 15,799 83.9% 132.5 109.3 87.2
total - HOustOn 588,846 91.1% 147.2 102.2 82.3
Source: Apartment Data Services, Inc.
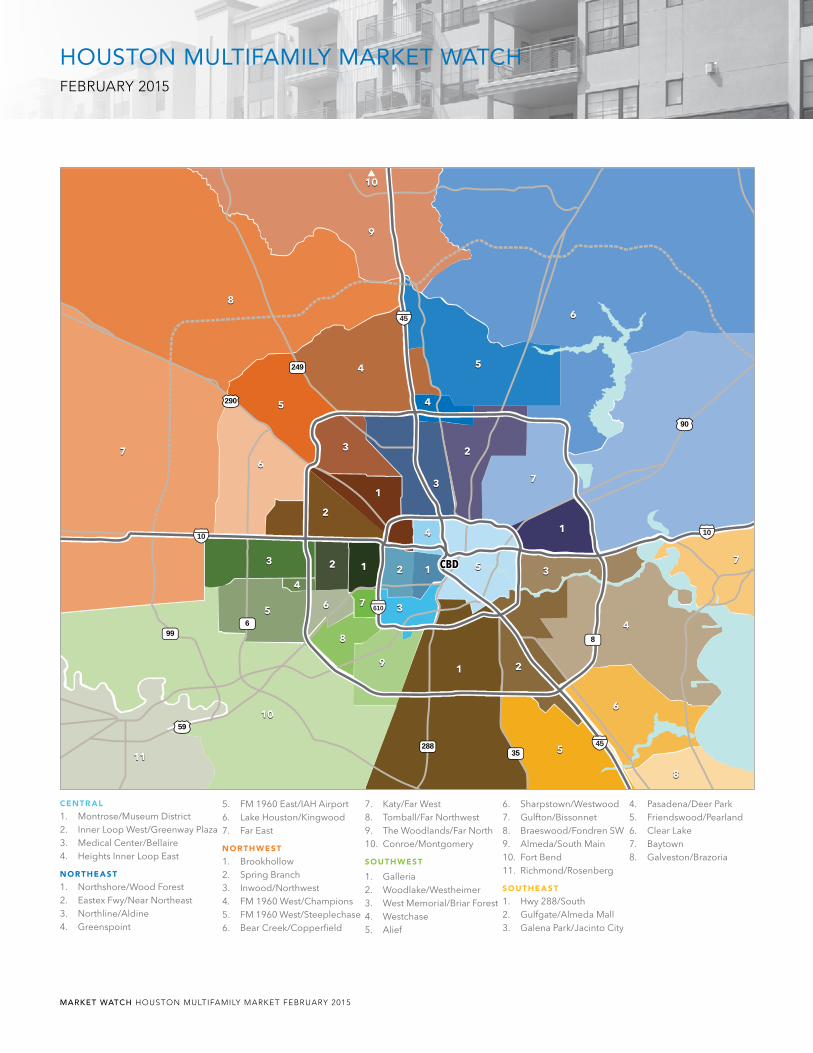
MARKET WATCH HOUSTON MULTIFAMILY MARKET FEBRUARY 2015
HOUSTON MULTIFAMILY MARKET WATCHFebrUArY 2015
CBDCBD
45
45
1010
610
290
59
90
288
99
249
8
35
6
11
11 22
33
44
55
66
77
88
11
11
11
22
22
22
22
33
33
44
44
55
55 66 77
88
99
1010
1111
6677
88
99
1010
33
33
44
44
55
55
66
77
Montrose/Museum District
Inner Loop West/Greenway Plaza
Medical Center/Bellaire
Heights
Inner Loop East
Northshore/Wood Forest
Eastex Fwy/Near Northeast
Northline/Aldine
Greenspoint
FM 1960 East/IAH Airport
Lake Houston/Kingwood
Far East
1
2
3
4
5
1
2
6
7
3
4
5
CENTR
AL
Brookhollow
Spring Branch
Inwood/Northwest
FM 1960 West/Champions
FM 1960 West/Steeplechase
Bear Creek/Copperfield
Katy/Far West
Tomball/Far Northwest
The Woodlands/Far North
Conroe/Montgomery
1
2
3
4
5
6
7
8
9
10
NORTH
WEST
Hwy 288/South
Gulfgate/Almeda Mall
Galena Park/Jacinto City
Pasadena/Deer Park
Friendswood/Pearland
Clear Lake
Baytown
Galveston/Brazoria
1
2
3
4
5
6
7
8
SOUTH
EAST
Galleria
Woodlake/Westheimer
West Memorial/Briar Forest
Westchase
Alief
Sharpstown/Westwood
Gulfton/Bissonnet
Braeswood/Fondren SW
Almeda/South Main
Fort Bend
Richmond/Rosenberg
1
2
3
4
5
6
7
8
9
10
11
SOUTH
WEST
NORTH
EAST
Houston | MULTIFAMILY SUBMARKETS
centr al
1. Montrose/Museum District2. Inner Loop West/Greenway Plaza3. Medical Center/Bellaire4. Heights Inner Loop East
nOrtHeast
1. Northshore/Wood Forest2. Eastex Fwy/Near Northeast3. Northline/Aldine4. Greenspoint
5. FM 1960 East/IAH Airport6. Lake Houston/Kingwood7. Far East
nOrtHwest
1. Brookhollow2. Spring Branch3. Inwood/Northwest4. FM 1960 West/Champions5. FM 1960 West/Steeplechase6. Bear Creek/Copperfield
7. Katy/Far West8. Tomball/Far Northwest9. The Woodlands/Far North10. Conroe/Montgomery
sOutHwest
1. Galleria2. Woodlake/Westheimer3. West Memorial/Briar Forest4. Westchase5. Alief
6. Sharpstown/Westwood7. Gulfton/Bissonnet8. Braeswood/Fondren SW9. Almeda/South Main10. Fort Bend11. Richmond/Rosenberg
sOutHeast
1. Hwy 288/South2. Gulfgate/Almeda Mall3. Galena Park/Jacinto City
4. Pasadena/Deer Park5. Friendswood/Pearland6. Clear Lake7. Baytown8. Galveston/Brazoria

Copyright © 2015 Transwestern. All rights reserved. No part of this work may be reproduced or distributed to third parties without written permission of the copyright owner. The information contained in this report was gathered by Transwestern from CoStar and other primary and secondary sources believed to be reliable. Transwestern, however, makes no representation concerning the accuracy or completeness of such information and expressly disclaims any responsibility for any inaccuracy contained herein.
HOUSTON MULTIFAMILY MARKET WATCHFebrUArY 2015
SEATTLE
WALNUT CREEK
LOS ANGELES
SALT LAKECITY
DENVER
MINNEAPOLIS
MILWAUKEE
ST. LOUIS
CHICAGO
DETROIT GREENWICHNEW YORK
NEW JERSEY
BALTIMORENORTHERNVIRGINIA
BETHESDAWASHINGTON DC
DALLASFORTWORTH
HOUSTONAUSTIN
SAN ANTONIO
OKLAHOMACITY
NEW ORLEANS
ATLANTA
FORT LAUDERDALEORLANDO
MIAMI-DADE
SANFRANCISCO
PHOENIXORANGE COUNTY
SAN DIEGO
BOSTON
SILICONVALLEY
TRANSWESTERNLOCATIONS
HOustOn multifamily team
Ed CumminsSenior Vice [email protected]
Guadalupe OlivaresAssistant Vice [email protected]
MethODOLOGy
The information in this report is the result of a compilation of publicly available data from a variety of commercial and government sources.
cONtact
Rachel AlexanderDirector of Market [email protected]
t 713.270.7700 f 713.270.6285www.transwestern.net/houston
1900 West Loop South, Suite 1300Houston, Texas 77027
Ryan MendezSenior [email protected]
aBOut tr answestern
Transwestern is a privately held real estate firm specializing in agency leasing, property and facilities management, tenant advisory, capital markets, research and sustainability. The fully integrated global enterprise leverages competencies in office, industrial, retail, multifamily and healthcare properties to add value for investors, owners and occupiers of real estate. As a member of the Transwestern family of companies, the firm capitalizes on market insights and operational expertise of independent affiliates specializing in development, real estate investment management and research. Transwestern has 34 U.S. offices and assists clients through more than 180 offices in 38 countries as part of a strategic alliance with Paris-based BNP Paribas Real Estate.
Transwestern was founded in Houston, Texas in 1978, and Houston remains the corporate headquarters today. As one of the preeminent commercial real estate firms in Houston, we offer a comprehensive menu of real estate services designed to provide owners, tenants and investors with the optimum solutions for their unique requirements. Transwestern has seasoned veterans in every area of expertise with the integrity, experience and creativity to be the best partner for its clients. Transwestern’s Houston office currently employs over 400 team members and has been an innovator in the Houston market for 37 years.
Tim GregorySenior Vice [email protected]
Michael SnodgrassManaging Director - Structured [email protected]
Jan SparksManaging Director - Structured [email protected]

HOUSTON MULTIFAMILYdeceMber 2014
Market Watch
recent multifamily sales
Heights/Inner Loop East :: Archstone Memorial Heights556 units201 S Heights BlvdBuyer: SG InterestsSeller: AvalonBay Communities, Inc.
Braeswood/Fondren SW :: Oaks of Bissonnet356 units7003 Bissonnet StBuyer: Ofakim Properties LLCSeller: SHI Investments
Katy/Far West :: Kenwood Club At The Park320 units2000 Westborough DrBuyer: Olympus PropertySeller: Azure Partners
Monthly StatisticshOUStON MSa NOveMber 2014
Occupancy 91.2%
Price ($/Mo) 923
Rental Rate ($/SF/Mo) 1.05
Average Size (SF) 876
Number of Communities 2,554
Number of Units 588,409
Under Construction (units) 24,819
Units Absorbed (past 12 months) 16,449
% Offering Concessions 26%
Average Concession Package 5.2%Source: Apartment Data Services, Inc.
Sales StatisticshOUStON MSa UNIteD StateS
QUarter tO Date
LaSt QUarter
(3Q14)
traILING 12
MONthS
LaSt QUarter
(3Q14)
traILING 12
MONthS
Volume ($ Mil)
$940.3 $1,411.0 $5,465.3 $30,463.2 $106,949.9
No. of Properties
48 80 297 1,821 6,936
Total No. of Units
12,239 20,690 76,538 272,330 1,030,304
Avg. Price per Unit
$133,612 $121,114 $104,437 $127,384 $117,478
Avg. Cap Rate
7.5% 7.2% 7.2% 6.0% 6.2%
Source: Real Capital Analytics
3Q 2014 Houston MSA Overview
SUBMARKETRENTABLE
UNITSOCCUPANCY
RENTAL RATE (PSF)
CLASS A CLASS B CLASS C
Alief 27,276 84.3% $1.11 $0.85
Almeda/South Main 4,280 94.3% $1.10 $0.85
Baytown 9,158 91.8% $1.16 $0.85
Bear Creek/Copperfield 21,937 89.3% $1.31 $1.13 $0.90
Braeswood/Fondren SW 20,492 92.8% $1.08 $0.82
Brookhollow 24,520 93.8% $1.64 $1.07 $0.82
Clear Lake 7,546 92.6% $1.46 $1.14 $0.90
Conroe/Montgomery 5,503 94.2% $1.03 $0.90
Eastex Frwy/Near Northeast 4,743 88.3% $0.99 $0.79
Far East 8,600 93.7% $1.05 $0.76
FM 1960 East/IAH Airport 37,294 92.2% $1.06 $0.86
FM 1960 West/Champions 13,021 95.2% $1.34 $1.10 $0.86
FM 1960 West/Steeplechase 19,332 92.2% $1.31 $1.13 $0.88
Fort Bend 12,577 89.7% $1.42 $1.18 $0.89
Friendswood/Pearland 5,541 95.4% $1.39 $1.13 $0.92
Galena Park/Jacinto City 320 98.3% $1.03 $0.95
Galleria 23,463 90.8% $1.74 $1.13 $0.89
Galveston/Brazoria 20,715 89.7% $1.39 $1.05 $0.85
Greenspoint 9,473 89.3% $0.83
Gulfgate/Almeda Mall 21,956 94.0% $1.04 $0.83
Gulfton/Bissonnet 16,901 95.1% $1.44 $1.10 $0.83
Heights 3,744 83.2% $1.77 $1.15 $1.06
Highway 288/South 13,216 88.3% $1.41 $1.11 $0.78
Inner Loop East 8,424 91.1% $1.97 $1.01 $0.81
Inner Loop West/Greenway Plaza 15,881 79.4% $1.84 $1.28 $0.99
Inwood/Northwest 7,256 93.7% $1.04 $0.81
Katy/Far West 17,677 89.0% $1.37 $1.16 $0.86
Lake Houston/Kingwood 11,588 94.9% $1.42 $1.15 $0.89
Medical Center/Bellaire 20,516 94.3% $1.63 $1.17 $0.94
Montrose/Museum District 13,434 87.8% $1.85 $1.21
Northline/Aldine 9,956 94.4% $0.89 $0.82
Northshore/Wood Forest 8,646 91.2% $0.99 $0.86
Pasadena/Deer Park 21,862 92.0% $1.70 $1.10 $0.80
Richmond/Rosenburg 4,536 93.7% $1.17 $0.89
Sharpstown/Westwood 25,194 90.6% $0.89 $0.84
Spring Branch 18,466 94.1% $1.65 $1.13 $0.82
Tomball/Far Northwest 5,131 63.4% $1.42 $1.13 $0.94
West Memorial/Briar Forest 25,487 87.5% $1.60 $1.17 $0.87
Westchase 14,092 94.0% $1.47 $1.17 $0.94
Woodlake/Westheimer 11,989 90.0% $1.52 $1.16 $0.90
Woodlands/Far North 15,799 82.2% $1.53 $1.17 $0.88
total - hOUStON 587,542 91.0% $1.67 $1.13 $0.85
Source: Apartment Data Services, Inc.

MARKET WATCH HOUSTON MULTIFAMILY MARKET DEcEMbER 2014
HOUSTON MULTIFAMILY MARKET WATCHdeceMber 2014
CBDCBD
45
45
1010
610
290
59
90
288
99
249
8
35
6
11
11 22
33
44
55
66
77
88
11
11
11
22
22
22
22
33
33
44
44
55
55 66 77
88
99
1010
1111
6677
88
99
1010
33
33
44
44
55
55
66
77
Montrose/Museum District
Inner Loop West/Greenway Plaza
Medical Center/Bellaire
Heights
Inner Loop East
Northshore/Wood Forest
Eastex Fwy/Near Northeast
Northline/Aldine
Greenspoint
FM 1960 East/IAH Airport
Lake Houston/Kingwood
Far East
1
2
3
4
5
1
2
6
7
3
4
5
CENTR
AL
Brookhollow
Spring Branch
Inwood/Northwest
FM 1960 West/Champions
FM 1960 West/Steeplechase
Bear Creek/Copperfield
Katy/Far West
Tomball/Far Northwest
The Woodlands/Far North
Conroe/Montgomery
1
2
3
4
5
6
7
8
9
10
NORTH
WEST
Hwy 288/South
Gulfgate/Almeda Mall
Galena Park/Jacinto City
Pasadena/Deer Park
Friendswood/Pearland
Clear Lake
Baytown
Galveston/Brazoria
1
2
3
4
5
6
7
8
SOUTH
EAST
Galleria
Woodlake/Westheimer
West Memorial/Briar Forest
Westchase
Alief
Sharpstown/Westwood
Gulfton/Bissonnet
Braeswood/Fondren SW
Almeda/South Main
Fort Bend
Richmond/Rosenberg
1
2
3
4
5
6
7
8
9
10
11
SOUTH
WEST
NORTH
EAST
Houston | MULTIFAMILY SUBMARKETS
centr al
1. Montrose/Museum District2. Inner Loop West/Greenway Plaza3. Medical Center/Bellaire4. Heights Inner Loop East
northeast
1. Northshore/Wood Forest2. Eastex Fwy/Near Northeast3. Northline/Aldine4. Greenspoint
5. FM 1960 East/IAH Airport6. Lake Houston/Kingwood7. Far East
northwest
1. Brookhollow2. Spring Branch3. Inwood/Northwest4. FM 1960 West/Champions5. FM 1960 West/Steeplechase6. Bear Creek/Copperfield
7. Katy/Far West8. Tomball/Far Northwest9. The Woodlands/Far North10. Conroe/Montgomery
southwest
1. Galleria2. Woodlake/Westheimer3. West Memorial/Briar Forest4. Westchase5. Alief
6. Sharpstown/Westwood7. Gulfton/Bissonnet8. Braeswood/Fondren SW9. Almeda/South Main10. Fort Bend11. Richmond/Rosenberg
southeast
1. Hwy 288/South2. Gulfgate/Almeda Mall3. Galena Park/Jacinto City
4. Pasadena/Deer Park5. Friendswood/Pearland6. Clear Lake7. Baytown8. Galveston/Brazoria

Copyright © 2014 Transwestern. All rights reserved. No part of this work may be reproduced or distributed to third parties without written permission of the copyright owner. The information contained in this report was gathered by Transwestern from CoStar and other primary and secondary sources believed to be reliable. Transwestern, however, makes no representation concerning the accuracy or completeness of such information and expressly disclaims any responsibility for any inaccuracy contained herein.
HOUSTON MULTIFAMILY MARKET WATCHdeceMber 2014
SEATTLE
WALNUT CREEK
LOS ANGELES
SALT LAKECITY
DENVER
MINNEAPOLIS
MILWAUKEE
ST. LOUIS
CHICAGO
DETROIT GREENWICHNEW YORK
NEW JERSEY
BALTIMORENORTHERNVIRGINIA
BETHESDAWASHINGTON DC
DALLASFORTWORTH
HOUSTONAUSTIN
SAN ANTONIO
OKLAHOMACITY
NEW ORLEANS
ATLANTA
FORT LAUDERDALEORLANDO
MIAMI-DADE
SANFRANCISCO
PHOENIXORANGE COUNTY
SAN DIEGO
BOSTON
SILICONVALLEY
TRANSWESTERNLOCATIONS
houston multifamily team
Ed CumminsSenior Vice [email protected]
Guadalupe OlivaresAssistant Vice [email protected]
MethODOLOGy
The information in this report is the result of a compilation of publicly available data from a variety of commercial and government sources.
cONtact
Rachel AlexanderDirector of Market [email protected]
t 713.270.7700 f 713.270.6285www.transwestern.net/houston
1900 West Loop South, Suite 1300Houston, Texas 77027
Ryan MendezSenior [email protected]
aBout tr answestern
Transwestern is a privately held real estate firm specializing in agency leasing, property and facilities management, tenant advisory, capital markets, research and sustainability. The fully integrated global enterprise leverages competencies in office, industrial, retail, multifamily and healthcare properties to add value for investors, owners and occupiers of real estate. As a member of the Transwestern family of companies, the firm capitalizes on market insights and operational expertise of independent affiliates specializing in development, real estate investment management and research. Transwestern has 34 U.S. offices and assists clients through more than 180 offices in 38 countries as part of a strategic alliance with Paris-based BNP Paribas Real Estate.
Transwestern was founded in Houston, Texas in 1978, and Houston remains the corporate headquarters today. As one of the preeminent commercial real estate firms in Houston, we offer a comprehensive menu of real estate services designed to provide owners, tenants and investors with the optimum solutions for their unique requirements. Transwestern has seasoned veterans in every area of expertise with the integrity, experience and creativity to be the best partner for its clients. Transwestern’s Houston office currently employs over 385 team members and has been an innovator in the Houston market for 36 years.
Tim GregorySenior Vice [email protected]
Michael SnodgrassManaging Director - Structured [email protected]
Jan SparksManaging Director - Structured [email protected]
HOUSTON MULTIFAMILYSEPTEMBER 2014
Market Watch
recent multifamily sales
Galveston/Brazoria :: The Park at Cedar Lawn192 units4400 Avenue NBuyer: Mosaic ResidentialSeller: TriPro Management
Galleria :: Avenue R392 units5455 Richmond AveBuyer: Mesirow FinancialSeller: Carlyle Group
Katy/Far West :: Residences at Cinco Ranch300 units20900 FM 1093Buyer: Starlight US Multifamily FundsSeller: TA Realty & Michelson Organization joint venture
Monthly StatisticshOUStON MSa JULY 2014
Occupancy 91.0%
Price ($/Mo) 911
Rental Rate ($/SF/Mo) 1.04
Average Size (SF) 876
Number of Communities 2,539
Number of Units 584,101
Under Construction (units) 22,989
Units Absorbed (past 12 months) 14,690
% Offering Concessions 23%
Average Concession Package 4.9%Source: Apartment Data Services, Inc.
Sales StatisticshOUStON MSa UNIteD StateS
QUarter tO Date
LaSt QUarter
(2Q14)
traILING 12
MONthS
LaSt QUarter
(2Q14)
traILING 12
MONthS
Volume ($ Mil)
$605.2 $1,232.7 $4,948.6 $25,706.0 $96,803.2
No. of Properties
39 66 268 1,620 6,493
Total No. of Units
9,045 15,553 69,970 228,448 972,112
Avg. Price per Unit
N/A $109,666 $97,779 $114,122 $112,287
Avg. Cap Rate
N/A 7.1% 7.1% 6.2% 6.2%
Source: Real Capital Analytics
2Q 2014 Houston MSA Overview
SUBMARKETRENTABLE
UNITSOCCUPANCY
RENTAL RATE (PSF)
CLASS A CLASS B CLASS C
Alief 27,276 94.0% $1.09 $0.85
Almeda/South Main 4,280 93.6% $1.11 $0.84
Baytown 9,158 91.7% $1.17 $0.83
Bear Creek/Copperfield 13,021 94.7% $1.29 $1.11 $0.90
Braeswood/Fondren SW 21,937 89.1% $1.08 $0.82
Brookhollow 20,492 91.9% $1.65 $1.05 $0.82
Clear Lake 24,520 93.3% $1.42 $1.13 $0.89
Conroe/Montgomery 7,426 91.4% $1.01 $0.89
Eastex Frwy/Near Northeast 5,503 95.1% $0.99 $0.78
Far East 4,605 89.4% $1.03 $0.77
FM 1960 East/IAH Airport 8,600 93.9% $1.04 $0.86
FM 1960 West/Champions 37,293 91.4% $1.34 $1.09 $0.84
FM 1960 West/Steeplechase 19,332 92.1% $1.33 $1.11 $0.87
Fort Bend 12,577 89.1% $1.46 $1.16 $0.89
Friendswood/Pearland 5,541 95.7% $1.39 $1.13 $0.93
Galena Park/Jacinto City 362 98.3% $1.04 $0.95
Galleria 22,870 92.9% $1.71 $1.12 $0.88
Galveston/Brazoria 20,532 89.8% $1.32 $1.03 $0.83
Greenspoint 9,473 88.8% $0.83
Gulfgate/Almeda Mall 21,956 93.9% $1.03 $0.82
Gulfton/Bissonnet 16,901 94.6% $1.42 $0.83
Heights 3,744 80.3% $1.80 $1.15 $1.06
Highway 288/South 13,216 88.4% $1.44 $1.11 $0.76
Inner Loop East 8,424 88.7% $1.96 $1.01 $0.80
Inner Loop West/Greenway Plaza 14,988 83.0% $1.82 $1.29 $0.98
Inwood/Northwest 7,268 94.5% $1.05 $0.81 $0.64
Katy/Far West 17,479 88.1% $1.37 $1.16 $0.89
Lake Houston/Kingwood 11,588 95.2% $1.37 $1.11 $0.88
Medical Center/Bellaire 20,516 92.9% $1.65 $1.12 $0.93
Montrose/Museum District 13,434 86.1% $1.90 $1.23 $0.70
Northline/Aldine 9,850 94.1% $0.91 $0.80
Northshore/Wood Forest 8,646 91.1% $0.99 $0.85
Pasadena/Deer Park 21,862 91.8% $1.70 $1.09 $0.81
Richmond/Rosenburg 4,536 93.9% $1.14 $0.86
Sharpstown/Westwood 25,194 90.8% $0.86 $0.83
Spring Branch 18,466 93.9% $1.56 $1.12 $0.81
Tomball/Far Northwest 4,441 66.8% $1.45 $1.11 $0.93
West Memorial/Briar Forest 25,255 88.1% $1.60 $1.13 $0.85
Westchase 14,092 94.0% $1.43 $1.14 $0.92
Woodlake/Westheimer 11,989 89.7% $1.52 $1.09 $0.89
Woodlands/Far North 15,458 82.5% $1.52 $1.16 $0.88
tOtaL 584,101 91.0% $1.67 $1.11 $0.84
Source: Apartment Data Services, Inc.

MARKET WATCH HOUSTON MULTIFAMILY MARKET SEPTEMBER 2014
HOUSTON MULTIFAMILY MARKET WATCHSEPTEMBER 2014
CBDCBD
45
45
1010
610
290
59
90
288
99
249
8
35
6
11
11 22
33
44
55
66
77
88
11
11
11
22
22
22
22
33
33
44
44
55
55 66 77
88
99
1010
1111
6677
88
99
1010
33
33
44
44
55
55
66
77
Montrose/Museum District
Inner Loop West/Greenway Plaza
Medical Center/Bellaire
Heights
Inner Loop East
Northshore/Wood Forest
Eastex Fwy/Near Northeast
Northline/Aldine
Greenspoint
FM 1960 East/IAH Airport
Lake Houston/Kingwood
Far East
1
2
3
4
5
1
2
6
7
3
4
5
CENTR
AL
Brookhollow
Spring Branch
Inwood/Northwest
FM 1960 West/Champions
FM 1960 West/Steeplechase
Bear Creek/Copperfield
Katy/Far West
Tomball/Far Northwest
The Woodlands/Far North
Conroe/Montgomery
1
2
3
4
5
6
7
8
9
10
NORTH
WEST
Hwy 288/South
Gulfgate/Almeda Mall
Galena Park/Jacinto City
Pasadena/Deer Park
Friendswood/Pearland
Clear Lake
Baytown
Galveston/Brazoria
1
2
3
4
5
6
7
8
SOUTH
EAST
Galleria
Woodlake/Westheimer
West Memorial/Briar Forest
Westchase
Alief
Sharpstown/Westwood
Gulfton/Bissonnet
Braeswood/Fondren SW
Almeda/South Main
Fort Bend
Richmond/Rosenberg
1
2
3
4
5
6
7
8
9
10
11
SOUTH
WEST
NORTH
EAST
Houston | MULTIFAMILY SUBMARKETS
centr al
1. Montrose/Museum District2. Inner Loop West/Greenway Plaza3. Medical Center/Bellaire4. Heights Inner Loop East
northeast
1. Northshore/Wood Forest2. Eastex Fwy/Near Northeast3. Northline/Aldine4. Greenspoint
5. FM 1960 East/IAH Airport6. Lake Houston/Kingwood7. Far East
northwest
1. Brookhollow2. Spring Branch3. Inwood/Northwest4. FM 1960 West/Champions5. FM 1960 West/Steeplechase6. Bear Creek/Copperfield
7. Katy/Far West8. Tomball/Far Northwest9. The Woodlands/Far North10. Conroe/Montgomery
southwest
1. Galleria2. Woodlake/Westheimer3. West Memorial/Briar Forest4. Westchase5. Alief
6. Sharpstown/Westwood7. Gulfton/Bissonnet8. Braeswood/Fondren SW9. Almeda/South Main10. Fort Bend11. Richmond/Rosenberg
southeast
1. Hwy 288/South2. Gulfgate/Almeda Mall3. Galena Park/Jacinto City
4. Pasadena/Deer Park5. Friendswood/Pearland6. Clear Lake7. Baytown8. Galveston/Brazoria

Copyright © 2014 Transwestern. All rights reserved. No part of this work may be reproduced or distributed to third parties without written permission of the copyright owner. The information contained in this report was gathered by Transwestern from CoStar and other primary and secondary sources believed to be reliable. Transwestern, however, makes no representation concerning the accuracy or completeness of such information and expressly disclaims any responsibility for any inaccuracy contained herein.
HOUSTON MULTIFAMILY MARKET WATCHSEPTEMBER 2014
SEATTLE
WALNUT CREEK
LOS ANGELES
SALT LAKECITY
DENVER
MINNEAPOLIS
MILWAUKEE
ST. LOUIS
CHICAGO
DETROIT GREENWICHNEW YORK
NEW JERSEY
BALTIMORENORTHERNVIRGINIA
BETHESDAWASHINGTON DC
DALLASFORTWORTH
HOUSTONAUSTIN
SAN ANTONIO
OKLAHOMACITY
NEW ORLEANS
ATLANTA
FORT LAUDERDALEORLANDO
MIAMI-DADE
SANFRANCISCO
PHOENIXORANGE COUNTY
SAN DIEGO
BOSTON
SILICONVALLEY
TRANSWESTERNLOCATIONS
houston multifamily team
Ed CumminsSenior Vice [email protected]
Guadalupe OlivaresAssistant Vice [email protected]
MethODOLOGY
The information in this report is the result of a compilation of publicly available data from a variety of commercial and government sources.
cONtact
Rachel AlexanderDirector of Market [email protected]
t 713.270.7700 f 713.270.6285www.transwestern.net/houston
1900 West Loop South, Suite 1300Houston, Texas 77027
Ryan MendezSenior [email protected]
aBout tr answestern
Transwestern is a privately held real estate firm specializing in agency leasing, property and facilities management, tenant advisory, capital markets, research and sustainability. The fully integrated global enterprise leverages competencies in office, industrial, retail, multifamily and healthcare properties to add value for investors, owners and occupiers of real estate. As a member of the Transwestern family of companies, the firm capitalizes on market insights and operational expertise of independent affiliates specializing in development, real estate investment management and research. Transwestern has 34 U.S. offices and assists clients through more than 181 offices in 40 countries as part of a strategic alliance with Paris-based BNP Paribas Real Estate.
Transwestern was founded in Houston, Texas in 1978, and Houston remains the corporate headquarters today. As one of the preeminent commercial real estate firms in Houston, we offer a comprehensive menu of real estate services designed to provide owners, tenants and investors with the optimum solutions for their unique requirements. Transwestern has seasoned veterans in every area of expertise with the integrity, experience and creativity to be the best partner for its clients. Transwestern’s Houston office currently employs over 385 team members and has been an innovator in the Houston market for 36 years.
Tim GregorySenior Vice [email protected]
Michael SnodgrassManaging Director - Structured [email protected]
Jan SparksManaging Director - Structured [email protected]
HOUSTON MULTIFAMILYJULY 2014
Market Watch
RECENT MULTIFAMILY SALES
FM 1960 West/Champions :: Cypress Ridge268 units2331 Bammelwood DriveBuyer: CrestMarcSeller: Scenic Capital Advisors
West Memorial/Briar Forest :: ARIUM Briar Forest476 units12951 Briar Forest DriveBuyer: Provident Realty AdvisorsSeller: Carlyle Group
Downtown :: Post Rice Lofts300 units909 Texas AvenueBuyer: Crow HoldingsSeller: Post Properties
Monthly StatisticshOUStON MSa MaY 2014
Occupancy 91.0%
Price ($/Mo) 895
Rental Rate ($/SF/Mo) 1.02
Average Size (SF) 875
Number of Communities 2,525
Number of Units 580,325
Under Construction (units) 22,928
Units Absorbed (past 12 months) 14,520
% Offering Concessions 28%
Average Concession Package 4.8%Source: Apartment Data Services, Inc.
Sales StatisticshOUStON MSa UNIteD StateS
QUarter tO Date
LaSt QUarter
(1Q14)
traILING 12
MONthS
LaSt QUarter
(1Q14)
traILING 12
MONthS
Volume ($ Mil)
$877.1 $784.8 $4,815.0 $19,089.6 $89,248.9
No. of Properties
49 45 255 1,395 6,177
Total No. of Units
11,163 11,235 68,675 195,299 927,973
Avg. Price per Unit
$97,860 $83,410 $99,374 $110,245 $111,223
Avg. Cap Rate
N/A 7.2% 7.1% 6.1% 6.2%
Source: Real Capital Analytics
1Q 2014 Houston MSA Overview
SUBMARKETRENTABLE
UNITSOCCUPANCY
RENTAL RATE (PSF)
CLASS A CLASS B CLASS C
Alief 27,276 93.5% $1.07 $0.83
Almeda/South Main 4,280 94.1% $1.11 $0.79
Baytown 9,348 90.7% $1.10 $0.81
Bear Creek/Copperfield 13,021 95.0% $1.29 $1.10 $0.89
Braeswood/Fondren SW 21,937 89.0% $0.99 $0.80
Brookhollow 20,492 91.8% $1.69 $1.07 $0.82
Clear Lake 24,520 93.3% $1.36 $1.12 $0.89
Conroe/Montgomery 7,426 91.2% $1.00 $0.87
Eastex Frwy/Near Northeast 5,503 95.4% $0.97 $0.76
Far East 4,477 88.6% $1.02 $0.77
FM 1960 East/IAH Airport 8,600 92.6% $1.04 $0.86
FM 1960 West/Champions 37,293 91.2% $1.30 $1.07 $0.84
FM 1960 West/Steeplechase 19,170 91.5% $1.34 $1.08 $0.88
Fort Bend 11,524 95.1% $1.38 $1.15 $0.92
Friendswood/Pearland 5,541 96.2% $1.36 $1.11 $0.91
Galena Park/Jacinto City 362 99.2% $0.92
Galleria 22,870 91.3% $1.68 $1.09 $0.88
Galveston/Brazoria 20,532 88.6% $1.31 $1.00 $0.83
Greenspoint 9,473 89.4% $0.82
Gulfgate/Almeda Mall 21,956 94.7% $1.01 $0.81
Gulfton/Bissonnet 16,877 92.9% $1.41 $0.84
Heights 3,708 77.4% $1.79 $1.10 $0.88
Highway 288/South 12,866 91.3% $1.39 $1.08 $0.76
Inner Loop East 8,342 89.2% $1.93 $0.93 $0.78
Inner Loop West/Greenway Plaza 14,897 81.5% $1.75 $1.23 $0.95
Inwood/Northwest 7,118 93.4% $1.06 $0.81
Katy/Far West 17,057 88.2% $1.37 $1.15 $0.87
Lake Houston/Kingwood 11,498 95.0% $1.31 $1.10 $0.86
Medical Center/Bellaire 20,513 91.4% $1.62 $1.13 $0.94
Montrose/Museum District 13,231 86.2% $1.88 $1.20 $0.70
Northline/Aldine 9,850 93.9% $0.85 $0.81
Northshore/Wood Forest 8,646 91.5% $0.98 $0.84
Pasadena/Deer Park 21,862 92.2% $1.70 $1.09 $0.78
Richmond/Rosenburg 4,536 94.0% $1.14 $0.85
Sharpstown/Westwood 25,194 90.5% $0.80 $0.83
Spring Branch 18,465 93.5% $1.63 $1.10 $0.78
Tomball/Far Northwest 4,441 61.8% $1.49 $1.09 $0.77
West Memorial/Briar Forest 25,255 88.1% $1.60 $1.13 $0.85
Westchase 14,092 94.6% $1.40 $1.16 $0.90
Woodlake/Westheimer 11,580 92.7% $1.41 $1.04 $0.87
Woodlands/Far North 14,696 84.6% $1.50 $1.13 $0.86
tOtaL 580,325 91.0% $1.64 $1.09 $0.83
Source: Apartment Data Services, Inc.