Market Value and Patent Citations - University of …bhhall/papers/HallJaffeTrajten...We probe into...
42
1 Market Value and Patent Citations Bronwyn H. Hall UC Berkeley, NBER, and IFS Adam Jaffe Brandeis University and NBER Manuel Trajtenberg Tel Aviv University, NBER and CEPR Revised, September 2003 Abstract The goal of this paper is to explore the usefulness of patent citations as a means to tackle the huge heterogeneity of patented innovations in determining the stock market value of firms, and to further validate the informational content of patent citations in terms of economic impact. This project was made possible by the creation of a comprehensive data file on patents and citations for 1963-1999, comprising 3 million US patents and 16 million citations, and the matching of assignee names to Compustat. We estimate Tobin’s q equations on R&D to assets stocks, patents to R&D, and citations to patents. We find that each ratio impacts significantly market value, with an extra citation per patent boosting market value by 3%, and firms with 20 citations and more commanding a 54% premium. The impact of citations per patent is highest for Drugs, and low for Computers and Communications. We probe into the timing of information revelation by citations, and find that “future” citations capture virtually the full impact of total citations, and that “unpredictable” citations have a stronger effect than the predictable portion. Self-citations are more valuable than citations coming from external patents, but this effect decreases with the size of the patent portfolio held by the firm. Keywords: market value, patent citations, innovation. JEL Classification: O31, O38 This paper follows closely in the steps of the late Zvi Griliches, and owes to him the underlying vision, method, and pursuit of data. The data construction was partially supported by the National Science Foundation, via grants SBR-9413099 and SBR-9320973. We are extremely grateful to Meg Fernando of REI, Case Western Reserve University for excellent assistance in matching the patent data to Compustat. We also acknowledge with gratitude the comments received at numerous seminars, and from two referees.
-
Upload
vuongkhanh -
Category
Documents
-
view
214 -
download
0
Transcript of Market Value and Patent Citations - University of …bhhall/papers/HallJaffeTrajten...We probe into...
1
Market Value and Patent Citations
Bronwyn H. Hall
UC Berkeley, NBER, and IFS
Adam Jaffe Brandeis University and NBER
Manuel Trajtenberg
Tel Aviv University, NBER and CEPR
Revised, September 2003
Abstract The goal of this paper is to explore the usefulness of patent citations as a means to tackle the huge heterogeneity of patented innovations in determining the stock market value of firms, and to further validate the informational content of patent citations in terms of economic impact. This project was made possible by the creation of a comprehensive data file on patents and citations for 1963-1999, comprising 3 million US patents and 16 million citations, and the matching of assignee names to Compustat. We estimate Tobin’s q equations on R&D to assets stocks, patents to R&D, and citations to patents. We find that each ratio impacts significantly market value, with an extra citation per patent boosting market value by 3%, and firms with 20 citations and more commanding a 54% premium. The impact of citations per patent is highest for Drugs, and low for Computers and Communications. We probe into the timing of information revelation by citations, and find that “future” citations capture virtually the full impact of total citations, and that “unpredictable” citations have a stronger effect than the predictable portion. Self-citations are more valuable than citations coming from external patents, but this effect decreases with the size of the patent portfolio held by the firm. Keywords: market value, patent citations, innovation. JEL Classification: O31, O38
This paper follows closely in the steps of the late Zvi Griliches, and owes to him the underlying vision, method, and pursuit of data. The data construction was partially supported by the National Science Foundation, via grants SBR-9413099 and SBR-9320973. We are extremely grateful to Meg Fernando of REI, Case Western Reserve University for excellent assistance in matching the patent data to Compustat. We also acknowledge with gratitude the comments received at numerous seminars, and from two referees.
2
1. Introduction It is no longer a cliché but a seemingly accepted notion that we live in the “knowledge
economy”, characterized by the unprecedented role and rising importance of Information and
Communication Technologies, of intellectual skills, and of innovation and R&D. The
centrality of available knowledge and of knowledge creation is expected to manifest itself in a
wide range of indicators of economic performance, such as multifactor productivity, the rate
of innovation, and ultimately sustained economic growth. It is also expected to impact the
stock market value of firms: investors surely recognize the competitive advantages and
growth potential associated with knowledge creation, and hence presumably know how to
price the intangible assets of firms associated with their “stock of knowledge.”
Mapping these priors into workable empirical research strategies has not been easy, if
only because intangibles in general and knowledge in particular are amorphous entities,
devoid of immediate, clear counterparts in economic data. Two observables have played a
central role in this context: the flow of R&D expenditures undertaken by publicly held firms,
and the number of patents that these firms receive over time. Properly accumulated (under
some plausible assumptions regarding depreciation), “knowledge stocks” have been computed
on the basis of these flows, and their impact on market value assessed in the context of
Tobin’s q-type equations. These inquiries shed a great deal of light on the shadow value of
R&D, the additional information contained in patents once R&D has been accounted for, and
related issues. Yet a major obstacle stood along the way: R&D is just an input into the highly
uncertain process of knowledge creation, with much of it rendering “dry holes” and only few
research avenues leading to significant successes. Patents do signify a minimal standard of
success along the innovation process, and yet patents themselves are known to vary
enormously in their “importance” or “value.”
The main goal of this paper is to add patent citations to the toolkit at our disposal, as a
means to tackle the huge heterogeneity of patented innovations in determining market value.
The underlying motivation is in fact twofold: (i) to better explain market value with the aid of
patent citations, presumed to be a higher-resolution measure of the knowledge stocks of
3
traded firms, in addition to R&D and patent counts; and (ii) to further validate the
informational content of patent citations in terms of economic impact, so as to rationalize and
broaden their use in economic research. A further goal is to exploit the richness and high level
of detail of citations data in order to investigate finer issues, such as when do investors learn
about the value of innovations, and the extent to which external spillovers are as valuable as
internal ones.
This project was made possible by the recently completed creation of a comprehensive
data file on patents and citations, comprising all US patents granted during the period 1963-
1999 (3 million patents), and all patent citations made during 1975-1999 (about 16 million
citations), as described in Hall, Jaffe and Trajtenberg (2001).1 Furthermore, we matched the
assignees of patents granted to publicly traded US companies with firms listed in Standards
and Poors’ Compustat file, thus linking the wealth of data on patents to information on R&D
expenditures, stock market value, assets, and other variables available in Compustat. We
construct on the basis of these data three measures of “knowledge stocks”: the traditional
R&D and patent count stocks, and a citations stock. The latter poses serious truncation
problems, since citations to a given patent typically keep coming over long periods of time,
but we only observe them until the last date of the available data; we apply correction
methods developed elsewhere to deal with this and related problems. We also consider
alternative time-related partitions of the citations stock, into “past” and “future” citations on
the one hand, and into “predictable” and “residual” citations on the other.
We estimate Tobin’s q “hedonic” equations on three complementary aspects of
knowledge stocks: R&D “intensity” (the ratio of R&D stocks to the book value of assets), the
patent yield of R&D (i.e. the ratio of patent count stocks to R&D stocks), and the average
citations received by these patents (i.e. the ratio of citations to patent stocks). We find that
each ratio impacts significantly market value, with an extra citation per patent boosting
market value by 3%. Zooming on the high citation cases, we find that firms having 2 to 3
times the median number of citations per patent display a 35% value premium, and the lucky
1 The complete data are available in the NBER site at http://www.nber.org/patents/, and also in a CD included with Jaffe and Trajtenberg (2002). For purposes of this paper we actually used a previous version of the data, that extends only until 1996.
4
few with 20 citations and more command a staggering 54% premium. Exploring industry
effects, we find that there are wide differences across sectors in the impact of each knowledge
stock ratio on market value. Thus, the impact of patent yield for Drugs is 3 times the average,
and that of Comp&Comm twice as high; similarly, the impact of citations/patents for Drugs is
over 50% higher than the average effect, while that for Comp&Comm is small, and lower
than all others except for the low-tech sector. We probe into the timing of information
revelation by citations, and find that past citations are essentially regarded as bygones and
show no effect, whereas future citations by themselves capture virtually the full impact of
total citations; moreover, the part of total citations that cannot be predicted on the basis of
past citations has a stronger effect on market value than the predictable portion. Self-citations
(i.e. those coming from down-the-line patents owned by the same firm) are more valuable
than citations coming from external patents, but this effect decreases with the size of patent
portfolio held by the firm, as might be expected.
The paper is organized as follows: section 2 discusses the rationale for the use of
patent and citations data in this sort of research, and reviews previous literature. The data are
described in section 3, along with a discussion of truncation and its remedies. Section 4 deals
with the specification of the market value equation, and the construction of citation stocks,
including the partition into past-future and predictable-residual citation stocks. The empirical
findings are presented in section 5: starting with a “horse race” between R&D, patents and
citations, we proceed to estimate the preferred specification that includes the three ratios, add
industry effects, experiment with the various partitions of the citations stock, and finally look
at the differential impact of self citations. Section 6 concludes with ideas for further research.
It is important to note that in this paper we look only at a simple “hedonic” (and hence
snapshot-like) market value equation, and do not address the deeper dynamic forces at work,
as discussed by Pakes (1985) – these will have to await for future research.
2. Patents, citations, and market value: where do we stand?
Patents have long been recognized as a very rich data source for the study of
innovation and technical change. Indeed, there are numerous advantages to the use of patent
data: each patent contains highly detailed information on the innovation; patents display
5
extremely wide coverage in terms of technologies, assignees, and geography; there are
already millions of them, (the flow being of over 150,000 patents per year); the data contained
in patents are supplied entirely on a voluntarily basis, etc. There are serious limitations as
well, the most glaring being that not all innovations are patented, simply because not all
inventions meet the patentability criteria, and because the inventor has to make a strategic
decision to patent, as opposed to relying on secrecy or other means of appropriability.2
The large-scale use of patent data in economic research goes back to Schmookler
(1966), followed by Scherer (1982), and Griliches (1984).3 One of the major limitations of
these research programs, extremely valuable as they had been, was that they relied
exclusively on patent counts as indicators of innovative output.4 However, it has long been
recognized that innovations vary enormously in their technological and economic
“importance” or “value”, and that the distribution of such “values” is extremely skewed. Thus
simply patent counts are inherently limited in the extent to which they can capture such
heterogeneity (see Griliches, Hall and Pakes, 1987). The line of research initiated by
Schankerman and Pakes (1986) using patent renewal data clearly revealed these features of
the patent data. Patent citations suggested themselves as a means to tackle such heterogeneity
(Trajtenberg, 1990, Albert et al, 1991), as well as a way to trace spillovers (Jaffe, Henderson
and Trajtenberg, 1993). In order to understand the role that patent citations have come to play
in this context, we have to look more in detail into the patent document as a legal entity and as
an information source.
A patent is a temporary legal monopoly awarded to inventors for the commercial use
of a newly invented device, i.e. a patent awards the right to exclude others from the
unauthorized use of the disclosed innovation, for a predetermined period of time.5 For a patent
2 Unfortunately, we have very little idea of the extent to which patents are representative of the wider universe of inventions, since there is no systematic data about inventions that are not patented (see however Crepon, Duguet and Mairesse, 1998). This is an important, wide-open area for future research. 3 The work of Schmookler involved assigning patent counts to industries, whereas Griliches’ project entailed matching patents to a sample of Compustat firms. In both cases the resulting data used were yearly patent counts by industries or firms. Scherer’s project involved the creation of a “technology flow matrix” by industry of origin and industries of use. 4 Of course, that is the best they could do at the time, given computer and data resources available. 5 Whether or not this right translates into market power depends upon a host of other factors, including the legal strength of these rights, the speed of technical advance, the ease of imitation, etc.
6
to be granted, the innovation must fulfill the following criteria: (i) it has to be novel in a very
precise sense;6 (ii) non-trivial, in that it would not appear obvious to a skilled practitioner of
the technology; and (iii) it must be useful, meaning that it has potential commercial value. If a
patent is granted, an extensive public document is created. The front page of a patent contains
detailed information about the invention, the inventor, the assignee, and the technological
antecedents of the invention, including citations to previous patents. These citations serve an
important legal function, since they delimit the scope of the property rights awarded by the
patent. Thus, if patent B cites patent A, it implies that patent A represents a piece of
previously existing knowledge upon which patent B builds, and over which B cannot have a
claim. The applicant has a legal duty to disclose any knowledge of the prior art (and thus the
inventor’s attorney typically plays an important role in deciding which patents to cite), but the
decision regarding which citations to include ultimately rests with the patent examiner, who is
supposed to be an expert in the area and hence to be able to identify relevant prior art that the
applicant misses or conceals.7
Thus, patent citations presumably convey information on two major aspects of
innovations:8 the first is linkages between inventions, inventors and assignees along time and
space. In particular, patent citations enable the quantitative, detailed study of spillovers, along
geographical, institutional, and related dimensions. The second is that citations may be used
as indicators of the “importance” of individual patents, thus introducing a way of gauging the
enormous heterogeneity in the “value” of patents.9 In this paper we concentrate on the latter
aspect, with only a passing reference to citations as indicators of spillovers when dealing with
self-citations.
6 In the US that means “first to invent”, whereas in Europe and Japan “first to file.” 7 “During the examination process, the examiner searches the pertinent portion of the ‘classified’ patent file. His purpose is to identify any prior disclosures of technology…which anticipate the claimed invention and preclude the issuance of a patent; which might be similar to the claimed invention and limit the scope of patent protection…; or which, generally, reveal the state of the technology to which the invention is directed…. If such documents are found they are made known to the inventor, and are ‘cited’ in any patent which matures from the application…Thus, the number of time a patent document is cited may be a measure of its technological significance.” (OTAF, 1976, p. 167). 8 Citations allow one also to probe into other aspects of innovations, such as their “originality”, “generality”, links to science, etc. – see Trajtenberg, Henderson and Jaffe (1997). 9 The two are of course related: one may deem more “important” those patents that generate more spillovers, and vice versa. Most research so far has treated these two aspects separately, but clearly there is room to aim for an integrative approach.
7
There are reasons to believe that citations convey not just technological but also
economically significant information: Patented innovations are for the most part the result of
costly R&D conducted by profit-seeking organizations; if firms invest in further developing
an innovation disclosed in a previous patent, then the resulting (citing) patents presumably
signify that the cited innovation is economically valuable. Moreover, citations typically keep
coming over the long run,10 giving plenty of time to dissipate the original uncertainty
regarding both the technological viability and the commercial worth of the cited innovation.
Thus, if we still observe citations years after the grant of the cited patent, it must be that the
latter had indeed proven to be valuable.
A detailed survey of inventors provides some direct evidence on citations as indicative
of the presumed links across innovations (Jaffe, Trajtenberg and Fogarty, 2000). A set of
“citing inventors” answered questions about their patented inventions, the relationship of
these to previous patents cited in theirs, as well as to technologically similar “placebo” patents
that were not actually cited. A second set of (matched) “cited inventors” answered similar
questions regarding the citing patents. The results confirm that citations do contain significant
information on knowledge flows, but with a substantial amount of noise. The answers
revealed significant differences between the cited patents and the placebos as to whether the
citing inventor had learned anything from the cited patent, and precisely how and what she
learned from it. However, as many as half of all citations did not seem to correspond to any
kind of knowledge flow, whereas one-quarter of them indicate a strong connection between
citing and cited patents.
There have been a small number of studies that attempted to validate the use of patent
citations as indicators of economic impact or value. Trajtenberg (1990) related the flow of
patents in computed tomography (CT) scanners, a major innovation in medical technology, to
10 The mean backward citation lag hovers around 15 years (depending on the cohort), the median at about 10, and 5% of citations go back 50 years and more. The forward lag is more difficult to characterize because of the inherent truncation, but looking at citations to the oldest cohort in the data, that of 1975, we see that even after 25 years citations keep coming at a non-declining rate (see Jaffe and Trajtenberg, 2002, Ch. 13).
8
the estimated social surplus due to improvements in this technology.11 Whereas simple patent
counts showed no correlation with the estimated surplus, citation-weighted patent counts
turned out to be highly correlated with it, thus providing first-time evidence to the effect that
citations carry information on the value of patented innovations. Recent work by Lanjouw and
Schankerman (2003) also uses citations, along with other measures such as number of claims
and number of countries in which an invention is patented, as a proxy for patent “quality.”
They find that a composite measure has significant power in predicting which patents will be
renewed and which will be litigated, thus inferring that that these indicators are indeed
associated with the private value of patents. Harhoff et al (1999) survey German patent
holders of US patents that were also filed in Germany, asking them to estimate the price at
which they would have been willing to sell the patent right three years after filing. They find
that the estimated value is correlated with subsequent citations, and that the most highly cited
patents are very valuable, with a single citation implying an average value of about $1
million. Giummo (2003) examines the royalties received by the inventor/patentholders at 9
major German corporations under the German Employee Compensation Act and reaches
similar conclusions.
There is a substantial literature relating the stock market value of firms to various
measures of “knowledge capital”, and in particular to R&D and patents, going back to the
landmark research program initiated by Griliches and coworkers at the NBER.12 Hall (2000)
offers a recent survey of this line of work: the typical finding is that patent counts do not have
as much explanatory power as R&D in a market value equation, but they do appear to add
some information above and beyond R&D. A few papers have tried to incorporate patent
citations as well, albeit in the context of small-scale studies: H. Shane (1993) finds that, for a
small sample of semiconductor firms in 1977-90, patents weighted by citations have more
predictive power in a Tobin’s q equation than simple patents counts, entering significantly
even when R&D stock is included. Citations-weighted patents also turned out to be more
11 Consumer surplus was derived from an estimated discrete choice model of demand for CT scanners, based on purchases of scanners by US hospitals. Innovation manifested itself in the sale of improved scanners over time, i.e. scanners having better characteristics (e.g. speed and resolution). 12 See, among others, Griliches (1981), Pakes (1985), Jaffe (1986), Griliches, Pakes and Hall (1987), Connolly and Hirschey (1988), Griliches, Hall, and Pakes (1991), Hall (1993a), Hall (1993b), and Blundell, Griffith and van Reenen (1999).
9
highly correlated with R&D than simple patent counts, implying that firms invest more efforts
into patented innovations that ultimately yielded more citations. Finally, Austin (1993) finds
that citation-weighted counts enter positively but not significantly (due to small sample size)
in an event study of patent grants in the biotechnology industry.
3. Data
For the purposes of this project we have brought together two large datasets, and
linked them via an elaborate matching process: the first is all patents granted by the US
Patent Office between 1965 and 1996, including their patent citations; the second is firm data
drawn from Compustat, including market value, assets, and R&D expenditures. The matching
of the two sets (by firm name) proved to be a formidable, large-scale task, that tied up a great
deal of our research efforts for a long time: Assignees obtain patents under a variety of names
(their own and those of their subsidiaries) and the Patent Office does not keep a unique
identifier for each patenting organization from year to year. In fact, the initial list of corporate
assignees of the 1965-95 patents included over 100,000 entries, which we sought to match to
the names of the approximately 6,000 manufacturing firms on the Compustat files, and to
about 30,000 of their subsidiaries (obtained from the Who Owns Whom directory), as of
1989.13 In addition to firms patenting under a variety of names (in some cases for strategic
purposes), the difficulties in matching are compounded by the fact that there are numerous
spelling mistakes in the names, and a bewildering array of abbreviations. As shown in Hall,
Jaffe and Trajtenberg (2001), we nevertheless succeeded in matching over half a million
patents, which represent 50-65% (depending on the year) of all patents of US origin that were
assigned to corporations during the years 1965 to 1995.14,15 Still, the results presented here
13 Since ownership patterns change over time, ideally one would like to match patents to firms at more than one point in time; however, the difficulties of the matching process made it impossible to aim for more than one match. 14 That is, the 573,000 matched patents comprise 50-65% of all assigned patents (about ¼ don’t have an assignee) granted to US corporate inventors. Since Compustat includes firms that are traded in the US stock market only, most US patents of foreign origin are obviously not matched. The percentage matched is rather high, considering that the matching was done only to manufacturing firms, and only to those listed in Compustat. 15 In order to ensure that we picked up all the important subsidiaries, we examined and sought to assign all unmatched patenting organizations that had more than 50 patents during the period. A spot check of firms in the semiconductor industry suggests that our total patent numbers are fairly accurate, except for some firms for which we found a 5-15% undercount, due primarily to changing ownership patterns after 1989 – see Hall and Ziedonis (2001).
10
should be viewed with some caution, since they might be affected by remaining matching
errors and omissions.
The Compustat data comprise all firms in the manufacturing sector (SIC 2000-3999)
between 1976 and 1995. After dropping duplicate observations and partially owned
subsidiaries, and cleaning on our key variables, we ended up with an unbalanced panel of
4,864 firms (approximately 1,700 per year). The firms are all publicly traded on the New
York, American, and regional stock exchanges, or over-the-counter on NASDAQ. The main
Compustat variables used here are the market value of the firm at the close of the year, the
book value of the physical assets, and the book value of the R&D investment. The market
value is defined as the sum of the common stock, the preferred stock,16 the long-term debt
adjusted for inflation, and the short-term debt net of assets. The book value is the sum of net
plant and equipment, inventories, and investments in unconsolidated subsidiaries, intangibles,
and others (all adjusted for inflation).17 The R&D capital stock is constructed using a
declining balance formula and the past history of R&D spending with a 15 percent
depreciation rate (for details see Hall, 1990).
Using the patents and citation data matched to the Compustat firms, we constructed
patent stocks and citation-weighted patent stocks, applying the same declining balance
formula used for R&D (also with a depreciation rate of 15%). Our patent data go back to
1964, and the first year for which we used a patent stock variable in the pooled regressions
was 1975, so the effect of the missing initial condition (i.e. patents prior to 1964) should be
small for the patent variable. The fraction of firms in our sample reporting R&D expenditures
each year hovers around 60-70%, and the fraction of firms with a positive patent stock lies in
the same range.18 The yearly fraction of firms with current patent applications is about 35-
16 That is, the preferred dividends capitalized at the preferred dividend rate for medium risk companies given by Moody's. 17 These intangibles are normally the goodwill and excess of market over book value from acquisitions, and do not include the R&D investment of the current firm, although they may include some value for the results of R&D by firms that have been acquired by the current firm. 18 Even though there is substantial overlap between firms reporting R&D and those with patent stocks, the two sets are not nested: 19 percent of the firms with R&D stocks have no patents while 13 percent of the firms with patent stocks report no R&D.
11
40%, the percentage dropping steeply by the end of period because of the application-grant
lag.
3.1 Dealing with truncation
Patent data pose two types of truncation problems, one regarding patent counts, the
other citation counts. The first stems from the fact that there is a significant lag between
patent applications and patent grants (averaging lately about 2 years). Thus, as we approach
the last year for which there are data available (e.g. 1995 in the data used here), we observe a
declining fraction of the patents that were applied for in the later years but have not yet been
granted.19 As shown in Appendix I, correcting for this sort of truncation bias is relatively
straightforward, and essentially involves using the application-grant empirical distribution to
compute “weight factors.” Thus, and using the results reported there, a patent count for say
1994 would be adjusted upwards by a factor of 1.166, implying that about 17% of the patents
applied for in 1994 are expected to be granted after 1995, the last year of the data.
Citation counts are inherently truncated, since patents keep receiving citations over
long periods of time (in some cases even after 50 years), but we observe at best only the
citations given up to the present, and more realistically only up to the last year of the available
data. Moreover, patents applied for in different years suffer to different extents from this
truncation bias in citations received, and hence their citation intensity is not comparable and
cannot be aggregated. For recent patents the problem is obviously more acute, since we only
observe the first few years of citations. Thus, a 1993 patent that received 10 citations by 1996
(the end of our data) is likely to be a higher citation-intensity patent than a 1985 patent that
received 11 citations within our data period. Furthermore, although our basic patent
information begins in 1964, we only have data on the citations made by patents beginning in
1976. Hence patents granted before 1976 experience truncation at the beginning of their
citation cycle.20
19 Of course, the difficulty stems from the fact that we do not observe patent applications (and even if we did, we would not know which of them would eventually be granted), and that we date patents by their application rather than by their grant year.
12
We address the problem of truncated citations by estimating the shape of the citation-
lag distribution, i.e. the fraction of lifetime citations (defined as the 30 years after the grant
date) that are received in each year after patent grant. We assume that this distribution is
stationary and independent of overall citation intensity. Given this distribution, we can
estimate the total citations of any patent for which we observe a portion of its citation life,
simply by dividing the observed citations by the fraction of the population distribution that
lies in the time interval for which citations are observed.21 In the case of patents for which we
observe the prime citation years (roughly years 3-10 after grant), this should give relatively
accurate estimates of lifetime citations. On the other hand, when we observe only the first few
years after grant (which is the case for more recent patents) the estimates will be much more
noisy. In particular, the estimate of lifetime citations for patents with no citations in their first
few years will be exactly zero, despite the fact that some of those patents will be eventually
cited. Because of the increasing imprecision in measuring cites per patent as we approach the
end of our sample period, our pooled regressions focus first on the 1976-1992 period, and
then on the subset of years between 1979 and 1988.22
3.2 A first look at the data
Table 1 shows the sample statistics for the main variables used in the analysis, for the
sample of observations analyzed in Tables 3 through 6: as expected, both market and book
value, and the various knowledge stocks (R&D, patents and citations) are extremely skewed,
with the means exceeding the median by over an order of magnitude. The ratios R&D/assets
and citations/patents are distributed much more symmetrically, reflecting systematic size
effects; however, the patent yield (patents/R&D) retains a high degree of skewness and
displays a large variance, indicating a rather weak correlation between the two stocks. Both
the dependent variable (market to book value) and the candidate regressors in the models to
20 Thus, a 1964 patent that received 10 citations between 1976 and 1996 is probably more citation-intensive than a 1976 patent that received 11 citations over that same period. 21 The details of the estimation of the citation lag distribution and the derived adjustment to citation intensity are described in Hall, Jaffe and Trajtenberg (2000), Appendix D, and further adjustment procedures are developed in Hall, Jaffe and Trajtenberg (2001). 22 Another issue that arises in this context is that the number of citations made by each patent has been rising over time, suggesting a kind of ''citation inflation'' that renders each citation less significant in later years. In this paper we choose not to make any correction for the secular changes in citation rates, with the cost that our extrapolation attempts become somewhat inaccurate later in the sample. For a detailed discussion of this issue, and of econometric techniques to deal with it, see Hall, Jaffe and Trajtenberg (2001).
13
be estimated exhibit a non-negligible amount of within variation, suggesting that there is
interesting “action” in both the cross-sectional and the temporal dimensions.
Figure 1 shows the total citation and patenting rates per real R&D spending in our
sample. Patent counts are adjusted for the application-grant lag, and citation counts are shown
both corrected and uncorrected: clearly, correcting for truncation has a dramatic impact on the
series, particularly for recent years. Although the earlier years (1975-1985) show a steady
decline in patenting and citation weighted patenting per R&D dollar, one can clearly see the
marked increase in patenting that began in 1986-87. However, the yield begins to decline in
about 1993, mostly because of rapid increases in R&D during that period. The corrected
patent citation yield also begins to increase in 1986-87 but does not decline later on quite as
much as the patent yield, reflecting an increase in the number of citations made per patent in
the early to mid-nineties.
The distribution of citations per patent is, as expected, extremely skewed: Fully one
quarter of the 1 million patents in our data have no citations, 150,000 have only one, 125,000
have two, and just 4 patents received more than 200 citations. Fitting a Pareto distribution to
this curve yields a parameter of 1.8, which implies that the distribution has a mean but no
variance. However, a Kolmogorov-Smirnov or other distributional test would easily reject
that the data are actually Pareto. The most highly cited patent since 1976 is patent # 4,440,871
assigned to Union Carbide Corporation in 1984, for synthesizing a novel class of crystalline
microporous silicoaluminophosphates, widely used as catalysts in chemical reactions. This
patent received 227 citations in our data (i.e. up to 1996), and a total of 349 up to July 2003.
4. Model Specification: The Market Value Equation
We use a specification of the firm-level market-value function that is predominant in
the literature: an additively separable linear specification, as was used by Griliches (1981) and
his various co-authors. A notable advantage of this specification is that it assumes that the
marginal shadow value of the assets is equalized across firms. The model is given by,
14
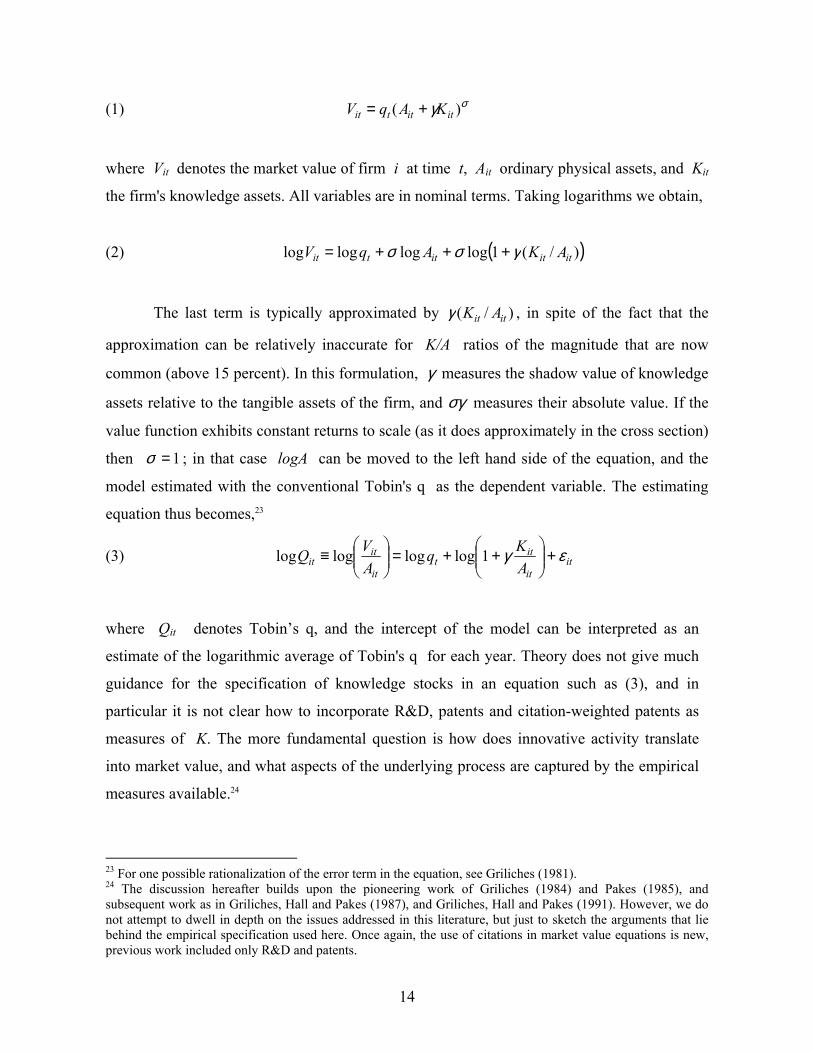
(1) σγ )( itittit KAqV +=
where Vit denotes the market value of firm i at time t, Ait ordinary physical assets, and Kit
the firm's knowledge assets. All variables are in nominal terms. Taking logarithms we obtain,
(2) ( ))/(1loglogloglog ititittit AKAqV γσσ +++=
The last term is typically approximated by )/( itit AKγ , in spite of the fact that the
approximation can be relatively inaccurate for K/A ratios of the magnitude that are now
common (above 15 percent). In this formulation, γ measures the shadow value of knowledge
assets relative to the tangible assets of the firm, and σγ measures their absolute value. If the
value function exhibits constant returns to scale (as it does approximately in the cross section)
then 1=σ ; in that case logA can be moved to the left hand side of the equation, and the
model estimated with the conventional Tobin's q as the dependent variable. The estimating
equation thus becomes,23
(3) itit
itt
it
itit A
KqAVQ εγ +
++=
≡ 1loglogloglog
where Qit denotes Tobin’s q, and the intercept of the model can be interpreted as an
estimate of the logarithmic average of Tobin's q for each year. Theory does not give much
guidance for the specification of knowledge stocks in an equation such as (3), and in
particular it is not clear how to incorporate R&D, patents and citation-weighted patents as
measures of K. The more fundamental question is how does innovative activity translate
into market value, and what aspects of the underlying process are captured by the empirical
measures available.24
23 For one possible rationalization of the error term in the equation, see Griliches (1981). 24 The discussion hereafter builds upon the pioneering work of Griliches (1984) and Pakes (1985), and subsequent work as in Griliches, Hall and Pakes (1987), and Griliches, Hall and Pakes (1991). However, we do not attempt to dwell in depth on the issues addressed in this literature, but just to sketch the arguments that lie behind the empirical specification used here. Once again, the use of citations in market value equations is new, previous work included only R&D and patents.
15
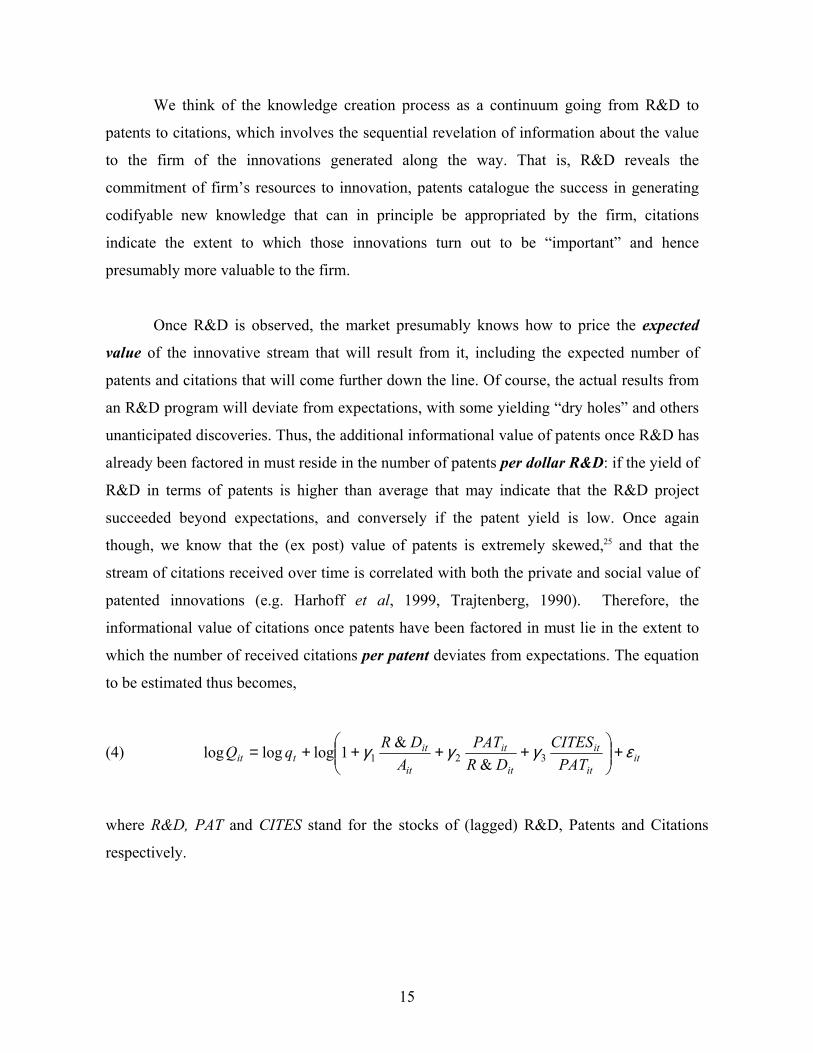
We think of the knowledge creation process as a continuum going from R&D to
patents to citations, which involves the sequential revelation of information about the value
to the firm of the innovations generated along the way. That is, R&D reveals the
commitment of firm’s resources to innovation, patents catalogue the success in generating
codifyable new knowledge that can in principle be appropriated by the firm, citations
indicate the extent to which those innovations turn out to be “important” and hence
presumably more valuable to the firm.
Once R&D is observed, the market presumably knows how to price the expected
value of the innovative stream that will result from it, including the expected number of
patents and citations that will come further down the line. Of course, the actual results from
an R&D program will deviate from expectations, with some yielding “dry holes” and others
unanticipated discoveries. Thus, the additional informational value of patents once R&D has
already been factored in must reside in the number of patents per dollar R&D: if the yield of
R&D in terms of patents is higher than average that may indicate that the R&D project
succeeded beyond expectations, and conversely if the patent yield is low. Once again
though, we know that the (ex post) value of patents is extremely skewed,25 and that the
stream of citations received over time is correlated with both the private and social value of
patented innovations (e.g. Harhoff et al, 1999, Trajtenberg, 1990). Therefore, the
informational value of citations once patents have been factored in must lie in the extent to
which the number of received citations per patent deviates from expectations. The equation
to be estimated thus becomes,
(4) itit
it
it
it
it
ittit PAT
CITESDR
PATA
DRqQ εγγγ +
++++= 321 &
&1logloglog
where R&D, PAT and CITES stand for the stocks of (lagged) R&D, Patents and Citations
respectively.
16
4.1 How to construct knowledge stocks?
The computation of R&D and patent stocks is relatively straightforward, essentially
requiring just upfront assumptions as to the depreciation rate – here we shall just follow
convention and resort to the traditional 15% depreciation rate, used in much of the literature.26
The construction of citation stocks is inherently more complex, simply because citations are
not a one-shot event at a point in time (as are R&D expenditures and patent applications), but
keep coming over a long period of time into the future (some take 50 years and more). In
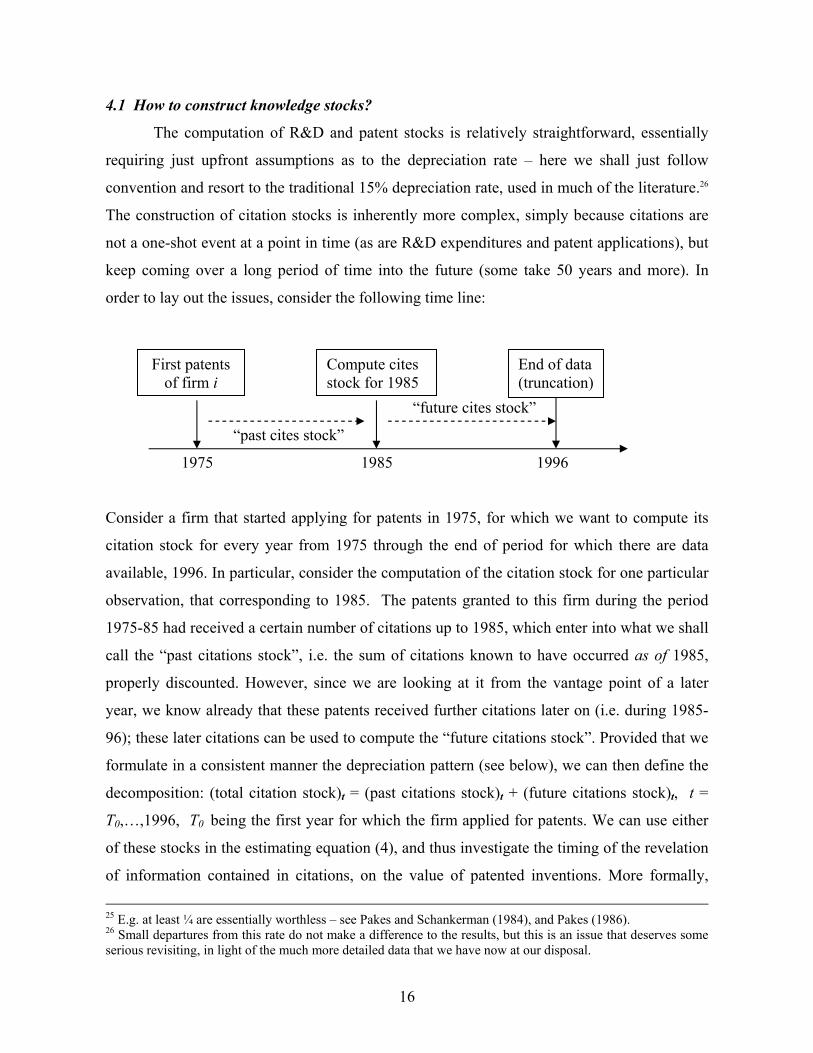
order to lay out the issues, consider the following time line:
“future cites stock”
“past cites stock”
1975 1985 1996
Consider a firm that started applying for patents in 1975, for which we want to compute its
citation stock for every year from 1975 through the end of period for which there are data
available, 1996. In particular, consider the computation of the citation stock for one particular
observation, that corresponding to 1985. The patents granted to this firm during the period
1975-85 had received a certain number of citations up to 1985, which enter into what we shall
call the “past citations stock”, i.e. the sum of citations known to have occurred as of 1985,
properly discounted. However, since we are looking at it from the vantage point of a later
year, we know already that these patents received further citations later on (i.e. during 1985-
96); these later citations can be used to compute the “future citations stock”. Provided that we
formulate in a consistent manner the depreciation pattern (see below), we can then define the
decomposition: (total citation stock)t = (past citations stock)t + (future citations stock)t, t =
T0,…,1996, T0 being the first year for which the firm applied for patents. We can use either
of these stocks in the estimating equation (4), and thus investigate the timing of the revelation
of information contained in citations, on the value of patented inventions. More formally,
25 E.g. at least ¼ are essentially worthless – see Pakes and Schankerman (1984), and Pakes (1986). 26 Small departures from this rate do not make a difference to the results, but this is an issue that deserves some serious revisiting, in light of the much more detailed data that we have now at our disposal.
First patents of firm i
Compute cites stock for 1985
End of data (truncation)
17
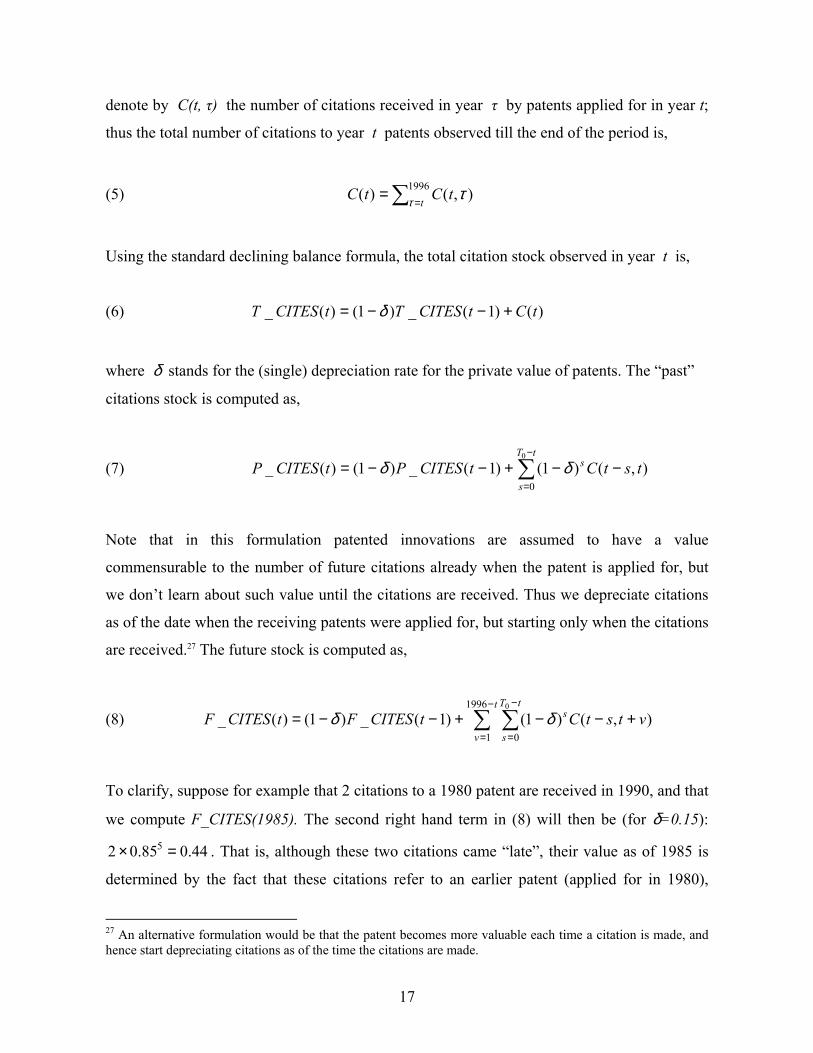
denote by C(t, τ) the number of citations received in year τ by patents applied for in year t;
thus the total number of citations to year t patents observed till the end of the period is,
(5) ∑ == 1996 ),()(
ttCtC τ τ
Using the standard declining balance formula, the total citation stock observed in year t is,
(6) )()1(_)1()(_ tCtCITESTtCITEST +−−= δ
where δ stands for the (single) depreciation rate for the private value of patents. The “past”
citations stock is computed as,
(7) ∑−
=−−+−−=
tT
s
s tstCtCITESPtCITESP0
0),()1()1(_)1()(_ δδ
Note that in this formulation patented innovations are assumed to have a value
commensurable to the number of future citations already when the patent is applied for, but
we don’t learn about such value until the citations are received. Thus we depreciate citations
as of the date when the receiving patents were applied for, but starting only when the citations
are received.27 The future stock is computed as,
(8) ∑∑−
=
−
=+−−+−−=
tT
s
st
vvtstCtCITESFtCITESF
0
0
1996
1),()1()1(_)1()(_ δδ
To clarify, suppose for example that 2 citations to a 1980 patent are received in 1990, and that
we compute F_CITES(1985). The second right hand term in (8) will then be (for δ=0.15):
44.085.02 5 =× . That is, although these two citations came “late”, their value as of 1985 is
determined by the fact that these citations refer to an earlier patent (applied for in 1980),
27 An alternative formulation would be that the patent becomes more valuable each time a citation is made, and hence start depreciating citations as of the time the citations are made.
18
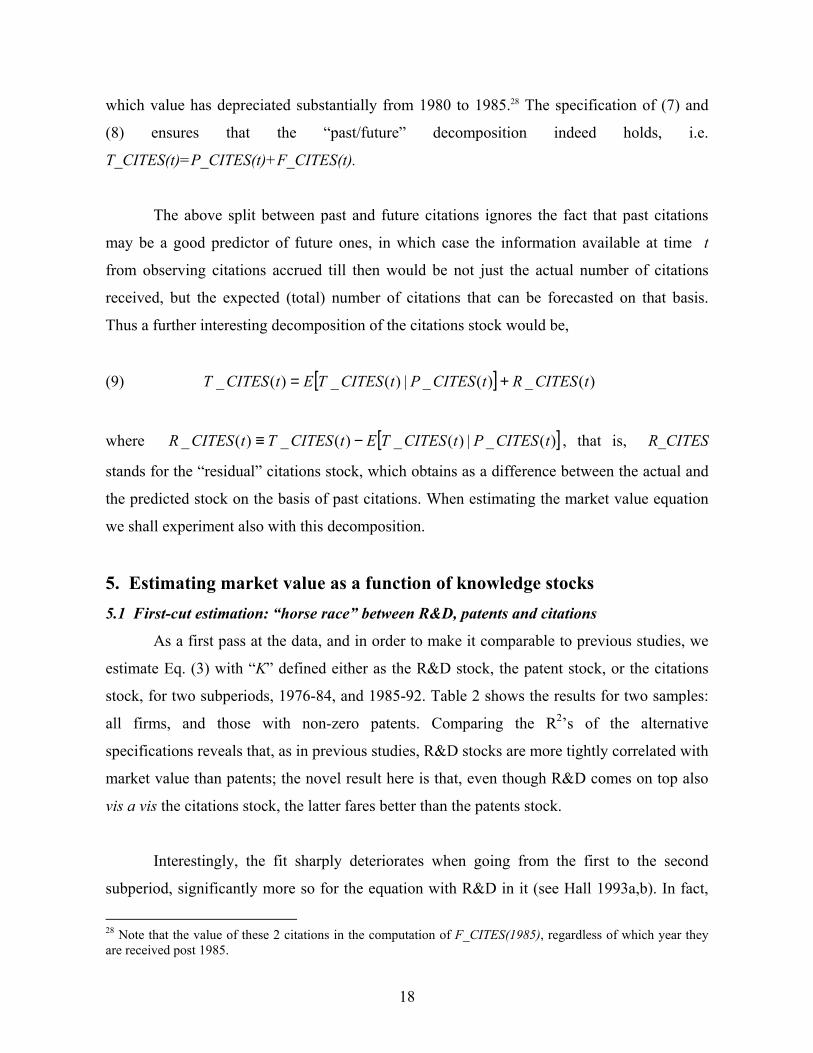
which value has depreciated substantially from 1980 to 1985.28 The specification of (7) and
(8) ensures that the “past/future” decomposition indeed holds, i.e.
T_CITES(t)=P_CITES(t)+F_CITES(t).
The above split between past and future citations ignores the fact that past citations
may be a good predictor of future ones, in which case the information available at time t
from observing citations accrued till then would be not just the actual number of citations
received, but the expected (total) number of citations that can be forecasted on that basis.
Thus a further interesting decomposition of the citations stock would be,
(9) [ ] )(_)(_|)(_)(_ tCITESRtCITESPtCITESTEtCITEST +=
where [ ])(_|)(_)(_)(_ tCITESPtCITESTEtCITESTtCITESR −≡ , that is, R_CITES
stands for the “residual” citations stock, which obtains as a difference between the actual and
the predicted stock on the basis of past citations. When estimating the market value equation
we shall experiment also with this decomposition.
5. Estimating market value as a function of knowledge stocks 5.1 First-cut estimation: “horse race” between R&D, patents and citations
As a first pass at the data, and in order to make it comparable to previous studies, we
estimate Eq. (3) with “K” defined either as the R&D stock, the patent stock, or the citations
stock, for two subperiods, 1976-84, and 1985-92. Table 2 shows the results for two samples:
all firms, and those with non-zero patents. Comparing the R2’s of the alternative
specifications reveals that, as in previous studies, R&D stocks are more tightly correlated with
market value than patents; the novel result here is that, even though R&D comes on top also
vis a vis the citations stock, the latter fares better than the patents stock.
Interestingly, the fit sharply deteriorates when going from the first to the second
subperiod, significantly more so for the equation with R&D in it (see Hall 1993a,b). In fact,
28 Note that the value of these 2 citations in the computation of F_CITES(1985), regardless of which year they are received post 1985.
19
we run also year-by-year regressions on each of the alternative stocks, and find that while the
R2s for all three stocks decline throughout the 1980s, they tend to converge: by the mid-
1980’s citations stocks, and somewhat less so patent stocks, have as much explanatory power
as R&D. It is quite likely that these findings reflect the sharp changes in patenting behavior
that occurred in the early and mid-1980s, in particular the strengthening of patents rights, and
the start of the spectacular rise in the rate of patenting (see Kortum and Lerner, 1998).
However, a much deeper inquiry is called for.
The coefficients of the alternative stocks are not directly comparable, since they are
not in the same units: the coefficient of R&D/Assets is in dollars (of market value) per dollar
(of R&D), whereas the coefficient of Patents/Assets is in terms of dollars per patent, and that
of Citations/Assets is in dollars per citation. We thus normalize the coefficients of patents and
of citations by multiplying them by the ratio of the total patent (citation) stock to the total
R&D stock for all firms.29 Thus in Table 2, the 1.74 coefficient of R&D/Assets (for the
sample of all firms, first period), can be compared to 0.344 = 0.607 x 0.566 for patents, and to
0.45 for citations. Once again, the marginal shadow value of R&D is much larger than that of
patents or of citations, but the differences shrink in the second period.
In view of the truncation problems at both ends of our data period, and given that the
shadow values of our measures appear to change over time, from now on we focus on the 10-
year period in the middle of our sample, 1979-1988, when the data are the most complete, and
the valuation coefficients rather stable.30 We also confine the sample to observations on firms
that had obtained at least one patent during the period 1975-1988 (we refer to them as
“patenting firms”), and hence for which we could compute a patent stock (and in principle
also a citation stock) for the sample period.
29 We did not use the average (or median) of these ratios over firms because of the presence of many zeros, and the skewness of both the patents and the citations distributions; yet the ratio of the totals, as used here, is not very reliable either, and thus the normalized coefficients should be taken with (more than) a grain of salt. 30 Based on yearly regressions of the model – see Hall, Jaffe and Trajtenberg (2001), Figures 5a and 5b.
20
5.2 Estimating the full model
We now turn to the estimation of the full model, as specified in equation 4: market
value is assumed to depend not only on the R&D intensity of the firm (i.e. the ratio of the
R&D stock to assets), but also on the patent yield (the ratio of the patent stock to R&D stock),
and on the average “importance” of those patents as manifested in the ratio of citations to
patents. As already mentioned, R&D, patents and citations are seen as cascading indicators of
the value of innovations, each adding further information on top of what could be predicted
on the basis of the previous indicator. Thus, for a given level of R&D spending firms that
manage to patent more will presumably have higher market valuations, and similarly for firms
with patent portfolios that receive on average more citations.
Table 3 presents the results for alternative specifications of equation 4: columns (1)
and (2) display the baseline estimates, (3) investigates more in detail the impact of the number
of citations, and (4) and (5) experiments with the decomposition of citations into past and
future, as well as into predicted and unpredicted. Each of the indicators shows a strong and
highly significant impact on market value, and a substantial contribution to the overall fit of
the estimated model. Thus, it is clear that each of the measures – R&D/assets, patents/R&D
and citations/patents – adds information on top of what could be inferred just from the
others.31 In order to assess their quantitative impact, we need to compute the semi
elasticities,32
(10) 1
3211 ˆ&
ˆ&ˆ1ˆ)/&(
log −
+++=
∂∂
PATCITES
DRPAT
ADR
ADRQ γγγγ
and similarly for PAT/R&D and for CITES/PAT. The distributions of the ratios of the
various stocks that appear in the right hand side of (10) are very skewed, and hence we
31 Note also that the dummy for not doing R&D is large and very significant. This occurs because the patent yield variable (Patents/R&D) has been set to zero when the firm has no R&D stock. The interpretation is that the average market value effect of being a firm with patents that does no R&D is 6 - 7 percent. There are 2,934 observations with no R&D in the current year; 1,960 have no stock of R&D either. 32 Note that this is a partial derivative, holding the other ratios constant, which is not a trivial matter given that R&D appears also in the denominator of the patents ratio, and patents in the denominator of the citations to patents ratio.
21
evaluate them both at the mean and at the median, and we also compute the ratio of the totals.
Table 4 presents the results, using the estimates { 321 ˆ,ˆ,ˆ γγγ } from Table 3, column (2). Thus,
an increase of 1 percentage point in the R&D intensity of a firm (i.e. in the ratio R&D/Assets)
leads to a similar increase in market value, i.e. about 0.8%; an extra patent per million $ of
R&D boosts market value by about 2%, and an extra citation per patent by over 3%. These
are very substantial effects, confirming the hypothesized importance of knowledge stocks for
firms’ value. The impact of citations per patent is particularly striking, consistent with the
“million dollar” worth of citations reported by Harhoff et al (1999).
5.3 How valuable are highly cited patents?
We have already alluded to the fact that the distribution of citations is very skewed,
with about ¼ of all patents getting none, and only a few dozen (out of millions) receiving 100
citations and more. This suggests that the average effect that we get in a regression such as
that in Table 3, column (2) may not reveal the full extent of the impact of the tail of the
citations distribution. We thus break the Citations/Patents variable up into 5 groups: < 5, 5-6,
7-10 (6 is the median), 11-20, > 20, and include dummy variables for each (the first serves as
the base category). As shown in Table 3, column (3), for firms with fewer than the median
number of citations per patent, it makes no difference how far below the median they fall:
firms with 5-6 citations per patent have no higher value than those with less than 5. However,
firms that average more than the median number of citations per patent exhibit a very
significant increase in market value: 10% higher if having 7-10 citations per patent, and 35%
higher if having 2-3 times the median (11-20 citations per patent). The most dramatic effect is
for the 143 firms (573 observations) with more than 20 cites per patent: the market value of
these firms is a staggering 54% higher than that would be expected given their R&D capital
and their patent stock.
These 143 firms with exceptionally high citation rates are concentrated in computing,
office equipment, semiconductors, and electronics (66 firms), and in pharmaceuticals and
medical instruments (41 firms).33 They include both small firms (which have very few highly
33 Of the remaining 38 firms 8 are in machinery, 7 in textiles and apparel, and the other 23 are scattered in various sectors.
22
cited patents) and medium to large firms (such as Intel, Compaq Computer, Tandem
Computer, Alza, and General Signal Corporation). It appears that the larger firms are
primarily in the electronics sector, broadly defined, while those in the pharmaceutical sector
that average a high citation rate are more likely to be smaller biotechnology firms.
5.4 The timing of citations
As mentioned in section 3, citations unfold over time, sometimes well into the future,
and hence it is not clear to what extent the market anticipates these future citations, or rather
reacts to them as they occur. In Table 3, column (4) we partition the stock of citations into
“past” and “future” as shown in equations (7) and (8): whereas the coefficient of the stock
based on future citations is somewhat larger than the coefficient of the stock based on all
citations, that of past citations is negative and marginally significant. Thus, it would seem that
past citations quickly become “old news” and hence do not impact current market value
(beyond R&D and patents); on the other hand, investors are able to forecast pretty well the
expected value of patented innovations as it evolves over time, which is later corroborated by
future citations.
However, the past and future citations stocks are in fact highly correlated measures of
the same underlying quantity, and thus this finding does not necessarily imply that realized
citations are worthless for forecasting the value of the knowledge assets associated with
patents or the expected profit stream from those assets. Indeed, past citations could be used to
forecast future ones, and therefore to forecast also the value associated with the underlying
patented innovations. To explore this idea, we decompose the total citation stock into the part
predicted by the past citation stock and the (orthogonal) residual, as shown in equation (9).34
As can be seen in Table 3, column 5, the coefficient of the unexpected portion is much larger
than that of the predictable one, but the latter is still significantly positive. Thus, past citations
clearly help in forecasting future returns, yet there is new and highly significant information
on the value of patented innovations that is revealed along the way, that correlates tightly with
future/unpredicted citations.
34 We also included a full set of time dummies in the conditioning set.
23
5.5 Industry Effects
In Table 5 we include dummies for 6 sectors: Drugs and Medical Instrumentation
(henceforth just “Drugs”), Chemicals, Computers and Communications (Comp&Comm),
Electrical, Metals and Machinery, and miscellaneous (low-tech industries), and interact them
with the knowledge stock ratios. In column (2) we can see that there is a high premium to
being in the Drugs or Comp&Comm sectors, which comes mostly at the expense of the
coefficient of R&D intensity, which plunges by a half. The full interactions in column (3)
reveal wide differences across sectors in the effects of each knowledge stock ratio. In general,
the differential importance of patent yield and of citations per patent rises, at the expense of
R&D intensity. Thus, whereas in no sector the effect of R&D/Assets is much larger than the
average effect picked up in the base specification displayed in column (1), the impact of
patent yield for Drugs is 3 times the average effect (0.10 versus 0.031), and that of
Comp&Comm twice as high; similarly but not as pronounced, the impact of citations/patents
for Drugs is over 50% higher than the average effect, while that for Comp&Comm is small,
and lower than that for the other sectors except for the low-tech sector. This contrast is
consistent with the differing roles played by patents in the two sectors: Drugs is characterized
by discrete product technologies where patents serve their traditional role of exclusion, and
some of them are therefore valuable on an individual basis, as measured by citations.
Comp&Comm is a group of complex product industries where many patents held by different
firms “read” on a given product. In this industry patents are largely valued for negotiating
cross-licensing agreements, so their individual quality is not as important, although having
them is.35
5.6 The impact of self-citations
Citations to a given patent may come from any subsequent patent, including from
patents assigned to the same firm as that holding the cited patent. These “self-citations” may
differ from other citations in various ways:36 first, self-citations cannot be regarded as
representing spillovers as these are commonly defined, since they occur within the same
35 See Cohen, Nelson, and Walsh (2000) for further discussion of this contrast and Hall and Ziedonis (2001) for evidence on semiconductors. 36 Indeed, self-citations have received careful attention in previous studies, and in many cases they have been treated differently than external citations – see e.g. Jaffe et al (1993), Jaffe and Trajtenberg (2002).
24
economic unit. Second, although it is the patent examiner who decides what citations are
made, this decision is based in part on information provided by the applicant, and occurs in a
process of negotiation with the applicant’s attorneys. Hence it is possible that self-citations
are affected to some degree by firms’ differential knowledge and incentives with respect to
internal versus external citations. Finally, and most importantly for our purposes here, self-
citations may provide very different signals than external citations regarding the value to the
firm of the subsequent down-the-line, technologically connected innovations.
Indeed, firms citing their own patents may be a reflection of the cumulative nature of
innovation and the ''increasing returns'' property of knowledge accumulation, particularly
within a narrow field or technology trajectory. Self-citations would then suggest that the firm
has a strong competitive position in that particular technology and is in a position to
internalize some of the knowledge spillovers created by its own developments. This would
imply both that the firm has lower costs because there is less need to acquire technology from
others, and that they may be able to earn higher profits without risking rapid entry (since it
controls a substantial stretch of the underlying technology). If so, the private value of self-
citations would be greater than that of external citations, since the latter might be indicative
inter alia of spillovers that are beneficial to others, and in particular to potential or actual
competitors. On the other hand, if the share of self-citations reflects primarily the extent of
“self-bias”, then their informational content as to market value might be weaker.
These effects may change with firm size, or rather with the size of their patent
portfolio: the share of self-citations should increase with the size of the portfolio, simply
because the more patents a firm has, the higher the probability that a citation from a new
patent it gets will be given to a patent it already has.37 Thus firms with larger portfolios will
exhibit for “mechanical” reasons a larger share of self-citations, regardless of whether these
self-citations are indicative of the type of real phenomena mentioned before (e.g.
internalization of spillovers leading to competitive advantage). In fact, the raw correlation
37 Suppose there are N patents that could be cited, and that they are all equally likely to be cited by a new patent, i.e. the probability of citing any particular patent is simply 1/N. If the firm owns n out of these N patents, then the probability that a citation will be a self citation is n/N. Thus the share of self citations should grow with n, the size of the patent portfolio.
25
between share of self-citations and the log of the patent portfolio size is about 0.22.38 Thus,
the presumed link between self-citations and market value may weaken with the size of the
patent portfolio. Moreover, it may well be that the “self-bias” increases with size (e.g. because
of the presence of more active legal departments in firms with large portfolios), and thus the
confluence of both the statistical effect just mentioned and the increasing self-bias may
altogether cancel the expected positive effect of self-cites for firms holding large portfolios.
In order to investigate this question, we add self-citation measures to our valuation
equation in two ways: the share of self-citations out of total citations, and the ratio of the
stock of self-citations to the patent stock. Since self-citations are already included in the
citation stock, when we add the latter variable to the regression, its coefficient will represent
the premium or discount associated with self-citations. The distribution of the share of self-
citations is very skewed (towards zero), the median share is 0.06, the mean 0.09, and for 1.5%
of the observations the share is higher than 0.50.
Columns 2 and 3 of Table 6 show the results of estimating our preferred specification
with these variables included. Both forms of the self-cite variable have highly significant and
positive coefficients in the market value equation. From column 2 we see that an increase of
10 percentage points in the share of self-citations is associated with a 2.2% increase in market
value. The results in column 3 indicate that, if each of the patents held by the firm receives an
additional cite from patents held by other entities, market value increases by 4.3%; however,
if those extra citations are made by the firm itself, market value rises 10%. In column (4) we
investigate the question of the size of the patent portfolio held by the firm and the impact of
self-citations: as hypothesized, the value-relevance of self-cites declines with size. For firms
holding an average-sized patent portfolio (about 200 patents), the effect of self-cites is that
just described, and for those with smaller portfolios self-cites have even a more pronounced
effect on market value. However, for firms with a portfolio of 1,000 patents self-citations do
not make a difference, and above that the impact on market value is even negative.
38 Regressing the share of self-citations on log(patents), with year dummies and a dummy for zero cites, renders a coefficient of 0.013 on log(patents). Two standard deviations over the mean of log(patents) brings the share of self-citations to 0.055, almost twice the median.
26
6. Concluding remarks The results of the paper clearly show that patent citations contain significant
information on the market value of firms, in addition to R&D and simple patents counts, thus
enriching the toolkit available to economists in trying to tackle empirically the intangible
assets, and in particular the “knowledge stock” of firms. In so doing, our findings help
overcome the problem of the huge heterogeneity in the “importance” of patents, that greatly
undermined their use in the explanation of firm value or performance.
It remains true that patent-related measures cannot win a ''horserace'' with R&D as a
determinant of market value, but this is hardly surprising:39 Even if citations are a reasonably
informative signal of success, this does not mean that they will be more correlated with value
than R&D, because optimizing firms will increase their R&D in response to success. Our
findings indicate that the marginal effect of additional citations per patent on market value is
very high (controlling for R&D intensity and for patent yield): if the “quality” of patents of a
firm increases so that on average these patents receive one additional citation, the market
value of the firm would increase by 3%. This is a very large impact, but then one has to keep
in mind that getting an additional citation per patent is very hard, considering that the mean
number of citations per patent is just over 3, and that the distribution is extremely skewed,
with about ¼ receiving none. The finding of a high quasi elasticity of Tobin’s q to citations
per patent (of 3%) implies, reassuringly, that the citations/patents ratio is not just a
statistically significant regressor, but a high-resolution indicator of the value of patented
innovations. Breaking the number of citations into segments reveals that as we move up the
distribution to, say, twice the median, the impact on market value grows very large (a
premium of about 35%), which raises to 50% as a firm collects citations to the tune of 3 times
the median and more.
We classify firms into six major sectors in order to explore industry effects, and find
that there are indeed wide differences across them in the impact of each knowledge stock ratio
on market value. Thus, the impact of patent yield for Drugs is 3 times the average, and that of
Comp&Comm twice as high; similarly, the impact of citations/patents for Drugs is over 50%
27
higher than the average effect, while that for Comp&Comm is small, and lower than all others
except for the low-tech sector.
Exploring in more detail the unfolding over time of the information that citations
provide, we find that market value is highly correlated with the portion of down-the-line
citations that cannot be predicted on the basis of past citations, and furthermore, the
coefficient on these unpredictable citations is 4 times larger than the coefficient on the
predictable portion. This suggests that the market “already knows” much about the value of
inventions, which will ultimately be confirmed by the arrival of future “unexpected” citations,
“unexpected” in the sense that they cannot be predicted on the basis of past citations. This
intriguing result calls for further inquiry: how many years' worth of citations does one have to
observe in order to know most of what citations will eventually reveal – is, say, 10 years
enough? What fraction of what one learns from the lifetime citations (in the sense of the
correlation with market value), is known after say 5 years? Also, one could explore whether
this result is driven by the tail of the distribution, which we know is associated with much of
the value. In other words, to what extent is it possible to predict that a patent will ultimately
get more than 20 citations based only on the first few years' citations? Is this difficulty of
predicting the really big winners what makes the unpredictable portion of the citations total so
important? 40
A further interesting finding is that market value is positively correlated with the share
of self-citations out of total citations to a firm’s patents, but that such linkage weakens with
the size of the firm’s patent portfolio. The self-citation variable gives us a window into
technological competition, in the sense that it may inform us about the extent to which firms
have internalized knowledge spillovers, or the strength of their competitive position vis-a-vis
other firms in their industry. Future work should explore the ways in which this finding varies
by technology field, and further investigate the meaning of the size relationship that we found.
39 This point has been forcefully made by Samuel Kortum in a comment on this paper. 40 It would also be useful to explore the use of a functional form or normalization that would allow the relative value of past and future citations to be compared more directly, rather than just asking which adds more to the R2.
28
In addition to these variations on the themes already struck, there are other aspects of
citation behavior that are likely to be value-relevant and hence worth exploring.41 One is
generality, defined as (1 minus) the Herfindahl index of concentration of citations over patent
classes (see Trajtenberg, Henderson, and Jaffe, 1997). The idea is that if citations to a patent
are spread over a larger number of technological fields, the cited patent is to be regarded as
more “general,” in that it presumably spilled over a wider range of fields. In terms of
impacting the market value of firms, though, one could hypothesize the following: for firms
that concentrate in narrow fields of activity, more generality is likely to be detrimental, since
the firm will not be able to appropriate the spillovers to other fields. For conglomerates, the
opposite may be true. Thus, for example, we could compute the average generality of patents
for firm j in year t, and interact it with a dummy for whether or not the firm is a
conglomerate. We may need to normalize generality as well, since the measure depends on
the number of citations. This suggests both a conceptual difficulty in separating the effects of
generality from citation intensity, and also a complex truncation problem in the generality
measure itself. There is thus a plentiful research agenda ahead; we hope the findings of this
paper will encourage its pursuit.
41 Another issue that we have explored little in this paper but which deserves attention is the variation in measurement error across measures based on widely varying numbers of patents and citations. Because of the count nature of the underlying data, measures based on few citations or patents are inherently ''noisier'' than those based on a large number. See Hall (2000) for a discussion of this issue in the context of a concentration index based on patent counts.
29
References
Albert, M. B., D. Avery, F. Narin, and P. McAllister. 1991. ''Direct Validation of Citation Counts as Indicators of Industrially Important Patents,'' Research Policy 20: 251-259.
Austin, David. 1993. ''An Event Study Approach to Measuring Innovative Output: The Case of Biotechnology,'' American Economic Review 83 (May): 253-258.
Blundell, Richard, Rachel Griffith, and John van Reenen. 1999. ''Market Share, Market Value, and Innovation in a Panel of British Manufacturing Firms.'' Review of Economic Studies 66: 529-554.
Cohen, Wesley M., Richard R. Nelson and John P. Walsh. 2000. "Protecting Their Intellectual Assets: Appropriability Conditions and Why Firms Patent or Not?," NBER Working Paper No. 7552
Connolly, Robert A., and Mark Hirschey. 1988. ''Market Value and Patents: A Bayesian Approach,'' Economics Letters 27(1): 83-87.
Crepon, Bruno, Emmanuel Duguet and Jacques Mairesse. 1998. "Research, Innovation, and Productivity: An Econometric Analysis at the Firm Level," Economics of Innovation and New Technology 7 (3): 115-156.
Giummo, Jesse. 2003. An Empirical Examination of the Value of Patented Inventions Using German Employee Inventors’ Compensation Records. University of California at Berkeley: doctoral dissertation.
Griliches, Zvi. 1981. ''Market Value, R&D, and Patents,'' Economic Letters 7: 183-187.
Griliches, Zvi (editor). 1984. R&D, Patents and Productivity, University of Chicago Press.
Griliches, Zvi, Ariel Pakes and Bronwyn H. Hall, 1987. ''The Value of Patents as Indicators of Inventive Activity,'' in Dasgupta, Partha, and Paul Stoneman (eds.), Economic Policy and Technological Performance. Cambridge, England: Cambridge University Press, 97-124.
Griliches, Zvi, Bronwyn H. Hall, and Ariel Pakes. 1991. ''R&D, Patents, and Market Value Revisited: Is There a Second (Technological Opportunity) Factor?'' Economics of Innovation and New Technology 1: 183-202.
Bronwyn H. Hall. 1993a. ''The Stock Market Valuation of R&D Investment during the 1980s,'' American Economic Review 83: 259-264.
_____________. 1993b. ''Industrial Research during the 1980s: Did the Rate of Return Fall?'' Brookings Papers on Economic Activity Micro (2): 289-344. ________________. 2000. “Innovation and Market Value.” In Barrell, Ray, Geoffrey Mason, and Mary O'Mahoney (eds.), Productivity, Innovation and Economic Performance, Cambridge: Cambridge University Press.
Hall, Bronwyn H., and Rosemarie Ham Ziedonis. 2001. ''The Patent Paradox Revisited: Determinants of Patenting in the U.S. Semiconductor Industry, 1980-94,'' Rand Journal of Economics, Vol. 32, No. 1.
30
Hall, Bronwyn H, Adam Jaffe, and Manuel Trajtenberg. 2000. “Market Value and Patent Citations: A First Look”. NBER Working Paper No. 7741 (June).
Hall, Bronwyn H, Adam Jaffe, and Manuel Trajtenberg. 2001. “The NBER Patent Citations Data File: Lessons, Insights and Methodological Tools,” NBER Working Paper No. 8498 (October). Reprinted as Chapter 13 in Jaffe and Trajtenberg (2002)
Harhoff, Dietmar, Francis Narin, F.M. Scherer, and Katrin Vopel. 1999. ''Citation Frequency and the Value of Patented Inventions,'' The Review of Economics and Statistics 81(3): 511-515.
Jaffe, Adam. 1986. ''Technological Opportunity and Spillovers of R&D: Evidence from Firms' Patents, Profits, and Market Value,'' American Economic Review 76: 984-1001.
Jaffe, Adam, Manuel Trajtenberg and Michael Fogarty. 2000. ''The Meaning of Patent Citations: Report of the NBER/Case Western Reserve Survey of Patentees,'' NBER Working Paper No. 7631 (April). Reprinted as Chapter 12 in Jaffe and Trajtenberg (2002).
Jaffe, Adam, Manuel Trajtenberg, and Rebecca Henderson. 1993. ''Geographic Localization of Knowledge Spillovers as Evidenced by Patent Citations,'' Quarterly Journal of Economics 108(3), August, 577-598.
Jaffe, Adam and Manuel Trajtenberg, 2002, Patents, Citations and Innovations: A Window on the Knowledge Economy. Cambridge, MIT Press.
Kortum, Samuel and Josh Lerner. 1998. "Stronger Protection or Technological Revolution: What is Behind the Recent Surge in Patenting?” Carnegie-Rochester Conference Series on Public Policy, 48, 247-304.
Lanjouw, Jean O., and Mark Schankerman. 2003. 'Patent Quality and Research Productivity: Measuring Innovation with Multiple Indicators,'' Economic Journal, forthcoming.
Office of Technology Assessment and Forecast (OTAF), 1976. U.S. Department of Commerce, Patent and Trademark Office, Sixth Report. Washington, D.C.: US Government Printing Office, 1976.
Pakes, Ariel. 1985. ''On Patents, R&D, and the Stock Market Rate of Return,'' Journal of Political Economy 93: 390-409.
Pakes, Ariel. 1986. ''Patents as Options: Some Estimates of the Value of Holding European Patent Stocks,'' Econometrica 54: 755-784.
Pakes, Ariel, and Mark Schankerman. 1984. ''The Rate of Obsolescence of Patents, Research Gestation Lags, and the Private Rate of Return to Research Resources,'' in Griliches, Zvi (ed.), R&D, Patents, and Productivity, Chicago: University of Chicago Press.
Schankerman, Mark, and Ariel Pakes. 1986. ''Estimates of the Value of Patent Rights in European Countries during the Post-1950 Period,'' Economic Journal 97: 1-25.
Scherer, F. M. 1965. ''Firm Size, Market Structure, Opportunity, and the Output of Patented Innovations,'' American Economic Review 55: 1097-1123.
Schmookler, Jacob. 1966. Invention and Economic Growth, Cambridge, Mass.: Harvard University Press.
31
Shane, Hilary. 1993. ''Patent Citations as an Indicator of the Value of Intangible Assets in the Semiconductor Industry.'' Philadelphia, PA: The Wharton School. Photocopied (November).
Trajtenberg, Manuel. 1990. ''A Penny for Your Quotes: Patent Citations and the Value of Innovations,'' Rand Journal of Economics 21 (1): 172-187.
Trajtenberg, Manuel, Rebecca Henderson, and Adam Jaffe. 1997. ''University versus Corporate Patents: A Window on the Basicness of Invention,'' Economics of Innovation and New Technology 5: 19-50.
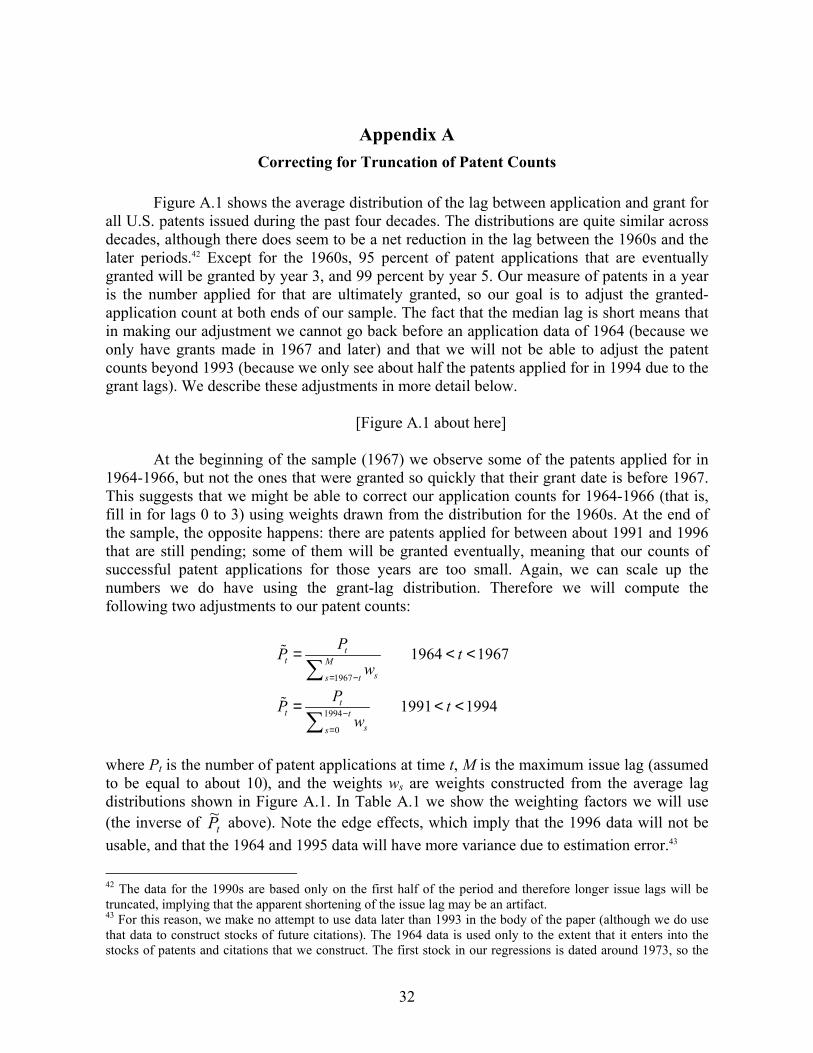
32
Appendix A Correcting for Truncation of Patent Counts
Figure A.1 shows the average distribution of the lag between application and grant for
all U.S. patents issued during the past four decades. The distributions are quite similar across decades, although there does seem to be a net reduction in the lag between the 1960s and the later periods.42 Except for the 1960s, 95 percent of patent applications that are eventually granted will be granted by year 3, and 99 percent by year 5. Our measure of patents in a year is the number applied for that are ultimately granted, so our goal is to adjust the granted-application count at both ends of our sample. The fact that the median lag is short means that in making our adjustment we cannot go back before an application data of 1964 (because we only have grants made in 1967 and later) and that we will not be able to adjust the patent counts beyond 1993 (because we only see about half the patents applied for in 1994 due to the grant lags). We describe these adjustments in more detail below.
[Figure A.1 about here]
At the beginning of the sample (1967) we observe some of the patents applied for in
1964-1966, but not the ones that were granted so quickly that their grant date is before 1967. This suggests that we might be able to correct our application counts for 1964-1966 (that is, fill in for lags 0 to 3) using weights drawn from the distribution for the 1960s. At the end of the sample, the opposite happens: there are patents applied for between about 1991 and 1996 that are still pending; some of them will be granted eventually, meaning that our counts of successful patent applications for those years are too small. Again, we can scale up the numbers we do have using the grant-lag distribution. Therefore we will compute the following two adjustments to our patent counts:
1967
1994
0
1964 1967
1991 1994
tt M
ss t
tt t
ss
PP tw
PP tw
= −
−
=
= < <
= < <
∑
∑
where Pt is the number of patent applications at time t, M is the maximum issue lag (assumed to be equal to about 10), and the weights ws are weights constructed from the average lag distributions shown in Figure A.1. In Table A.1 we show the weighting factors we will use (the inverse of tP~ above). Note the edge effects, which imply that the 1996 data will not be usable, and that the 1964 and 1995 data will have more variance due to estimation error.43
42 The data for the 1990s are based only on the first half of the period and therefore longer issue lags will be truncated, implying that the apparent shortening of the issue lag may be an artifact. 43 For this reason, we make no attempt to use data later than 1993 in the body of the paper (although we do use that data to construct stocks of future citations). The 1964 data is used only to the extent that it enters into the stocks of patents and citations that we construct. The first stock in our regressions is dated around 1973, so the
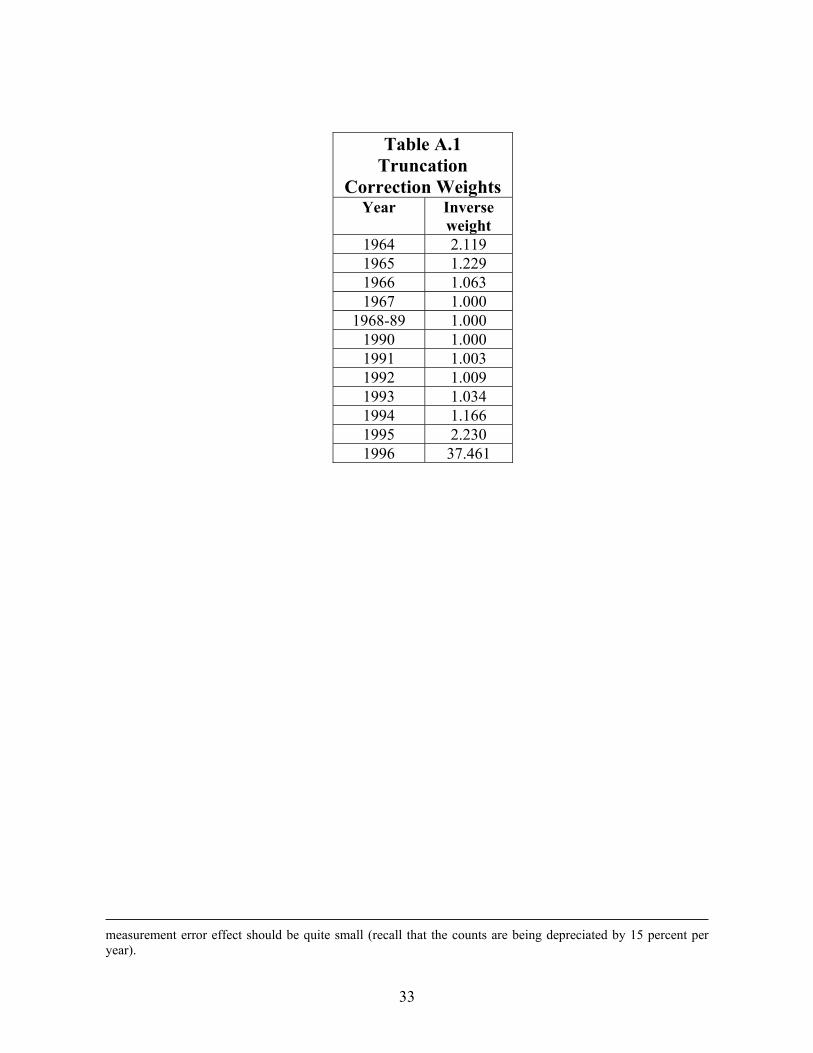
33
Table A.1 Truncation
Correction Weights Year Inverse
weight 1964 2.119 1965 1.229 1966 1.063 1967 1.000
1968-89 1.000 1990 1.000 1991 1.003 1992 1.009 1993 1.034 1994 1.166 1995 2.230 1996 37.461
measurement error effect should be quite small (recall that the counts are being depreciated by 15 percent per year).
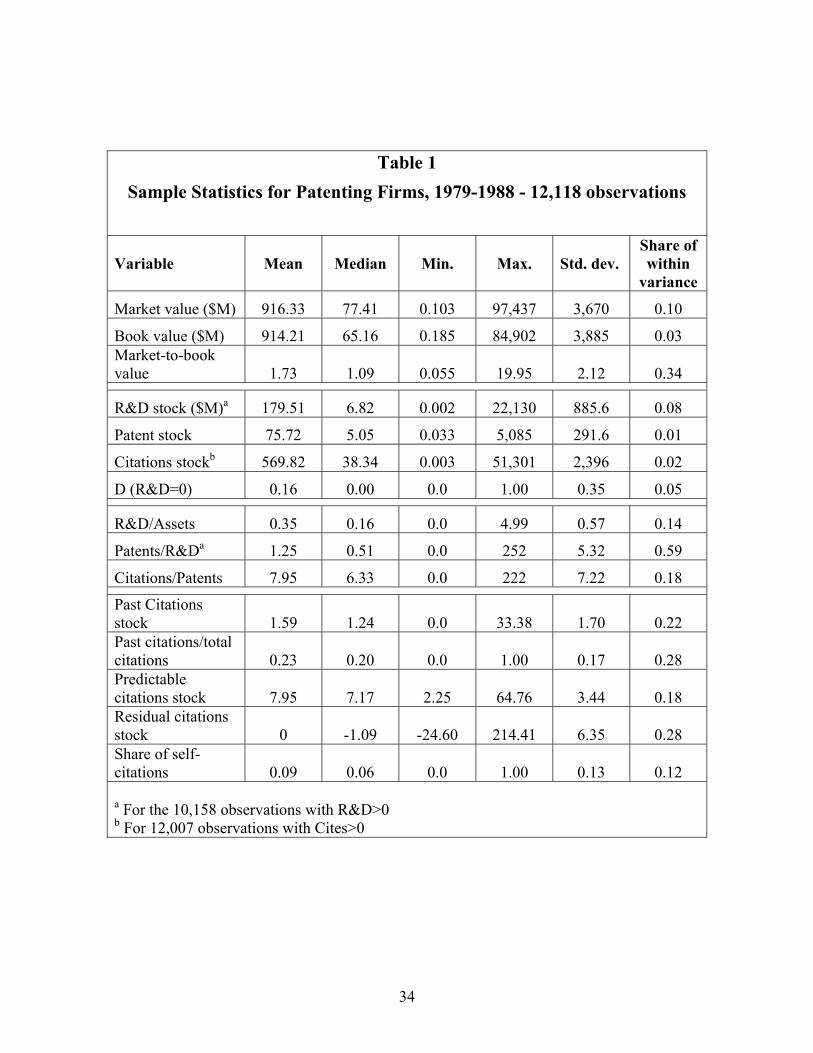
34
Table 1 Sample Statistics for Patenting Firms, 1979-1988 - 12,118 observations
Variable
Mean
Median Min.
Max.
Std. dev. Share of within
variance
Market value ($M) 916.33 77.41 0.103 97,437 3,670 0.10
Book value ($M) 914.21 65.16 0.185 84,902 3,885 0.03 Market-to-book value 1.73 1.09 0.055 19.95 2.12 0.34
R&D stock ($M)a 179.51 6.82 0.002 22,130 885.6 0.08
Patent stock 75.72 5.05 0.033 5,085 291.6 0.01
Citations stockb 569.82 38.34 0.003 51,301 2,396 0.02
D (R&D=0) 0.16 0.00 0.0 1.00 0.35 0.05
R&D/Assets 0.35 0.16 0.0 4.99 0.57 0.14
Patents/R&Da 1.25 0.51 0.0 252 5.32 0.59
Citations/Patents 7.95 6.33 0.0 222 7.22 0.18
Past Citations stock 1.59 1.24 0.0 33.38 1.70 0.22 Past citations/total citations 0.23 0.20 0.0 1.00 0.17 0.28 Predictable citations stock 7.95 7.17 2.25 64.76 3.44 0.18 Residual citations stock 0 -1.09 -24.60 214.41 6.35 0.28 Share of self-citations 0.09 0.06 0.0 1.00 0.13 0.12 a For the 10,158 observations with R&D>0 b For 12,007 observations with Cites>0
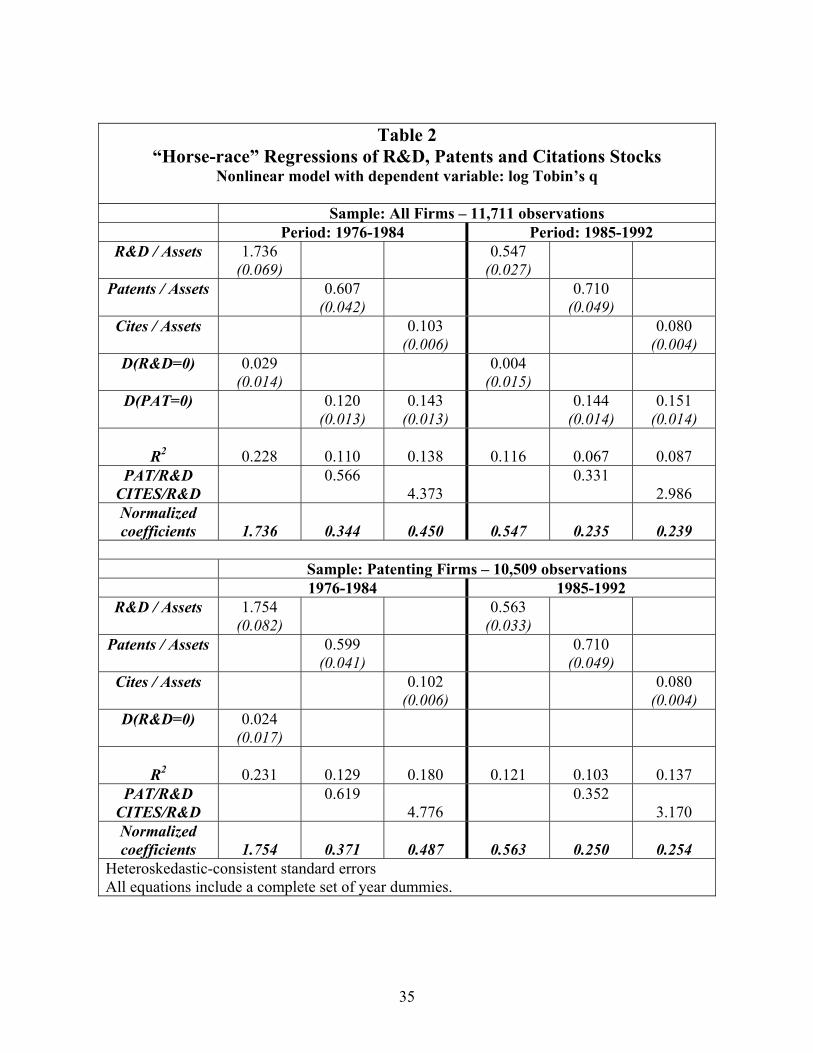
35
Table 2 “Horse-race” Regressions of R&D, Patents and Citations Stocks
Nonlinear model with dependent variable: log Tobin’s q
Sample: All Firms – 11,711 observations Period: 1976-1984 Period: 1985-1992
R&D / Assets 1.736 (0.069)
0.547 (0.027)
Patents / Assets 0.607 (0.042)
0.710 (0.049)
Cites / Assets 0.103 (0.006)
0.080 (0.004)
D(R&D=0) 0.029 (0.014)
0.004 (0.015)
D(PAT=0) 0.120 (0.013)
0.143 (0.013)
0.144 (0.014)
0.151 (0.014)
R2
0.228
0.110
0.138
0.116
0.067
0.087
PAT/R&D CITES/R&D
0.566 4.373
0.331 2.986
Normalized coefficients
1.736
0.344
0.450
0.547
0.235
0.239
Sample: Patenting Firms – 10,509 observations 1976-1984 1985-1992
R&D / Assets 1.754 (0.082)
0.563 (0.033)
Patents / Assets 0.599 (0.041)
0.710 (0.049)
Cites / Assets 0.102 (0.006)
0.080 (0.004)
D(R&D=0) 0.024 (0.017)
R2
0.231
0.129
0.180
0.121
0.103
0.137
PAT/R&D CITES/R&D
0.619 4.776
0.352 3.170
Normalized coefficients
1.754
0.371
0.487
0.563
0.250
0.254
Heteroskedastic-consistent standard errors All equations include a complete set of year dummies.
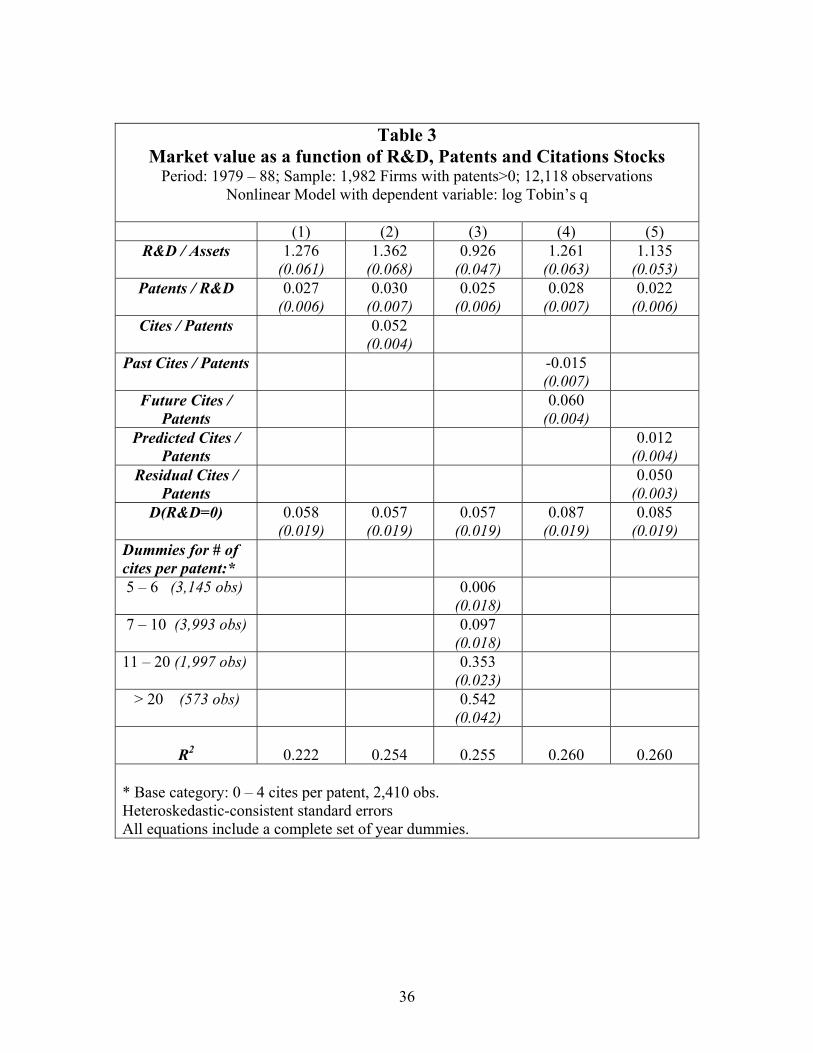
36
Table 3 Market value as a function of R&D, Patents and Citations Stocks
Period: 1979 – 88; Sample: 1,982 Firms with patents>0; 12,118 observations Nonlinear Model with dependent variable: log Tobin’s q
(1) (2) (3) (4) (5)
R&D / Assets 1.276 (0.061)
1.362 (0.068)
0.926 (0.047)
1.261 (0.063)
1.135 (0.053)
Patents / R&D 0.027 (0.006)
0.030 (0.007)
0.025 (0.006)
0.028 (0.007)
0.022 (0.006)
Cites / Patents 0.052 (0.004)
Past Cites / Patents -0.015 (0.007)
Future Cites / Patents
0.060 (0.004)
Predicted Cites / Patents
0.012 (0.004)
Residual Cites / Patents
0.050 (0.003)
D(R&D=0) 0.058 (0.019)
0.057 (0.019)
0.057 (0.019)
0.087 (0.019)
0.085 (0.019)
Dummies for # of cites per patent:*
5 – 6 (3,145 obs) 0.006 (0.018)
7 – 10 (3,993 obs) 0.097 (0.018)
11 – 20 (1,997 obs) 0.353 (0.023)
> 20 (573 obs) 0.542 (0.042)
R2
0.222
0.254
0.255
0.260
0.260
* Base category: 0 – 4 cites per patent, 2,410 obs. Heteroskedastic-consistent standard errors All equations include a complete set of year dummies.
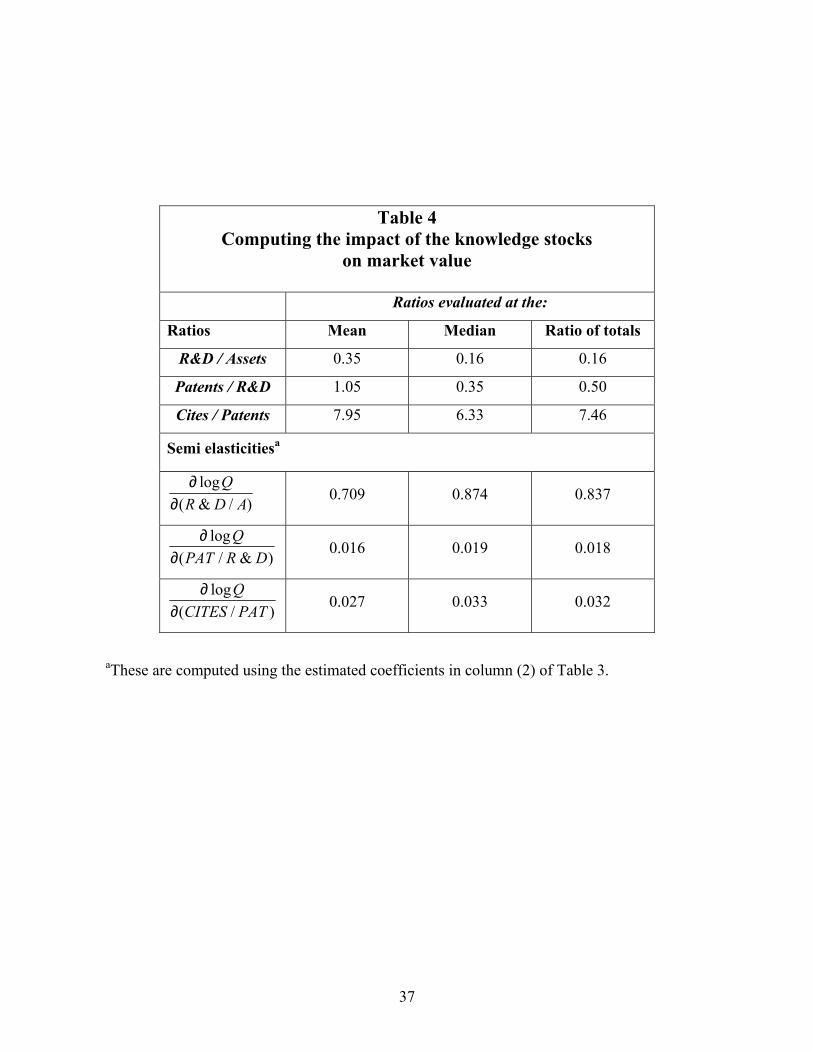
37
Table 4 Computing the impact of the knowledge stocks
on market value
Ratios evaluated at the:
Ratios Mean Median Ratio of totals
R&D / Assets 0.35 0.16 0.16
Patents / R&D 1.05 0.35 0.50
Cites / Patents 7.95 6.33 7.46
Semi elasticitiesa
)/&(log
ADRQ
∂∂ 0.709 0.874 0.837
)&/(log
DRPATQ
∂∂ 0.016 0.019 0.018
)/(log
PATCITESQ
∂∂ 0.027 0.033 0.032
aThese are computed using the estimated coefficients in column (2) of Table 3.
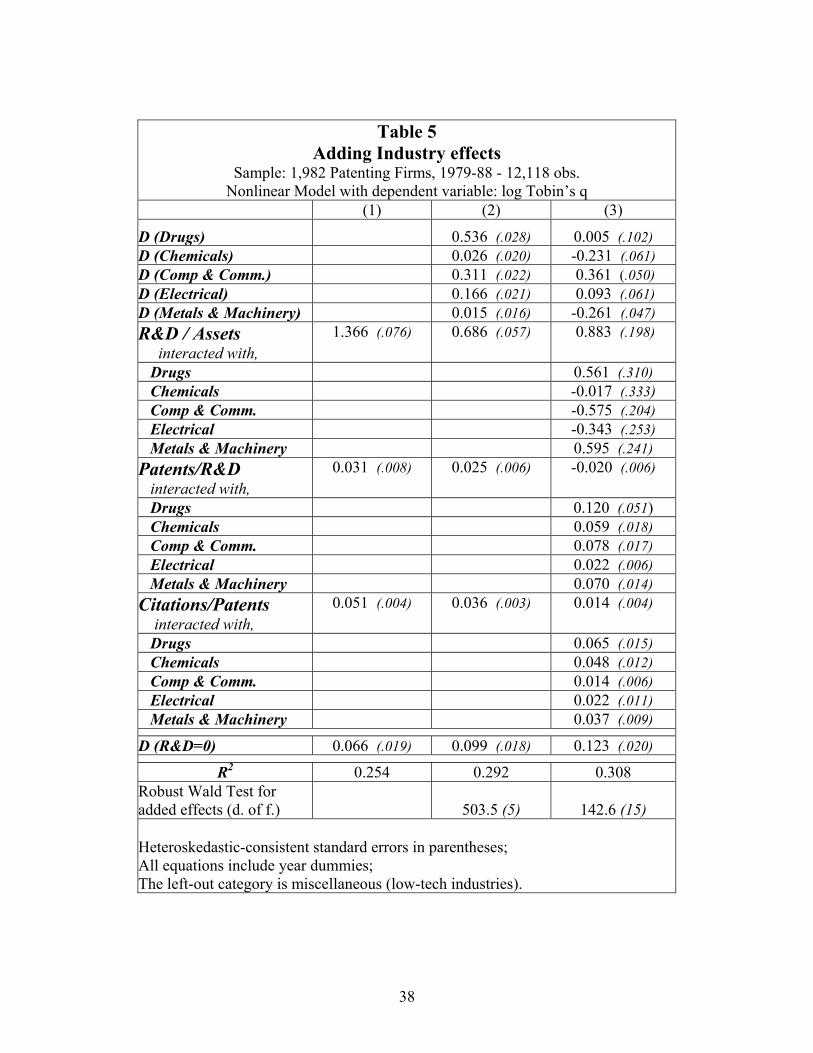
38
Table 5 Adding Industry effects
Sample: 1,982 Patenting Firms, 1979-88 - 12,118 obs. Nonlinear Model with dependent variable: log Tobin’s q
(1) (2) (3)
D (Drugs) 0.536 (.028) 0.005 (.102) D (Chemicals) 0.026 (.020) -0.231 (.061) D (Comp & Comm.) 0.311 (.022) 0.361 (.050) D (Electrical) 0.166 (.021) 0.093 (.061) D (Metals & Machinery) 0.015 (.016) -0.261 (.047) R&D / Assets interacted with,
1.366 (.076) 0.686 (.057) 0.883 (.198)
Drugs 0.561 (.310) Chemicals -0.017 (.333) Comp & Comm. -0.575 (.204) Electrical -0.343 (.253) Metals & Machinery 0.595 (.241) Patents/R&D interacted with,
0.031 (.008) 0.025 (.006) -0.020 (.006)
Drugs 0.120 (.051) Chemicals 0.059 (.018) Comp & Comm. 0.078 (.017) Electrical 0.022 (.006) Metals & Machinery 0.070 (.014) Citations/Patents interacted with,
0.051 (.004) 0.036 (.003) 0.014 (.004)
Drugs 0.065 (.015) Chemicals 0.048 (.012) Comp & Comm. 0.014 (.006) Electrical 0.022 (.011) Metals & Machinery 0.037 (.009)
D (R&D=0) 0.066 (.019) 0.099 (.018) 0.123 (.020)
R2 0.254 0.292 0.308 Robust Wald Test for added effects (d. of f.) 503.5 (5) 142.6 (15) Heteroskedastic-consistent standard errors in parentheses; All equations include year dummies; The left-out category is miscellaneous (low-tech industries).
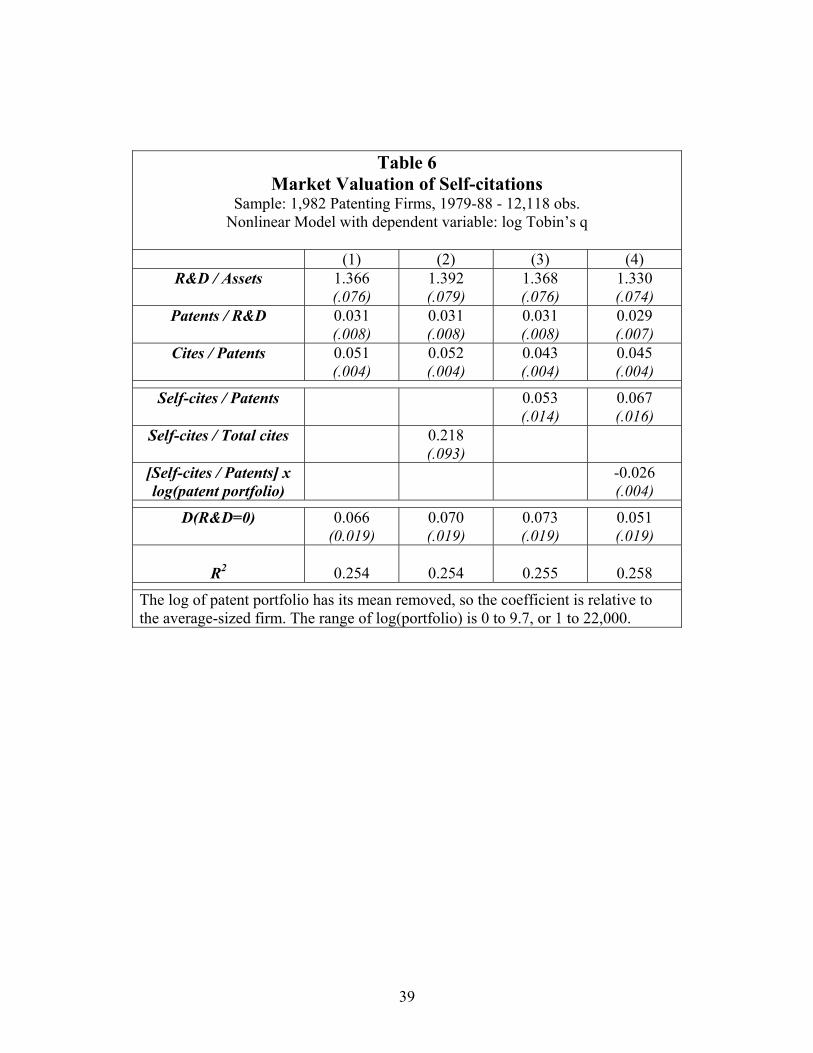
39
Table 6 Market Valuation of Self-citations
Sample: 1,982 Patenting Firms, 1979-88 - 12,118 obs. Nonlinear Model with dependent variable: log Tobin’s q
(1) (2) (3) (4)
R&D / Assets 1.366 (.076)
1.392 (.079)
1.368 (.076)
1.330 (.074)
Patents / R&D 0.031 (.008)
0.031 (.008)
0.031 (.008)
0.029 (.007)
Cites / Patents 0.051 (.004)
0.052 (.004)
0.043 (.004)
0.045 (.004)
Self-cites / Patents
0.053 (.014)
0.067 (.016)
Self-cites / Total cites 0.218 (.093)
[Self-cites / Patents] x log(patent portfolio)
-0.026 (.004)
D(R&D=0) 0.066 (0.019)
0.070 (.019)
0.073 (.019)
0.051 (.019)
R2
0.254 0.254 0.255 0.258
The log of patent portfolio has its mean removed, so the coefficient is relative to the average-sized firm. The range of log(portfolio) is 0 to 9.7, or 1 to 22,000.
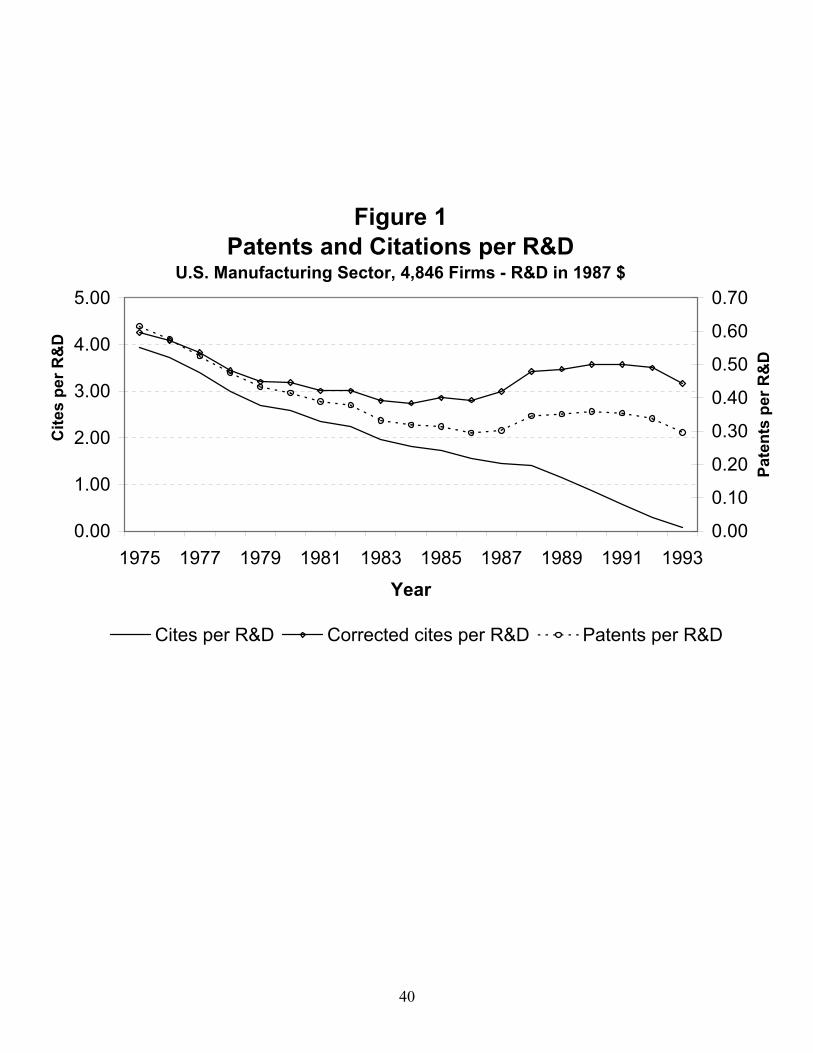
40
Figure 1Patents and Citations per R&D
U.S. Manufacturing Sector, 4,846 Firms - R&D in 1987 $
0.00
1.00
2.00
3.00
4.00
5.00
1975 1977 1979 1981 1983 1985 1987 1989 1991 1993
Year
Cite
s pe
r R&
D
0.00
0.10
0.20
0.30
0.40
0.50
0.60
0.70
Pate
nts
per R
&D
Cites per R&D Corrected cites per R&D Patents per R&D
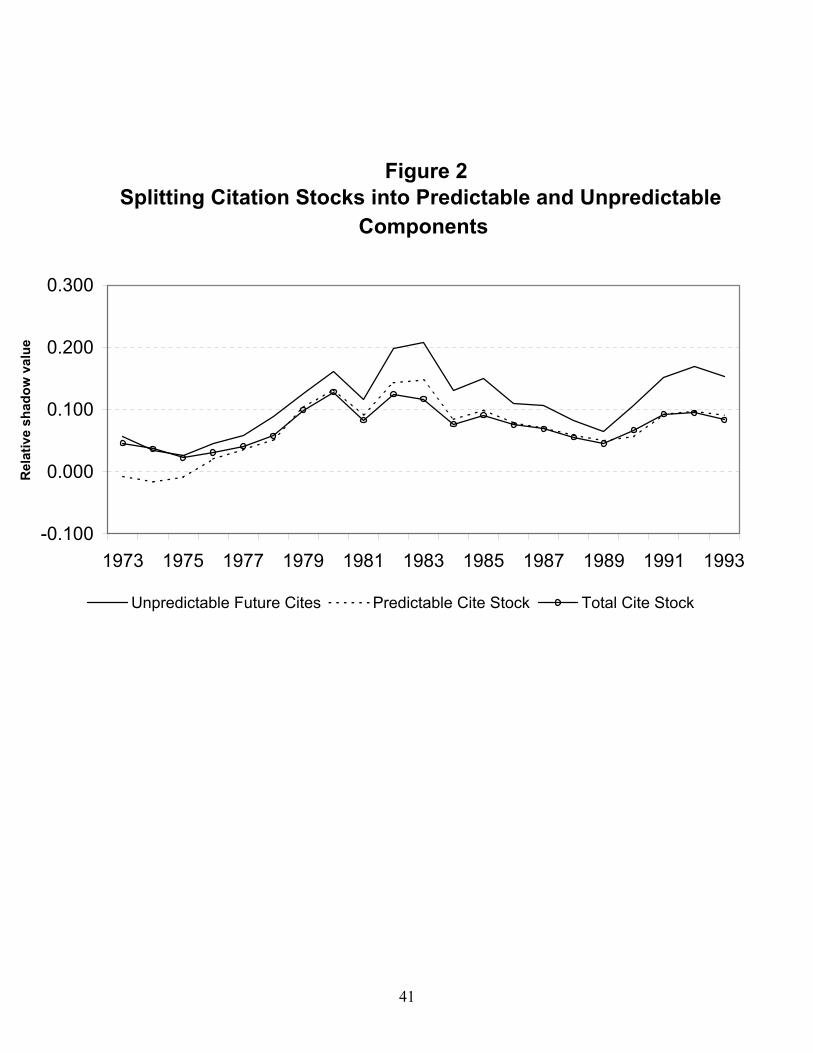
41
Figure 2Splitting Citation Stocks into Predictable and Unpredictable
Components
-0.100
0.000
0.100
0.200
0.300
1973 1975 1977 1979 1981 1983 1985 1987 1989 1991 1993
Rel
ativ
e sh
adow
val
ue
Unpredictable Future Cites Predictable Cite Stock Total Cite Stock
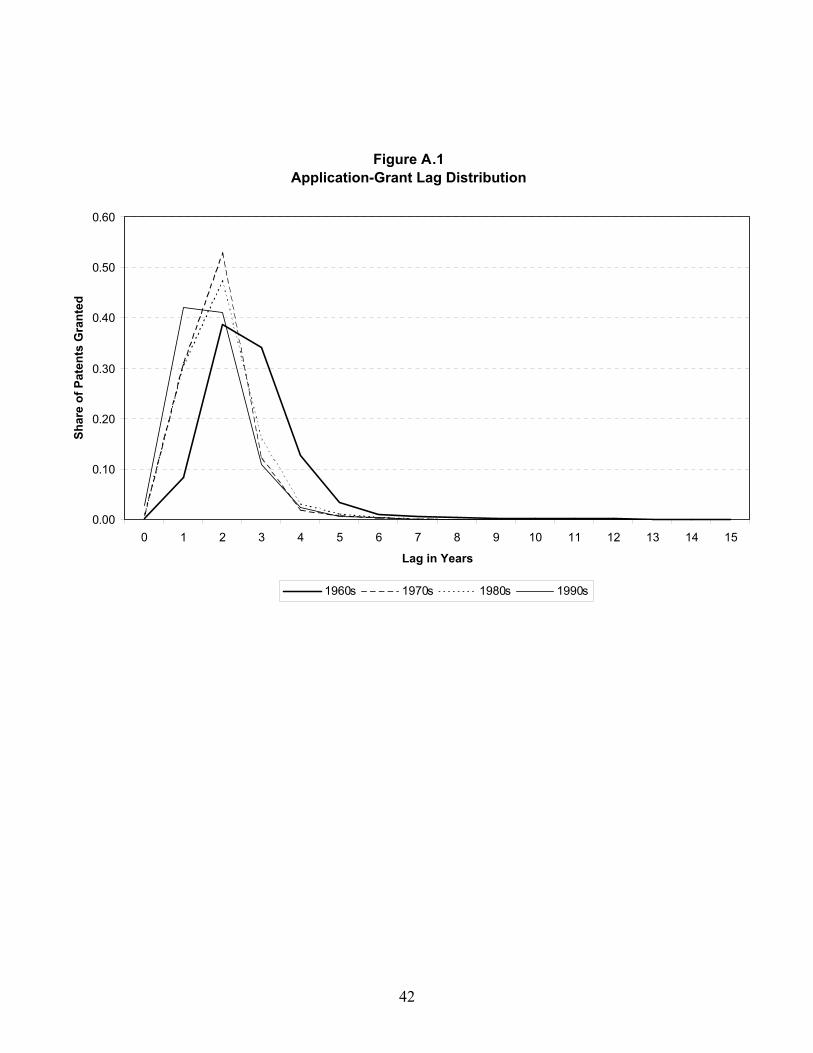
42
Figure A.1Application-Grant Lag Distribution
0.00
0.10
0.20
0.30
0.40
0.50
0.60
0 1 2 3 4 5 6 7 8 9 10 11 12 13 14 15
Lag in Years
Shar
e of
Pat
ents
Gra
nted
1960s 1970s 1980s 1990s

![REVELATION 1 - WalkInHisCommandments.comwalkinhiscommandments.com/Pickering/New Translation... · Revelation 1 REVELATION 1 [Introduction] 1:1 Jesus Christ’s revelation, which God](https://static.fdocuments.net/doc/165x107/5ea9b5c9d37aba202a2d210b/revelation-1-w-translation-revelation-1-revelation-1-introduction-11-jesus.jpg)