Market Study · 2017-06-20 · Market Study A glimpse at the landscape of European LNG...
27
Transcript of Market Study · 2017-06-20 · Market Study A glimpse at the landscape of European LNG...


Market Study
A glimpse at the landscape of European LNG
regasification infrastructure
Final Version
June 2017
Page 4 of 27
European_LNG_Regas_Infrastructure_fv
Table of Content
Abstract ................................................................................................................. 7
1 Introduction ............................................................................................... 8
2 The European Regasification Business in Numbers ........................... 10
3 Access to European Terminal Capacity ................................................ 14
4 The Jungle of European Regasification Costs ..................................... 17
5 Markets for Regasification Capacity ..................................................... 21
6 Conclusion ............................................................................................... 24
Authors ............................................................................................................... 25

Page 5 of 27
European_LNG_Regas_Infrastructure_fv
List of Figures
Figure 2-1: Development of Regasification Capacity in Europe .......................................................... 10
Figure 2-2: Development of LNG Imports to Europe ........................................................................... 11
Figure 2-3: European Regasification Terminals in 2016 ...................................................................... 12
Figure 3-1: Terminal Landscape Europe ............................................................................................. 15
Figure 3-2: Contracted vs. Available Capacity 2017 ............................................................................ 16
Figure 5-1: Publication Dates for UIOLI Slots ...................................................................................... 23

Page 6 of 27
European_LNG_Regas_Infrastructure_fv
DISCLAIMER
This article was prepared by TEAM CONSULT G.P.E. GmbH (TEAM CONSULT) with ut-
most care. It is based, among other things, on information, the validity and completeness of
which is not the responsibility of TEAM CONSULT. Therefore, TEAM CONSULT cannot
assume any liability for the completeness, accuracy and up-to-date nature of the data used
in this article.
This article in its entirety is the intellectual property of TEAM CONSULT G.P.E. GmbH, and
is thus protected by copyright.

Page 7 of 27
European_LNG_Regas_Infrastructure_fv
Abstract
The energy industry will likely face the occurrence of a global oversupply of natural gas for
the next years to come as further 115 mtpa of liquefaction capacities were under construc-
tion globally as of January 2017. The European market as a residual market for LNG could
be able to absorb additional volumes since the infrastructure is available and since Europe is
a large gas consumer and has a number of liquid trading hubs for gas.
Therefore, this paper aims at providing an overview of the landscape of the LNG regasifica-
tion infrastructure in the European Union (EU) by first giving some numbers on the regasifi-
cation business in recent years and then providing an overview of the two different access
regimes found at European terminals and laid down in EU legislation.
Based on our comprehensive data collection we provide guidance through the jungle of dif-
ferent regasification tariffs and the tariff system in the EU. Thereby, we shed light on special
features in different countries and find cost levels for spot tariffs for the terminal throughput
process in the range from 0.65 €/MWh up to 2.50 €/MWh in certain months of a year and in
some specific cases. Overall, we find that comparing terminal tariffs is difficult due to a multi-
tude of different technical factors of each terminal.
In summary, we conclude that Europe is well-positioned to receive additional volumes of
LNG as there is still surplus capacity to offer for third-party-access (TPA). The available ca-
pacity is likely to arouse interest in future years in an oversupplied global market as Europe
offers liquid markets as well as storage opportunities and the necessary infrastructure to
move gas around. Third-party access rules to terminal capacity are established in Europe
and an effective secondary market for regulated as well as exempted terminals is imple-
mented. However, if more LNG should reach Europe, it is not only a matter of availability of
import capacity and LNG markets being long. Key is a fundamental understanding of access
conditions for terminals in view of technical and commercial conditions.

Page 8 of 27
European_LNG_Regas_Infrastructure_fv
1 Introduction
The energy industry will likely face the occurrence of a global oversupply of natural gas for
the next years to come as further 115 mtpa of liquefaction capacities were under construc-
tion globally as of January 2017.1 This means an expected increase of existing export capac-
ities by at least 34% by 2022 whereas global gas demand growth so far remains behind ex-
pectations.
Therefore, the LNG market is changing. LNG liquefaction operators and suppliers need to
find sales markets for their surplus LNG volumes in order to amortize their investments
made. In addition, the recently started trend to more flexible and liquid LNG markets will
continue along the whole value chain.
The European market as a residual market for LNG could be able to absorb additional vol-
umes since the infrastructure is available and since Europe is a large gas consumer and has
a number of liquid trading hubs for gas. Furthermore, LNG is strongly supported by EU poli-
cy2 due to reasons of security and diversification of supply.
Key factors determining the future European LNG demand are the role of natural gas in the
future energy mix and the strategies suppliers of pipeline gas to Europe will adopt. There are
two extreme scenarios conceivable with different impact on the future price development.
First, if natural gas is able to regain its position in power generation there is significant need
for additional volumes. Between 2010 and 2014, European markets could have absorbed up
to 36 mtpa of additional pipeline gas and LNG for power generation if incentives would have
had been set in favor of gas for power.3 Contrary, there is a negative scenario if gas does
not benefit from its environmental advantages and if prices for coal as well as emission al-
lowances remain low, which means that gas demand from the power sector will remain low.
Finally, LNG has to compete against pipeline gas deliveries from Russia, Norway and Alge-
ria.
1 See: IGU World LNG Report – 2017 Edition, p. 19.
2 In February 2016, the European Commission published its EU strategy for liquefied natural gas and gas stor-
age (COM (2016) 49 final).
3 Kübler, Madjid/ Völler, Jens/ Bluhm, Hannes (2016): Can the European gas market absorb additional gas
volumes? How? How much? Where?, December 2016, p 19.

Page 9 of 27
European_LNG_Regas_Infrastructure_fv
However, when speaking about additional LNG imports another important issue comes up:
third-party access (TPA) to regasification capacity. According to a recent publication by
KAPSARC, 54% of global regasification capacity offer some sort of TPA – at least in theory.
TPA is mostly implemented in Europe, which is kind of a forerunner region where this access
indeed happens in practice supported by two functioning trading hubs – the British NBP (Na-
tional Balancing Point) and the Dutch TTF (Title Transfer Facility).4 However, access to re-
gasification capacity is not easy as existing long term capacity contracts, complex access
codes and tariff systems need to be taken into account.
The scenario of Europe as an outlet for LNG suggests taking a closer look at the European
LNG import terminals. In recent years, not even half of the nameplate throughput capacity at
European regasification terminals was used. However, this does not necessarily mean that
access to the entire surplus of capacity is easily available. When it comes to access to Euro-
pean regasification capacity the most striking feature is that regasification capacity is not
homogenous at all. Different aspects have to be evaluated when eyeing to deliver LNG to
Europe. In addition, there is a myriad of technical aspects to be considered. Furthermore,
terminals can be divided into two different groups related to their type of third-party access
regime which in turn has an impact on capacity booking procedures, tariffs and transparen-
cy.
This paper aims at providing an overview of the landscape of European LNG regasification
infrastructure by describing the two different access regimes as well as the markets for ca-
pacity and by providing an introduction into the tarification systems.
4 Six, Sammy/ Corbeau, Anne-Sophie: Third-Party Access to Regasification Terminals: Adapting to the LNG
Market’s Reconfiguration, February 2017, KAPSARC, p. 3.

Page 10 of 27
European_LNG_Regas_Infrastructure_fv
2 The European Regasification Business in Numbers
The European regasification landscape is made up of 22 terminals classified as large-scale
in ten different countries.5 Since the construction of the first terminal in Barcelona in 1968,
the overall capacity constantly increased, especially after 2004 (refer to Figure 2-1). Today,
total nameplate capacity stands at 146 mtpa (204 bcm/a) with the Polish terminal in
Świnoujście and the French Dunkerque terminal being the newest members in the family.
While there might be extensions to one or the other terminal6 as well as the purchase of
additional FSRUs (Floating Storage and Regasification Unit), further additional large onshore
terminals are not under construction yet. The major European player measured by LNG im-
port capacity is Spain (44 mtpa, 30%) followed by the United Kingdom (35 mtpa, 24%) and
France (25 mtpa, 17%).
Figure 2-1: Development of Regasification Capacity in Europe
Sources: IGU World LNG Reports
All regasification terminals conduct broadly the same functions, which are berthing and un-
loading of LNG vessels, storage of LNG as well as regasification and send-out to the grid in
order to supply natural gas to end-users. Thereby, terminals differ by their initial investment
drivers, level of utilization, mode of operation and ownership.
5 There are three further terminals in Turkey often assigned to Europe. However, Turkey is not in the scope of
this paper as it does not fall under EU regulation.
6 Extensions are planned at the Polish Świnoujście terminal, the Greek Revithoussa terminal and the Belgium
Zeebrugge terminal.
51 51 5156
62
7784
90 90
121 121
130 130 133 136133
136
146
0
20
40
60
80
100
120
140
160
2000 2001 2002 2003 2004 2005 2006 2007 2008 2009 2010 2011 2012 2013 2014 2015 2016 2017
No
min
al c
ap
ac
ity i
n m
tpa
Italy France Greece Belgium Spain Portugal United Kingdom Netherlands Lithuania Poland

Page 11 of 27
European_LNG_Regas_Infrastructure_fv
However, the role of terminals has changed. In the current market environment of global
oversupply, they have to become more flexible and customer oriented. Market participants
seek options to react to and capitalise on short-term market dynamics. Additional storage
capacity as well as re-exports and transshipment provide value by enabling profit from sea-
sonal or geographical arbitrage. This is the reason why next to their core business terminal
operators started to offer a wide range of additional terminal services. Terminal operators
constantly enhance their offers related to services such as ship loading, truck loading, small
ship loading, bunkering and transshipment. Most of the terminals offer one or the other small
scale service or have concrete plans to develop such services.
Imported volumes to Europe rose from 27 mtpa in 2014 to 33 mtpa in 2016 with about 89%
of LNG delivered on a long-term basis (Figure 2-2). However, LNG import volumes remain
small compared with pipeline imports.7 Qatar remains the super-supplier with about half of
the imported volumes to the EU being shipped from the LNG giant in the Middle East in
2016. In terms of supply volumes Algeria ranked second (7.63 mtpa) and was followed by
Nigeria (5.98 mtpa). Deliveries from the Sabine Pass Terminal in the US, which commenced
operations in February 2016, remained behind expectations due to European prices being
not “competitive” to price levels paid by Latin American and Asian buyers. However, this
might change in the future with more liquefaction capacity on the starting blocks.
Figure 2-2: Development of LNG Imports to Europe
Source: GIIGNL Annual LNG Reports net of re-exports (3.56 mtpa)
7 See: Council of European Energy Regulators (CEER): CEER Analysis on the role of LNG to improve security
of supply, C15-LNG-25-03, 3 February 2016, p. 9.
38
48
59 60
42
3027
32 33
89%82% 81% 81% 87%
97% 94% 93% 89%
0
10
20
30
40
50
60
70
2008 2009 2010 2011 2012 2013 2014 2015 2016
mtp
a
Long-Term Contracts Spot/Short-term trading Total import quantity

Page 12 of 27
European_LNG_Regas_Infrastructure_fv
Based on the European terminal capacity, there is a huge amount of unused capacity alt-
hough the LNG import business saw a slight recovery in 2015 and 2016 from post-2011 lows
with annual throughput utilisation rates (net of re-exports) slightly increased to 27% on aver-
age.
The busiest terminals in 2016 were those in France, Italy and Lithuania (Figure 2-3) with
annual throughput utilisation rates above 30%.
Figure 2-3: European Regasification Terminals in 2016
Sources: GIIGNL, IGU, GLE, TEAM CONSULT Analysis * incl. re-exports
However, low utilisation rates do not necessarily pose a problem as the tendency for an ex-
cess of annual regasification throughput capacity is normal due to several reasons. Global
regasification capacity exceeding global liquefaction capacity provides optionality to LNG
players as they are able to flexibly change destination or secure access to different regions
in order to be able to arbitrage. Furthermore, due to security of supply reasons capacities are
determined by peak send outs and are not expected to be permanently and fully utilized over
a longer period. Additionally, factors such as shipping constraints, gas blending and quality
adjustment and multi-user terminal operations can also restrict the actual available capacity.
Assuming that LNG regasification terminals could work in the range of 50% utilisation rate
and even higher, imports could – from a mere technical point - at least double compared to
2016 numbers. Although there is enough spare capacity at European regasification termi-
CountryNumber of
terminals
Throughput
capacity
Gross
throughput in
2016*
UtilizationStorage
capacity
Unit mtpa/year mtpa/year % bcm liq
Belgium 1 6.60 1.79 27% 0.38
France 4 15.50 6.72 43% 1.41
Greece 1 3.30 0.53 16% 0.13
Italy 3 11.00 4.59 42% 0.49
Lithuania 1 3.00 1.00 33% 0.17
Netherlands 1 8.80 1.05 12% 0.54
Poland 1 3.60 0.82 23% 0.32
Portugal 1 5.80 1.50 26% 0.39
Spain 6 43.70 10.30 24% 3.32
United Kingdom 3 35.00 7.86 22% 2.1
Summe 136.30 36.16 27% 9.25
Page 13 of 27
European_LNG_Regas_Infrastructure_fv
nals, it has to be kept in mind that import capacity is not distributed evenly across the EU
and especially South Eastern European regions still lack LNG import infrastructure.
Page 14 of 27
European_LNG_Regas_Infrastructure_fv
3 Access to European Terminal Capacity
Open access regimes to terminal capacity as they exist in Europe come along with different
challenges concerning the operational management of the terminal as well as the treatment
of different gas qualities. Furthermore, access rules are required to be non-discriminatory
and transparent for all terminal users and the access to the gas pipeline network has to be
ensured at any time.
A major issue in the EU’s regasification business is the treatment of terminals from a regula-
tory perspective. With market liberalization, terminals that were considered to be a strategic
element of the downstream infrastructure became subject to regulatory requirements con-
cerning to non-discrimination, transparency, unbundling and market opening. Dealing with
regulatory issues is well advanced in the European Union as already under the First Gas
Directive of 1998, two regimes of terminal access were introduced: negotiated and regulated
Third Party Access.
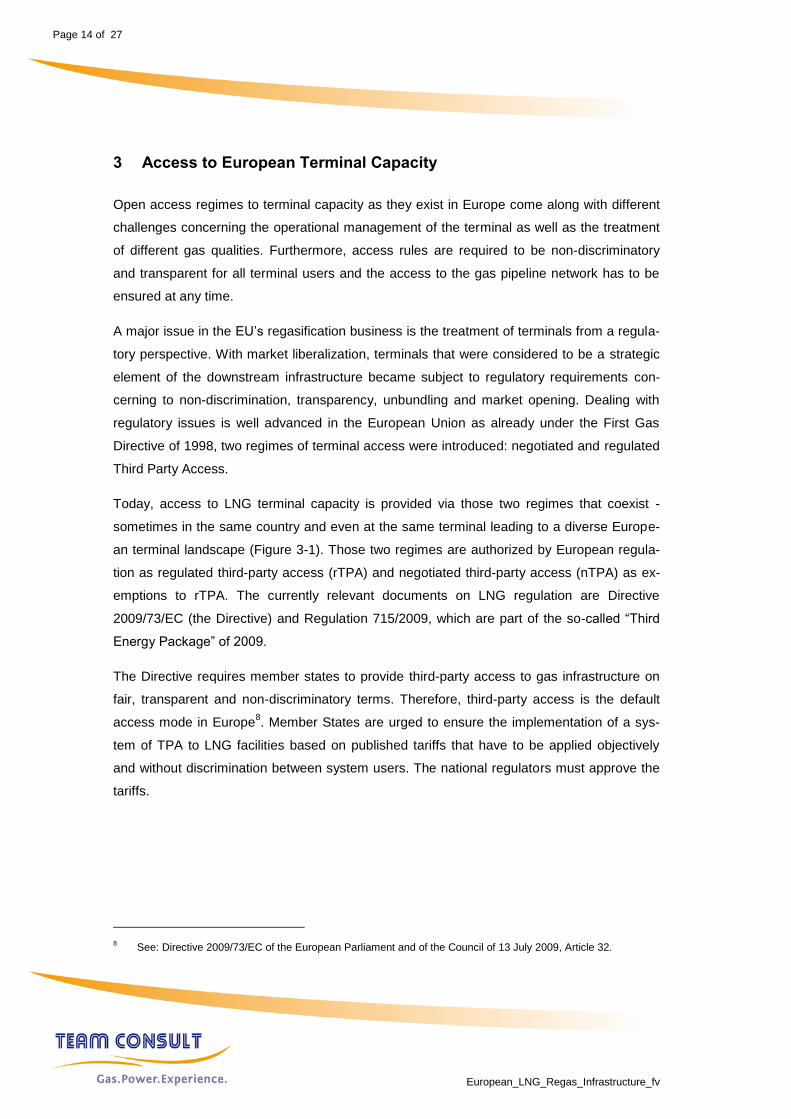
Today, access to LNG terminal capacity is provided via those two regimes that coexist -
sometimes in the same country and even at the same terminal leading to a diverse Europe-
an terminal landscape (Figure 3-1). Those two regimes are authorized by European regula-
tion as regulated third-party access (rTPA) and negotiated third-party access (nTPA) as ex-
emptions to rTPA. The currently relevant documents on LNG regulation are Directive
2009/73/EC (the Directive) and Regulation 715/2009, which are part of the so-called “Third
Energy Package” of 2009.
The Directive requires member states to provide third-party access to gas infrastructure on
fair, transparent and non-discriminatory terms. Therefore, third-party access is the default
access mode in Europe8. Member States are urged to ensure the implementation of a sys-
tem of TPA to LNG facilities based on published tariffs that have to be applied objectively
and without discrimination between system users. The national regulators must approve the
tariffs.
8 See: Directive 2009/73/EC of the European Parliament and of the Council of 13 July 2009, Article 32.

Page 15 of 27
European_LNG_Regas_Infrastructure_fv
Figure 3-1: Terminal Landscape Europe
Source: TEAM CONSULT Analysis
However, exemptions from rTPA9 for new import facilities or for capacity extension of exist-
ing facilities might be granted by regulatory authorities in order to trigger investments10
. Ex-
emptions are normally granted for 20 or 25 years. Once regulated a terminal cannot be ex-
empted afterwards.11
An exemption from rTPA involves that capacities are normally sold on
a long-term contractual basis (open-season process) and that tariffs are the result of com-
mercial negotiations with the primary shipper/ customer and do not have to be published.
Nevertheless, the national regulators will have an eye on terminal operations and monitor
anti-hoarding mechanisms. Shippers can normally get access to such terminal capacities
only via the secondary market as the majority of the capacity at exempted terminals is con-
tracted on a long-term basis (Figure 3-2).
9 There are five exemption criteria that have to be fulfilled according to Article 36 of Directive 2009/73/EC.
10 See: Directive 2009/73/EC of the European Parliament and of the Council of 13 July 2009, Article 23 & 36.
11 An exception is the OLT terminal in Italy which initially applied and was granted exemption from TPA but later
on in 2012 asked to revoke it due to low utilization.

Page 16 of 27
European_LNG_Regas_Infrastructure_fv
Figure 3-2: Contracted vs. Available Capacity 2017
Sources: Terminal websites
There are five terminals exempted from rTPA covering 53 mtpa or 36% of regasification ca-
pacity in 2017. This means that a major amount of capacity is contracted on a long-term
basis. Well-known capacity holders are producers such as Qatar Petroleum, ExxonMobil,
Eni, Shell, BP, Sonatrach and Total as well as European players like DONG, Uniper, Centri-
ca and others. Terminal access to those terminals for third parties can only take place via the
secondary market. 16 terminals underlie regulated TPA (87 mtpa). Adriatic LNG in Italy is the
only terminal that pursuits a hybrid approach with 20% of the overall capacity being subject
to rTPA whereas the other 80% are exempted.
Overall, a large part of the regasification capacity in the EU is contracted on a long-term
basis.
ZeebruggeMontoir
Fos TonkinFos CavaouRevithoussa
PanigagliaLNG ToscanaIndependence
SwinoujscieSines
BilbaoBarcelonaCartagena
HuelvaMugardos
SaguntoPorto LevanteGate terminal
DunkerqueDragon LNG
Grain LNGSouth Hook
0 5 10 15 20 25
bcm
Contracted capacity Available capacity
Terminals exempted from
TPA
Terminals with regulated
TPA

Page 17 of 27
European_LNG_Regas_Infrastructure_fv
4 The Jungle of European Regasification Costs
Access to regasification capacity and regasification costs are key drivers to be considered
when making decisions on where to market LNG. This section will shed some light on Euro-
pean regasification costs based on our data collection.
First of all, terminals exempted from regulation are not obliged to publish their tariffs. There-
fore, there is a lack of transparency on regasification tariffs especially in the UK and the
Netherlands (Gate). The new French terminal in Dunkerque also does not publish any tariffs
as is the case for the exempted part of the Italian Rovigo terminal (Adriatic LNG).
By contrast, regulated terminals have to make their tariffs transparent to the public. However,
this does not mean that each terminal operator publishes the very same tariff for the same
service or in other words tariffs cannot be compared easily. The tariff landscape is multifac-
eted – from all-inclusive tariffs, to tariffs per cargo (independent of the actual cargo size), to
two component tariffs (fixed and variable) to even more complicated systems.
According to EU legislation, each member state is obliged to have an independent regulator
with defined powers and duties. This is meant to the creation of a level playing field for all
market participants. Tariffs for access to regasification infrastructure have to be approved by
the regulator.12
Based on our data concerning European regulated regasification terminals, this section of
the paper will give an initial overview about the costs of berthing, unloading, storing, regasify-
ing and sending out of a spot cargo.13
Thereby, the results presented are based on tariffs in
Belgium, Spain, Poland, Greece, France and Portugal.
In general, two systems of tariffs can be differentiated at regulated European terminals. On
the one hand, there are tariffs that consist of different components according to the LNG
service chain and thereby, have individual pricing tags for berthing/ unloading, storage and
regasification. Examples for the first type are Belgium, Spain and Portugal. On the other
hand, it is also quite common to distinguish between a fixed capacity charge per cargo or per
12
See: Directive 2009/73/EC of the European Parliament and of the Council of 13 July 2009, Article 39 & 41.
13 The transformation into energy units neglects any losses from boil-off or the regasification process itself. Costs
for other services such as e.g. the provision of jetty, mooring, grid access, quality adjustment, small-scale ser-
vices or the equipment of the facility for cool down and partial filling of LNG ship tanks are not in the scope of
this paper.

Page 18 of 27
European_LNG_Regas_Infrastructure_fv
booked capacity and a variable commodity charge. Terminals that rather fall under the sec-
ond group are the ones in France, Greece and Poland. Some terminals also distinguish be-
tween long-term and shorter-term products.
The Belgian Zeebrugge terminal is an example where the tariff is made up of different com-
ponents for berthing/ unloading, storage and regasification. There is no difference between
long-term or short-term products in Belgium, but the terminals offers a basic service defined
as one slot consisting of a package of entitlements to a berthing right, basic storage and
basic firm send out capacity. Basic storage means that the terminal operator has to provide a
capacity of 140,000 m3 of LNG which should be made available at the start of the subscribed
slot and decrease linearly over the basic storage duration. The basic storage duration equals
about 10 days. The basic send out capacity is 4,200 MWh/hour. There is a fixed fee for all
individual services. Additional flexible services for storage and send-out can be booked and
paid on a volume basis. Fuel gas has to be provided in kind with the compensation rate
amounting to 1.3%.
The French terminals were actually an example for a more complex tariff, which was estab-
lished in 2012. However, the tariff system was simplified for the regulatory period commenc-
ing 1 April 2017. Thereby, a system of three different types of terminal services was reduced
to just a basic and a spot service after a consultation of the relevant stakeholders. Further-
more, the tariff components were simplified. Today, the tariffs only consist of a fixed tariff for
each berthing slot and a commodity tariff per unloaded quantity. Contrary to the methodology
applied in Greece, the spot commodity tariff is lower than the one for the basic service.
Therefore, additional options as special storage send-out options, dedicated storage or
send-out flexibility service are reserved to basic storage users. The send-out profile of a spot
cargo is determined by the operator and should correspond to the shipper’s request as long
as the impact on the send-outs of other shippers is below a predefined threshold, which
means that spot send-outs are subordinated to the basic service users’ send-out profiles.
Our analysis of European terminal tariffs based on our data collection revealed that tariffs
vary strongly between European terminals. Thereby, we assessed costs for a spot cargo of a
size of 135.000 m3
in EUR/MWh regasified.14
The lowest cost observed was just above
0.65 €/MWh (~0.20 $/mmBTU15
), whereas cost seen could be also higher than 2.50 €/MWh
(~0.81 $/mmBTU) for certain terminals in certain months and in some specific cases. In total
14
Except for Fos Tonkin (France) as this terminal can just receive LNG vessels up to 75.000m3.
15 Rates applied for conversion are 1 Euro = $1.10 and 1 MWh = 3.41 mmBTU.

Page 19 of 27
European_LNG_Regas_Infrastructure_fv
terms, those values correspond to about 0.6 to 2.3 Mio. EUR16
for a spot cargo of a size of
135,000m3 received, unloaded, stored and regasified.
Compared to the lowest Month-Ahead mid-price observed at the TTF between January 2016
and end of April 2017 of 10.65 €/MWh, this corresponds to 6% up to 23% of the hub price.
However, measured to the highest Month-Ahead mid-price at the Spanish PVB hub seen in
the same period, which was about 33.00 €/MWh the range is only 2% to 8% of the hub price.
The regasification tariffs in Lithuania and Italy were deliberately left out of the analysis for
different reasons.
The regasification service price charged at the floating Klaipeda plant in Lithuania is stated to
be 0.10 €/MWh (excl. VAT)17
and is therefore the only all-round carefree package. This tariff
has a rather political background as the country seeks to diversify its gas supply away from
Russian gas. Remaining operational costs of the terminal are covered by a supply security
charge, which has to be paid by all Lithuanian gas consumers regardless of whether they
buy from the Klaipeda LNG terminal.18
Therefore, the Lithuanian tariff was excluded from the
selection of terminal tariffs.
The tariffs charged at Italian terminals were also excluded from the range given above as the
Panigaglia terminal is a quite old terminal; the OLT terminal has special features due to be-
ing a floating offshore terminal and at the Rovigo terminal 80% of the capacity is exempted
from regulation. The published tariff therefore applies only to 20% of the capacity. Further-
more, there is a special guarantee factor for Italian terminals which shall cover 64% of the
total revenue. From the published tariffs we estimate the regasification costs at Italian termi-
16
For a spot cargo of 135,000 m3 and a conversion factor of 1 m
3 LNG = 6.788 MWh applied. Fuel gas costs or
additional losses are not taken into account.
17 LNG regasification service price, approved by the Company based on LNG regasification service price cap set
by National Commission for Energy Control and Prices (hereinafter, NCC) on November 17, 2016 by the reso-
lution No. O3-368.
18 See: National Commission for Energy and Control Prices: AB “Amber Grid”, website:
http://www.regula.lt/en/Pages/ab-amber-grid.aspx.

Page 20 of 27
European_LNG_Regas_Infrastructure_fv
nals to be quite high19
, which might be the main barrier to any spot LNG imports into Italy so
far.20
In summary, the comparison of European regasification tariffs is a difficult exercise as there
is a multitude of technical factors inherent to the different terminals which in turn have an
impact on the terminal access conditions and basic services, respectively. Thereby, each
terminal and tariff has its specialities. As different as the approaches in tarification are the
final costs per megawatt hour of regasified LNG. Overall, in general four major factors influ-
ence the type and level of European regasification tariffs: access rules (rTPA versus nTPA),
age of infrastructure, type of infrastructure (onshore/ offshore) and political aspects. The
latter applies especially to terminals that were built for security of supply reasons.
19
E.g. regulated tariff at Rovigo terminal is above 1.4 USD/mmBTU.
20 See: Mereghetti, Mathilde: Italy’s regasification fees still too high for LNG spot deliveries – traders, published in
ICIS Heren as of 24 February 2016.

Page 21 of 27
European_LNG_Regas_Infrastructure_fv
5 Markets for Regasification Capacity
There is not only a jungle of different regasification tariff structures in Europe, but also the
access to terminal capacity varies. In general, the main rights a capacity holder obtains at a
regasification terminal are:
Right to berth and unload a specified number of LNG tankers on specific berthing
slots
Right to use certain amount of temporary storage
Right to nominate LNG for re-gasification and send out into the gas network
Those rights can be assigned to individual parties or can be shared between different par-
ties.
Terminal users are obliged not to hoard capacities they do not use as determined by the
Regulation EC No. 715/2009.21
Thereafter, capacity at European terminals can be obtained
via primary and secondary markets and LNG facility contracts shall include measures to
prevent any capacity hoarding, especially in cases of contractual congestion. The terms and
conditions vary depending on the terminal – especially between regulated and exempted
terminals.
Primary capacity
Primary capacity can be secured via long-term contracts at terminals with regulated third-
party access and via open season processes at exempted terminals. Furthermore, free an-
nual and monthly capacities might be booked according to the “first come – first serve” prin-
ciple. This is e.g. the case at the Dutch Gate terminal, where 11.1 bcm/a out of a total capac-
ity of 12 bcm/a is currently contracted on a long-term basis. The remaining capacity can be
booked in the primary market.
If a third party is interested in delivering LNG cargos to European regasification terminals,
the interested party can approach the primary capacity holder and conclude a bi-lateral trad-
ing agreement.
21
See: Regulation EC No. 715/2009 of the European Parliament and of the Council of 13 July 2009 on conditions
for access to the natural gas transmission networks, Article 17.

Page 22 of 27
European_LNG_Regas_Infrastructure_fv
Primary rights of berthing slots, temporary storage, send-out capacity and LNG stock in the
facility can also be traded between the capacity holders at the very same terminal (internal
transfer).
Secondary Market
If the primary capacity holder does not need the contracted capacity then capacity has to be
made available to third parties on the secondary market. Thereby, two different forms are
possible. The cargo could be handled by the primary shipper, which means that the LNG is
delivered to the primary customer at the jetty and delivered back to the third party after send-
out in form of gas at the hub (= “virtual service” or swap). The second option is that the third
party obtains capacity from the primary holder for a pre-determined period of time and man-
ages the unloading and nomination of the LNG through the terminal and into the gas network
itself (=”physical” service). The difference between the two options is the level of interaction
with the terminal.
Anti-Hoarding mechanisms
Additionally to the secondary market, different so-called anti-hoarding mechanisms were
established with the aim to enhance competition at terminals and to prevent capacity holders
from taking advantage of hoarding their capacities. Those mechanisms are commonly known
as “use-it-or-lose-it” (UIOLI) mechanisms. Thereby, capacity is released back to the terminal
operator by the primary holder with the primary holder does not need the capacity and did
not sell it on the secondary market. The terminal operator will package and offer the UIOLI
slot (berthing and storage capacity and interruptible deliverability) to the market via bulletin
boards. The buyer of the capacity will be able to use the terminal to unload and regasify LNG
within the same contractual framework as the primary shipper.
There are no common guidelines on when UIOLI slots have to be published and often they
are published at relatively short notice. As can be seen in Figure 5-1, publication dates range
from seven days prior to the berthing slot to 30 days before the relevant arrival window. This
seems to some extent to make it unattractive, respectively impossible, for a shipper to bring
in a cargo. Transparency has been improved in recent years but debates on transparency
lost momentum in the overhang of LNG import capacity.

Page 23 of 27
European_LNG_Regas_Infrastructure_fv
Figure 5-1: Publication Dates for UIOLI Slots
Sources: Terminal operator websites
There is no direct involvement of any primary capacity holder in the transaction. The contrac-
tual relationship is directly between the terminal operator and the third party. Thereby, the
third party becomes a shipper to the terminal.
Terminal Publication of UIOLI slot
Gate Earliest 30 days before the relevant arrival window starts
Grain LNG Re-offered 7 days prior to the berthing slot
South Hook 14 day ahead of the berthing slot
Dragon LNG 12 days prior to the relevant berth slot
Dunkerque No information

Page 24 of 27
European_LNG_Regas_Infrastructure_fv
6 Conclusion
The way in which capacity is managed at LNG terminals is crucial in ensuring that market
participants are able to gain access to terminal capacity for storage and regasification on a
long-term and even more important, on a spot basis. LNG supplies can contribute to security
of supply along with diversification and the provision of more flexibility to the system through
openness to a wider market.
There are no new terminals in a detailed planning stage in Europe, except for maybe on
islands and in Eastern Europe due to security of supply reasons. In case of Western and
Southern Europe new terminal capacity is not required as there is a lot of spare capacity left.
Europe is well-positioned to receive additional volumes of LNG as there is still surplus ca-
pacity to offer for TPA. The available capacity is likely to arouse interest in future years in an
oversupplied global market as Europe offers liquid markets as well as storage opportunities
and the necessary infrastructure to move gas around. Therefore, it might be good to have an
eye on the European regasification business.
Transparency for exempted terminals is quite low. Whereas tariffs do not have to be pub-
lished, available UIOLI slots are sometimes published on short notice making it difficult for
potentially interested parties to organize the delivery of a cargo.
Overall, regulated European terminals are quite transparent when it comes to the services
offered and tariffs as they are required by EU regulation to publish information on tariffs,
access codes, available capacities, nomination procedures. Thereby some countries set very
good examples in terms of transparency. When it comes to tariffs, the exercise of comparing
different terminal tariffs is difficult due to a multitude of different technical factors of each
terminal. The products offered at each terminal are different in terms of the services includ-
ed.
To summarize, we see full or partial third-party access in Europe which is working quite well.
Furthermore, an effective secondary market for regulated as well as exempted terminals is
implemented. However, if more LNG should reach Europe, it is not only a matter of availabil-
ity of import capacity and LNG markets being long. Key is a fundamental understanding of
access conditions for terminals in view of technical and commercial conditions.

Page 25 of 27
European_LNG_Regas_Infrastructure_fv
Authors
Dr. Dietrich Gerstein
Dietrich has over 25 years of in-depth knowledge of international natural gas, LNG and en-
ergy markets. He has excellent understanding in handling international projects and inter-
governmental relationships. Lately, Dietrich worked as Global Director LNG of Royal Dutch
Vopak and managed the operation of the company’s regasification terminals. As CEO of the
LNG business unit of E.On Ruhrgas, he was responsible for initiating and implementing LNG
supply and purchase projects. Next to his current position at Team Consult he works with the
German Gas and Water Association and governmental institutions on facilitating the use of
LNG as a clean fuel.
Jörg Blaurock
Jörg Blaurock joined our team as an independent consultant on July 1, 2014. He has over 25
years of experience in many positions along the value-chain in the energy industry. He was
Managing Director and Sales Manager of DONG Energy and responsible for the sale of gas,
power and services in Germany and worked as International Commercial Manager on price
revisions of long-term gas supply contracts in Copenhagen. His professional career began in
1989 with Mobil Oil and ExxonMobil where he was in various Line-Management positions
with a local and functional connection to the German gas production.
Stefanie Segeth
Stefanie Segeth graduated from the University of Duisburg-Essen with a M.Sc. in Energy
and Finance. She gained first practical experience in the energy business during her inte-
grated Bachelor’s programme with Vattenfall and has over 5 years of experience in the en-
ergy industry. Prior to joining TEAM CONSULT, she gathered experience in the mechanisms
of gas markets and gas trading as an analyst with a national energy company. Stefanie
joined TEAM CONSULT as Consultant in July 2015.

Page 26 of 27
European_LNG_Regas_Infrastructure_fv
Page intentionally left blank