Market Strategy - Angel Broking Strategy_DiwaliSpe… · that Angel Broking stands committed as...
22
Transcript of Market Strategy - Angel Broking Strategy_DiwaliSpe… · that Angel Broking stands committed as...


Market StrategyDiwali Special
Please refer to important disclosures at the end of this report. 1
Dear Friends,
Wish you and your family a very Happy Diwaliand a Prosperous New Year!
Last year, I'd expressed confidence in India'sstrong prospects and India has indeedemerged as a sweet spot among globalmarkets. With developed economies as wellas China struggling for growth and otheremerging economies coming under pressuredue to falling commodity prices, India hasstood out as a key beneficiary of cheaper commodities on one handand a reformist, action-oriented government on the other.
Not surprisingly therefore, India has significantly outperformed othermajor emerging markets such as Brazil and Russia. The Sensex hasappreciated 33% even in dollar terms over the last two years, while theRussian and Brazil benchmark indices have lost 40% and 50% in dollarterms. A major encouraging factor behind this outperformance is theincreasing maturity and depth of our markets. Domestic inflows haveremained strong, even offsetting the decline in foreign flows recently.This reflects the strong optimism and conviction amongst domestic retailinvestors about the India story!
The outperformance is testimony to our improving macros: our twindeficits continue to shrink, lower inflation is resulting in falling interestrates and the currency has remained relatively stable. Despite a 125bpcut in interest rates by the RBI in CY2015, the full effect of these cuts isonly now being transmitted by banks and while this has delayed corporateearnings recovery by few quarters, but in my view, going forward,improvement in earnings should gather steam. Also with the declininginflation trajectory, the RBI has enough headroom to cut interest ratesfurther by at least 50-100bp, so decline in interest rates is an importanttrigger that will continue to play out in coming quarters in my view. Allthe macro improvements coupled with a strong stable Government witheffective leadership at the helm, have placed India in a position fromwhere not just a year or two but the forthcoming many years look filledwith potential to scale new highs.
Foreign inflows coupled with strong domestic investments are likely tolead to our markets outperforming all major markets over the next fewyears, re-affirming equities as the best asset class, while returns fromother asset classes such as fixed income, gold and real estate aremoderating. Therefore, in my view, this is an opportune time to increaseexposure to equities as an asset class. As always, let me again reiteratethat Angel Broking stands committed as your advisor to maximise yourwealth by offering you the best advice. So this Diwali, let the markets
add the required fireworks to your portfolio!
Best regards,
Dinesh Thakkar
Dinesh Thakkar
Market StrategyDiwali Special
November 2015 Please refer to important disclosures at the end of this report. 2
India best placed among emerging economiesWe have a positive view on the markets, as we believe that favourable macro cuessuch as low inflation, declining interest rates, cheap global commodities and stronggovernance are likely to drive improvement in corporate performance over the next18-24 months. In our view, India is best placed within the emerging economies spaceand is likely to continue attracting higher fund inflows in the medium-term,notwithstanding any near-term global concerns.
Declining rates cycle, government stimulus to act as a catalyst foreconomic revival
So far, while inflation had been coming down, policy rates took longer to decline andbanks had been even slower to cut rates. But, now decline in interest rates is gatheringmomentum even in the hands of the borrowers and in our view there is substantialheadroom for rates to decline further by at least 100-150bps. This is considering thatdeposit growth is still meaningfully higher than credit growth (11.5% vs 9.5%) andinflation remains structurally low at sub-5% levels.
Further, while the 40-50%+ decline in prices of most major global commodities is ahuge positive for the Indian economy in the wider context, but in the near-term, largecorporates in the commodity space as well as banks have been negatively impactedand this has slowed corporate earnings growth as well as banks' ability to cut ratesfaster. However, going forward, as cheaper imports and sharply declining subsidiesrelease huge funds for the government to spend on more productive areas such asinfrastructure, we expect the positive stimulus from cheaper commodities to also gainmomentum. This is already reflected in the substantial ordering activity by thegovernment in recent months and strong pipeline going ahead (put together, in excessof `3.5lakh crores in next few quarters itself).
Prefer companies with strong competitive advantage, benefittingfrom evolving macros
From a top-down perspective, we expect themes like urbanisation, consumerism,domestic and export service sector plays as well as government spending plays to dowell in the coming years. With falling rates and huge under-penetration, retail finance,including housing finance is likely to perform well and BFSI companies better alignedto this would continue to outperform. With reviving domestic macros, we expect auto sectorvolumes, especially in passenger four-wheeler and commercial vehicle space, to continuegrowing strongly. We prefer those OEMs and ancillaries that have strong competitivepositioning and the ability to maintain or even gain market share, going ahead.
Post the election rally last year when all cyclical and midcap stocks had rallied, therehas been a reality check and once again there is a preference for quality companies,which are aligned to the evolving macros. So companies in commoditised sectorswhere there is global over-supply will remain in the negative list for us. On the otherhand, we continue to like defensive sectors like IT and pharma where Indian companieshave strong competitive advantages on a global scale; within these sectors, we preferthose companies where margins have scope to improve relative to peers, which is notbeing factored in valuations currently.
From a bottom-up perspective, we continue to like select emerging midcap companieswith strong brands, entrepreneurial success and healthy growth outlook. Overall, weexpect the Sensex EPS to report a growth of ~11% in FY2016 and 17% in FY2017,with an upward bias. Attributing an 18x multiple to our FY2017E Sensex EPS, wearrive at a target of 31,500 for the Sensex, implying a 16% upside from the presentlevels with a 12-18 month horizon.
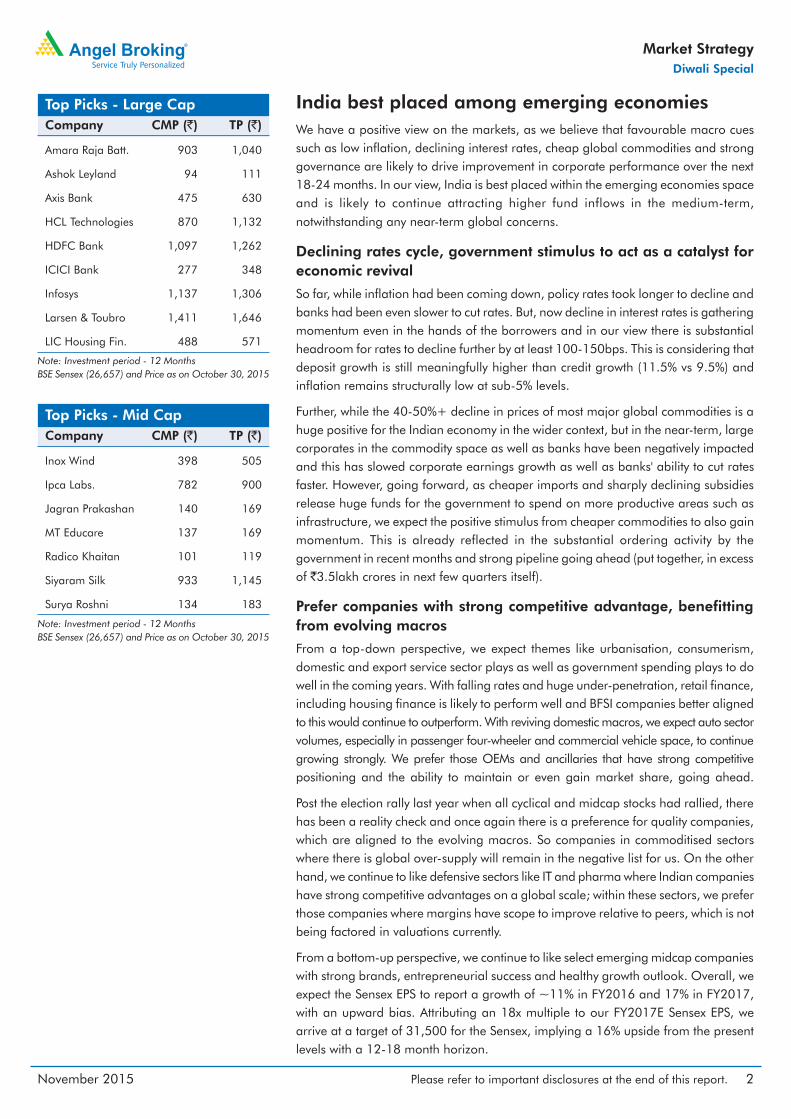
Note: Investment period - 12 MonthsBSE Sensex (26,657) and Price as on October 30, 2015
Top Picks - Large CapCompany CMP (`) TP (`)
Amara Raja Batt. 903 1,040
Ashok Leyland 94 111
Axis Bank 475 630
HCL Technologies 870 1,132
HDFC Bank 1,097 1,262
ICICI Bank 277 348
Infosys 1,137 1,306
Larsen & Toubro 1,411 1,646
LIC Housing Fin. 488 571
Note: Investment period - 12 MonthsBSE Sensex (26,657) and Price as on October 30, 2015
Top Picks - Mid CapCompany CMP (`) TP (`)
Inox Wind 398 505
Ipca Labs. 782 900
Jagran Prakashan 140 169
MT Educare 137 169
Radico Khaitan 101 119
Siyaram Silk 933 1,145
Surya Roshni 134 183

November 2015 Please refer to important disclosures at the end of this report. 3
Market StrategyDiwali Special
Top Picks - Large Cap
November 2015 Please refer to important disclosures at the end of this report. 4
Market StrategyDiwali Special
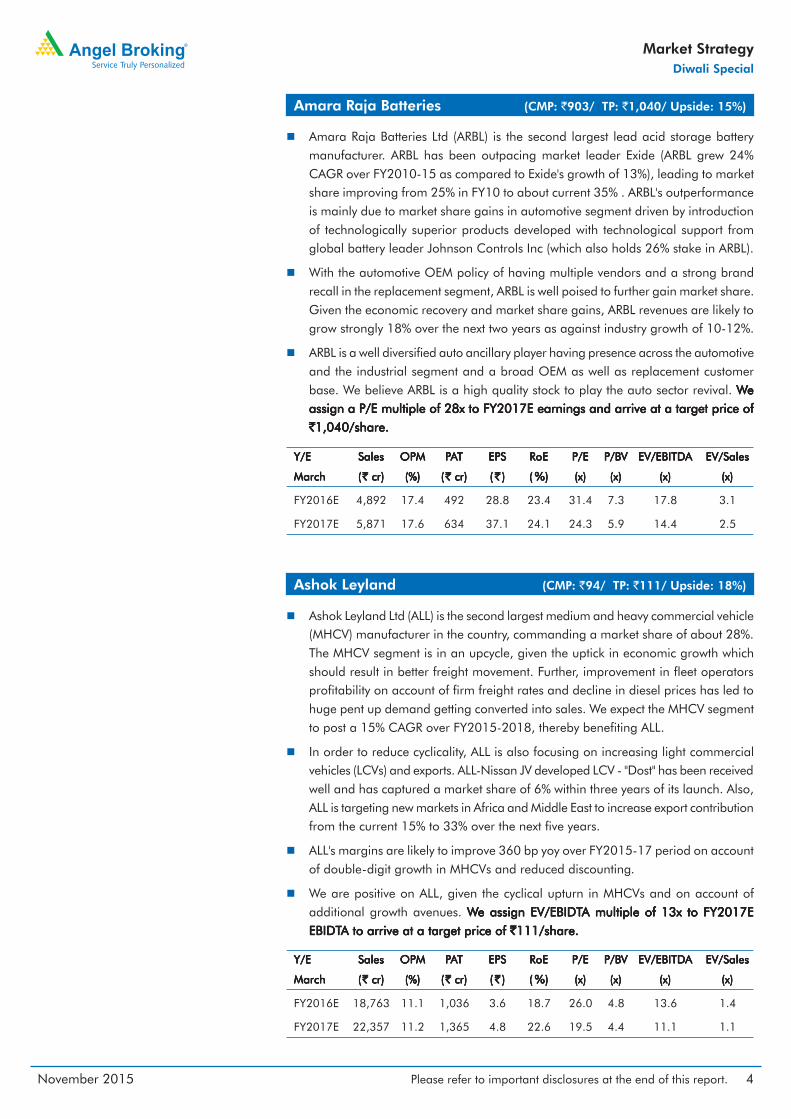
Ashok Leyland Ltd (ALL) is the second largest medium and heavy commercial vehicle(MHCV) manufacturer in the country, commanding a market share of about 28%.The MHCV segment is in an upcycle, given the uptick in economic growth whichshould result in better freight movement. Further, improvement in fleet operatorsprofitability on account of firm freight rates and decline in diesel prices has led tohuge pent up demand getting converted into sales. We expect the MHCV segmentto post a 15% CAGR over FY2015-2018, thereby benefiting ALL.
In order to reduce cyclicality, ALL is also focusing on increasing light commercialvehicles (LCVs) and exports. ALL-Nissan JV developed LCV - "Dost" has been receivedwell and has captured a market share of 6% within three years of its launch. Also,ALL is targeting new markets in Africa and Middle East to increase export contributionfrom the current 15% to 33% over the next five years.
ALL's margins are likely to improve 360 bp yoy over FY2015-17 period on accountof double-digit growth in MHCVs and reduced discounting.
We are positive on ALL, given the cyclical upturn in MHCVs and on account ofadditional growth avenues. WWWWWe assign EV/EBIDTe assign EV/EBIDTe assign EV/EBIDTe assign EV/EBIDTe assign EV/EBIDTA multiple of 13x to FY2017EA multiple of 13x to FY2017EA multiple of 13x to FY2017EA multiple of 13x to FY2017EA multiple of 13x to FY2017EEBIDTEBIDTEBIDTEBIDTEBIDTA to arrive at a target price of A to arrive at a target price of A to arrive at a target price of A to arrive at a target price of A to arrive at a target price of `̀̀̀̀111/share.111/share.111/share.111/share.111/share.
Ashok Leyland (CMP: `94/ TP: `111/ Upside: 18%)
Y/EY/EY/EY/EY/E SalesSalesSalesSalesSales OPMOPMOPMOPMOPM PPPPPAAAAATTTTT EPSEPSEPSEPSEPS RoERoERoERoERoE P/EP/EP/EP/EP/E P/BP/BP/BP/BP/BVVVVV EV/EBITDEV/EBITDEV/EBITDEV/EBITDEV/EBITDAAAAA EV/SalesEV/SalesEV/SalesEV/SalesEV/Sales
MarchMarchMarchMarchMarch ((((( `̀̀̀̀ cr) cr) cr) cr) cr) (%)(%)(%)(%)(%) ((((( `̀̀̀̀ cr) cr) cr) cr) cr) ((((( `̀̀̀̀ ))))) (((((%%%%%))))) (x)(x)(x)(x)(x) (x)(x)(x)(x)(x) (x)(x)(x)(x)(x) (x)(x)(x)(x)(x)
FY2016E 18,763 11.1 1,036 3.6 18.7 26.0 4.8 13.6 1.4
FY2017E 22,357 11.2 1,365 4.8 22.6 19.5 4.4 11.1 1.1
Amara Raja Batteries Ltd (ARBL) is the second largest lead acid storage batterymanufacturer. ARBL has been outpacing market leader Exide (ARBL grew 24%CAGR over FY2010-15 as compared to Exide's growth of 13%), leading to marketshare improving from 25% in FY10 to about current 35% . ARBL's outperformanceis mainly due to market share gains in automotive segment driven by introductionof technologically superior products developed with technological support fromglobal battery leader Johnson Controls Inc (which also holds 26% stake in ARBL).
With the automotive OEM policy of having multiple vendors and a strong brandrecall in the replacement segment, ARBL is well poised to further gain market share.Given the economic recovery and market share gains, ARBL revenues are likely togrow strongly 18% over the next two years as against industry growth of 10-12%.
ARBL is a well diversified auto ancillary player having presence across the automotiveand the industrial segment and a broad OEM as well as replacement customerbase. We believe ARBL is a high quality stock to play the auto sector revival. WWWWWeeeeeassign a P/E multiple of 28x to FY2017E earnings and arrive at a target price ofassign a P/E multiple of 28x to FY2017E earnings and arrive at a target price ofassign a P/E multiple of 28x to FY2017E earnings and arrive at a target price ofassign a P/E multiple of 28x to FY2017E earnings and arrive at a target price ofassign a P/E multiple of 28x to FY2017E earnings and arrive at a target price of`̀̀̀̀1,040/share.1,040/share.1,040/share.1,040/share.1,040/share.
Amara Raja Batteries (CMP: `903/ TP: `1,040/ Upside: 15%)
Y/EY/EY/EY/EY/E SalesSalesSalesSalesSales OPMOPMOPMOPMOPM PPPPPAAAAATTTTT EPSEPSEPSEPSEPS RoERoERoERoERoE P/EP/EP/EP/EP/E P/BP/BP/BP/BP/BVVVVV EV/EBITDEV/EBITDEV/EBITDEV/EBITDEV/EBITDAAAAA EV/SalesEV/SalesEV/SalesEV/SalesEV/Sales
MarchMarchMarchMarchMarch ((((( `̀̀̀̀ cr) cr) cr) cr) cr) (%)(%)(%)(%)(%) ((((( `̀̀̀̀ cr) cr) cr) cr) cr) ((((( `̀̀̀̀ ))))) (((((%%%%%))))) (x)(x)(x)(x)(x) (x)(x)(x)(x)(x) (x)(x)(x)(x)(x) (x)(x)(x)(x)(x)
FY2016E 4,892 17.4 492 28.8 23.4 31.4 7.3 17.8 3.1
FY2017E 5,871 17.6 634 37.1 24.1 24.3 5.9 14.4 2.5
November 2015 Please refer to important disclosures at the end of this report. 5
Market StrategyDiwali Special
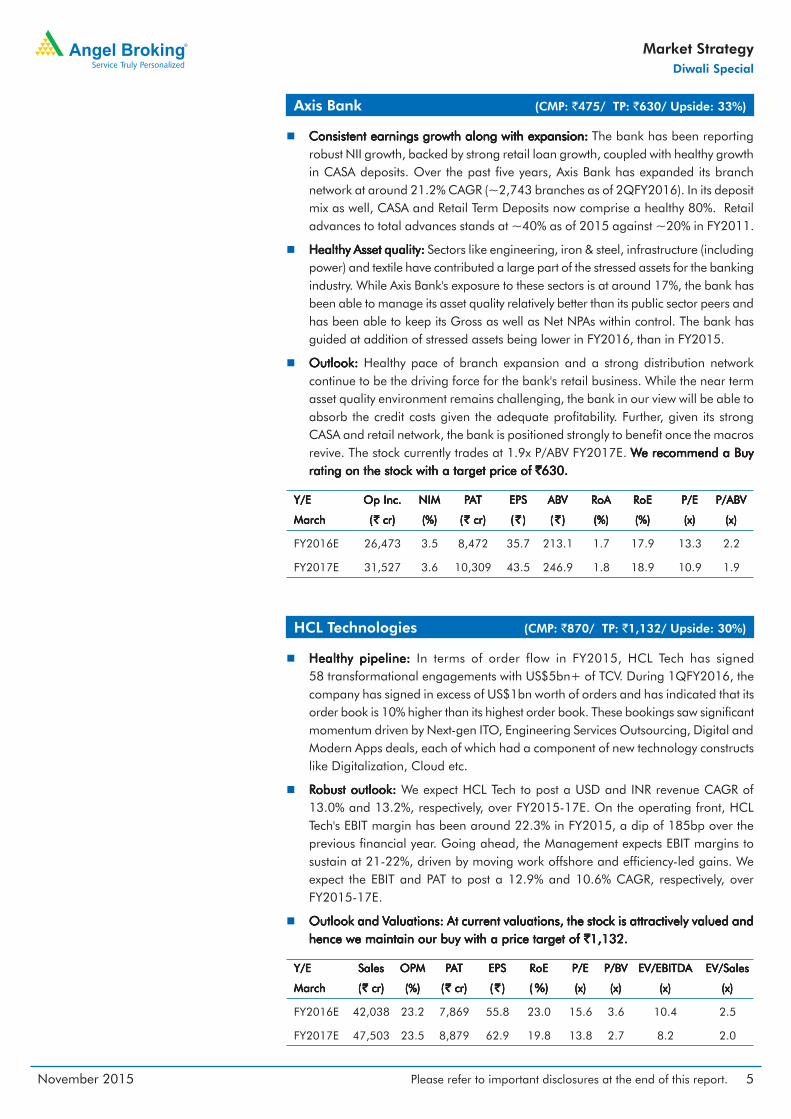
Consistent earnings growth along with expansion: Consistent earnings growth along with expansion: Consistent earnings growth along with expansion: Consistent earnings growth along with expansion: Consistent earnings growth along with expansion: The bank has been reportingrobust NII growth, backed by strong retail loan growth, coupled with healthy growthin CASA deposits. Over the past five years, Axis Bank has expanded its branchnetwork at around 21.2% CAGR (~2,743 branches as of 2QFY2016). In its depositmix as well, CASA and Retail Term Deposits now comprise a healthy 80%. Retailadvances to total advances stands at ~40% as of 2015 against ~20% in FY2011.
Healthy Asset quality: Healthy Asset quality: Healthy Asset quality: Healthy Asset quality: Healthy Asset quality: Sectors like engineering, iron & steel, infrastructure (includingpower) and textile have contributed a large part of the stressed assets for the bankingindustry. While Axis Bank's exposure to these sectors is at around 17%, the bank hasbeen able to manage its asset quality relatively better than its public sector peers andhas been able to keep its Gross as well as Net NPAs within control. The bank hasguided at addition of stressed assets being lower in FY2016, than in FY2015.
Outlook: Outlook: Outlook: Outlook: Outlook: Healthy pace of branch expansion and a strong distribution networkcontinue to be the driving force for the bank's retail business. While the near termasset quality environment remains challenging, the bank in our view will be able toabsorb the credit costs given the adequate profitability. Further, given its strongCASA and retail network, the bank is positioned strongly to benefit once the macrosrevive. The stock currently trades at 1.9x P/ABV FY2017E. WWWWWe recommend a Buye recommend a Buye recommend a Buye recommend a Buye recommend a Buyrating on the stock with a target price of rating on the stock with a target price of rating on the stock with a target price of rating on the stock with a target price of rating on the stock with a target price of `̀̀̀̀630.630.630.630.630.
Axis Bank (CMP: `475/ TP: `630/ Upside: 33%)
Y/EY/EY/EY/EY/E Op Inc.Op Inc.Op Inc.Op Inc.Op Inc. NIMNIMNIMNIMNIM PPPPPAAAAATTTTT EPSEPSEPSEPSEPS ABABABABABVVVVV RoARoARoARoARoA RoERoERoERoERoE P/EP/EP/EP/EP/E P/ABP/ABP/ABP/ABP/ABVVVVV
MarchMarchMarchMarchMarch ((((( `̀̀̀̀ cr) cr) cr) cr) cr) (%)(%)(%)(%)(%) ((((( `̀̀̀̀ cr) cr) cr) cr) cr) ((((( `̀̀̀̀ ))))) ((((( `̀̀̀̀ ))))) (%)(%)(%)(%)(%) (%)(%)(%)(%)(%) (x)(x)(x)(x)(x) (x)(x)(x)(x)(x)
FY2016E 26,473 3.5 8,472 35.7 213.1 1.7 17.9 13.3 2.2
FY2017E 31,527 3.6 10,309 43.5 246.9 1.8 18.9 10.9 1.9
Healthy pipeline:Healthy pipeline:Healthy pipeline:Healthy pipeline:Healthy pipeline: In terms of order flow in FY2015, HCL Tech has signed58 transformational engagements with US$5bn+ of TCV. During 1QFY2016, thecompany has signed in excess of US$1bn worth of orders and has indicated that itsorder book is 10% higher than its highest order book. These bookings saw significantmomentum driven by Next-gen ITO, Engineering Services Outsourcing, Digital andModern Apps deals, each of which had a component of new technology constructslike Digitalization, Cloud etc.
Robust outlook: Robust outlook: Robust outlook: Robust outlook: Robust outlook: We expect HCL Tech to post a USD and INR revenue CAGR of13.0% and 13.2%, respectively, over FY2015-17E. On the operating front, HCLTech's EBIT margin has been around 22.3% in FY2015, a dip of 185bp over theprevious financial year. Going ahead, the Management expects EBIT margins tosustain at 21-22%, driven by moving work offshore and efficiency-led gains. Weexpect the EBIT and PAT to post a 12.9% and 10.6% CAGR, respectively, overFY2015-17E.
Outlook and VOutlook and VOutlook and VOutlook and VOutlook and Valuations: At current valuations, the stock is attractively valued andaluations: At current valuations, the stock is attractively valued andaluations: At current valuations, the stock is attractively valued andaluations: At current valuations, the stock is attractively valued andaluations: At current valuations, the stock is attractively valued andhence we maintain our buy with a price target of hence we maintain our buy with a price target of hence we maintain our buy with a price target of hence we maintain our buy with a price target of hence we maintain our buy with a price target of `̀̀̀̀1,132.1,132.1,132.1,132.1,132.
HCL Technologies (CMP: `870/ TP: `1,132/ Upside: 30%)
Y/EY/EY/EY/EY/E SalesSalesSalesSalesSales OPMOPMOPMOPMOPM PPPPPAAAAATTTTT EPSEPSEPSEPSEPS RoERoERoERoERoE P/EP/EP/EP/EP/E P/BP/BP/BP/BP/BVVVVV EV/EBITDEV/EBITDEV/EBITDEV/EBITDEV/EBITDAAAAA EV/SalesEV/SalesEV/SalesEV/SalesEV/Sales
MarchMarchMarchMarchMarch ((((( `̀̀̀̀ cr) cr) cr) cr) cr) (%)(%)(%)(%)(%) ((((( `̀̀̀̀ cr) cr) cr) cr) cr) ((((( `̀̀̀̀ ))))) (((((%%%%%))))) (x)(x)(x)(x)(x) (x)(x)(x)(x)(x) (x)(x)(x)(x)(x) (x)(x)(x)(x)(x)
FY2016E 42,038 23.2 7,869 55.8 23.0 15.6 3.6 10.4 2.5
FY2017E 47,503 23.5 8,879 62.9 19.8 13.8 2.7 8.2 2.0
November 2015 Please refer to important disclosures at the end of this report. 6
Market StrategyDiwali Special
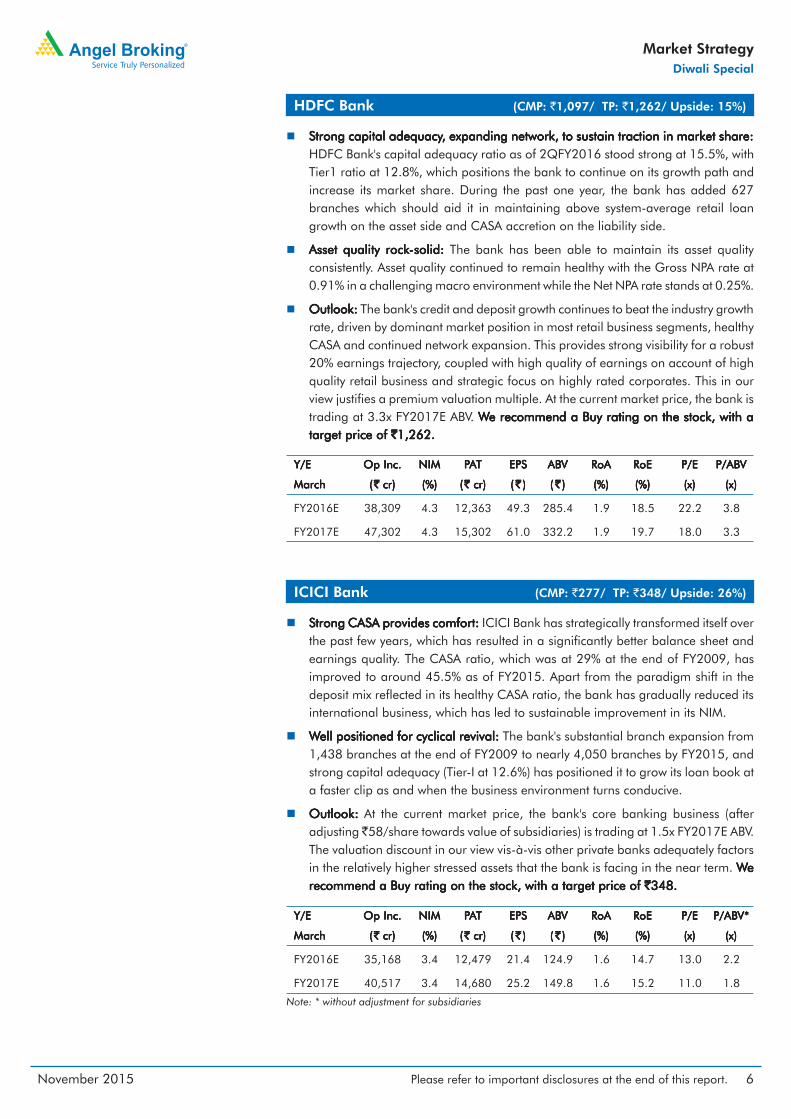
Strong CASA provides comfort: Strong CASA provides comfort: Strong CASA provides comfort: Strong CASA provides comfort: Strong CASA provides comfort: ICICI Bank has strategically transformed itself overthe past few years, which has resulted in a significantly better balance sheet andearnings quality. The CASA ratio, which was at 29% at the end of FY2009, hasimproved to around 45.5% as of FY2015. Apart from the paradigm shift in thedeposit mix reflected in its healthy CASA ratio, the bank has gradually reduced itsinternational business, which has led to sustainable improvement in its NIM.
WWWWWell positioned for cyclical revival: ell positioned for cyclical revival: ell positioned for cyclical revival: ell positioned for cyclical revival: ell positioned for cyclical revival: The bank's substantial branch expansion from1,438 branches at the end of FY2009 to nearly 4,050 branches by FY2015, andstrong capital adequacy (Tier-I at 12.6%) has positioned it to grow its loan book ata faster clip as and when the business environment turns conducive.
Outlook: Outlook: Outlook: Outlook: Outlook: At the current market price, the bank's core banking business (afteradjusting ̀ 58/share towards value of subsidiaries) is trading at 1.5x FY2017E ABV.The valuation discount in our view vis-à-vis other private banks adequately factorsin the relatively higher stressed assets that the bank is facing in the near term. WWWWWeeeeerecommend a Buy rating on the stock, with a target price of recommend a Buy rating on the stock, with a target price of recommend a Buy rating on the stock, with a target price of recommend a Buy rating on the stock, with a target price of recommend a Buy rating on the stock, with a target price of `̀̀̀̀348.348.348.348.348.
ICICI Bank (CMP: `277/ TP: `348/ Upside: 26%)
Y/EY/EY/EY/EY/E Op Inc.Op Inc.Op Inc.Op Inc.Op Inc. NIMNIMNIMNIMNIM PPPPPAAAAATTTTT EPSEPSEPSEPSEPS ABABABABABVVVVV RoARoARoARoARoA RoERoERoERoERoE P/EP/EP/EP/EP/E P/ABP/ABP/ABP/ABP/ABV*V*V*V*V*
MarchMarchMarchMarchMarch ((((( `̀̀̀̀ cr) cr) cr) cr) cr) (%)(%)(%)(%)(%) ((((( `̀̀̀̀ cr) cr) cr) cr) cr) ((((( `̀̀̀̀ ))))) ((((( `̀̀̀̀ ))))) (%)(%)(%)(%)(%) (%)(%)(%)(%)(%) (x)(x)(x)(x)(x) (x)(x)(x)(x)(x)
FY2016E 35,168 3.4 12,479 21.4 124.9 1.6 14.7 13.0 2.2
FY2017E 40,517 3.4 14,680 25.2 149.8 1.6 15.2 11.0 1.8
HDFC Bank (CMP: `1,097/ TP: `1,262/ Upside: 15%)
Strong capital adequacyStrong capital adequacyStrong capital adequacyStrong capital adequacyStrong capital adequacy, expanding network, to sustain traction in market share:, expanding network, to sustain traction in market share:, expanding network, to sustain traction in market share:, expanding network, to sustain traction in market share:, expanding network, to sustain traction in market share:HDFC Bank's capital adequacy ratio as of 2QFY2016 stood strong at 15.5%, withTier1 ratio at 12.8%, which positions the bank to continue on its growth path andincrease its market share. During the past one year, the bank has added 627branches which should aid it in maintaining above system-average retail loangrowth on the asset side and CASA accretion on the liability side.
Asset quality rockAsset quality rockAsset quality rockAsset quality rockAsset quality rock-----solid: solid: solid: solid: solid: The bank has been able to maintain its asset qualityconsistently. Asset quality continued to remain healthy with the Gross NPA rate at0.91% in a challenging macro environment while the Net NPA rate stands at 0.25%.
Outlook: Outlook: Outlook: Outlook: Outlook: The bank's credit and deposit growth continues to beat the industry growthrate, driven by dominant market position in most retail business segments, healthyCASA and continued network expansion. This provides strong visibility for a robust20% earnings trajectory, coupled with high quality of earnings on account of highquality retail business and strategic focus on highly rated corporates. This in ourview justifies a premium valuation multiple. At the current market price, the bank istrading at 3.3x FY2017E ABV. WWWWWe recommend a Buy rating on the stock, with ae recommend a Buy rating on the stock, with ae recommend a Buy rating on the stock, with ae recommend a Buy rating on the stock, with ae recommend a Buy rating on the stock, with atarget price of target price of target price of target price of target price of `̀̀̀̀1,262.1,262.1,262.1,262.1,262.
Y/EY/EY/EY/EY/E Op Inc.Op Inc.Op Inc.Op Inc.Op Inc. NIMNIMNIMNIMNIM PPPPPAAAAATTTTT EPSEPSEPSEPSEPS ABABABABABVVVVV RoARoARoARoARoA RoERoERoERoERoE P/EP/EP/EP/EP/E P/ABP/ABP/ABP/ABP/ABVVVVV
MarchMarchMarchMarchMarch ((((( `̀̀̀̀ cr) cr) cr) cr) cr) (%)(%)(%)(%)(%) ((((( `̀̀̀̀ cr) cr) cr) cr) cr) ((((( `̀̀̀̀ ))))) ((((( `̀̀̀̀ ))))) (%)(%)(%)(%)(%) (%)(%)(%)(%)(%) (x)(x)(x)(x)(x) (x)(x)(x)(x)(x)
FY2016E 38,309 4.3 12,363 49.3 285.4 1.9 18.5 22.2 3.8
FY2017E 47,302 4.3 15,302 61.0 332.2 1.9 19.7 18.0 3.3
Note: * without adjustment for subsidiaries
November 2015 Please refer to important disclosures at the end of this report. 7
Market StrategyDiwali Special
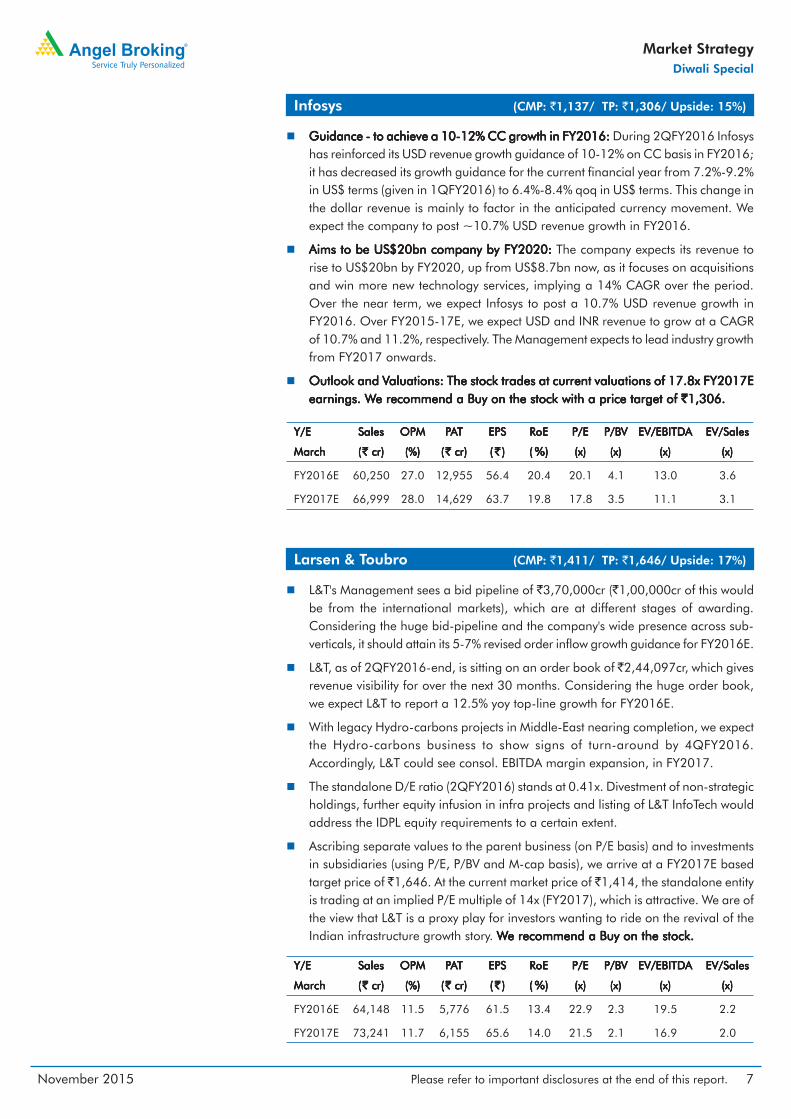
Infosys (CMP: `1,137/ TP: `1,306/ Upside: 15%)
Guidance - to achieve a 10-12% CC growth in FY2016:Guidance - to achieve a 10-12% CC growth in FY2016:Guidance - to achieve a 10-12% CC growth in FY2016:Guidance - to achieve a 10-12% CC growth in FY2016:Guidance - to achieve a 10-12% CC growth in FY2016: During 2QFY2016 Infosyshas reinforced its USD revenue growth guidance of 10-12% on CC basis in FY2016;it has decreased its growth guidance for the current financial year from 7.2%-9.2%in US$ terms (given in 1QFY2016) to 6.4%-8.4% qoq in US$ terms. This change inthe dollar revenue is mainly to factor in the anticipated currency movement. Weexpect the company to post ~10.7% USD revenue growth in FY2016.
Aims to be US$20bn company by FY2020: Aims to be US$20bn company by FY2020: Aims to be US$20bn company by FY2020: Aims to be US$20bn company by FY2020: Aims to be US$20bn company by FY2020: The company expects its revenue torise to US$20bn by FY2020, up from US$8.7bn now, as it focuses on acquisitionsand win more new technology services, implying a 14% CAGR over the period.Over the near term, we expect Infosys to post a 10.7% USD revenue growth inFY2016. Over FY2015-17E, we expect USD and INR revenue to grow at a CAGRof 10.7% and 11.2%, respectively. The Management expects to lead industry growthfrom FY2017 onwards.
Outlook and VOutlook and VOutlook and VOutlook and VOutlook and Valuations: The stock trades at current valuations of 17.8x FY2017Ealuations: The stock trades at current valuations of 17.8x FY2017Ealuations: The stock trades at current valuations of 17.8x FY2017Ealuations: The stock trades at current valuations of 17.8x FY2017Ealuations: The stock trades at current valuations of 17.8x FY2017Eearnings. Wearnings. Wearnings. Wearnings. Wearnings. We recommend a Buy on the stock with a price target of e recommend a Buy on the stock with a price target of e recommend a Buy on the stock with a price target of e recommend a Buy on the stock with a price target of e recommend a Buy on the stock with a price target of `̀̀̀̀1,306.1,306.1,306.1,306.1,306.
Y/EY/EY/EY/EY/E SalesSalesSalesSalesSales OPMOPMOPMOPMOPM PPPPPAAAAATTTTT EPSEPSEPSEPSEPS RoERoERoERoERoE P/EP/EP/EP/EP/E P/BP/BP/BP/BP/BVVVVV EV/EBITDEV/EBITDEV/EBITDEV/EBITDEV/EBITDAAAAA EV/SalesEV/SalesEV/SalesEV/SalesEV/Sales
MarchMarchMarchMarchMarch ((((( `̀̀̀̀ cr) cr) cr) cr) cr) (%)(%)(%)(%)(%) ((((( `̀̀̀̀ cr) cr) cr) cr) cr) ((((( `̀̀̀̀ ))))) (((((%%%%%))))) (x)(x)(x)(x)(x) (x)(x)(x)(x)(x) (x)(x)(x)(x)(x) (x)(x)(x)(x)(x)
FY2016E 60,250 27.0 12,955 56.4 20.4 20.1 4.1 13.0 3.6
FY2017E 66,999 28.0 14,629 63.7 19.8 17.8 3.5 11.1 3.1
Larsen & Toubro (CMP: `1,411/ TP: `1,646/ Upside: 17%)
L&T's Management sees a bid pipeline of `3,70,000cr (`1,00,000cr of this wouldbe from the international markets), which are at different stages of awarding.Considering the huge bid-pipeline and the company's wide presence across sub-verticals, it should attain its 5-7% revised order inflow growth guidance for FY2016E.
L&T, as of 2QFY2016-end, is sitting on an order book of ̀ 2,44,097cr, which givesrevenue visibility for over the next 30 months. Considering the huge order book,we expect L&T to report a 12.5% yoy top-line growth for FY2016E.
With legacy Hydro-carbons projects in Middle-East nearing completion, we expectthe Hydro-carbons business to show signs of turn-around by 4QFY2016.Accordingly, L&T could see consol. EBITDA margin expansion, in FY2017.
The standalone D/E ratio (2QFY2016) stands at 0.41x. Divestment of non-strategicholdings, further equity infusion in infra projects and listing of L&T InfoTech wouldaddress the IDPL equity requirements to a certain extent.
Ascribing separate values to the parent business (on P/E basis) and to investmentsin subsidiaries (using P/E, P/BV and M-cap basis), we arrive at a FY2017E basedtarget price of ̀ 1,646. At the current market price of ̀ 1,414, the standalone entityis trading at an implied P/E multiple of 14x (FY2017), which is attractive. We are ofthe view that L&T is a proxy play for investors wanting to ride on the revival of theIndian infrastructure growth story. WWWWWe recommend a Buy on the stock.e recommend a Buy on the stock.e recommend a Buy on the stock.e recommend a Buy on the stock.e recommend a Buy on the stock.
Y/EY/EY/EY/EY/E SalesSalesSalesSalesSales OPMOPMOPMOPMOPM PPPPPAAAAATTTTT EPSEPSEPSEPSEPS RoERoERoERoERoE P/EP/EP/EP/EP/E P/BP/BP/BP/BP/BVVVVV EV/EBITDEV/EBITDEV/EBITDEV/EBITDEV/EBITDAAAAA EV/SalesEV/SalesEV/SalesEV/SalesEV/Sales
MarchMarchMarchMarchMarch ((((( `̀̀̀̀ cr) cr) cr) cr) cr) (%)(%)(%)(%)(%) ((((( `̀̀̀̀ cr) cr) cr) cr) cr) ((((( `̀̀̀̀ ))))) (((((%%%%%))))) (x)(x)(x)(x)(x) (x)(x)(x)(x)(x) (x)(x)(x)(x)(x) (x)(x)(x)(x)(x)
FY2016E 64,148 11.5 5,776 61.5 13.4 22.9 2.3 19.5 2.2
FY2017E 73,241 11.7 6,155 65.6 14.0 21.5 2.1 16.9 2.0
November 2015 Please refer to important disclosures at the end of this report. 8
Market StrategyDiwali Special
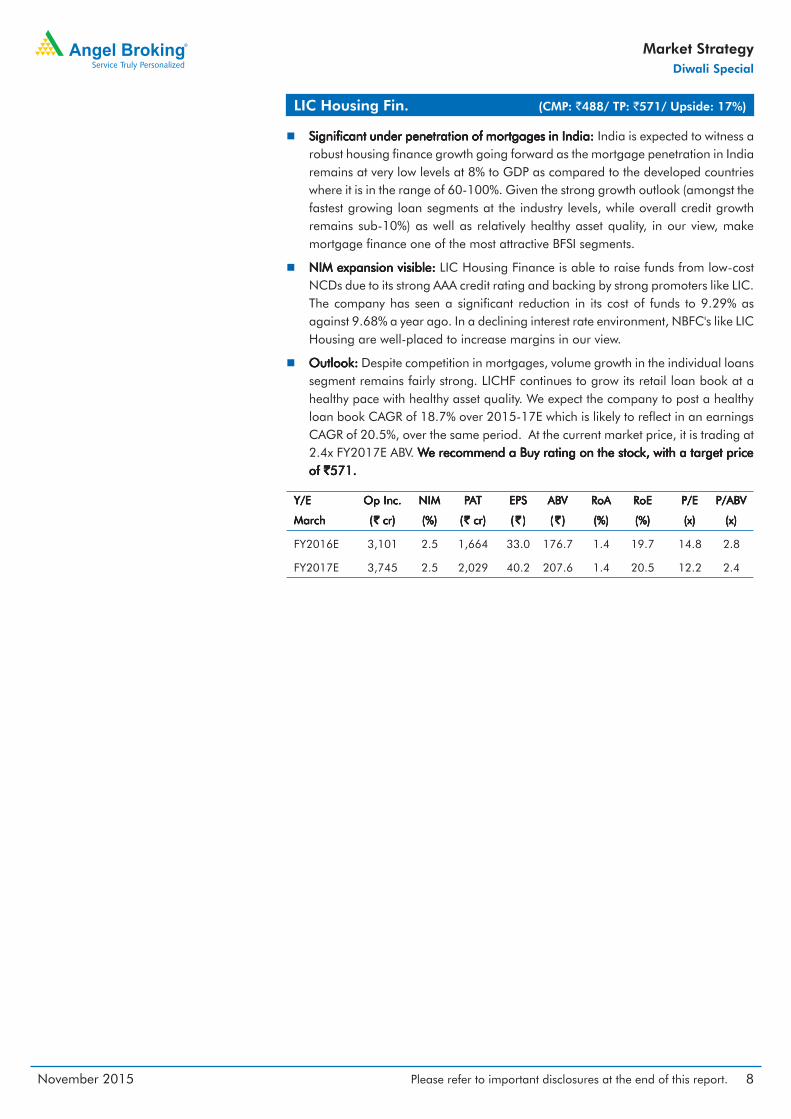
LIC Housing Fin. (CMP: `488/ TP: `571/ Upside: 17%)
Significant under penetration of mortgages in India: Significant under penetration of mortgages in India: Significant under penetration of mortgages in India: Significant under penetration of mortgages in India: Significant under penetration of mortgages in India: India is expected to witness arobust housing finance growth going forward as the mortgage penetration in Indiaremains at very low levels at 8% to GDP as compared to the developed countrieswhere it is in the range of 60-100%. Given the strong growth outlook (amongst thefastest growing loan segments at the industry levels, while overall credit growthremains sub-10%) as well as relatively healthy asset quality, in our view, makemortgage finance one of the most attractive BFSI segments.
NIM expansion visible: NIM expansion visible: NIM expansion visible: NIM expansion visible: NIM expansion visible: LIC Housing Finance is able to raise funds from low-costNCDs due to its strong AAA credit rating and backing by strong promoters like LIC.The company has seen a significant reduction in its cost of funds to 9.29% asagainst 9.68% a year ago. In a declining interest rate environment, NBFC's like LICHousing are well-placed to increase margins in our view.
Outlook: Outlook: Outlook: Outlook: Outlook: Despite competition in mortgages, volume growth in the individual loanssegment remains fairly strong. LICHF continues to grow its retail loan book at ahealthy pace with healthy asset quality. We expect the company to post a healthyloan book CAGR of 18.7% over 2015-17E which is likely to reflect in an earningsCAGR of 20.5%, over the same period. At the current market price, it is trading at2.4x FY2017E ABV. WWWWWe recommend a Buy rating on the stock, with a target pricee recommend a Buy rating on the stock, with a target pricee recommend a Buy rating on the stock, with a target pricee recommend a Buy rating on the stock, with a target pricee recommend a Buy rating on the stock, with a target priceof of of of of `̀̀̀̀571.571.571.571.571.
Y/EY/EY/EY/EY/E Op Inc.Op Inc.Op Inc.Op Inc.Op Inc. NIMNIMNIMNIMNIM PPPPPAAAAATTTTT EPSEPSEPSEPSEPS ABABABABABVVVVV RoARoARoARoARoA RoERoERoERoERoE P/EP/EP/EP/EP/E P/ABP/ABP/ABP/ABP/ABVVVVV
MarchMarchMarchMarchMarch ((((( `̀̀̀̀ cr) cr) cr) cr) cr) (%)(%)(%)(%)(%) ((((( `̀̀̀̀ cr) cr) cr) cr) cr) ((((( `̀̀̀̀ ))))) ((((( `̀̀̀̀ ))))) (%)(%)(%)(%)(%) (%)(%)(%)(%)(%) (x)(x)(x)(x)(x) (x)(x)(x)(x)(x)
FY2016E 3,101 2.5 1,664 33.0 176.7 1.4 19.7 14.8 2.8
FY2017E 3,745 2.5 2,029 40.2 207.6 1.4 20.5 12.2 2.4
November 2015 Please refer to important disclosures at the end of this report. 9
Market StrategyDiwali Special
Top Picks - Mid Cap
November 2015 Please refer to important disclosures at the end of this report. 10
Market StrategyDiwali Special
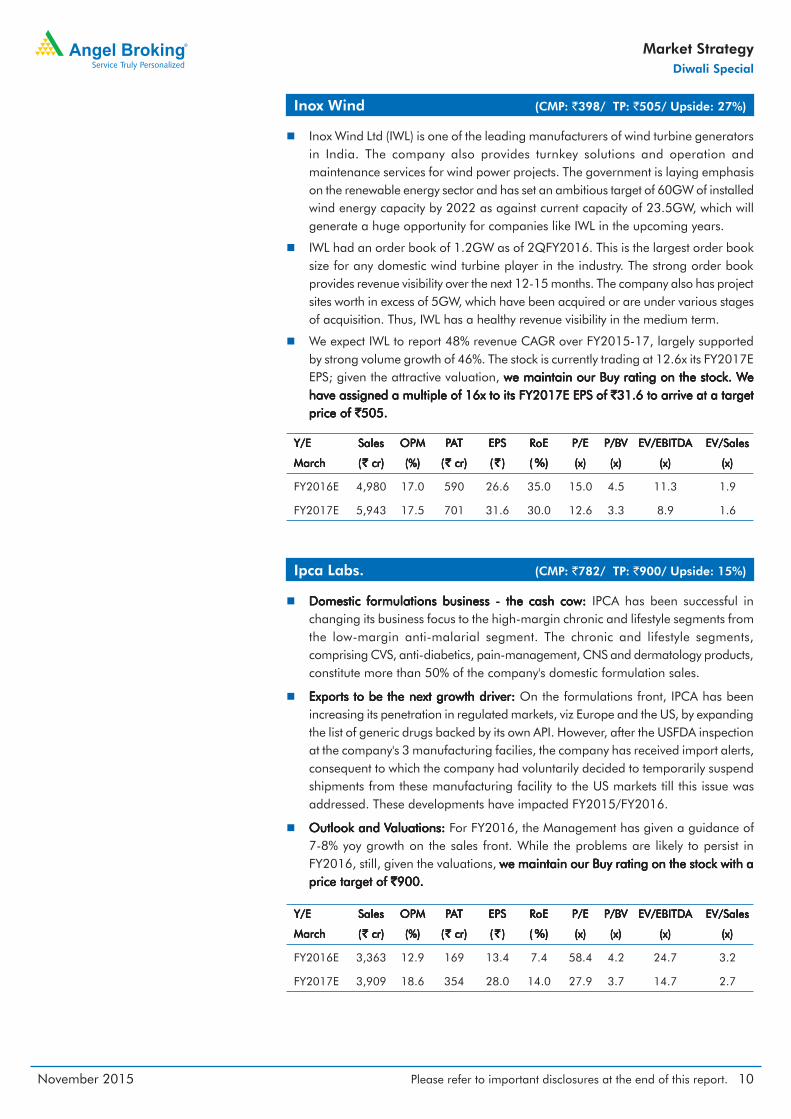
Inox Wind Ltd (IWL) is one of the leading manufacturers of wind turbine generatorsin India. The company also provides turnkey solutions and operation andmaintenance services for wind power projects. The government is laying emphasison the renewable energy sector and has set an ambitious target of 60GW of installedwind energy capacity by 2022 as against current capacity of 23.5GW, which willgenerate a huge opportunity for companies like IWL in the upcoming years.
IWL had an order book of 1.2GW as of 2QFY2016. This is the largest order booksize for any domestic wind turbine player in the industry. The strong order bookprovides revenue visibility over the next 12-15 months. The company also has projectsites worth in excess of 5GW, which have been acquired or are under various stagesof acquisition. Thus, IWL has a healthy revenue visibility in the medium term.
We expect IWL to report 48% revenue CAGR over FY2015-17, largely supportedby strong volume growth of 46%. The stock is currently trading at 12.6x its FY2017EEPS; given the attractive valuation, we maintain our Buy rating on the stock. Wwe maintain our Buy rating on the stock. Wwe maintain our Buy rating on the stock. Wwe maintain our Buy rating on the stock. Wwe maintain our Buy rating on the stock. Weeeeehave assigned a multiple of 16x to its FY2017E EPS of have assigned a multiple of 16x to its FY2017E EPS of have assigned a multiple of 16x to its FY2017E EPS of have assigned a multiple of 16x to its FY2017E EPS of have assigned a multiple of 16x to its FY2017E EPS of `̀̀̀̀31.6 to arrive at a target31.6 to arrive at a target31.6 to arrive at a target31.6 to arrive at a target31.6 to arrive at a targetprice of price of price of price of price of `̀̀̀̀505.505.505.505.505.
Inox Wind (CMP: `398/ TP: `505/ Upside: 27%)
Y/EY/EY/EY/EY/E SalesSalesSalesSalesSales OPMOPMOPMOPMOPM PPPPPAAAAATTTTT EPSEPSEPSEPSEPS RoERoERoERoERoE P/EP/EP/EP/EP/E P/BP/BP/BP/BP/BVVVVV EV/EBITDEV/EBITDEV/EBITDEV/EBITDEV/EBITDAAAAA EV/SalesEV/SalesEV/SalesEV/SalesEV/Sales
MarchMarchMarchMarchMarch ((((( `̀̀̀̀ cr) cr) cr) cr) cr) (%)(%)(%)(%)(%) ((((( `̀̀̀̀ cr) cr) cr) cr) cr) ((((( `̀̀̀̀ ))))) (((((%%%%%))))) (x)(x)(x)(x)(x) (x)(x)(x)(x)(x) (x)(x)(x)(x)(x) (x)(x)(x)(x)(x)
FY2016E 4,980 17.0 590 26.6 35.0 15.0 4.5 11.3 1.9
FY2017E 5,943 17.5 701 31.6 30.0 12.6 3.3 8.9 1.6
Ipca Labs. (CMP: `782/ TP: `900/ Upside: 15%)
Domestic formulations business - the cash cow: Domestic formulations business - the cash cow: Domestic formulations business - the cash cow: Domestic formulations business - the cash cow: Domestic formulations business - the cash cow: IPCA has been successful inchanging its business focus to the high-margin chronic and lifestyle segments fromthe low-margin anti-malarial segment. The chronic and lifestyle segments,comprising CVS, anti-diabetics, pain-management, CNS and dermatology products,constitute more than 50% of the company's domestic formulation sales.
Exports to be the next growth driver: Exports to be the next growth driver: Exports to be the next growth driver: Exports to be the next growth driver: Exports to be the next growth driver: On the formulations front, IPCA has beenincreasing its penetration in regulated markets, viz Europe and the US, by expandingthe list of generic drugs backed by its own API. However, after the USFDA inspectionat the company's 3 manufacturing facilies, the company has received import alerts,consequent to which the company had voluntarily decided to temporarily suspendshipments from these manufacturing facility to the US markets till this issue wasaddressed. These developments have impacted FY2015/FY2016.
Outlook and VOutlook and VOutlook and VOutlook and VOutlook and Valuations: aluations: aluations: aluations: aluations: For FY2016, the Management has given a guidance of7-8% yoy growth on the sales front. While the problems are likely to persist inFY2016, still, given the valuations, we maintain our Buy rating on the stock with awe maintain our Buy rating on the stock with awe maintain our Buy rating on the stock with awe maintain our Buy rating on the stock with awe maintain our Buy rating on the stock with aprice target of price target of price target of price target of price target of `̀̀̀̀900.900.900.900.900.
Y/EY/EY/EY/EY/E SalesSalesSalesSalesSales OPMOPMOPMOPMOPM PPPPPAAAAATTTTT EPSEPSEPSEPSEPS RoERoERoERoERoE P/EP/EP/EP/EP/E P/BP/BP/BP/BP/BVVVVV EV/EBITDEV/EBITDEV/EBITDEV/EBITDEV/EBITDAAAAA EV/SalesEV/SalesEV/SalesEV/SalesEV/Sales
MarchMarchMarchMarchMarch ((((( `̀̀̀̀ cr) cr) cr) cr) cr) (%)(%)(%)(%)(%) ((((( `̀̀̀̀ cr) cr) cr) cr) cr) ((((( `̀̀̀̀ ))))) (((((%%%%%))))) (x)(x)(x)(x)(x) (x)(x)(x)(x)(x) (x)(x)(x)(x)(x) (x)(x)(x)(x)(x)
FY2016E 3,363 12.9 169 13.4 7.4 58.4 4.2 24.7 3.2
FY2017E 3,909 18.6 354 28.0 14.0 27.9 3.7 14.7 2.7
November 2015 Please refer to important disclosures at the end of this report. 11
Market StrategyDiwali Special
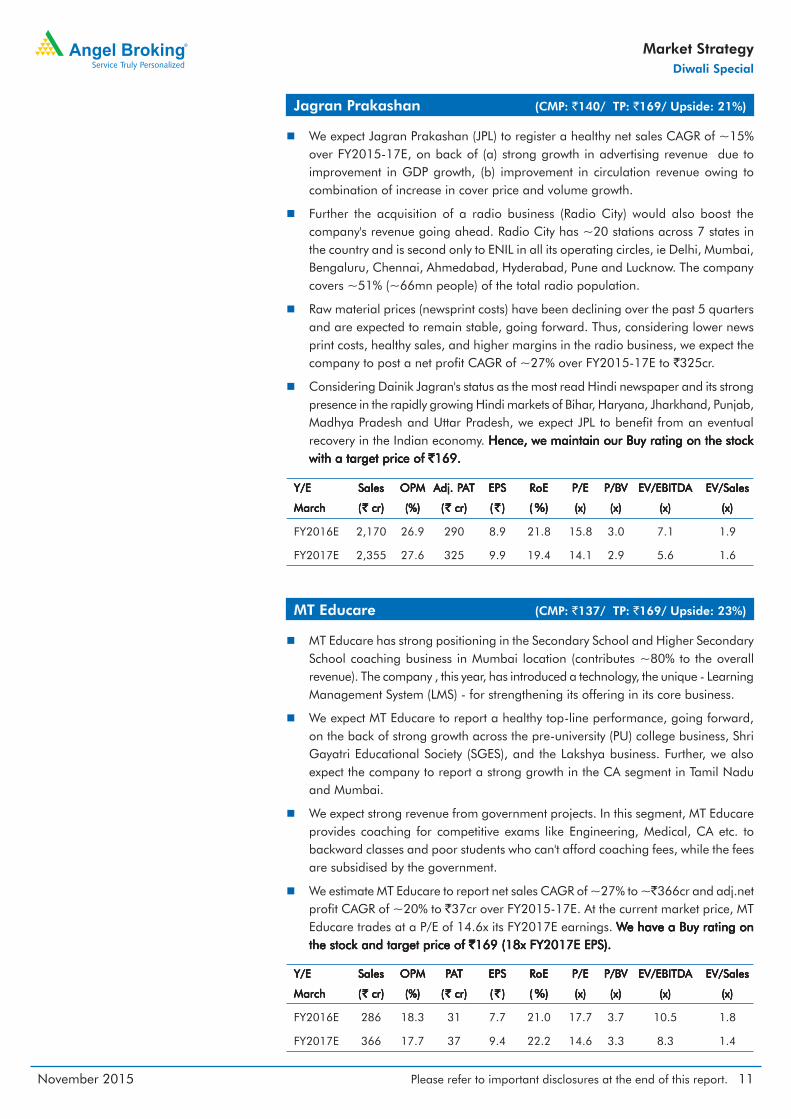
MT Educare (CMP: `137/ TP: `169/ Upside: 23%)
MT Educare has strong positioning in the Secondary School and Higher SecondarySchool coaching business in Mumbai location (contributes ~80% to the overallrevenue). The company , this year, has introduced a technology, the unique - LearningManagement System (LMS) - for strengthening its offering in its core business.
We expect MT Educare to report a healthy top-line performance, going forward,on the back of strong growth across the pre-university (PU) college business, ShriGayatri Educational Society (SGES), and the Lakshya business. Further, we alsoexpect the company to report a strong growth in the CA segment in Tamil Naduand Mumbai.
We expect strong revenue from government projects. In this segment, MT Educareprovides coaching for competitive exams like Engineering, Medical, CA etc. tobackward classes and poor students who can't afford coaching fees, while the feesare subsidised by the government.
We estimate MT Educare to report net sales CAGR of ~27% to ~`366cr and adj.netprofit CAGR of ~20% to `37cr over FY2015-17E. At the current market price, MTEducare trades at a P/E of 14.6x its FY2017E earnings. WWWWWe have a Buy rating one have a Buy rating one have a Buy rating one have a Buy rating one have a Buy rating onthe stock and target price of the stock and target price of the stock and target price of the stock and target price of the stock and target price of `̀̀̀̀169 (18x FY2017E EPS).169 (18x FY2017E EPS).169 (18x FY2017E EPS).169 (18x FY2017E EPS).169 (18x FY2017E EPS).
Y/EY/EY/EY/EY/E SalesSalesSalesSalesSales OPMOPMOPMOPMOPM PPPPPAAAAATTTTT EPSEPSEPSEPSEPS RoERoERoERoERoE P/EP/EP/EP/EP/E P/BP/BP/BP/BP/BVVVVV EV/EBITDEV/EBITDEV/EBITDEV/EBITDEV/EBITDAAAAA EV/SalesEV/SalesEV/SalesEV/SalesEV/Sales
MarchMarchMarchMarchMarch ((((( `̀̀̀̀ cr) cr) cr) cr) cr) (%)(%)(%)(%)(%) ((((( `̀̀̀̀ cr) cr) cr) cr) cr) ((((( `̀̀̀̀ ))))) (((((%%%%%))))) (x)(x)(x)(x)(x) (x)(x)(x)(x)(x) (x)(x)(x)(x)(x) (x)(x)(x)(x)(x)
FY2016E 286 18.3 31 7.7 21.0 17.7 3.7 10.5 1.8
FY2017E 366 17.7 37 9.4 22.2 14.6 3.3 8.3 1.4
We expect Jagran Prakashan (JPL) to register a healthy net sales CAGR of ~15%over FY2015-17E, on back of (a) strong growth in advertising revenue due toimprovement in GDP growth, (b) improvement in circulation revenue owing tocombination of increase in cover price and volume growth.
Further the acquisition of a radio business (Radio City) would also boost thecompany's revenue going ahead. Radio City has ~20 stations across 7 states inthe country and is second only to ENIL in all its operating circles, ie Delhi, Mumbai,Bengaluru, Chennai, Ahmedabad, Hyderabad, Pune and Lucknow. The companycovers ~51% (~66mn people) of the total radio population.
Raw material prices (newsprint costs) have been declining over the past 5 quartersand are expected to remain stable, going forward. Thus, considering lower newsprint costs, healthy sales, and higher margins in the radio business, we expect thecompany to post a net profit CAGR of ~27% over FY2015-17E to `325cr.
Considering Dainik Jagran's status as the most read Hindi newspaper and its strongpresence in the rapidly growing Hindi markets of Bihar, Haryana, Jharkhand, Punjab,Madhya Pradesh and Uttar Pradesh, we expect JPL to benefit from an eventualrecovery in the Indian economy. Hence, we maintain our Buy rating on the stockHence, we maintain our Buy rating on the stockHence, we maintain our Buy rating on the stockHence, we maintain our Buy rating on the stockHence, we maintain our Buy rating on the stockwith a target price of with a target price of with a target price of with a target price of with a target price of `̀̀̀̀169.169.169.169.169.
Jagran Prakashan (CMP: `140/ TP: `169/ Upside: 21%)
Y/EY/EY/EY/EY/E SalesSalesSalesSalesSales OPMOPMOPMOPMOPM Adj. PAdj. PAdj. PAdj. PAdj. PAAAAATTTTT EPSEPSEPSEPSEPS RoERoERoERoERoE P/EP/EP/EP/EP/E P/BP/BP/BP/BP/BVVVVV EV/EBITDEV/EBITDEV/EBITDEV/EBITDEV/EBITDAAAAA EV/SalesEV/SalesEV/SalesEV/SalesEV/Sales
MarchMarchMarchMarchMarch ((((( `̀̀̀̀ cr) cr) cr) cr) cr) (%)(%)(%)(%)(%) ((((( `̀̀̀̀ cr) cr) cr) cr) cr) ((((( `̀̀̀̀ ))))) (((((%%%%%))))) (x)(x)(x)(x)(x) (x)(x)(x)(x)(x) (x)(x)(x)(x)(x) (x)(x)(x)(x)(x)
FY2016E 2,170 26.9 290 8.9 21.8 15.8 3.0 7.1 1.9
FY2017E 2,355 27.6 325 9.9 19.4 14.1 2.9 5.6 1.6
November 2015 Please refer to important disclosures at the end of this report. 12
Market StrategyDiwali Special
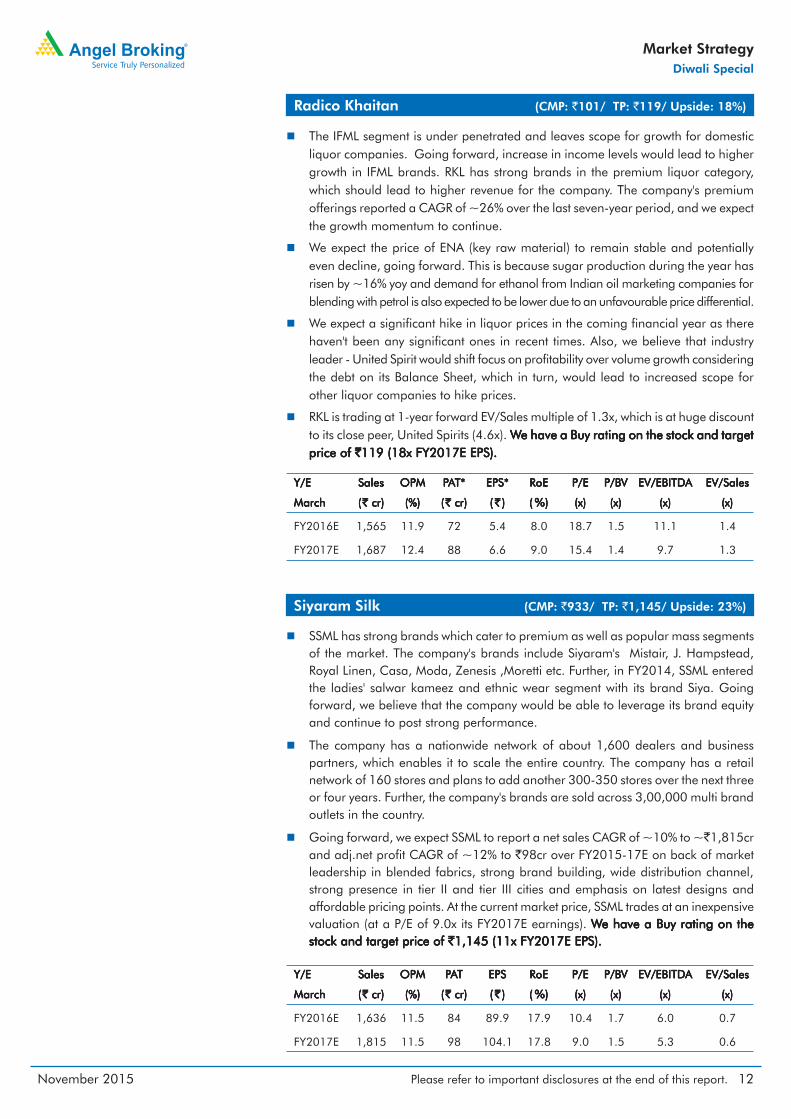
The IFML segment is under penetrated and leaves scope for growth for domesticliquor companies. Going forward, increase in income levels would lead to highergrowth in IFML brands. RKL has strong brands in the premium liquor category,which should lead to higher revenue for the company. The company's premiumofferings reported a CAGR of ~26% over the last seven-year period, and we expectthe growth momentum to continue.
We expect the price of ENA (key raw material) to remain stable and potentiallyeven decline, going forward. This is because sugar production during the year hasrisen by ~16% yoy and demand for ethanol from Indian oil marketing companies forblending with petrol is also expected to be lower due to an unfavourable price differential.
We expect a significant hike in liquor prices in the coming financial year as therehaven't been any significant ones in recent times. Also, we believe that industryleader - United Spirit would shift focus on profitability over volume growth consideringthe debt on its Balance Sheet, which in turn, would lead to increased scope forother liquor companies to hike prices.
RKL is trading at 1-year forward EV/Sales multiple of 1.3x, which is at huge discountto its close peer, United Spirits (4.6x). WWWWWe have a Buy rating on the stock and targete have a Buy rating on the stock and targete have a Buy rating on the stock and targete have a Buy rating on the stock and targete have a Buy rating on the stock and targetprice of price of price of price of price of `̀̀̀̀119 (18x FY2017E EPS).119 (18x FY2017E EPS).119 (18x FY2017E EPS).119 (18x FY2017E EPS).119 (18x FY2017E EPS).
Radico Khaitan (CMP: `101/ TP: `119/ Upside: 18%)
Y/EY/EY/EY/EY/E SalesSalesSalesSalesSales OPMOPMOPMOPMOPM PPPPPAAAAAT*T*T*T*T* EPS*EPS*EPS*EPS*EPS* RoERoERoERoERoE P/EP/EP/EP/EP/E P/BP/BP/BP/BP/BVVVVV EV/EBITDEV/EBITDEV/EBITDEV/EBITDEV/EBITDAAAAA EV/SalesEV/SalesEV/SalesEV/SalesEV/Sales
MarchMarchMarchMarchMarch ((((( `̀̀̀̀ cr) cr) cr) cr) cr) (%)(%)(%)(%)(%) ((((( `̀̀̀̀ cr) cr) cr) cr) cr) ((((( `̀̀̀̀ ))))) (((((%%%%%))))) (x)(x)(x)(x)(x) (x)(x)(x)(x)(x) (x)(x)(x)(x)(x) (x)(x)(x)(x)(x)
FY2016E 1,565 11.9 72 5.4 8.0 18.7 1.5 11.1 1.4
FY2017E 1,687 12.4 88 6.6 9.0 15.4 1.4 9.7 1.3
Siyaram Silk (CMP: `933/ TP: `1,145/ Upside: 23%)
SSML has strong brands which cater to premium as well as popular mass segmentsof the market. The company's brands include Siyaram's Mistair, J. Hampstead,Royal Linen, Casa, Moda, Zenesis ,Moretti etc. Further, in FY2014, SSML enteredthe ladies' salwar kameez and ethnic wear segment with its brand Siya. Goingforward, we believe that the company would be able to leverage its brand equityand continue to post strong performance.
The company has a nationwide network of about 1,600 dealers and businesspartners, which enables it to scale the entire country. The company has a retailnetwork of 160 stores and plans to add another 300-350 stores over the next threeor four years. Further, the company's brands are sold across 3,00,000 multi brandoutlets in the country.
Going forward, we expect SSML to report a net sales CAGR of ~10% to ~`1,815crand adj.net profit CAGR of ~12% to `98cr over FY2015-17E on back of marketleadership in blended fabrics, strong brand building, wide distribution channel,strong presence in tier II and tier III cities and emphasis on latest designs andaffordable pricing points. At the current market price, SSML trades at an inexpensivevaluation (at a P/E of 9.0x its FY2017E earnings). WWWWWe have a Buy rating on thee have a Buy rating on thee have a Buy rating on thee have a Buy rating on thee have a Buy rating on thestock and target price of stock and target price of stock and target price of stock and target price of stock and target price of `̀̀̀̀1,145 (11x FY2017E EPS).1,145 (11x FY2017E EPS).1,145 (11x FY2017E EPS).1,145 (11x FY2017E EPS).1,145 (11x FY2017E EPS).
Y/EY/EY/EY/EY/E SalesSalesSalesSalesSales OPMOPMOPMOPMOPM PPPPPAAAAATTTTT EPSEPSEPSEPSEPS RoERoERoERoERoE P/EP/EP/EP/EP/E P/BP/BP/BP/BP/BVVVVV EV/EBITDEV/EBITDEV/EBITDEV/EBITDEV/EBITDAAAAA EV/SalesEV/SalesEV/SalesEV/SalesEV/Sales
MarchMarchMarchMarchMarch ((((( `̀̀̀̀ cr) cr) cr) cr) cr) (%)(%)(%)(%)(%) ((((( `̀̀̀̀ cr) cr) cr) cr) cr) ((((( `̀̀̀̀ ))))) (((((%%%%%))))) (x)(x)(x)(x)(x) (x)(x)(x)(x)(x) (x)(x)(x)(x)(x) (x)(x)(x)(x)(x)
FY2016E 1,636 11.5 84 89.9 17.9 10.4 1.7 6.0 0.7
FY2017E 1,815 11.5 98 104.1 17.8 9.0 1.5 5.3 0.6
November 2015 Please refer to important disclosures at the end of this report. 13
Market StrategyDiwali Special
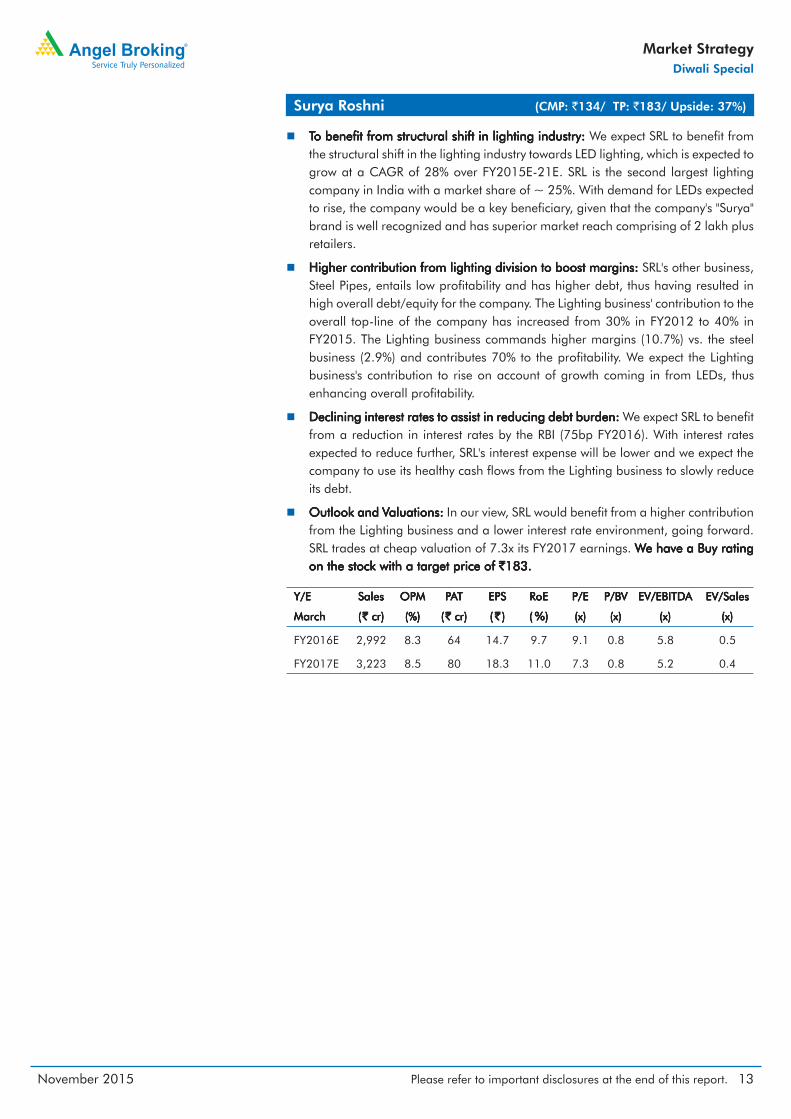
TTTTTo benefit from structural shift in lighting industry: o benefit from structural shift in lighting industry: o benefit from structural shift in lighting industry: o benefit from structural shift in lighting industry: o benefit from structural shift in lighting industry: We expect SRL to benefit fromthe structural shift in the lighting industry towards LED lighting, which is expected togrow at a CAGR of 28% over FY2015E-21E. SRL is the second largest lightingcompany in India with a market share of ~ 25%. With demand for LEDs expectedto rise, the company would be a key beneficiary, given that the company's "Surya"brand is well recognized and has superior market reach comprising of 2 lakh plusretailers.
Higher contribution from lighting division to boost margins: Higher contribution from lighting division to boost margins: Higher contribution from lighting division to boost margins: Higher contribution from lighting division to boost margins: Higher contribution from lighting division to boost margins: SRL's other business,Steel Pipes, entails low profitability and has higher debt, thus having resulted inhigh overall debt/equity for the company. The Lighting business' contribution to theoverall top-line of the company has increased from 30% in FY2012 to 40% inFY2015. The Lighting business commands higher margins (10.7%) vs. the steelbusiness (2.9%) and contributes 70% to the profitability. We expect the Lightingbusiness's contribution to rise on account of growth coming in from LEDs, thusenhancing overall profitability.
Declining interest rates to assist in reducing debt burden: Declining interest rates to assist in reducing debt burden: Declining interest rates to assist in reducing debt burden: Declining interest rates to assist in reducing debt burden: Declining interest rates to assist in reducing debt burden: We expect SRL to benefitfrom a reduction in interest rates by the RBI (75bp FY2016). With interest ratesexpected to reduce further, SRL's interest expense will be lower and we expect thecompany to use its healthy cash flows from the Lighting business to slowly reduceits debt.
Outlook and VOutlook and VOutlook and VOutlook and VOutlook and Valuations: aluations: aluations: aluations: aluations: In our view, SRL would benefit from a higher contributionfrom the Lighting business and a lower interest rate environment, going forward.SRL trades at cheap valuation of 7.3x its FY2017 earnings. WWWWWe have a Buy ratinge have a Buy ratinge have a Buy ratinge have a Buy ratinge have a Buy ratingon the stock with a target price of on the stock with a target price of on the stock with a target price of on the stock with a target price of on the stock with a target price of `̀̀̀̀183.183.183.183.183.
Surya Roshni (CMP: `134/ TP: `183/ Upside: 37%)
Y/EY/EY/EY/EY/E SalesSalesSalesSalesSales OPMOPMOPMOPMOPM PPPPPAAAAATTTTT EPSEPSEPSEPSEPS RoERoERoERoERoE P/EP/EP/EP/EP/E P/BP/BP/BP/BP/BVVVVV EV/EBITDEV/EBITDEV/EBITDEV/EBITDEV/EBITDAAAAA EV/SalesEV/SalesEV/SalesEV/SalesEV/Sales
MarchMarchMarchMarchMarch ((((( `̀̀̀̀ cr) cr) cr) cr) cr) (%)(%)(%)(%)(%) ((((( `̀̀̀̀ cr) cr) cr) cr) cr) ((((( `̀̀̀̀ ))))) (((((%%%%%))))) (x)(x)(x)(x)(x) (x)(x)(x)(x)(x) (x)(x)(x)(x)(x) (x)(x)(x)(x)(x)
FY2016E 2,992 8.3 64 14.7 9.7 9.1 0.8 5.8 0.5
FY2017E 3,223 8.5 80 18.3 11.0 7.3 0.8 5.2 0.4

November 2015 Please refer to important disclosures at the end of this report. 14
Market StrategyDiwali Special
Stock Watch
Stock WStock WStock WStock WStock Watch |atch |atch |atch |atch | November 2015
15May 2011 Please refer to important disclosures at the end of this report.
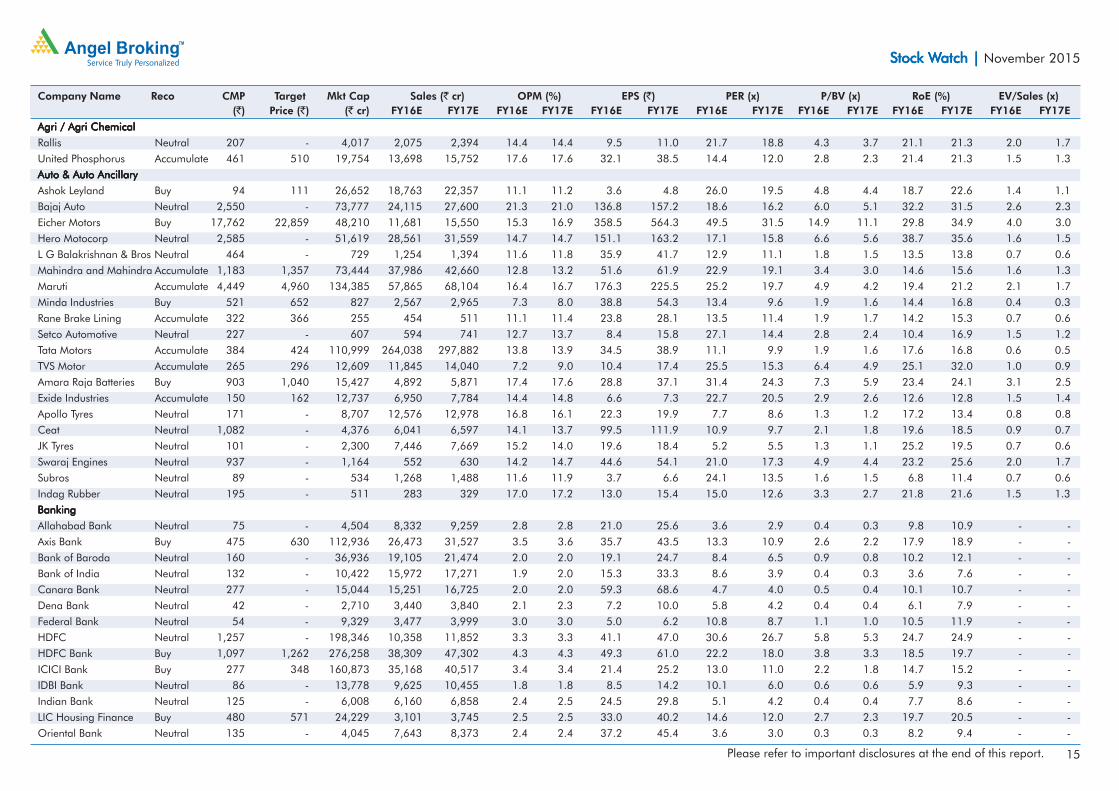
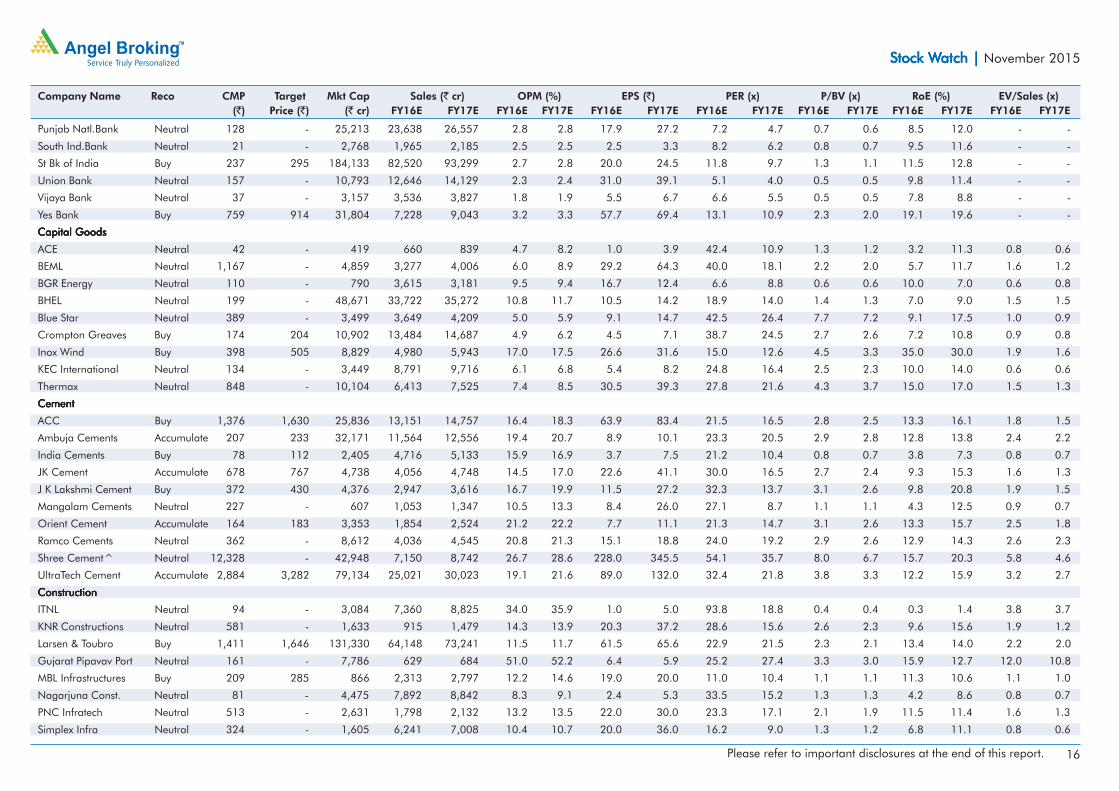
Company Name Reco CMP Target Mkt Cap Sales (` cr) OPM (%) EPS (`) PER (x) P/BV (x) RoE (%) EV/Sales (x) (`) Price (`) (` cr) FY16E FY17E FY16E FY17E FY16E FY17E FY16E FY17E FY16E FY17E FY16E FY17E FY16E FY17E
Agri / Agri ChemicalAgri / Agri ChemicalAgri / Agri ChemicalAgri / Agri ChemicalAgri / Agri Chemical
Rallis Neutral 207 - 4,017 2,075 2,394 14.4 14.4 9.5 11.0 21.7 18.8 4.3 3.7 21.1 21.3 2.0 1.7
United Phosphorus Accumulate 461 510 19,754 13,698 15,752 17.6 17.6 32.1 38.5 14.4 12.0 2.8 2.3 21.4 21.3 1.5 1.3
Auto & Auto AncillaryAuto & Auto AncillaryAuto & Auto AncillaryAuto & Auto AncillaryAuto & Auto Ancillary
Ashok Leyland Buy 94 111 26,652 18,763 22,357 11.1 11.2 3.6 4.8 26.0 19.5 4.8 4.4 18.7 22.6 1.4 1.1
Bajaj Auto Neutral 2,550 - 73,777 24,115 27,600 21.3 21.0 136.8 157.2 18.6 16.2 6.0 5.1 32.2 31.5 2.6 2.3
Eicher Motors Buy 17,762 22,859 48,210 11,681 15,550 15.3 16.9 358.5 564.3 49.5 31.5 14.9 11.1 29.8 34.9 4.0 3.0
Hero Motocorp Neutral 2,585 - 51,619 28,561 31,559 14.7 14.7 151.1 163.2 17.1 15.8 6.6 5.6 38.7 35.6 1.6 1.5
L G Balakrishnan & Bros Neutral 464 - 729 1,254 1,394 11.6 11.8 35.9 41.7 12.9 11.1 1.8 1.5 13.5 13.8 0.7 0.6
Mahindra and Mahindra Accumulate 1,183 1,357 73,444 37,986 42,660 12.8 13.2 51.6 61.9 22.9 19.1 3.4 3.0 14.6 15.6 1.6 1.3
Maruti Accumulate 4,449 4,960 134,385 57,865 68,104 16.4 16.7 176.3 225.5 25.2 19.7 4.9 4.2 19.4 21.2 2.1 1.7
Minda Industries Buy 521 652 827 2,567 2,965 7.3 8.0 38.8 54.3 13.4 9.6 1.9 1.6 14.4 16.8 0.4 0.3
Rane Brake Lining Accumulate 322 366 255 454 511 11.1 11.4 23.8 28.1 13.5 11.4 1.9 1.7 14.2 15.3 0.7 0.6
Setco Automotive Neutral 227 - 607 594 741 12.7 13.7 8.4 15.8 27.1 14.4 2.8 2.4 10.4 16.9 1.5 1.2
Tata Motors Accumulate 384 424 110,999 264,038 297,882 13.8 13.9 34.5 38.9 11.1 9.9 1.9 1.6 17.6 16.8 0.6 0.5
TVS Motor Accumulate 265 296 12,609 11,845 14,040 7.2 9.0 10.4 17.4 25.5 15.3 6.4 4.9 25.1 32.0 1.0 0.9
Amara Raja Batteries Buy 903 1,040 15,427 4,892 5,871 17.4 17.6 28.8 37.1 31.4 24.3 7.3 5.9 23.4 24.1 3.1 2.5
Exide Industries Accumulate 150 162 12,737 6,950 7,784 14.4 14.8 6.6 7.3 22.7 20.5 2.9 2.6 12.6 12.8 1.5 1.4
Apollo Tyres Neutral 171 - 8,707 12,576 12,978 16.8 16.1 22.3 19.9 7.7 8.6 1.3 1.2 17.2 13.4 0.8 0.8
Ceat Neutral 1,082 - 4,376 6,041 6,597 14.1 13.7 99.5 111.9 10.9 9.7 2.1 1.8 19.6 18.5 0.9 0.7
JK Tyres Neutral 101 - 2,300 7,446 7,669 15.2 14.0 19.6 18.4 5.2 5.5 1.3 1.1 25.2 19.5 0.7 0.6
Swaraj Engines Neutral 937 - 1,164 552 630 14.2 14.7 44.6 54.1 21.0 17.3 4.9 4.4 23.2 25.6 2.0 1.7
Subros Neutral 89 - 534 1,268 1,488 11.6 11.9 3.7 6.6 24.1 13.5 1.6 1.5 6.8 11.4 0.7 0.6
Indag Rubber Neutral 195 - 511 283 329 17.0 17.2 13.0 15.4 15.0 12.6 3.3 2.7 21.8 21.6 1.5 1.3
BankingBankingBankingBankingBanking
Allahabad Bank Neutral 75 - 4,504 8,332 9,259 2.8 2.8 21.0 25.6 3.6 2.9 0.4 0.3 9.8 10.9 - -
Axis Bank Buy 475 630 112,936 26,473 31,527 3.5 3.6 35.7 43.5 13.3 10.9 2.6 2.2 17.9 18.9 - -
Bank of Baroda Neutral 160 - 36,936 19,105 21,474 2.0 2.0 19.1 24.7 8.4 6.5 0.9 0.8 10.2 12.1 - -
Bank of India Neutral 132 - 10,422 15,972 17,271 1.9 2.0 15.3 33.3 8.6 3.9 0.4 0.3 3.6 7.6 - -
Canara Bank Neutral 277 - 15,044 15,251 16,725 2.0 2.0 59.3 68.6 4.7 4.0 0.5 0.4 10.1 10.7 - -
Dena Bank Neutral 42 - 2,710 3,440 3,840 2.1 2.3 7.2 10.0 5.8 4.2 0.4 0.4 6.1 7.9 - -
Federal Bank Neutral 54 - 9,329 3,477 3,999 3.0 3.0 5.0 6.2 10.8 8.7 1.1 1.0 10.5 11.9 - -
HDFC Neutral 1,257 - 198,346 10,358 11,852 3.3 3.3 41.1 47.0 30.6 26.7 5.8 5.3 24.7 24.9 - -
HDFC Bank Buy 1,097 1,262 276,258 38,309 47,302 4.3 4.3 49.3 61.0 22.2 18.0 3.8 3.3 18.5 19.7 - -
ICICI Bank Buy 277 348 160,873 35,168 40,517 3.4 3.4 21.4 25.2 13.0 11.0 2.2 1.8 14.7 15.2 - -
IDBI Bank Neutral 86 - 13,778 9,625 10,455 1.8 1.8 8.5 14.2 10.1 6.0 0.6 0.6 5.9 9.3 - -
Indian Bank Neutral 125 - 6,008 6,160 6,858 2.4 2.5 24.5 29.8 5.1 4.2 0.4 0.4 7.7 8.6 - -
LIC Housing Finance Buy 480 571 24,229 3,101 3,745 2.5 2.5 33.0 40.2 14.6 12.0 2.7 2.3 19.7 20.5 - -
Oriental Bank Neutral 135 - 4,045 7,643 8,373 2.4 2.4 37.2 45.4 3.6 3.0 0.3 0.3 8.2 9.4 - -
Stock WStock WStock WStock WStock Watch |atch |atch |atch |atch | November 2015
16May 2011 Please refer to important disclosures at the end of this report.
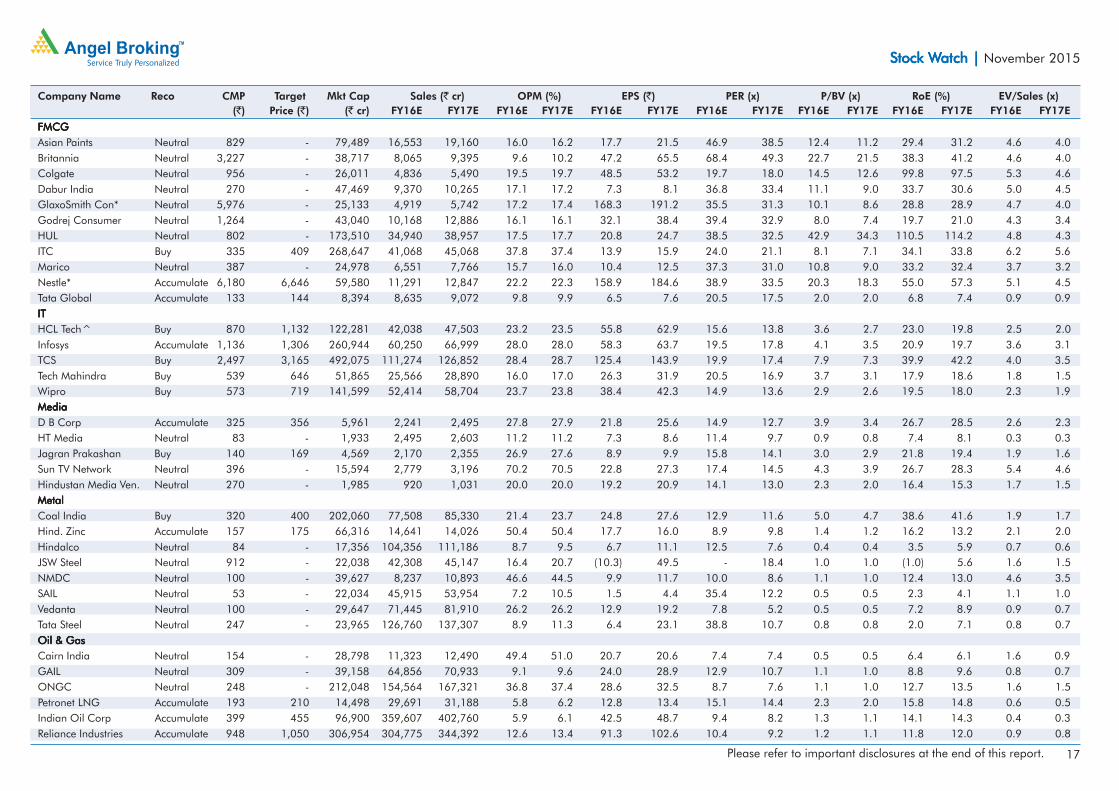
Company Name Reco CMP Target Mkt Cap Sales (` cr) OPM (%) EPS (`) PER (x) P/BV (x) RoE (%) EV/Sales (x) (`) Price (`) (` cr) FY16E FY17E FY16E FY17E FY16E FY17E FY16E FY17E FY16E FY17E FY16E FY17E FY16E FY17E
Punjab Natl.Bank Neutral 128 - 25,213 23,638 26,557 2.8 2.8 17.9 27.2 7.2 4.7 0.7 0.6 8.5 12.0 - -
South Ind.Bank Neutral 21 - 2,768 1,965 2,185 2.5 2.5 2.5 3.3 8.2 6.2 0.8 0.7 9.5 11.6 - -
St Bk of India Buy 237 295 184,133 82,520 93,299 2.7 2.8 20.0 24.5 11.8 9.7 1.3 1.1 11.5 12.8 - -
Union Bank Neutral 157 - 10,793 12,646 14,129 2.3 2.4 31.0 39.1 5.1 4.0 0.5 0.5 9.8 11.4 - -
Vijaya Bank Neutral 37 - 3,157 3,536 3,827 1.8 1.9 5.5 6.7 6.6 5.5 0.5 0.5 7.8 8.8 - -
Yes Bank Buy 759 914 31,804 7,228 9,043 3.2 3.3 57.7 69.4 13.1 10.9 2.3 2.0 19.1 19.6 - -
Capital GoodsCapital GoodsCapital GoodsCapital GoodsCapital Goods
ACE Neutral 42 - 419 660 839 4.7 8.2 1.0 3.9 42.4 10.9 1.3 1.2 3.2 11.3 0.8 0.6
BEML Neutral 1,167 - 4,859 3,277 4,006 6.0 8.9 29.2 64.3 40.0 18.1 2.2 2.0 5.7 11.7 1.6 1.2
BGR Energy Neutral 110 - 790 3,615 3,181 9.5 9.4 16.7 12.4 6.6 8.8 0.6 0.6 10.0 7.0 0.6 0.8
BHEL Neutral 199 - 48,671 33,722 35,272 10.8 11.7 10.5 14.2 18.9 14.0 1.4 1.3 7.0 9.0 1.5 1.5
Blue Star Neutral 389 - 3,499 3,649 4,209 5.0 5.9 9.1 14.7 42.5 26.4 7.7 7.2 9.1 17.5 1.0 0.9
Crompton Greaves Buy 174 204 10,902 13,484 14,687 4.9 6.2 4.5 7.1 38.7 24.5 2.7 2.6 7.2 10.8 0.9 0.8
Inox Wind Buy 398 505 8,829 4,980 5,943 17.0 17.5 26.6 31.6 15.0 12.6 4.5 3.3 35.0 30.0 1.9 1.6
KEC International Neutral 134 - 3,449 8,791 9,716 6.1 6.8 5.4 8.2 24.8 16.4 2.5 2.3 10.0 14.0 0.6 0.6
Thermax Neutral 848 - 10,104 6,413 7,525 7.4 8.5 30.5 39.3 27.8 21.6 4.3 3.7 15.0 17.0 1.5 1.3
CementCementCementCementCement
ACC Buy 1,376 1,630 25,836 13,151 14,757 16.4 18.3 63.9 83.4 21.5 16.5 2.8 2.5 13.3 16.1 1.8 1.5
Ambuja Cements Accumulate 207 233 32,171 11,564 12,556 19.4 20.7 8.9 10.1 23.3 20.5 2.9 2.8 12.8 13.8 2.4 2.2
India Cements Buy 78 112 2,405 4,716 5,133 15.9 16.9 3.7 7.5 21.2 10.4 0.8 0.7 3.8 7.3 0.8 0.7
JK Cement Accumulate 678 767 4,738 4,056 4,748 14.5 17.0 22.6 41.1 30.0 16.5 2.7 2.4 9.3 15.3 1.6 1.3
J K Lakshmi Cement Buy 372 430 4,376 2,947 3,616 16.7 19.9 11.5 27.2 32.3 13.7 3.1 2.6 9.8 20.8 1.9 1.5
Mangalam Cements Neutral 227 - 607 1,053 1,347 10.5 13.3 8.4 26.0 27.1 8.7 1.1 1.1 4.3 12.5 0.9 0.7
Orient Cement Accumulate 164 183 3,353 1,854 2,524 21.2 22.2 7.7 11.1 21.3 14.7 3.1 2.6 13.3 15.7 2.5 1.8
Ramco Cements Neutral 362 - 8,612 4,036 4,545 20.8 21.3 15.1 18.8 24.0 19.2 2.9 2.6 12.9 14.3 2.6 2.3
Shree Cement^ Neutral 12,328 - 42,948 7,150 8,742 26.7 28.6 228.0 345.5 54.1 35.7 8.0 6.7 15.7 20.3 5.8 4.6
UltraTech Cement Accumulate 2,884 3,282 79,134 25,021 30,023 19.1 21.6 89.0 132.0 32.4 21.8 3.8 3.3 12.2 15.9 3.2 2.7
ConstructionConstructionConstructionConstructionConstruction
ITNL Neutral 94 - 3,084 7,360 8,825 34.0 35.9 1.0 5.0 93.8 18.8 0.4 0.4 0.3 1.4 3.8 3.7
KNR Constructions Neutral 581 - 1,633 915 1,479 14.3 13.9 20.3 37.2 28.6 15.6 2.6 2.3 9.6 15.6 1.9 1.2
Larsen & Toubro Buy 1,411 1,646 131,330 64,148 73,241 11.5 11.7 61.5 65.6 22.9 21.5 2.3 2.1 13.4 14.0 2.2 2.0
Gujarat Pipavav Port Neutral 161 - 7,786 629 684 51.0 52.2 6.4 5.9 25.2 27.4 3.3 3.0 15.9 12.7 12.0 10.8
MBL Infrastructures Buy 209 285 866 2,313 2,797 12.2 14.6 19.0 20.0 11.0 10.4 1.1 1.1 11.3 10.6 1.1 1.0
Nagarjuna Const. Neutral 81 - 4,475 7,892 8,842 8.3 9.1 2.4 5.3 33.5 15.2 1.3 1.3 4.2 8.6 0.8 0.7
PNC Infratech Neutral 513 - 2,631 1,798 2,132 13.2 13.5 22.0 30.0 23.3 17.1 2.1 1.9 11.5 11.4 1.6 1.3
Simplex Infra Neutral 324 - 1,605 6,241 7,008 10.4 10.7 20.0 36.0 16.2 9.0 1.3 1.2 6.8 11.1 0.8 0.6
Stock WStock WStock WStock WStock Watch |atch |atch |atch |atch | November 2015
17May 2011 Please refer to important disclosures at the end of this report.
Company Name Reco CMP Target Mkt Cap Sales (` cr) OPM (%) EPS (`) PER (x) P/BV (x) RoE (%) EV/Sales (x) (`) Price (`) (` cr) FY16E FY17E FY16E FY17E FY16E FY17E FY16E FY17E FY16E FY17E FY16E FY17E FY16E FY17E
FMCGFMCGFMCGFMCGFMCGAsian Paints Neutral 829 - 79,489 16,553 19,160 16.0 16.2 17.7 21.5 46.9 38.5 12.4 11.2 29.4 31.2 4.6 4.0Britannia Neutral 3,227 - 38,717 8,065 9,395 9.6 10.2 47.2 65.5 68.4 49.3 22.7 21.5 38.3 41.2 4.6 4.0Colgate Neutral 956 - 26,011 4,836 5,490 19.5 19.7 48.5 53.2 19.7 18.0 14.5 12.6 99.8 97.5 5.3 4.6Dabur India Neutral 270 - 47,469 9,370 10,265 17.1 17.2 7.3 8.1 36.8 33.4 11.1 9.0 33.7 30.6 5.0 4.5GlaxoSmith Con* Neutral 5,976 - 25,133 4,919 5,742 17.2 17.4 168.3 191.2 35.5 31.3 10.1 8.6 28.8 28.9 4.7 4.0Godrej Consumer Neutral 1,264 - 43,040 10,168 12,886 16.1 16.1 32.1 38.4 39.4 32.9 8.0 7.4 19.7 21.0 4.3 3.4HUL Neutral 802 - 173,510 34,940 38,957 17.5 17.7 20.8 24.7 38.5 32.5 42.9 34.3 110.5 114.2 4.8 4.3ITC Buy 335 409 268,647 41,068 45,068 37.8 37.4 13.9 15.9 24.0 21.1 8.1 7.1 34.1 33.8 6.2 5.6Marico Neutral 387 - 24,978 6,551 7,766 15.7 16.0 10.4 12.5 37.3 31.0 10.8 9.0 33.2 32.4 3.7 3.2Nestle* Accumulate 6,180 6,646 59,580 11,291 12,847 22.2 22.3 158.9 184.6 38.9 33.5 20.3 18.3 55.0 57.3 5.1 4.5Tata Global Accumulate 133 144 8,394 8,635 9,072 9.8 9.9 6.5 7.6 20.5 17.5 2.0 2.0 6.8 7.4 0.9 0.9ITITITITITHCL Tech^ Buy 870 1,132 122,281 42,038 47,503 23.2 23.5 55.8 62.9 15.6 13.8 3.6 2.7 23.0 19.8 2.5 2.0Infosys Accumulate 1,136 1,306 260,944 60,250 66,999 28.0 28.0 58.3 63.7 19.5 17.8 4.1 3.5 20.9 19.7 3.6 3.1TCS Buy 2,497 3,165 492,075 111,274 126,852 28.4 28.7 125.4 143.9 19.9 17.4 7.9 7.3 39.9 42.2 4.0 3.5Tech Mahindra Buy 539 646 51,865 25,566 28,890 16.0 17.0 26.3 31.9 20.5 16.9 3.7 3.1 17.9 18.6 1.8 1.5Wipro Buy 573 719 141,599 52,414 58,704 23.7 23.8 38.4 42.3 14.9 13.6 2.9 2.6 19.5 18.0 2.3 1.9MediaMediaMediaMediaMediaD B Corp Accumulate 325 356 5,961 2,241 2,495 27.8 27.9 21.8 25.6 14.9 12.7 3.9 3.4 26.7 28.5 2.6 2.3HT Media Neutral 83 - 1,933 2,495 2,603 11.2 11.2 7.3 8.6 11.4 9.7 0.9 0.8 7.4 8.1 0.3 0.3Jagran Prakashan Buy 140 169 4,569 2,170 2,355 26.9 27.6 8.9 9.9 15.8 14.1 3.0 2.9 21.8 19.4 1.9 1.6Sun TV Network Neutral 396 - 15,594 2,779 3,196 70.2 70.5 22.8 27.3 17.4 14.5 4.3 3.9 26.7 28.3 5.4 4.6Hindustan Media Ven. Neutral 270 - 1,985 920 1,031 20.0 20.0 19.2 20.9 14.1 13.0 2.3 2.0 16.4 15.3 1.7 1.5MetalMetalMetalMetalMetalCoal India Buy 320 400 202,060 77,508 85,330 21.4 23.7 24.8 27.6 12.9 11.6 5.0 4.7 38.6 41.6 1.9 1.7Hind. Zinc Accumulate 157 175 66,316 14,641 14,026 50.4 50.4 17.7 16.0 8.9 9.8 1.4 1.2 16.2 13.2 2.1 2.0Hindalco Neutral 84 - 17,356 104,356 111,186 8.7 9.5 6.7 11.1 12.5 7.6 0.4 0.4 3.5 5.9 0.7 0.6JSW Steel Neutral 912 - 22,038 42,308 45,147 16.4 20.7 (10.3) 49.5 - 18.4 1.0 1.0 (1.0) 5.6 1.6 1.5NMDC Neutral 100 - 39,627 8,237 10,893 46.6 44.5 9.9 11.7 10.0 8.6 1.1 1.0 12.4 13.0 4.6 3.5SAIL Neutral 53 - 22,034 45,915 53,954 7.2 10.5 1.5 4.4 35.4 12.2 0.5 0.5 2.3 4.1 1.1 1.0Vedanta Neutral 100 - 29,647 71,445 81,910 26.2 26.2 12.9 19.2 7.8 5.2 0.5 0.5 7.2 8.9 0.9 0.7Tata Steel Neutral 247 - 23,965 126,760 137,307 8.9 11.3 6.4 23.1 38.8 10.7 0.8 0.8 2.0 7.1 0.8 0.7Oil & GasOil & GasOil & GasOil & GasOil & GasCairn India Neutral 154 - 28,798 11,323 12,490 49.4 51.0 20.7 20.6 7.4 7.4 0.5 0.5 6.4 6.1 1.6 0.9GAIL Neutral 309 - 39,158 64,856 70,933 9.1 9.6 24.0 28.9 12.9 10.7 1.1 1.0 8.8 9.6 0.8 0.7ONGC Neutral 248 - 212,048 154,564 167,321 36.8 37.4 28.6 32.5 8.7 7.6 1.1 1.0 12.7 13.5 1.6 1.5Petronet LNG Accumulate 193 210 14,498 29,691 31,188 5.8 6.2 12.8 13.4 15.1 14.4 2.3 2.0 15.8 14.8 0.6 0.5Indian Oil Corp Accumulate 399 455 96,900 359,607 402,760 5.9 6.1 42.5 48.7 9.4 8.2 1.3 1.1 14.1 14.3 0.4 0.3Reliance Industries Accumulate 948 1,050 306,954 304,775 344,392 12.6 13.4 91.3 102.6 10.4 9.2 1.2 1.1 11.8 12.0 0.9 0.8
Stock WStock WStock WStock WStock Watch |atch |atch |atch |atch | November 2015
18May 2011 Please refer to important disclosures at the end of this report.
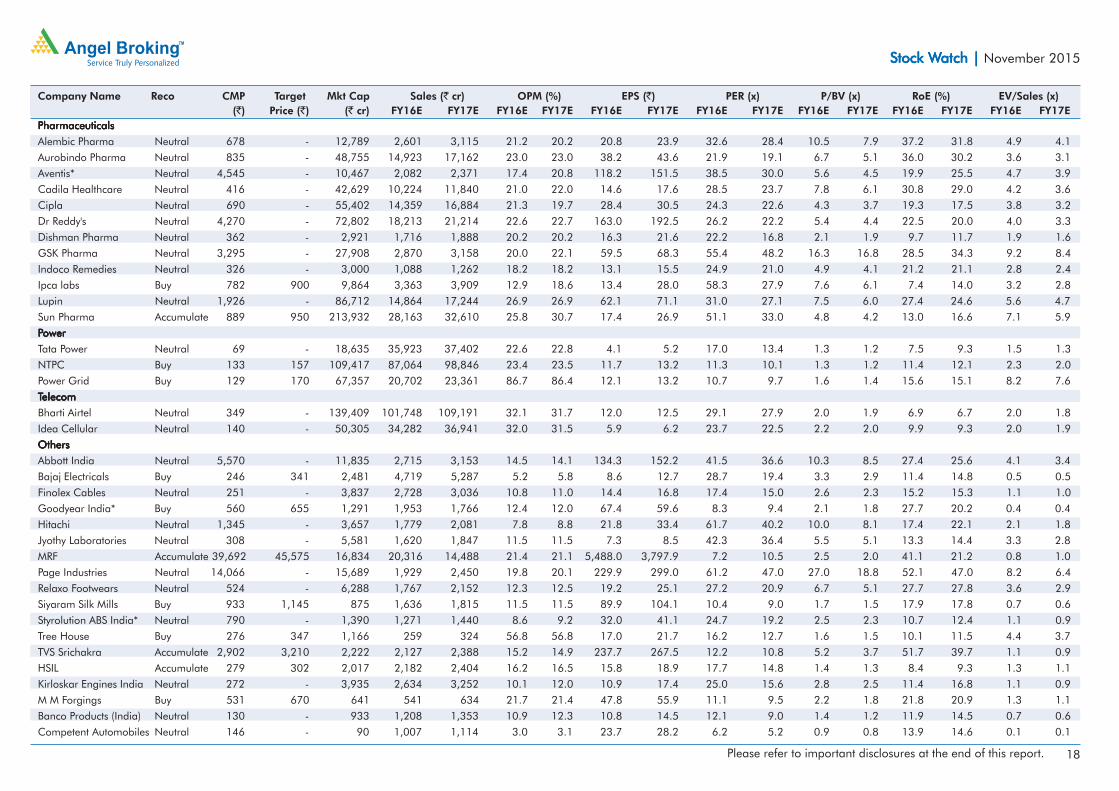
Company Name Reco CMP Target Mkt Cap Sales (` cr) OPM (%) EPS (`) PER (x) P/BV (x) RoE (%) EV/Sales (x) (`) Price (`) (` cr) FY16E FY17E FY16E FY17E FY16E FY17E FY16E FY17E FY16E FY17E FY16E FY17E FY16E FY17E
PharmaceuticalsPharmaceuticalsPharmaceuticalsPharmaceuticalsPharmaceuticals
Alembic Pharma Neutral 678 - 12,789 2,601 3,115 21.2 20.2 20.8 23.9 32.6 28.4 10.5 7.9 37.2 31.8 4.9 4.1
Aurobindo Pharma Neutral 835 - 48,755 14,923 17,162 23.0 23.0 38.2 43.6 21.9 19.1 6.7 5.1 36.0 30.2 3.6 3.1
Aventis* Neutral 4,545 - 10,467 2,082 2,371 17.4 20.8 118.2 151.5 38.5 30.0 5.6 4.5 19.9 25.5 4.7 3.9
Cadila Healthcare Neutral 416 - 42,629 10,224 11,840 21.0 22.0 14.6 17.6 28.5 23.7 7.8 6.1 30.8 29.0 4.2 3.6
Cipla Neutral 690 - 55,402 14,359 16,884 21.3 19.7 28.4 30.5 24.3 22.6 4.3 3.7 19.3 17.5 3.8 3.2
Dr Reddy's Neutral 4,270 - 72,802 18,213 21,214 22.6 22.7 163.0 192.5 26.2 22.2 5.4 4.4 22.5 20.0 4.0 3.3
Dishman Pharma Neutral 362 - 2,921 1,716 1,888 20.2 20.2 16.3 21.6 22.2 16.8 2.1 1.9 9.7 11.7 1.9 1.6
GSK Pharma Neutral 3,295 - 27,908 2,870 3,158 20.0 22.1 59.5 68.3 55.4 48.2 16.3 16.8 28.5 34.3 9.2 8.4
Indoco Remedies Neutral 326 - 3,000 1,088 1,262 18.2 18.2 13.1 15.5 24.9 21.0 4.9 4.1 21.2 21.1 2.8 2.4
Ipca labs Buy 782 900 9,864 3,363 3,909 12.9 18.6 13.4 28.0 58.3 27.9 7.6 6.1 7.4 14.0 3.2 2.8
Lupin Neutral 1,926 - 86,712 14,864 17,244 26.9 26.9 62.1 71.1 31.0 27.1 7.5 6.0 27.4 24.6 5.6 4.7
Sun Pharma Accumulate 889 950 213,932 28,163 32,610 25.8 30.7 17.4 26.9 51.1 33.0 4.8 4.2 13.0 16.6 7.1 5.9
PPPPPowerowerowerowerower
Tata Power Neutral 69 - 18,635 35,923 37,402 22.6 22.8 4.1 5.2 17.0 13.4 1.3 1.2 7.5 9.3 1.5 1.3
NTPC Buy 133 157 109,417 87,064 98,846 23.4 23.5 11.7 13.2 11.3 10.1 1.3 1.2 11.4 12.1 2.3 2.0
Power Grid Buy 129 170 67,357 20,702 23,361 86.7 86.4 12.1 13.2 10.7 9.7 1.6 1.4 15.6 15.1 8.2 7.6
TTTTTelecomelecomelecomelecomelecom
Bharti Airtel Neutral 349 - 139,409 101,748 109,191 32.1 31.7 12.0 12.5 29.1 27.9 2.0 1.9 6.9 6.7 2.0 1.8
Idea Cellular Neutral 140 - 50,305 34,282 36,941 32.0 31.5 5.9 6.2 23.7 22.5 2.2 2.0 9.9 9.3 2.0 1.9
OthersOthersOthersOthersOthers
Abbott India Neutral 5,570 - 11,835 2,715 3,153 14.5 14.1 134.3 152.2 41.5 36.6 10.3 8.5 27.4 25.6 4.1 3.4
Bajaj Electricals Buy 246 341 2,481 4,719 5,287 5.2 5.8 8.6 12.7 28.7 19.4 3.3 2.9 11.4 14.8 0.5 0.5
Finolex Cables Neutral 251 - 3,837 2,728 3,036 10.8 11.0 14.4 16.8 17.4 15.0 2.6 2.3 15.2 15.3 1.1 1.0
Goodyear India* Buy 560 655 1,291 1,953 1,766 12.4 12.0 67.4 59.6 8.3 9.4 2.1 1.8 27.7 20.2 0.4 0.4
Hitachi Neutral 1,345 - 3,657 1,779 2,081 7.8 8.8 21.8 33.4 61.7 40.2 10.0 8.1 17.4 22.1 2.1 1.8
Jyothy Laboratories Neutral 308 - 5,581 1,620 1,847 11.5 11.5 7.3 8.5 42.3 36.4 5.5 5.1 13.3 14.4 3.3 2.8
MRF Accumulate 39,692 45,575 16,834 20,316 14,488 21.4 21.1 5,488.0 3,797.9 7.2 10.5 2.5 2.0 41.1 21.2 0.8 1.0
Page Industries Neutral 14,066 - 15,689 1,929 2,450 19.8 20.1 229.9 299.0 61.2 47.0 27.0 18.8 52.1 47.0 8.2 6.4
Relaxo Footwears Neutral 524 - 6,288 1,767 2,152 12.3 12.5 19.2 25.1 27.2 20.9 6.7 5.1 27.7 27.8 3.6 2.9
Siyaram Silk Mills Buy 933 1,145 875 1,636 1,815 11.5 11.5 89.9 104.1 10.4 9.0 1.7 1.5 17.9 17.8 0.7 0.6
Styrolution ABS India* Neutral 790 - 1,390 1,271 1,440 8.6 9.2 32.0 41.1 24.7 19.2 2.5 2.3 10.7 12.4 1.1 0.9
Tree House Buy 276 347 1,166 259 324 56.8 56.8 17.0 21.7 16.2 12.7 1.6 1.5 10.1 11.5 4.4 3.7
TVS Srichakra Accumulate 2,902 3,210 2,222 2,127 2,388 15.2 14.9 237.7 267.5 12.2 10.8 5.2 3.7 51.7 39.7 1.1 0.9
HSIL Accumulate 279 302 2,017 2,182 2,404 16.2 16.5 15.8 18.9 17.7 14.8 1.4 1.3 8.4 9.3 1.3 1.1
Kirloskar Engines India Neutral 272 - 3,935 2,634 3,252 10.1 12.0 10.9 17.4 25.0 15.6 2.8 2.5 11.4 16.8 1.1 0.9
M M Forgings Buy 531 670 641 541 634 21.7 21.4 47.8 55.9 11.1 9.5 2.2 1.8 21.8 20.9 1.3 1.1
Banco Products (India) Neutral 130 - 933 1,208 1,353 10.9 12.3 10.8 14.5 12.1 9.0 1.4 1.2 11.9 14.5 0.7 0.6
Competent Automobiles Neutral 146 - 90 1,007 1,114 3.0 3.1 23.7 28.2 6.2 5.2 0.9 0.8 13.9 14.6 0.1 0.1
Stock WStock WStock WStock WStock Watch |atch |atch |atch |atch | November 2015
19May 2011 Please refer to important disclosures at the end of this report.
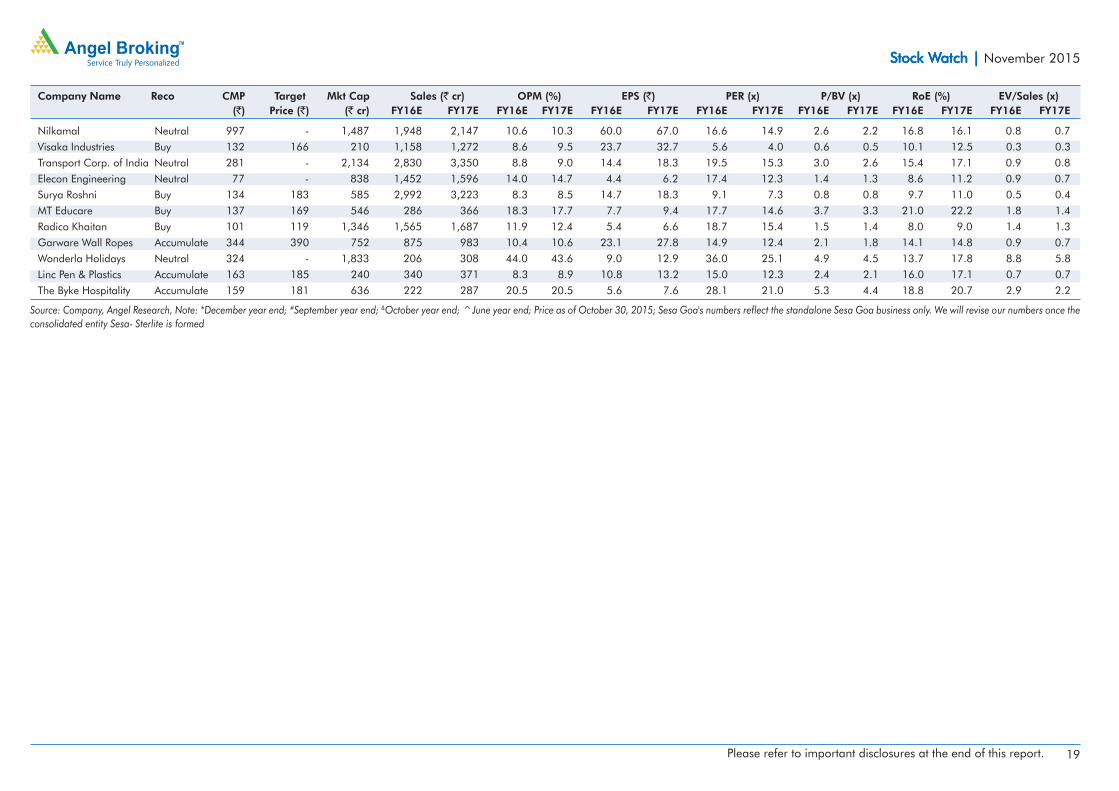
Company Name Reco CMP Target Mkt Cap Sales (` cr) OPM (%) EPS (`) PER (x) P/BV (x) RoE (%) EV/Sales (x) (`) Price (`) (` cr) FY16E FY17E FY16E FY17E FY16E FY17E FY16E FY17E FY16E FY17E FY16E FY17E FY16E FY17E
Source: Company, Angel Research, Note: *December year end; #September year end; &October year end; ^June year end; Price as of October 30, 2015; Sesa Goa's numbers reflect the standalone Sesa Goa business only. We will revise our numbers once theconsolidated entity Sesa- Sterlite is formed
Nilkamal Neutral 997 - 1,487 1,948 2,147 10.6 10.3 60.0 67.0 16.6 14.9 2.6 2.2 16.8 16.1 0.8 0.7
Visaka Industries Buy 132 166 210 1,158 1,272 8.6 9.5 23.7 32.7 5.6 4.0 0.6 0.5 10.1 12.5 0.3 0.3
Transport Corp. of India Neutral 281 - 2,134 2,830 3,350 8.8 9.0 14.4 18.3 19.5 15.3 3.0 2.6 15.4 17.1 0.9 0.8
Elecon Engineering Neutral 77 - 838 1,452 1,596 14.0 14.7 4.4 6.2 17.4 12.3 1.4 1.3 8.6 11.2 0.9 0.7
Surya Roshni Buy 134 183 585 2,992 3,223 8.3 8.5 14.7 18.3 9.1 7.3 0.8 0.8 9.7 11.0 0.5 0.4
MT Educare Buy 137 169 546 286 366 18.3 17.7 7.7 9.4 17.7 14.6 3.7 3.3 21.0 22.2 1.8 1.4
Radico Khaitan Buy 101 119 1,346 1,565 1,687 11.9 12.4 5.4 6.6 18.7 15.4 1.5 1.4 8.0 9.0 1.4 1.3
Garware Wall Ropes Accumulate 344 390 752 875 983 10.4 10.6 23.1 27.8 14.9 12.4 2.1 1.8 14.1 14.8 0.9 0.7
Wonderla Holidays Neutral 324 - 1,833 206 308 44.0 43.6 9.0 12.9 36.0 25.1 4.9 4.5 13.7 17.8 8.8 5.8
Linc Pen & Plastics Accumulate 163 185 240 340 371 8.3 8.9 10.8 13.2 15.0 12.3 2.4 2.1 16.0 17.1 0.7 0.7
The Byke Hospitality Accumulate 159 181 636 222 287 20.5 20.5 5.6 7.6 28.1 21.0 5.3 4.4 18.8 20.7 2.9 2.2
November 2015 Please refer to important disclosures at the end of this report. 21
Market StrategyDiwali Special
Disclaimer
Angel Broking Private Limited (hereinafter referred to as "Angel") is a registered Member of National Stock Exchange of India Limited,Bombay Stock Exchange Limited and Metropolitan Stock Exchange of India Limited. It is also registered as a Depository Participant with CDSLand Portfolio Manager with SEBI. It also has registration with AMFI as a Mutual Fund Distributor. Angel Broking Private Limited is a registeredentity with SEBI for Research Analyst in terms of SEBI (Research Analyst) Regulations, 2014 vide registration number INH000000164. Angelor its associates has not been debarred/ suspended by SEBI or any other regulatory authority for accessing /dealing in securities Market.Angel or its associates including its relatives/analyst do not hold any financial interest/beneficial ownership of more than 1% in the companycovered by Analyst. Angel or its associates/analyst has not received any compensation / managed or co-managed public offering ofsecurities of the company covered by Analyst during the past twelve months. Angel/analyst has not served as an officer, director or employeeof company covered by Analyst and has not been engaged in market making activity of the company covered by Analyst.
This document is solely for the personal information of the recipient, and must not be singularly used as the basis of any investment decision.Nothing in this document should be construed as investment or financial advice. Each recipient of this document should make such investigationsas they deem necessary to arrive at an independent evaluation of an investment in the securities of the companies referred to in thisdocument (including the merits and risks involved), and should consult their own advisors to determine the merits and risks of such aninvestment.
Reports based on technical and derivative analysis center on studying charts of a stock's price movement, outstanding positions and tradingvolume, as opposed to focusing on a company's fundamentals and, as such, may not match with a report on a company's fundamentals.
The information in this document has been printed on the basis of publicly available information, internal data and other reliable sourcesbelieved to be true, but we do not represent that it is accurate or complete and it should not be relied on as such, as this document is forgeneral guidance only. Angel Broking Pvt. Limited or any of its affiliates/ group companies shall not be in any way responsible for any lossor damage that may arise to any person from any inadvertent error in the information contained in this report. Angel Broking Pvt. Limitedhas not independently verified all the information contained within this document. Accordingly, we cannot testify, nor make any representationor warranty, express or implied, to the accuracy, contents or data contained within this document. While Angel Broking Pvt. Limited endeavorsto update on a reasonable basis the information discussed in this material, there may be regulatory, compliance, or other reasons thatprevent us from doing so.
This document is being supplied to you solely for your information, and its contents, information or data may not be reproduced, redistributedor passed on, directly or indirectly.
Neither Angel Broking Pvt. Limited, nor its directors, employees or affiliates shall be liable for any loss or damage that may arise from or inconnection with the use of this information.
Note: Note: Note: Note: Note: Please refer to the important 'Stock Holding Disclosure' report on the Angel website (Research Section). Also, please refer to the latestupdate on respective stocks for the disclosure status in respect of those stocks. Angel Broking Pvt. Limited and its affiliates may haveinvestment positions in the stocks recommended in this report.
Buy (> 15%) Accumulate (5% to 15%) Neutral (-5 to 5%)Reduce (-5% to -15%) Sell (< -15%)
Ratings (Returns) :

CSO & Registered Office: G-1, Ackruti Trade Centre, Rd. No. 7, MIDC, Andheri (E), Mumbai - 400 093.Tel.: (022) 3083 7700. Angel Broking Pvt. Ltd: BSE Sebi Regn No: INB010996539 / PMS Regd Code: PM/INP000001546 / CDSL Regn No: IN - DP - CDSL - 234 - 2004 / NSE Sebi Regn Nos: Cash: INB231279838 / NSE F&O: INF231279838/Currency: INE231279838 / MCX Currency Sebi Regn No: INE261279838 / Member ID: 10500 / Angel Commodities Broking Pvt. Ltd: MCX Member ID: 12685 / FMC Regn No: MCX / TCM / CORP / 0037 NCDEX : Member ID 00220 / FMC Regn No: NCDEX / TCM / CORP / 0302
6th Floor, Ackruti Star, Central Road, MIDC, Andheri (E), Mumbai - 400 093. Tel: (022) 39357800
Research Team
Fundamental:
Sarabjit Kour Nangra VP-Research (Pharmaceutical, IT) [email protected]
Vaibhav Agrawal VP-Research (Banking) [email protected]
Amarjeet Maurya Analyst (FMCG, Media, Mid-Cap) [email protected]
Bharat Gianani Analyst (Automobile) [email protected]
Chintan Shah Analyst (Banking) [email protected]
Milan Desai Analyst (Mid-Cap) [email protected]
Rahul Dholam Analyst (Metal, Oil & Gas, Power) [email protected]
Shrenik Gujrathi Analyst (Cap Goods, Cement) [email protected]
Santosh Yellapu Analyst (Infrastructure) [email protected]
Tejas Vahalia Research Editor [email protected]
Technicals and Derivatives:
Siddarth Bhamre Head – Technical & Derivatives [email protected]
Sameet Chavan Technical Analyst [email protected]
Ruchit Jain Technical Analyst [email protected]
Jay Kumar Purohit Technical Analyst [email protected]
Sneha Seth Associate (Derivatives) [email protected]
Production Team:
Dilip Patel Production Incharge [email protected]