Market snapshot Today’s top research idea
24
Investors are advised to refer through important disclosures made at the last page of the Research Report. Motilal Oswal research is available on www.motilaloswal.com/Institutional-Equities, Bloomberg, Thomson Reuters, Factset and S&P Capital. 20 June 2017 Research Team ([email protected]) Punjab farm loan waiver: CM Amarinder Singh says will waive loans of 8.75 lakh farmers v Punjab farm loan waiver: In a significant move today, Punjab Chief Minister Amarinder Singh announced his government’s decision to waive off the loans of as many as 8.75 lakh farmers. Equities - India Close Chg .% YTD.% Sensex 31,312 0.8 17.6 Nifty-50 9,658 0.7 18.0 Nifty-M 100 17,996 0.0 25.4 Equities-Global Close Chg .% YTD.% S&P 500 2,453 0.8 9.6 Nasdaq 6,239 1.4 15.9 FTSE 100 7,524 0.8 5.3 DAX 12,889 1.1 12.3 Hang Seng 10,521 1.3 12.0 Nikkei 225 20,068 -0.6 5.0 Commodities Close Chg .% YTD.% Brent (US$/Bbl) 46 -0.8 -16.4 Gold ($/OZ) 1,243 -0.8 7.9 Cu (US$/MT) 5,703 1.1 3.3 Almn (US$/MT) 1,875 1.0 10.0 Currency Close Chg .% YTD.% USD/INR 64.4 0.0 -5.2 USD/EUR 1.1 -0.3 6.1 USD/JPY 111.4 0.5 -4.7 YIELD (%) Close 1MChg YTDchg 10 Yrs G-Sec 6.5 0.0 0.0 10 Yrs AAA Corp 7.5 0.0 -0.1 Flows (USD b) 19-Jun MTD YTD FIIs 0.0 0.3 8.1 DIIs 0.1 0.6 2.9 Volumes (INRb) 19-Jun MTD* YTD* Cash 231 263 285 F&O 4,296 4,401 4,755 Note: YTD is calendar year, *Avg Quote of the day Learning to trust is one of life's most difficult tasks Today’s top research idea Market snapshot Cos/Sector Key Highlights Prabhat Dairy (Spotlight) Solid institutional player; Moving toward consumer business Tata Steel Selling Tata Motors’ shares will boost equity value by INR31/share; stake in Tata Sons is worth at least INR135/share Voltas Room AC segment to feel the heat of GST in 1QFY18 Ecoscope Has demonetization led to higher digital payments? Doubtful; ATM cash withdrawals back to pre-demonetization levels Metals Weekly China local steel prices increase, inventories continue to decline Piping hot news Prabhat Dairy: Solid institutional player; Moving toward consumer business Prabhat Dairy is a fully integrated dairy products company. The company sells specialty and co-manufactured products to its institutional customers, as well as branded dairy products. v The consumer branded business (B2C) is expected to account for ~50% of its revenues by 2020 (30% as on FY17), led by Hotels, Restaurants and Caterers (HoReCa), and Retail. v Prabhat targets 80% direct sourcing of milk by FY20 (~70% currently), which should help it source higher volumes of good-quality raw milk. v Utilization at its cheese manufacturing facility is expected to increase from ~20% currently to 80% by FY20. v Over the past 4 years, the company has delivered revenue, EBITDA and PAT CAGR of 22%, 15% and 25%, respectively. The stock trades at 19x FY19E EPS. Research covered Aggregate value of all digital payment transactions didn’t … however, total volume of digital payments has witness any increase post demonetization… stabilized at higher level # Implied savings; Does not include ‘errors & omissions’ Chart of the Day: Has demonetization led to higher digital payments?
Transcript of Market snapshot Today’s top research idea
Investors are advised to refer through important disclosures made at the last page of the Research Report. Motilal Oswal research is available on www.motilaloswal.com/Institutional-Equities, Bloomberg, Thomson Reuters, Factset and S&P Capital.
20 June 2017
Research Team ([email protected])
Punjab farm loan waiver: CM Amarinder Singh says will waive loans of 8.75 lakh farmers v Punjab farm loan waiver: In a significant move today, Punjab Chief Minister
Amarinder Singh announced his government’s decision to waive off the loansof as many as 8.75 lakh farmers.
Equities - India Close Chg .% YTD.% Sensex 31,312 0.8 17.6 Nifty-50 9,658 0.7 18.0 Nifty-M 100 17,996 0.0 25.4 Equities-Global Close Chg .% YTD.% S&P 500 2,453 0.8 9.6 Nasdaq 6,239 1.4 15.9 FTSE 100 7,524 0.8 5.3 DAX 12,889 1.1 12.3 Hang Seng 10,521 1.3 12.0 Nikkei 225 20,068 -0.6 5.0 Commodities Close Chg .% YTD.% Brent (US$/Bbl) 46 -0.8 -16.4Gold ($/OZ) 1,243 -0.8 7.9Cu (US$/MT) 5,703 1.1 3.3Almn (US$/MT) 1,875 1.0 10.0Currency Close Chg .% YTD.% USD/INR 64.4 0.0 -5.2USD/EUR 1.1 -0.3 6.1USD/JPY 111.4 0.5 -4.7YIELD (%) Close 1MChg YTDchg 10 Yrs G-Sec 6.5 0.0 0.0 10 Yrs AAA Corp 7.5 0.0 -0.1Flows (USD b) 19-Jun MTD YTDFIIs 0.0 0.3 8.1DIIs 0.1 0.6 2.9Volumes (INRb) 19-Jun MTD* YTD*Cash 231 263 285F&O 4,296 4,401 4,755Note: YTD is calendar year, *Avg
Quote of the day Learning to trust is one of life's most difficult tasks
Today’s top research idea Market snapshot
Cos/Sector Key Highlights Prabhat Dairy (Spotlight) Solid institutional player; Moving toward consumer business
Tata Steel Selling Tata Motors’ shares will boost equity value by INR31/share; stake in Tata Sons is worth at least INR135/share
Voltas Room AC segment to feel the heat of GST in 1QFY18
Ecoscope Has demonetization led to higher digital payments? Doubtful; ATM cash withdrawals back to pre-demonetization levels
Metals Weekly China local steel prices increase, inventories continue to decline
Piping hot news
Prabhat Dairy: Solid institutional player; Moving toward consumer business Prabhat Dairy is a fully integrated dairy products company. The company sells specialty and co-manufactured products to its institutional customers, as well as branded dairy products. v The consumer branded business (B2C) is expected to account for ~50% of its
revenues by 2020 (30% as on FY17), led by Hotels, Restaurants and Caterers(HoReCa), and Retail.
v Prabhat targets 80% direct sourcing of milk by FY20 (~70% currently), whichshould help it source higher volumes of good-quality raw milk.
v Utilization at its cheese manufacturing facility is expected to increase from~20% currently to 80% by FY20.
v Over the past 4 years, the company has delivered revenue, EBITDA and PATCAGR of 22%, 15% and 25%, respectively. The stock trades at 19x FY19E EPS.
Research covered
Aggregate value of all digital payment transactions didn’t … however, total volume of digital payments has witness any increase post demonetization… stabilized at higher level
# Implied savings; Does not include ‘errors & omissions’
Chart of the Day: Has demonetization led to higher digital payments?

20 June 2017 2
Tata, Lockheed Martin partner to make F-16s in India Tata Advanced Systems Ltd and US plane maker Lockheed Martin Corp. have signed an agreement to produce F-16 fighters in India ahead of the government’s plan to buy more fighter jets. India is likely to need 200 more fighter planes and has sought proposals for single-engine craft…
IHH Healthcare set to seal deal for Fortis, SRL stake IHH Healthcare Bhd, Asia’s largest private hospital operator, is set to buy a controlling stake in Fortis Healthcare Ltd and SRL Diagnostics from billionaire brothers Malvinder and Shivinder Mohan Singh in a deal that values the two companies at close to $2.9 billion, two people directly aware of the development said. “The final valuation has been agreed upon and an announcement in this regard is expected in the next few weeks,” said one of the two people…
Lanco Infratech first from 'Blacklist' to face bankruptcy action Lanco Infratech, the power and roads builder, became the first company to face bankruptcy proceedings among the dozen identified by the regulator as IDBI BankBSE -3.06 % has decided to recover its dues by taking the resolution to insolvency courts as per media sources…
Qatar says it will not negotiate unless neighbours lift "blockade" Qatar will not negotiate with its neighbours to resolve the Gulf diplomatic dispute unless they first lift the trade and travel boycott they imposed two weeks ago, its foreign minister said.…
Niti Aayog urges government to link financial grant to states' agriculture reforms Official think tank Niti Aayog has urged the government to link part of the financial grant given to states under Rashtriya Krishi Vikas Yojana to agriculture reforms implemented by the states, an official said. Such a move will compel states to bring about significant changes in the agriculture marketing and other reforms …
Chinese companies eye infrastructure investments in India Attracted by India’s infrastructure development programme, state-run Chinese firms, including China Harbour Engineering Co. Ltd and China Datang Corp. (CDC), are looking to buy Indian companies in the engineering, procurement, construction (EPC) and power generation space...
Boeing gets 3-year Navy deal for maintenance of P-8I fleet US aircraft manufacturer Boeing has received a three-year contract for continuing its support for maintenance of the Indian Navy’s fleet of P-8I maritime patrol aircraft, the company said today…
Kindly click on textbox for the detailed news link
In the news today
2
5
6 7
4
1
3
20 June 2017 3
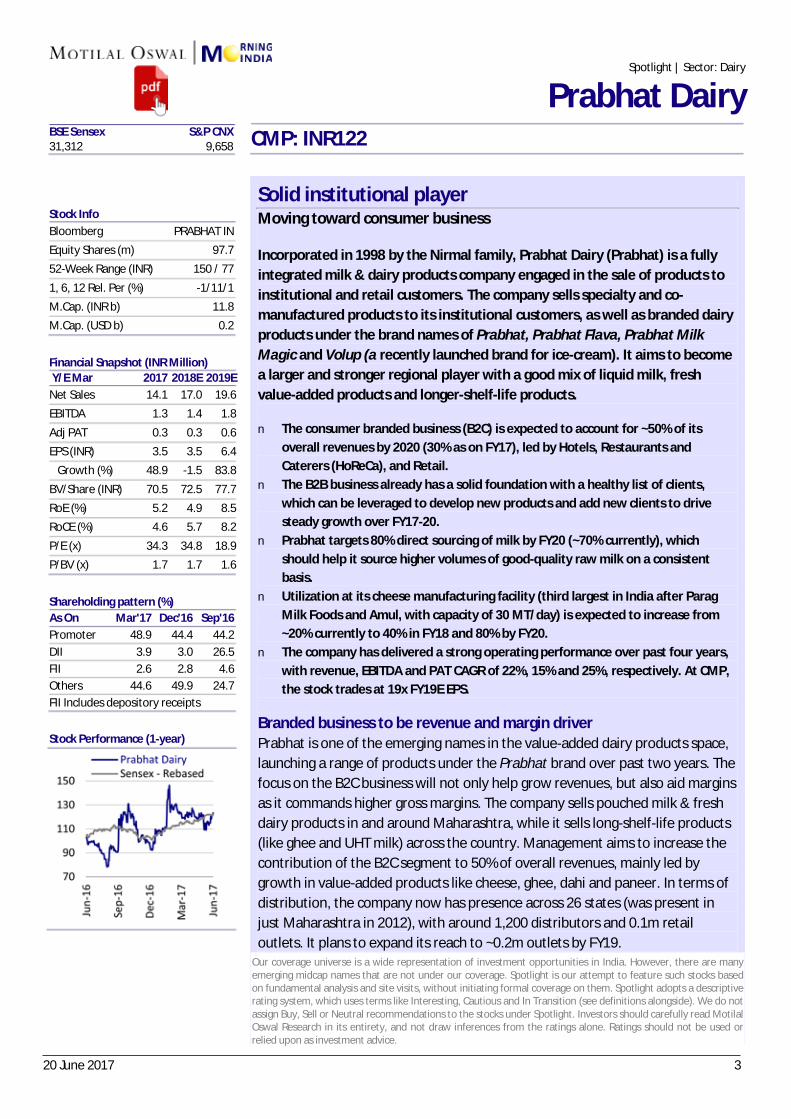
Solid institutional player Moving toward consumer business
Incorporated in 1998 by the Nirmal family, Prabhat Dairy (Prabhat) is a fully integrated milk & dairy products company engaged in the sale of products to institutional and retail customers. The company sells specialty and co-manufactured products to its institutional customers, as well as branded dairy products under the brand names of Prabhat, Prabhat Flava, Prabhat Milk Magic and Volup (a recently launched brand for ice-cream). It aims to become a larger and stronger regional player with a good mix of liquid milk, fresh value-added products and longer-shelf-life products. n The consumer branded business (B2C) is expected to account for ~50% of its
overall revenues by 2020 (30% as on FY17), led by Hotels, Restaurants and Caterers (HoReCa), and Retail.
n The B2B business already has a solid foundation with a healthy list of clients, which can be leveraged to develop new products and add new clients to drive steady growth over FY17-20.
n Prabhat targets 80% direct sourcing of milk by FY20 (~70% currently), which should help it source higher volumes of good-quality raw milk on a consistent basis.
n Utilization at its cheese manufacturing facility (third largest in India after Parag Milk Foods and Amul, with capacity of 30 MT/day) is expected to increase from ~20% currently to 40% in FY18 and 80% by FY20.
n The company has delivered a strong operating performance over past four years, with revenue, EBITDA and PAT CAGR of 22%, 15% and 25%, respectively. At CMP, the stock trades at 19x FY19E EPS.
Branded business to be revenue and margin driver Prabhat is one of the emerging names in the value-added dairy products space, launching a range of products under the Prabhat brand over past two years. The focus on the B2C business will not only help grow revenues, but also aid margins as it commands higher gross margins. The company sells pouched milk & fresh dairy products in and around Maharashtra, while it sells long-shelf-life products (like ghee and UHT milk) across the country. Management aims to increase the contribution of the B2C segment to 50% of overall revenues, mainly led by growth in value-added products like cheese, ghee, dahi and paneer. In terms of distribution, the company now has presence across 26 states (was present in just Maharashtra in 2012), with around 1,200 distributors and 0.1m retail outlets. It plans to expand its reach to ~0.2m outlets by FY19.
Spotlight | Sector: Dairy
Prabhat Dairy CMP: INR122
BSE Sensex S&P CNX 31,312 9,658
Stock Info Bloomberg PRABHAT IN Equity Shares (m) 97.7 52-Week Range (INR) 150 / 77
1, 6, 12 Rel. Per (%) -1/11/1 M.Cap. (INR b) 11.8 M.Cap. (USD b) 0.2
Financial Snapshot (INR Million) Y/E Mar 2017 2018E 2019E Net Sales 14.1 17.0 19.6 EBITDA 1.3 1.4 1.8
Adj PAT 0.3 0.3 0.6 EPS (INR) 3.5 3.5 6.4 Growth (%) 48.9 -1.5 83.8
BV/Share (INR) 70.5 72.5 77.7 RoE (%) 5.2 4.9 8.5 RoCE (%) 4.6 5.7 8.2
P/E (x) 34.3 34.8 18.9 P/BV (x) 1.7 1.7 1.6
Shareholding pattern (%) As On Mar'17 Dec'16 Sep'16 Promoter 48.9 44.4 44.2 DII 3.9 3.0 26.5 FII 2.6 2.8 4.6 Others 44.6 49.9 24.7 FII Includes depository receipts
Stock Performance (1-year)
Our coverage universe is a wide representation of investment opportunities in India. However, there are many emerging midcap names that are not under our coverage. Spotlight is our attempt to feature such stocks based on fundamental analysis and site visits, without initiating formal coverage on them. Spotlight adopts a descriptive rating system, which uses terms like Interesting, Cautious and In Transition (see definitions alongside). We do not assign Buy, Sell or Neutral recommendations to the stocks under Spotlight. Investors should carefully read Motilal Oswal Research in its entirety, and not draw inferences from the ratings alone. Ratings should not be used or relied upon as investment advice.

20 June 2017 4
Stable institutional business The institutional business contributes ~70% of revenues (as of FY17). State-of-art manufacturing facilities, strict quality control & food standards and a marquee list of clients have helped the business grow impressively in the past. Apart from developing products for its existing clients, the company has also struck deals with many new customers in India and globally. As majority of its clients operate on a cost-plus model, the business is somewhat immune to fluctuations in milk prices.
Expansion of direct milk procurement network Prabhat currently procures ~9llpd of milk, which management expects to increase to 14llpd by FY20. Around 60% of milk is sourced from milk-rich Ahmednagar, while the rest is sourced from Pune, Nashik and adjoining districts in Maharashtra. Five years back, it procured >90% of its milk requirement directly from agents. However, it now sources 70% of milk directly from ~85,000 farmers across ~1,700 villages twice a day (i.e. >700 procurement cycles a year). The company is targeting to increase the proportion of direct sourcing to 80% by FY20, which will help it get higher volumes of milk for use in value-added products. We believe that it is logical for Prabhat to have some portion of procurement from agents, given the sizable portion of its B2B business.
Improving capacity utilization and operational efficiencies We believe capacity utilization will improve but only gradually over next few years, aided by demand growth and distribution expansion. Prabhat expects to increase utilization at its recently set-up cheese manufacturing facility (capacity of 30MT/day) from 20% currently to around 40% by FY18, led by higher sales to the HoReCa and QSR segments, as well as exports. Gradual improvement in utilization, coupled with operational efficiencies from the cogeneration plant, will aid margins in the near term, in our view.
Expect RoCE to improve with no major capex over next 2-3 years The company has delivered a strong operating performance over past four years, with revenue, EBITDA and PAT CAGR of 22%, 15% and 25%, respectively. Management aims to exceed revenue of INR20b by FY20, led by growth in fresh and long-shelf-life value-added products. This would only be possible with an increase in milk procurement, distribution expansion and brand-building initiatives. Increased contribution of higher-margin B2C products to the portfolio, operating leverage and operational efficiencies are expected to lead to EBITDA margin expansion to 10% by FY20, from 9% in FY17. We, however, believe that EBITDA margin expansion could be somewhat restricted due to higher spending toward the B2C business. Management has guided for lower capex and a further reduction in debt over next 2-3 years. We believe that these initiatives will help to gradually improve RoE and RoCE over FY17-FY20 to 11.9% and 10.8%, respectively. Net working capital days are expected to remain in the range of 80-85, as (1) inventory days will increase with better cheese salience (cheese needs ageing before being sold), (2) debtor days will decline with improved B2C salience (has lower receivable days compared to B2B) and (2) creditor days are unlikely to see any major change from current levels.

20 June 2017 5
BSE SENSEX S&P CNX CMP: INR502 TP: INR451 (-10%) Sell 31,056 9,588
Stock Info Bloomberg TATA IN Equity Shares (m) 971.4 52-Week Range (INR) 520 / 297 1, 6, 12 Rel. Per (%) 8/4/35 M.Cap. (INR b) 444 M.Cap. (USD b) 6.9 Avg Val ( INRm) 2863 Free float (%) 68.7 Financials Snapshot (INR b) Y/E Mar 2017 2018E 2019E Sales 1,135 1,220 1,232 EBITDA 168 185 203 Adj. PAT 36 49 65 Adj. EPS (INR) 37.0 50.2 66.5 EPS Gr(%) 382.0 35.7 32.5 BV/Sh. (INR) 330 362 418 RoE (%) 15.4 14.5 17.1 RoCE (%) 9.2 9.7 10.4 P/E (x) 12.4 9.1 6.9 P/BV 1.4 1.3 1.1 Shareholding pattern (%) As On Mar-17 Dec-16 Mar-16 Promoter 31.4 31.4 31.4 DII 30.6 30.8 26.7 FII 14.1 13.1 13.2 Others 23.9 24.8 28.8 FII Includes depository receipts Stock Performance (1-year)
Selling Tata Motors’ shares will boost equity value by INR31/share; stake in Tata Sons is worth at least INR135/share
n Tata Steel will be selling 83.64m shares in Tata Motors, a group company, to
Tata Sons in a related party transaction at prevailing market price on or after 23 June 2017. This will unlock value of INR38b @INR455/share and help in reduction of debt and/or fund GBP550m expected payout toward de-risking of British Pension Scheme.
n This will unlock the equity value for Tata Steel equivalent to INR7.6b, a 20% holding company discount, and boost recurring free cash flow by INR2.3b, assuming marginal interest cost of 8% and marginal cash tax rate of 25%. At 10x FCF, value accretion will be INR23b from savings in interest cost. Thus, a total of INR30b or about INR31 will eventually get added to the market cap of Tata Steel.
n Although this is the last major investment in listed group companies, Tata Steel holds 12,375 shares, i.e.3.1% stake of Tata Sons. Each share of Tata Sons is worth at least INR11m. This implies a value of INR135/share for Tata Steel. If Tata Sons were to buyback these shares, it will trigger major re-rating for the stock. We have been ignoring this in the valuations because of circular reference.
n Tata Steel had recently reported very strong 4QFY17 results, benefiting from a number of non-sustainable events (e.g. forex gains, very strong ferro-chrome prices, strong steel market driven by monetary expansion in China, delay in coking coal cost at TSE, liquidation of low-cost inventories while market of strong etc.). Since then, steel prices have corrected by USD50-70/t, while raw material costs will be higher at TSE.
n Tata Steel’s business is structurally improving with (1) exit from weak businesses of long products and specialty businesses in Europe, (2) persistence to de-risk British Pension Scheme and (3) growth at highly profitable Indian business. However, volatility in the steel market will hurt its earnings. We have been valuing Tata Steel at INR451 and INR528 based on FY18E and FY19E SOTP, respectively. Value unlocking will boost the target price by INR31/share.
300
350
400
450
500
550
Jun-
16
Sep-
16
Dec-
16
Mar
-17
Jun-
17
Tata SteelSensex - Rebased
20 June 2017
Update | Sector: Metals
Tata Steel

20 June 2017 6
BSE SENSEX S&P CNX CMP: INR474 TP: INR400(-16%) Sell 31,312 9,658
Stock Info Bloomberg VOLT IN Equity Shares (m) 331 52-Week Range (INR) 515 / 287 1, 6, 12 Rel. Per (%) 11/35/31 M.Cap. (INR b) 156.8 M.Cap. (USD b) 2.4 Avg Val, INRm 570 Free float (%) 69.7 Financials Snapshot (INR b) Y/E Mar 2017 2018E 2019E Net Sales 60.3 67.4 75.5 EBITDA 5.8 5.9 6.7 PAT 5.1 5.3 6.0 EPS (INR) 15.5 16.0 18.1 Gr. (%) 30.1 3.6 13.2 BV/Sh (INR) 100.0 111.8 125.2 RoE (%) 18.0 15.1 15.3 RoCE (%) 16.5 15.0 15.1 P/E (x) 30.7 29.6 26.2 P/BV (x) 4.7 4.2 3.8 Shareholding pattern (%) As On Mar-17 Dec-16 Mar-16 Promoter 30.3 30.3 30.3 DII 26.5 27.1 29.2 FII 20.7 22.4 19.5 Others 22.5 20.2 21.1
FII Includes depository receipts Stock Performance (1-year)
Room AC segment to feel the heat of GST in 1QFY18 Market shift toward inverter ACs to be gradual We met management of Voltas (VOLT). Key takeaways: .
GST to impact room AC growth led by dealer destocking/inventory liquidation n Growth in the room air conditioning (AC) segment is expected to be flat YoY in
1QFY18 as dealers avoid fresh buying and resort to destocking/inventory clearance due to the likely implementation of GST in July 2017.
n The key concern for dealers has been claiming excise duty refund post the implementation of GST. There has been a clear preference for cash flows among dealers.
n The month of July is expected to see muted demand due to the onset of monsoon, and a revival is likely during the festive season later this year.
Pricing to remain stable in room ACs; expect margins to sustain at 11-12% n VOLT expects pricing for room ACs to remain stable, with the rise in commodity
prices likely to be offset by INR appreciation. n Post sharp price cuts to promote sales of inverter ACs, LG has reverted back to
normal pricing. n The company expects margins to stabilize at 11-12% over the long term, as
against 14.5% in FY17. Rationalization of margins would be driven by a) high competitive intensity in the industry and b) focus on maintaining market share with an 11-12% margin profile.
n VOLT would prefer to lose market share rather than compromising on margins (11-12%).
n VOLT expects market shift toward inverter ACs to be gradual.
Enters white goods space through JV (Voltas Beko) with Arcelik n VOLT has entered into a joint venture (JV) with Arcelik to foray into the
consumer durables segment. The JV will focus on four product categories: washing machine, refrigerator, dish washer and microwave oven.
n The JV will leverage the marketing, branding and distribution strength of VOLT, whereas Arcelik will bring in its R&D/manufacturing prowess, in addition to a wide product range and global sourcing capabilities.
n Voltas Beko will set up a manufacturing facility in India over the next two years with capex of USD100m.
n Arcelik has signed a non-compete clause of five years.
Qatar forms 50% of international MEP order book (INR18b) n In the MEP segment, Qatar accounts for 50% of the international order book
(INR18b). Execution of orders remains on track despite instability in the region. n Most of the legacy orders are executed, and new orders are bagged at 4-5%
EBIT margins. n Expect ordering for Expo 2020 to begin in FY18; Voltas would participate in
orders with maximum ticket size of INR8b.
250300350400450500550
Jun-
16
Sep-
16
Dec-
16
Mar
-17
Jun-
17
VoltasSensex - Rebased
19 June 2017
Update | Sector: Capital Goods
Voltas

20 June 2017 7
n Domestic ordering activity seems to be improving, as evident from order pick-up in rural electrification and waste water treatment (where it has order backlog of INR15b).
n Ordering in the domestic MEP segment seems to be picking up in the educational, hospitals and metro sectors. VOLT will participate in the Mumbai metro order.
n With legacy orders now completed, the focus would be on improving order inflow in MEP.
Other key highlights n In the air cooler business, VOLT is now the fourth largest player. It has set a
target to be among the top three players in three years. n Air cooler is a 5m unit annual market, with 60-65% of the market dominated by
unorganized players. Implementation of GST will expedite the transition from unorganized to organized trade.
n Agency business remains stable, forming 4-5% of the company’s overall sales. Margins are expected to remain stable at 27-28%.
n Excise benefit for the room AC factory will expire in March 2018. n Window AC market would not be impacted by the unified rating change in FY18. n The company did not participate in the EESL tender for room ACs, as the terms
of the contract were adverse, according to the company. Valuation and view Maintain Sell with TP of INR400: We maintain our Sell rating with a target price of INR400. Our cautious view is driven by: a) threat to margins from intensifying competition in the room AC segment, b) industry convergence toward inverter ACs, where VOLT has a weak share and c) inventory destocking prior to likely GST implementation in July 2017 and rating change in January 2018.
20 June 2017 8
19 June 2017
ECOSCOPE The Economy Observer
Has demonetization led to higher digital payments? Doubtful; ATM cash withdrawals back to pre-demonetization levels
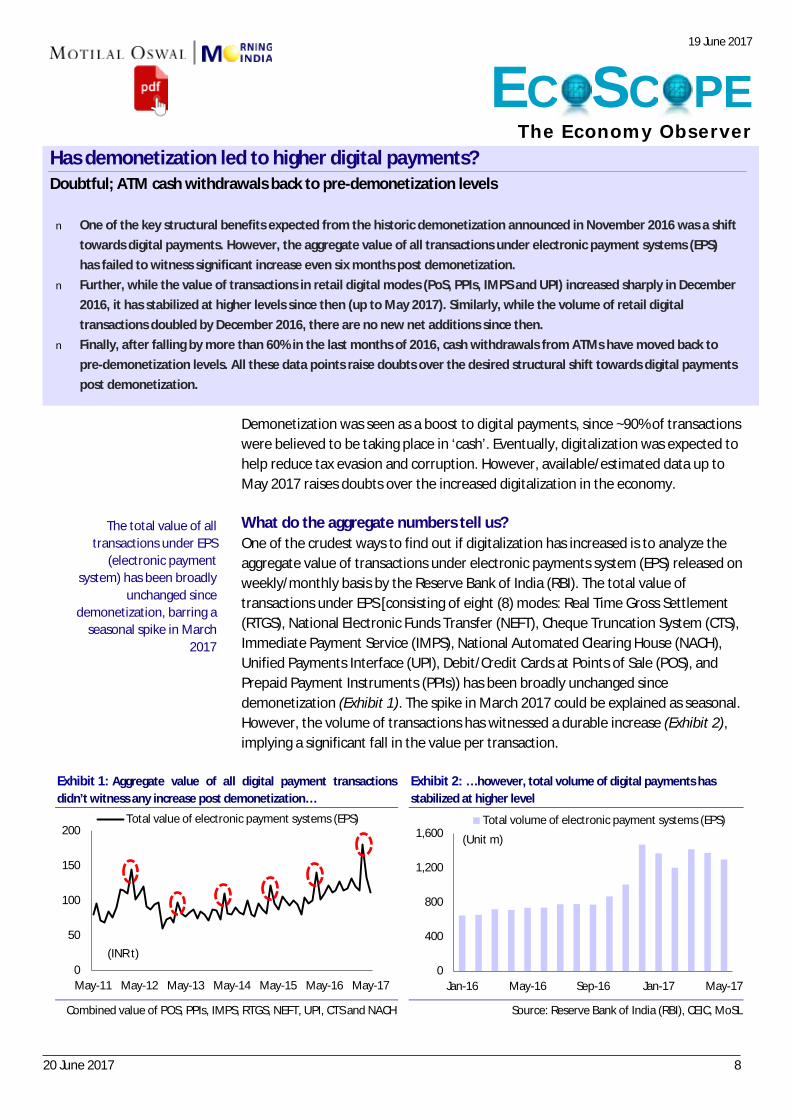
n One of the key structural benefits expected from the historic demonetization announced in November 2016 was a shifttowards digital payments. However, the aggregate value of all transactions under electronic payment systems (EPS)has failed to witness significant increase even six months post demonetization.
n Further, while the value of transactions in retail digital modes (PoS, PPIs, IMPS and UPI) increased sharply in December2016, it has stabilized at higher levels since then (up to May 2017). Similarly, while the volume of retail digitaltransactions doubled by December 2016, there are no new net additions since then.
n Finally, after falling by more than 60% in the last months of 2016, cash withdrawals from ATMs have moved back topre-demonetization levels. All these data points raise doubts over the desired structural shift towards digital paymentspost demonetization.
Demonetization was seen as a boost to digital payments, since ~90% of transactions were believed to be taking place in ‘cash’. Eventually, digitalization was expected to help reduce tax evasion and corruption. However, available/estimated data up to May 2017 raises doubts over the increased digitalization in the economy.
What do the aggregate numbers tell us? One of the crudest ways to find out if digitalization has increased is to analyze the aggregate value of transactions under electronic payments system (EPS) released on weekly/monthly basis by the Reserve Bank of India (RBI). The total value of transactions under EPS [consisting of eight (8) modes: Real Time Gross Settlement (RTGS), National Electronic Funds Transfer (NEFT), Cheque Truncation System (CTS), Immediate Payment Service (IMPS), National Automated Clearing House (NACH), Unified Payments Interface (UPI), Debit/Credit Cards at Points of Sale (POS), and Prepaid Payment Instruments (PPIs)) has been broadly unchanged since demonetization (Exhibit 1). The spike in March 2017 could be explained as seasonal. However, the volume of transactions has witnessed a durable increase (Exhibit 2), implying a significant fall in the value per transaction.
Exhibit 1: Aggregate value of all digital payment transactions didn’t witness any increase post demonetization…
Combined value of POS, PPIs, IMPS, RTGS, NEFT, UPI, CTS and NACH
Exhibit 2: … however, total volume of digital payments has stabilized at higher level
Source: Reserve Bank of India (RBI), CEIC, MoSL
0
50
100
150
200
May-11 May-12 May-13 May-14 May-15 May-16 May-17
Total value of electronic payment systems (EPS)
(INR t) 0
400
800
1,200
1,600
Jan-16 May-16 Sep-16 Jan-17 May-17
Total volume of electronic payment systems (EPS)
(Unit m)
The total value of all transactions under EPS
(electronic payment system) has been broadly
unchanged since demonetization, barring a
seasonal spike in March 2017

20 June 2017 9
China local steel prices increase, inventories continue to decline n Indian steel: Long product (TMT Mumbai) prices were unchanged WoW. Sponge iron prices were up ~1%
WoW, while domestic scrap prices were up ~2% WoW. Domestic iron ore prices were unchanged. Pellet priceswere unchanged. Domestic HRC prices were unchanged WoW.
n Raw materials: Iron ore prices (China cfr) were up ~2% WoW. Thermal coal prices were up ~3% WoW. Cokingcoal prices were down ~4% WoW. China pellet import prices were up ~2% WoW, driving by higher pelletpremiums.
n Europe: HRC prices were unchanged after declining consecutively for last few weeks. EU steel spreads remainsupportive on lower coking coal prices. CIS export HRC prices were up ~1% WoW. Rotterdam scrap priceswere up ~2% WoW.
n China: Local HRC prices were up ~4% WoW, while rebar prices were up ~1% WoW. Steel inventories aredeclining. Export HRC/rebar prices were up ~1% WoW.
n Base metals: Aluminum (cash LME) was down ~2% WoW. Alumina prices were higher. Zinc (cash LME) was up~1% WoW. Lead was down ~1% WoW. Copper was down ~1% WoW. Crude oil (Brent) prices were down ~2%WoW.
Metals Weekly 19 June 2017
STEE
L M
ETAL
LICS
AL
UM
. ZI
NC
COPP
ER
OTH
ERS
MIS
C.

20 June 2017 10
1. VA Tech Wabag: Ambitious plan for Africa & Latin AmericaBIZ; Rajneesh Chopra, global head-business developmentn Successful in bagging first project in Latin America. Domestic market has been
sluggish over last 2 years but exports contributed to 35-40% revenue currentlyand that is expected to go up to 50% of total revenue
n Overall revenue to grow by over 20% over next 2-3 years. Expect margin toimprove, given higher contribution from exports
n Company will decide on fundraising plans in next 2 Q’sn Awaiting for Namami Gange project to take off meaningfully & expect robust
business due to Namami Gange project over next 12-18 months."n VA Tech has received 2 bids for Haridwar & Varanasi in this month, and also has
bid for the initial two projects under Namami Gange project.
2. Removing permit cap for taxis, autos good move fromMaharashtra Govt: Bajaj Auto; RC Maheshwari, President CVbusinessn Good move by Maharashtra government as it will remove a lot of corruption
which will be there in transfer of permits etcn If the permits open up in the next one month's time, they should be able to do
at least about 15,000-20,000 units more in this year
3. Expect revenue to grow by 15% in FY18: BEL; MV Gowtama,CMDn Received an order for 8 lakh electronic voting machine (EVM) worth Rs 1,300
crore from the election commission.n Have manufactured Reliance Defence and Engineering orders and confident that
Reliance Defence will take delivery. Delayed shipment will certainly cause somepressure on margins.
n See lower returns on the equipments, which are supplied to the RelianceDefence.
n Company is negotiating with air force for supply of 7 squadrons of Akash andexpects negotiations to be completed in next two-three months.
4. Price cut will impact 2-3% revenues in non-cotton business:Kaveri Seed; G Vijay Kumar, CFOn Price cut of 10% in Hybrid seeds (except cotton) will impact 2-3% revenues in
the non-cotton seed business. The price cut is also a part of CSR responsibilitytowards the farmers
n Industry is agreed to go for 10% price cut on non-cotton hybrid seed. 75% of thebusiness for Kaveri comes from cotton seed & 25% from non-cotton seedbusiness out of which 50% business is over Sales from vegetable business areexpected to be around Rs 25 crore in FY18, which is a relatively new business.Maize is a big portion of revenues which will be around 23 percent of revenuesthis year
In conversation

20 June 2017 11
1. Farm loan leakages: Aadhaar linkages critical to stop huge theft
n The recent eruptions of farmers’ protests in Madhya Pradesh (MP) and Maharashtra indicate that all is not well on the economic front, especially in agriculture. If this could happen in MP, which claims to have registered the fastest growth in agri-GDP at 9.7% per year during the decade-long period of 2005-06 to 2014-15, then it can happen in any state, any time. MP has been a showcase of BJP’s performance in agriculture. But now it appears that agriculture is going to be the Achilles heel of prime minister Narendra Modi. Its poor performance at an all-India level, at less than 2% per annum, during the Modi period (2014-15 to 2016-17) also exposes chinks in the PM’s armour. Unless addressed quickly, and in a sustained manner, this neglect of agriculture may cost him heavily in 2019. It may turn out to be like the ‘India Shining’ days of NDA-I, while Bharat was whining!
2. Government limitations in job creation n The issue of employment is a subterranean rumble underlying the daily rhetoric
of Indian politics. Frequently, it grows in volume to dominate the discourse. This is such a moment. The Congress reacted to the Narendra Modi government’s completion of three years in office with an attack revolving around its alleged failure to create enough jobs. Bharatiya Janata Party (BJP) president Amit Shah responded with practised whataboutism, noting that if the Congress had paid similar attention to the issue during its time in power, it would not have suffered such electoral reverses over the past few years. This may be true; it is certainly irrelevant. It is an apt time, however, to consider an important question: What effect can the government actually have on job creation? One of Modi’s core campaign promises in the run-up to the 2014 election was creating jobs for the youth. His government has failed to deliver. Comprehensive employment data in India is sadly lacking.
3. A FUNDAMENTAL DISTORTION IN FARM POLICY n Looking at the way the agrarian crisis has built up in different pockets, it does
appear that the overall approach to agriculture is marked by reactive, rather than clear-sighted, proactive thinking. Almost all policies are geared towards ‘price’. It is assumed that getting this right is the panacea for all the problems. It is not surprising that the focus has deflected from enhancing productivity, which is the right answer to most problems in agriculture. First, the concept of minimum support price (MSP) has distorted the market. While MSP is effective for rice and wheat, where there is physical procurement by the FCI, it is only indicative for other crops. Increasing the MSP more to suit the interests of farmers rather than linking it with market dynamics has distorted the pricing system. Hence, when the MSP of soyabean is increased, market prices would increase even if the crop is good, as the MSP sets a benchmark. The MSP hence becomes an income-setter rather than a fair market price. Its contribution to inflation has also been distinct.
From the think tank

20 June 2017 12
4. Employment in India: Why skilling, reskilling the labour force has to be pushed forward
n A comment often made is that while growth has taken place in the economy, there has not been commensurate growth in the jobs created. If this were so, it is a worry because growth without employment is not desirable as it cannot be sustained and the fabled demographic dividend that we speak of can become a demographic liability. Data on employment is sparse and hence it is hard to arrive at absolute numbers, though there are some disparate pockets where such information is available. The concept is nebulous because while it is possible to get information from the organised sector, it is not easy for the unorganised segment where different concepts exist such as usual status, weekly status and so on.
5. Treat local production as deemed exports n Ahead of the rollout of the goods and services tax, the government plans to levy
an import duty of 10% on 4G telecom gear. This is not a good idea. On telecom and information technology goods, Indian policymaking does not happen on a clean slate: it has to abide by or scrap its commitments under the World Trade Organisation’s Information Technology Agreement (ITA) of December 1996. It is true that 4G equipment did not exist in 1996 and is technically outside the ITA-1. India has kept out of ITA-2 of 2015, and there are no legal objections to subjecting 4G gear to customs duties. But there are practical and economic difficulties. It is best to continue with zero import duties on all telecom and IT products while granting deemed export status to all domestic production of such gear. Obsession with customs revenues could scuttle Digital India and its promise of innovation, jobs and prosperity. IT products and components should be as cheap as possible.
International 6. Release big tech’s grip on power n Silicon Valley has dominated recent news, from disgraced Uber chief executive
Travis Kalanick’s leave of absence to work on “Self 2.0”, to the threat of massive antitrust fines against Google in Europe, to Amazon devouring the upmarket grocer Whole Foods.It will this week too, as the leaders of Big Tech gather at the White House for a summit on how private sector technology companies can help government tackle its largest digital dilemmas. The CEOs will give President Donald Trump ideas for how to use Big Data, adopt cloud computing and make procurement more efficient. But our biggest technology conundrum — what to do about the fact that Silicon Valley holds too much economic and political power — isn’t on the agenda.

20 June 2017 13
CMP TP % Upside EPS (INR) P/E (x) P/B (x) ROE (%) Company Reco (INR) (INR) Downside FY17 FY18E FY19E FY17 FY18E FY17 FY18E FY17 FY18E FY19E Automobiles Amara Raja Buy 837 1,044 25 28.0 34.5 41.8 29.9 24.3 5.5 4.7 20.3 20.8 21.2 Ashok Ley. Buy 94 117 24 4.6 5.5 7.1 20.5 17.1 4.5 3.9 23.3 24.4 26.9 Bajaj Auto Buy 2,835 3,422 21 132.3 150.4 178.2 21.4 18.8 4.8 4.3 25.3 24.1 25.6 Bharat Forge Buy 1,182 1,242 5 26.2 37.7 49.7 45.2 31.4 6.7 5.8 16.2 19.9 22.5 Bosch Neutral 24,994 23,287 -7 473.1 650.7 776.2 52.8 38.4 8.7 7.6 15.8 21.2 22.2 CEAT Buy 1,851 1,741 -6 93.3 104.9 133.9 19.8 17.7 3.1 2.7 16.9 16.3 17.9 Eicher Mot. Buy 28,465 30,402 7 613.8 892.0 1,135.1 46.4 31.9 16.1 11.5 40.3 41.9 38.5 Endurance Tech. Buy 931 948 2 23.5 30.8 37.9 39.6 30.2 7.6 6.2 20.8 22.6 23.1 Escorts Neutral 708 711 0 23.2 35.9 44.4 30.5 19.7 3.6 3.1 12.3 16.8 17.9 Exide Ind Buy 226 274 21 8.2 9.5 11.8 27.7 23.9 3.9 3.5 14.0 14.5 15.8 Hero Moto Neutral 3,826 3,622 -5 169.1 198.1 201.2 22.6 19.3 7.6 6.4 35.7 35.9 31.3 M&M Buy 1,386 1,603 16 54.3 69.6 81.7 25.5 19.9 3.2 2.9 14.2 14.2 14.4 Mahindra CIE Not Rated 240 - 5.4 9.9 11.8 44.9 24.4 2.8 2.5 6.4 10.8 11.5 Maruti Suzuki Buy 7,253 8,060 11 248.6 300.0 370.9 29.2 24.2 6.1 5.2 20.3 21.2 22.3 Tata Motors Buy 452 635 40 19.8 30.8 65.8 22.8 14.7 2.6 2.2 9.8 16.5 27.8 TVS Motor Buy 551 581 5 11.7 16.7 26.7 46.9 33.0 10.9 8.6 25.6 29.2 35.9 Aggregate 28.4 21.7 4.9 4.2 17.1 19.3 22.8 Banks - Private Axis Bank Neutral 520 525 1 15.4 23.4 41.2 33.8 22.2 2.3 2.1 6.9 9.9 15.7 DCB Bank Neutral 209 170 -19 7.0 8.8 11.2 29.9 23.8 3.1 2.8 10.9 12.4 14.0 Equitas Hold. Buy 155 210 35 4.7 4.8 7.5 32.9 32.0 2.3 2.2 8.9 7.1 10.1 Federal Bank Buy 119 125 5 4.8 5.8 7.3 24.8 20.7 2.3 2.2 9.9 10.9 12.5 HDFC Bank Buy 1,691 1,790 6 56.8 67.1 79.4 29.8 25.2 5.1 4.4 17.9 18.2 19.0 ICICI Bank Buy 321 365 14 16.8 16.8 19.2 19.1 19.0 2.2 2.0 10.1 9.1 9.8 IDFC Bank Neutral 57 62 8 3.0 3.3 4.3 19.1 17.3 1.3 1.3 7.2 7.4 9.0 IndusInd Buy 1,511 1,700 12 50.1 59.4 72.0 30.2 25.4 4.5 3.9 16.0 16.5 17.3 J&K Bank Neutral 94 89 -5 -31.3 4.4 8.0 NM 21.4 0.9 0.8 -27.0 4.0 7.0 Kotak Mah. Bk Buy 990 1,050 6 26.8 32.3 40.5 36.9 30.7 4.8 4.2 13.8 14.5 15.7 RBL Bank Under Review 509 - 11.9 17.6 23.8 42.8 28.9 4.5 4.0 12.3 14.6 17.3 South Indian Buy 30 31 5 2.2 2.9 3.6 13.6 10.3 1.1 1.1 9.4 10.6 12.2 Yes Bank Buy 1,434 2,110 47 73.0 90.5 114.0 19.7 15.8 3.7 3.1 18.9 17.9 19.4 Aggregate 28.3 22.8 3.2 2.9 11.4 12.9 14.5 Banks - PSU BOB Buy 168 217 29 6.0 19.0 24.9 28.1 8.8 1.1 1.0 4.1 12.3 14.5 BOI Neutral 139 147 6 -14.8 13.7 22.0 NM 10.1 0.6 0.6 -6.7 6.1 9.0 Canara Neutral 356 380 7 18.8 33.0 48.9 18.9 10.8 0.8 0.7 4.2 6.8 9.4 IDBI Bk Neutral 57 49 -13 1.5 6.4 8.6 37.3 8.9 0.5 0.5 1.4 5.8 7.3 Indian Bk Buy 308 360 17 29.3 33.3 38.1 10.5 9.2 1.0 0.9 10.1 10.6 11.1 OBC Neutral 150 150 0 -31.6 17.1 21.4 NM 8.8 0.4 0.4 -8.4 4.6 5.4 PNB Buy 147 184 25 6.2 10.3 14.5 23.7 14.4 0.8 0.8 3.6 5.6 7.5 SBI Buy 289 375 30 0.3 19.7 25.9 953.6 14.6 1.3 1.2 -0.2 8.9 10.7 Union Bk Neutral 152 174 15 7.6 24.6 34.5 19.9 6.2 0.5 0.5 2.7 8.1 10.5 Aggregate 100.6 12.0 0.9 0.9 0.9 7.4 9.3 NBFCs Bajaj Fin. Buy 1,399 1,550 11 33.6 47.0 63.6 41.7 29.8 8.0 6.5 21.7 24.0 26.2 Bharat Fin. Neutral 708 769 9 21.0 32.4 45.3 33.7 21.8 4.0 3.4 15.1 16.7 19.5 Cholaman.Inv.&Fn Buy 1,089 1,250 15 46.0 56.7 70.6 23.7 19.2 4.0 3.4 18.1 19.0 19.9 Dewan Hsg. Buy 458 559 22 29.6 38.6 45.5 15.5 11.9 1.8 1.6 14.4 14.5 15.2 GRUH Fin. Neutral 439 421 -4 8.1 10.3 12.5 54.0 42.8 14.4 12.0 30.4 30.6 30.9 HDFC Buy 1,654 1,797 9 46.8 50.7 55.9 35.3 32.6 6.5 5.9 19.3 18.3 17.4 Indiabulls Hsg Buy 1,130 1,227 9 69.0 82.2 101.6 16.4 13.7 3.9 3.5 25.5 27.0 29.6 LIC Hsg Fin Neutral 774 723 -7 38.2 44.6 51.2 20.2 17.4 3.6 3.1 19.4 19.3 19.0 Manappuram Not Rated 94 - 8.2 11.1 14.0 11.5 8.5 2.6 2.3 23.9 29.0 32.2 M&M Fin. Buy 350 400 14 7.1 12.9 16.4 49.4 27.0 3.1 2.9 6.4 10.9 12.9
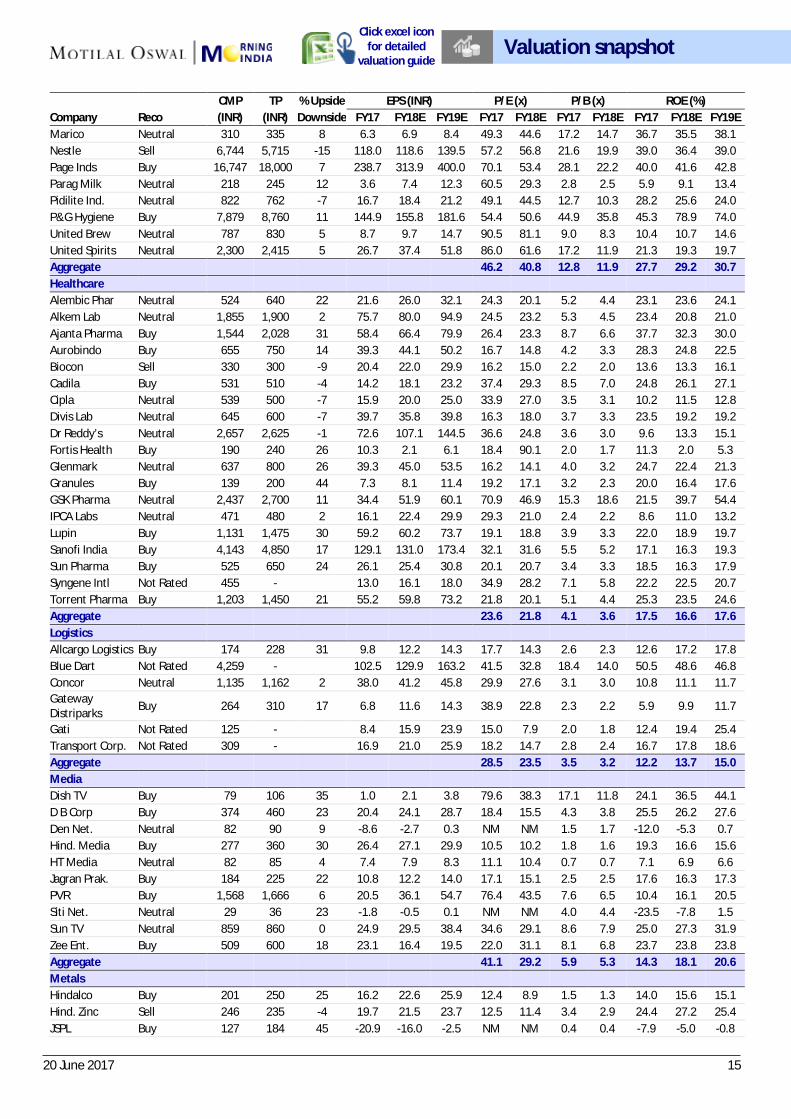
Valuation snapshot Click excel icon
for detailed valuation guide

20 June 2017 14
CMP TP % Upside EPS (INR) P/E (x) P/B (x) ROE (%) Company Reco (INR) (INR) Downside FY17 FY18E FY19E FY17 FY18E FY17 FY18E FY17 FY18E FY19E Muthoot Fin Buy 459 465 1 29.7 34.5 40.0 15.5 13.3 2.9 2.5 19.7 20.2 20.6 PFC Neutral 133 117 -12 25.7 27.2 30.2 5.2 4.9 0.9 0.8 17.9 17.0 16.8 Repco Home Buy 889 900 1 29.1 36.0 43.3 30.5 24.7 4.9 4.1 17.4 18.2 18.5 REC Neutral 189 134 -29 31.4 35.0 40.4 6.0 5.4 1.1 1.0 19.9 19.1 19.1 Shriram City Union Buy 2,432 2,689 11 84.3 130.4 164.7 28.8 18.6 3.2 2.8 11.8 16.2 17.8
STF Buy 996 1,269 27 55.6 77.4 98.6 17.9 12.9 2.0 1.8 11.7 14.5 16.3 Aggregate 19.1 16.4 3.3 2.9 17.2 17.7 17.9 Capital Goods ABB Sell 1,507 1,200 -20 19.7 25.1 32.2 76.5 60.1 9.7 8.4 12.7 13.9 15.8 Bharat Elec. Buy 169 200 19 6.9 7.2 8.1 24.3 23.5 5.0 3.9 20.6 16.5 16.8 BHEL Sell 138 100 -28 2.0 4.4 5.0 68.2 31.6 1.0 1.0 1.5 3.3 3.6 Blue Star Neutral 665 610 -8 12.9 17.9 26.6 51.7 37.1 8.4 7.9 18.0 21.9 30.1 CG Cons. Elec. Buy 220 240 9 4.7 5.6 6.7 47.0 39.5 25.6 18.4 76.4 54.2 50.3 CG Power & Indu. Sell 85 65 -23 4.1 2.3 4.5 20.7 37.1 1.3 1.2 6.2 3.4 4.2 Cummins Neutral 930 950 2 26.5 28.8 35.5 35.1 32.3 6.9 6.4 21.2 20.5 23.2 GE T&D Neutral 345 320 -7 5.7 8.9 10.6 60.1 38.6 8.5 7.5 12.4 20.7 21.5 Havells Neutral 482 480 0 9.6 12.1 14.5 50.5 39.9 9.2 8.1 18.2 20.4 21.4 Inox Wind Under Review 143 - 12.8 -3.2 15.5 11.2 NM 1.5 1.5 14.9 -3.3 15.1 K E C Intl Neutral 252 250 -1 11.9 13.6 16.8 21.3 18.5 4.1 3.5 21.2 20.3 21.2 L&T Buy 1,754 2,000 14 63.3 68.0 78.3 27.7 25.8 3.3 3.2 12.6 12.5 13.6 Pennar Eng. Not Rated 138 - 5.8 7.5 10.0 23.7 18.4 2.0 1.8 8.6 10.0 11.8 Siemens Neutral 1,315 1,355 3 17.8 24.3 33.3 73.8 54.2 6.9 5.9 9.3 11.0 13.7 Solar Ind Neutral 825 825 0 20.6 22.0 27.5 40.0 37.5 7.3 6.3 19.8 18.1 19.5 Suzlon Energy Not Rated 19 - 0.6 0.9 1.0 29.3 21.0 -1.7 -1.8 NM -8.8 -11.0 Thermax Sell 958 850 -11 30.8 32.3 34.0 31.0 29.7 4.2 3.8 14.3 13.6 12.9 Va Tech Wab. Buy 729 800 10 28.9 34.9 39.8 25.2 20.9 4.0 3.5 16.3 17.7 17.5 Voltas Sell 474 400 -16 15.5 16.0 18.1 30.6 29.6 4.7 4.2 18.0 15.1 15.3 Aggregate 34.5 30.8 3.9 3.6 11.2 11.7 12.9 Cement Ambuja Cem. Buy 237 283 19 4.9 6.6 7.2 48.6 35.8 2.4 2.4 5.0 6.7 7.1 ACC Neutral 1,641 1,521 -7 33.7 49.2 63.6 48.6 33.3 3.6 3.7 7.5 11.0 14.2 Birla Corp. Buy 911 998 10 29.4 40.9 58.9 31.0 22.3 2.1 2.0 7.5 9.2 12.2 Dalmia Bharat Buy 2,548 3,162 24 38.8 66.7 87.1 65.7 38.2 4.6 4.1 7.2 11.3 13.1 Grasim Inds. Neutral 1,116 1,234 11 67.9 86.9 114.5 16.4 12.8 1.8 1.6 11.5 13.1 15.1 India Cem Neutral 221 210 -5 5.6 9.3 12.9 39.3 23.7 1.3 1.3 3.4 5.5 7.2 J K Cements Buy 999 1,322 32 33.7 46.4 59.5 29.6 21.5 4.0 3.4 14.4 17.0 18.6 JK Lakshmi Ce Buy 495 550 11 7.0 11.4 20.5 71.1 43.4 4.1 3.8 6.0 9.2 14.7 Ramco Cem Buy 698 823 18 27.3 31.1 37.5 25.6 22.5 4.5 3.9 19.2 18.6 19.1 Orient Cem Buy 150 185 23 -1.6 4.5 6.8 NM 33.2 3.1 2.9 -3.2 9.0 12.3 Prism Cem Buy 115 138 20 0.3 3.7 5.8 330.9 31.0 5.8 5.0 1.8 17.2 22.6 Shree Cem Buy 17,690 23,316 32 384.4 480.7 621.0 46.0 36.8 8.7 7.2 20.2 21.5 22.6 Ultratech Buy 4,096 4,928 20 96.1 121.4 159.1 42.6 33.7 4.9 4.3 12.0 13.6 15.7 Aggregate 36.3 27.2 3.5 3.2 9.7 11.8 13.7 Consumer Asian Paints Neutral 1,154 1,210 5 21.0 23.1 27.4 54.9 49.9 14.6 13.9 28.5 28.6 30.6 Britannia Buy 3,593 4,050 13 73.7 82.1 101.3 48.8 43.8 16.0 14.8 36.9 35.2 37.2 Colgate Buy 1,099 1,180 7 21.2 25.7 31.1 51.8 42.9 23.5 22.2 50.4 53.2 60.3 Dabur Neutral 288 295 3 7.2 7.7 9.1 39.7 37.2 10.4 9.0 28.4 26.0 26.3 Emami Buy 1,116 1,250 12 26.5 29.2 34.7 42.1 38.2 14.4 11.6 35.8 33.8 32.2 Godrej Cons. Neutral 1,883 1,950 4 37.8 43.6 50.0 49.8 43.2 12.1 9.4 24.6 24.5 23.0 GSK Cons. Sell 5,354 4,380 -18 156.1 169.7 185.5 34.3 31.5 7.2 7.1 22.2 22.6 23.0 HUL Buy 1,095 1,215 11 19.6 22.8 27.0 55.8 48.1 35.6 34.5 65.6 72.8 82.5 ITC Buy 310 355 14 8.4 9.6 11.5 37.0 32.4 8.4 8.2 23.5 25.6 28.9 Jyothy Lab Neutral 377 390 4 11.2 8.9 11.0 33.5 42.1 6.3 6.4 21.1 15.1 18.4
Valuation snapshot Click excel icon
for detailed valuation guide
20 June 2017 15
CMP TP % Upside EPS (INR) P/E (x) P/B (x) ROE (%) Company Reco (INR) (INR) Downside FY17 FY18E FY19E FY17 FY18E FY17 FY18E FY17 FY18E FY19E Marico Neutral 310 335 8 6.3 6.9 8.4 49.3 44.6 17.2 14.7 36.7 35.5 38.1 Nestle Sell 6,744 5,715 -15 118.0 118.6 139.5 57.2 56.8 21.6 19.9 39.0 36.4 39.0 Page Inds Buy 16,747 18,000 7 238.7 313.9 400.0 70.1 53.4 28.1 22.2 40.0 41.6 42.8 Parag Milk Neutral 218 245 12 3.6 7.4 12.3 60.5 29.3 2.8 2.5 5.9 9.1 13.4 Pidilite Ind. Neutral 822 762 -7 16.7 18.4 21.2 49.1 44.5 12.7 10.3 28.2 25.6 24.0 P&G Hygiene Buy 7,879 8,760 11 144.9 155.8 181.6 54.4 50.6 44.9 35.8 45.3 78.9 74.0 United Brew Neutral 787 830 5 8.7 9.7 14.7 90.5 81.1 9.0 8.3 10.4 10.7 14.6 United Spirits Neutral 2,300 2,415 5 26.7 37.4 51.8 86.0 61.6 17.2 11.9 21.3 19.3 19.7 Aggregate 46.2 40.8 12.8 11.9 27.7 29.2 30.7 Healthcare Alembic Phar Neutral 524 640 22 21.6 26.0 32.1 24.3 20.1 5.2 4.4 23.1 23.6 24.1 Alkem Lab Neutral 1,855 1,900 2 75.7 80.0 94.9 24.5 23.2 5.3 4.5 23.4 20.8 21.0 Ajanta Pharma Buy 1,544 2,028 31 58.4 66.4 79.9 26.4 23.3 8.7 6.6 37.7 32.3 30.0 Aurobindo Buy 655 750 14 39.3 44.1 50.2 16.7 14.8 4.2 3.3 28.3 24.8 22.5 Biocon Sell 330 300 -9 20.4 22.0 29.9 16.2 15.0 2.2 2.0 13.6 13.3 16.1 Cadila Buy 531 510 -4 14.2 18.1 23.2 37.4 29.3 8.5 7.0 24.8 26.1 27.1 Cipla Neutral 539 500 -7 15.9 20.0 25.0 33.9 27.0 3.5 3.1 10.2 11.5 12.8 Divis Lab Neutral 645 600 -7 39.7 35.8 39.8 16.3 18.0 3.7 3.3 23.5 19.2 19.2 Dr Reddy’s Neutral 2,657 2,625 -1 72.6 107.1 144.5 36.6 24.8 3.6 3.0 9.6 13.3 15.1 Fortis Health Buy 190 240 26 10.3 2.1 6.1 18.4 90.1 2.0 1.7 11.3 2.0 5.3 Glenmark Neutral 637 800 26 39.3 45.0 53.5 16.2 14.1 4.0 3.2 24.7 22.4 21.3 Granules Buy 139 200 44 7.3 8.1 11.4 19.2 17.1 3.2 2.3 20.0 16.4 17.6 GSK Pharma Neutral 2,437 2,700 11 34.4 51.9 60.1 70.9 46.9 15.3 18.6 21.5 39.7 54.4 IPCA Labs Neutral 471 480 2 16.1 22.4 29.9 29.3 21.0 2.4 2.2 8.6 11.0 13.2 Lupin Buy 1,131 1,475 30 59.2 60.2 73.7 19.1 18.8 3.9 3.3 22.0 18.9 19.7 Sanofi India Buy 4,143 4,850 17 129.1 131.0 173.4 32.1 31.6 5.5 5.2 17.1 16.3 19.3 Sun Pharma Buy 525 650 24 26.1 25.4 30.8 20.1 20.7 3.4 3.3 18.5 16.3 17.9 Syngene Intl Not Rated 455 - 13.0 16.1 18.0 34.9 28.2 7.1 5.8 22.2 22.5 20.7 Torrent Pharma Buy 1,203 1,450 21 55.2 59.8 73.2 21.8 20.1 5.1 4.4 25.3 23.5 24.6 Aggregate 23.6 21.8 4.1 3.6 17.5 16.6 17.6 Logistics Allcargo Logistics Buy 174 228 31 9.8 12.2 14.3 17.7 14.3 2.6 2.3 12.6 17.2 17.8 Blue Dart Not Rated 4,259 - 102.5 129.9 163.2 41.5 32.8 18.4 14.0 50.5 48.6 46.8 Concor Neutral 1,135 1,162 2 38.0 41.2 45.8 29.9 27.6 3.1 3.0 10.8 11.1 11.7 Gateway Distriparks Buy 264 310 17 6.8 11.6 14.3 38.9 22.8 2.3 2.2 5.9 9.9 11.7
Gati Not Rated 125 - 8.4 15.9 23.9 15.0 7.9 2.0 1.8 12.4 19.4 25.4 Transport Corp. Not Rated 309 - 16.9 21.0 25.9 18.2 14.7 2.8 2.4 16.7 17.8 18.6 Aggregate 28.5 23.5 3.5 3.2 12.2 13.7 15.0 Media Dish TV Buy 79 106 35 1.0 2.1 3.8 79.6 38.3 17.1 11.8 24.1 36.5 44.1 D B Corp Buy 374 460 23 20.4 24.1 28.7 18.4 15.5 4.3 3.8 25.5 26.2 27.6 Den Net. Neutral 82 90 9 -8.6 -2.7 0.3 NM NM 1.5 1.7 -12.0 -5.3 0.7 Hind. Media Buy 277 360 30 26.4 27.1 29.9 10.5 10.2 1.8 1.6 19.3 16.6 15.6 HT Media Neutral 82 85 4 7.4 7.9 8.3 11.1 10.4 0.7 0.7 7.1 6.9 6.6 Jagran Prak. Buy 184 225 22 10.8 12.2 14.0 17.1 15.1 2.5 2.5 17.6 16.3 17.3 PVR Buy 1,568 1,666 6 20.5 36.1 54.7 76.4 43.5 7.6 6.5 10.4 16.1 20.5 Siti Net. Neutral 29 36 23 -1.8 -0.5 0.1 NM NM 4.0 4.4 -23.5 -7.8 1.5 Sun TV Neutral 859 860 0 24.9 29.5 38.4 34.6 29.1 8.6 7.9 25.0 27.3 31.9 Zee Ent. Buy 509 600 18 23.1 16.4 19.5 22.0 31.1 8.1 6.8 23.7 23.8 23.8 Aggregate 41.1 29.2 5.9 5.3 14.3 18.1 20.6 Metals Hindalco Buy 201 250 25 16.2 22.6 25.9 12.4 8.9 1.5 1.3 14.0 15.6 15.1 Hind. Zinc Sell 246 235 -4 19.7 21.5 23.7 12.5 11.4 3.4 2.9 24.4 27.2 25.4 JSPL Buy 127 184 45 -20.9 -16.0 -2.5 NM NM 0.4 0.4 -7.9 -5.0 -0.8
Valuation snapshot Click excel icon
for detailed valuation guide

20 June 2017 16
CMP TP % Upside EPS (INR) P/E (x) P/B (x) ROE (%) Company Reco (INR) (INR) Downside FY17 FY18E FY19E FY17 FY18E FY17 FY18E FY17 FY18E FY19E JSW Steel Buy 199 241 21 14.8 20.1 22.6 13.5 9.9 2.1 1.8 17.3 19.7 18.8 Nalco Neutral 64 65 1 3.7 3.6 4.0 17.5 18.0 1.2 1.2 7.2 6.7 7.3 NMDC Under Review 113 - 10.0 12.0 12.7 11.4 9.4 1.6 1.5 12.4 14.9 15.7 SAIL Sell 58 30 -48 -6.2 -12.6 0.4 NM NM 0.6 0.8 -6.7 -15.2 0.5 Vedanta Neutral 242 225 -7 15.1 24.5 27.4 16.0 9.9 1.5 1.4 9.7 14.8 15.3 Tata Steel Sell 519 451 -13 37.0 39.5 45.7 14.0 13.2 1.6 1.4 15.4 11.4 12.1 Aggregate 17.0 13.7 1.4 1.3 8.0 9.4 11.8 Oil & Gas BPCL Neutral 667 779 17 72.5 64.5 70.3 9.2 10.3 2.8 2.4 32.4 25.1 23.3 GAIL Sell 381 357 -6 22.6 27.4 31.6 16.9 13.9 1.7 1.6 10.2 11.7 12.5 Gujarat Gas Sell 804 699 -13 20.4 38.5 46.6 39.3 20.9 6.7 5.3 17.8 28.5 27.5 Gujarat St. Pet. Neutral 165 171 4 8.8 11.2 13.4 18.7 14.7 2.1 1.9 11.9 13.7 14.6 HPCL Buy 530 632 19 61.0 45.6 45.8 8.7 11.6 2.7 2.3 32.4 21.2 18.7 IOC Neutral 407 457 12 41.0 41.9 43.3 9.9 9.7 1.9 2.0 22.3 20.2 19.9 IGL Neutral 1,072 1,067 0 43.1 46.7 51.8 24.9 23.0 5.1 4.4 21.0 20.6 19.5 MRPL Neutral 128 124 -3 11.7 12.8 13.3 10.9 10.0 2.2 1.9 24.8 20.5 18.4 Oil India Buy 293 363 24 19.3 34.7 37.4 15.1 8.4 0.8 0.8 5.7 9.3 9.6 ONGC Buy 166 229 38 16.4 20.6 23.9 10.1 8.1 1.0 0.9 10.4 11.7 13.0 PLNG Buy 437 546 25 22.7 26.3 35.9 19.2 16.6 4.0 3.4 23.2 22.4 25.7 Reliance Ind. Neutral 1,409 1,264 -10 106.6 121.7 127.8 13.2 11.6 1.4 1.3 11.9 11.8 11.2 Aggregate 11.8 10.8 1.6 1.5 13.2 13.4 13.4 Retail Jubilant Food Sell 928 680 -27 10.0 12.2 17.9 92.7 76.3 7.6 7.1 8.2 9.3 12.6 Titan Co. Neutral 513 505 -2 9.0 10.3 12.1 56.8 50.0 10.8 9.5 20.6 20.2 20.9 Aggregate 59.9 52.3 10.3 9.2 17.2 17.6 18.5 Technology Cyient Buy 509 620 22 30.6 38.3 44.2 16.6 13.3 2.7 2.4 16.2 17.8 17.9 HCL Tech. Buy 842 960 14 59.8 61.9 67.6 14.1 13.6 3.5 3.5 27.5 25.4 26.0 Hexaware Neutral 249 235 -5 13.7 15.4 16.7 18.2 16.2 4.4 3.9 26.5 25.3 23.5 Infosys Buy 929 1,200 29 62.9 64.7 71.1 14.8 14.4 3.1 2.8 23.3 21.4 21.2 KPIT Tech Neutral 124 150 21 11.9 13.4 15.2 10.4 9.2 1.6 1.3 14.3 15.6 15.2 L&T Infotech Buy 817 850 4 55.5 59.7 65.0 14.7 13.7 5.1 4.0 40.4 32.8 28.3 Mindtree Neutral 516 475 -8 24.9 30.5 36.5 20.7 16.9 3.4 3.1 16.8 18.9 20.5 Mphasis Neutral 591 600 2 38.9 41.7 45.0 15.2 14.2 2.0 2.3 13.2 14.0 15.7 NIIT Tech Neutral 571 470 -18 42.8 42.5 46.1 13.3 13.4 2.1 1.9 16.1 14.8 14.7 Persistent Sys Buy 680 700 3 37.7 43.9 51.4 18.0 15.5 2.8 2.7 17.0 18.1 20.3 Tata Elxsi Buy 1,617 1,607 -1 56.3 68.0 80.4 28.7 23.8 9.0 7.2 37.1 33.7 32.3 TCS Neutral 2,432 2,400 -1 133.4 139.7 149.6 18.2 17.4 5.7 5.9 33.5 32.4 32.3 Tech Mah Buy 389 500 29 30.9 32.3 36.9 12.6 12.0 2.1 1.9 18.4 16.7 17.0 Wipro Neutral 254 250 -2 16.9 17.3 19.1 15.0 14.7 2.4 2.2 16.9 15.5 15.7 Zensar Tech Buy 872 1,020 17 54.9 65.5 76.0 15.9 13.3 2.4 2.1 16.3 17.2 17.4 Aggregate 16.1 15.7 3.7 3.6 23.2 22.6 22.0 Telecom Bharti Airtel Buy 367 430 17 11.1 6.3 11.5 33.0 58.4 2.2 2.1 6.7 3.7 6.4 Bharti Infratel Buy 376 440 17 14.9 17.5 19.9 25.3 21.5 4.5 3.9 16.2 19.4 19.1 Idea Cellular Buy 80 110 38 -1.1 -12.9 -13.6 NM NM 1.2 1.4 -1.6 -20.8 -27.4 Tata Comm Buy 735 811 10 26.0 18.1 36.0 28.3 40.6 13.2 9.9 126.2 27.9 39.1 Aggregate 35.3 165.0 2.4 2.4 6.9 1.5 3.9 Utiltites Coal India Buy 254 316 24 14.9 18.3 20.7 17.0 13.9 6.4 6.4 37.8 46.2 52.1 CESC Buy 899 1,040 16 51.9 73.4 80.6 17.3 12.2 2.0 1.8 11.4 15.5 15.0 JSW Energy Buy 63 88 40 3.9 2.1 1.8 16.3 29.7 1.0 1.0 6.7 3.3 2.8 NTPC Buy 161 198 23 13.0 13.4 16.2 12.4 12.0 1.4 1.3 11.5 10.9 12.3 Power Grid Buy 212 242 14 14.2 17.6 20.5 14.9 12.0 2.3 2.0 16.2 17.5 17.8 Tata Power Sell 78 67 -14 5.2 6.7 7.0 15.1 11.6 1.8 1.6 11.2 14.6 13.6
Valuation snapshot Click excel icon
for detailed valuation guide

20 June 2017 17
CMP TP % Upside EPS (INR) P/E (x) P/B (x) ROE (%) Company Reco (INR) (INR) Downside FY17 FY18E FY19E FY17 FY18E FY17 FY18E FY17 FY18E FY19E Aggregate 14.7 12.8 2.3 2.1 15.3 16.3 17.4 Others Arvind Neutral 380 382 1 12.4 16.6 23.6 30.7 22.8 2.8 2.5 10.3 11.5 14.7 Bata India Under Review 540 - 13.5 15.6 19.3 40.1 34.6 5.3 4.7 13.9 14.5 15.9 Castrol India Buy 412 531 29 13.6 14.6 15.2 30.2 28.3 34.2 30.6 115.2 114.1 106.8 Century Ply. Neutral 302 323 7 8.7 9.8 12.9 34.7 30.7 9.4 7.7 31.1 27.7 29.6 Coromandel Intl Under Review 432 - 16.0 18.3 23.6 27.1 23.6 4.7 4.2 18.2 18.9 21.7 Delta Corp Buy 165 229 39 4.2 5.3 7.1 39.1 31.2 4.1 2.8 11.1 11.3 11.5 Dynamatic Tech Buy 2,570 3,334 30 67.6 112.9 166.7 38.0 22.8 5.2 4.3 15.1 20.7 24.3 Eveready Inds. Buy 347 368 6 12.9 14.4 17.5 26.9 24.0 8.7 7.0 37.7 32.3 31.6 Interglobe Neutral 1,198 1,234 3 46.0 65.6 88.2 26.0 18.3 21.4 19.0 86.2 110.2 129.8 Indo Count Buy 179 229 28 13.0 14.6 17.6 13.8 12.3 4.2 3.1 34.8 28.8 25.9 Info Edge Buy 1,004 1,050 5 15.7 20.3 22.9 64.1 49.6 6.2 5.7 10.2 11.9 12.3 Inox Leisure Sell 287 240 -16 3.3 8.0 12.0 86.0 35.7 5.0 4.4 5.9 12.5 16.2 Jain Irrigation Under Review 107 - 5.5 7.6 10.0 19.4 14.1 1.6 1.6 8.6 11.7 14.8 Just Dial Neutral 407 465 14 17.5 18.5 21.1 23.3 22.0 3.1 2.8 14.8 13.4 13.7 Kaveri Seed Buy 639 653 2 19.1 29.5 36.3 33.5 21.7 4.4 4.7 13.6 20.5 25.4 Kitex Garm. Buy 412 551 34 26.0 31.0 36.7 15.8 13.3 4.3 3.5 29.9 28.7 27.7 Manpasand Buy 795 900 13 12.7 21.0 30.0 62.6 37.8 3.9 3.7 7.3 8.8 13.1 MCX Buy 1,120 1,300 16 24.8 30.5 42.9 45.1 36.7 4.2 4.0 9.9 11.1 14.6 Monsanto Buy 2,864 2,841 -1 72.9 89.3 109.3 39.3 32.1 11.9 11.1 30.4 35.9 39.6 Navneet Education Buy 185 226 22 7.8 9.4 11.3 23.9 19.7 6.0 5.0 26.8 27.8 28.2
PI Inds. Buy 811 952 17 33.4 33.4 38.1 24.3 24.3 6.9 5.6 32.8 25.4 23.8 Piramal Enterp. Buy 2,914 3,044 4 72.6 104.1 144.6 40.1 28.0 3.8 3.5 9.8 13.0 16.4 SRF Buy 1,635 1,816 11 85.9 89.0 111.5 19.0 18.4 3.0 2.7 16.6 15.1 17.0 S H Kelkar Buy 288 367 28 7.2 9.6 12.2 39.7 29.9 5.1 4.6 13.7 16.1 18.2 Symphony Sell 1,282 1,288 0 27.0 35.1 42.9 47.5 36.5 25.8 22.0 56.8 65.0 66.3 TTK Prestige Neutral 6,671 5,281 -21 106.9 137.7 176.0 62.4 48.4 9.9 8.9 16.5 19.4 22.2 V-Guard Neutral 186 167 -10 3.6 4.5 6.0 52.1 41.5 12.4 10.1 27.4 26.9 28.8 Wonderla Buy 377 393 4 7.0 11.9 16.0 54.0 31.6 4.9 4.4 9.5 14.8 17.5
Valuation snapshot Click excel icon
for detailed valuation guide
20 June 2017 18
Company 1 Day (%) 1M (%) 12M (%)
Company 1 Day (%) 1M (%) 12M (%) Automobiles
Capital Goods
Amara Raja -0.4 -6.4 -3.2
ABB -0.3 -1.3 21.7 Ashok Ley. 0.0 10.8 -4.6
Bharat Elec. -0.6 -3.3 33.8
Bajaj Auto 0.9 -4.6 10.0
BHEL -0.3 -15.8 12.9 Bharat Forge -0.1 11.9 61.6
Blue Star -0.8 2.9 54.5
Bosch 2.3 8.5 13.5
CG Cons. Elec. 0.0 -1.2 64.4 CEAT -0.4 4.0 123.0
CG Power & Inds Sol. 2.4 -7.3 13.6
Eicher Mot. -0.9 2.0 51.9
Cummins 1.1 -3.9 16.3 Endurance Tech. -0.6 16.5
GE T&D 2.1 -5.2 -3.5
Escorts -0.2 10.7 301.2
Havells -1.7 -0.5 33.8 Exide Ind 2.0 -4.8 40.8
Inox Wind -0.8 -9.4 -38.4
Hero Moto 1.3 7.1 26.3
K E C Intl -0.9 2.8 85.5 M&M -0.2 4.0 3.3
L&T 1.6 1.7 18.7
Mahindra CIE 0.7 -3.0 25.3
Pennar Eng. 0.4 5.5 -9.0 Maruti Suzuki -0.2 6.9 76.5
Siemens -0.1 -4.4 4.2
Tata Motors -0.7 2.1 -2.4
Solar Ind 0.4 0.2 32.8 TVS Motor 0.2 4.9 88.5
Suzlon Energy -1.1 -9.7 5.4
Banks - Private
Thermax -0.8 -2.5 19.1 Axis Bank 1.9 3.8 -1.3
Va Tech Wab. 2.3 8.6 19.9
DCB Bank -0.5 9.4 112.6
Voltas -3.1 14.0 48.1 Equitas Hold. -0.7 -1.8 -10.7
Cement
Federal Bank -1.3 6.1 106.8
Ambuja Cem. 0.1 -5.5 0.9 HDFC Bank 1.4 8.4 44.7
ACC 0.3 -2.3 5.7
ICICI Bank 1.3 4.4 34.5
Birla Corp. -1.3 18.8 100.0 IDFC Bank -0.4 -5.5 22.0
Dalmia Bharat 3.2 4.9 134.8
IndusInd 0.7 8.8 37.5
Grasim Inds. -0.3 -0.5 28.9 J&K Bank 4.6 10.6 36.9
India Cem 0.5 6.6 112.0
Kotak Mah. Bk 0.5 5.6 32.0
J K Cements -1.3 -10.1 54.2 RBL Bank -1.1 -8.4
JK Lakshmi Ce -0.2 4.8 30.6
South Indian 0.5 13.0 60.5
Ramco Cem 0.6 1.6 27.2 Yes Bank -0.5 0.3 34.0
Orient Cem 0.2 -1.8 -7.9
Banks - PSU
Prism Cem -1.9 -4.5 22.4 BOB 0.0 -10.9 11.5
Shree Cem -0.5 -5.3 28.7
BOI 0.3 -22.4 47.5
Ultratech -0.5 -6.1 24.3 Canara 1.1 -3.1 80.3
Consumer
IDBI Bk -3.1 -17.1 -20.1
Asian Paints 0.8 2.8 15.6 Indian Bk 0.2 -10.7 148.3
Britannia 0.7 0.1 36.1
OBC 0.1 -4.8 50.2
Colgate 0.3 8.3 28.3 PNB 0.0 -5.1 56.0
Dabur -0.5 4.4 -8.7
SBI 0.9 -6.4 35.2
Emami 0.3 0.8 10.1 Union Bk 0.2 -13.0 19.9
Godrej Cons. 0.8 4.7 22.9
NBFCs
GSK Cons. -0.1 1.2 -4.9 Bajaj Fin. -0.5 8.4 86.1
HUL 0.4 8.7 24.3
Bharat Fin. -0.7 1.7 4.9
ITC 1.4 8.6 29.5 Cholaman.Inv.&Fn -0.1 5.2 18.9
Jyothy Lab 0.5 0.9 27.1
Dewan Hsg. 0.9 13.1 127.1
Marico -1.0 0.0 21.3 GRUH Fin. -1.2 10.7 61.6
Nestle -0.2 3.3 4.4
HDFC 0.9 8.7 34.7
Page Inds 1.0 15.3 22.3 Indiabulls Hsg 0.0 8.5 62.4
Parag Milk 0.7 -9.5 -13.5
LIC Hsg Fin -0.5 13.4 63.0
Pidilite Ind. 0.8 7.9 17.0 Manappuram 1.9 5.1 60.9
P&G Hygiene -0.3 3.9 26.4
M&M Fin. 0.3 11.0 13.1
United Brew 0.2 1.6 4.5 Muthoot Fin -2.6 21.1 72.9
United Spirits 0.7 19.7 -6.0
PFC 1.0 -13.8 63.3
Healthcare Repco Home -0.3 17.9 21.3
Alembic Phar 0.3 -12.7 -0.9
REC 1.1 -12.8 131.6
Alkem Lab -1.1 -1.0 34.4 STF 1.3 -0.5 -12.7
Ajanta Pharma -0.6 -7.8 2.9
Shriram City Union -0.8 13.0 44.3
Aurobindo 0.4 9.9 -9.8
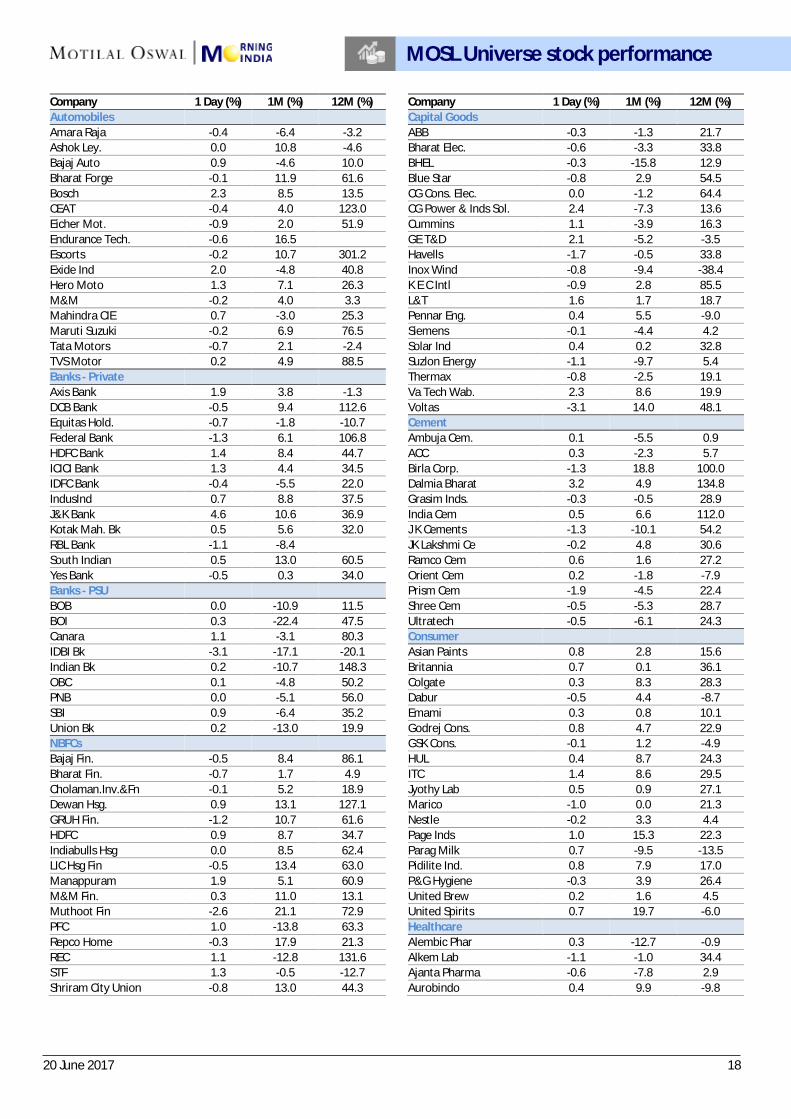
MOSL Universe stock performance
20 June 2017 19
Company 1 Day (%) 1M (%) 12M (%)
Company 1 Day (%) 1M (%) 12M (%) Biocon -2.3 1.2 38.3
Titan Co. -0.5 9.0 36.8
Cadila 1.1 15.6 69.5
Technology Cipla 0.4 -4.3 11.0
Cyient 0.7 -0.6 3.6
Divis Lab 0.5 5.6 -41.9
HCL Tech. 0.4 -0.5 11.9 Dr Reddy’s -0.8 0.0 -11.6
Hexaware -0.9 -1.6 17.1
Fortis Health -0.3 -6.5 17.6
Infosys -1.2 -3.0 -21.1 Glenmark -0.2 -3.5 -15.9
KPIT Tech -0.6 -2.3 -33.1
Granules -1.6 -6.4 0.7
L&T Infotech 1.8 5.7 GSK Pharma -1.0 -0.2 -30.6
Mindtree 0.2 3.9 -18.1
IPCA Labs -0.2 -11.0 -3.5
Mphasis -1.9 1.7 9.1 Lupin 0.0 -14.0 -22.8
NIIT Tech 0.5 14.5 6.3
Sanofi India 2.2 1.8 -1.0
Persistent Sys 2.0 17.9 -0.9 Sun Pharma -0.8 -19.5 -29.3
Tata Elxsi 4.7 4.4 -8.6
Syngene Intl -0.5 -5.9 14.9
TCS 1.4 -3.0 -6.6 Torrent Pharma -0.6 -6.5 -10.5
Tech Mah -0.4 -6.5 -27.4
Logistics
Wipro -0.2 -2.0 -7.9 Allcargo Logistics 0.3 -2.4 6.4
Zensar Tech 0.3 -2.1 -9.4
Blue Dart 1.4 -1.0 -27.1
Telecom Concor -0.1 -5.1 7.0
Bharti Airtel 0.6 -1.5 3.2
Gateway Distriparks 0.1 7.7 -18.1
Bharti Infratel 0.4 -0.7 11.1 Gati 0.0 -7.2 -17.3
Idea Cellular 2.6 -9.2 -21.0
Transport Corp. -0.3 18.4 64.9
Tata Comm -0.2 9.0 63.5 Media
Utiltites
Dish TV -2.0 -20.6 -16.2
Coal India -0.6 -8.3 -19.0 D B Corp 0.1 1.8 0.1
CESC 1.9 2.4 54.6
Den Net. -1.0 -14.0 -7.0
JSW Energy -0.2 -3.1 -25.2 Hind. Media 0.3 0.3 2.3
NTPC 0.2 1.2 5.5
HT Media 1.0 -0.7 5.5
Power Grid 1.4 3.2 35.4 Jagran Prak. -0.1 -1.1 8.5
Tata Power 0.2 -7.4 5.9
PVR 0.6 3.2 64.7
Others Siti Net. -0.8 -7.7 -20.8
Arvind 0.1 0.9 22.9
Sun TV 2.4 0.8 132.3
Bata India 0.2 -1.1 2.1 Zee Ent. 0.1 -0.4 13.1
Castrol India 0.4 -5.6 10.3
Metals
Century Ply. -1.6 18.7 49.0 Hindalco 2.8 5.1 69.4
Coromandel Intl -0.4 5.7 82.6
Hind. Zinc 2.1 -0.1 42.9
Delta Corp -1.6 7.9 91.6 JSPL 2.0 13.7 92.0
Dynamatic Tech 1.0 -6.3 3.9
JSW Steel 2.1 2.9 42.9
Eveready Inds. 1.6 6.5 33.0 Nalco -1.3 -5.0 55.8
Interglobe -0.8 12.6 18.6
NMDC 0.7 -8.2 21.7
Indo Count -1.3 -7.8 -1.4 SAIL 1.3 -4.6 29.0
Info Edge -0.5 18.0 25.1
Vedanta 2.3 5.2 97.7
Inox Leisure 1.4 -0.4 29.5 Tata Steel 3.4 6.1 59.5
Jain Irrigation 0.9 15.7 58.2
Oil & Gas
Just Dial 0.0 -20.2 -38.7 BPCL -0.9 -5.0 32.8
Kaveri Seed -2.6 19.0 42.9
GAIL 0.8 -5.1 31.3
Kitex Garm. 0.2 4.6 -12.3 Gujarat Gas 0.8 2.8 55.4
Manpasand 1.5 0.3 46.5
Gujarat St. Pet. -2.9 -5.2 24.5
MCX 1.2 13.1 12.4 HPCL 0.1 1.7 72.7
Monsanto -2.6 3.0 10.2
IOC 0.5 -6.6 96.9
Navneet Educat. -0.5 13.9 98.3 IGL 0.9 7.2 73.6
PI Inds. -0.3 0.1 19.1
MRPL 0.6 -4.6 96.7
Piramal Enterp. -1.5 2.8 114.5 Oil India -0.7 -7.6 11.5
SRF 0.3 -6.2 30.0
ONGC -0.5 -7.7 18.3
S H Kelkar -1.3 -0.5 35.9 PLNG 2.4 -2.5 53.1
Symphony -0.2 -9.6 6.6
Reliance Ind. 1.5 6.9 44.8
TTK Prestige 0.0 5.0 46.1 Retail
V-Guard 2.7 -8.8 87.1
Jubilant Food -1.0 -8.8 -13.9
Wonderla 0.7 -1.9 -5.8
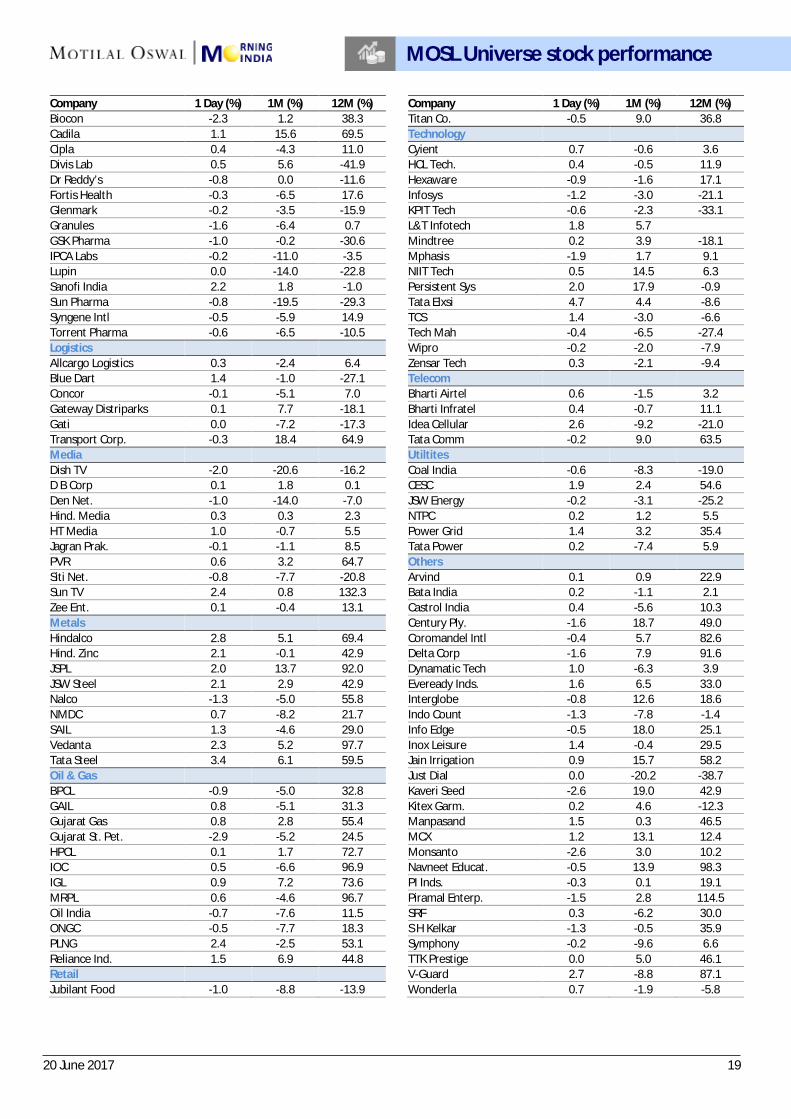
MOSL Universe stock performance

20 June 2017 20
N O T E S

THEMATIC/STRATEGY RESEARCH GALLERY

RECENT INITIATING COVERAGE REPORTS
REPORT GALLERY

DIFFERENTIATED PRODUCT GALLERY

13 December 2016 20
Disclosures This document has been prepared by Motilal Oswal Securities Limited (hereinafter referred to as Most) to provide information about the company (ies) and/sector(s), if any, covered in the report and may be distributed by it and/or its affiliated company(ies). This report is for personal information of the selected recipient/s and does not construe to be any investment, legal or taxation advice to you. This research report does not constitute an offer, invitation or inducement to invest in securities or other investments and Motilal Oswal Securities Limited (hereinafter referred as MOSt) is not soliciting any action based upon it. This report is not for public distribution and has been furnished to you solely for your general information and should not be reproduced or redistributed to any other person in any form. This report does not constitute a personal recommendation or take into account the particular investment objectives, financial situations, or needs of individual clients. Before acting on any advice or recommendation in this material, investors should consider whether it is suitable for their particular circumstances and, if necessary, seek professional advice. The price and value of the investments referred to in this material and the income from them may go down as well as up, and investors may realize losses on any investments. Past performance is not a guide for future performance, future returns are not guaranteed and a loss of original capital may occur.
MOSt and its affiliates are a full-service, integrated investment banking, investment management, brokerage and financing group. We and our affiliates have investment banking and other business relationships with a some companies covered by our Research Department. Our research professionals may provide input into our investment banking and other business selection processes. Investors should assume that MOSt and/or its affiliates are seeking or will seek investment banking or other business from the company or companies that are the subject of this material and that the research professionals who were involved in preparing this material may educate investors on investments in such business . The research professionals responsible for the preparation of this document may interact with trading desk personnel, sales personnel and other parties for the purpose of gathering, applying and interpreting information. Our research professionals are paid on twin parameters of performance & profitability of MOSt. MOSt generally prohibits its analysts, persons reporting to analysts, and members of their households from maintaining a financial interest in the securities or derivatives of any companies that the analysts cover. Additionally, MOSt generally prohibits its analysts and persons reporting to analysts from serving as an officer, director, or advisory board member of any companies that the analysts cover. Our salespeople, traders, and other professionals or affiliates may provide oral or written market commentary or trading strategies to our clients that reflect opinions that are contrary to the opinions expressed herein, and our proprietary trading and investing businesses may make investment decisions that are inconsistent with the recommendations expressed herein. In reviewing these materials, you should be aware that any or all of the foregoingamong other things, may give rise to real or potential conflicts of interest. MOSt and its affiliated company(ies), their directors and employees and their relatives may; (a) from time to time, have a long or short position in, act as principal in, and buy or sell the securities or derivatives thereof of companies mentioned herein. (b) be engaged in any other transaction involving such securities and earn brokerage or other compensation or act as a market maker in the financial instruments of the company(ies) discussed herein or act as an advisor or lender/borrower to such company(ies) or may have any other potential conflict of interests with respect to any recommendation and other related information and opinions.; however the same shall have no bearing whatsoever on the specific recommendations made by the analyst(s), as the recommendations made by the analyst(s) are completely independent of the views of the affiliates of MOSt even though there might exist an inherent conflict of interest in some of the stocks mentioned in the research report Reports based on technical and derivative analysis center on studying charts company's price movement, outstanding positions and trading volume, as opposed to focusing on a company's fundamentals and, as such, may not match with a report on a company's fundamental analysis. In addition MOST has different business segments / Divisions with independent research separated by Chinese walls catering to different set of customers having various objectives, risk profiles, investment horizon, etc, and therefore may at times have different contrary views on stocks sectors and markets.
Unauthorized disclosure, use, dissemination or copying (either whole or partial) of this information, is prohibited. The person accessing this information specifically agrees to exempt MOSt or any of its affiliates or employees from, any and all responsibility/liability arising from such misuse and agrees not to hold MOSt or any of its affiliates or employees responsible for any such misuse and further agrees to hold MOSt or any of its affiliates or employees free and harmless from all losses, costs, damages, expenses that may be suffered by the person accessing this information due to any errors and delays. The information contained herein is based on publicly available data or other sources believed to be reliable. Any statements contained in this report attributed to a third party represent MOSt’s interpretation of the data, information and/or opinions provided by that third party either publicly or through a subscription service, and such use and interpretation have not been reviewed by the third party. This Report is not intended to be a complete statement or summary of the securities, markets or developments referred to in the document. While we would endeavor to update the information herein on reasonable basis, MOSt and/or its affiliates are under no obligation to update the information. Also there may be regulatory, compliance, or other reasons that may prevent MOSt and/or its affiliates from doing so. MOSt or any of its affiliates or employees shall not be in any way responsible and liable for any loss or damage that may arise to any person from any inadvertent error in the information contained in this report. MOSt or any of its affiliates or employees do not provide, at any time, any express or implied warranty of any kind, regarding any matter pertaining to this report, including without limitation the implied warranties of merchantability, fitness for a particular purpose, and non-infringement. The recipients of this report should rely on their own investigations.
This report is intended for distribution to institutional investors. Recipients who are not institutional investors should seek advice of their independent financial advisor prior to taking any investment decision based on this report or for any necessary explanation of its contents.
Most and it’s associates may have managed or co-managed public offering of securities, may have received compensation for investment banking or merchant banking or brokerage services, may have received any compensation for products or services other than investment banking or merchant banking or brokerage services from the subject company in the past 12 months. Most and it’s associates have not received any compensation or other benefits from the subject company or third party in connection with the research report. Subject Company may have been a client of Most or its associates during twelve months preceding the date of distribution of the research report
MOSt and/or its affiliates and/or employees may have interests/positions, financial or otherwise of over 1 % at the end of the month immediately preceding the date of publication of the research in the securities mentioned in this report. To enhance transparency, MOSt has incorporated a Disclosure of Interest Statement in this document. This should, however, not be treated as endorsement of the views expressed in the report.
Motilal Oswal Securities Limited is registered as a Research Analyst under SEBI (Research Analyst) Regulations, 2014. SEBI Reg. No. INH000000412
Pending Regulatory inspections against Motilal Oswal Securities Limited: SEBI pursuant to a complaint from client Shri C.R. Mohanraj alleging unauthorized trading, issued a letter dated 29th April 2014 to MOSL notifying appointment of an Adjudicating Officer as per SEBI regulations to hold inquiry and adjudge violation of SEBI Regulations; MOSL replied to the Show Cause Notice whereby SEBI granted us an opportunity of Inspection of Documents. Since all the documents requested by us were not covered we have requested to SEBI vide our letter dated June 23, 2015 to provide pending list of documents for inspection.
List of associate companies of Motilal Oswal Securities Limited -Click here to access detailed report Analyst Certification The views expressed in this research report accurately reflect the personal views of the analyst(s) about the subject securities or issues, and no part of the compensation of the research analyst(s) was, is, or will be directly or indirectly related to the specific recommendations and views expressed by research analyst(s) in this report. The research analysts, strategists, or research associates principally responsible for preparation of MOSt research receive compensation based upon various factors, including quality of research, investor client feedback, stock picking, competitive factors and firm revenues Disclosure of Interest Statement Companies where there is interest Analyst ownership of the stock No Served as an officer, director or employee No
A graph of daily closing prices of securities is available at www.nseindia.com and http://economictimes.indiatimes.com/markets/stocks/stock-quotes
Regional Disclosures (outside India) This report is not directed or intended for distribution to or use by any person or entity resident in a state, country or any jurisdiction, where such distribution, publication, availability or use would be contrary to law, regulation or which would subject MOSt& its group companies to registration or licensing requirements within such jurisdictions.
For Hong Kong: This report is distributed in Hong Kong by Motilal Oswal capital Markets (Hong Kong) Private Limited, a licensed corporation (CE AYY-301) licensed and regulated by the Hong Kong Securities and Futures Commission (SFC) pursuant to the Securities and Futures Ordinance (Chapter 571 of the Laws of Hong Kong) “SFO”. As per SEBI (Research Analyst Regulations) 2014 Motilal Oswal Securities (SEBI Reg No. INH000000412) has an agreement with Motilal Oswal capital Markets (Hong Kong) Private Limited for distribution of research report in Kong Kong. This report is intended for distribution only to “Professional Investors” as defined in Part I of Schedule 1 to SFO. Any investment or investment activity to which this document relates is only available to professional investor and will be engaged only with professional investors.” Nothing here is an offer or solicitation of these securities, products and services in any jurisdiction where their offer or sale is not qualified or exempt from registration. The Indian Analyst(s) who compile this report is/are not located in Hong Kong & are not conducting Research Analysis in Hong Kong.
For U.S Motilal Oswal Securities Limited (MOSL) is not a registered broker - dealer under the U.S. Securities Exchange Act of 1934, as amended (the"1934 act") and under applicable state laws in the United States. In addition MOSL is not a registered investment adviser under the U.S. Investment Advisers Act of 1940, as amended (the "Advisers Act" and together with the 1934 Act, the "Acts), and under applicable state laws in the United States. Accordingly, in the absence of specific exemption under the Acts, any brokerage and investment services provided by MOSL, including the products and services described herein are not available to or intended for U.S. persons.
This report is intended for distribution only to "Major Institutional Investors" as defined by Rule 15a-6(b)(4) of the Exchange Act and interpretations thereof by SEC (henceforth referred to as "major institutional investors"). This document must not be acted on or relied on by persons who are not major institutional investors. Any investment or investment activity to which this document relates is only available to major institutional investors and will be engaged in only with major institutional investors. In reliance on the exemption from registration provided by Rule 15a-6 of the U.S. Securities Exchange Act of 1934, as amended (the "Exchange Act") and interpretations thereof by the U.S. Securities and Exchange Commission ("SEC") in order to conduct business with Institutional Investors based in the U.S., MOSL has entered into a chaperoning agreement with a U.S. registered broker-dealer, Motilal Oswal Securities International Private Limited. ("MOSIPL"). Any business interaction pursuant to this report will have to be executed within the provisions of this chaperoning agreement.
The Research Analysts contributing to the report may not be registered /qualified as research analyst with FINRA. Such research analyst may not be associated persons of the U.S. registered broker-dealer, MOSIPL, and therefore, may not be subject to NASD rule 2711 and NYSE Rule 472 restrictions on communication with a subject company, public appearances and trading securities held by a research analyst account.
For Singapore Motilal Oswal Capital Markets Singapore Pte Limited is acting as an exempt financial advisor under section 23(1)(f) of the Financial Advisers Act(FAA) read with regulation 17(1)(d) of the Financial Advisors Regulations and is a subsidiary of Motilal Oswal Securities Limited in India. This research is distributed in Singapore by Motilal Oswal Capital Markets Singapore Pte Limited and it is only directed in Singapore to accredited investors, as defined in the Financial Advisers Regulations and the Securities and Futures Act (Chapter 289), as amended from time to time.
In respect of any matter arising from or in connection with the research you could contact the following representatives of Motilal Oswal Capital Markets Singapore Pte Limited: Varun Kumar [email protected] Contact : (+65) 68189232 Office Address:21 (Suite 31),16 CollyerQuay,Singapore 04931
Motilal Oswal Securities Ltd
Motilal Oswal Tower, Level 9, Sayani Road, Prabhadevi, Mumbai 400 025 Phone: +91 22 3982 5500 E-mail: [email protected]