MARKET PULSE Q2’2016 - Nielsen PULSE Q2’2016 ... Country 2015 2016f China 6.9 6.7 ... Impacted...
12
MARKET PULSE Q2’2016 OPPORTUNITIES IN A VOLATILE MARKET
Transcript of MARKET PULSE Q2’2016 - Nielsen PULSE Q2’2016 ... Country 2015 2016f China 6.9 6.7 ... Impacted...

MARKET PULSE Q2’2016
OPPORTUNITIES IN A VOLATILE MARKET

Co
pyr
igh
t ©
2012
Th
e N
iels
en C
om
pan
y. C
on
fid
enti
al a
nd
pro
pri
etar
y.
2
GLOBAL GROWTH REMAINS SLUGGISH, EAST ASIA & PACIFIC IS EXPECTED TO EASE MODESTLY
Note: Europe & Central Asia only includes Developing Countries in the region, Euro Area refers to countries with high income
Source: Global Economic Prospects - World Bank Group (June, 2016)
USA
East Asia & the Pacific 2015 2016f
2.4% 1.9% 2015 2016f
6.5% 6.3%
LAC
2015 2016f
-0.7% -1.3%
MENA
2015 2016f
2.6% 2.9%
2015 2016f
1.6% 1.6%
Euro Area
World: 2.4% (unchanged from 2015)
Country 2015 2016f
China 6.9 6.7
Thailand 2.8 2.5
Indonesia 4.8 5.1
Philippines 5.8 6.4
Vietnam 6.7 6.2 #: Increase vs. 2015
#: Decrease vs. 2015
#: No change vs. 2015
Real GDP % Growth Growth prospects weakened throughout the world economy. World Bank projects global growth for 2016 at 2.4%, unchanged from 2015

Co
pyr
igh
t ©
2012
Th
e N
iels
en C
om
pan
y. C
on
fid
enti
al a
nd
pro
pri
etar
y.
3
MODERATE GROWTH DUE TO IMPACT OF UNFAVORABLE WEATHER CONDITIONS, BUT SERVICE SECTOR IS THE STAR
Source: GSO
6.3 6.7
5.5
0
2
4
6
8
10
H1'15 2015 H1'16
Total GDP
Agri-forestry and fishery
Industry & Construction
Services
GDP % GROWTH Y-O-Y KEY HIGHLIGHTS
INDUSTRY & CONSTRUCTION | 33% GDP Mining industry experienced the deepest plunge
MINING ↓2.2%
driven by CRUDE OIL & NATURAL GAS
↓3.7%
SERVICES | 41% GDP
Services recorded the highest growth in the last 5 years
6.1 6.1
5.8 5.9
6.4
RETAIL & WHOLESALE ↑8.1%
AGRI-FORESTRY & FISHERY | 16% GDP
1st time in many years experienced negative growth (-0.2%) Impacted by the most severe drought in Vietnam in 90 years and salinity intrusion in SCC & MKD.
AGRICULTURAL OUTPUT
↓0.7% vs. YA in H1’16
Forecast: • Rice output ↓1.5% • Rice exports ↓10% • Coffee exports ↓25%
2016 Target: 6.7%

Co
pyr
igh
t ©
2012
Th
e N
iels
en C
om
pan
y. C
on
fid
enti
al a
nd
pro
pri
etar
y.
4
INFLATION SLIGHTLY UP TICKED BUT REMAIN MODERATE
Source: GSO, World Bank (June, 2016)
CPI H1’16
+1.7% vs. YA
6.7
4.8
0.9 1.7
H1'13 H1'14 H1'15 H1'16
Higher CPI growth vs. H1’15 but still low
-9.4
2.5
2.0
2.4
4.1
17.7
1.7
Transportation
Clothes & footware
Food & food stuff
Beverages & Cigarette
Education
Medicine & Healthcare
CPI
Driven by Healthcare & Education fees, while Food & Beverage remain low
Inflation Composition
“CPI inflation is expected to remain moderate mainly due to soft commodity prices and
stay well below 5 percent mark the authorities are aiming for this year”
– World Bank (June, 2016)
6.8 6.0
1.8
0.6
1.7
2012 2013 2014
2015 H1'16

Co
pyr
igh
t ©
2012
Th
e N
iels
en C
om
pan
y. C
on
fid
enti
al a
nd
pro
pri
etar
y.
5
Concern about The state of
Economy jumped +4 pts
vs. last quarter
VIETNAMESE CONSUMERS STILL SHOW POSITIVITY BUT STILL CAUTIOUS
Source: Nielsen Global Survey Consumer Confidence Section (Q1’16), Retailer Sentiment Report Q1’16
104 105 108 109 107
Q2/15 Q3/15 Q4/15 Q1/16 Q2/16
CONSUMER CONFIDENCE INDEX (CCI)
Consumer Confidence Index Calculation • Perceptions of local job prospects • Perceptions of state of personal finances over
the next 12 months • Perceptions of good/bad time for people to buy
the things they want and need over the next 12 months
…BUT THAT DOESN’T MEAN THEY WILL HESITATE TO SPEND
41%
HOLIDAY/ VACATIONS
+5
37%
OUT OF HOME ENTERTAINMENT
+3
*compared versus last quarter
Where do Vietnamese consumers channel their spare cash?
Co
pyr
igh
t ©
2012
Th
e N
iels
en C
om
pan
y. C
on
fid
enti
al a
nd
pro
pri
etar
y.
6
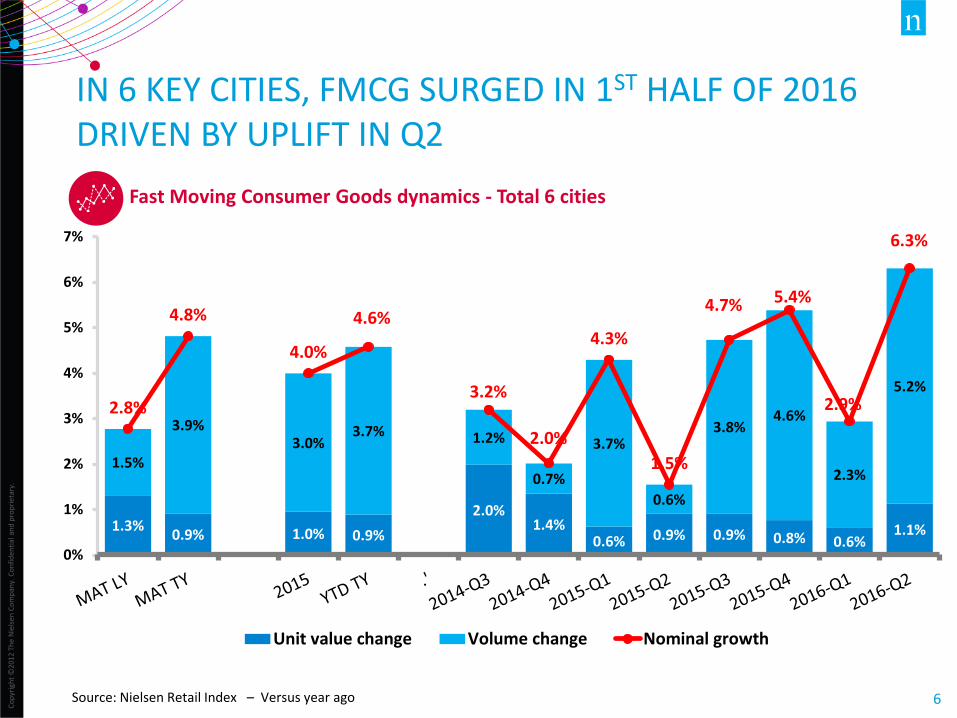
1.3% 0.9% 1.0% 0.9%
2.0% 1.4%
0.6% 0.9% 0.9% 0.8% 0.6% 1.1%
1.5%
3.9% 3.0%
3.7% 1.2%
0.7%
3.7%
0.6%
3.8% 4.6%
2.3%
5.2%
2.8%
4.8%
4.0%
4.6%
3.2%
2.0%
4.3%
1.5%
4.7% 5.4%
2.9%
6.3%
0%
1%
2%
3%
4%
5%
6%
7%
Unit value change Volume change Nominal growth
IN 6 KEY CITIES, FMCG SURGED IN 1ST HALF OF 2016 DRIVEN BY UPLIFT IN Q2
Source: Nielsen Retail Index – Versus year ago
Fast Moving Consumer Goods dynamics - Total 6 cities
Co
pyr
igh
t ©
2012
Th
e N
iels
en C
om
pan
y. C
on
fid
enti
al a
nd
pro
pri
etar
y.
7
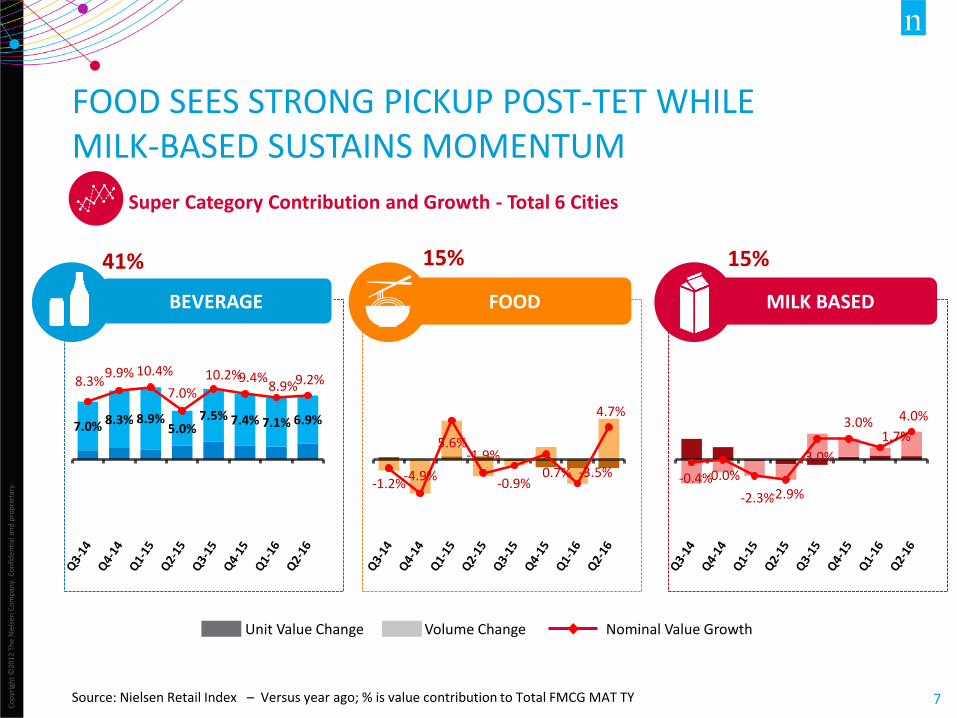
Super Category Contribution and Growth - Total 6 Cities
FOOD SEES STRONG PICKUP POST-TET WHILE MILK-BASED SUSTAINS MOMENTUM
Source: Nielsen Retail Index – Versus year ago; % is value contribution to Total FMCG MAT TY
-1.2% -4.9%
5.6% -1.9%
-0.9% 0.7% -3.5%
4.7% 7.0% 8.3% 8.9%
5.0% 7.5% 7.4% 7.1% 6.9%
8.3% 9.9% 10.4%
7.0% 10.2% 9.4%
8.9% 9.2%
-0.4% -0.0%
-2.3% -2.9%
3.0%
3.0% 1.7%
4.0%
BEVERAGE FOOD MILK BASED
41% 15% 15%
Unit Value Change Volume Change Nominal Value Growth

Co
pyr
igh
t ©
2012
Th
e N
iels
en C
om
pan
y. C
on
fid
enti
al a
nd
pro
pri
etar
y.
8
OTHER CATEGORIES HAVE ALSO BOUNCED BACK IN Q2
Source: Nielsen Retail Index – Versus year ago; % is value contribution to Total FMCG MAT TY
4.5%
-0.7% 3.9%
0.4% -0.5% 6.1%
-1.5%
4.6%
5.4%
3.8%
7.5%
2.3% -0.1%
-0.8% -5.6%
2.2%
-2.7%
-4.8% -3.5%
-2.8% 3.1%
6.4% 4.6%
8.1%
0.7%
-10.1%
-11.5%
-6.0%
3.3% 2.7%
-4.7% -4.1%
HOME CARE PERSONAL CARE CIGARETTE BABY CARE
6% 8% 13% 3%
Super Category Contribution and Growth - Total 6 Cities
Unit Value Change Volume Change Nominal Value Growth

Co
pyr
igh
t ©
2012
Th
e N
iels
en C
om
pan
y. C
on
fid
enti
al a
nd
pro
pri
etar
y.
9
4.6%
10.3%
4.9% 5.0% 3.8% 1.5%
6.5% 6.8%
10.5% 10.0%
8.7%
14.1%
7.3% 8.1%
7.1%
5.4%
11.7% 10.6%
13.9% 14.3%
FOR THE FIRST TIME, NON-ALCOHOLIC BEVERAGE GROWTH IS SLUGGISH, SHOWING OPPOSITE TREND WITH BEER
Source: Nielsen Retail Index – Versus year ago; % is value contribution to Total FMCG MAT TY
BEER
Unit Value Change Volume Change Nominal Value Growth
Beverages (Soft Drink, Energy Drink, Packaged Water, RTD Tea, Sport Drink, Fruit Juice, Coffee, Tea Bag and Healthy Food Drink)
9.7%
3.2%
9.1% 11.7%
14.4%
8.6% 8.7% 8.1%
3.1% 3.4%
9.9%
3.9%
9.5%
12.0%
14.2%
8.7% 8.7% 8.3%
3.7% 4.1%
NON-ALCOHOLIC BEVERAGE
Super Category Contribution and Growth - Total 6 Cities
22% 19%

Co
pyr
igh
t ©
2012
Th
e N
iels
en C
om
pan
y. C
on
fid
enti
al a
nd
pro
pri
etar
y.
11
4.4%
5.6% 4.9%
4.3% 5.2%
3.1%
5.5% 5.9%
4.6%
6.3%
-6%
-4%
-2%
0%
2%
4%
6%
8%
10%
Total Urban
Unit Value change Volume change Nominal growth
Fast Moving Consumer Goods dynamics - Urban vs Rural
Source: Nielsen Retail Index – Versus year ago Note: This slide only includes Feminine Protection, Hair Conditioner, Shampoo, Toothpaste, Toothbrush, Personal Wash, Dishwashing Liquids, Fabric Softener, Laundry Products, Bouillon-MSG, RTDM, Soft Drink, Packaged Water, Energy Drink, RTDT, Cigarette, Sport Drink, Sweet Condensed Milk, Fruit Juice , Household Cleaners, Beer, Instant Noodles, Household Insecticide
IN URBAN & RURAL AREA, FMCG SOFTENS THIS YEAR AND SHOWS MUCH VOLATILITY TO BE PREDICTABLE
54% 46%
Rural
Urban
4.0%
7.6%
3.9% 2.2%
6.0% 3.8%
9.3%
9.8%
6.0%
5.6%
-6%
-4%
-2%
0%
2%
4%
6%
8%
10%
Total Rural

Co
pyr
igh
t ©
2012
Th
e N
iels
en C
om
pan
y. C
on
fid
enti
al a
nd
pro
pri
etar
y.
12
7.0% 8.3% 8.4% 7.8% 8.6% 3.3% 7.4% 8.7% 6.4% 10.3%
2.8% 3.2% -1.8% -5.2% -3.4% -1.5%
7.7% 9.7% 3.9% 2.3%
6.4% 6.2%
1.0%
4.6%
8.3%
3.4%
6.9% 7.2% 6.7% 5.6%
6.2%
2.9% 4.7%
1.0%
4.1% 6.3%
7.5% 6.8%
3.7% 2.1%
6.2% 6.5% 6.1% 4.5% 5.5%
2.5%
7.8% 9.0% 5.5%
7.5%
FMCG Nominal Value Growth vs. YA by regions
NORTH 25%
CENTRAL 28%
SOUTH 47%
FMCG SOFTENS PARTICULARLY IN NORTH, CENTRAL & MKD DUE TO UNFAVORABLE WEATHER CONDITIONS
Val % SOT – FMCG – YTD TY
S.East (33%)
MKD (14%)
Cold Winter
Salinity intrusion
Drought