MARKET OUTLOOK ina yles illiams
13
Philadelphia | Chicago FIS GROUP | www.fisgroup.com | 215.567.1100 2019: Après moi, le déluge - A Late Cycle Rally as Part of a Protracted Market Topping Process MARKET OUTLOOK Q1 2019 January 2019 TINA BYLES WILLIAMS CIO & CEO 2018: FROM “ANNUS MIRABILIS” TO “ANNUS HORRIBILIS” After delivering robust performance for two consecutive years (and high double-digit returns in 2017), global equity markets finished in negative territory. Across the board, equity markets stumbled badly over the combined hurdles presented by: • China’s policy engineered slowdown • Dissipating U.S. dollar liquidity precipitated by the Fed's in- terest rates hikes coupled with the shrinking of its balance sheet and the ramp up in Treasury issuance 1 • Increasingly bellicose trade war rhetoric and measures • Declining global trade and capital spending outside of the U.S. • Geopolitical uncertainty in Europe fostered by the Italian government’s budget standoff with the ECB as well as tor- tuous Brexit negotiations In this maelstrom, the countercyclical U.S. dollar increased by 8% and the relatively insulated U.S. economy and equity mar- kets, which also continued to be flattered by pro-cyclical fiscal stimulus from corporate tax reductions, outperformed their global peers. Unsurprisingly, more trade fueled non-U.S. coun- tries and markets cratered. (See TABLE 1). While the S&P 500 index fell by 4.38% in 2018; non-U.S. equities, as represented by the MSCI x U.S., fell by 10.7%. Emerging Markets and European equities were especially impacted. Despite some improvement in wage growth, the Japanese economy hit another air pocket with its disproportionate earnings exposure to China and a de- cline in investor sentiment, undermined by the government’s intention to once again raise the VAT in 2019. In our Q1 Outlook, we always pause to evaluate the efficacy of our calls in the prior year. TABLE 2 on PAGES 7-9 provides a scorecard of our calls. Our overweight to the U.S. dollar was spot on, as was our focus on defensive countries such as the U.S., (which we moved from a slight underweight in Q1 to neu- tral for Q2 and for the balance of year) and Switzerland. On a U.S. dollar basis, our Japan overweight and focus on high qual- ity companies, outperformed the ACWI x US index. Our EM portfolio had mixed results. Outside of China/Taiwan we did well. Overweights to Russia and underweights in South Africa for all and most of the year, respectively proved highly ac- cretive. Our strategic overweight to India, but tactical Q1 and Q3 underweights were correct as well. In Latin America, while our published calls through Q2 outperformed with respect to Brazil, intra-quarter trading detracted from the performance of the top down calls. A well timed exit from Nigeria in early 2018 and pret- ty good timing and great sizing inThailand managed to negate a poor call in Pakistan and poorly timed implementation in Egypt, which were exited during the year. But unfortunately, we got the largest EM market mostly wrong. Within China, our heavy overweight to the health care sector ran into unforeseen regula- tory risks that we ultimately traded out of after a loss while other “New China” overweights also detracted. We also mistimed the Taiwanese market in Q2 and Q3 amid fears of trade war conta- gion that the broader market ultimately did not share. Our sector positioning focusing on defensive sectors such as Consumer Staples and Health Care was accretive. Our over- weight to European defense stocks (based on both valuation and our long-term theme of the regions increased geopolitical uncertainty) outperformed Europe but was impaired by Eu- rope’s sharp cyclical draw-down in 2018. Additionally, the other cyclical sector focus, Energy, was impaired by the supply shock caused by unanticipated Iran sanction waivers, which caused the price of oil to plunge. Finally, our U.S. small cap portfolio outperformed its benchmark because of its defensive sector fo- cus and positive security selection. TABLE 1 Annualized Return Source: FIS Group Professional Estimates & FactSet Description Local Currency U.S. Dollar 2017 2018 2017 2018 MSCI AC World Index - Net Return All Country Index 19.77 -7.69 23.97 -9.42 MSCI AC World Index ex USA - Net Return 18.23 -10.65 27.19 -14.20 S&P 500 - Total Return U.S. 21.83 -4.38 21.83 -4.38 MSCI Canada - Net Return Canada 8.45 -9.74 16.07 -17.20 MSCI Europe - Net Return Euro Area 13.06 -10.59 25.51 -14.86 MSCI United Kingdom - Net Return U.K. 11.71 -8.82 22.30 -14.15 MSCI Japan - Net Return Japan 19.75 -15.15 23.99 -12.88 MSCI EMF Asia - Net Return Emerging Asia / Emerging Japan 35.89 -13.12 42.83 -15.45 S&P GSCI Brent Crude Total Return Brent Oil 15.49 -15.30 15.49 -15.30 Trade-Weighted Dollar -7.15 7.91 1 This in turn precipitated two mini stock price stymying bond market tantrums – the first in late January through February (when UST yields rose from 2.4% to nearly 3%) and the second in September through October (when UST yields rose from 2.8% to 3.25%).
Transcript of MARKET OUTLOOK ina yles illiams
Philadelphia | Chicago FIS GROUP | www.fisgroup.com | 215.567.1100
2019: Après moi, le déluge - A Late Cycle Rally as Part of a Protracted Market Topping Process
MARKET OUTLOOK Q1 2019
January 2019
Tina Byles WilliamsCiO & CeO
2018: FROM “ANNUS MIRABILIS” TO “ANNUS HORRIBILIS”
After delivering robust performance for two consecutive years (and high double-digit returns in 2017), global equity markets finished in negative territory. Across the board, equity markets stumbled badly over the combined hurdles presented by:
• China’s policy engineered slowdown
• Dissipating U.S. dollar liquidity precipitated by the Fed's in-terest rates hikes coupled with the shrinking of its balance sheet and the ramp up in Treasury issuance 1
• Increasingly bellicose trade war rhetoric and measures
• Declining global trade and capital spending outside of the U.S.
• Geopolitical uncertainty in Europe fostered by the Italian government’s budget standoff with the ECB as well as tor-tuous Brexit negotiations
In this maelstrom, the countercyclical U.S. dollar increased by 8% and the relatively insulated U.S. economy and equity mar-kets, which also continued to be flattered by pro-cyclical fiscal stimulus from corporate tax reductions, outperformed their global peers. Unsurprisingly, more trade fueled non-U.S. coun-tries and markets cratered. (See TABLE 1). While the S&P 500 index fell by 4.38% in 2018; non-U.S. equities, as represented by
the MSCI x U.S., fell by 10.7%. Emerging Markets and European equities were especially impacted. Despite some improvement in wage growth, the Japanese economy hit another air pocket with its disproportionate earnings exposure to China and a de-cline in investor sentiment, undermined by the government’s intention to once again raise the VAT in 2019.
In our Q1 Outlook, we always pause to evaluate the efficacy of our calls in the prior year. TABLE 2 on PAGES 7-9 provides a scorecard of our calls. Our overweight to the U.S. dollar was spot on, as was our focus on defensive countries such as the U.S., (which we moved from a slight underweight in Q1 to neu-tral for Q2 and for the balance of year) and Switzerland. On a U.S. dollar basis, our Japan overweight and focus on high qual-ity companies, outperformed the ACWI x US index.
Our EM portfolio had mixed results. Outside of China/Taiwan we did well. Overweights to Russia and underweights in South Africa for all and most of the year, respectively proved highly ac-cretive. Our strategic overweight to India, but tactical Q1 and Q3 underweights were correct as well. In Latin America, while our published calls through Q2 outperformed with respect to Brazil, intra-quarter trading detracted from the performance of the top down calls. A well timed exit from Nigeria in early 2018 and pret-ty good timing and great sizing in Thailand managed to negate a poor call in Pakistan and poorly timed implementation in Egypt, which were exited during the year. But unfortunately, we got the largest EM market mostly wrong. Within China, our heavy overweight to the health care sector ran into unforeseen regula-tory risks that we ultimately traded out of after a loss while other “New China” overweights also detracted. We also mistimed the Taiwanese market in Q2 and Q3 amid fears of trade war conta-gion that the broader market ultimately did not share.
Our sector positioning focusing on defensive sectors such as Consumer Staples and Health Care was accretive. Our over-weight to European defense stocks (based on both valuation and our long-term theme of the regions increased geopolitical uncertainty) outperformed Europe but was impaired by Eu-rope’s sharp cyclical draw-down in 2018. Additionally, the other cyclical sector focus, Energy, was impaired by the supply shock caused by unanticipated Iran sanction waivers, which caused the price of oil to plunge. Finally, our U.S. small cap portfolio outperformed its benchmark because of its defensive sector fo-cus and positive security selection.
TABLE1
Annualized Return
Source: FIS Group Professional Estimates & FactSet
DescriptionLocal
CurrencyU.S.
Dollar
2017 2018 2017 2018
MSCI AC World Index - Net Return
All Country Index 19.77 -7.69 23.97 -9.42
MSCI AC World Index ex USA - Net Return 18.23 -10.65 27.19 -14.20
S&P 500 - Total Return U.S. 21.83 -4.38 21.83 -4.38
MSCI Canada - Net Return Canada 8.45 -9.74 16.07 -17.20
MSCI Europe - Net Return Euro Area 13.06 -10.59 25.51 -14.86
MSCI United Kingdom - Net Return
U.K. 11.71 -8.82 22.30 -14.15
MSCI Japan - Net Return Japan 19.75 -15.15 23.99 -12.88
MSCI EMF Asia - Net Return Emerging Asia / Emerging Japan
35.89 -13.12 42.83 -15.45
S&P GSCI Brent Crude Total Return
Brent Oil 15.49 -15.30 15.49 -15.30
Trade-Weighted Dollar
-7.15 7.91 1This in turn precipitated two mini stock price stymying bond market tantrums – the first in late January through February (when UST yields rose from 2.4% to nearly 3%) and the second in September through October (when UST yields rose from 2.8% to 3.25%).
Philadelphia | Chicago FIS GROUP | www.fisgroup.com | 215.567.1100
MARKET OUTLOOK Q1 2019 2
APRÈS MOI, LE DÉLUGE - A LATE CYCLE RALLY AS PART OF A PROTRACTED MARKET TOPPING PROCESS
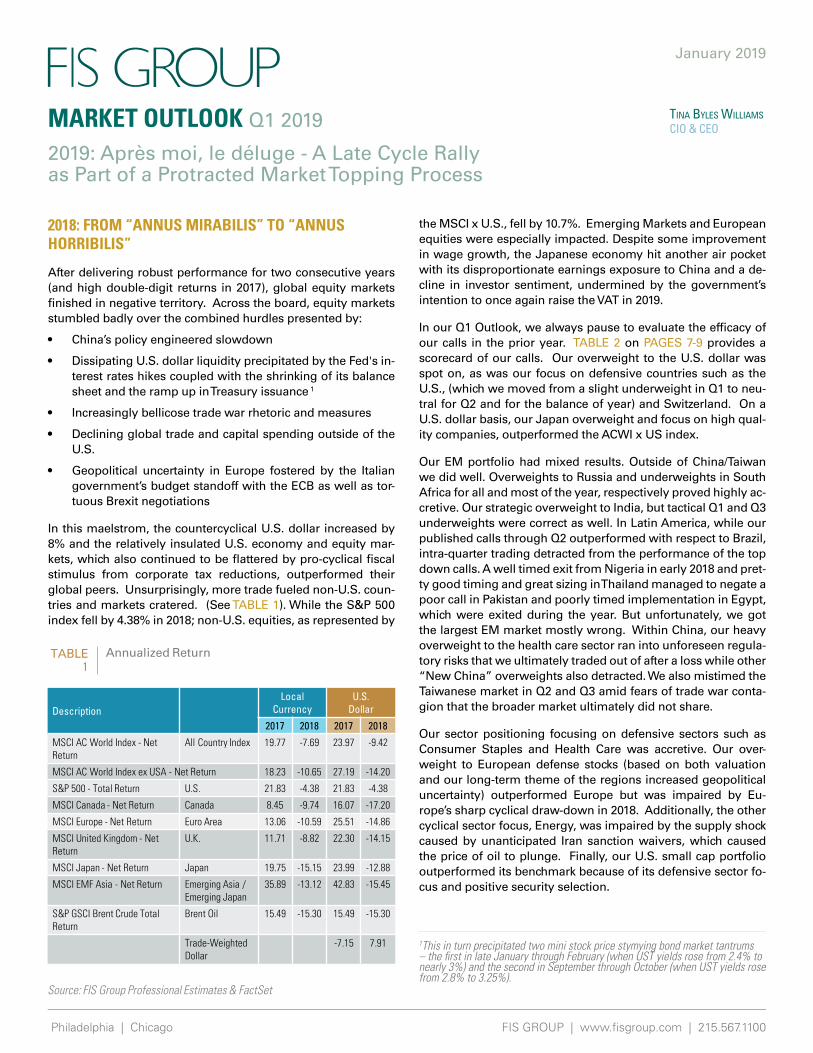
In 2019, global leading indicators herald a soft spot for the first half of 2019. (See CHART 1 and CHART 2). In the U.S., where leading indicators dipped in November but are still consistent with above-trend growth, we expect growth to slow to around 2.5% in 2019, as the fiscal policy impetus from the 2017 tax law diminishes. (Notably, if it makes it to July 2019, the current U.S. economic expansion will have been the longest on record). Re-cession risk in the US remains low for now, but if this changes it would likely trigger another leg down in equities, setting the scene for what would ultimately be one of the best buying op-portunities in years.
Further rises in interest rates combined with a slowdown in global trade and Chinese growth remains a headwind for non-U.S. economies and earnings. However, these trends in the rest of the world (RoW) which began in 2018 are likely to bottom out in the second half of 2019, while U.S. growth is set to roll over. Emerging Markets will become more attractive when the U.S. dollar, which has traded sideways recently, softens, and Chinese reflation stems the decline in credit and industrial production.
Early in the year, inflation is likely to be subdued because of the lingering effects of a strong dollar and low oil prices. That said, we expect a build-up of capacity pressures as well as money velocity (the number of times each unit of money is turned over) as market participants reduce money balances and hold higher-yielding assets; leading inflation to surprise to the upside as the year progresses. The U.S. government’s pro-cyclical policy is storing up inflation pressures due to the simultaneous issuance of debt to pay for its increased budget and spiking demand, due to the stimulus. Inflation is like toothpaste – difficult to return to the tube after it gets out. Almost all the hyperinflations of the 20th century were preceded by rapid rises in government spending which was financed by the central bank. Recent year on year tax revenues is flat despite above-trend growth in 2018; suggesting a structural pressure on the budget deficit. The Fed would, therefore, need to finance the deficit in order to avoid yields going sky high. As inflation pressures become more ap-parent, market consensus could transition from believing that the Fed has been too aggressive, to one that the Fed is behind the curve. The curve in that event would steepen, and risk as-sets could have one last hurrah. Rates won’t hamper growth until they reach nominal GDP growth, currently 3.8%.
DIMINISHING U.S. DOLLAR LIQUIDITY COULD BE AN UNDERAPPRECIATED RISK
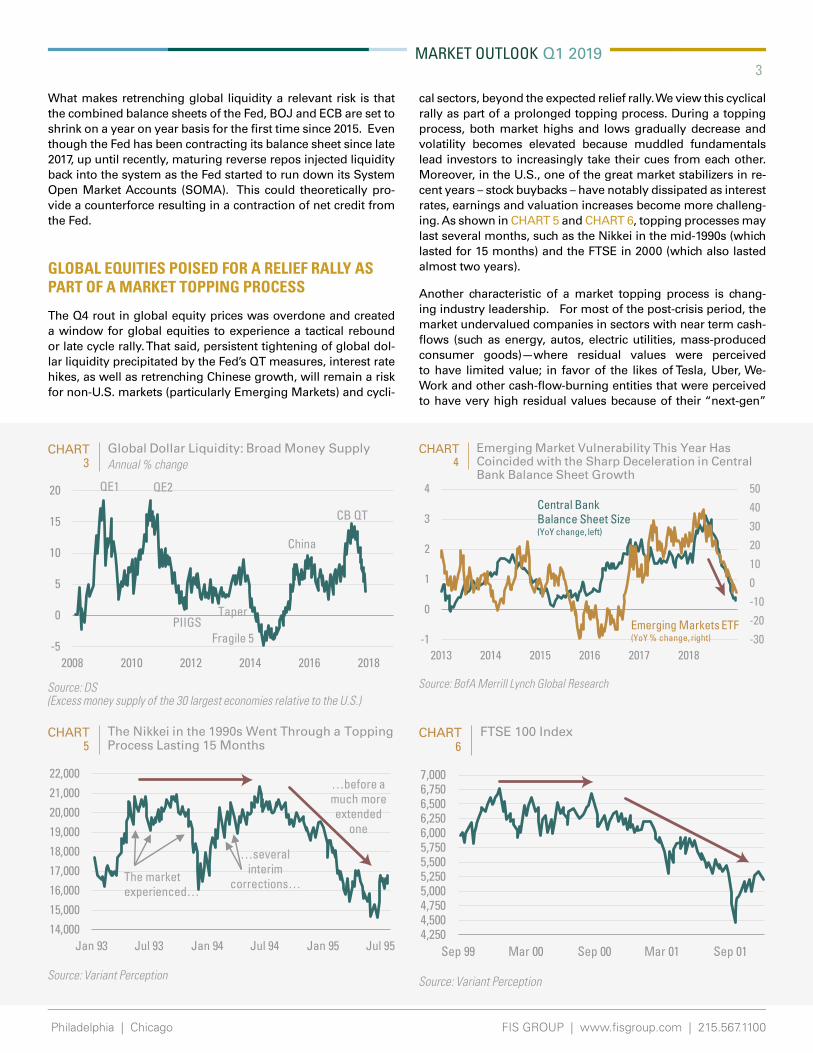
Five months ago, Urjit Patel, the head of the Reserve Bank of India, predicted (correctly) that the Fed's interest rate increases, coupled with the shrinking of its balance sheet through quanti-tative tightening (QT) and a ramp-up in Treasury issuance would result in a dollar liquidity shortage; and that "a crisis in the rest of the dollar bond markets is inevitable."
Excess liquidity (broadly, money growth minus GDP growth), provides a safety net for risk assets. (See CHART 3 on next page). Therefore, the expansion of global liquidity has been a key support for asset prices; whereas declining liquidity is espe-cially challenging for smaller markets that are marginal net im-porters of liquidity such as EMs and commodities. The Fed's QT has had the effect of pulling global capital out of these econo-mies that were big beneficiaries of the post-GFC reach for yield, such as Emerging Markets. CHART 4 illustrates this relationship, suggesting that an important factor behind last year’s EM tur-moil was the sharp deceleration in central bank balance sheet growth. Today, excess liquidity is on the low side but isn’t falling. This means that the safety net is partially there but that risk as-sets are vulnerable.
CHART
828486889092949698100102
-40-20
020406080
100120140
2014 2015 2016 2017 2018
Source: FIS Group Professional Estimates & FactSet
Leading Economic Indicators Portend Global Soft Patch1
Business Survey, ZEW, Economic Expectations, Balance, % - Euro Zone (left)
Sentix Economic Index, USA, Overall - United States (left)
Leading Index, Composite, 2010=100, Index - Japan (right)
CHART
0102030405060708090
100
Dec 16 Mar 17 Jun 17 Sep 17 Dec 17 Mar 18 Jun 18 Sep 18
Source: Variant Perception
2Percentage of Countries with Rising PMI%, 12 month period, Based on PMI manufacturing
Philadelphia | Chicago FIS GROUP | www.fisgroup.com | 215.567.1100
MARKET OUTLOOK Q1 2019 3
What makes retrenching global liquidity a relevant risk is that the combined balance sheets of the Fed, BOJ and ECB are set to shrink on a year on year basis for the first time since 2015. Even though the Fed has been contracting its balance sheet since late 2017, up until recently, maturing reverse repos injected liquidity back into the system as the Fed started to run down its System Open Market Accounts (SOMA). This could theoretically pro-vide a counterforce resulting in a contraction of net credit from the Fed.
GLOBAL EQUITIES POISED FOR A RELIEF RALLY AS PART OF A MARKET TOPPING PROCESS
The Q4 rout in global equity prices was overdone and created a window for global equities to experience a tactical rebound or late cycle rally. That said, persistent tightening of global dol-lar liquidity precipitated by the Fed’s QT measures, interest rate hikes, as well as retrenching Chinese growth, will remain a risk for non-U.S. markets (particularly Emerging Markets) and cycli-
cal sectors, beyond the expected relief rally. We view this cyclical rally as part of a prolonged topping process. During a topping process, both market highs and lows gradually decrease and volatility becomes elevated because muddled fundamentals lead investors to increasingly take their cues from each other. Moreover, in the U.S., one of the great market stabilizers in re-cent years – stock buybacks – have notably dissipated as interest rates, earnings and valuation increases become more challeng-ing. As shown in CHART 5 and CHART 6, topping processes may last several months, such as the Nikkei in the mid-1990s (which lasted for 15 months) and the FTSE in 2000 (which also lasted almost two years).
Another characteristic of a market topping process is chang-ing industry leadership. For most of the post-crisis period, the market undervalued companies in sectors with near term cash-flows (such as energy, autos, electric utilities, mass-produced consumer goods)—where residual values were perceived to have limited value; in favor of the likes of Tesla, Uber, We-Work and other cash-flow-burning entities that were perceived to have very high residual values because of their “next-gen”
CHART
-5
0
5
10
15
20
2008 2010 2012 2014 2016 2018
Source: DS (Excess money supply of the 30 largest economies relative to the U.S.)
3Global Dollar Liquidity: Broad Money SupplyAnnual % change
QE1 QE2
PIIGSTaper
Fragile 5
China
CB QT
CHART
-30
-20
-10
0
10
20
30
40
50
-1
0
1
2
3
4
2013 2014 2015 2016 2017 2018
Source: BofA Merrill Lynch Global Research
4Emerging Market Vulnerability This Year Has Coincided with the Sharp Deceleration in Central Bank Balance Sheet Growth
Central Bank Balance Sheet Size (YoY change, left)
Emerging Markets ETF (YoY % change, right)
CHART
14,000
15,000
16,000
17,000
18,000
19,000
20,000
21,000
22,000
Jan 93 Jul 93 Jan 94 Jul 94 Jan 95 Jul 95
Source: Variant Perception
5The Nikkei in the 1990s Went Through a Topping Process Lasting 15 Months
The market experienced…
…severalinterim
corrections…
…before a much more extended
one
CHART
4,2504,5004,7505,0005,2505,5005,7506,0006,2506,5006,7507,000
Sep 99 Mar 00 Sep 00 Mar 01 Sep 01
Source: Variant Perception
6FTSE 100 Index
Philadelphia | Chicago FIS GROUP | www.fisgroup.com | 215.567.1100
MARKET OUTLOOK Q1 2019 4
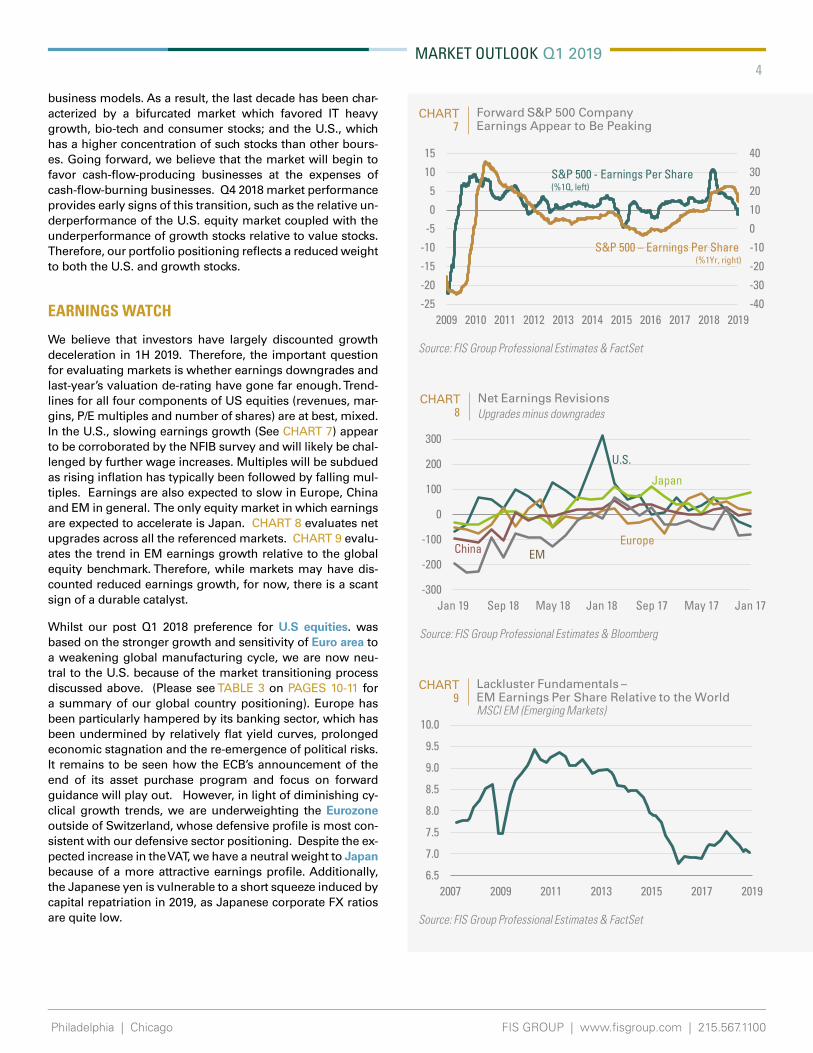
business models. As a result, the last decade has been char-acterized by a bifurcated market which favored IT heavy growth, bio-tech and consumer stocks; and the U.S., which has a higher concentration of such stocks than other bours-es. Going forward, we believe that the market will begin to favor cash-flow-producing businesses at the expenses of cash-flow-burning businesses. Q4 2018 market performance provides early signs of this transition, such as the relative un-derperformance of the U.S. equity market coupled with the underperformance of growth stocks relative to value stocks. Therefore, our portfolio positioning reflects a reduced weight to both the U.S. and growth stocks.
EARNINGS WATCH
We believe that investors have largely discounted growth deceleration in 1H 2019. Therefore, the important question for evaluating markets is whether earnings downgrades and last-year’s valuation de-rating have gone far enough. Trend-lines for all four components of US equities (revenues, mar-gins, P/E multiples and number of shares) are at best, mixed. In the U.S., slowing earnings growth (See CHART 7) appear to be corroborated by the NFIB survey and will likely be chal-lenged by further wage increases. Multiples will be subdued as rising inflation has typically been followed by falling mul-tiples. Earnings are also expected to slow in Europe, China and EM in general. The only equity market in which earnings are expected to accelerate is Japan. CHART 8 evaluates net upgrades across all the referenced markets. CHART 9 evalu-ates the trend in EM earnings growth relative to the global equity benchmark. Therefore, while markets may have dis-counted reduced earnings growth, for now, there is a scant sign of a durable catalyst.
Whilst our post Q1 2018 preference for U.S equities. was based on the stronger growth and sensitivity of Euro area to a weakening global manufacturing cycle, we are now neu-tral to the U.S. because of the market transitioning process discussed above. (Please see TABLE 3 on PAGES 10-11 for a summary of our global country positioning). Europe has been particularly hampered by its banking sector, which has been undermined by relatively flat yield curves, prolonged economic stagnation and the re-emergence of political risks. It remains to be seen how the ECB’s announcement of the end of its asset purchase program and focus on forward guidance will play out. However, in light of diminishing cy-clical growth trends, we are underweighting the Eurozone outside of Switzerland, whose defensive profile is most con-sistent with our defensive sector positioning. Despite the ex-pected increase in the VAT, we have a neutral weight to Japan because of a more attractive earnings profile. Additionally, the Japanese yen is vulnerable to a short squeeze induced by capital repatriation in 2019, as Japanese corporate FX ratios are quite low.
CHART
-40
-30
-20
-10
0
10
20
30
40
-25
-20
-15
-10
-5
0
5
10
15
2009 2010 2011 2012 2013 2014 2015 2016 2017 2018 2019
Forward S&P 500 CompanyEarnings Appear to Be Peaking7
S&P 500 - Earnings Per Share(%1Q, left)
S&P 500 – Earnings Per Share (%1Yr, right)
Source: FIS Group Professional Estimates & FactSet
CHART
-300
-200
-100
0
100
200
300
Jan 17May 17Sep 17Jan 18May 18Sep 18Jan 19
Net Earnings RevisionsUpgrades minus downgrades8
U.S.
Europe
Source: FIS Group Professional Estimates & Bloomberg
Japan
China EM
CHART
6.5
7.0
7.5
8.0
8.5
9.0
9.5
10.0
2007 2009 2011 2013 2015 2017 2019
Lackluster Fundamentals –EM Earnings Per Share Relative to the WorldMSCI EM (Emerging Markets)
9
Source: FIS Group Professional Estimates & FactSet
Philadelphia | Chicago FIS GROUP | www.fisgroup.com | 215.567.1100
MARKET OUTLOOK Q1 2019 5
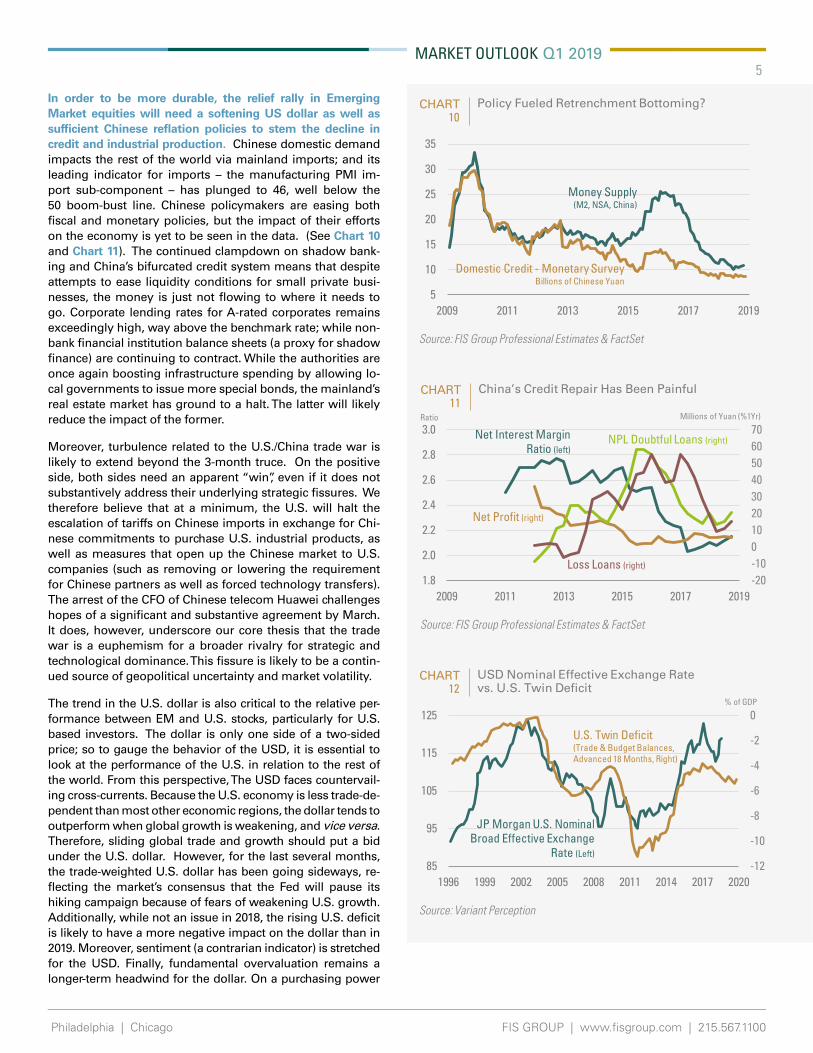
In order to be more durable, the relief rally in Emerging Market equities will need a softening US dollar as well as sufficient Chinese reflation policies to stem the decline in credit and industrial production. Chinese domestic demand impacts the rest of the world via mainland imports; and its leading indicator for imports – the manufacturing PMI im-port sub-component – has plunged to 46, well below the 50 boom-bust line. Chinese policymakers are easing both fiscal and monetary policies, but the impact of their efforts on the economy is yet to be seen in the data. (See Chart 10 and Chart 11). The continued clampdown on shadow bank-ing and China’s bifurcated credit system means that despite attempts to ease liquidity conditions for small private busi-nesses, the money is just not flowing to where it needs to go. Corporate lending rates for A-rated corporates remains exceedingly high, way above the benchmark rate; while non-bank financial institution balance sheets (a proxy for shadow finance) are continuing to contract. While the authorities are once again boosting infrastructure spending by allowing lo-cal governments to issue more special bonds, the mainland’s real estate market has ground to a halt. The latter will likely reduce the impact of the former.
Moreover, turbulence related to the U.S./China trade war is likely to extend beyond the 3-month truce. On the positive side, both sides need an apparent “win”, even if it does not substantively address their underlying strategic fissures. We therefore believe that at a minimum, the U.S. will halt the escalation of tariffs on Chinese imports in exchange for Chi-nese commitments to purchase U.S. industrial products, as well as measures that open up the Chinese market to U.S. companies (such as removing or lowering the requirement for Chinese partners as well as forced technology transfers). The arrest of the CFO of Chinese telecom Huawei challenges hopes of a significant and substantive agreement by March. It does, however, underscore our core thesis that the trade war is a euphemism for a broader rivalry for strategic and technological dominance. This fissure is likely to be a contin-ued source of geopolitical uncertainty and market volatility.
The trend in the U.S. dollar is also critical to the relative per-formance between EM and U.S. stocks, particularly for U.S. based investors. The dollar is only one side of a two-sided price; so to gauge the behavior of the USD, it is essential to look at the performance of the U.S. in relation to the rest of the world. From this perspective, The USD faces countervail-ing cross-currents. Because the U.S. economy is less trade-de-pendent than most other economic regions, the dollar tends to outperform when global growth is weakening, and vice versa. Therefore, sliding global trade and growth should put a bid under the U.S. dollar. However, for the last several months, the trade-weighted U.S. dollar has been going sideways, re-flecting the market’s consensus that the Fed will pause its hiking campaign because of fears of weakening U.S. growth. Additionally, while not an issue in 2018, the rising U.S. deficit is likely to have a more negative impact on the dollar than in 2019. Moreover, sentiment (a contrarian indicator) is stretched for the USD. Finally, fundamental overvaluation remains a longer-term headwind for the dollar. On a purchasing power
CHART
5
10
15
20
25
30
35
2009 2011 2013 2015 2017 2019
Policy Fueled Retrenchment Bottoming?10
Source: FIS Group Professional Estimates & FactSet
Money Supply (M2, NSA, China)
Domestic Credit - Monetary SurveyBillions of Chinese Yuan
CHART
-20-10010203040506070
1.8
2.0
2.2
2.4
2.6
2.8
3.0
2009 2011 2013 2015 2017 2019
China’s Credit Repair Has Been Painful11
Source: FIS Group Professional Estimates & FactSet
Net Interest Margin Ratio (left)
Net Profit (right)
Millions of Yuan (%1Yr)Ratio
NPL Doubtful Loans (right)
Loss Loans (right)
CHART
-12
-10
-8
-6
-4
-2
0
85
95
105
115
125
1996 1999 2002 2005 2008 2011 2014 2017 2020
Source: Variant Perception
12USD Nominal Effective Exchange Rate vs. U.S. Twin Deficit
JP Morgan U.S. Nominal Broad Effective Exchange
Rate (Left)
U.S. Twin Deficit (Trade & Budget Balances, Advanced 18 Months, Right)
% of GDP
Philadelphia | Chicago FIS GROUP | www.fisgroup.com | 215.567.1100
MARKET OUTLOOK Q1 2019 6
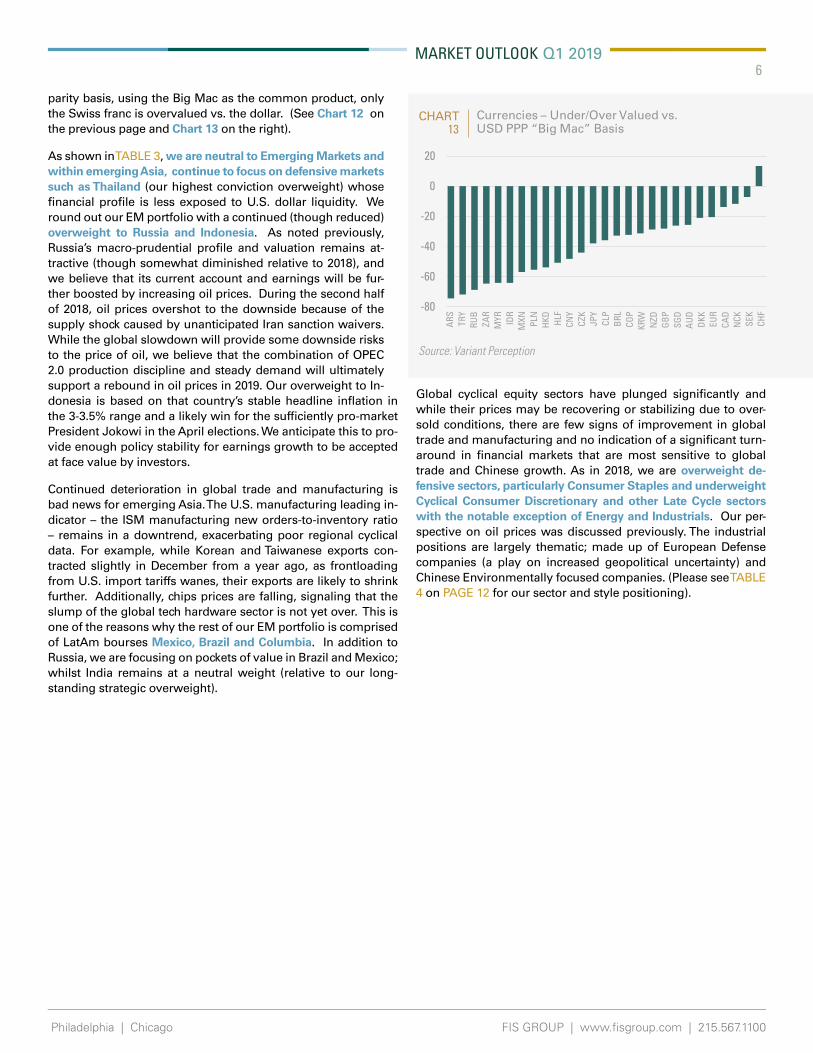
parity basis, using the Big Mac as the common product, only the Swiss franc is overvalued vs. the dollar. (See Chart 12 on the previous page and Chart 13 on the right).
As shown in TABLE 3, we are neutral to Emerging Markets and within emerging Asia, continue to focus on defensive markets such as Thailand (our highest conviction overweight) whose financial profile is less exposed to U.S. dollar liquidity. We round out our EM portfolio with a continued (though reduced) overweight to Russia and Indonesia. As noted previously, Russia’s macro-prudential profile and valuation remains at-tractive (though somewhat diminished relative to 2018), and we believe that its current account and earnings will be fur-ther boosted by increasing oil prices. During the second half of 2018, oil prices overshot to the downside because of the supply shock caused by unanticipated Iran sanction waivers. While the global slowdown will provide some downside risks to the price of oil, we believe that the combination of OPEC 2.0 production discipline and steady demand will ultimately support a rebound in oil prices in 2019. Our overweight to In-donesia is based on that country’s stable headline inflation in the 3-3.5% range and a likely win for the sufficiently pro-market President Jokowi in the April elections. We anticipate this to pro-vide enough policy stability for earnings growth to be accepted at face value by investors.
Continued deterioration in global trade and manufacturing is bad news for emerging Asia. The U.S. manufacturing leading in-dicator – the ISM manufacturing new orders-to-inventory ratio – remains in a downtrend, exacerbating poor regional cyclical data. For example, while Korean and Taiwanese exports con-tracted slightly in December from a year ago, as frontloading from U.S. import tariffs wanes, their exports are likely to shrink further. Additionally, chips prices are falling, signaling that the slump of the global tech hardware sector is not yet over. This is one of the reasons why the rest of our EM portfolio is comprised of LatAm bourses Mexico, Brazil and Columbia. In addition to Russia, we are focusing on pockets of value in Brazil and Mexico; whilst India remains at a neutral weight (relative to our long-standing strategic overweight).
Global cyclical equity sectors have plunged significantly and while their prices may be recovering or stabilizing due to over-sold conditions, there are few signs of improvement in global trade and manufacturing and no indication of a significant turn-around in financial markets that are most sensitive to global trade and Chinese growth. As in 2018, we are overweight de-fensive sectors, particularly Consumer Staples and underweight Cyclical Consumer Discretionary and other Late Cycle sectors with the notable exception of Energy and Industrials. Our per-spective on oil prices was discussed previously. The industrial positions are largely thematic; made up of European Defense companies (a play on increased geopolitical uncertainty) and Chinese Environmentally focused companies. (Please see TABLE 4 on PAGE 12 for our sector and style positioning).
CHART
-80
-60
-40
-20
0
20
Source: Variant Perception
13Currencies – Under/Over Valued vs. USD PPP “Big Mac” Basis
ARS TR
YRU
BZA
RM
YR IDR
MXN PL
NH
KD HLF
CNY
CZK
JPY
CLP
BRL
COP
KRW
NZD
GB
PSG
DA
UD
DKK EU
RCA
DN
CK SEK
CHF
Philadelphia | Chicago FIS GROUP | www.fisgroup.com | 215.567.1100
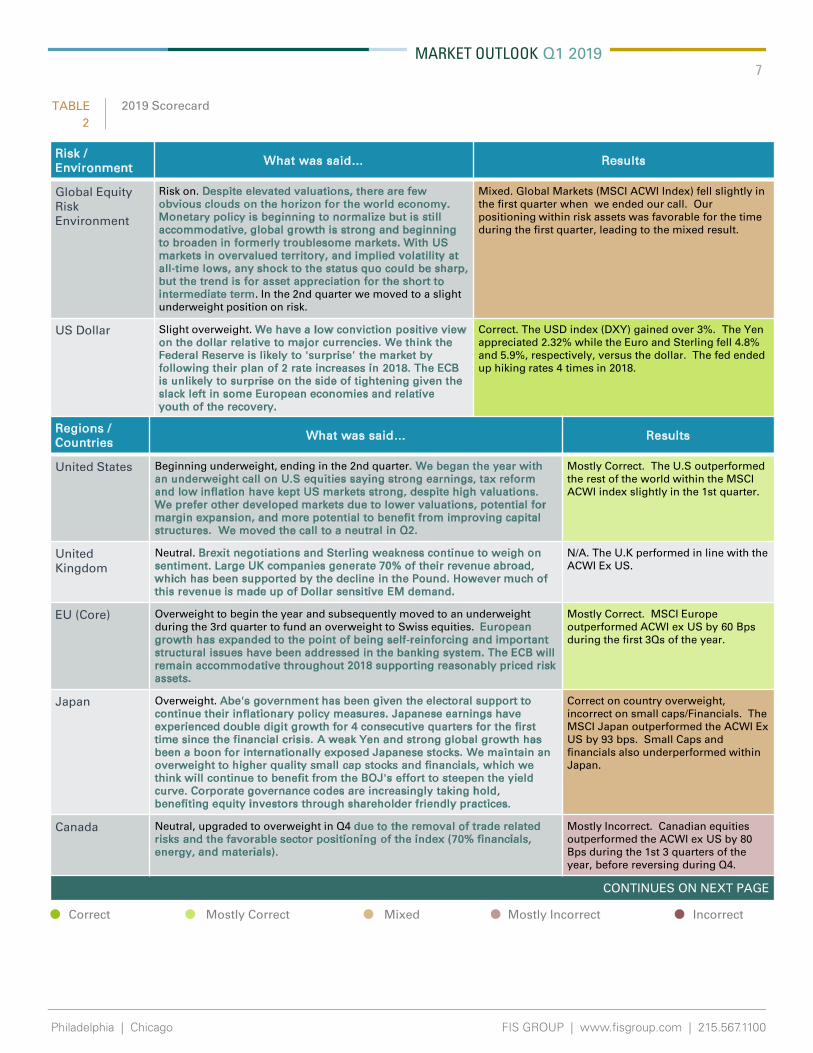
MARKET OUTLOOK Q1 2019 7
Risk / Environment
What was said… Results
Global Equity Risk Environment
Risk on. Despite elevated valuations, there are fewobvious clouds on the horizon for the world economy. Monetary policy is beginning to normalize but is stillaccommodative, global growth is strong and beginning to broaden in formerly troublesome markets. With US markets in overvalued territory, and implied volatility at all-time lows, any shock to the status quo could be sharp, but the trend is for asset appreciation for the short to intermediate term. In the 2nd quarter we moved to a slight underweight position on risk.
Mixed. Global Markets (MSCI ACWI Index) fell slightly in the first quarter when we ended our call. Our positioning within risk assets was favorable for the time during the first quarter, leading to the mixed result.
US Dollar Slight overweight. We have a low conviction positive view on the dollar relative to major currencies. We think the Federal Reserve is likely to 'surprise' the market by following their plan of 2 rate increases in 2018. The ECB is unlikely to surprise on the side of tightening given the slack left in some European economies and relative youth of the recovery.
Correct. The USD index (DXY) gained over 3%. The Yen appreciated 2.32% while the Euro and Sterling fell 4.8% and 5.9%, respectively, versus the dollar. The fed ended up hiking rates 4 times in 2018.
TABLE 2019 Scorecard2
Regions / Countries
What was said… Results
United States Beginning underweight, ending in the 2nd quarter. We began the year with an underweight call on U.S equities saying strong earnings, tax reform and low inflation have kept US markets strong, despite high valuations. We prefer other developed markets due to lower valuations, potential for margin expansion, and more potential to benefit from improving capital structures. We moved the call to a neutral in Q2.
Mostly Correct. The U.S outperformed the rest of the world within the MSCI ACWI index slightly in the 1st quarter.
United Kingdom
Neutral. Brexit negotiations and Sterling weakness continue to weigh on sentiment. Large UK companies generate 70% of their revenue abroad, which has been supported by the decline in the Pound. However much of this revenue is made up of Dollar sensitive EM demand.
N/A. The U.K performed in line with the ACWI Ex US.
EU (Core) Overweight to begin the year and subsequently moved to an underweight during the 3rd quarter to fund an overweight to Swiss equities. European growth has expanded to the point of being self-reinforcing and important structural issues have been addressed in the banking system. The ECB will remain accommodative throughout 2018 supporting reasonably priced risk assets.
Mostly Correct. MSCI Europe outperformed ACWI ex US by 60 Bps during the first 3Qs of the year.
Japan Overweight. Abe's government has been given the electoral support tocontinue their inflationary policy measures. Japanese earnings have experienced double digit growth for 4 consecutive quarters for the first time since the financial crisis. A weak Yen and strong global growth has been a boon for internationally exposed Japanese stocks. We maintain an overweight to higher quality small cap stocks and financials, which we think will continue to benefit from the BOJ's effort to steepen the yield curve. Corporate governance codes are increasingly taking hold,benefiting equity investors through shareholder friendly practices.
Correct on country overweight, incorrect on small caps/Financials. The MSCI Japan outperformed the ACWI Ex US by 93 bps. Small Caps and financials also underperformed within Japan.
Canada Neutral, upgraded to overweight in Q4 due to the removal of trade related risks and the favorable sector positioning of the index (70% financials, energy, and materials).
Mostly Incorrect. Canadian equities outperformed the ACWI ex US by 80 Bps during the 1st 3 quarters of the year, before reversing during Q4.
CONTINUES ON NEXT PAGE
• Correct • Mostly Correct • Mixed • Mostly Incorrect • Incorrect
Philadelphia | Chicago FIS GROUP | www.fisgroup.com | 215.567.1100
MARKET OUTLOOK Q1 2019 8
Regions / Countries
What was said… Results
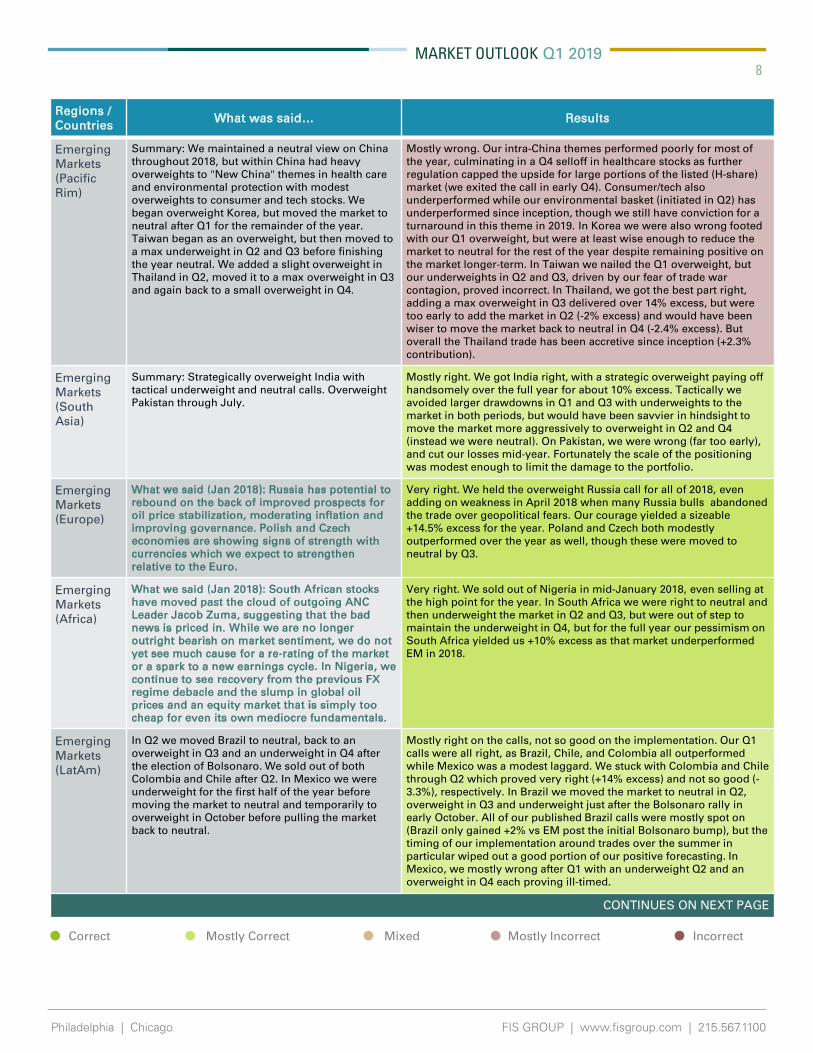
Emerging Markets (Pacific Rim)
Summary: We maintained a neutral view on China throughout 2018, but within China had heavy overweights to "New China" themes in health care and environmental protection with modest overweights to consumer and tech stocks. We began overweight Korea, but moved the market to neutral after Q1 for the remainder of the year. Taiwan began as an overweight, but then moved to a max underweight in Q2 and Q3 before finishing the year neutral. We added a slight overweight in Thailand in Q2, moved it to a max overweight in Q3 and again back to a small overweight in Q4.
Mostly wrong. Our intra-China themes performed poorly for most of the year, culminating in a Q4 selloff in healthcare stocks as further regulation capped the upside for large portions of the listed (H-share) market (we exited the call in early Q4). Consumer/tech also underperformed while our environmental basket (initiated in Q2) has underperformed since inception, though we still have conviction for a turnaround in this theme in 2019. In Korea we were also wrong footed with our Q1 overweight, but were at least wise enough to reduce the market to neutral for the rest of the year despite remaining positive on the market longer-term. In Taiwan we nailed the Q1 overweight, but our underweights in Q2 and Q3, driven by our fear of trade war contagion, proved incorrect. In Thailand, we got the best part right, adding a max overweight in Q3 delivered over 14% excess, but were too early to add the market in Q2 (-2% excess) and would have been wiser to move the market back to neutral in Q4 (-2.4% excess). But overall the Thailand trade has been accretive since inception (+2.3% contribution).
Emerging Markets(South Asia)
Summary: Strategically overweight India with tactical underweight and neutral calls. Overweight Pakistan through July.
Mostly right. We got India right, with a strategic overweight paying off handsomely over the full year for about 10% excess. Tactically we avoided larger drawdowns in Q1 and Q3 with underweights to the market in both periods, but would have been savvier in hindsight to move the market more aggressively to overweight in Q2 and Q4 (instead we were neutral). On Pakistan, we were wrong (far too early), and cut our losses mid-year. Fortunately the scale of the positioning was modest enough to limit the damage to the portfolio.
Emerging Markets (Europe)
What we said (Jan 2018): Russia has potential to rebound on the back of improved prospects for oil price stabilization, moderating inflation and improving governance. Polish and Czech economies are showing signs of strength with currencies which we expect to strengthen relative to the Euro.
Very right. We held the overweight Russia call for all of 2018, even adding on weakness in April 2018 when many Russia bulls abandoned the trade over geopolitical fears. Our courage yielded a sizeable +14.5% excess for the year. Poland and Czech both modestly outperformed over the year as well, though these were moved to neutral by Q3.
Emerging Markets (Africa)
What we said (Jan 2018): South African stocks have moved past the cloud of outgoing ANC Leader Jacob Zuma, suggesting that the bad news is priced in. While we are no longer outright bearish on market sentiment, we do not yet see much cause for a re-rating of the market or a spark to a new earnings cycle. In Nigeria, we continue to see recovery from the previous FX regime debacle and the slump in global oil prices and an equity market that is simply too cheap for even its own mediocre fundamentals.
Very right. We sold out of Nigeria in mid-January 2018, even selling at the high point for the year. In South Africa we were right to neutral and then underweight the market in Q2 and Q3, but were out of step to maintain the underweight in Q4, but for the full year our pessimism on South Africa yielded us +10% excess as that market underperformed EM in 2018.
Emerging Markets (LatAm)
In Q2 we moved Brazil to neutral, back to an overweight in Q3 and an underweight in Q4 after the election of Bolsonaro. We sold out of both Colombia and Chile after Q2. In Mexico we were underweight for the first half of the year before moving the market to neutral and temporarily to overweight in October before pulling the market back to neutral.
Mostly right on the calls, not so good on the implementation. Our Q1 calls were all right, as Brazil, Chile, and Colombia all outperformed while Mexico was a modest laggard. We stuck with Colombia and Chile through Q2 which proved very right (+14% excess) and not so good (-3.3%), respectively. In Brazil we moved the market to neutral in Q2, overweight in Q3 and underweight just after the Bolsonaro rally in early October. All of our published Brazil calls were mostly spot on (Brazil only gained +2% vs EM post the initial Bolsonaro bump), but the timing of our implementation around trades over the summer in particular wiped out a good portion of our positive forecasting. In Mexico, we mostly wrong after Q1 with an underweight Q2 and an overweight in Q4 each proving ill-timed.
CONTINUES ON NEXT PAGE
• Correct • Mostly Correct • Mixed • Mostly Incorrect • Incorrect
Philadelphia | Chicago FIS GROUP | www.fisgroup.com | 215.567.1100
MARKET OUTLOOK Q1 2019 9
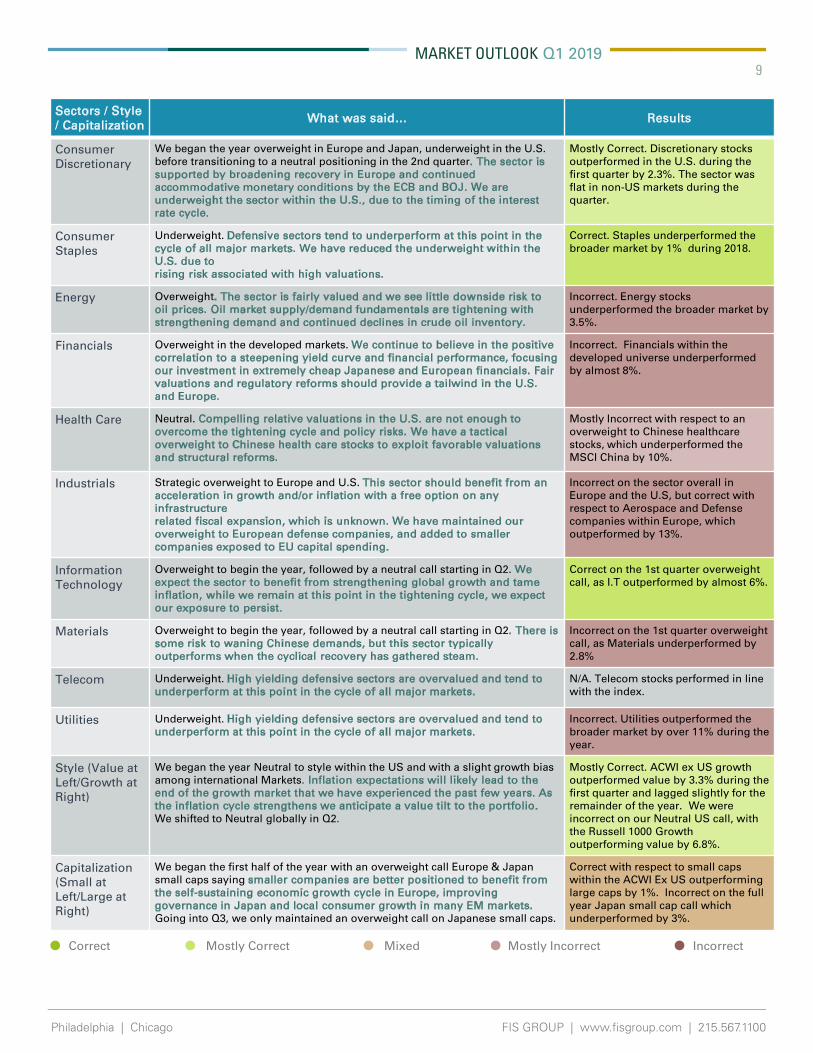
Sectors / Style / Capitalization
What was said… Results
Consumer Discretionary
We began the year overweight in Europe and Japan, underweight in the U.S. before transitioning to a neutral positioning in the 2nd quarter. The sector issupported by broadening recovery in Europe and continued accommodative monetary conditions by the ECB and BOJ. We are underweight the sector within the U.S., due to the timing of the interest rate cycle.
Mostly Correct. Discretionary stocks outperformed in the U.S. during the first quarter by 2.3%. The sector was flat in non-US markets during the quarter.
Consumer Staples
Underweight. Defensive sectors tend to underperform at this point in thecycle of all major markets. We have reduced the underweight within the U.S. due torising risk associated with high valuations.
Correct. Staples underperformed the broader market by 1% during 2018.
Energy Overweight. The sector is fairly valued and we see little downside risk tooil prices. Oil market supply/demand fundamentals are tightening withstrengthening demand and continued declines in crude oil inventory.
Incorrect. Energy stocks underperformed the broader market by 3.5%.
Financials Overweight in the developed markets. We continue to believe in the positive correlation to a steepening yield curve and financial performance, focusingour investment in extremely cheap Japanese and European financials. Fair valuations and regulatory reforms should provide a tailwind in the U.S. and Europe.
Incorrect. Financials within the developed universe underperformed by almost 8%.
Health Care Neutral. Compelling relative valuations in the U.S. are not enough to overcome the tightening cycle and policy risks. We have a tactical overweight to Chinese health care stocks to exploit favorable valuations and structural reforms.
Mostly Incorrect with respect to an overweight to Chinese healthcare stocks, which underperformed the MSCI China by 10%.
Industrials Strategic overweight to Europe and U.S. This sector should benefit from anacceleration in growth and/or inflation with a free option on any infrastructurerelated fiscal expansion, which is unknown. We have maintained our overweight to European defense companies, and added to smaller companies exposed to EU capital spending.
Incorrect on the sector overall in Europe and the U.S, but correct with respect to Aerospace and Defense companies within Europe, which outperformed by 13%.
Information Technology
Overweight to begin the year, followed by a neutral call starting in Q2. We expect the sector to benefit from strengthening global growth and tame inflation, while we remain at this point in the tightening cycle, we expect our exposure to persist.
Correct on the 1st quarter overweight call, as I.T outperformed by almost 6%.
Materials Overweight to begin the year, followed by a neutral call starting in Q2. There is some risk to waning Chinese demands, but this sector typically outperforms when the cyclical recovery has gathered steam.
Incorrect on the 1st quarter overweight call, as Materials underperformed by 2.8%
Telecom Underweight. High yielding defensive sectors are overvalued and tend tounderperform at this point in the cycle of all major markets.
N/A. Telecom stocks performed in line with the index.
Utilities Underweight. High yielding defensive sectors are overvalued and tend tounderperform at this point in the cycle of all major markets.
Incorrect. Utilities outperformed the broader market by over 11% during the year.
Style (Value at Left/Growth at Right)
We began the year Neutral to style within the US and with a slight growth bias among international Markets. Inflation expectations will likely lead to the end of the growth market that we have experienced the past few years. As the inflation cycle strengthens we anticipate a value tilt to the portfolio.We shifted to Neutral globally in Q2.
Mostly Correct. ACWI ex US growth outperformed value by 3.3% during the first quarter and lagged slightly for the remainder of the year. We were incorrect on our Neutral US call, with the Russell 1000 Growth outperforming value by 6.8%.
Capitalization (Small at Left/Large at Right)
We began the first half of the year with an overweight call Europe & Japan small caps saying smaller companies are better positioned to benefit from the self-sustaining economic growth cycle in Europe, improving governance in Japan and local consumer growth in many EM markets. Going into Q3, we only maintained an overweight call on Japanese small caps.
Correct with respect to small caps within the ACWI Ex US outperforming large caps by 1%. Incorrect on the full year Japan small cap call which underperformed by 3%.
• Correct • Mostly Correct • Mixed • Mostly Incorrect • Incorrect
Philadelphia | Chicago FIS GROUP | www.fisgroup.com | 215.567.1100
MARKET OUTLOOK Q1 2019 10
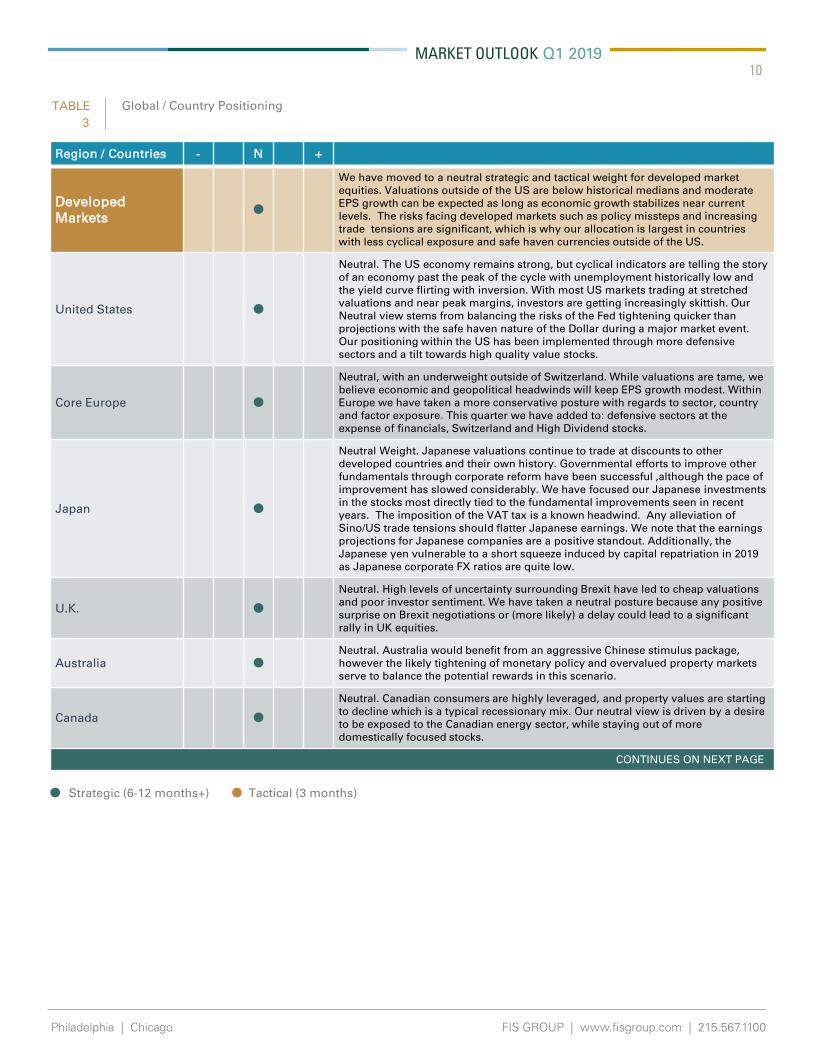
• Strategic (6-12 months+) • Tactical (3 months)
Region / Countries - N +
Developed Markets •
We have moved to a neutral strategic and tactical weight for developed market equities. Valuations outside of the US are below historical medians and moderate EPS growth can be expected as long as economic growth stabilizes near current levels. The risks facing developed markets such as policy missteps and increasing trade tensions are significant, which is why our allocation is largest in countries with less cyclical exposure and safe haven currencies outside of the US.
United States •
Neutral. The US economy remains strong, but cyclical indicators are telling the story of an economy past the peak of the cycle with unemployment historically low and the yield curve flirting with inversion. With most US markets trading at stretched valuations and near peak margins, investors are getting increasingly skittish. Our Neutral view stems from balancing the risks of the Fed tightening quicker than projections with the safe haven nature of the Dollar during a major market event. Our positioning within the US has been implemented through more defensive sectors and a tilt towards high quality value stocks.
Core Europe •Neutral, with an underweight outside of Switzerland. While valuations are tame, we believe economic and geopolitical headwinds will keep EPS growth modest. Within Europe we have taken a more conservative posture with regards to sector, country and factor exposure. This quarter we have added to: defensive sectors at the expense of financials, Switzerland and High Dividend stocks.
Japan •
Neutral Weight. Japanese valuations continue to trade at discounts to other developed countries and their own history. Governmental efforts to improve other fundamentals through corporate reform have been successful ,although the pace of improvement has slowed considerably. We have focused our Japanese investments in the stocks most directly tied to the fundamental improvements seen in recent years. The imposition of the VAT tax is a known headwind. Any alleviation of Sino/US trade tensions should flatter Japanese earnings. We note that the earnings projections for Japanese companies are a positive standout. Additionally, the Japanese yen vulnerable to a short squeeze induced by capital repatriation in 2019 as Japanese corporate FX ratios are quite low.
U.K. •Neutral. High levels of uncertainty surrounding Brexit have led to cheap valuations and poor investor sentiment. We have taken a neutral posture because any positive surprise on Brexit negotiations or (more likely) a delay could lead to a significant rally in UK equities.
Australia •Neutral. Australia would benefit from an aggressive Chinese stimulus package, however the likely tightening of monetary policy and overvalued property markets serve to balance the potential rewards in this scenario.
Canada •Neutral. Canadian consumers are highly leveraged, and property values are starting to decline which is a typical recessionary mix. Our neutral view is driven by a desire to be exposed to the Canadian energy sector, while staying out of more domestically focused stocks.
CONTINUES ON NEXT PAGE
TABLE Global / Country Positioning3
• Strategic (6-12 months+) • Tactical (3 months)
Philadelphia | Chicago FIS GROUP | www.fisgroup.com | 215.567.1100
MARKET OUTLOOK Q1 2019 11
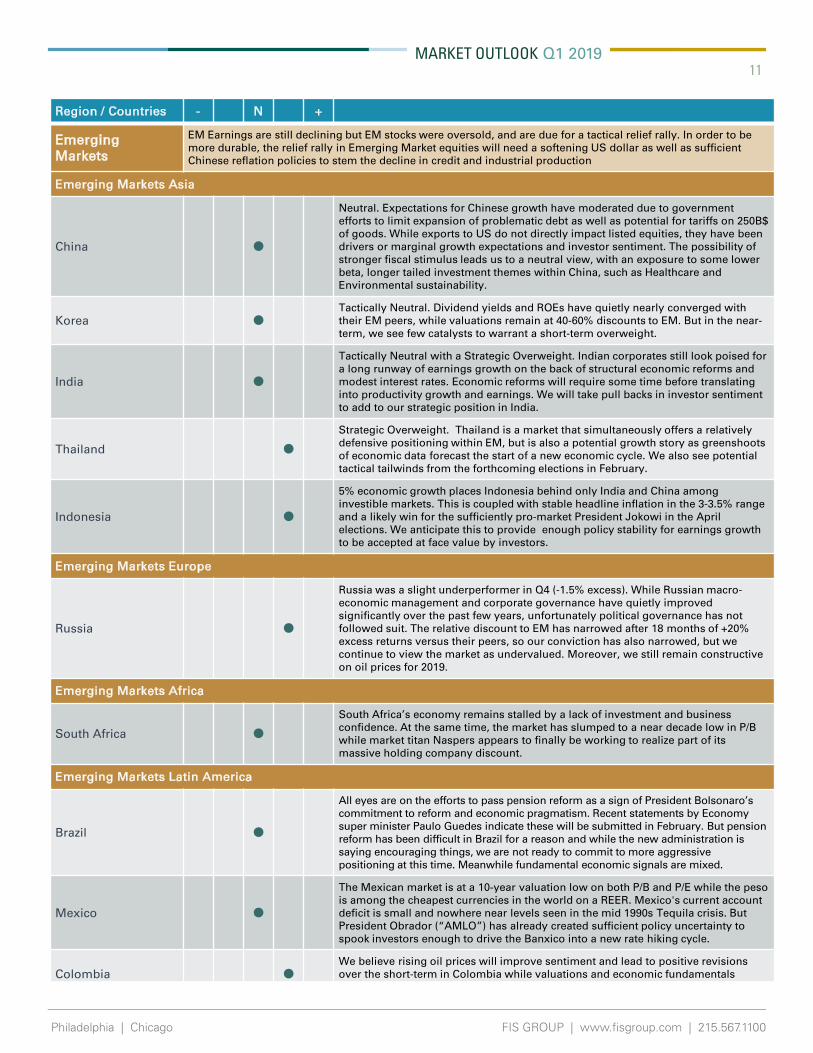
Region / Countries - N +
Emerging Markets
EM Earnings are still declining but EM stocks were oversold, and are due for a tactical relief rally. In order to be more durable, the relief rally in Emerging Market equities will need a softening US dollar as well as sufficient Chinese reflation policies to stem the decline in credit and industrial production
Emerging Markets Asia
China •
Neutral. Expectations for Chinese growth have moderated due to government efforts to limit expansion of problematic debt as well as potential for tariffs on 250B$ of goods. While exports to US do not directly impact listed equities, they have been drivers or marginal growth expectations and investor sentiment. The possibility of stronger fiscal stimulus leads us to a neutral view, with an exposure to some lower beta, longer tailed investment themes within China, such as Healthcare and Environmental sustainability.
Korea •Tactically Neutral. Dividend yields and ROEs have quietly nearly converged with their EM peers, while valuations remain at 40-60% discounts to EM. But in the near-term, we see few catalysts to warrant a short-term overweight.
India •Tactically Neutral with a Strategic Overweight. Indian corporates still look poised for a long runway of earnings growth on the back of structural economic reforms and modest interest rates. Economic reforms will require some time before translating into productivity growth and earnings. We will take pull backs in investor sentiment to add to our strategic position in India.
Thailand •Strategic Overweight. Thailand is a market that simultaneously offers a relatively defensive positioning within EM, but is also a potential growth story as greenshootsof economic data forecast the start of a new economic cycle. We also see potential tactical tailwinds from the forthcoming elections in February.
Indonesia •5% economic growth places Indonesia behind only India and China among investible markets. This is coupled with stable headline inflation in the 3-3.5% range and a likely win for the sufficiently pro-market President Jokowi in the April elections. We anticipate this to provide enough policy stability for earnings growth to be accepted at face value by investors.
Emerging Markets Europe
Russia •
Russia was a slight underperformer in Q4 (-1.5% excess). While Russian macro-economic management and corporate governance have quietly improved significantly over the past few years, unfortunately political governance has not followed suit. The relative discount to EM has narrowed after 18 months of +20% excess returns versus their peers, so our conviction has also narrowed, but we continue to view the market as undervalued. Moreover, we still remain constructive on oil prices for 2019.
Emerging Markets Africa
South Africa •South Africa’s economy remains stalled by a lack of investment and business confidence. At the same time, the market has slumped to a near decade low in P/B while market titan Naspers appears to finally be working to realize part of its massive holding company discount.
Emerging Markets Latin America
Brazil •All eyes are on the efforts to pass pension reform as a sign of President Bolsonaro’scommitment to reform and economic pragmatism. Recent statements by Economy super minister Paulo Guedes indicate these will be submitted in February. But pension reform has been difficult in Brazil for a reason and while the new administration is saying encouraging things, we are not ready to commit to more aggressive positioning at this time. Meanwhile fundamental economic signals are mixed.
Mexico •The Mexican market is at a 10-year valuation low on both P/B and P/E while the peso is among the cheapest currencies in the world on a REER. Mexico's current account deficit is small and nowhere near levels seen in the mid 1990s Tequila crisis. But President Obrador (“AMLO”) has already created sufficient policy uncertainty to spook investors enough to drive the Banxico into a new rate hiking cycle.
Colombia •We believe rising oil prices will improve sentiment and lead to positive revisions over the short-term in Colombia while valuations and economic fundamentals remain reasonable.
• Strategic (6-12 months+) • Tactical (3 months)
Philadelphia | Chicago FIS GROUP | www.fisgroup.com | 215.567.1100
MARKET OUTLOOK Q1 2019 12
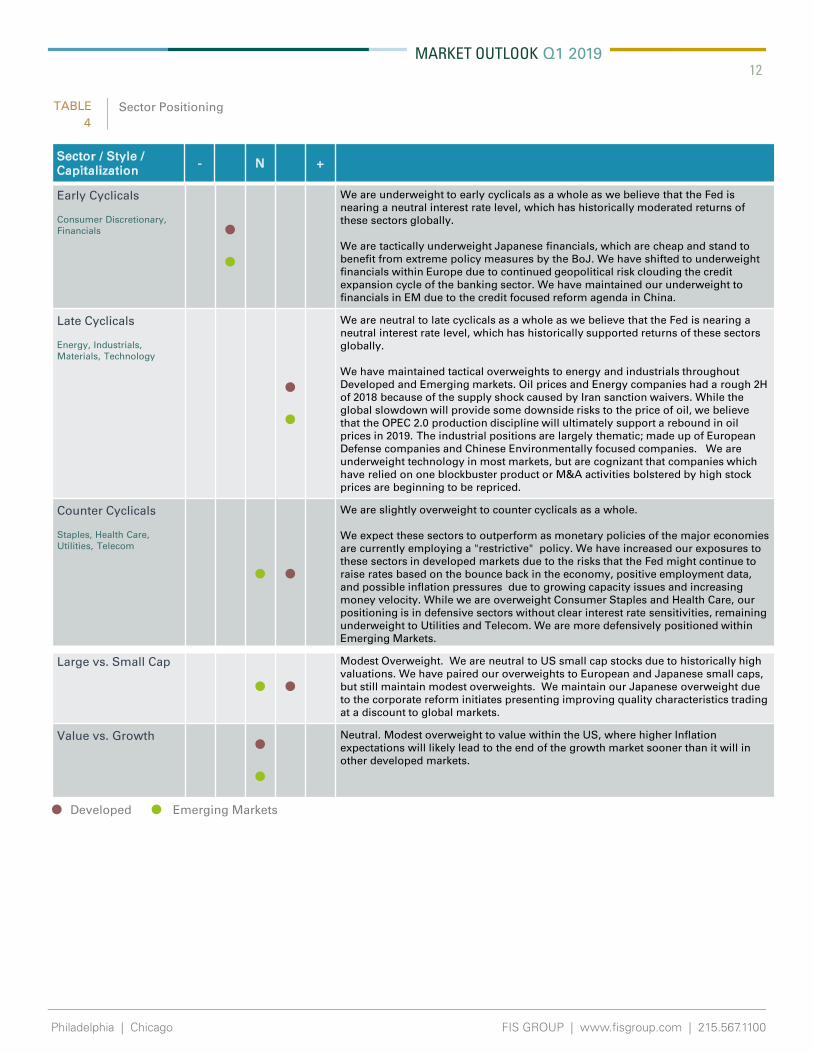
Early Cyclicals
Consumer Discretionary, Financials •
•
We are underweight to early cyclicals as a whole as we believe that the Fed is nearing a neutral interest rate level, which has historically moderated returns of these sectors globally.
We are tactically underweight Japanese financials, which are cheap and stand to benefit from extreme policy measures by the BoJ. We have shifted to underweight financials within Europe due to continued geopolitical risk clouding the credit expansion cycle of the banking sector. We have maintained our underweight to financials in EM due to the credit focused reform agenda in China.
Late Cyclicals
Energy, Industrials, Materials, Technology
••
We are neutral to late cyclicals as a whole as we believe that the Fed is nearing a neutral interest rate level, which has historically supported returns of these sectors globally.
We have maintained tactical overweights to energy and industrials throughout Developed and Emerging markets. Oil prices and Energy companies had a rough 2H of 2018 because of the supply shock caused by Iran sanction waivers. While the global slowdown will provide some downside risks to the price of oil, we believe that the OPEC 2.0 production discipline will ultimately support a rebound in oil prices in 2019. The industrial positions are largely thematic; made up of European Defense companies and Chinese Environmentally focused companies. We are underweight technology in most markets, but are cognizant that companies which have relied on one blockbuster product or M&A activities bolstered by high stock prices are beginning to be repriced.
Counter Cyclicals
Staples, Health Care, Utilities, Telecom
• •
We are slightly overweight to counter cyclicals as a whole.
We expect these sectors to outperform as monetary policies of the major economies are currently employing a "restrictive" policy. We have increased our exposures to these sectors in developed markets due to the risks that the Fed might continue to raise rates based on the bounce back in the economy, positive employment data, and possible inflation pressures due to growing capacity issues and increasing money velocity. While we are overweight Consumer Staples and Health Care, our positioning is in defensive sectors without clear interest rate sensitivities, remaining underweight to Utilities and Telecom. We are more defensively positioned within Emerging Markets.
Large vs. Small Cap
• •Modest Overweight. We are neutral to US small cap stocks due to historically high valuations. We have paired our overweights to European and Japanese small caps, but still maintain modest overweights. We maintain our Japanese overweight due to the corporate reform initiates presenting improving quality characteristics trading at a discount to global markets.
Value vs. Growth ••
Neutral. Modest overweight to value within the US, where higher Inflation expectations will likely lead to the end of the growth market sooner than it will in other developed markets.
Sector / Style / Capitalization
- N +
TABLE4
Sector Positioning
• Developed • Emerging Markets

Philadelphia | Chicago FIS GROUP | www.fisgroup.com | 215.567.1100
MARKET OUTLOOK Q1 2019 13
Important Disclosures:
This report is neither an offer to sell nor a solicitation to invest in any product offered by FIS Group, Inc. and should not be considered as investment advice. This report was prepared for clients and prospective clients of FIS Group and is intended to be used solely by such clients and prospects for educational and illustrative purposes. The information contained herein is proprietary to FIS Group and may not be duplicated or used for any purpose other than the educational purpose for which it has been provided. Any unauthorized use, duplication or disclosure of this report is strictly prohibited.
This report is based on information believed to be correct, but is subject to revision. Although the information provided herein has been obtained from sources which FIS Group believes to be reliable, FIS Group does not guarantee its accuracy, and such information may be incomplete or condensed. Additional information is avail-able from FIS Group upon request.
All performance and other projections are historical and do not guarantee future performance. No assurance can be given that any particular investment objective or strategy will be achieved at a given time and actual investment results may vary over any given time.