
Market Liquidity and Financial Fragility€¦ · Market Liquidity and Financial Fragility Danilo L....
75
. . . . . . . . . . . . . . . . . . . . . . . . . . . . . . . . . . . . . . . . . . . . . . . . . . . . . . . . . . . . . . . . . . . . . . . . . . . . . . . . . . . . . . . . . . . . Introduction . . . . . . Model . . . . Illustration . . . . . Stress-Test . Remarks Market Liquidity and Financial Fragility Danilo L. B. Wegner Australian Institute of Business XII Annual Seminar on Risk, Financial Stability and Banking August, 2017
Transcript of Market Liquidity and Financial Fragility€¦ · Market Liquidity and Financial Fragility Danilo L....

..........
..........................................................................
.....
......
..........
.
. . . . . .Introduction
. . . . . .Model
. . . .Illustration
. . . . .Stress-Test
.Remarks
Market Liquidity and Financial Fragility
Danilo L. B. Wegner
Australian Institute of Business
XII Annual Seminar on Risk, Financial Stability and BankingAugust, 2017

..........
..........................................................................
.....
......
..........
.
. . . . . .Introduction
. . . . . .Model
. . . .Illustration
. . . . .Stress-Test
.Remarks
Motivation
▶ Excess market liquidity, in the form of easy access to credit and theeasiness of buying and selling assets, seems to precede financial crises
▶ Market liquidity is heavily influenced by government and central bankpolicies, e.g. monetary policy
▶ Through their actions, therefore, governments and central banksaround the world affect the likelihood of crises
▶ 2007-2009 global financial crisis showed the need to design andimplement macro-prudential policies, by definion focusing on measuresof systemic risk
▶ As far as a measure of systemic risk is concerned, the topology offinancial markets matters, making network analysis very suitable
▶ Question: how government and central bank policies (by affectingmarket liquidity) impact systemic risk (by leading to changes infinancial networks)?

..........
..........................................................................
.....
......
..........
.
. . . . . .Introduction
. . . . . .Model
. . . .Illustration
. . . . .Stress-Test
.Remarks
Financial Intermediaries’ Balance-Sheet (Shin, 2009)

..........
..........................................................................
.....
......
..........
.
. . . . . .Introduction
. . . . . .Model
. . . .Illustration
. . . . .Stress-Test
.Remarks
Liquidity and Leverage (Adrian & Shin, 2008): HHolds

..........
..........................................................................
.....
......
..........
.
. . . . . .Introduction
. . . . . .Model
. . . .Illustration
. . . . .Stress-Test
.Remarks
Liquidity and Leverage (Adrian & Shin, 2008): CBanks

..........
..........................................................................
.....
......
..........
.
. . . . . .Introduction
. . . . . .Model
. . . .Illustration
. . . . .Stress-Test
.Remarks
Liquidity and Leverage (Adrian & Shin, 2008): IBanks

..........
..........................................................................
.....
......
..........
.
. . . . . .Introduction
. . . . . .Model
. . . .Illustration
. . . . .Stress-Test
.Remarks
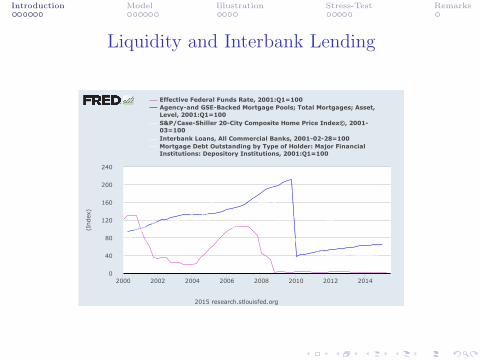
Liquidity and Interbank Lending
0
40
80
120
160
200
240
2000 2002 2004 2006 2008 2010 2012 2014
2015research.stlouisfed.org
EffectiveFederalFundsRate,2001:Q1=100
Agency-andGSE-BackedMortgagePools;TotalMortgages;Asset,
Level,2001:Q1=100
S&P/Case-Shiller20-CityCompositeHomePriceIndex©,2001-
03=100
InterbankLoans,AllCommercialBanks,2001-02-28=100
MortgageDebtOutstandingbyTypeofHolder:MajorFinancial
Institutions:DepositoryInstitutions,2001:Q1=100
(Index)

..........
..........................................................................
.....
......
..........
.
. . . . . .Introduction
. . . . . .Model
. . . .Illustration
. . . . .Stress-Test
.Remarks
Liquidity and Interbank Lending
0
40
80
120
160
200
240
2000 2002 2004 2006 2008 2010 2012 2014
2015research.stlouisfed.org
EffectiveFederalFundsRate,2001:Q1=100
Agency-andGSE-BackedMortgagePools;TotalMortgages;Asset,
Level,2001:Q1=100
S&P/Case-Shiller20-CityCompositeHomePriceIndex©,2001-
03=100
InterbankLoans,AllCommercialBanks,2001-02-28=100
MortgageDebtOutstandingbyTypeofHolder:MajorFinancial
Institutions:DepositoryInstitutions,2001:Q1=100
(Index)
..........
..........................................................................
.....
......
..........
.
. . . . . .Introduction
. . . . . .Model
. . . .Illustration
. . . . .Stress-Test
.Remarks
Liquidity and Interbank Lending
0
40
80
120
160
200
240
2000 2002 2004 2006 2008 2010 2012 2014
2015research.stlouisfed.org
EffectiveFederalFundsRate,2001:Q1=100
Agency-andGSE-BackedMortgagePools;TotalMortgages;Asset,
Level,2001:Q1=100
S&P/Case-Shiller20-CityCompositeHomePriceIndex©,2001-
03=100
InterbankLoans,AllCommercialBanks,2001-02-28=100
MortgageDebtOutstandingbyTypeofHolder:MajorFinancial
Institutions:DepositoryInstitutions,2001:Q1=100
(Index)

..........
..........................................................................
.....
......
..........
.
. . . . . .Introduction
. . . . . .Model
. . . .Illustration
. . . . .Stress-Test
.Remarks
Liquidity and Interbank Lending
0
40
80
120
160
200
240
2000 2002 2004 2006 2008 2010 2012 2014
2015research.stlouisfed.org
EffectiveFederalFundsRate,2001:Q1=100
Agency-andGSE-BackedMortgagePools;TotalMortgages;Asset,
Level,2001:Q1=100
S&P/Case-Shiller20-CityCompositeHomePriceIndex©,2001-
03=100
InterbankLoans,AllCommercialBanks,2001:Q1=100
MortgageDebtOutstandingbyTypeofHolder:MajorFinancial
Institutions:DepositoryInstitutions,2001:Q1=100
(Index)

..........
..........................................................................
.....
......
..........
.
. . . . . .Introduction
. . . . . .Model
. . . .Illustration
. . . . .Stress-Test
.Remarks
Related Literature▶ Financial crises:
▶ Diamond and Dybvig (JPE, 83); Shleifer and Vishny (JF, 92); Allenand Gale (EJ, 00), Abreu and Brunnermeier (ECTA, 03); Geanakoplos(NBER, 10); Brunnermeier and Pedersen (RFS, 09); Morris and Shin(AER, 98), He and Xiong (RFS, forth); Caballero and Krishnamurthy(JF, 08), Mendoza and Quadrini (JME, 10), Mendoza (AER, 10);
▶ Financial networks:▶ Rochet and Tirole (JMCB, 96), Kyiotaki and Moore (97), Allen and
Gale (JPE, 00), Freixas et al (JMCB, 00), Eisenberg and Noe (MS,01), Lagunoff and Schreft (JET, 01), Cifuentes et al (JEEA, 05), Nieret al (JEDC, 07), Brusco and Castiglionesi (JF, 07), Caballero andSimsek (11), Zawadowski (11);
▶ Network formation:
▶ Leitner (JF, 05), Babus (09), Castiglionesi and Navarro (11),Cohen-Cole et al (11);
▶ Government intervention:
▶ Huang and Xu (EER, 99), Gorton and Huang (AER, 04), Schneiderand Tornell (RES, 04), Corsetti et al (JME, 06), Morris and Shin (JIE,06), Acharya and Yorulmazer (JFI, 07), Ennis and Keister (AER, 09),Diamond and Rajan (11), Farhi and Tirole (AER, forth).

..........
..........................................................................
.....
......
..........
.
. . . . . .Introduction
. . . . . .Model
. . . .Illustration
. . . . .Stress-Test
.Remarks
Network Structures (Allen & Gale, 2000): Complete

..........
..........................................................................
.....
......
..........
.
. . . . . .Introduction
. . . . . .Model
. . . .Illustration
. . . . .Stress-Test
.Remarks
Network Structures (Allen & Gale, 2000): Incomplete
..........
..........................................................................
.....
......
..........
.
. . . . . .Introduction
. . . . . .Model
. . . .Illustration
. . . . .Stress-Test
.Remarks
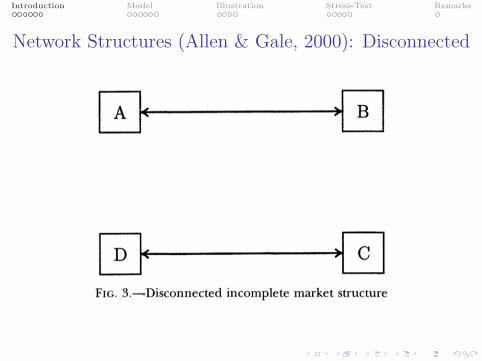
Network Structures (Allen & Gale, 2000): Disconnected

..........
..........................................................................
.....
......
..........
.
. . . . . .Introduction
. . . . . .Model
. . . .Illustration
. . . . .Stress-Test
.Remarks
Model▶ 1-good ($), three-period economy, t = 0, 1, 2;
▶ Economy divided in N regions, N = {1, . . . , N};▶ Each region has a representative bank from BN =
{B1, . . . , BN
}▶ Any bank has available two types of long-term, positive NPV projects:
▶ A large project that pays r∗i at t = 2 and costs $2 at t = 0;▶ A small project that pays ri at t = 2 and costs $1 at t = 0.
t=0 t=1
t=2
-2
r∗i
Large Project
t=0 t=1
t=2
-1
ri
Small Project
▶ Regions have continuums of depositors, each with $1 and utility:
U i (c1, c2) =
{c1, with probability ωi,c2, with probability 1− ωi.

..........
..........................................................................
.....
......
..........
.
. . . . . .Introduction
. . . . . .Model
. . . .Illustration
. . . . .Stress-Test
.Remarks
Banks’ Interaction Process
▶ At date 0, banks meet each other, randomly, in a pairwise fashion
▶ Assuming an even number N of banks, there will be N − 1 rounds ofinteraction, so that, with four banks,
Round 1:(B1 ↔ B2, B3 ↔ B4)
Round 2:(B1 ↔ B3, B2 ↔ B4)
Round 3:(B1 ↔ B4, B2 ↔ B3)
▶ At each round of interaction, banks collect $1 from depositors, receiveei as an equity endowment, and with that they decide whether to:
(i) Invest in a small project;(ii) Borrow from the other bank to invest in a large project;(iii) Lend to the other bank.

..........
..........................................................................
.....
......
..........
.
. . . . . .Introduction
. . . . . .Model
. . . .Illustration
. . . . .Stress-Test
.Remarks
Maturity Mismatch
▶ Banks partially finance long-term investments (projects or loans) withshort-term funds (from early depositors)
▶ Banks are assumed to be cash-constrained at t=1, i.e., they are forcedto sell - before maturity - a fraction of the investment in projects andloans in order to service early depositors
▶ Premature sell of assets at t = 1 comes at a fire-sale cost:
(i) One unit of payoff of a large project can be sold at ρ∗ < 1;(ii) One unit of payoff of a small project can be sold at ρ < 1.
▶ Large projects are most costly to be prematurely liquidated:
0 < ρ∗ < ρ < 1.

..........
..........................................................................
.....
......
..........
.
. . . . . .Introduction
. . . . . .Model
. . . .Illustration
. . . . .Stress-Test
.Remarks
Government Intervention
▶ Government reduces fire-sale costs by enhancing the market liquidityof projects and loans at t = 1
▶ Discount factors associated with the premature sell of assets are now:
(i) Large projects: ρ∗ + γ∗ (1− ρ∗);(ii) For small projects, ρ+ γ (1− ρ).
▶ No government intervention, γ∗ = γ = 0: original fire-sale cost
▶ Full government intervention, γ∗ = γ = 1: no fire-sale cost
▶ Too-big-to-fail policy: γ∗ > γ

..........
..........................................................................
.....
......
..........
.
. . . . . .Introduction
. . . . . .Model
. . . .Illustration
. . . . .Stress-Test
.Remarks
Effect of Government Intervention on Liquidity

..........
..........................................................................
.....
......
..........
.
. . . . . .Introduction
. . . . . .Model
. . . .Illustration
. . . . .Stress-Test
.Remarks
Effect of Government Intervention on Liquidity
Small Project Large Project

..........
..........................................................................
.....
......
..........
.
. . . . . .Introduction
. . . . . .Model
. . . .Illustration
. . . . .Stress-Test
.Remarks
Effect of Government Intervention on Liquidity
t0
Resale Price
0
Resale Price
t
Small Project Large Project

..........
..........................................................................
.....
......
..........
.
. . . . . .Introduction
. . . . . .Model
. . . .Illustration
. . . . .Stress-Test
.Remarks
Effect of Government Intervention on Liquidity
t0 2
Resale Price
0
Resale Price
t2
Small Project Large Project

..........
..........................................................................
.....
......
..........
.
. . . . . .Introduction
. . . . . .Model
. . . .Illustration
. . . . .Stress-Test
.Remarks
Effect of Government Intervention on Liquidity
t0 2
Resale Price
ri
0
Resale Price
r∗i
t2
Small Project Large Project

..........
..........................................................................
.....
......
..........
.
. . . . . .Introduction
. . . . . .Model
. . . .Illustration
. . . . .Stress-Test
.Remarks
Effect of Government Intervention on Liquidity
t0 1 2
Resale Price
ri
0 1
Resale Price
r∗i
t2
Small Project Large Project

..........
..........................................................................
.....
......
..........
.
. . . . . .Introduction
. . . . . .Model
. . . .Illustration
. . . . .Stress-Test
.Remarks
Effect of Government Intervention on Liquidity
t0 1 2
Resale Price
ri
riρ
0 1
Resale Price
r∗i
r∗i ρ∗
t2
λ
Resale Price at t=1
λ∗
Resale Price at t=1
Small Project Large Project
Factor: ρ+ λ (1− ρ) Factor: ρ∗ + λ∗ (1− ρ∗)

..........
..........................................................................
.....
......
..........
.
. . . . . .Introduction
. . . . . .Model
. . . .Illustration
. . . . .Stress-Test
.Remarks
Effect of Government Intervention on Liquidity
t0 1 2
Resale Price
ri
riρ
0 1
Resale Price
r∗i
r∗i ρ∗
t2
λ0
Resale Price at t=1
riρ
λ∗0
Resale Price at t=1
r∗i ρ∗
Small Project Large Project
Factor: ρ+ λ (1− ρ) Factor: ρ∗ + λ∗ (1− ρ∗)

..........
..........................................................................
.....
......
..........
.
. . . . . .Introduction
. . . . . .Model
. . . .Illustration
. . . . .Stress-Test
.Remarks
Effect of Government Intervention on Liquidity
t0 1 2
Resale Price
ri
riρ
0 1
Resale Price
r∗i
r∗i ρ∗
t2
λ0 1
Resale Price at t=1
ri
riρ
λ∗0 1
Resale Price at t=1
r∗i
r∗i ρ∗
Small Project Large Project
Factor: ρ+ λ (1− ρ) Factor: ρ∗ + λ∗ (1− ρ∗)

..........
..........................................................................
.....
......
..........
.
. . . . . .Introduction
. . . . . .Model
. . . .Illustration
. . . . .Stress-Test
.Remarks
Timeline of Events
▶ t = 0:
1. Banks meet pairwise, randomly, deciding at each meeting:
(i) Whether or not to form a link (extend or take a loan)(ii) How much to invest in the short-term asset(iii) How much of the long-term asset (project or loan) to sell in
order to service early depositors
▶ t = 1:
1. Banks execute the selling strategy2. Together with the investment in the short-term asset, proceeds
are used to pay early depositors
▶ t = 2:
1. Payoffs from long-term assets (projects and loans) are realized,with the fraction not previously sold accruing to the banks
2. Banks pay late depositors and clear positions with other banks,consuming the remainings as profits

..........
..........................................................................
.....
......
..........
.
. . . . . .Introduction
. . . . . .Model
. . . .Illustration
. . . . .Stress-Test
.Remarks
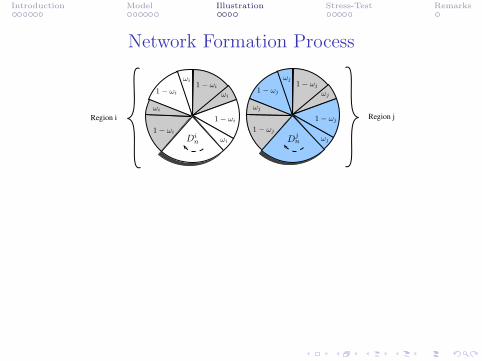
Network Formation Process

..........
..........................................................................
.....
......
..........
.
. . . . . .Introduction
. . . . . .Model
. . . .Illustration
. . . . .Stress-Test
.Remarks
Network Formation Process
Region i Region j
..........
..........................................................................
.....
......
..........
.
. . . . . .Introduction
. . . . . .Model
. . . .Illustration
. . . . .Stress-Test
.Remarks
Network Formation Process
1− ωi
ωi
ωi1− ωi
ωi
1− ωi
1− ωj
ωj
ωj1− ωj
ωj
1− ωjRegion i Region j
1− ωi
ωiDin
1− ωj
ωjDjn

..........
..........................................................................
.....
......
..........
.
. . . . . .Introduction
. . . . . .Model
. . . .Illustration
. . . . .Stress-Test
.Remarks
Network Formation Process
Bank i Bank j
1− ωi
ωi
ωi1− ωi
ωi
1− ωi
1− ωj
ωj
ωj1− ωj
ωj
1− ωjRegion i Region j
1− ωi
ωiDin
1− ωj
ωjDjn

..........
..........................................................................
.....
......
..........
.
. . . . . .Introduction
. . . . . .Model
. . . .Illustration
. . . . .Stress-Test
.Remarks
Network Formation Process
Bank i Bank jSmallProject i
SmallProject j
1− ωi
ωi
ωi1− ωi
ωi
1− ωi
1− ωj
ωj
ωj1− ωj
ωj
1− ωjRegion i Region j
1− ωi
ωiDin
1− ωj
ωjDjn

..........
..........................................................................
.....
......
..........
.
. . . . . .Introduction
. . . . . .Model
. . . .Illustration
. . . . .Stress-Test
.Remarks
Network Formation Process
Bank i Bank j
Large Project jLarge Project i
SmallProject i
SmallProject j
1− ωi
ωi
ωi1− ωi
ωi
1− ωi
1− ωj
ωj
ωj1− ωj
ωj
1− ωjRegion i Region j
1− ωi
ωiDin
1− ωj
ωjDjn

..........
..........................................................................
.....
......
..........
.
. . . . . .Introduction
. . . . . .Model
. . . .Illustration
. . . . .Stress-Test
.Remarks
Network Formation Process: Autarky
Bank i Bank j
Large Project jLarge Project i
SmallProject i
SmallProject j
1− ωi
ωi
1− ωj
ωj
Region i Region j

..........
..........................................................................
.....
......
..........
.
. . . . . .Introduction
. . . . . .Model
. . . .Illustration
. . . . .Stress-Test
.Remarks
Network Formation Process: Autarky
Bank i Bank j
Large Project jLarge Project i
SmallProject i
SmallProject j
1− ωi
ωi
1− ωj
ωj
Region i Region j
$1 $1

..........
..........................................................................
.....
......
..........
.
. . . . . .Introduction
. . . . . .Model
. . . .Illustration
. . . . .Stress-Test
.Remarks
Network Formation Process: Autarky
Bank i Bank j
Large Project jLarge Project i
SmallProject i
SmallProject j
1− ωi
ωi
1− ωj
ωj
Region i Region j
$1
$1 $1
$1

..........
..........................................................................
.....
......
..........
.
. . . . . .Introduction
. . . . . .Model
. . . .Illustration
. . . . .Stress-Test
.Remarks
Network Formation Process: Autarky
Bank i Bank j
Large Project jLarge Project i
SmallProject i
SmallProject j
rjri
1− ωi
ωi
1− ωj
ωj
Region i Region j
$1
$1 $1 $1 $1
$1

..........
..........................................................................
.....
......
..........
.
. . . . . .Introduction
. . . . . .Model
. . . .Illustration
. . . . .Stress-Test
.Remarks
Network Formation Process: Autarky
Bank i Bank j

..........
..........................................................................
.....
......
..........
.
. . . . . .Introduction
. . . . . .Model
. . . .Illustration
. . . . .Stress-Test
.Remarks
Network Formation Process: j to i
Bank i Bank j
Large Project jLarge Project i
SmallProject i
SmallProject j
1− ωi
ωi
1− ωj
ωj
Region i Region j

..........
..........................................................................
.....
......
..........
.
. . . . . .Introduction
. . . . . .Model
. . . .Illustration
. . . . .Stress-Test
.Remarks
Network Formation Process: j to i
Bank i Bank j
Large Project jLarge Project i
SmallProject i
SmallProject j
1− ωi
ωi
1− ωj
ωj
Region i Region j
$1 $1

..........
..........................................................................
.....
......
..........
.
. . . . . .Introduction
. . . . . .Model
. . . .Illustration
. . . . .Stress-Test
.Remarks
Network Formation Process: j to i
Bank i Bank j
Large Project jLarge Project i
SmallProject i
SmallProject j
1− ωi
ωi
1− ωj
ωj
Region i Region j
$1 $1
$1

..........
..........................................................................
.....
......
..........
.
. . . . . .Introduction
. . . . . .Model
. . . .Illustration
. . . . .Stress-Test
.Remarks
Network Formation Process: j to i
Bank i Bank j
Large Project jLarge Project i
SmallProject i
SmallProject j
1− ωi
ωi
1− ωj
ωj
Region i Region j
$1 $1
$1
$2

..........
..........................................................................
.....
......
..........
.
. . . . . .Introduction
. . . . . .Model
. . . .Illustration
. . . . .Stress-Test
.Remarks
Network Formation Process: j to i
Bank i Bank j
Large Project jLarge Project i
SmallProject i
SmallProject j
r∗i
rj
1− ωi
ωi
1− ωj
ωj
Region i Region j
$1 $1 $1
$1
$2

..........
..........................................................................
.....
......
..........
.
. . . . . .Introduction
. . . . . .Model
. . . .Illustration
. . . . .Stress-Test
.Remarks
Network Formation Process: j to i
Bank i Bank j
Large Project jLarge Project i
SmallProject i
SmallProject j
r∗i
rj
1− ωi
ωi
1− ωj
ωj
Region i Region j
$1 $1 $1 $1
$1
$2

..........
..........................................................................
.....
......
..........
.
. . . . . .Introduction
. . . . . .Model
. . . .Illustration
. . . . .Stress-Test
.Remarks
Network Formation Process: j to i
Bank i Bank j

..........
..........................................................................
.....
......
..........
.
. . . . . .Introduction
. . . . . .Model
. . . .Illustration
. . . . .Stress-Test
.Remarks
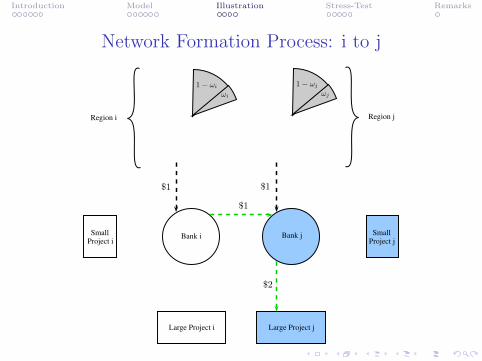
Network Formation Process: i to j
Bank i Bank j
Large Project jLarge Project i
SmallProject i
SmallProject j
1− ωi
ωi
1− ωj
ωj
Region i Region j

..........
..........................................................................
.....
......
..........
.
. . . . . .Introduction
. . . . . .Model
. . . .Illustration
. . . . .Stress-Test
.Remarks
Network Formation Process: i to j
Bank i Bank j
Large Project jLarge Project i
SmallProject i
SmallProject j
1− ωi
ωi
1− ωj
ωj
Region i Region j
$1 $1

..........
..........................................................................
.....
......
..........
.
. . . . . .Introduction
. . . . . .Model
. . . .Illustration
. . . . .Stress-Test
.Remarks
Network Formation Process: i to j
Bank i Bank j
Large Project jLarge Project i
SmallProject i
SmallProject j
1− ωi
ωi
1− ωj
ωj
Region i Region j
$1 $1
$1
..........
..........................................................................
.....
......
..........
.
. . . . . .Introduction
. . . . . .Model
. . . .Illustration
. . . . .Stress-Test
.Remarks
Network Formation Process: i to j
Bank i Bank j
Large Project jLarge Project i
SmallProject i
SmallProject j
1− ωi
ωi
1− ωj
ωj
Region i Region j
$1 $1
$1
$2

..........
..........................................................................
.....
......
..........
.
. . . . . .Introduction
. . . . . .Model
. . . .Illustration
. . . . .Stress-Test
.Remarks
Network Formation Process: i to j
Bank i Bank j
Large Project jLarge Project i
SmallProject i
SmallProject j
r∗j
ri
1− ωi
ωi
1− ωj
ωj
Region i Region j
$1 $1 $1
$1
$2

..........
..........................................................................
.....
......
..........
.
. . . . . .Introduction
. . . . . .Model
. . . .Illustration
. . . . .Stress-Test
.Remarks
Network Formation Process: i to j
Bank i Bank j
Large Project jLarge Project i
SmallProject i
SmallProject j
r∗j
ri
1− ωi
ωi
1− ωj
ωj
Region i Region j
$1 $1 $1 $1
$1
$2

..........
..........................................................................
.....
......
..........
.
. . . . . .Introduction
. . . . . .Model
. . . .Illustration
. . . . .Stress-Test
.Remarks
Network Formation Process: i to j
Bank i Bank j

..........
..........................................................................
.....
......
..........
.
. . . . . .Introduction
. . . . . .Model
. . . .Illustration
. . . . .Stress-Test
.Remarks
Network Formation Process: Continuation
Bank i Bank j
Large Project jLarge Project i
SmallProject i
SmallProject j
r∗i r∗j
rjri
rirj
1− ωi
ωi
1− ωj
ωj
Region i Region j
$1
$1 $1 $1 $1
$1$1
$1
$2 $2

..........
..........................................................................
.....
......
..........
.
. . . . . .Introduction
. . . . . .Model
. . . .Illustration
. . . . .Stress-Test
.Remarks
Network Formation Process: Continuation
Bank i Bank g
Large Project gLarge Project i
SmallProject i
SmallProject g
r∗i r∗g
rgri
rirg
1− ωi
ωi
1− ωi
1− ωg
ωg
1− ωgRegion i Region g
ωi ωg
$1
$1 $1 $1 $1
$1$1
$1
$2 $2

..........
..........................................................................
.....
......
..........
.
. . . . . .Introduction
. . . . . .Model
. . . .Illustration
. . . . .Stress-Test
.Remarks
Network Formation Process: Continuation
Bank i Bank p
Large Project pLarge Project i
SmallProject i
SmallProject p
r∗i r∗p
rpri
rirp
1− ωi
ωi
1− ωi
1− ωp
ωp
1− ωpRegion i Region p
ωiDin ωp
$1
$1 $1 $1 $1
$1$1
$1
$2 $2
Dpn

..........
..........................................................................
.....
......
..........
.
. . . . . .Introduction
. . . . . .Model
. . . .Illustration
. . . . .Stress-Test
.Remarks
Network Formation Process: Continuation
Bank i Bank y
Large Project yLarge Project i
SmallProject i
SmallProject y
r∗i r∗y
ryri
riry
ωi
1− ωi
ωi
1− ωi
ωy
1− ωy
ωy
1− ωyRegion i Region y
1− ωi
ωiDin
1− ωy
ωy
$1
$1 $1 $1 $1
$1$1
$1
$2 $2
Dyn

..........
..........................................................................
.....
......
..........
.
. . . . . .Introduction
. . . . . .Model
. . . .Illustration
. . . . .Stress-Test
.Remarks
Network Formation Process: Continuation
Bank i Bank o
Large Project oLarge Project i
SmallProject i
SmallProject o
r∗i r∗o
rori
riro
1− ωi
ωi
ωi1− ωi
ωi
1− ωi
1− ωo
ωo
ωo1− ωo
ωo
1− ωoRegion i Region o
1− ωi
ωiDin
1− ωo
ωo
$1
$1 $1 $1 $1
$1$1
$1
$2 $2
Don

..........
..........................................................................
.....
......
..........
.
. . . . . .Introduction
. . . . . .Model
. . . .Illustration
. . . . .Stress-Test
.Remarks
Characterization of the Financial System
▶ Networks are characterized by the adjacency matrix,
X =
0 χ12 · · · χ1N
χ21 0 · · · χ2N
......
. . ....
χN1 χN2 · · · 0
,
and the parameters of the model,
r∗ =
r∗1r∗2...r∗N
r =
r1r2...rN
ω =
ω1
ω2
...ωN
e =
e1e2...eN
plus the fire-sale and government intervention parameters, ρ, ρ∗ and γand γ∗, respectively

..........
..........................................................................
.....
......
..........
.
. . . . . .Introduction
. . . . . .Model
. . . .Illustration
. . . . .Stress-Test
.Remarks
Payoff Shocks
t=0 t=1
t=2
-2
r∗i
Large Project
t=0 t=1
t=2
-1
ri
Small Project

..........
..........................................................................
.....
......
..........
.
. . . . . .Introduction
. . . . . .Model
. . . .Illustration
. . . . .Stress-Test
.Remarks
Payoff Shocks
t=0 t=1
t=2
-2
r∗i
Large Project
t=0 t=1
t=2
-1
ri
Small Project
δ∗
δ

..........
..........................................................................
.....
......
..........
.
. . . . . .Introduction
. . . . . .Model
. . . .Illustration
. . . . .Stress-Test
.Remarks
Payoff Shocks
t=0 t=1
t=2
-2
Large Project
t=0 t=1
t=2
-1
Small Project
r∗i (1− δ∗)ri (1− δ)

..........
..........................................................................
.....
......
..........
.
. . . . . .Introduction
. . . . . .Model
. . . .Illustration
. . . . .Stress-Test
.Remarks
Measures of Fragility: Single Shocks
▶ Consider a network with N banks, and take an arbitrary bank i facingshocks in its projects. The set
Di :={j∣∣∆j > W j
}contains all those banks that become distressed after bank i is hit by a shock
▶ The cardinality of this set,∣∣Di
∣∣, thus, gives the total number of failuresfollowing bank i’s shocks
▶ The index
f i :=∣∣Di
∣∣gives, therefore, a measure of the relative fragility of the network to bank i,for a particular realization of shocks that it faces
▶ By doing the same for every bank j ̸= i in the network and combining allthe results, for instance taking
f :=∑i∈N
f i,
one has a measure of the overall fragility of the network relative to theindividual failure of its members

..........
..........................................................................
.....
......
..........
.
. . . . . .Introduction
. . . . . .Model
. . . .Illustration
. . . . .Stress-Test
.Remarks
Example
▶ Network with 6 banks, generated under ρ∗ = 0.05ρ, γ∗ = 0.8 andγ = 0.3, and its non-government counterpart, i.e., the one obtained inthe same way but with γ∗ = γ = 0. The other parameters used aregiven by:
r∗ r ω e
Bank 1 3.23 1.19 0.05 0.04
Bank 2 3.00 1.01 0.17 0.12
Bank 3 2.22 1.19 0.15 0.11
Bank 4 2.55 1.08 0.09 0.07
Bank 5 2.97 1.00 0.15 0.12
Bank 6 2.71 1.21 0.14 0.10

..........
..........................................................................
.....
......
..........
.
. . . . . .Introduction
. . . . . .Model
. . . .Illustration
. . . . .Stress-Test
.Remarks
Example (cont’d)
Network w/ Govt Intervention
1
23
4
5 6
Network w/ No Govt Intervention
1
23
4
5 6
Government No GovernmentBank LR Links Failures Networth Bank LR Links Failures Networth5.00 0.69 4.00 1152.00 4.08 6.00 0.82 3.00 1598.00 1.823.00 0.79 2.00 1138.00 1.86 5.00 0.68 3.00 1074.00 3.672.00 0.63 5.00 1108.00 6.04 2.00 0.62 4.00 745.00 5.321.00 0.67 3.00 1063.00 3.79 4.00 0.91 0.00 572.00 0.506.00 0.81 1.00 698.00 1.42 1.00 0.70 2.00 203.00 2.814.00 0.91 0.00 0.00 0.50 3.00 0.83 0.00 0.00 0.89

..........
..........................................................................
.....
......
..........
.
. . . . . .Introduction
. . . . . .Model
. . . .Illustration
. . . . .Stress-Test
.Remarks
Final Remarks
▶ Trade-off: networth and fragility
▶ Introducing measures of welfare and characterizing an efficient frontierof financial networks
▶ Can the model generate the type of financial networks most typicallyobserved (core-periphery)?
▶ How to identify networks?