Market Intervention under Competitive Market Conditions.
19
Market Market Intervention under Intervention under Competitive Market Competitive Market Conditions Conditions
-
Upload
dominic-perez -
Category
Documents
-
view
225 -
download
0
Transcript of Market Intervention under Competitive Market Conditions.

Market Intervention Market Intervention under Competitive under Competitive Market ConditionsMarket Conditions
Market Intervention Market Intervention under Competitive under Competitive Market ConditionsMarket Conditions
Overview• Efficiency of a competitive
market• Implications of:-1. Price controls2. Supply restrictions3. Import tariff/quota4. Tax/subsidy
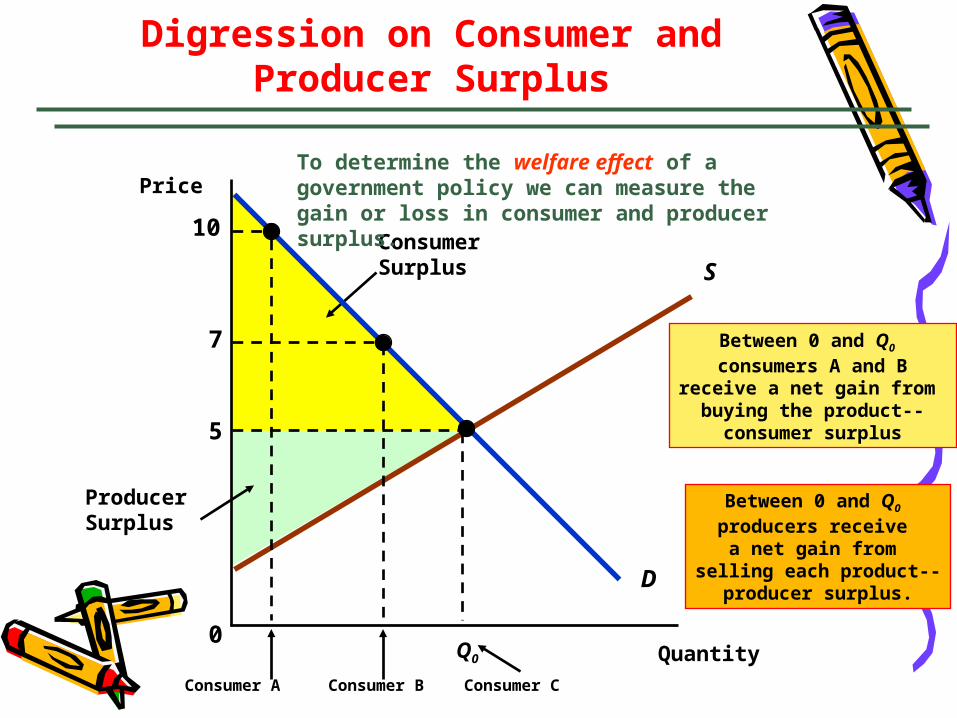
ProducerSurplus
Between 0 and Q0 producers receive
a net gain from selling each product--
producer surplus.
ConsumerSurplus
Digression on Consumer and Producer Surplus
Quantity0
Price
S
D
5
Q0
Consumer C
10
7
Consumer BConsumer A
Between 0 and Q0 consumers A and B
receive a net gain from buying the product--consumer surplus
To determine the welfare effect of a government policy we can measure the gain or loss in consumer and producer surplus.
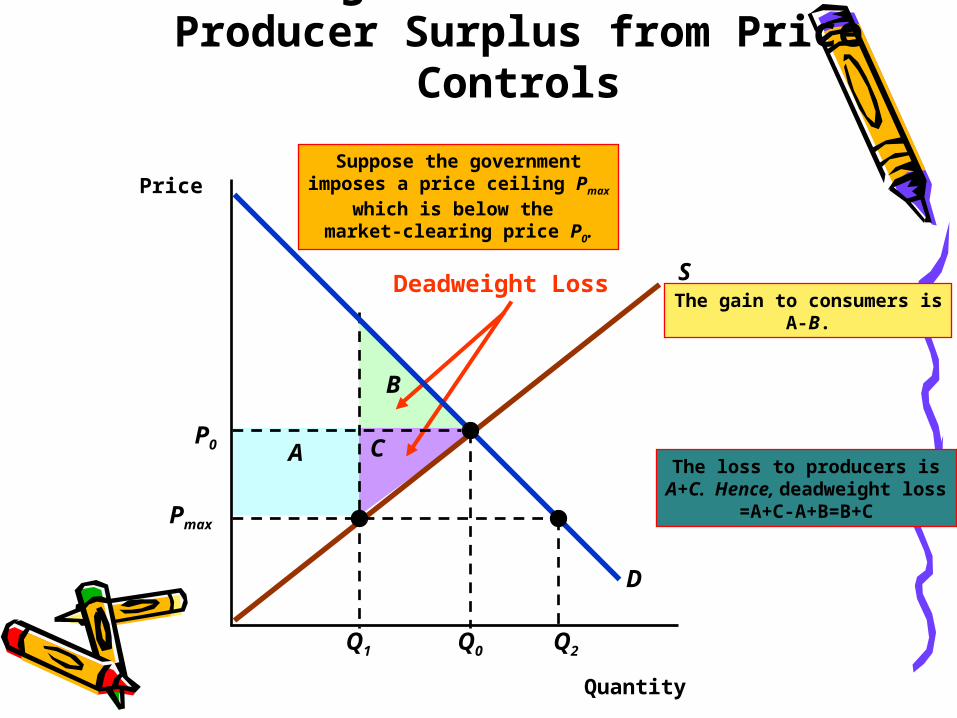
The loss to producers isA+C. Hence, deadweight loss
=A+C-A+B=B+C
B
A C
The gain to consumers isA-B.
Deadweight Loss
Change in Consumer andProducer Surplus from Price
Controls
Quantity
Price
S
D
P0
Q0
Pmax
Q1 Q2
Suppose the governmentimposes a price ceiling Pmax
which is below the market-clearing price P0.

B
APmax
C
Q1
If demand is sufficientlyinelastic, triangle B can be larger than rectangle
A and the consumer suffers a net loss from
price controls.
ExampleOil price controls
and gasoline shortagesin 1979
S
D
Effect of Price ControlsWhen Demand Is Inelastic
Quantity
Price
P0
Q2
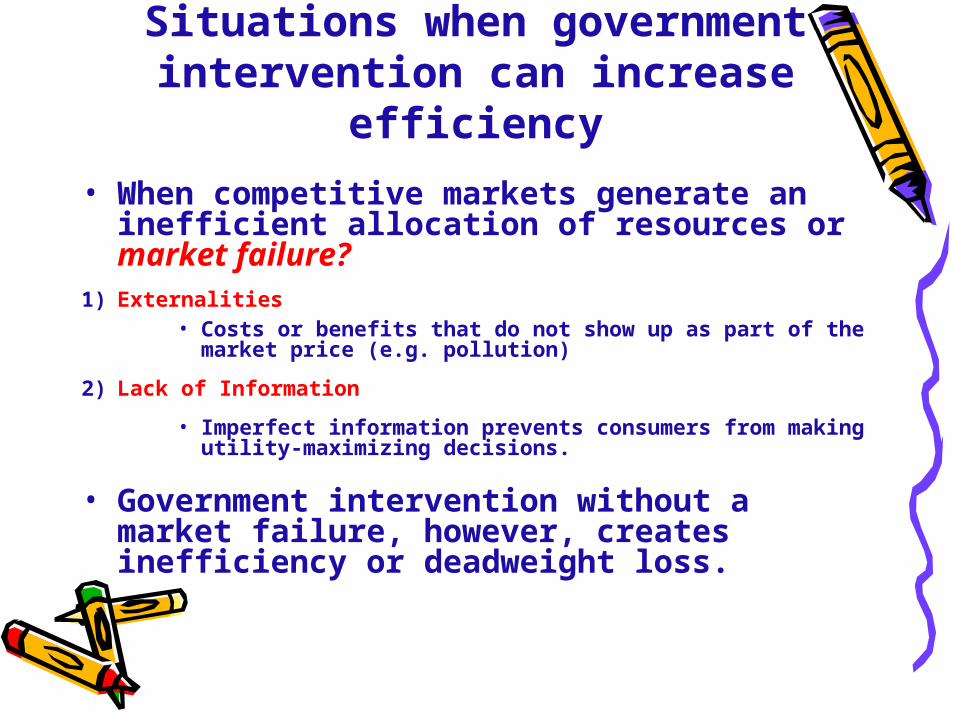
Situations when government intervention can increase
efficiency
• When competitive markets generate an inefficient allocation of resources or market failure?
1) Externalities• Costs or benefits that do not show up as part of the
market price (e.g. pollution)
2) Lack of Information
• Imperfect information prevents consumers from making utility-maximizing decisions.
• Government intervention without a market failure, however, creates inefficiency or deadweight loss.
P2
Q3
A B
C
Q2
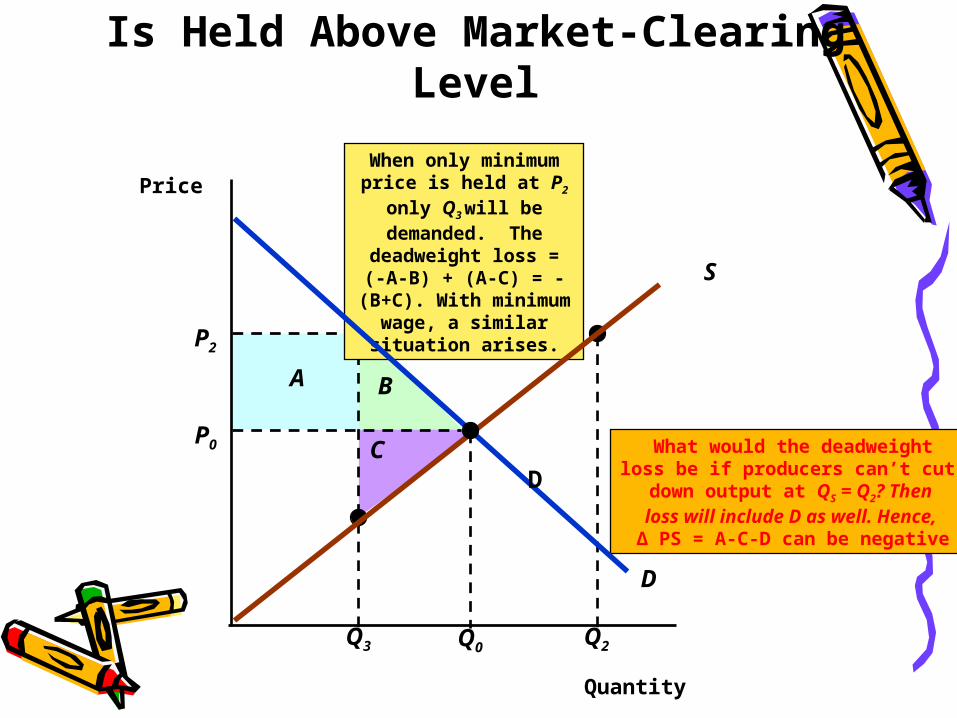
What would the deadweightloss be if producers can’t cut down output at QS = Q2? Then
loss will include D as well. Hence, ∆ PS = A-C-D can be negative
When only minimum price is held at P2 only Q3 will be demanded. The deadweight loss =(-A-B) + (A-C) = -(B+C).
With minimum wage, a similar situation arises.
Welfare Loss When PriceIs Held Above Market-Clearing
Level
Quantity
Price
S
D
P0
Q0
D

D + Qg
Qg
BA
Price support with govt. purchase vs. direct income
support
Quantity
PriceS
D
P0
Q0
Ps
Q2Q1
The cost to the government is the speckled rectangle
Ps(Q2-Q1)
D
C
∆ CS=-A-B; ∆ PS =A+B+DTotal welfare loss=
∆ CS + ∆ PS – Govt. Cost=D-(Q2-Q1)ps
Govt. purchase
With direct income support of A+B+D, total loss is limited to 0+(A+B+D) –(A+B+D) = 0, i.e., free-market is undisturbed
With acreage restriction∆ CS=-A-B; ∆ PS =A-C+(B+C+D)=A+B+D; govt. cost=-(B+C+D). Hence, total loss =-(B+C)
BA
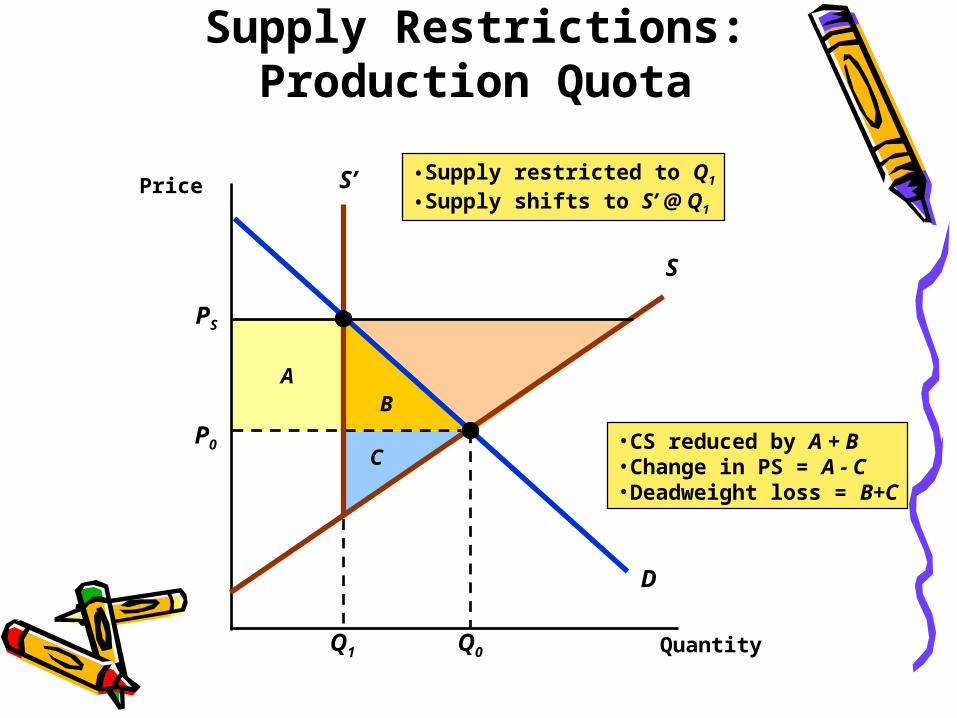
•CS reduced by A + B•Change in PS = A - C•Deadweight loss = B+C
C
Supply Restrictions: Production Quota
Quantity
Price
D
P0
Q0
S
PS
S’
Q1
•Supply restricted to Q1
•Supply shifts to S’ @ Q1
QS QD
PW
Imports
AB C
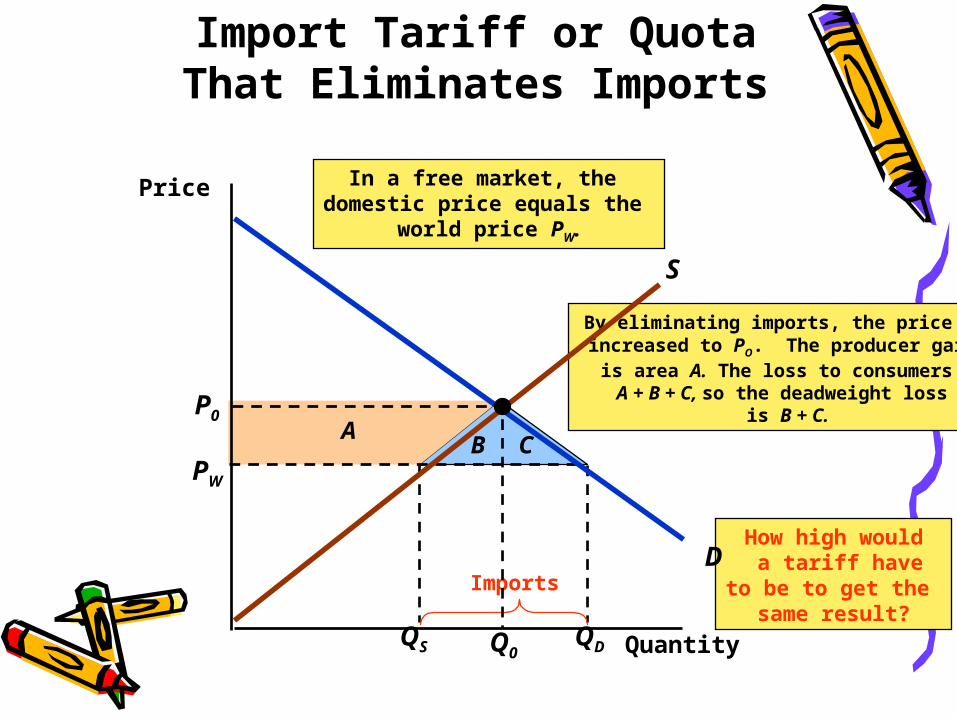
By eliminating imports, the price is increased to PO. The producer gain is area A. The loss to consumers =A + B + C, so the deadweight loss
is B + C.
Import Tariff or QuotaThat Eliminates Imports
Quantity
Price
How high would a tariff have
to be to get the same result?
D
P0
Q0
S
In a free market, the domestic price equals the
world price PW.

• Question:– Would the U.S. be
better off or worse off with a quota instead of a tariff? (e.g. Japanese import restrictions in the 1980s)
Import Tariff or Quota(general case)
DCB
QS QDQ’S Q’D
AP*
Pw
Quantity
D
SPrice

Import Tariff or Quota(general case)
• If a tariff is used the government gains D, so the net domestic product loss is B + C.
• If a quota is used instead, rectangle D becomes part of the profits of foreign producers, and the net domestic loss is B + C + D.
DCB
QS QDQ’S Q’D
AP*
Pw
Quantity
D
SPrice

Example: The Sugar Quota
• The world price of sugar has been as low as 4 cents per pound, while in the U.S. the price has been 20-25 cents per pound.

C
D
B
QS = 4.0 Q’S = 15.6 Q’d = 21.1
Qd = 24.2
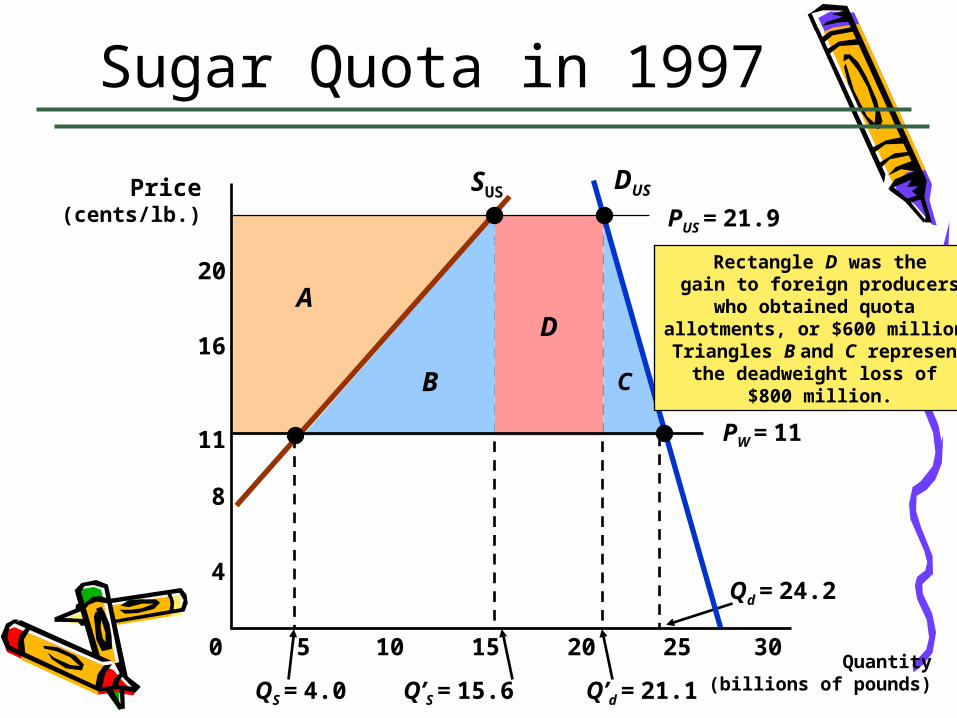
AThe cost of the quotas
to consumers was A + B + C + D, or $2.4b. The gain to producers
was area A, or $1b.
Sugar Quota in 1997
Quantity(billions of pounds)
Price(cents/lb.)
SUS DUS
5 10 15 20 250
4
8
11
16
20
PW = 11
PUS = 21.9
30
C
D
B
QS = 4.0 Q’S = 15.6 Q’d = 21.1
Qd = 24.2
A
Sugar Quota in 1997
Quantity(billions of pounds)
Price(cents/lb.)
SUS DUS
5 10 15 20 250
4
8
11
16
20
PW = 11
PUS = 21.9
30
Rectangle D was thegain to foreign producers
who obtained quota allotments, or $600 million.Triangles B and C represent
the deadweight loss of $800 million.

The Impact of a Tax or Subsidy
• The burden of a tax (or the benefit of a subsidy) falls partly on the consumer and partly on the producer.
• We will consider a specific tax which is a tax of a certain amount of money per unit sold.

D
S
B
D
ABuyers lose A + B, andsellers lose D + C, and
the government earns A + D in revenue. The deadweight
loss is B + C.C
Incidence of a SpecificTax
Quantity
Price
P0
Q0Q1
PS
Pb
t
Pb is the price (includingthe tax) paid by buyers.
PS is the price sellers receive,net of the tax. The burdenof the tax is split evenly.

Impact of a Tax Dependson Elasticities of Supply and
Demand
Quantity Quantity
Price Price
S
D S
D
Q0
P0 P0
Q0Q1
Pb
PS
t
Q1
Pb
PS
t
Burden on Buyer Burden on Seller

The Effects of a Subsidy
• A subsidy can be analyzed in much the same way as a tax.
• It can be treated as a negative tax.
• The seller’s price exceeds the buyer’s price.


![[Economics] Perfectly Competitive Market](https://static.fdocuments.net/doc/165x107/55847362d8b42a6b4d8b4d5a/economics-perfectly-competitive-market.jpg)