Market Intelligence Report - APEDA
24
Market Intelligence Report Dairy Products Cheese Skimmed Milk Powder
Transcript of Market Intelligence Report - APEDA

Market Intelligence Report
Dairy Products
Cheese
Skimmed Milk Powder

ABOUT INDIAN AND GLOBAL DAIRY FARMING
Global Dairy Farming in 2018 at 843 million
tons increased by 2.2 percent from 2017.
This majorly occurred due to production
expansion in India, Turkey, European Union,
Pakistan, the United States of America and
Argentina but was also partially offset by
declines in China and Ukraine.
World exports of dairy products expanded
to 75 million tons and increase of 2.1
million tons and 2.9 percent up from 2017.
Across the main dairy products, Skim milk
powder expanded by 8.6 percent to 2.6
million tons, where in imports sharply
expanded in China, Mexico, Egypt and
Indonesia and the bulk of the expanded
export supplies came from the United
States of America, Mexico, the European
Union and Belarus. Cheese exports also
increased at large to 2.57 million tons, up
by 0.8 percent in 2018, compared to a 4.6
percent increase in 2017 mainly supplied by
the EU, the United States of America, New
Zealand, Belarus and Australia, accounting
for 73 percent of total world trade.
The global dairy export market is highly
concentrated. Germany remains the largest
exporter of dairy products with a share of
15 per cent which is followed by France,
New Zealand, the Netherlands, Belgium,
USA and Denmark. Germany has been the
world’s major dairy importer as well with a
share of 10 per cent. Other large dairy
products importers are Italy, United
Kingdom, France, Belgium, the Netherlands,
Spain and USA.
In terms of price a decline was observed
from 2017, with the highest fall registered
for Skim Milk Powder (-5.6 percent), Cheese
(-5.2 percent), butter(-4.4 percent) and
Whole Milk Powder (-2.9 percent). Milk
output increased to 346.9 million tons, in
Asia. The rise was observed due to India,
Pakistan and China. In Europe, milk output
increased due to 226.4 million tons in 2018,
with higher outputs in European Union,
Russian Federation and Belarus. In North
America, mainly Canada and the United
States of America milk output increased to
108.6 million tons, an increase of 1.1
percent from 2017. Africa, saw and
estimated increase of 1.1 percent due to
large milk producing countries like Kenya,
South Africa, Algeria and Morocco.
A rise in production is seen due to
improvements in milk collection processes
(India and Pakistan), efficiency increase in
integrated dairy production systems
(Turkey), increased yield per cow (the
European Union and the United States of
America) and higher demands from
processing sector and imports (Argentina).

INDIA
In India, the milk production increased by
5.6 percent in 2018 which was extensively
driven by expanded dairy herd and
incremental improvement to milk collection
systems and higher productivity. However,
it was slightly lower than for the preceding
two years. The reason for this was mainly
linked to limited fodder available, on
account of below average rainfall received
during monsoon. The growth rates of both
exports and imports have increased for India.
India’s exports performance is not up to its true
potential. The reasons for this are high
population pressure, low level of milk
processing, high transportation costs, stringent
food safety measures, occasional ban on export
dairy products, poor quality and hygiene
standards of dairy products being exported,
insufficient international marketing efforts and
highly protected world dairy markets.
India is the largest exporter of dairy
products in Asia, major importing of dairy
products being Bangladesh, the United Arab
Emirates, Pakistan, Nepal, and Bhutan. It
exports Skim Milk Powder (SMP), butter,
Whole Milk Powder (WMP), casein and
ghee. The chief dairy products imported by
India are butter oil, whey products, cheese
and milk powders. Major nations from
where gets its dairy products are Denmark,
Nepal, the United States of America,
France, the Netherlands and Italy.
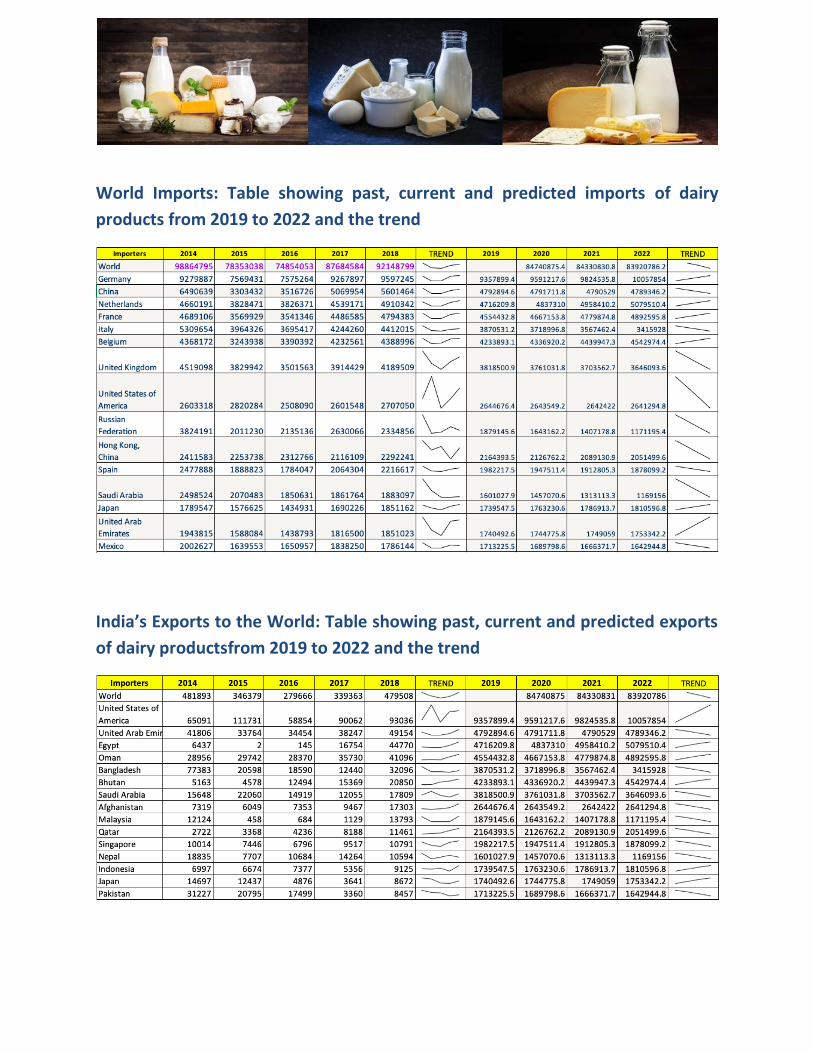
World Imports: Table showing past, current and predicted imports of dairy
products from 2019 to 2022 and the trend
India’s Exports to the World: Table showing past, current and predicted exports
of dairy productsfrom 2019 to 2022 and the trend

Cheese and its Uses
Cheese is a dairy product derived from milk
that is produced in a wide range of flavours,
textures, and forms by coagulation of the
milk protein casein. During production, the
milk is usually acidified, and adding the
enzyme rennet causes coagulation. The
solids are separated and pressed into final
form. Apart from serving during wine
tasting Cheese has other uses as well.
Cheese Can Prevent Osteoporosis – as it is
rich in Vitamin D. It can have a positive
effect on your dental health, and is also the
best dietary source for calcium, protein,
vitamin B12 and can prevent common
cancers.
Curd is a dairy product obtained
by coagulating milk in a process called
curdling. The coagulation can be caused by
adding rennet or any edible acidic
substance such as lemon juice or vinegar,
and then allowing it to coagulate. The
increased acidity causes the milk proteins
(caesin) to tangle into solid masses,
or curds.
Consumption of curd is good for digestion,
boosts immunity, gives beautiful and
healthy skin, reduces high blood pressure,
prevents vaginal infections and is good for
bones.

Global Market Demand of Cheese
The top consumers of cheese are mainly
countries in the cold region of the world
mainly because cheese can be chilled and
preserved for future use. The cold weather
requires high protein levels which the
cheese provides. Cheese is also processed
in smaller quantities from milk obtained
from other mammals such as the sheep,
goats and even donkeys.
The top cheese consumer is Denmark. The
country consumes 28.1 kilograms of cheese
consumption per capita. The second highest
consumer is Iceland followed by Finland at
27.7 kilograms and 27.3 kilograms of cheese
consumption per capita respectively. France
follows closely at 27.2 kilograms of cheese
per capita. The French keep high breed
dairy cattle which contribute significantly to
high production of cheese. At position five
is Cyprus which consumes 26.7 kilograms of
cheese consumption per capita.
The most cheese consuming countries in
the world do not feature in the list of
countries with overweight people. That is
because people often consume cheese
without the high carbs of buns and high
protein/salt levels in the patties. The most
popular way of consuming cheese is of
course along with wine. Wine and cheese
sampling are often done for aficionados of
both products. It is actually recommended
by most nutritionist to consume at least 1
to 2 slices of cheese per week considering
their role in bone development, cancer
prevention and fighting cavities.

The country specific reasons for demand
are as follows:
DENMARK
Cheese is one of the most favourite food of
Danish people. Denmark was not in the list
but since a few years cheese consumption
in this country increased rapidly and that’s
the reason it ranks at number one with 28.1
kg per capita. There are a lot of Danish
cheese varieties available in the market.
Danish nation loves to eat cheese and
this food trend is increasing day by day.
FINLAND
Premium quality cheese price drop has
increased Cheese consumption in Finland
tremendously. As a list the country has
gained the second position in the list of
countries that consume most cheese.
ICELAND
There are a lot of dairy farmers, over 750, in
the small Island nation of just 300,000.
Iceland Dairies cooperates with these
farmers to provide cheese and other milk
products to the masses. Iceland’s high
standard of living ensures that cheese
consumption is also high in the country
(27.7 kg).
FRANCE
The country that invented the concept of
experimenting wine with cheese and then
made it hugely popular worldwide, is
always head to head with other countries in
per capita consumption. With 27.2 kg of
cheese consumption per capita, people in
France are among the highest most cheese.
LUXEMBOURG
Cheese consumption in Luxembourg is not
only done in abundance but the quality of
cheese consumed within the country is also
usually in premium. Cheese consumed here
is often in the form of appetizers, value-
added cheese and cheese experimentation
with wine. Luxembourg consumed 22.8 kg
of cheese per capita.
ITALY
In Italy, cheese is consumed more as part of
a Mediterranean style diet rather than
snacking on it intermittently. Italian people
watch how much calories of cheese they
consume and plan their meals accordingly.
That is the reason why Italians, despite
having some of the slimmest figures in the
world, consume 21.5 kg of cheese per
capita.

AUSTRIA
Ever since the drop of production unit
prices of cheese in 2015 resulting from an
EU ruling in 2015, more and more quality
cheese products are circling Austrian
market at lower price. The result is an
increase in cheese consumption which is
now 21.5 kg per capita.
World’s Largest Cheese Importers
Worldwide purchases of imported cheese totalled an estimated US$31.3 billion in 2018.
Overall, the value of cheese imports declined by -3.6% for all importing countries since 2014
when international purchases of cheese were valued at $32.4 billion. Year over year, globally
imported cheese appreciated by 2.9% from 2017 to 2018.
From a continental perspective, European countries bought the highest dollar worth of
imported cheese during 2018 with purchases valued at $22.1 billion or 70.5% of the global
total. In second place were Asian importers at 15.3% while 6.8% of cheese imported worldwide
was delivered to North America. Smaller percentages were sold to Latin America (3.1%)
excluding Mexico but including the Caribbean, Africa (2.1%) then Oceania (2%).

World’s Largest Cheese Exporters
World’s largest importers of Cheese and their respective exporters.
Largest Importers / Export Destinations
Germany United
Kingdom Italy France Belgium
Exporters
Netherlands Ireland Germany Italy France
France France France Netherlands Netherlands
Italy Italy Netherlands Germany Germany
Austria Germany Belgium Belgium Italy
Denmark Netherlands Lithuania UK Denmark
0%
2%
4%
6%
8%
10%
12%
14%
16%
World Importers of Cheese

Germany and Netherlands are the common exporters, we will study
the advantage they have over other exporters
Netherlands
Rich History leading to high
exports
In the Netherlands, milk became a popular
drink at a time when clean water was in
short supply. Any that wasn't drunk was
churned into butter or cheeses, often
named after the towns where they were
traded, such as Gouda. For the Dutch,
cheeses, milk, yoghurts and other dairy
products are not only staple foods but
national symbols, and the bedrock of a
major export industry.
Two small Dutch butter businesses, which
merged and started making margarine,
helped give rise to one of largest companies
in the world - Unilever.
Changing consumer buying
behavior
Dutch have evolved tremendously with
changing times. A significant change was
observed in the buying behavior of people a
few years go, where people started to buy
cheese online. The Dutch people hugely
accepted this change and started selling it
through online mode to ensure
convenience of its customers.
Distance and Infrastructure
From a cost (logistics and farmgate prices)
about 75% of Dutch cheese is consumed
within 500km of the Dutch border,
indicating the importance of margin growth
in (northwestern) Europe. The cheese is
majorly exported to Europe thus saving
time and cost and also resulting in no
degradation of product.
Trade Policy Advantage of EU
The European Union allows free trade of
milk and dairy products between member
states, enhancing cross-border trade. This
free trade policy hugely benefits
Netherlands as it provides a ground for easy
exports, and no extra tariffs thus making it
the largest exporter to the top cheese
importers of the world.

Germany
Made in Germany stands for
innovation, quality and safety
Made in Germany stands for innovation,
quality and safety with respect to food
items. The renowned high level of quality of
German products, which is increasingly
being complemented by the introduction of
quality assurance systems across all stages,
provides a good basis for further export
successes.
The German food industry is particularly
strong and competitive on foreign markets
with regard to high-quality processed
products (with high value-added). Thus, the
demand for cheese exported from Germany
is extremely high.
Location Advantage
Germany is centrally located in Europe with
excellent transportation channels. Food
processors are well situated to export
products to other EU countries. Thus
therefore, Germany easily exports to all
European Nation with ease.
Technological Advantage
Germans remain unbeaten when it comes
to technology. Good acidification,
coagulation, separating curds and whey,
salting, shaping, and ripeningtechniques,
and a solid infrastructure have aided
Germany in meeting the cheese demands of
the world.

Trade Details
Trade preferences include duty-free entry
of all dairy products as well as a wide range
of agricultural products, in all of the
European Nations. This free trade policy
hugely benefits Germany as it provides a
ground for easy exports, and no extra
tariffs thus making it the largest exporter
to the top cheese importers of the world.
Indian Export of Cheese
India is one of the least cost producers of
raw milk. India's comparative advantage lies
in its world’s largest dairy herd, favorable
climate, inland water resources and large
farming sector. The country has also a
locational advantage with respect to access
to the Asian markets, which are substantial
net importers of dairy products. The
generation of more exportable surplus
through improved breeding and feeding
programs is the key to amplify the foreign
exchange earnings from dairy
sector.Products that attracted the 20%
export incentives include whole milk,
buttermilk, condensed milk, yogurt,
skimmed milk, milk food for babies, and
processed, grated and powdered varieties
of cheese.
Competitive Landscape
The cheese market in India is highly concentrated in nature with the presence of only a few large manufacturers, such as GCMMF, Parag Milk Foods, Britannia and Mother Dairy. These players compete against one another in terms of prices and quality.
Regional Insights
On a geographical front, Maharashtra enjoys the leading position in the cheese market in India. Other regions include Karnataka, Tamil Nadu, Delhi, Gujarat, Andhra Pradesh and Telangana, Uttar Pradesh, West Bengal, Kerala, Haryana, Punjab, Rajasthan, Madhya Pradesh, Bihar and Orissa.

Indian: Current Cheese Importers Value exported in
2018 (USD thousand)
Share in India's exports (%)
Average tariff (estimated) faced by
India (%)
United Arab Emirates 7625 21.1 5
Bhutan 7006 19.4 0
United States of America 3340 9.2 20.6
Singapore 2914 8.1 0
Philippines 2589 7.2 4.1
Qatar 2298 6.4 5
Saudi Arabia 2094 5.8 5
Kuwait 1504 4.2 5
Nepal 1265 3.5 14
Oman 1101 3 5
Strategy to Promote Indian Cheese
Leveraging Opportunities due to potential risks in Major Exporting
Countries
Netherlands

Germany
Germany is known for its efficiency—and that includes its bovine population. A century ago, a
dairy cow produced 7,700 pounds of milk a year; today, its descendants are doubling that
output. Germany’s $14 billion dairy farming industry rests squarely on the backs of 4.2 million
cows.
Skimmed Milk Powder (SMP) and its Uses
Skimmed milk powder is used as an
alternative to fresh milk after dissolution in
water or by direct addition of the powder in
the formulation, for instance to standardize
dry extract content or protein content.
Lecithin may also be added at the end of
the drying session to obtain spray instant
skimmed milk powder. Lecithin is used for
its emulsifier properties that helps the
powder rehydrate quickly.
Skimmed milk powder is mostly used in
products based on reconstituted milk
(yogurt, dairy dessert, ice creams…), in
chocolates, in confectionery, in baby food,
in animal feeding.
Dairy produce: Alternative to the drinking
milk.
Confectionery:
Puffed confectionery (malted milk, nougat).
Stabilization of the foam and prevention of
bubble collapse, Light taste of milk, Firm
texture for chewing: saccharose
crystallization control (thanks to its lactose
content) and retention of water.
Caramel confectionery. Crucial to obtain the
right color: Maillard reaction.
Milk chocolate. Distinctive taste, Smooth
and milky texture, Soft candy and coating.

Bakery:
Breads, cakes, rolls. Nutritional value, Taste
enhancement, Browning increase,
Improvement of water retention capacity,
Freshness extension.
Ice creams:
Important source of non-fat solids,
Regulation of the protein vs fat rate, Ice
cream stabilization.
Health Benefits
Deficient of fats and fat-soluble vitamins
but proteins, water soluble vitamins and
minerals are preserved. Can be consumed
by people with high cholesterol levels.
Fortified with Vitamin A and D.
Global Market Demand of SMP
World SMP exports expanded by 8.6
percent to 2.6 million tons, following a
similar rate of expansion in 2017. While
imports sharply expanded in China, Mexico,
Egypt and Indonesia, several others
curtailed theirs including Russian
Federation, Saudi Arabia, Japan, among
others. The bulk of the expanded export
supplies came from the United States of
America, Mexico, the European Union and
Belarus, while those of New Zealand
declined. The United States of America
benefitted from increased SMP production,
high stocks and competitive prices it
offered, along with active demand from
several trading partners, specially, Mexico,
the Philippines, Indonesia, Malaysia, and
Viet Nam. However, exports to China, its
third largest export destination, declined by
as much as one-third in 2018. Mexico, one
of the largest importers and exporters of
SMP, imported as much as 360 000 tons
and exported 105 000 tons. Of Mexico’s
total SMP exports, almost 90 percent went
to Venezuela. The European Union also
benefitted from competitive prices and
strong demand. While expanding SMP
exports, the European Union also brought
down its stocks held under the public
intervention programme to 175 803 tons at
the end of December, less than half to what
it had in January 2018, and no new stocks
were acquired. SMP exports of Belarus
expanded markedly to Kazakhstan,
Kirgizstan, Ukraine and Armenia, while
exports to the Russian Federation declined

by 31 percent. New Zealand’s exports
declined for a second consecutive year,
reflecting low production in the 2017/18
milk cycle, but remained the third largest
SMP exporter in the world. SMP exports of
Australia, the fourth largest SMP exporter in
the world, also declined, a result of reduced
milk output caused by extreme weather
conditions. Considering the 2018/19 dairy
cycle, SMP exports of New Zealand in
November and December 2018 surpassed
their respective levels in 2017.
World’s Largest SMP Importers
Worldwide purchases of imported SMP totalled an estimated US$6.6 billion in 2018.
Overall, the value of SMP imports declined by -40.18% for all importing countries since 2014
when international purchases of SMP were valued at $11 billion. Year over year, globally
imported SMP depreciated by -6.05% from 2017 to 2018.

World’s Largest SMPExporters
World’s largest importers of Cheese and their respective exporters.
Largest Importers / Export Destinations
Mexico China Indonesia Algeria Philippines
Exporters
USA New Zealand USA France USA
Canada Australia Australia Poland New Zealand
Poland Germany Belgium Belgium Netherlands
Uruguay USA New Zealand New Zealand Australia
Belgium France France Canada Germany
0
2
4
6
8
10
12
World Importers of SMP

USA and New Zealand are the common exporters, we will study the
advantage they have over other exporters
USA
Infrastructure
Produced in 80 production plants, the
United States is one of the world's largest
manufacturers of Skimmed Milk Powder.
Most of the plants are located in strategic
locations, close to large urban conurbations
in the northern part of the East Coast, in
California and in the south-central area of
the US (Kansas, Oklahoma, Texas, New
Mexico, Arizona, Colorado).
Prominent Entities
Massive quantities of SMP are provided by
Dairy America, an Association of
Cooperatives that counts among its
members Agri-Mark Inc., California Dairies
Inc., Land O'Lakes Inc., Maryland & Virginia
Milk Producers Association, O-AT-KA Milk
Producers Inc., United Dairymen of Arizona,
Dairy Farmers of America and Lone Star
Milk Producers.
Investments and Standards
The reasons why the US is such a dominant
supplier of SMP are that it has a
considerable number of pastures at its
disposal, it has made substantial
investments in research and development,
it adopts strict health regulations and
quality standards and boasts efficient
manufacturing systems (many US plants are
able to adapt production around market
needs). It is also able to produce all year
round, even in winter.
The fluctuating production of SMP adapts
to both the logic of the commodity's various
uses as well as market demands, including
international.
Price Regulations
The prices (as regulated by the Dairy Export
Incentive Program, or DEIP) and stocks are
affected by both industry production trends
and international price trends, which, in
turn, are affected by the euro-dollar
exchange rate.

New Zealand
New Zealand exports of SMP have been
running ahead of last year particularly as
shipments to China have accelerated – up
14 percent through May YOY. With the void
left in the Chinese import market by the
drop in U.S. shipments, EU and New
Zealand sales of SMP to this market have
expanded. Although SMP output is
expected to slow this year, the export
forecast is revised higher by 8 percent to
410,000 tons supported in-part by a
drawdown in stocks.
Dairy Industry
Routinely, dairy exports contribute 25-30
percent of New Zealand’s total exports. New
Zealand’s dairy industry is reasonably unique in
the world because it is focused on exporting
with around 95 percent of total production
being exported. In addition, New Zealand’s
dairy industry is almost entirely pasture-based.
New Zealand has a temperate climate and
pasture grows all year round, though in winter
growth is at only 10 to 20 percent of the rate in
mid-spring. This has meant the industry has
developed around an outdoor pasture grazing
based feeding model.
Dairy Genetics
New Zealand dairy genetics have been selected
for the milk protein and fat content, rather than
total liquid yield, milk now produced in New
Zealand contains approximately nine percent
milk solids compared with most major milk
producing countries at about 7.5 percent. This
endows a manufacturing advantage on milk
processors making powders in New Zealand.
Manufacturing
SMP continues to be manufactured at fairly
consistent volumes despite the wide price
variations experienced over the last decade
because of several factors. 1. There is limited
demand for specialized protein products such as
casein, whey powders, whey protein
concentrates, and milk protein concentrates at
prices that make them more profitable than
SMP products. 2. There is always going to be a
sizable volume of SMP produced as a co-
product of butter, and AMF production. The
North Island is home to a bigger proportion of
the dairy cattle herd, 3.96 million dairy cattle,
while the South Island has 2.57 million dairy
cattle.
Indian Export of SMP The exports will also help India bring down
inventories that have dragged local raw milk
prices to three-year lows and below cost of the
production, sparking widespread farmer
protests.
In the wake of the protests, the western states
of Gujarat and Maharashtra, India’s leading milk
producers, offered 50,000 rupees ($727.86) a
ton subsidy for exports of SMP, while the
central government approved a further subsidy
of 10 percent of the export price.
India rarely impacts the dried milk export
market. The U.S. Department of Agriculture
recently forecast the country’s 2018 non-fat dry
milk powder shipments to be only 15,000 tons,
compared to 410,000 tons from New Zealand
and 720,000 tons from the United States.
Historically, Indian SMP is offered at a discount
to SMP from New Zealand, which is perceived
as of higher quality.
Increased Production
In India, milk production increased by 5.6
percent in 2018, driven by an expanded dairy
herd and incremental, but steady,
improvements to milk collection systems and
higher productivity. However, India’s milk
output growth in 2018 was slightly lower than
for the preceding two years. This resulted from
limited fodder availability on account of the
below-average rainfall received during the
monsoon.

India : Current Skimmed Milk Powder Importers
Value exported in 2018 (USD thousand)
Share in India's exports (%)
Average tariff (estimated) faced by
India (%)
Bangladesh 29609 32.6
Afghanistan 17206 18.9 5.5
Malaysia 12319 13.6 0
Pakistan 8251 9.1 18.8
Bhutan 7836 8.6 0
Nepal 4859 5.3 30
United Arab Emirates 4277 4.7 5
Lebanon 1131 1.2 5
Thailand 1071 1.2 137.4
Myanmar 955 1.1 3
Strategy to Promote Indian SMP
Leveraging Opportunities due to potential risks in Major Exporting
Countries
USA & EU
Although U.S. exports of skimmed milk
powder (SMP) grew at an annual pace of 7
percent from 2014 through 2018, the trade
challenges facing U.S. exporters along with
strong competition are expected to lead to
a 4 percent drop in shipments for 2019. EU
exports of SMP are expected slow in the second
half of the year but for the year are set to
increase by 16 percent over 2018 to reach a
record 950,000 tons. While Algeria remains a
principal destination, the EU is making inroads
into such key Asian markets as China and
Indonesia which in 2018 were ranked as the
second and third largest global import markets
for SMP. While SMP production is expected to
grow by only 1 percent in 2019, a major factor
contributing to the outflow of SMP has been
the availability of intervention stocks. These
stood at 175,000 tons at the end of 2018, and
by the end of May totaled less than 1,000 tons.

Forecast
The U.S. export forecast for SMP is adjusted
down 1 percent to 686,000 tons or about 4
percent below 2018. Shipments through May
are down 13 percent YOY and in absolute
terms, the biggest losses over this period have
been to China (-10,300 tons), Pakistan (- 9,390
tons), and Malaysia (-6,515 tons).
China Trade Tariffs
Currently U.S. exporters face a prohibitive 35
percent import tariff in China due to the trade
dispute. In 2018, U.S. shipments of SMP to
China totaled 21,100 tons while this year they
only total 2,000 tons through May. Shipments
to Mexico are lagging last year’s pace but its
annual imports of SMP are forecast to grow by
2 percent this year which are expected to lift
U.S. exports in the second half ofthis year.
Indonesia and EU
Indonesia, which currently has a 5%-10% import
duty on EU dairy, says it is open to going further
than matching the EU’s levy by raising its tariffs
to 20%-25%.Indonesia will turn to other dairy
suppliers, such as Australia, New Zealand, the
U.S. or India.
New Zealand
Since 1994, the number of dairy cattle has increased by 70 per cent and this has had a negative effect on
our waterways. More cows mean more irrigated land. Some beautiful landscapes rich in dry land plants
and animals, like Mackenzie Country and Canterbury plains, are unsuitable for dairy conversion and
require large scale irrigation.
Agricultural-related emissions were found to be the largest emission source for Southland, accounting for 69% of overall gross emissions.
"We urgently need fewer cows if we are going to address the climate and water crises."

Potential of Indian Cheese & SMP
Osteoporosis (Calcium Deficiency)
Osteoporosis is a bone disease that occurs when the body loses too much bone, makes too
little bone, or both. Osteoporosis means “porous bone.” In the USA, approximately 1.5 million
fractures annually are attributable to osteoporosis. And USA is our third largest importer;
therefore we can further capitalize on it.
In the last 5 years, Russia is suffering from large number of osteoporosis related deaths.
Currently India is not exporting Russia, but India has a good bilateral trade relationship with
Russia, therefore, we can use this to initiate trade.
Vitamin B12
Vitamin B12 deficiency is observed in countries following a vegetarian diet.
Israel & Taiwan are the largest vegetarian countries in the world after India. India is the third
largest Asian trade partner of Israel. Therefore, we can look to explore the Israel and Taiwan.
China
China’s dairy market has witnessed the steady and substantial growth since the beginning of
1990s. The Chinese government is playing an important role in increasing dairy consumption in
China. Apart from this a huge potential lies in China as the middle class is consuming more dairy
products due to them being rich in protein, calcium, vitamins and several minerals. Curd has
experienced explosive growth which fueled general demand of dairy products on China.
Chinese consumers are becoming more and more aware of the health benefits of cheese.
Cheese and other dairy products in China which are rich in protein and calcium offer a more
nutritious, healthy choice over many other food types. This segment is thus receiving attention
from dairy players.