Market Intelligence Book - John Hancock · PDF fileJohn Hancock Investments | Market...
35
Market Intelligence THE LATEST THINKING FROM OUR ASSET MANAGEMENT NETWORK Q2 2018 Outlook As of March 31, 2018 Available online and in the App Store!
Transcript of Market Intelligence Book - John Hancock · PDF fileJohn Hancock Investments | Market...

Market IntelligenceTHE LATEST THINKING FROM OUR ASSET MANAGEMENT NETWORK
Q2 2018 OutlookAs of March 31, 2018
Available online and in the App Store!

Smart investing starts here
Get started at jhinvestments.com/MarketIntelligence
Tap into our latest Market Intelligence
� Get our 12- to 18-month outlook for a range of asset classes
� See key macro themes from our network of 75+ asset managers and researchers
� Explore interactive charts and our guided view
� Stay current with automatic updates and notifications
� Take a deeper dive with related blog posts and portfolio manager videos

John Hancock Investments | Market Intelligence
What you’ll find
3
About John Hancock Investments
A trusted brand
A better way to invest
Results for investors
Insight that leverages the best of our diverse asset management network
4
5
6
7
What we’re hearing from our network 8
U.S. equity: solid fundamentals
No recession in sight
Corporate earnings continue to support
Small-cap stocks should get a boost from tax reform
Some sectors are more expensive than others
New communications sector has broad implications
Expect volatility to continue
Long/short strategies have added value in challenging market environments
9
10
11
12
13
14
15
16
International equity: opportunities persist
Growth moderates, but expansionary indicators are still intact
Earnings forecasts have held up better than equity prices
The pendulum swings back in favor of international equities
Non-U.S. stocks have more reasonable expectations
International small-cap stocks are well positioned
Technology companies are powering the EM earnings rebound
17
18
19
20
21
22
23
Fixed income: select opportunities
The Fed is on track to steadily normalize short-term interest rates
Competing forces continue to flatten the yield curve
Demand for MBS may deteriorate as the largest buyer steps away
High-quality bond allocations are poised to earn meager returns
Tight spread differentials favor emerging-market debt over U.S. high yield
Investment-grade corporates represent an attractive balance of risk and return
The yield curve may hold clues to the timing of the cycle
24
25
26
27
28
29
30
31
What to do now 32
Family of funds 33

About John Hancock InvestmentsJohn Hancock Investments | Market Intelligence
A trusted brand
John Hancock Investments is a premier asset manager representing one of America’s most trusted brands, with a heritage of financial stewardship dating back to 1862. Helping our shareholders pursue their financial goals is at the core of everything we do. It’s why we support the role of professional financial advice and operate with the highest standards of conduct and integrity.
4
150 years of promises kept Diverse capabilities to help serve our clients
From our earliest days
as a four-person operation
on Boston’s State Street,
John Hancock has grown
to include a diversified
global investment firm.
The New York Times named
John Hancock one of the
most powerful brands
of the 20th century.1
Nearly $155 billion in assets under management across asset classes2
� 39% U.S. equity
� 27% Fixed income
� 20% International equity
� 9% Alternative and specialty
� 5% Other3
Data is as of 3/31/18.
1 The New York Times, 1999. 2 $104 billion in retail mutual fund and ETF assets and $50 billion in retirement assets, including seed capital. 3 Includes money market funds, hybrid funds, and fund-of-fund allocations to unaffiliated products. 4 Not all funds are available to all investors. Funds domiciled outside the United States are not available to U.S. persons.
Mutual funds
ETFs Closed-end funds
Education savings
Managed accounts
Retirement portfolios
UCITS funds4
ESG funds

John Hancock Investments | Market Intelligence About John Hancock Investments
ESG funds
Introduced multimanager approach
Managed accounts
Target-date portfolios
1988 1990 1992 1994 1996 1998 2000 2002 2004 2006 2008 2010 2012 2014 2016 20181969
Closed-end funds
Target-risk portfolios
Alternative Asset Allocation Fund
ETFs
UCITS funds
Epoch Investment Partners, Inc.
Education savings
A better way to invest
We serve investors globally through a unique multimanager approach: We search the world to find proven portfolio teams with specialized expertise for every strategy we offer, then we apply robust investment oversight to ensure they continue to meet our uncompromising standards and serve the best interests of our shareholders.
Representative list of asset managers shows managers of stand-alone funds only. All data is as of 3/31/18. All logos are the property of their respective owners.
5
79 proven portfolio teams 116 investment strategies27 elite asset managers
Our team of 200+ professionals who specialize in manager research and oversight vets more than 300 new strategies and holds over 100 in-person oversight meetings with managers annually.

John Hancock Investments | Market Intelligence About John Hancock Investments
Results for investors
6
Our unique approach to asset management enables us to provide a diverse set of investments backed by some of the world’s best managers, along with strong risk-adjusted returns across asset classes.
Our performance is the result of our multimanager approach and our focus on finding and overseeing the best portfolio teams.
1 As of 3/31/18. Includes mutual fund rankings/ratings only. Out of 84 funds rated by Morningstar, 9 funds received a 5-star overall rating and 35 funds received a 4-star overall rating. Ratings are counted at the highest-rated share class. For each managed product, including mutual funds, variable annuity and variable life subaccounts, exchange-traded funds, closed-end funds, and separate accounts, with at least a 3-year history, Morningstar calculates a Morningstar Rating™ based on a Morningstar Risk-Adjusted Return that accounts for variation in a fund’s monthly excess performance, placing more emphasis on downward variations and rewarding consistent performance. Exchange-traded funds and open-end mutual funds are considered a single population for comparative purposes. The top 10.0% of funds in each category, the next 22.5%, 35.0%, 22.5%, and bottom 10.0% receive 5, 4, 3, 2, or 1 star(s), respectively. The overall Morningstar Rating for a managed product is derived from a weighted average of the performance figures associated with its 3-, 5-, and 10-year (if applicable) Morningstar Rating metrics. The rating formula most heavily weights the 3-year rating, using the following calculation: 100% 3-year rating for 36 to 59 months of total returns, 60% 5-year rating/40% 3-year rating for 60 to 119 months of total returns, and 50% 10-year rating/30% 5 year rating/20% 3-year rating for 120 or more months of total returns. Star ratings do not reflect the effect of any applicable sales load. 2 Morningstar, as of 3/31/18. 32 out of 43 funds outperformed their Morningstar category averages for the 10-year period ended 3/31/18. Results for other periods will vary. Investing involves risks, including the potential loss of principal. There is no guarantee that a fund’s investment strategy will be successful. Please see the funds’ prospectuses for additional risks. For complete performance information, visit jhinvestments.com. Past performance does not guarantee future results.
44 FUNDS 74%
OUTPERFORMED
44 funds rated 4 or 5 stars by Morningstar
at the highest-rated share class1
74% of funds outperformed their Morningstar
category averages over the past 10 years2

John Hancock Investments | Market Intelligence About John Hancock Investments
60+
75+
Insight that leverages the best of our diverse asset management network
Our multimanager approach to investing provides our dedicated in-house research team with a unique advantage: We leverage the very best market insight from our global network of specialized asset managers and investment partners.
7
More than 75 asset managers, independent research
firms, broker-dealers, and banks make up our network.
A dedicated 60+ person investment research team—
part of 200+ professionals specializing in manager research
and oversight—evaluates the views from our network.
Research is vetted and debated to develop our
12- to 18-month outlook on a range of asset classes.
The result is Market Intelligence, the latest thinking and
timely investment ideas from John Hancock Investments.
Ameriprise, Barclays, Barrow Hanley, BCA Research, BlackRock, BofA Merrill Lynch, Boston Common, Boston Partners, Brandywine Global, Breckinridge, Capital Economics, Capital Group, Citi, Credit Suisse, Deutsche Asset & Wealth Management, Dodge & Cox, DoubleLine, Eaton Vance, Edward Jones, Empirical Research Partners, Epoch, Evercore ISI, Federated, Fidelity, First Quadrant, Gavekal, Goldman Sachs, GW&K, Invesco, Ivy, Janney, Janus, Jennison, John Hancock Asset Management, J.P. Morgan, Lazard, Legg Mason, Leuthold, Loomis Sayles, Lord Abbett, LPL, Macquarie, Macro Research Board, Matthews Asia, Mercer, MetWest, MFS, Morgan Stanley, Ned Davis Research, NEPC, Neuberger Berman, Nuveen, Oppenheimer Funds, PIMCO, Pzena, Raymond James, Redwood, Research Affiliates, Roubini Global Economics, Royce, Russell, SSGA, Standard Life, Stone Harbor, Strategas Research Partners, Sustainable Growth Advisers, T. Rowe Price, Templeton, Trillium, UBS, Vanguard, WAMCO, Wellington, Wells Capital, Wells Fargo
About John Hancock InvestmentsJohn Hancock Investments | Market Intelligence 8
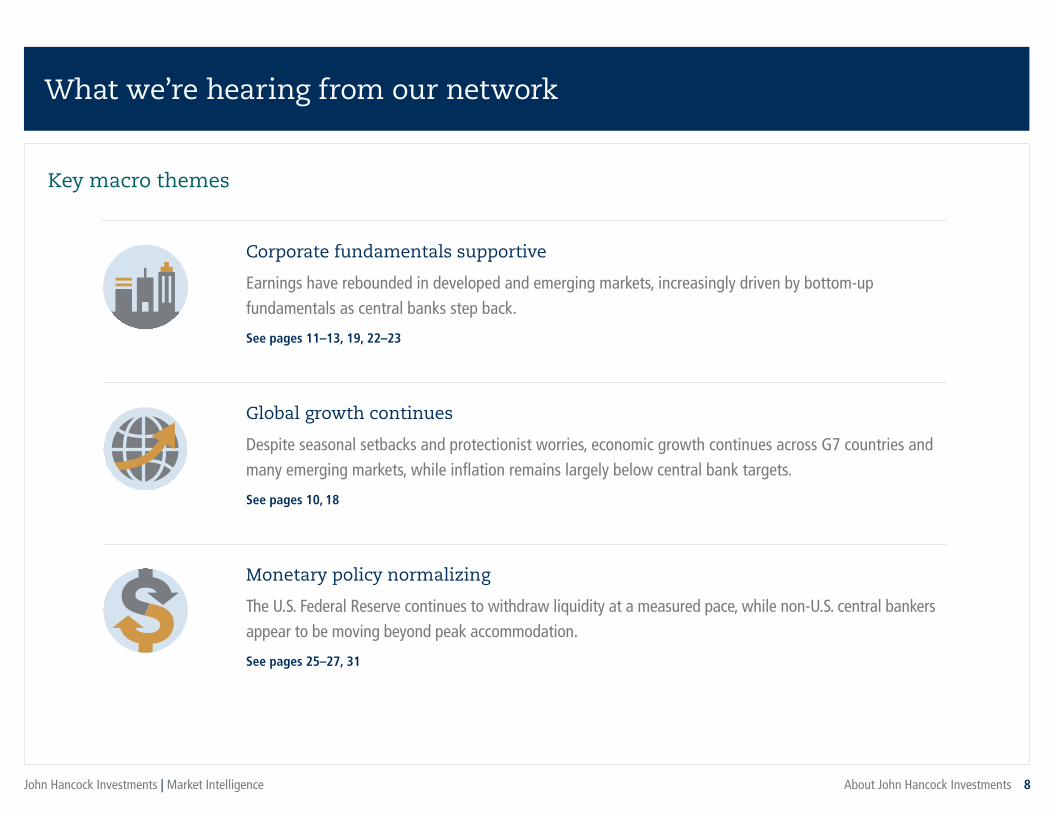
What we’re hearing from our network
Corporate fundamentals supportive
Earnings have rebounded in developed and emerging markets, increasingly driven by bottom-up fundamentals as central banks step back.
See pages 11–13, 19, 22–23
Global growth continues
Despite seasonal setbacks and protectionist worries, economic growth continues across G7 countries and many emerging markets, while inflation remains largely below central bank targets.
See pages 10, 18
Monetary policy normalizing
The U.S. Federal Reserve continues to withdraw liquidity at a measured pace, while non-U.S. central bankers appear to be moving beyond peak accommodation.
See pages 25–27, 31
Key macro themes

U.S. equity: solid fundamentalsUnderlying fundamentals remain supportive, despite recent market volatility.
John Hancock Investments | Market Intelligence 9U.S. equity: solid fundamentals
Key macro themes Range of views from our networkDarker shading indicates a greater concentration of views within our network.
BEARISH NEUTRAL BULLISH
U.S. equity
U.S. large cap
U.S. small cap
U.S. growth
U.S. value
Our 12–18 month view: SLIGHTLY POSITIVE
Recent volatility may take more time to play out as the market adjusts to higher yields, protectionist rhetoric, and continued political turmoil. However, we believe fundamentals will eventually prevail and move U.S. equities higher over the next 12 to 18 months.
Corporate fundamentals supportive
Barring an escalating trade war or external shocks, stock prices should continue to be supported this year by tax reform, healthy profit margins, and robust economic growth.
Global growth continues
While overseas indicators have moderated recently, continued global expansion should help provide further support for U.S. equities.
Monetary policy normalizing
The Fed is unwinding its balance sheet and steadily reining in liquidity, the pace of which could be affected by fiscal stimulus (accelerated) or deepening protectionism (slowed).
What’s inside�� No recession in sight
�� Corporate earnings continue to support
�� Small-cap stocks should get a boost from tax reform
�� Some sectors are more expensive than others
�� New communications sector has broad implications
�� Expect volatility to continue
�� Long/short strategies have added value in challenging markets
The value of a company’s securities is subject to change with the company’s financial condition and overall market and economic conditions. See pages 10–16 for complete information. Past performance does not guarantee future results.

John Hancock Investments | Market Intelligence U.S. equity: solid fundamentals
Recessions
–25
–20
–15
–10
–5
0
5
10
15
20182015201220092006200320001997199419911988198519821979197619731970
Darker shading indicates a greater concentration of views within our network.
Year-over-year change in the Composite Index of Leading Indicators
“The LEI points to robust economic growth throughout 2018. Its six-month
growth rate has not been this high since the first quarter of 2011.”
No recession in sight
Source: The Conference Board, as of 2/28/18. The Composite Index of Leading Indicators is an index published monthly by The Conference Board, used to predict the direction of the economy’s movements in the months to come. The index is made up of 10 economic components whose changes tend to precede changes in the overall economy. It is not possible to invest directly in an index. Past performance does not guarantee future results.
10
U.S. equity
BEARISH NEUTRAL BULLISH= OUR 12–18 MONTH VIEW
Composite Index of Leading Indicators (ranked by weighting in the index)Weekly manufacturing hours worked Leading Credit Index
ISM Index of New OrdersNew orders of nondefense capital goods
Consumer expectations Stock prices
Yield spread Weekly unemployment claimsNew orders of consumer goods and materials
Building permits
Eight of the ten index components were positive in February as the economy continued to strengthen.

John Hancock Investments | Market Intelligence U.S. equity: solid fundamentals
Darker shading indicates a greater concentration of views within our network.
120
125
130
135
140
145
150
155
160
$165
1,700
1,900
2,100
2,300
2,500
2,700
2,900
3,100
2017201620152014
S&P 500 Index (right axis)
S&P 500 Index EPS forecast (left axis)2018 EPS growth estimates year over year (%)
Energy 71.88
Financials 26.64
Materials 23.38
S&P 500 Index 18.26
Industrials 17.66
Information technology 16.36
Consumer discretionary 15.59
Telecommunication services 15.09
Consumer staples 11.52
Healthcare 10.99
Utilities 7.80
Real estate 5.55
11
Corporate earnings continue to support
Earnings forecasts for U.S. companies have continued their upward trend Newly lowered corporate tax rates have led to higher EPS estimates across sectors
Source: FactSet, as of 3/31/18. The S&P 500 Index tracks the performance of 500 of the largest publicly traded companies in the United States. It is not possible to invest directly in an index. Earnings per share (EPS) is a measure of how much profit a company has generated calculated by dividing the company’s net income by its total number of outstanding shares. Past performance does not guarantee future results.
U.S. equity
BEARISH NEUTRAL BULLISH= OUR 12–18 MONTH VIEW
Concerns over trade tensions and rising interest rates have affected stock prices, but earnings forecasts remain strong.
“While stock prices adjusted during that early February drawdown,
we saw no meaningful deterioration in intrinsic values.”
John Hancock Investments | Market Intelligence U.S. equity: solid fundamentals
4.9%
6.4%
0 5 10 15 20 25
Telecommunicationservices
Consumerstaples
Utilities
Energy
Real estate
Materials
Informationtechnology
Consumerdiscretionary
Healthcare
Industrials
Financials
–2
0
2
4
6
8
10
12%
3/181/1811/179/177/175/173/171/1711/16
Small-cap performance relative to large-cap performance (11/8/16–3/31/18)
26.76
29.62
18.70
19.74
12.10
16.56
5.88
10.22
25.87
27.34
35.02
4.9%
6.4%
0 5 10 15 20 25
Telecommunicationservices
Consumerstaples
Utilities
Energy
Real estate
Materials
Informationtechnology
Consumerdiscretionary
Healthcare
Industrials
Financials
–2
0
2
4
6
8
10
12%
3/181/1811/179/177/175/173/171/1711/16
Darker shading indicates a greater concentration of views within our network.
12
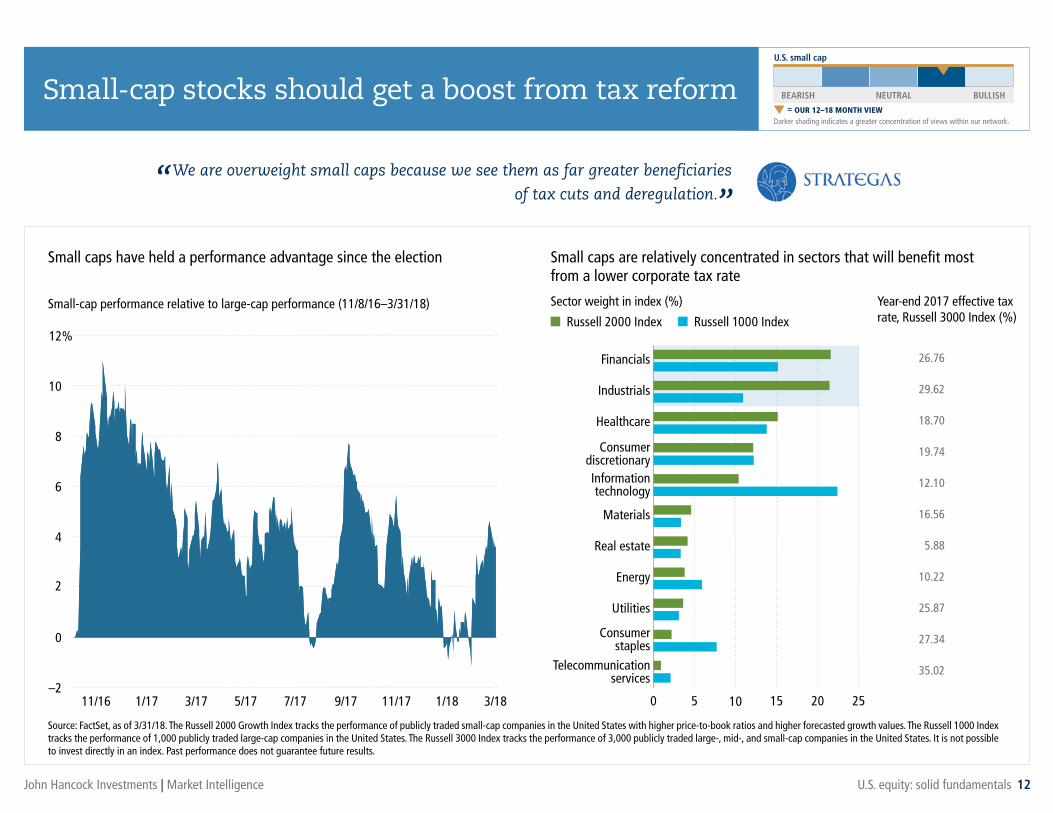
Small-cap stocks should get a boost from tax reform
Small caps are relatively concentrated in sectors that will benefit most from a lower corporate tax rate
Small caps have held a performance advantage since the election
Source: FactSet, as of 3/31/18. The Russell 2000 Growth Index tracks the performance of publicly traded small-cap companies in the United States with higher price-to-book ratios and higher forecasted growth values. The Russell 1000 Index tracks the performance of 1,000 publicly traded large-cap companies in the United States. The Russell 3000 Index tracks the performance of 3,000 publicly traded large-, mid-, and small-cap companies in the United States. It is not possible to invest directly in an index. Past performance does not guarantee future results.
U.S. small cap
BEARISH NEUTRAL BULLISH= OUR 12–18 MONTH VIEW
“We are overweight small caps because we see them as far greater beneficiaries
of tax cuts and deregulation.”
Year-end 2017 effective tax rate, Russell 3000 Index (%)
Sector weight in index (%)
Russell 2000 Index Russell 1000 Index

John Hancock Investments | Market Intelligence U.S. equity: solid fundamentals
12x 13x 14x 15x 16x 17x 18x 19x 20x6
8
10
12
14
16
18%
MaterialsFinancials
Healthcare
Information technology
Utilities
Industrials
Consumer discretionary
Consumer staples
1.14
1.32
1.32
1.39
1.82
2.09
1.75
1.19
S&P 500Index
Forward P/E ratio
Long
-ter
m e
arni
ngs
grow
th fo
reca
st
1.60Real estate
1.45
Darker shading indicates a greater concentration of views within our network.
13
Source: FactSet, as of 3/31/18. Price/earnings-to-growth (PEG) ratio is a valuation metric for determining the relative trade-off between the price of a stock, the earnings generated per share, and the company’s expected growth. The forward price-to-earnings (P/E) ratio is a stock valuation measure comparing the current share price of a stock with the underlying company’s estimated earnings per share over the next 12 months. The long-term earnings growth forecast is an estimate of a company’s expected long-term growth in earnings, derived from all polled analysts’ estimates. The S&P 500 Index tracks the performance of 500 of the largest publicly traded companies in the United States. The telecommunication services and energy PEG ratios (2.24 and 1.12, respectively) are not charted, as the forward PEs (10.48x and 19.53x, respectively) fall outside the range shown on the horizontal axis. It is not possible to invest directly in an index. Past performance does not guarantee future results.
Some sectors are more expensive than others
Our network favors sectors with a combination of compelling growth and reasonable valuations (lower PEG ratios)
PEG ratios of S&P 500 Index sectors
PEG = P/EG
Overweight Neutral Underweight
Network views
“We continue to find rich valuations in the dividend-oriented segments of the market,
especially given their lower growth potential.”
U.S. equity
BEARISH NEUTRAL BULLISH= OUR 12–18 MONTH VIEW

John Hancock Investments | Market Intelligence U.S. equity: solid fundamentals
StocksApproximate weight (%)
Forward P/E ratio (x)
Long-term EPS growth (%)
Facebook, Inc., Class A 1.69 20.92 24.90
Alphabet Inc., Class C 1.39 24.03 19.07
Alphabet Inc., Class A 1.37 24.03 19.07
AT&T, Inc. 0.98 10.27 0.93
Verizon Communications, Inc. 0.89 10.46 4.39
Comcast Corp., Class A 0.71 13.42 11.98
Walt Disney Co. 0.67 13.61 9.07
Netflix, Inc. 0.55 95.01 53.08
Booking Holdings, Inc. 0.45 23.12 13.29
Time Warner, Inc. 0.34 12.16 8.94
Total 9.04 22.84 16.850 5 10 15 20 25
Telecommunication services
Real estate
Materials
Utilities
Energy
Consumer staples
Communications
Industrials
Consumer discretionary
Healthcare
Financials
Information technology
Darker shading indicates a greater concentration of views within our network.
New communications sector has broad implications
The change eliminates telecom and reduces the weights of the technology and consumer discretionary sectors
Top 10 proposed positions in the new sector1S&P 500 Index sector weights (%)
9.04%
“We estimate the beta of the Communication Services sector will increase from roughly 0.5 to 0.9,
essentially eliminating the defensive nature of the old Telecommunication Services sector.”
Source: MSCI, S&P, as of 3/31/18. The forward price-to-earnings (P/E) ratio is a stock valuation measure comparing the current share price of a stock with the underlying company’s estimated earnings per share over the next 12 months. The long-term earnings growth forecast is an estimate of a company’s expected long-term growth in earnings, derived from all polled analysts’ estimates. Earnings per share (EPS) is a measure of how much profit a company has generated calculated by dividing the company’s net income by its total number of outstanding shares. The S&P 500 Index tracks the performance of 500 of the largest publicly traded companies in the United States. It is not possible to invest directly in an index. Past performance does not guarantee future results. 1 Reflects stocks by weightings as of 3/31/18 in the S&P 500 Index. Approximate sector and position weights from John Hancock Investments and could change.
14
Current Expected by year-end 2018
U.S. equity
BEARISH NEUTRAL BULLISH= OUR 12–18 MONTH VIEW

John Hancock Investments | Market Intelligence U.S. equity: solid fundamentals
–60
–50
–40
–30
–20
–10
0
2018201520102005200019951990
–3
–8–11
–19
–12
–20
–6 –6 –5
–9
–17
–30
–34
–14
–8 –7 –8–10
–49
–28
–16–19
–10
–6 –7
–12 –11
–3
–10
Darker shading indicates a greater concentration of views within our network.
15
U.S. equity
BEARISH NEUTRAL BULLISH= OUR 12–18 MONTH VIEW
Expect volatility to continue
Source: FactSet, as of 3/31/18. The S&P 500 Index tracks the performance of 500 of the largest publicly traded companies in the United States. It is not possible to invest directly in an index. Drawdown is a measure of market declines from a peak to a subsequent trough. Past performance does not guarantee future results.
This year’s market drawdown is in line with other non-recessionary years since 1990
Cumulative intrayear drawdowns (peak-to-trough declines) of S&P 500 Index (%)
Average maximum intrayear market drawdown (%)
Overall since 1990 –13.72
In nonrecession years –11.50
In recession years –33.00
Intrayear drawdowns in nonrecession years have taken 74 days on average to decline and fully recover. By March 31, 2018, we had reached day 45.
Recessions
“It sure doesn’t feel like it, but under the surface we continue to see signs that the intensity
of the correction is abating and stocks are trying to forge a low.”

John Hancock Investments | Market Intelligence U.S. equity: solid fundamentals
–50 –40 –30 –20 –10 0 10 20 30 40 50 60 70–50
–40
–30
–20
–10
0
10
20
30
40
S&P 500 Index rolling 12-month returns (%)
Long
/sho
rt e
xces
s re
turn
s vs
. S&
P 50
0 In
dex
(%)
112Rolling 12-month periods since 1980 in which the
S&P 500 Index returned < 5%
84Number of periods in which long/short
strategies outperformed
75% Periods with long/short
outperformance
8.67%Average excess
return
Darker shading indicates a greater concentration of views within our network.
16
Long/short strategies have added value in challenging markets
Long/short strategies have delivered positive excess returns when stocks were flagging (1980–2018)
Source: Morningstar, as of 3/31/18. The S&P 500 Index tracks the performance of 500 of the largest publicly traded companies in the United States. It is not possible to invest directly in an index. Past performance does not guarantee future results.
Long/short strategies outperformed in 75% of 12-month periods when stock returns were below 5%.
“We expect both [inflation and interest rates] to continue rising modestly
throughout 2018, with volatility likely to remain elevated as a result.”
U.S. equity
BEARISH NEUTRAL BULLISH= OUR 12–18 MONTH VIEW

International equity: opportunities persistDespite seasonal setbacks, growth and earnings remain solid, and non-U.S. equities remain modestly ahead of U.S. stocks.
John Hancock Investments | Market Intelligence International equity: opportunities persist
Key macro themes
See pages 18–23 for complete information. Past performance does not guarantee future results.
Range of views from our networkDarker shading indicates a greater concentration of views within our network.
BEARISH NEUTRAL BULLISH
International equity
European equity
Japanese equity
Emerging-market equity
Our 12–18 month view: SLIGHTLY POSITIVE
We agree with the consensus view that investors should overweight non-U.S. equities in a globally balanced portfolio. Improving corporate fundamentals and attractive valuations are increasingly potential tailwinds, particularly for small-cap stocks.
Corporate fundamentals supportive
Earnings expectations continue to trend higher across both developed and emerging markets, with company-specific drivers recapturing investor attention.
Global growth continues
Growth outside of the United States continues to make progress, while monetary policy remains relatively accommodative.
Monetary policy normalizing
Long after the start of monetary policy normalization in the United States, foreign central bankers are finally beginning to acknowledge signs of sustained global growth.
What’s inside�� Growth moderates, but expansionary indicators are still intact
�� Earnings forecasts have held up better than equity prices
�� The pendulum swings back in favor of international equities
�� Non-U.S. stocks have more reasonable expectations
�� International small- and mid-cap stocks are well positioned
�� Technology companies are powering the EM earnings rebound
17

John Hancock Investments | Market Intelligence International equity: opportunities persist
Lead quotes from eurozone PMIs
1. “ At least some of the slowing may be ascribed to bad weather in some northern regions.”
2. “ Supply chain delays and raw material shortages were often reported to have stymied production.”
3. “ The fact that export order book growth has more than halved since the end of last year suggests the stronger euro is taking an increasing toll.”
4. “ Survey responses also highlighted how political uncertainty also appears to have intensified, dampening demand.”
5. “ Price pressures have meanwhile also eased slightly, in part linked to cheaper imports arising from the euro’s recent strength.”
46
48
50
52
54
56
58
60
62
64
3/18 2017201620152014
53.60 France
55.10 Italy
53.20 Japan
54.80 Spain
58.40 Germany
55.10 U.K.
Darker shading indicates a greater concentration of views within our network.
Source: Markit, World Bank, FactSet, as of 3/31/18. The Purchasing Managers’ Index (PMI) is an indicator of the economic health of the manufacturing sector based on five major indicators: new orders, inventory levels, production, supplier deliveries, and the employment environment. Past performance does not guarantee future results.
18
Growth moderates, but expansionary indicators are still intact
PMI readings remain above 50 after a sharp reversal in Q1 Top reasons for slower growth suggest a temporary setback
International equity
BEARISH NEUTRAL BULLISH= OUR 12–18 MONTH VIEW
Expa
nsio
nary
Our outlook calls for PMIs to return to a more measured upward trajectory in coming quarters.
“The global manufacturing PMI has fallen in recent months, but from a high level
which appears to have overstated growth in industrial output.”
Cont
ract
iona
ry

John Hancock Investments | Market Intelligence International equity: opportunities persist
Darker shading indicates a greater concentration of views within our network.
19
2018 EPS growth estimates year over year (%)
Energy 16.80
Financials 16.68
Information technology 15.17
Industrials 12.82
Consumer staples 9.32
MSCI EAFE Index 9.25
Materials 5.66
Consumer discretionary 5.13
Healthcare 3.60
Utilities 1.31
Telecommunication services –4.15
Real estate –12.05110
120
130
140
$150
MSCI EAFE EPS Forecast (next 12 months)
850
950
1,050
1,150
1,250
201720162015
MSCI EAFE Index EPS forecast, next 12 months (left axis)
MSCI EAFE Index price (right axis)
Earnings forecasts have held up better than equity prices
“Fundamentals are good in the U.S., Europe, and Japan but we see more earnings upside in Europe.”
Source: FactSet, as of 3/31/18. Earnings per share (EPS) is a measure of how much profit a company has generated calculated by dividing the company’s net income by its total number of outstanding shares. The MSCI Europe, Australasia, and Far East (EAFE) Index tracks the performance of publicly traded large- and mid-cap stocks of companies in those regions. It is not possible to invest directly in an index. Past performance does not guarantee future results.
The recent drop in equity prices appears to be driven more by sentiment than by underlying fundamentals
International equity
BEARISH NEUTRAL BULLISH= OUR 12–18 MONTH VIEW
The severity of the 2018 sell-off hasn’t been matched by a similar deterioration in fundamentals.

John Hancock Investments | Market Intelligence International equity: opportunities persist
–240
–120
0
120
240
360%
2017201220072002199719921987198219771972
23 41 25 67 7549 58 18 87 113 13
MSC
I EAF
E In
dex
rela
tive
retu
rn
Length of cycle in months
Cumulative outperformance of international equities
Cumulative underperformance of international equities
Darker shading indicates a greater concentration of views within our network.
20
Source: Bloomberg, FactSet, as of 3/31/18. International equities are represented by the MSCI Europe, Australasia, and Far East (EAFE) Index, which tracks the performance of publicly traded large- and mid-cap stocks of companies in those regions. Total returns are calculated gross of foreign withholding tax on dividends. U.S. equities are represented by the S&P 500 Index, which tracks the performance of 500 of the largest publicly traded companies in the United States. Japan, the United Kingdom, France, Switzerland, and Germany are represented by the MSCI Japan Index, the MSCI United Kingdom Index, the MSCI France Index, the MSCI Switzerland Index, and the MSCI Germany Index, respectively, which track the performance of publicly traded large- and mid-cap stocks of companies in those countries. It is not possible to invest directly in an index. Past performance does not guarantee future results.
Cumulative relative performance of the MSCI EAFE Index against the S&P 500 Index One factor driving performance is sector composition
MSCI EAFE IndexFinancials
Technology
S&P 500 Index
The pendulum swings back in favor of international equities
Non-U.S. stocks have modestly outperformed U.S. stocks through the recent volatility.
International equity
BEARISH NEUTRAL BULLISH= OUR 12–18 MONTH VIEW
21.1%
24.8%
“Overall, relative performance among major regional equity markets
is being driven by tech and financials.”

John Hancock Investments | Market Intelligence International equity: opportunities persist
Darker shading indicates a greater concentration of views within our network.
21
Source: FactSet, as of 3/31/18. The S&P 500 Index tracks the performance of 500 of the largest publicly traded companies in the United States. The MSCI Europe, Australasia, and Far East (EAFE) Index tracks the performance of publicly traded large- and mid-cap stocks of companies in those regions. It is not possible to invest directly in an index. Price to earnings (P/E) is a valuation measure comparing the ratio of a stock’s price with its earnings per share. Past performance does not guarantee future results.
Non-U.S. stocks have more reasonable expectationsInternational equity
BEARISH NEUTRAL BULLISH= OUR 12–18 MONTH VIEW
While growth prospects continue to improve globally, a valuation gap has emerged between U.S. and non-US. stocks
Non-U.S. equities are trading at multiples much closer to their historical averages
P/E levels since 2003 (x)
8
10
12
14
16
18
20
201720162015201420132012201120102009200820072006200520042003
10
15
S&P 500Index
8.28
10.34
17.09
18.29
13.80
16.35
MSCI EAFEIndex
AVERAGE
LOW
CURRENT
HIGH
AVERAGE
LOW
CURRENT
HIGH
Rolling forward P/E ratios (x)
n S&P 500 Indexn MSCI EAFE Index
“Select opportunities in non-U.S. equities have recently grown, as the gap in valuation between non-U.S.
equities and the relatively more expensive U.S. market has widened significantly over the past few years.”
8
10
12
14
16
18
20
201720162015201420132012201120102009200820072006200520042003
10
15
S&P 500Index
8.28
10.34
17.09
18.29
13.80
16.35
MSCI EAFEIndex
AVERAGE
LOW
CURRENT
HIGH
AVERAGE
LOW
CURRENT
HIGH

John Hancock Investments | Market Intelligence International equity: opportunities persist
–10
0
10
20%
201720162015201420132012201120102009200820072006200520042003 MSCI EAFESMID Cap Index
MSCI EAFEIndex
9.25%
15.06%
Darker shading indicates a greater concentration of views within our network.
Source: FactSet, as of 3/31/18. The MSCI Europe, Australasia, and Far East (EAFE) SMID Cap Index tracks the performance of publicly traded small- and mid-cap (SMID) stocks of companies in those regions. The MSCI Europe, Australasia, and Far East (EAFE) Index tracks the performance of publicly traded large- and mid-cap stocks of companies in those regions. It is not possible to invest directly in an index. Standard deviation (STD) is a statistical measure of the historic volatility of a portfolio. It measures the fluctuation of a fund’s periodic returns from the mean or average. The larger the deviation, the larger the standard deviation and the higher the risk. Earnings per share (EPS) is a measure of how much profit a company has generated calculated by dividing the company’s net income by its total number of outstanding shares. Past performance does not guarantee future results.
22
International small- and mid-cap stocks are well positioned
International small-cap stocks may be poised to build on their historical performance advantage over large caps Small- and mid-cap companies have higher EPS growth forecasts
2018 earnings estimates
International equity
BEARISH NEUTRAL BULLISH= OUR 12–18 MONTH VIEW
“Going forward, investors should favor companies exposed to the cyclical recovery in the Eurozone;
the obvious way to do this is to overweight small- and mid-cap stocks relative to large caps.”
Rolling 12-month excess returns and volatility of international small-cap stocks vs. international large-cap stocks
Median 12-month excess return vs. MSCI EAFE Index
% of periods with positive excess returns
Relative STD small vs. large
MSCI EAFE SMID Cap Index 3.50% 79% 104% (17.05/16.35)
John Hancock Investments | Market Intelligence International equity: opportunities persist
65
75
85
95
105%
2017201620152014
MSC
I EM
Inde
x ne
xt 1
2-m
onth
ear
ning
s es
timat
es
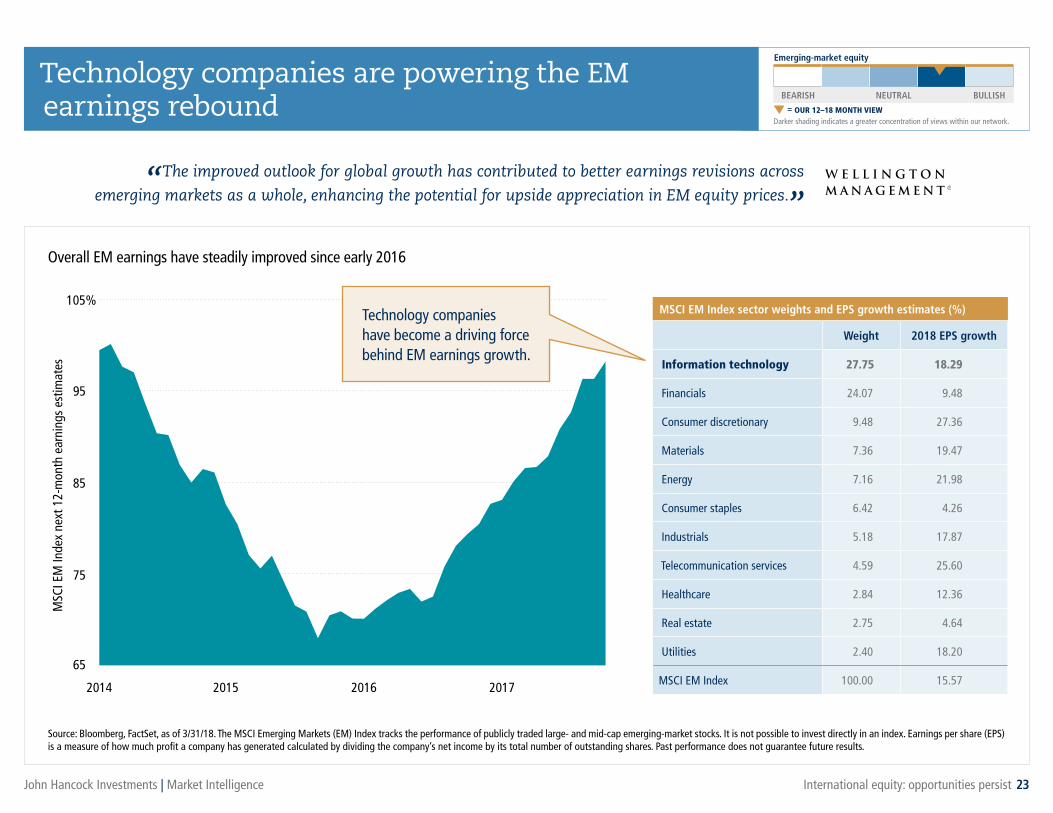
MSCI EM Index sector weights and EPS growth estimates (%)
Weight 2018 EPS growth
Information technology 27.75 18.29
Financials 24.07 9.48
Consumer discretionary 9.48 27.36
Materials 7.36 19.47
Energy 7.16 21.98
Consumer staples 6.42 4.26
Industrials 5.18 17.87
Telecommunication services 4.59 25.60
Healthcare 2.84 12.36
Real estate 2.75 4.64
Utilities 2.40 18.20
MSCI EM Index 100.00 15.57
Darker shading indicates a greater concentration of views within our network.
Overall EM earnings have steadily improved since early 2016
23
“The improved outlook for global growth has contributed to better earnings revisions across
emerging markets as a whole, enhancing the potential for upside appreciation in EM equity prices.”
Technology companies are powering the EM earnings rebound
Emerging-market equity
BEARISH NEUTRAL BULLISH= OUR 12–18 MONTH VIEW
Source: Bloomberg, FactSet, as of 3/31/18. The MSCI Emerging Markets (EM) Index tracks the performance of publicly traded large- and mid-cap emerging-market stocks. It is not possible to invest directly in an index. Earnings per share (EPS) is a measure of how much profit a company has generated calculated by dividing the company’s net income by its total number of outstanding shares. Past performance does not guarantee future results.
Technology companies have become a driving force behind EM earnings growth.
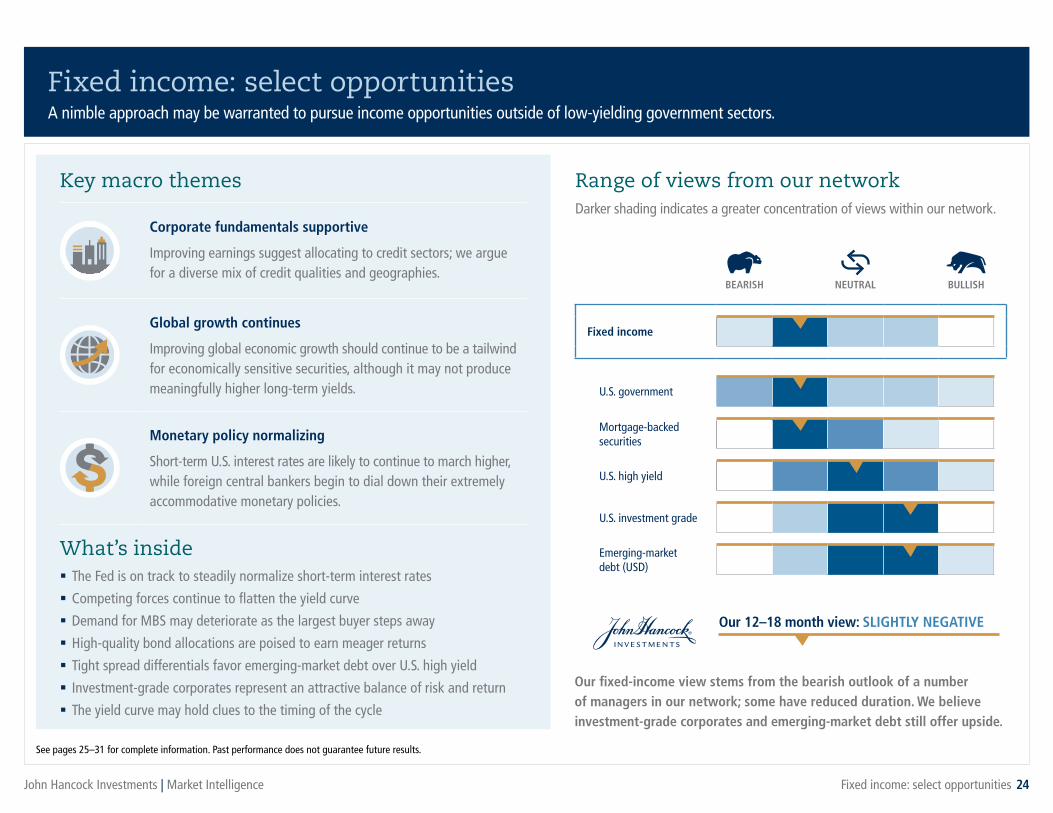
Fixed income: select opportunitiesA nimble approach may be warranted to pursue income opportunities outside of low-yielding government sectors.
John Hancock Investments | Market Intelligence Fixed income: select opportunities
Key macro themes
See pages 25–31 for complete information. Past performance does not guarantee future results.
Range of views from our networkDarker shading indicates a greater concentration of views within our network.
BEARISH NEUTRAL BULLISH
Fixed income
U.S. government
Mortgage-backed securities
U.S. high yield
U.S. investment grade
Emerging-market debt (USD)
Our 12–18 month view: SLIGHTLY NEGATIVE
Our fixed-income view stems from the bearish outlook of a number of managers in our network; some have reduced duration. We believe investment-grade corporates and emerging-market debt still offer upside.
Corporate fundamentals supportive
Improving earnings suggest allocating to credit sectors; we argue for a diverse mix of credit qualities and geographies.
Global growth continues
Improving global economic growth should continue to be a tailwind for economically sensitive securities, although it may not produce meaningfully higher long-term yields.
Monetary policy normalizing
Short-term U.S. interest rates are likely to continue to march higher, while foreign central bankers begin to dial down their extremely accommodative monetary policies.
What’s inside�� The Fed is on track to steadily normalize short-term interest rates
�� Competing forces continue to flatten the yield curve
�� Demand for MBS may deteriorate as the largest buyer steps away
�� High-quality bond allocations are poised to earn meager returns
�� Tight spread differentials favor emerging-market debt over U.S. high yield
�� Investment-grade corporates represent an attractive balance of risk and return
�� The yield curve may hold clues to the timing of the cycle
24
John Hancock Investments | Market Intelligence Fixed income: select opportunities
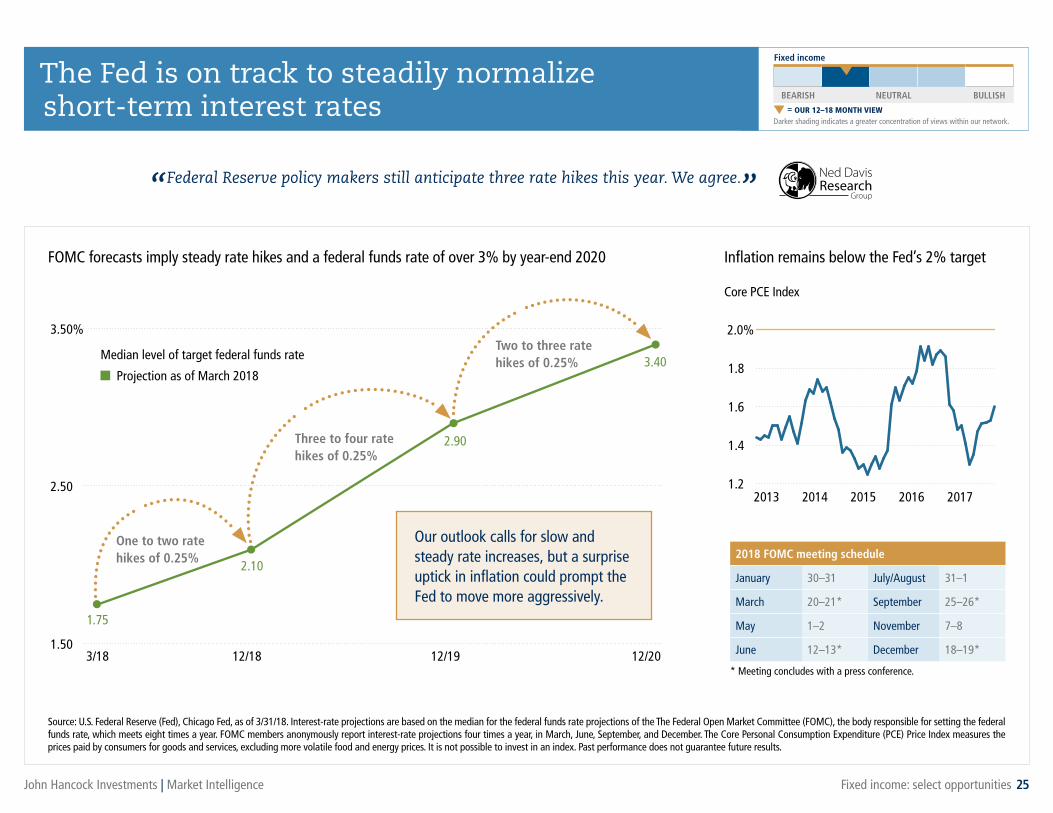
2018 FOMC meeting schedule
January 30–31 July/August 31–1
March 20–21* September 25–26*
May 1–2 November 7–8
June 12–13* December 18–19*
* Meeting concludes with a press conference.
Darker shading indicates a greater concentration of views within our network.
The Fed is on track to steadily normalize short-term interest rates
25
FOMC forecasts imply steady rate hikes and a federal funds rate of over 3% by year-end 2020
Source: U.S. Federal Reserve (Fed), Chicago Fed, as of 3/31/18. Interest-rate projections are based on the median for the federal funds rate projections of the The Federal Open Market Committee (FOMC), the body responsible for setting the federal funds rate, which meets eight times a year. FOMC members anonymously report interest-rate projections four times a year, in March, June, September, and December. The Core Personal Consumption Expenditure (PCE) Price Index measures the prices paid by consumers for goods and services, excluding more volatile food and energy prices. It is not possible to invest in an index. Past performance does not guarantee future results.
Fixed income
BEARISH NEUTRAL BULLISH= OUR 12–18 MONTH VIEW
Inflation remains below the Fed’s 2% target
1.50
2.50
3.50%
12/2012/1912/183/18
1.75
2.10
3.40
2.90
1.2
1.4
1.6
1.8
2.0%
2017201620152014 2013
Median level of target federal funds rate
Projection as of March 2018
Three to four rate hikes of 0.25%
One to two rate hikes of 0.25%
Two to three rate hikes of 0.25%
“Federal Reserve policy makers still anticipate three rate hikes this year. We agree.”
Our outlook calls for slow and steady rate increases, but a surprise uptick in inflation could prompt the Fed to move more aggressively.
Core PCE Index
John Hancock Investments | Market Intelligence Fixed income: select opportunities
0.0
0.5
1.0
1.5
2.0
2.5
3.0
12/189/183/189/173/179/163/169/153/159/143/149/133/13
Yiel
ds (%
)
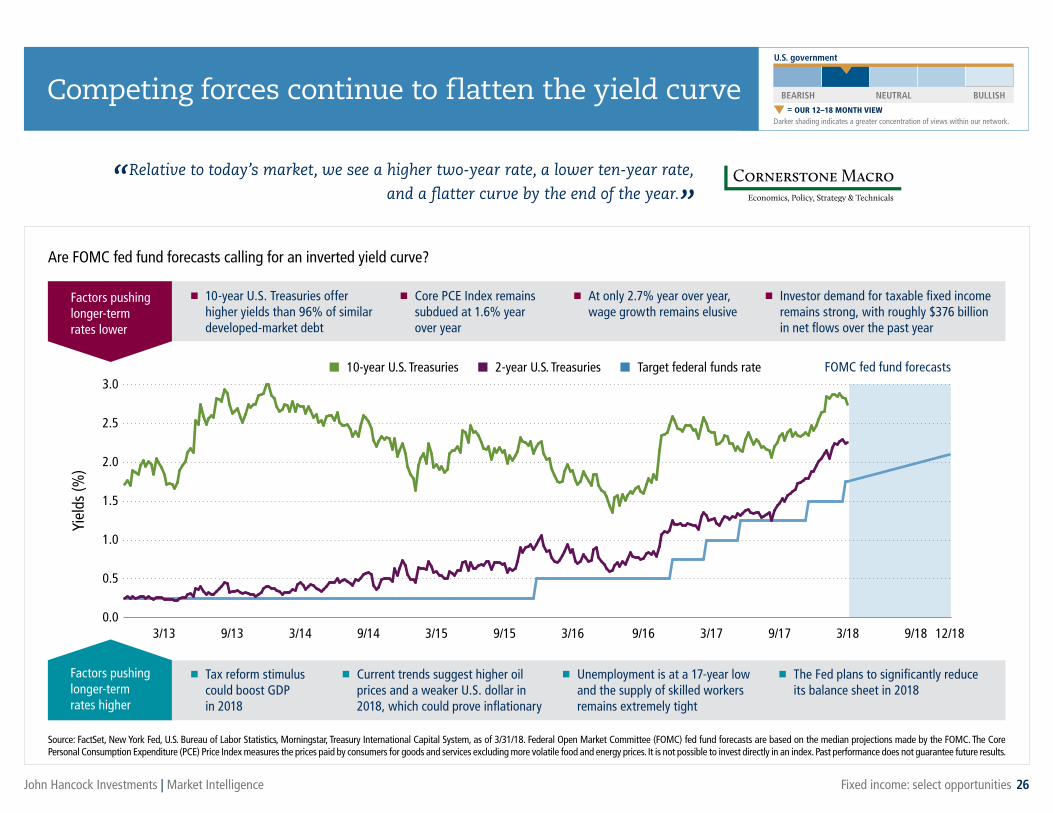
n 10-year Treasury yield n 2-year Treasury yield n Federal funds rateFactors pushing longer-term rates lower
Factors pushing longer-term rates higher
■ 10-year U.S. Treasuries offer higher yields than 96% of similar developed-market debt
■ Core PCE Index remains subdued at 1.6% year over year
■ At only 2.7% year over year, wage growth remains elusive
■ Investor demand for taxable fixed income remains strong, with roughly $376 billion in net flows over the past year
■ Tax reform stimulus could boost GDP in 2018
■ Current trends suggest higher oil prices and a weaker U.S. dollar in 2018, which could prove inflationary
■ Unemployment is at a 17-year low and the supply of skilled workers remains extremely tight
■ The Fed plans to significantly reduce its balance sheet in 2018
Darker shading indicates a greater concentration of views within our network.
26
Source: FactSet, New York Fed, U.S. Bureau of Labor Statistics, Morningstar, Treasury International Capital System, as of 3/31/18. Federal Open Market Committee (FOMC) fed fund forecasts are based on the median projections made by the FOMC. The Core Personal Consumption Expenditure (PCE) Price Index measures the prices paid by consumers for goods and services excluding more volatile food and energy prices. It is not possible to invest directly in an index. Past performance does not guarantee future results.
“Relative to today’s market, we see a higher two-year rate, a lower ten-year rate,
and a flatter curve by the end of the year.”Are FOMC fed fund forecasts calling for an inverted yield curve?
U.S. government
BEARISH NEUTRAL BULLISH= OUR 12–18 MONTH VIEW
Competing forces continue to flatten the yield curve
n 10-year U.S. Treasuries n 2-year U.S. Treasuries n Target federal funds rate FOMC fed fund forecasts

John Hancock Investments | Market Intelligence Fixed income: select opportunities
Darker shading indicates a greater concentration of views within our network.
Q2 2018 Q3 2018 Q4 2018 Q1 2019 Q2 2019 Q3 2019 Q4 2019 Q1 2020–1,200
–1,000
–800
–600
–400
–200
0
$2.42TU.S. Treasuries
$1.75TAgency MBS
$720B
$480B
Source: U.S. Federal Reserve (Fed), 2018. Past performance does not guarantee future results.
“The Fed has been by far the largest buyer of agency mortgage-backed securities (MBS) in the market.
In October, it will begin rolling off the roughly 30% of the MBS market on its books.”
27
Mortgage-backed securities
BEARISH NEUTRAL BULLISH= OUR 12–18 MONTH VIEW
Demand for MBS may deteriorate as the largest buyer steps away
The Fed intends to roll off its maturing bond proceeds, shrinking the balance sheet The Fed’s $4 trillion balance sheet
n U.S. Treasuries n Agency MBS
The impact on U.S. Treasury and MBS prices might appear benign …
… but the market’s largest buyer may effectively become its largest seller within the next two years.
Cum
ulat
ive
roll-
off (
in b
illio
ns)

John Hancock Investments | Market Intelligence Fixed income: select opportunities
01 3 5 7 9 11 13 15 17
8
4
12
16
20
Subs
eque
nt fi
ve-y
ear r
etur
ns (%
)
Starting yield (%)
2000s2010s
1990s1980s1970s
Darker shading indicates a greater concentration of views within our network.
28
High-quality bond allocations are poised to earn meager returns
Low yields and upward pressure on interest rates make duration-sensitive allocations a particularly risky proposition
Source: Bloomberg Barclays U.S. Aggregate Bond Index (Agg), as of 3/31/18. This index tracks the performance of U.S. investment-grade bonds in government, asset-backed, and corporate debt markets. It is not possible to invest directly in an index. Past performance does not guarantee future results.
“In today’s fixed-income landscape, defined by extraordinarily low yields, conventional
high-quality bond strategies are no longer sufficient to meet investors’ return objectives.”
Relationship between starting bond yields and subsequent five-year returns for the Agg
Fixed income
BEARISH NEUTRAL BULLISH= OUR 12–18 MONTH VIEW
The notable exception to this relationship was when the aggressive rate increases of the Volcker era dampened the returns of earlier bond issues.
87% of a bond’s performance is attributable to its starting yield, and today, the Agg is yielding only 3.11%.

John Hancock Investments | Market Intelligence Fixed income: select opportunities
Darker shading indicates a greater concentration of views within our network.
29
Source: Bloomberg, as of 3/31/18. U.S. high yield is represented by the Bloomberg Barclays U.S. Corporate High Yield Bond Index, which tracks the performance of the U.S. dollar-denominated, high-yield, fixed-rate corporate bond market. Emerging-market debt is represented by the J.P. Morgan Emerging Markets Bond Index (EMBI) Global Diversified Index, which tracks the performance of U.S. dollar-denominated Brady bonds, Eurobonds, and traded loans issued by sovereign and quasisovereign entities. The index caps its exposure to countries with larger amounts of outstanding debt. It is not possible to invest directly in an index. One hundred basis points (bps) equals one percent. Past performance does not guarantee future results.
“... with stretched valuations in much of the developed world, many investors are taking a
closer look at how to work exposure to emerging markets into their portfolios.”Emerging-market debt (EMD) now appears to offer better relative value than U.S. high yield (HY)
Option-adjusted spreads (OAS) of HY and EMD over U.S. Treasuries (bps) for past 10 years (March 2008–March 2018)
Emerging-market debt (USD)
BEARISH NEUTRAL BULLISH= OUR 12–18 MONTH VIEW
Tight spread differentials favor emerging-market debt over U.S. high yield
0
500
1,000
1,500
2,000
20182017201620152014201320122011201020092008
Historically, EMD has outperformed HY when the spread differential between the two is narrow—as it is today.
n HY n EMD
Rolling 3-year periods where EMD underperforms
Rolling 3-year periods where EMD outperforms
Average starting OAS differential 386 bps 109 bps
Average annualized 3-year EMD excess returns to HY –2.78% 1.38%
John Hancock Investments | Market Intelligence Fixed income: select opportunities
–0.3 –0.2 –0.1 0.0 0.1 0.2 0.3 0.4 0.50
1
2
3
4
5
6
7
Yiel
d to
wor
st (%
)
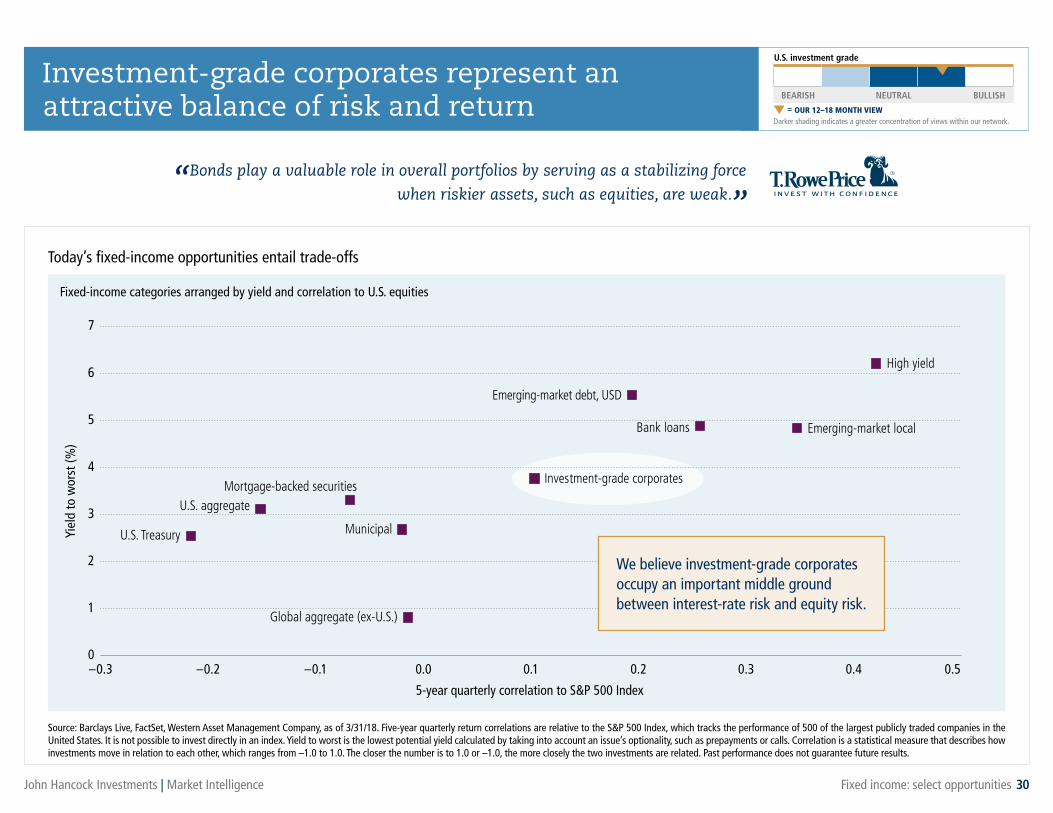
Investment-grade corporates
U.S. aggregate
Municipal
Mortgage-backed securities
U.S. Treasury
Emerging-market localBank loans
Emerging-market debt, USD
Global aggregate (ex-U.S.)
High yield
5-year quarterly correlation to S&P 500 Index
Darker shading indicates a greater concentration of views within our network.
“Bonds play a valuable role in overall portfolios by serving as a stabilizing force
when riskier assets, such as equities, are weak.”
30
Investment-grade corporates represent an attractive balance of risk and return
U.S. investment grade
BEARISH NEUTRAL BULLISH= OUR 12–18 MONTH VIEW
Source: Barclays Live, FactSet, Western Asset Management Company, as of 3/31/18. Five-year quarterly return correlations are relative to the S&P 500 Index, which tracks the performance of 500 of the largest publicly traded companies in the United States. It is not possible to invest directly in an index. Yield to worst is the lowest potential yield calculated by taking into account an issue’s optionality, such as prepayments or calls. Correlation is a statistical measure that describes how investments move in relation to each other, which ranges from –1.0 to 1.0. The closer the number is to 1.0 or –1.0, the more closely the two investments are related. Past performance does not guarantee future results.
Today’s fixed-income opportunities entail trade-offs
Fixed-income categories arranged by yield and correlation to U.S. equities
We believe investment-grade corporates occupy an important middle ground between interest-rate risk and equity risk.
John Hancock Investments | Market Intelligence Fixed income: select opportunities
Darker shading indicates a greater concentration of views within our network.
–100
0
100
200
300
20172016201520142013201220112010200920082007200620052004200320022001200019991998
Basi
s po
ints
5,000
10,000
15,000
20,000
25,000
$30,000
31
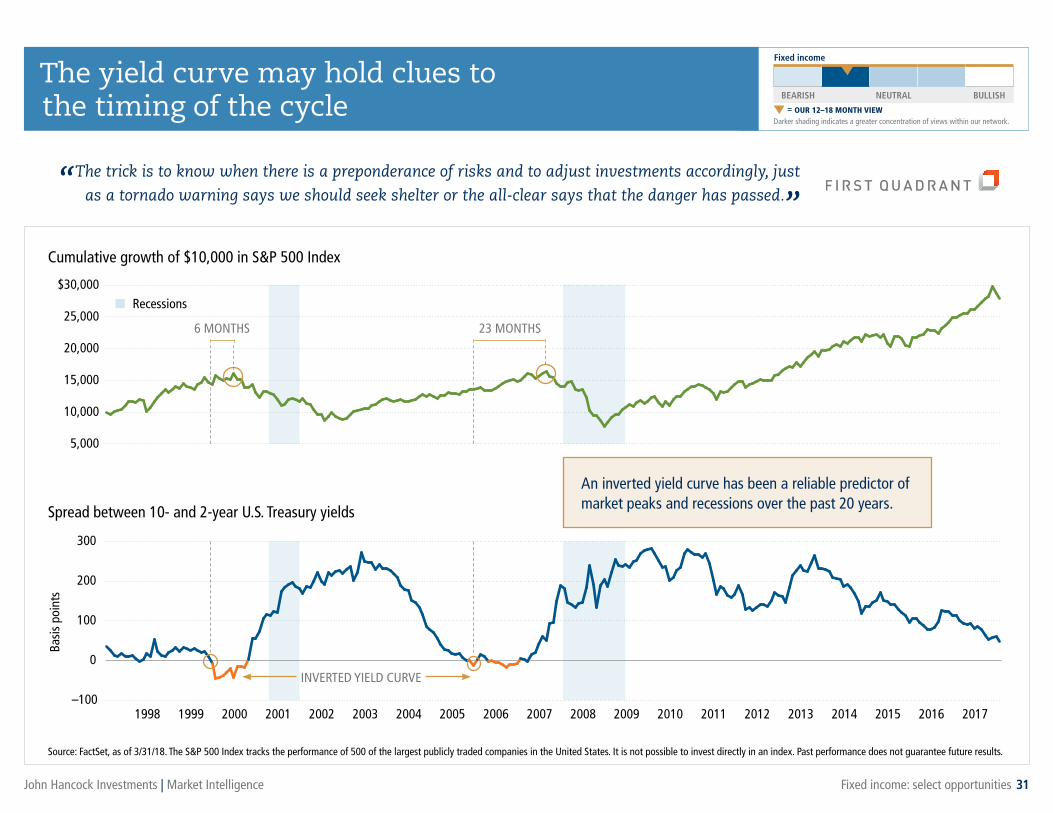
The yield curve may hold clues to the timing of the cycle
“The trick is to know when there is a preponderance of risks and to adjust investments accordingly, just
as a tornado warning says we should seek shelter or the all-clear says that the danger has passed.”Cumulative growth of $10,000 in S&P 500 Index
Spread between 10- and 2-year U.S. Treasury yields
n Recessions
An inverted yield curve has been a reliable predictor of market peaks and recessions over the past 20 years.
23 MONTHS6 MONTHS
INVERTED YIELD CURVE
Source: FactSet, as of 3/31/18. The S&P 500 Index tracks the performance of 500 of the largest publicly traded companies in the United States. It is not possible to invest directly in an index. Past performance does not guarantee future results.
Fixed income
BEARISH NEUTRAL BULLISH= OUR 12–18 MONTH VIEW

John Hancock Investments | Market Intelligence 32
Our 12–18 month view Strategies to consider
U.S. equity: solid fundamentalsSLIGHTLY BULLISH
� Overweight U.S. equities within a globally diversified portfolio
� Increasing exposure to U.S. small-cap equities
� Tilt portfolios toward sectors with a combination of compelling growth and favorable valuations
� Revisit risk tolerance and consider long/short equity in preparation for more volatility
International equity: opportunities persistSLIGHTLY BULLISH
� Overweight international equities within a globally diversified portfolio
� Increasing exposure to international small-cap equities
� For more aggressive allocations, favor emerging-market equities
Fixed income: select opportunitiesSLIGHTLY BEARISH
� Underweight fixed income within a globally diversified portfolio
� Tilt portfolios away from interest-rate-sensitive parts of the market, such as government bonds and MBS
� For more aggressive allocations, favor emerging-market debt over high yield
� Leverage investment-grade corporates to balance risk and return
Overall portfolio considerations Look to the changing slope of the U.S. Treasury yield curve for an indicator of a market peak in U.S. equities and the continued need for risk management
Opinions are those of John Hancock Investments and are provided for informational purposes only. They are subject to change and are not an endorsement of any security, mutual fund, sector, or index. No forecasts are guaranteed. Diversification does not guarantee a profit or eliminate the risk of a loss.
BEARISH NEUTRAL BULLISH
BEARISH NEUTRAL BULLISH
BEARISH NEUTRAL BULLISH
Represents our 12–18 month view.Darker shading indicates a greater concentration of views within our network.
What to do now

John Hancock Investments | Market Intelligence
1 As of 1/31/14, the fund is closed to new investors. 2 As of 3/23/18, the fund is closed to new investors. 3 As of 4/23/18, the fund is closed to new investments and will liquidate on or about 5/24/18. 4 As of 8/29/14, the fund is closed to new investments. 5 Prior to 4/20/18, the fund was called John Hancock Seaport Fund. Not all funds are available for sale at all firms. The funds listed above have associated risks. John Hancock Multifactor ETF shares are bought and sold at market price (not NAV), and are not individually redeemed from the fund. Brokerage commissions will reduce returns. John Hancock ETFs are distributed by Foreside Fund Services, LLC, and are subadvised by Dimensional Fund Advisors LP. Foreside is not affiliated with John Hancock Funds, LLC or Dimensional Fund Advisors LP. Dimensional Fund Advisors LP receives compensation from John Hancock in connection with licensing rights to the John Hancock Dimensional indexes. Dimensional Fund Advisors LP does not sponsor, endorse, or sell, and makes no representation as to the advisability of investing in, John Hancock Multifactor ETFs.
Managed by Morningstar category A C I R6
DO
MES
TIC
EQU
ITY
Balanced JHAM Allocation—50% to 70% equity SVBAX SVBCX SVBIX JBAWXBlue Chip Growth T. Rowe Price Large growth JBGAX JBGCXClassic Value Pzena Large value PZFVX JCVCX JCVIX JCVWXDisciplined Value Boston Partners Large value JVLAX JVLCX JVLIX JDVWXDisciplined Value Mid Cap1 Boston Partners Mid-cap blend JVMAX JVMCX JVMIX JVMRXEquity Income T. Rowe Price Large value JHEIX JHERXFundamental All Cap Core JHAM Large growth JFCAX JFCCX JFCIX JFAIXFundamental Large Cap Core JHAM Large blend TAGRX JHLVX JLVIX JLCWXFundamental Large Cap Value JHAM Large value JFVAX JFVCX JFVIX JFLVXNew Opportunities BW/DFA/GWK Small blend JASOX JBSOX JHSOX JWSOXSmall Cap Core JHAM Small blend JCCAX JCCIX JORSXSmall Cap Growth Redwood Small growth JSJAX JSJCX JSJIX JSJFXSmall Cap Value Wellington Small blend JSCAX JSCBX JSCCXStrategic Growth JHAM Large growth JSGAX JSGCX JSGIX JSGTXU.S. Global Leaders Growth SGA Large growth USGLX USLCX USLIX UGLSXU.S. Growth Wellington Large growth JHUAX JHUCX JHUIX JUSEXValue Equity Barrow Hanley Large value JVEAX JVECX JVEIX JVERX
GLO
BAL/
INT’
L EQ
UIT
Y
Disciplined Value International Boston Partners Foreign large blend JDIBX JDICX JDVIX JDIUXEmerging Markets Dimensional Diversified emerging markets JEVAX JEVCX JEVIX JEVRXEmerging Markets Equity JHAM Diversified emerging markets JEMQX JEMZX JEMMX JEMGXFundamental Global Franchise JHAM World large stock JFGAX JFGIX JFGFXGlobal Equity JHAM World large stock JHGEX JGECX JGEFX JGEMXGlobal Shareholder Yield Epoch World large stock JGYAX JGYCX JGYIX JGRSXGreater China Opportunities JHAM China region JCOAX JCOCX JCOIXInternational Growth2 Wellington Foreign large growth GOIGX GONCX GOGIX JIGTXInternational Small Company Dimensional Foreign small/mid blend JISAX JISDX JSCIX JHSMXInternational Value Equity JHAM Foreign large value JIEAX JIEVX JIEEX JIVUX
INCO
ME
Bond JHAM Intermediate-term bond JHNBX JHCBX JHBIX JHBSXCalifornia Tax-Free Income JHAM Muni California long TACAX TCCAX JCAFX JCSRXEmerging Markets Debt JHAM Emerging markets bond JMKAX JMKCX JMKIX JEMIXFloating Rate Income WAMCO Bank loan JFIAX JFIGX JFIIX JFIRXGlobal Income3 Stone Harbor High yield bond JYGAX JYGIX JHRSXGovernment Income JHAM Intermediate government JHGIX TCGIX JGIFX JTSRXHigh Yield JHAM High yield bond JHHBX JHYCX JYHIX JFHYXHigh Yield Municipal Bond JHAM High yield muni JHTFX JCTFX JHYMX JCTRXIncome JHAM Multisector bond JHFIX JSTCX JSTIX JSNWXInvestment Grade Bond JHAM Intermediate-term bond TAUSX TCUSX TIUSX JIGEXMoney Market JHAM Taxable money market JHMXX JMCXXShort Duration Credit Opportunities Stone Harbor Multisector bond JMBAX JMBCX JMBIX JSDEXSpectrum Income T. Rowe Price Multisector bond JHSIX JHSRXStrategic Income Opportunities JHAM Multisector bond JIPAX JIPCX JIPIX JIPRXTax-Free Bond JHAM Muni national long TAMBX TBMBX JTBDX JTMRX
Managed by Morningstar category A C I R6
ALT
ERN
ATIV
E A
ND
SPE
CIA
LTY
Absolute Return Currency First Quadrant Multicurrency JCUAX JCUCX JCUIX JCURXAlternative Asset Allocation JHAM Multialternative JAAAX JAACX JAAIX JAARXEnduring Assets Wellington Infrastructure JEEBX JEEFX JEEIX JEEDXFinancial Industries JHAM Financial FIDAX FIDCX JFIFX JFDRXGlobal Absolute Return Strategies Standard Life Multialternative JHAAX JHACX JHAIX JHASXGlobal Conservative Absolute Return Standard Life Multialternative JHRAX JHRCX JHRIX JHRRXGlobal Focused Strategies Standard Life Multialternative JGFOX JGFEX JGFGX JGFDXNatural Resources4 Jennison Natural resources JNRAX JNRIXRedwood Boston Partners Options-based JTRAX JTRCX JTRIX JTRRXRegional Bank JHAM Financial FRBAX FRBCX JRBFX JRGRXSeaport Long/Short 5 Wellington Long/short equity JSFBX JSFTX JSFDX JSFRXTechnical Opportunities Wellington Large growth JTCAX JTCDX JTCIX JTOPX
ASS
ET A
LLO
C Income Allocation Fund JHAM Allocation—15% to 30% equity JIAFX JIAGX JIAIX JIASXMulti-Index Lifetime Portfolios JHAMMulti-Index Preservation Portfolios JHAMMultimanager Lifestyle Portfolios JHAMMultimanager Lifetime Portfolios JHAM
ESG
ESG All Cap Core Trillium Large growth JHKAX JHKCX JHKIX JHKRXESG Core Bond Breckinridge Intermediate-term bond JBOAX JBOIX JBORXESG International Equity Boston Common Foreign large blend JTQAX JTQIX JTQRXESG Large Cap Core Trillium Large blend JHJAX JHJCX JHJIX JHJRX
Index provider Morningstar category Ticker
ETF
John Hancock Multifactor Consumer Discretionary ETF Dimensional Consumer cyclical JHMCJohn Hancock Multifactor Consumer Staples ETF Dimensional Consumer defensive JHMSJohn Hancock Multifactor Developed International ETF Dimensional Foreign large blend JHMDJohn Hancock Multifactor Energy ETF Dimensional Equity energy JHMEJohn Hancock Multifactor Financials ETF Dimensional Financial JHMFJohn Hancock Multifactor Healthcare ETF Dimensional Health JHMHJohn Hancock Multifactor Industrials ETF Dimensional Industrials JHMIJohn Hancock Multifactor Large Cap ETF Dimensional Large blend JHMLJohn Hancock Multifactor Materials ETF Dimensional Natural resources JHMAJohn Hancock Multifactor Mid Cap ETF Dimensional Mid-cap blend JHMMJohn Hancock Multifactor Small Cap ETF Dimensional Small blend JHSCJohn Hancock Multifactor Technology ETF Dimensional Technology JHMTJohn Hancock Multifactor Utilities ETF Dimensional Utilities JHMU
33
Family of funds As of March 31, 2018

Connect with John Hancock Investments: @JH_Investments | jhinvestmentsblog.com
John Hancock Funds, LLC Member FINRA, SIPC601 Congress Street Boston, MA 02210-2805 800-225-5291 jhinvestments.com
NOT FDIC INSURED. MAY LOSE VALUE. NO BANK GUARANTEE. NOT INSURED BY ANY GOVERNMENT AGENCY.
Request a prospectus or summary prospectus from your financial advisor, by visiting jhinvestments.com, or by calling us at 800-225-5291. The prospectus includes investment objectives, risks, fees, expenses, and other information that you should consider carefully before investing.
The opinions expressed are those of the contributors as of 3/31/18 and are subject to change. No forecasts are guaranteed. This commentary is provided for informational purposes only and is not an endorsement of any security, mutual fund, sector, or index. John Hancock Funds, LLC, John Hancock Advisers, LLC, and their affiliates, employees, and clients may hold or trade the securities mentioned in this commentary. Past performance does not guarantee future results.
Asset manager views are compiled throughout the preceding calendar quarter through in-person discussions, reviewed research, and on-site visits. These inputs are complemented by third-party research collected during the calendar quarter. Our views reflect John Hancock Investments’ proprietary weighting of these inputs.
A bearish reading indicates the potential for an asset to underperform its class or subclass on a risk-adjusted basis. A bullish reading indicates the potential for an asset to outperform its class or subclass on a risk-adjusted basis. A neutral reading indicates the potential for performance in line with the asset’s historical averages.
Stocks and bonds can decline due to adverse issuer, market, regulatory, or economic developments; foreign investing, especially in emerging markets, has additional risks, such as currency and market volatility and political and social instability; value stocks may decline in price; growth stocks may be more susceptible to earnings disappointments; the securities of small companies are subject to higher volatility than those of larger, more established companies; and high-yield bonds are subject to additional risks, such as increased risk of default. Fixed-income investments are subject to interest-rate and credit risk; their value will normally decline as interest rates rise or if an issuer is unable or unwilling to make principal or interest payments. Liquidity—the extent to which a security may be sold or a derivative position closed without negatively affecting its market value, if at all—may be impaired by reduced trading volume, heightened volatility, rising interest rates, and other market conditions. Hedging and other strategic transactions may increase volatility and result in losses if not successful. Currency transactions are affected by fluctuations in exchange rates. This material is not intended to be, nor shall it be interpreted or construed as, a recommendation or providing advice, impartial or otherwise. John Hancock Investments and its representatives and affiliates may receive compensation derived from the sale of and/or from any investment made in its products and services.

Connect with John Hancock Investments: @JH_Investments | jhinvestmentsblog.com
John Hancock Funds, LLC Member FINRA, SIPC601 Congress Street Boston, MA 02210-2805 800-225-5291 jhinvestments.com
NOT FDIC INSURED. MAY LOSE VALUE. NO BANK GUARANTEE. NOT INSURED BY ANY GOVERNMENT AGENCY.MF443182 JHAN-2016-04-04-0273 MIBOOK 4/18