Market Insights/Torcivia 37 Hilgert Avenue 610-927 … Insights PPT.pdf · Product/Brand...
32
Market Insights/Torcivia 37 Hilgert Avenue Reading, PA 19607 610-927-2299 [email protected] Market Insights 1
Transcript of Market Insights/Torcivia 37 Hilgert Avenue 610-927 … Insights PPT.pdf · Product/Brand...

Market Insights/Torcivia
37 Hilgert Avenue Reading, PA 19607
610-927-2299
Market Insights1

• Background & Qualifications • U.S. Wood Flooring Market
• Canada Wood Flooring Market
• Brand Positioning • Discussion with Questions & Answers
Market Insights2

• Market Insights: 1997 to present Contributing Editor: Floor Focus magazine Expert Witness in Federal Court (re: Flooring)
• Mannington Mills- 16 years: Business Development & Planning; Business Analysis; Channel Management; Market Research; and, Acquisition & Ventures
• American Bank & Trust (now Wells Fargo)- 8 years • Temple University (Phila., PA): BS- Economics Graduate study Columbia University
Market Insights
3

U.S. Wood Flooring Market
Market Insights4

Market Insights5

Market Insights6
Market Insights7

Market Insights8

Market Insights9
Market Insights
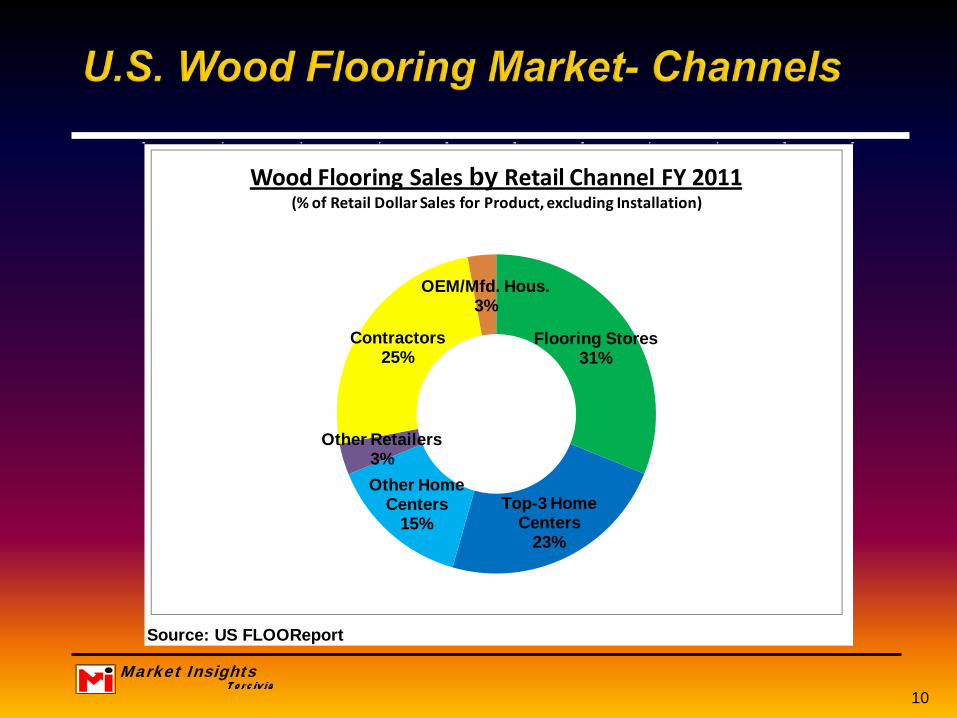
Source: US FLOOReport
Flooring Stores31%
Top-3 Home Centers
23%
Other Home Centers
15%
Other Retailers3%
Contractors25%
OEM/Mfd. Hous.3%
Wood Flooring Sales by Retail Channel FY 2011(% of Retail Dollar Sales for Product, excluding Installation)
10

Market Insights11

Market Insights12

Market Insights13

Market Insights14

Market Insights15

Market Insights
Country of Origin 2008 2009 2010 2011 2011 2012 % Chg.Total Imports- 341 581 462 547 279 312 11.7%
% Change -- 70.4% -20.5% 18.4%
1 China 37% 50% 55% 56% 54% 60%2 Brazil 12% 21% 19% 18% 20% 15%3 Canada 22% 12% 13% 12% 12% 12%4 Malaysia 3% 2% 2% 1% 2% 2%5 Paraguay 1% 1% 1% 2% 2% 1%6 Peru 0% 1% 1% 1% 1% 1%7 Indonesia 4% 2% 1% 1% 1% 2%8 Chile 1% 1% 1% 1% 1% 1%9 Denmark 1% 1% 1% 1% 1% 1%
10 Italy 2% 0% 0% 0% 1% 1%All Others 18% 8% 7% 6% 5% 4%Total Imports- 100% 100% 100% 100% 100% 100%
Notes: -Changes in Harmonozed Tariff System (HTS) codes prevent comparisons with import figures for wood flooring before 2008
-Bamboo flooring not included in wood flooring import figuresSource: U.S. International Trade Commission
Prepared by Market Insights (Reading, PA)
Annual Import Values(US $ in millions at C.I.F.)
Year-to-Date(US$ in millions @ c.i.f.)
Share of Imports
16

Market Insights
U.S.A. Data % of U.S. Data % of U.S.
Total Population in 2011 (MM, mid-year) 310 34 11% 380 122%
Wood Flooring Market FY 2011: Quantity (sq. ft., MM) 715 184 26% 764 107%
Value (US$, MM) 1,636 484 30% n.a. n.a.
Per-Capita Quantity Consumption (sq. ft. per person) 2.30 5.45 236% 2.01 87%
*Europe= Western Europe plus nations of Scandanavia, Hungary, Czech & Slovakian Reps.Prepared by Market Insights (Reading, PA)
Canada Europe*
17

Market Insights18

Canada Wood Flooring Market
Market Insights19
Market Insights20

Market Insights21
Market Insights22
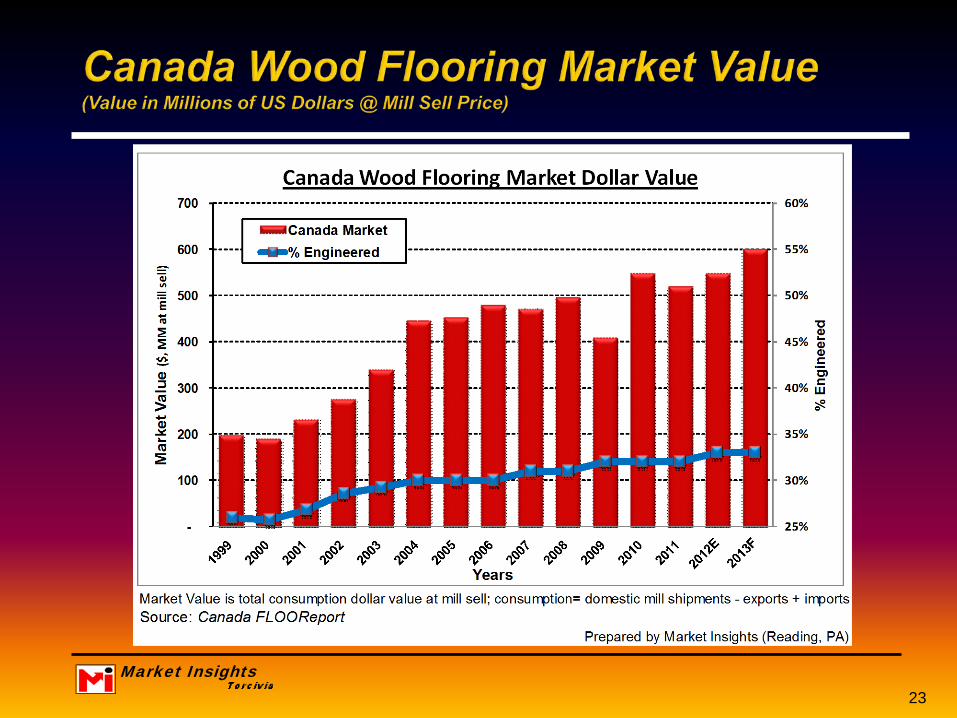
Market Insights23

Wood Flooring Brand Positioning
Market Insights24

Market Insights25
High Value/ High PricedProduct/Brand Characteristics:
- Many Product Features/Benefits- High Brand Equity- Very Positive Brand Image- Most Customers are Brand Loyal
Low-Value/ Low-PricedProduct/Brand Characteristics:
Middle-Value/ Mid-Priced - Few/No Product Features/BenefitsProduct/Brand Characteristics: - Some/No Brand Equity- Some Product Features/Benefits - Value-based Brand Image/ or None- Some Brand Equity - Customers are Price Loyal- Somewhat Positive Brand Image- Some Customers are Brand Loyal

Market Insights
% Adv./SalesBrand 2007 2008 2009 2010 2011 Amount Share (2007 - 2011)
($, 000) ($, 000) ($, 000) ($, 000) ($, 000) ($, 000)Armstrong 18,114 11,374 5,975 6,380 - 41,843 52% 1.9%Bellawood (Lumber Liq.) 2,420 716 1,034 1,612 3,356 9,138 11% 2.4%Mirage (Boa Franc) 2,644 2,269 1,177 1,509 760 8,359 10% 4.3%BR-111 4,936 2,467 - 265 - 7,668 10% 5.6%Carlisle Wide Width Planks 558 2,500 296 1,589 386 5,329 7% n.a. Teragren (bamboo) 955 1,074 322 - - 2,351 3% n.a. Shaw* - - 909 142 - 1,050 1% 0.1%Mohawk - 1,024 - - - 1,024 1% 0.1%Bella Cera - - - 636 377 1,013 1% n.a. Listone Giordano (Marg.)* 497 - - - - 497 1% n.a. Mullican - - - 411 - 411 1% 0.1%T. Morton/ Armstrong 302 - - - - 302 0% n.a. Max Windsor 272 - - - - 272 0% n.a. Wicanders (cork) 269 - - - - 269 0% n.a. Pianto Legano 255 - - - - 255 0% n.a.
Totals- 31,222 21,424 9,713 12,544 4,879 79,781 100% 1.0%% of Residential $ Sales 1.5% 1.3% 0.7% 0.9% 0.3% 1.0%Source: Kantar Media
Total 2007- 2011
26

Market Insights
Product Category 2007 2008 2009 2010 2011Resilient Flooring 0.2% 0.2% 0.0% 0.0% 0.7%Laminate Flooring 2.3% 2.8% 2.4% 2.0% 0.0%Wood Flooring 1.5% 1.3% 0.7% 0.9% 0.3%Ceramic Tile 0.6% 0.7% 0.6% 0.3% 0.0%Carpet 0.3% 0.3% 0.2% 0.1% 0.1%
Flooring Manufacturers- 0.6% 0.6% 0.5% 0.4% 0.2%
Carpet Fiber 0.2% 0.1% 0.1% 0.2% 0.1%Total Flooring & Fibers- 0.7% 0.7% 0.6% 0.5% 0.2%
Source: Kantar Media and US FLOOReport
27

Market Insights
(Mkt. Sh.) (Mkt. Sh.)Top-5 Retailers 8% Top-5 Retailers 20%Color Tile The Home DepotNew York Carpet World LowesSears Lumber LiquidatorsSherwin Williams Empire TodayCarpetland USA Sherwin Williams
Private Label Brands Private Label BrandsBrand Name Retailer Brand Name Retailer(None) Trafficmaster THD
Surface Source LowesBellawood Lmbr. Liq.
20121993
28

Market Insights
Brand EquityProduct
Higher Profits Differentiation: - Image
Higher Margin - Performance - Product Development - Cost/ Price - Adv./Brand Development - Research & Development - Capital Investment - Earnings & Bonus'
CommodityNo/Low Brand Equity
29

Market Insights30
• Large retailers gaining channel power • Retailer brands increasing
• Manufacturer brands decreasing
• Brand equity= higher margins= increased brand equity
• Brand equity is an investment= equipment maintenance • Commodity status= lower margins= low brand equity
• IT IS NOT TOO LATE….

Market Insights31
• Economy future is election dependent ???? • Wood Flooring: U.S.= +12% in $ Sales in 2013
Can.= +9% in $ Sales in 2013
• Channel Sales: about 35% each H.C’ers, Flooring, & Contractors
• Channel power shifting to retailers • Adv. & Brand Investment declining for manufacturers and increasing for retailers • Future is your choice= ….Brand equity or Commodity status

Discussion Questions & Answers
Market Insights32