Market Imperfections and Dividend Policy Decisions ... Imperfections and Dividend...Market...
41
Market Imperfections and Dividend Policy Decisions: Evidence from Manufacturing Sector of Pakistan DARAKHSHAN YOUNIS ATTIYA YASMEEN JAVID
-
Upload
vuongtuyen -
Category
Documents
-
view
232 -
download
3
Transcript of Market Imperfections and Dividend Policy Decisions ... Imperfections and Dividend...Market...

Market Imperfections and Dividend Policy Decisions: Evidence from Manufacturing
Sector of Pakistan
DARAKHSHAN YOUNIS
ATTIYA YASMEEN JAVID

Introduction
In corporate finance, the finance manager is generally thought to face two operational decisions: the investment (or capital budgeting) and the financing decisions. A third decision may arise, however, when the firm begins to generate profits.
When firm decides to pay a dividend there is a tradeoff between retained earnings and new shares.
Dividend policy is important financial decision and one of the essential parts of corporate policy.

Motivation of the Study
Market Imperfections
Asymmetric Information
Agency Costs
Transaction Costs
Taxes
Significance of Study
The present study contributes to existing literature by testing significance of dividend theories.
Dividend Theories
Signaling Theory
Agency Cost
Theory
Transaction Cost Theory
Stability Theory
Life Cycle Theory

Research Objectives To test the relevance of the Lintner (1956) model and check whether firms in manufacturing sector follow smooth and stable dividend policy or not.
To test that dividends help in reducing agency cost of the firms in manufacturing sector.
To test that dividend policies signal corporate operating characteristics of these firms.
To test the effect of transaction costs on the dividend paying ability of these firms.
To test whether mature, profitable, low growth firms pay more dividends or not.

Theoretical Background
Agency Cost Theory
Firstly agency problem identified by Jensen and Meckling (1976) and further extended by Rozeff (1982) and Easterbrook (1984). This theory derives from the potential conflict of interests between corporate managers (agents) and outside shareholders (principals).
Signaling Theory
This theory suggests that there is information asymmetry between managers and stockholders. Managers have internal information while stockholders have not. Managers would take costly but credible measures to transfer this information. One of these measures is dividend.

Theoretical Background
Transaction Cost Theory
Williamson (1988, 1996) states that corporate finance and corporate governance questions can be answered with the help of transaction cost economics. Low transaction costs of issuing equity or debt is positively related to dividend payments and firms that have high transaction costs reduce their dividend payments to shareholders.
Life Cycle Theory
The firm life cycle theory of dividends states that mature firms face low investment opportunities and anticipates firm growth rate and earnings are expected to fall.

Theoretical background
Stability Theory
Bringham and Houstan (2004) have stated that stable dividend policy is substantial for firm value. Shareholders require stability of dividend because they depend on dividends to fulfill their costs.
Free Cash Flow Theory
Free cash flow is primarily amount of cash that would be left after all positive net present value projects are taken up. Distribution of FCF as dividends help to reduce overinvestment problem.

Literature Review Theory Year
Agency Cost theory 1980,1984,1986 Grossman and Hart , Easterbrook , and Jensen said that dividend payment at lest partially reduce the agency cost problem. When management pay dividend it would have less cash in control so difficult for management to misuse shareholder wealth through unmonitored activities
Signaling Theory 1977,1979 Properties of dividends emerging from signaling models were examined by Ross and Bhattacharya. When firm announces to pay dividends surplus returns noticed because of this announcement and signaling theories help to investigate these excess returns.

Literature Review Theory Year Transaction Cost Theory 1988,1996 Williamson states that corporate finance and corporate
governance questions can be answered with the help of transaction cost economics. Low transaction costs of issuing equity or debt is positively related to dividend payments and firms that have high transaction costs reduce their dividend payments to shareholders.
Dividend Stability Theory 2004 Bringham and Houstan have stated that stable dividend policy is substantial for firm value. Revenue, favorable financing circumstances and cash flows change with time. Therefore firms change their dividends with time e.g. firm increase dividends when investment opportunities are low and cash flows are large and vice versa.
Literature Review
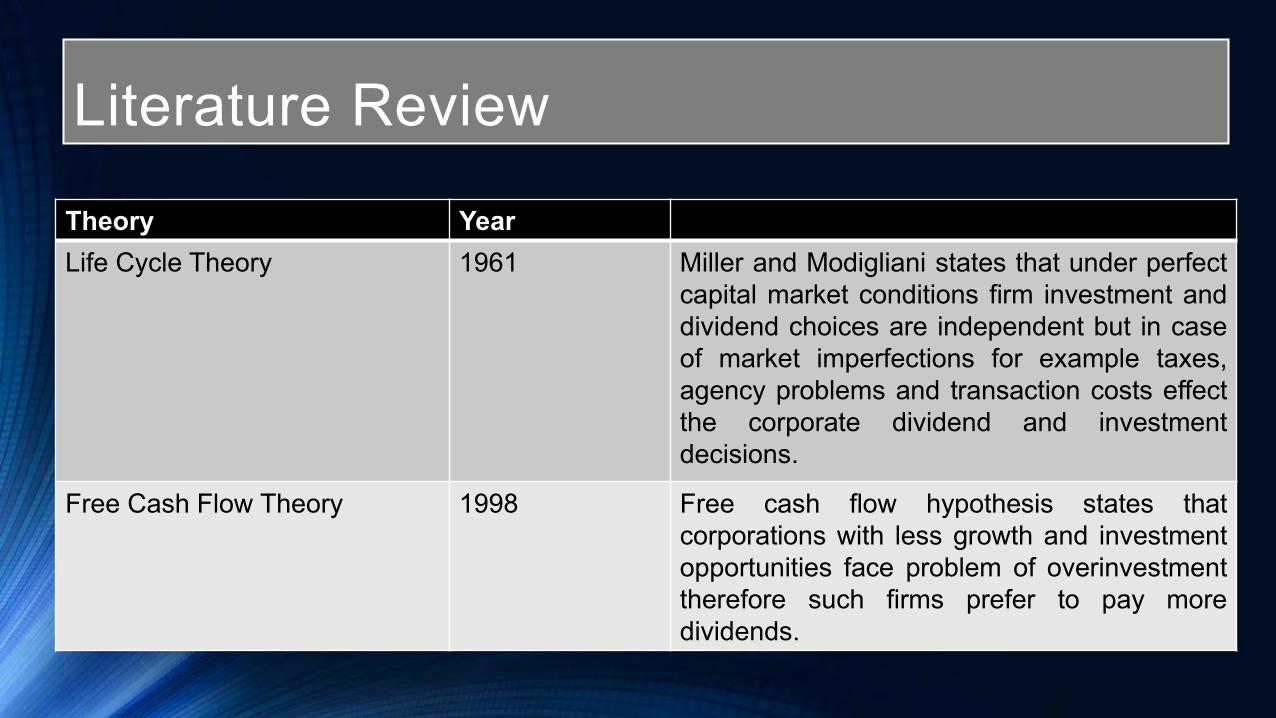
Theory Year Life Cycle Theory 1961 Miller and Modigliani states that under perfect
capital market conditions firm investment and dividend choices are independent but in case of market imperfections for example taxes, agency problems and transaction costs effect the corporate dividend and investment decisions.
Free Cash Flow Theory 1998 Free cash flow hypothesis states that corporations with less growth and investment opportunities face problem of overinvestment therefore such firms prefer to pay more dividends.

Variables Definition
Dependent Variable
Dividend Yield
DY=DPS/EPS

Stability Theory
Dividend Theory
• Earning Per share
• Dividend Per share
Variables
• EPS=Net Income/No of outstanding shares
• DPS=Total amount of dividend/No of outstanding shares
Formula
Variables Definition

Signaling Theory
RETURN=(P1-P0)/P0 ROA=Net
Income/Total assets
MB=Market price/Book
value
NI=Profit before tax-
Tax
Return ROA MB NI
Variables Definition

•Agency cost Theory
Dividend Theory
• Insider Ownership
• Free Cash Flow • Collateral
Capacity
Proxies • MSO=Percentage
of shares held by mangers.
• FCF=Ratio of FCF/Total asset
• LNFIX=Natural Log of fixed assets
Variable Structure
Variables Definition

Transaction Cost Theory
BETA
SIZE Growth
BETA=Covariance of stock return with market
return/Variance of market return
SG=Natural logarithm of firm sales
SIZEA=Natural logarithm of firm total assets
Variables Definition

Variables Definition
Life Cycle Theory
Age Price Earning Ratio
Market to Book Value
AGE=listing date-2012 P/E ratio=Market Price/Earning per share
MB=Market price/Book value

Model Development • Analysis begins with the Lintner Model which was
developed in 1956 by John Lintner who said that firms set a target payout ratio according to their earnings and whenever their occurs a change in their earnings firms don’t immediately change their dividends but these changes are partial . So this model is also called Partial Adjusted model.

Lintner Model
• Lintner (1956) built the following behavioral model in light of his survey findings:
Dt-Dt-1=α0+K(rPt-Dt-1)+ut
Dt=α0+α1Pt+α2Dt-1
Where α1=rK , α2=1-K
α0is generally positive.
Speed of Adjustment(K)=1-α2
Payout ratio(r)=α1/1-α2

Stability Theory Model • The preceding model is modified to test for stability in the
dividend policy of the Manufacturing companies listed on the KSE. As is the standard practice in the financial economics literature, the Lintner model is modified as per Fama and Babiak (1968), and estimated as:
DPSi,t = = α1+β1EPSi,t+ β2DPSi,(t-1)+єi,t

Signaling Theory Model
Dividend and Earnings
Div it = α + β1NIit + β2SIZEAit + β3LEVEARGEit + β4DY i(t-1) + є it
Dividend and Performance
Div it = α + β1MBit + β2SIZEAit + β3LEVEARGEit + β4DY i(t-1) + є it
Dividend and Performance
Div it = α + β1ROAit + β2SIZEAit + β3LEVEARGEit + β4DY i(t-1) + є it
Dividend and Return
Div it = α + β1RETURNit + β2SIZEAit + β3LEVEARGEit + β4DY i(t-1) + є it

Agency Cost Theory Model
Div it = α + β1FCFit + β2SGit + β3ROAit + β4DY i(t-1) + є it
Div it = α + β1Lnfixit + β2SGit + β3ROAit + β4DY i(t-1) + є it
Div it = α + β1MSOit + β2SGit + β3ROAit + β4DY i(t-1) + є it
Div it = α + β1MSOit +β2Lnfixit +β3FCFit+β4SGit+ β5DY i(t-1)+є it

Transaction Cost Theory Model
Div it = α + β1BETAit + β2NIit + β3EPSit + β4DY i(t-1) + є it
Div it = α + β1SIZEAit + β2NIit + β3EPSit + β4DY i(t-1) + є it
Div it = α + β1GSit + β2NIit + β3EPSit + β4DY i(t-1) + є it
Div it=α+β1BETAit +β2SIZEAit+β3GSit+β4NIit+β5EPSit+ β6DY i(t-1) + є it

Life Cycle Theory Model
Div it = α + β1AGEit + β2NIit + β3LEVEARGEit + β4DY i(t-1) + є it
Div it = α + β1P/Eit + β2NIit + β3LEVEARGEit + β4DY i(t-1) + є it
Div it = α + β1MBit + β2NIit + β3LEVEARGEit + β4DY i(t-1) + є it
Divit=α+β1AGEit+β2MBit+β3P/Eit+β4NIit +β5LEVERAGE+β6DY i(t-1) + є it

Sample Selection
Observations are from 2003-
2011.
138 firm are selected from 19 different sectors.
Firms are taken on the basis of
total asset.
Data is taken from annul reports, balance
sheet analysis and business recorder.

Estimation Technique
• For estimating the previously explained model we have used panel
data GMM technique because GMM technique deal with the problems
like endogenity .GMM technique is used as
• GMM CEM to test the individual effect of firms characteristic.
• GMM FEM to check industry effect by dummy variable.
• GMM REM to check the random effects of error terms.

Lintner Model Results Regressors CEM FEM REM
NI 0.23* (2.44)
0.08 (0.48)
0.23*
(2.54)
Dt-1 0.57* (19.8)
0.30* (9.01)
0.57*
(20.63)
Adjusted R-squared 30.7% 35.92% 30.7%
Hausman test(p-value) 0.000
Sargan test(p-value) 0.4 0.97 0.4
Durbin Watson(p-value) 2.1 2.0 2.1
The speed of adjustment (1-ai ) 43% 70% 43%
The target payout ratio (β/(1-ai)) 53% 11.42% 53%

Stability Theory Regressors CEM FEM REM
EPS 0.08*
(13.07) 0.07* (10.38)
0.08* (14.77)
DPSt-1 0.68* (31.26)
0.27* (8.90)
0.68*
(35.35) Adjusted R-squared 70.92% 76.90% 70.92%
Hausman test(p-value) 0.000
Sargan test(p-value) 0.124 0.061 0.115
Durbin Watson(p-value) 2.3 2.2 2.3
The speed of adjustment (1-ai ) 32% 73% 32%
The target payout ratio (β/(1-ai)) 25% 9% 25%

Signaling Theory Results Regressors Model 1 Model 2 Model 3 Model 4 RETURN -0.039** (1.98) ROA 0.04* (5.82) MB 0.08(0.96) NI 0.179** (1.92) SIZEA 0.002* (4.75) 0.0016*(3.30) 0.0023* (4.47) 0.002* (3.40) LEVERAGE -0.008*** (1.63) -0.004(0.91) -0.009*** (1.8) -0.004(0.90) DYt-1 0.56* (21.73) 0.51* (19.11) 0.54* (19.02) 0.54* (18.69) Adjusted R-squared 34.81% 35.75% 31.75% 31.42%
Hausman test(pvalue) 0.000 0.000 0.000 0.000
Sargantest(p-value) 0.07 0.07 0.09 0.56
Durbin Watson(p value) 2.11 2.04 2.08 2.08

Individual Model for Agency Cost Theory Regressors Model 1 Model 2 Model 3 FCF 0.032* (2.32) MSO 0.005(1.16) LNFIX 0.016* (2.34) SG 0.015* (3.25) 0.09* (2.48) 0.09* (2.31) ROA 0.02(1.55) 0.05* (6.87) 0.05* (6.47) DYt-1 0.53* (16.25) 0.5* (17.76) 0.48* (16.36) Adjusted R-squared 38.25% 34.12% 33.64% Hausman test(p-value) 0.000 0.000 0.000 Sargantest(p-value) 0.107 0.138 0.110 Durbin Watson(p-value) 1.99 2.02 2.03

Overall Model for Agency Cost Theory Regressors CEM FEM REM
FCF 0.05* (5.72) 0.054* (4.95) 0.05* (6.03) MSO 0.00814(1.28) 0.003* (2.05) 0.00814(1.35)
LNFIX 0.018* (2.06) 0.06* (3.09) 0.018* (2.17) SG 0.015* (3.04) 0.008* (2.07) 0.015* (3.20)
DYt-1 0.52* (14.60) 0.30* (9.58) 0.52* (15.38) Adjusted R-squared 37.32% 38.10% 37.32%
Hausman test(p-value) 0.000 Sargantest(p-value) 0.106 0.187 0.106
Durbin Watson(p-value) 2.0 2.0 2.0

Results of Transaction Cost Theory
Regressors REM REM REM Beta -0.039(0.172)
SIZEA 0.017* (3.27)
SG 0.011* (3.01)
NI 0.177** (1.90) 0.12(1.28) 0.168*** (1.83)
EPS 0.02* (4.73) 0.02* (4.11) 0.0002* (4.35)
DYt-1 0.54* (19.19) 0.52* (18.34) 0.53* (19.09)
Adjusted R-squared 32.10% 32.80% 32.69%
Hausman test(p-value) 0.000 0.000 0.000
Sargantest(p-value) 0.69 0.86 0.71
Durbin Watson(p-value) 2.07 2.05 2.06

Overall Model Results for Transaction Cost Theory Regressors CEM FEM REM Beta -0.013(0.65) 0.449(0.019) -0.013(0.667) SIZEA 0.017* (3.47) 0.027* (2.63) 0.017* (3.55) SG 0.01* (2.80) 0.0082* (2.15) 0.010* (2.87) EPS 0.01* (2.99) 0.019* (2.73) 0.015* (3.06) NI 0.114(1.25) -0.103(0.66) 0.114(1.28) DYt-1 0.53* (20.06) 0.32* (10.57) 0.53* (20.53) Adjusted R-squared 34.08% 37.82% 34.88% Hausman test(p-value) 0.000 Sargantest(p-value) 0.29 0.45 0.29 Durbin-Watson (P-Value)
2.08 2.04 2.08

Results of Life Cycle Theory Regressors REM REM REM
AGE 0.0061 (0.725)
MB 0.0012 (1.40)
P/E 0.0023 (0.38)
NI 0.228* (2.46) 0.209* (2.25) 0.225* (2.40)
LEV -0.005 (1.02) -0.005 (0.90) -0.005 (1.01)
DYt-1 0.57* (20.42) 0.56* (19.96) 0.57* (20.50)
Adjusted R-squared 30.8% 30.7% 30.8%
Hausman test(p-value) 0.000 0.000 0.000
Sargantest(p-value) 0.75 0.05 0.64
Durbin Watson(p-value) 2.1 2.1 2.1

Overall Model Results of Life Cycle Theory Regressors CEM FEM REM
AGE 0.062 (0.70) -0.002 (0.16) 0.006 (0.74) MB 0.001 (1.34) -0.006* (4.42) 0.001 (1.41) P/E 0.0017 (0.27) -0.002 (0.38) 0.002 (0.28) NI 0.202* (2.05) 0.114 (0.66) 0.202* (2.16)
LEV -0.0068 (1.17) -0.0017 (0.23) -0.0068 (1.23) DYt-1 0.56* (18.78) 0.30* (8.9) 0.56* (19.72)
Adjusted R-squared 30.8% 37.2% 30.8% Hausman test(p-value) 0.000
Sargantest(p-value) 0.17 0.05 0.17 Durbin Watson(p-value) 2.1 2.1 2.1

Results of Life Cycle and Free Cash Flow Theory
Regressors CEM FEM REM
FCF 0.028* (2.05) 0.034* (2.38) 0.028* (2.15)
ROA 0.03* (2.15) 0.04* (2.42) 0.03* (2.25)
MB -0.01 (1.59) -0.06* (5.42) -0.01 (1.59)
P/E -0.02 (0.38) -0.02 (0.26) -0.023 (0.39)
LEV -0.06 (0.11) -0.04 (0.30) 0.06 (0.12)
DYt-1 0.50* (16.8) 0.30* (9.68) 0.50* (17.63)
Adjusted R-squared 34.17% 39.1% 34.17%
Hausman test(p-value) 0.000
Sargantest(p-value) 0.11 0.29 0.11
Durbin Watson(p-value) 2.02 2.0 2.02

Conclusion • Lintner Model results show that dividend yield has a positive
relationship with last year’s dividend yield and current year earnings.
• Fama and Babiak (1968) model shows absence of dividend stability.
• Dividend signal information by two operating characteristics of firm which are earnings and performance.
• Free cash flow and collateral capacity are more useful tools to minimize agency costs.
• Firm size and sales growth are more effective instruments to reduce transaction costs.

Conclusion • Results show insignificant relationship of dividend yield with firm maturity proxies and do not support firm life cycle theory of dividends.
• Free cash flow and return on asset are used to test free cash flow hypothesis and results support this hypothesis indicating that when firms have more free cash flow managers choose to pay more dividends.
• It can be said that signaling hypothesis has dominant role in discussing dividend policy.

Policy Implications
Security Exchange Commission of Pakistan (SECP) should enforce a minimum payout ratio
Authorities should set some specific
percentage of net income must be
distributed to shareholders as
dividends.

Future Research • Which dividend theory best describe the dividend behavior of
financial firms listed on Karachi Stock Exchange (KSE) and compare their dividend payout polices with non financial firms listed on Karachi Stock Exchange (KSE).
• Further analysis can also be done to investigate shareholders choice between dividend and capital gain.
• Behavioral aspects of management that effect dividend policy can also be considered.