
Mobile Internet, Pocket Internet Plans, Aircel Pocket Internet | Aircel Delhi

Pulse
Monthly Real Estate Monitor
Market Highlights
August 2015
JULY 2015
Office space demand
increased across all
cities barring
Chennai and Kolkata
Retail space leasing
was robust in Chennai,
Hyderabad and
Mumbai
Residential demand
increased in Hyderabad
Get city Pulse by clicking below

Pulse
Monthly Real Estate Monitor
August 2015
Favourable Neutral Unfavourable
Legend: Market Sentiment
Peripheral Business
Districts Get Attractive
across Indian Cities
While the trend has been especially pronounced in case of
Gurgaon, Mumbai’s peripheral business districts remain an
exception to this trend so far
Among the major trends of the transitions that India’s real estate has
undergone over the past decade, is the trend of companies migrating
to offices in the suburbs and peripheral areas of major Indian cities.
Driven by a combination of cheaper rents and lesser commute times
for workforce, the migration has risen sharply over the last decade.
IT/ITeS companies, which were largely location-independent due to
their offshore-onsite business model, are the trend-setters in this
respect. Other sectors have increasingly taken the cue in setting-up
large office spaces in secondary business districts (SBDs) and
peripheral business districts (PBDs).
Developers have responded to occupier demand by executing large
IT parks and office projects in SBD and PBD precincts. PBD has seen
the biggest jump in the share of office stock, rising from 28% in 2004
to 47% in 1H2015. The share of SBDs in office stock has remained
stable over the last several years at around 43%.
CBD, on the other hand, has witnessed a severe attrition of occupiers
and a decline in fresh supply that‘s led to a significant drop in its share
of office stock from about 33% in 2004 to 10% in 1H2015.
Reasons behind the transition
The preference for SBDs and PBDs has been largely dependent on
the development of mass transit systems and social infrastructure.
The availability of large contiguous land parcels and high quality
supply of buildings have been other major factors in this trend.
Rental difference – the principal factor driving the rush towards
extended suburbs – has been significant. As of 1H2015, average
rental values at PBD locations in the country were about 45-60%
cheaper than CBD rentals.
Anuj Puri, Chairman & Country Head, JLL India
-------------------------------------------------------------------------------------------- For further reading please refer to following link:
http://www.joneslanglasalleblog.com/realestatecompass/real-estate/2015/08/peripheral-
business-districts-attractive-indian-cities//
More than 100 planned hotel projects in India
are in limbo, some stuck for as long as five
years, as the sector suffers from
overcapacity. A large number of these
projects belong to international hotel chains,
which had planned aggressive expansion in
India, only to face slow market growth and
pressure on room rates. High borrowing
costs of 13-14% are also making it tough. In
addition, limited interest from private equity
investors, due to lack of exit options, has also
led to a paucity of funds for the sector.
Investment sentiments
improving
A unit of the New York based private equity
firm Warburg Pincus will invest USD 284
million for a stake in Piramal Realty, the real
estate development arm of Piramal Group
NITI Aayog vice-chairman Arvind Panagariya exuded
confidence that India could be an USD 8 trillion economy, the
third largest one in the world, within next 15 years or even less
if it continues with growth-enabling policies.
India ranks third in the list of top 10 countries
outside US for LEED rated green buildings,
according to US Green Building
Council (USGBC). India has 1,883 projects
LEED certified and registered projects.
Next

DELHI
KOLKATA
CHENNAI
BANGALORE
HYDERABAD
PUNE MUMBAI
AHMEDABAD
For more information about our research, contact
Ashutosh Limaye
National Director, Research and REIS +91 98211 07054 [email protected]
Sujash Bera
Manager, Research +91 98305 43922 [email protected]
Research Dynamics 2015
Pulse reports from JLL are frequent updates on real estate market dynamics.
www.joneslanglasalle.co.in
Cities
Office
Rental
Value
Retail
Rental
Value
Residential
Capital
values
AHMEDABAD
DELHI
MUMBAI
PUNE
BANGALORE
CHENNAI
HYDERABAD
KOLKATA
Legend
Growing Stabilise Stagnate Falling
Back to top

OFFICE
Demand Vacancy
RV
CV
RETAIL
Demand Vacancy
RV
CV
RESIDENTIAL
Demand Launches
RV
CV
Demand/Vacancy
Rental Value (RV) / Capital Values (CV) Increasing Moderate Increase Stable Moderate Fall Falling
Pulse
Monthly Real Estate Monitor
August 2015
Ahmedabad
Gujarat Industrial Policy 2015 for start-ups and innovation will be
modified with the crucial points that need to be included for better
implementation. Changes in policy will be made in two months.
Ahmedabad office market continued
showing traction during the month.
Select companies from BFSI sector
executed the transactions especially
in the CBD submarket. Overall
submarket level rents remained
stagnated.
Major transactions:
• IDFC on CG Road annex
Ahmedabad retail market witnessed
notable transaction activity in the
month. Select fashion brands & QSR
preferred spaces on high streets to
increases the footprints.
Affordable projects in and around the
city continued witnessing notable
demand especially in the nodes such
as Bopal, Chandkheda, Naroda, Gota &
New Ranip.
New Launches:
• Aashraya in New Ranip
Key Precincts
Rental Value
(INR per sq ft
per month)
Capital Value
(INR per sq ft)
Prahlad Nagar 35–50 6,000–7,500
S G Highway 35–50 6,000–7,500
Ashram Road 32–42 5,500–6,500
Navarangpura 32–44 5,500–6,500
Koba 22–35 4,000–5,000
Key Precincts
Rental Value
(INR per sq ft
per month)
Capital Value
(INR per sq ft)
CG Road 100–125 16,000–18,000
SG Highway 80–110 11,000–13,000
Ashram Road 110–130 14,000–16,000
Chandkheda 60–80 9,000–12,000
Koba 50–70 8,000–10,000
Key Precincts
Rental Value
(INR per month
for a 1,000 sq ft
2BHK
apartment)
Capital Value
(INR per sq ft)
Naroda 4,000–6,000 2,200–2,500
Gota 5,000–8,000 2,500–2,800
Navrangpura 15,000–20,000 6,000–7,000
SG Highway 10,000–15,000 5,500–7,500
Satellite 12,000–15,000 4,000–6,000
South Bopal 8,000–12,000 3,000–4,000
Back to top

OFFICE
Demand Vacancy
RV
CV
RETAIL
Demand Vacancy
RV
CV
RESIDENTIAL
Demand Launches
RV
CV
Demand/Vacancy
Rental Value (RV) / Capital Values (CV) Increasing Moderate Increase Stable Moderate Fall Falling
Pulse
Monthly Real Estate Monitor
August 2015
Bangalore
The Bangalore Metro Rail Corporation Limited (BMRCL) is to spend INR
1.15 million for the acquisition of about four acres of land . BMRCL
would be spending almost twice the compensation this time for acquisition
as this is the first acquisition of BMRCL after The Right to Fair
Compensation and Transparency in Land Acquisition, Rehabilitation and
Resettlement Act, 2013 came into force.
Leasing activity remained stable in
Bangalore.
Major transactions:
• Tata Sky at Hennur Road
• Manipal Educational Group at
Hosur Road
• Medtronics and SDL Software,
both at Off Airport Road
There were no major leases
concluded in July.
Proposed road network and metro
project drove the demand in suburbs
of Bangalore.
Key Launches:
• Shriram Luxor, Salarpuria Sattva
Northland, both at Hennur Road
• Sumadhura Pranavam at
Whitefield
• Salarpuria Sattva Divinity at
Mysore road
Key Precincts
Rental Value
(INR per sq ft
per month)
Capital Value
(INR per sq ft)
CBD 80–130 10,000–22,000
Old Airport Road 60–75 7,000–12,000
Outer Ring Road (Eastern) 48–60 5,500–7,500
Old Madras Road 45–65 5,000–7,000
Electronic City 27–32 2,800–3,500
Key Precincts
Rental Value
(INR per sq ft
per month)
Capital Value
(INR per sq ft)
Koramangala 90–160 9,000–18,000
Indiranagar 90–180 12,000–18,000
New BEL Road 60–80 6,000–12,000
Commercial Street 175–250 16,000–20,000
Jayanagar 100–170 8,000–18,000
Key Precincts
Rental Value
(INR per month
for a 1,000 sq ft
2BHK
apartment)
Capital Value
(INR per sq ft)
Old Madras Road 15,000–25,000 5,000–8,000
Indiranagar 25,000–35,000 10,000–25,000
Bellary Road 12,000–18,000 4,500–11,000
Hosur Road 10,000–14,000 4,000–6,000
Whitefield 18,000–25,000 5,000–9,000
Tumkur Road 8,000–12,000 3,600–5,000
Kanakapura Road 10,000–17,000 4,200–6,500
Mysore Road 8,000–10,000 3,500–5,000
Back to top
OFFICE
Demand Vacancy
RV
CV
RETAIL
Demand Vacancy
RV
CV
RESIDENTIAL
Demand Launches
RV
CV
Demand/Vacancy
Rental Value (RV) / Capital Values (CV) Increasing Moderate Increase Stable Moderate Fall Falling
Pulse
Monthly Real Estate Monitor
August 2015
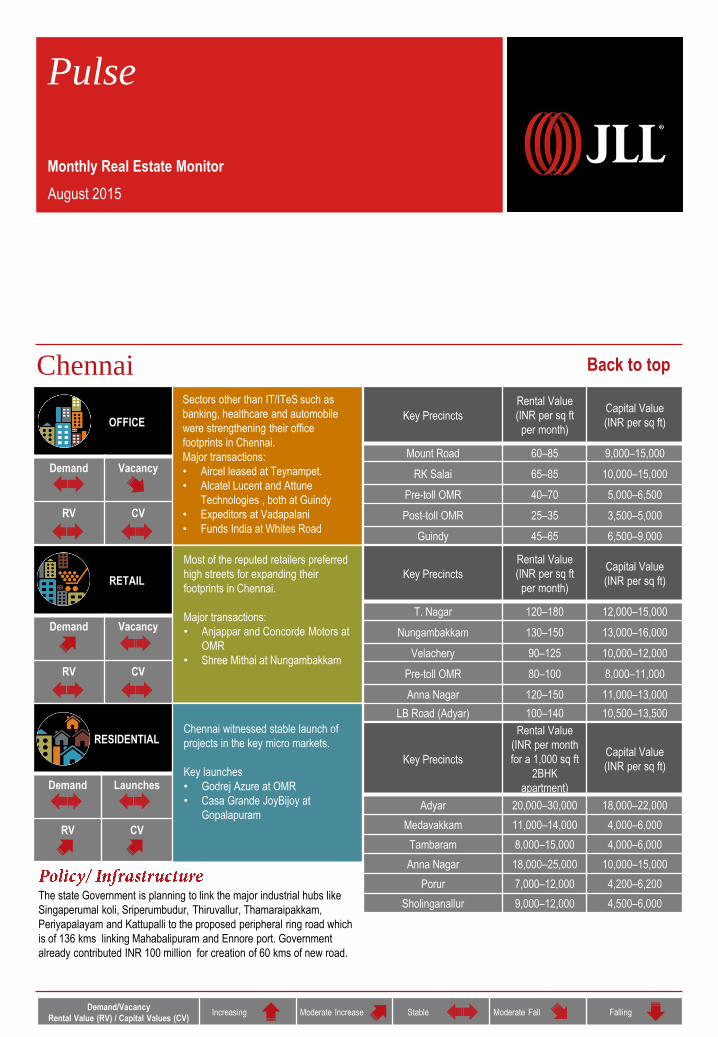
Chennai
The state Government is planning to link the major industrial hubs like
Singaperumal koli, Sriperumbudur, Thiruvallur, Thamaraipakkam,
Periyapalayam and Kattupalli to the proposed peripheral ring road which
is of 136 kms linking Mahabalipuram and Ennore port. Government
already contributed INR 100 million for creation of 60 kms of new road.
Sectors other than IT/ITeS such as
banking, healthcare and automobile
were strengthening their office
footprints in Chennai.
Major transactions:
• Aircel leased at Teynampet.
• Alcatel Lucent and Attune
Technologies , both at Guindy
• Expeditors at Vadapalani
• Funds India at Whites Road
Most of the reputed retailers preferred
high streets for expanding their
footprints in Chennai.
Major transactions:
• Anjappar and Concorde Motors at
OMR
• Shree Mithai at Nungambakkam
Chennai witnessed stable launch of
projects in the key micro markets.
Key launches
• Godrej Azure at OMR
• Casa Grande JoyBijoy at
Gopalapuram
Key Precincts
Rental Value
(INR per sq ft
per month)
Capital Value
(INR per sq ft)
Mount Road 60–85 9,000–15,000
RK Salai 65–85 10,000–15,000
Pre-toll OMR 40–70 5,000–6,500
Post-toll OMR 25–35 3,500–5,000
Guindy 45–65 6,500–9,000
Key Precincts
Rental Value
(INR per sq ft
per month)
Capital Value
(INR per sq ft)
T. Nagar 120–180 12,000–15,000
Nungambakkam 130–150 13,000–16,000
Velachery 90–125 10,000–12,000
Pre-toll OMR 80–100 8,000–11,000
Anna Nagar 120–150 11,000–13,000
LB Road (Adyar) 100–140 10,500–13,500
Key Precincts
Rental Value
(INR per month
for a 1,000 sq ft
2BHK
apartment)
Capital Value
(INR per sq ft)
Adyar 20,000–30,000 18,000–22,000
Medavakkam 11,000–14,000 4,000–6,000
Tambaram 8,000–15,000 4,000–6,000
Anna Nagar 18,000–25,000 10,000–15,000
Porur 7,000–12,000 4,200–6,200
Sholinganallur 9,000–12,000 4,500–6,000
Back to top

OFFICE
Demand Vacancy
RV
CV
RETAIL
Demand Vacancy
RV
CV
RESIDENTIAL
Demand Launches
RV
CV
Demand/Vacancy
Rental Value (RV) / Capital Values (CV) Increasing Moderate Increase Stable Moderate Fall Falling
Pulse
Monthly Real Estate Monitor
August 2015
Delhi NCR
• Plan for a six-lane elevated flyover between Noida and Greater
Noida via the DSC Road, connecting Sec-41 in Noida to NSEZ.
Tender to be floated next month
• Greater Noida Authority to start process for selection of development
agency for construction of heliport near the Yamuna Expressway
entry
• 43 km FNG Expressway to be designated as National Highway
Demand continued to remain healthy
and occupiers look keen to close out
their requirements. With space in
superior completed projects reducing,
occupiers were also looking at select
Grade B developments.
Major transactions:
• Cvent, Mercer, Mobikwik and
NCR Corporation, all leased in
Gurgaon
Demand remained weak as vacancy
was low in high-performing malls;
while pre-commitments was seen in
under-construction malls.
Major transactions:
• Pre-commitments by I.am.in,
Scullers and Urban Yoga, all in
Noida
Sales continued to remain tepid as no
visible price corrections were observed
and buyers remain fence-sitters before
making their buying decisions. Price
discounts and various pricing
techniques were being offered by
developers to push project sales.
New Launches:
• Vatika Expressions, M3M Sierra,
both in Gurgaon
Key Precincts
Rental Value
(INR per sq ft
per month)
Capital Value
(INR per sq ft)
Barakhamba Road 170–400 28,000–35,000
Jasola 110–170 17,000–21,000
DLF Cybercity 95–100 NA
MG Road 115–140 17,000–19,000
Golf Course Road 90–110 12,500–15,000
Key Precincts
Rental Value
(INR per sq ft
per month)
Capital Value
(INR per sq ft)
South Delhi 180–330 24,000–32,000
West and North Delhi 140–230 15,000–23,000
Gurgaon–MG Road 140–270 17,500–23,000
Rest of Gurgaon 60–100 8,000–14,000
Noida 130–220 14,000–25,000
Ghaziabad 90–150 10,500–16,000
Key Precincts
Rental Value
(INR per month
for a 1,000 sq ft
2BHK
apartment)
Capital Value
(INR per sq ft)
Golf Course Road 27,000–32,000 13,000–19,000
Sohna Road 17,000–20,000 5,800–7,500
Golf Course Extension Road 19,000–22,000 8,500–11,000
Dwarka Expressway NA 5,500–7,500
Noida–Greater Noida
Expressway 13,000–15,000 4,300–6,500
Noida City 12,000–14,500 4,700–6,000
Indirapuram 11,000–12,000 4,500–5,300
Back to top

OFFICE
Demand Vacancy
RV
CV
RETAIL
Demand Vacancy
RV
CV
RESIDENTIAL
Demand Launches
RV
CV
Demand/Vacancy
Rental Value (RV) / Capital Values (CV) Increasing Moderate Increase Stable Moderate Fall Falling
Pulse
Monthly Real Estate Monitor
August 2015
Hyderabad
• Telangana government has approved 20 flyover projects worth INR
26 billion for Hyderabad.
• A multi- modal transit hub to be developed at Old Gandhi Hospital
integrating MMTS, Metro and Secunderabad Main Railway station.
The city’s most active market was
Hitec city. Sentiments improved with
the Government aggressively working
on policies to draw investments.
Major transactions:
• Dronto Dyte leasing at Madhapur
• Reliance Jio purchasing space at
Hitec City
Both the core and suburban locations
of Hyderabad’s high streets showed
improved retail activity in July.
Major transactions:
• Chilli's, Woodland, Lawrence and
Mayo and W in the high streets of
CBD
• Mom and Me, Airtel and
McDonald's at the high streets of
Suburban locations
Launches were slow with only the
Western sub- market showing some
activity. However, improved
sentiments would likely to encourage
launches soon.
New Launches:
• Aditya Capitol Heights at
Gopalnagar
Key Precincts
Rental Value
(INR per sq ft
per month)
Capital Value
(INR per sq ft)
Begumpet 45–55 4,700–6,200
Banjara Hills 50–62 5,000–8,500
Hitec City 40–50 4,500–6,500
Gachibowli 38–48 4,500–5,700
Uppal 25–35 3,500–4,500
Key Precincts
Rental Value
(INR per sq ft
per month)
Capital Value
(INR per sq ft)
Banjara Hills 110–155 11,000–15,500
Jubilee Hills 120–150 12,000–15,000
Secunderabad 100–115 10,000–11,500
Hitec City 110–130 11,000–13,000
Kukatpally 110–120 10,000–12,000
Key Precincts
Rental Value
(INR per month
for a 1,000 sq ft
2BHK
apartment)
Capital Value
(INR per sq ft)
Banjara Hills 19,000–27,000 8,000–14,500
Begumpet 13,500–20,000 4,500–6,000
Kondapur 11,000–17,000 3,700–5,200
Gachibowli 11,000–16,500 3,500–4,700
Tellapur 8,000–14,000 3,000–4,100
Kukatpally 9,000–15,500 3,800–4,500
Back to top

OFFICE
Demand Vacancy
RV
CV
RETAIL
Demand Vacancy
RV
CV
RESIDENTIAL
Demand Launches
RV
CV
Demand/Vacancy
Rental Value (RV) / Capital Values (CV) Increasing Moderate Increase Stable Moderate Fall Falling
Pulse
Monthly Real Estate Monitor
August 2015
Kolkata
Electric-run buses would soon hit the roads of New Town—Rajarhat and
nearby important junctions, connecting the township to the city. The
HIDCO and Coal India Limited signed an MoU to operate the electric bus
services in the township. Coal India will bear the capital cost as part of its
corporate social responsibility and HIDCO will execute the plan and bear
the cost of operating and maintaining the buses.
Overall demand of the city witnessed
positive response with increased
occupier enquiries in all submarkets
other than SBD.
Occupiers were seen taking time
before finalising the transactions.
Transaction activity picked up during
July. Acropolis Mall at Kasba would
commence operation in the coming
1—2 months. High street locations in
Suburbs sub-market witnessed good
traction.
Major transactions:
• Skechers at a mall in Suburbs
• Spencer’s at a high street in
Suburbs
Residential demand in the city was
stable barring high-end categories
where the demand was at the verge of
improvement from the slow sales of the
past. New launches in low and mid
segment increased over the month.
New Launches:
• Amaya Residences at Narendrapur
• Highland Greens Phase III at
Batanagar
Key Precincts
Rental Value
(INR per sq ft
per month)
Capital Value
(INR per sq ft)
Park Street 110–135 13,000–20,000
Topsia 70–90 7,500–10,000
Kasba 75–90 8,000–11,000
Salt Lake Sector V 40–45 4,000–4,800
New Town and Rajarhat 32–36 3,200–4,100
Key Precincts
Rental Value
(INR per sq ft
per month)
Capital Value
(INR per sq ft)
Elgin Road 300–350 24,000–28,000
Park Street (high street) 325–375 25,000–31,000
Prince Anwar Shah Road 150–200 15,000–18,000
Salt Lake 185–225 15,000–20,000
New Town and Rajarhat 60–80 6,500–8,000
Gariahat (high street) 200–250 16,000–22,000
Key Precincts
Rental Value
(INR per month
for a 1,000 sq ft
2BHK
apartment)
Capital Value
(INR per sq ft)
Alipore 50,000–70,000 15,000–22,000
Prince Anwar Shah Road 20,000–35,000 7,000–14,000
EM Bypass (Topsia) 15,000–25,000 6,000–10,000
Lake Town 10,000–16,000 4,000–7,500
New Town (AA- I, II & III) 9,000–15,000 3,500–6,000
Rajarhat 7,000–14,000 3,000–4,500
Behala 7,000–14,000 3,000–5,500
Back to top

OFFICE
Demand Vacancy
RV
CV
RETAIL
Demand Vacancy
RV
CV
RESIDENTIAL
Demand Launches
RV
CV
Demand/Vacancy
Rental Value (RV) / Capital Values (CV) Increasing Moderate Increase Stable Moderate Fall Falling
Pulse
Monthly Real Estate Monitor
August 2015
Mumbai
The Mumbai Metropolitan Region Development Authority (MMRDA) has
initiated the process to appoint a master system integrator (MSI) to
design and implement the Smart BKC project by 2017.
The month of July was characterised
by robust transaction activities. Select
occupiers were seen buying large size
offices in SBD Central & some
executed the leases at Western
Suburbs.
Major transactions:
• Thomas Cook buying space in
SBD Central
• Liebherr India leasing in Suburbs
Leasing activity in the F&B and
lifestyle categories had been higher
during the month. Prime South and
Suburbs submarkets appeared to be
gaining momentum.
Major transactions:
• La Folie and Satya Paul, both in
Prime South
• Wok in the Box in Suburbs
Mumbai residential sector witnessed
slight fall in both overall demand and
new launches in July. The prime
reason for fall in new launches was
the confusion over Mumbai's new
development plan which pushed
developers to hold their projects.
New Launches:
• Marathon NexZone Atria at Panvel
• Krishna Heritage at Chembur
Key Precincts
Rental Value
(INR per sq ft
per month)
Capital Value
(INR per sq ft)
Lower Parel 160–200 17,000–22,000
BKC 240–330 26,500–34,000
Andheri - Kurla Road 100–145 10,000–15,000
Goregaon-Malad 85–125 9,000–12,500
Wagle Estate 50–65 5,200–6,900
Key Precincts
Rental Value
(INR per sq ft
per month)
Capital Value
(INR per sq ft)
Lower Parel 260–390 22,000–32,300
Malad 160–250 12,500–20,000
Ghatkopar 130–220 10,100–18,300
Mulund 125–200 9,500–15,500
Thane 100–185 8,000–14,500
Navi Mumbai 75–150 7,000–12,000
Key Precincts
Rental Value
(INR per month
for a 1,000 sq ft
2BHK
apartment)
Capital Value
(INR per sq ft)
Lower Parel 60,000–1,10,000 25,000–40,000
Wadala 36,000–60,000 15,000–23,000
Andheri 32,000–55,000 12,500–21,500
Ghatkopar 30,000–46,000 11,500–17,000
Ghodbunder Road 12,000–25,000 6.000–9,500
Kharghar 10,000–18,000 6,000–9,000
Back to top

OFFICE
Demand Vacancy
RV
CV
RETAIL
Demand Vacancy
RV
CV
RESIDENTIAL
Demand Launches
RV
CV
Demand/Vacancy
Rental Value (RV) / Capital Values (CV) Increasing Moderate Increase Stable Moderate Fall Falling
Pulse
Monthly Real Estate Monitor
August 2015
Pune
To speed up infrastructure projects in the city, the Pune Municipal
Corporation has formed a coordination committee having representatives
of various government organisations to resolve issues in the project that
have involvement of more than two government organisations.
Demand remained upbeat in the city
predominantly in SBD region.
Constant leasing activity and limited
ready supply have continually lowered
the vacancy rate in the city.
Major transactions:
• UBS and MasterCard, both leased
in SBD
Pune saw subdued absorption of mall
space leasing during the month.
Transactions were restricted to leases
in few malls in addition to small leases
on high streets retail areas.
Major transactions:
• Lee Cooper secured space in
Suburbs Submarket
Pune Residential sector witnessed
moderate fall in the demand numbers
during the month. Projects such as
Purvankara Silversand and Kalapataru
Crescendo were at pre-launch stage
and would come on stream in the next
few months.
Key Precincts
Rental Value
(INR per sq ft
per month)
Capital Value
(INR per sq ft)
Hadapsar 45–65 5,500–8,000
Kharadi 50–70 5,500–7,500
Hinjewadi 35–45 4,000–6,000
Viman Nagar 55–65 6,500–7,500
SB Road 60–80 7,000–12,000
Key Precincts
Rental Value
(INR per sq ft
per month)
Capital Value
(INR per sq ft)
MG Road 100–160 15,000–21,000
Bund Garden Road 90–130 13,000–17,000
FC Road 100–150 15,000–20,000
JM Road 100–150 15,000–20,000
DP Road 90–130 12,000–16,000
SB Road 80–140 13,000-16,000
Key Precincts
Rental Value
(INR per month
for a 1,000 sq ft
2BHK
apartment)
Capital Value
(INR per sq ft)
Wakad 10,000–13,000 5,000–6,500
Hinjewadi 9,000–11,000 4,800–6,500
Kharadi 11,000–15,000 5,000–7,200
Hadapsar 13,000–18,000 5,500–7,500
Undri 8,000–12,000 4,000–5,500
Pimri-Chinchwad 8,000–15,000 4,500–6,000
Back to top

For more information about our research, contact
Ashutosh Limaye
National Director, Research and REIS
+91 98211 07054 [email protected]
Sujash Bera
Manager, Research
+91 98305 43922 [email protected]
Research Dynamics 2015
Pulse reports from JLL are frequent updates on real estate market dynamics.
Jones Lang LaSalle (NYSE:JLL) is a professional services and investment management firm offering specialized real estate services to clients
seeking increased value by owning, occupying and investing in real estate. With annual revenue of $4 billion, JLL operates in 70 countries from
more than 1,000 locations worldwide. On behalf of its clients, the firm provides management and real estate outsourcing services to a property
portfolio of 3.0 billion square feet. Its investment management business, LaSalle Investment Management, has $47.6 billion of real estate
assets under management.
JLL has over 50 years of experience in Asia Pacific, with over 27,500 employees operating in 80 offices in 15 countries across the region. The
firm was named ‘Best Property Consultancy’ in three Asia Pacific countries at the International Property Awards Asia Pacific 2013, and won
nine Asia Pacific Awards in the Euromoney Real Estate Awards 2013.
For further information, please visit our website, www.jll.com
JLL is India’s premier and largest professional services firm specializing in real estate. With an extensive geographic footprint across 11 cities
(Ahmedabad, Delhi, Mumbai, Bangalore, Pune, Chennai, Hyderabad, Kolkata, Kochi, Chandigarh and Coimbatore) and a staff strength of over
6800, the firm provides investors, developers, local corporates and multinational companies with a comprehensive range of services including
research, analytics, consultancy, transactions, project and development services, integrated facility management, property and asset
management, sustainability, industrial, capital markets, residential, hotels, health care, senior living, education and retail advisory.
The firm was named the Best Property Consultancy in India (5 Star Winner) at the International Property Awards – Asia Pacific for 2012-13.
For further information, please visit www.joneslanglasalle.co.in