Market Design 3 - Carnegie Mellon University...9 | brattle.com Market Design 3.0 Aligning Policy and...
35
Copyright © 2017 The Brattle Group, Inc. Market Design 3.0 Roger Lueken Kathleen Spees David Luke Oates October 3, 2018 PREPARED BY A Vision for the Clean Electricity Grid of the Future October 2018 CEIC Seminar PRESENTED TO
Transcript of Market Design 3 - Carnegie Mellon University...9 | brattle.com Market Design 3.0 Aligning Policy and...

Copyright © 2017 The Brattle Group, Inc.
Market Design 3.0
Roger Lueken Kathleen Spees David Luke Oates
O c t ober 3 , 2 0 1 8
P RE PARED BY
A Vision for the Clean Electricity Grid of the Future
October 2018 CEIC Seminar P RE S EN TED T O
| brattle.com 1
Agenda Introduction to Wholesale Electricity Markets
State Decarbonization Initiatives
Market Design 3.0
New York ISO Carbon Pricing Initiative
ISO New England Integrating Markets and Public Policy (IMAPP) Proposed Clean Energy Market

| brattle.com 2
Intro to Wholesale Markets A Brief History of Wholesale Markets Traditional utility model
▀ Vertical integration of generation, transmission, and distribution ▀ Operate as a monopoly
Restructuring of late 1990s ▀ Recognition that “generation” is not a natural monopoly and competition
may benefit customers
Wholesale market structure today ▀ Competitive generation ▀ Regional Transmission Operator (RTO) or Independent System Operator
(ISO) schedule all power flow on their transmission network ▀ Network operation and electricity prices based on economic principles, i.e.,
prices reflect marginal cost of serving load
| brattle.com 3
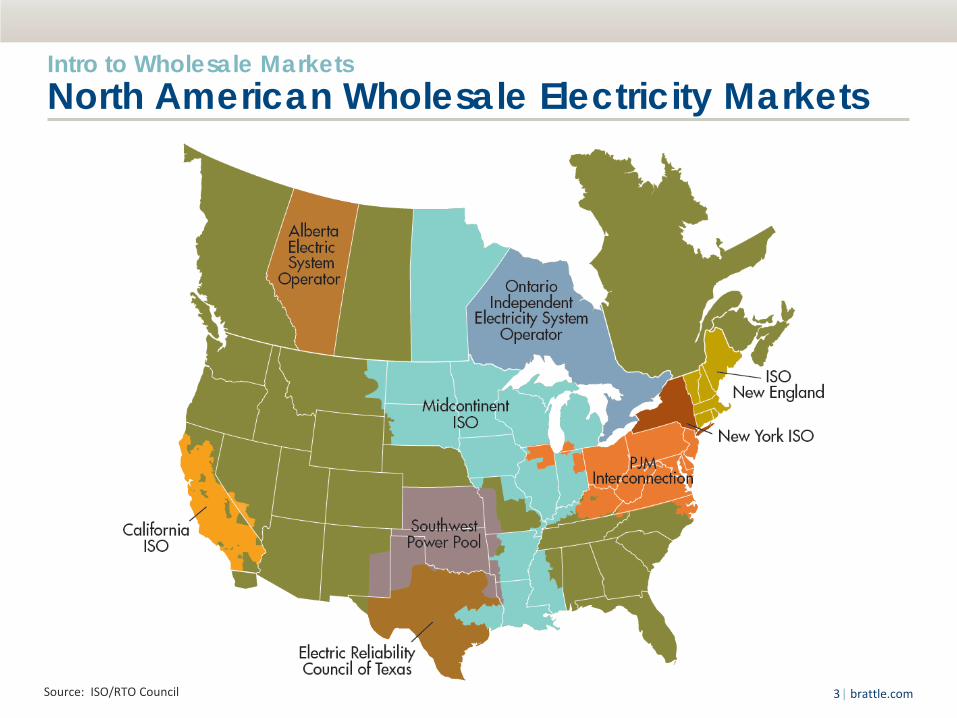
Intro to Wholesale Markets North American Wholesale Electricity Markets
Source: ISO/RTO Council

| brattle.com 4
Intro to Wholesale Markets “Standard” Market Design Energy Market: Resources submit $/MWh offers based on variable costs. Lowest-cost mix of resources clear Ancillary Service Markets: Additional products needed to reliably balance the electric system Capacity Markets: Additional payment needed to attract sufficient supply to meet resource adequacy standards
The objective of Standard Market Design is to maintain system reliability at least cost. Environmental objectives are not considered.
| brattle.com 5
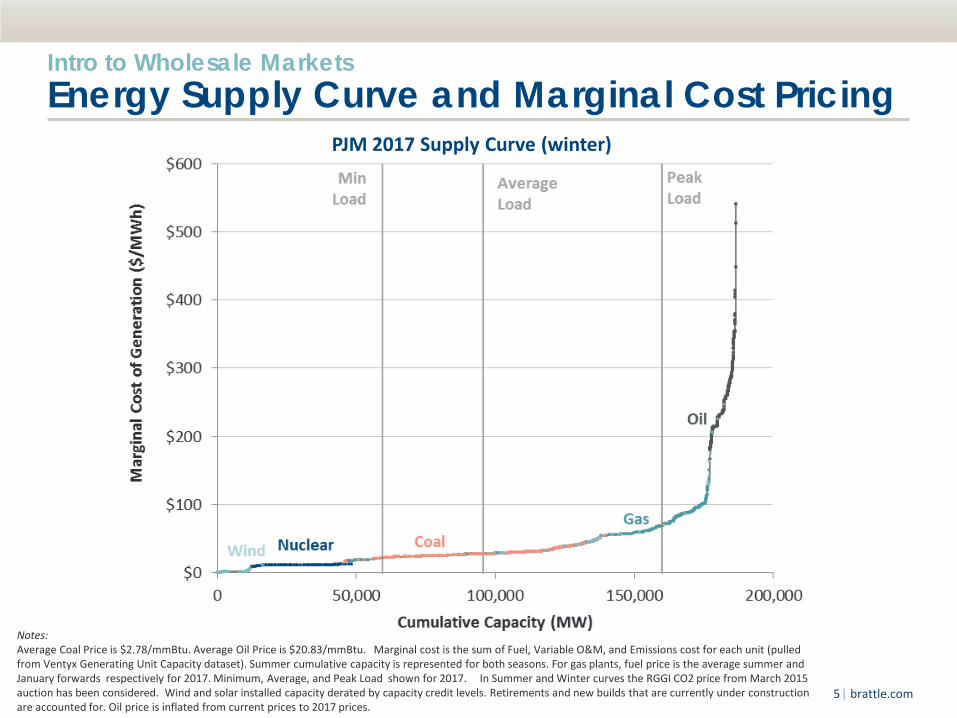
Notes: Average Coal Price is $2.78/mmBtu. Average Oil Price is $20.83/mmBtu. Marginal cost is the sum of Fuel, Variable O&M, and Emissions cost for each unit (pulled from Ventyx Generating Unit Capacity dataset). Summer cumulative capacity is represented for both seasons. For gas plants, fuel price is the average summer and January forwards respectively for 2017. Minimum, Average, and Peak Load shown for 2017. In Summer and Winter curves the RGGI CO2 price from March 2015 auction has been considered. Wind and solar installed capacity derated by capacity credit levels. Retirements and new builds that are currently under construction are accounted for. Oil price is inflated from current prices to 2017 prices.
PJM 2017 Supply Curve (winter)
Intro to Wholesale Markets Energy Supply Curve and Marginal Cost Pricing
| brattle.com 6
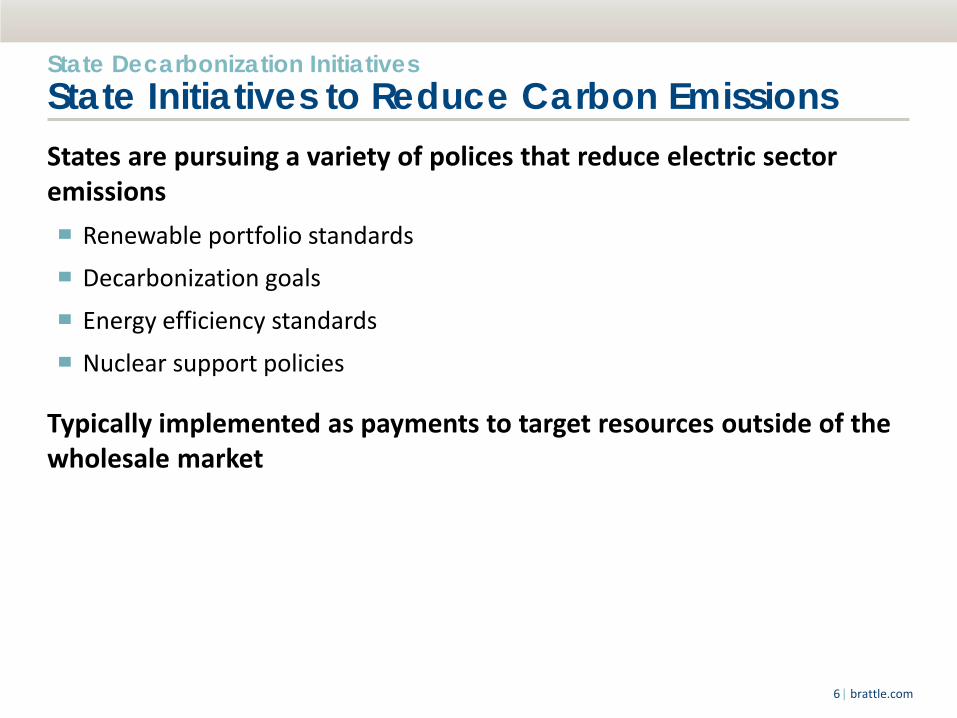
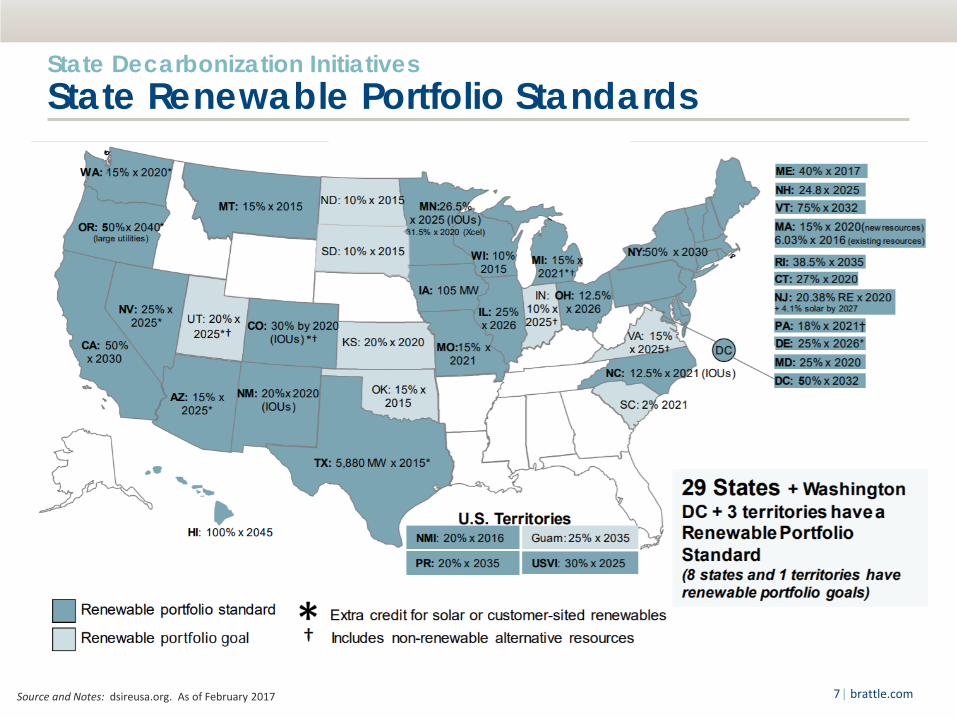
State Decarbonization Initiatives State Initiatives to Reduce Carbon Emissions States are pursuing a variety of polices that reduce electric sector emissions ▀ Renewable portfolio standards
▀ Decarbonization goals
▀ Energy efficiency standards
▀ Nuclear support policies
Typically implemented as payments to target resources outside of the wholesale market
| brattle.com 7
State Decarbonization Initiatives State Renewable Portfolio Standards
Source and Notes: dsireusa.org. As of February 2017

| brattle.com 8
State Decarbonization Initiatives States and Cities with Decarbonization Goals
Source: https://news.nationalgeographic.com/2017/06/states-cities-usa-climate-policy-environment/
Member of U.S. Climate Alliance Pledged to Follow Paris Agreement Signed Mayors National Climate Action Agenda
Presenter
Presentation Notes
Alliance to convene U.S. states committed to achieving the U.S. goal of reducing emissions 26-28 percent from 2005 levels and meeting or exceeding the targets of the federal Clean Power Plan.
| brattle.com 9
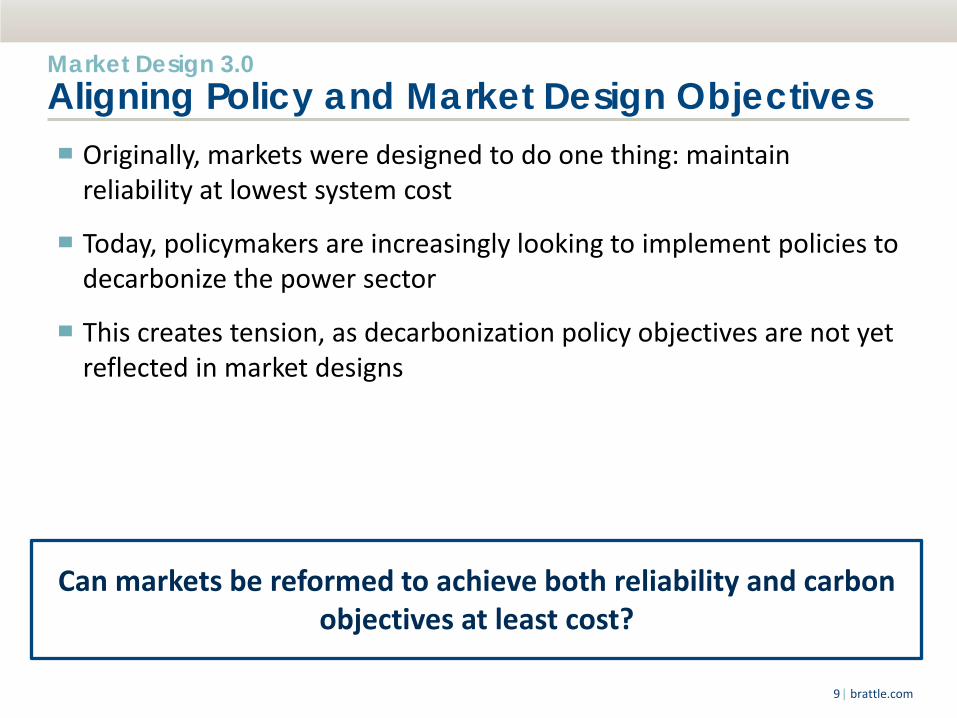
Market Design 3.0 Aligning Policy and Market Design Objectives ▀ Originally, markets were designed to do one thing: maintain
reliability at lowest system cost
▀ Today, policymakers are increasingly looking to implement policies to decarbonize the power sector
▀ This creates tension, as decarbonization policy objectives are not yet reflected in market designs
Can markets be reformed to achieve both reliability and carbon objectives at least cost?
| brattle.com 10
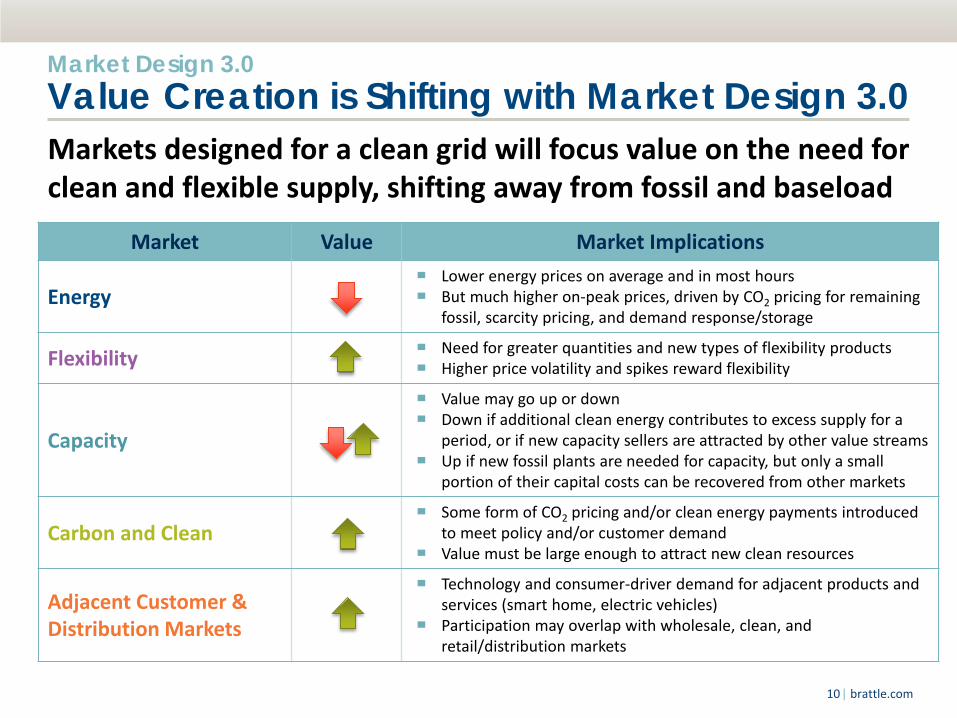
Market Design 3.0 Value Creation is Shifting with Market Design 3.0
Market Value Market Implications
Energy ▀ Lower energy prices on average and in most hours ▀ But much higher on-peak prices, driven by CO2 pricing for remaining
fossil, scarcity pricing, and demand response/storage
Flexibility ▀ Need for greater quantities and new types of flexibility products ▀ Higher price volatility and spikes reward flexibility
Capacity
▀ Value may go up or down ▀ Down if additional clean energy contributes to excess supply for a
period, or if new capacity sellers are attracted by other value streams ▀ Up if new fossil plants are needed for capacity, but only a small
portion of their capital costs can be recovered from other markets
Carbon and Clean ▀ Some form of CO2 pricing and/or clean energy payments introduced
to meet policy and/or customer demand ▀ Value must be large enough to attract new clean resources
Adjacent Customer & Distribution Markets
▀ Technology and consumer-driver demand for adjacent products and services (smart home, electric vehicles)
▀ Participation may overlap with wholesale, clean, and retail/distribution markets
Markets designed for a clean grid will focus value on the need for clean and flexible supply, shifting away from fossil and baseload
| brattle.com 11
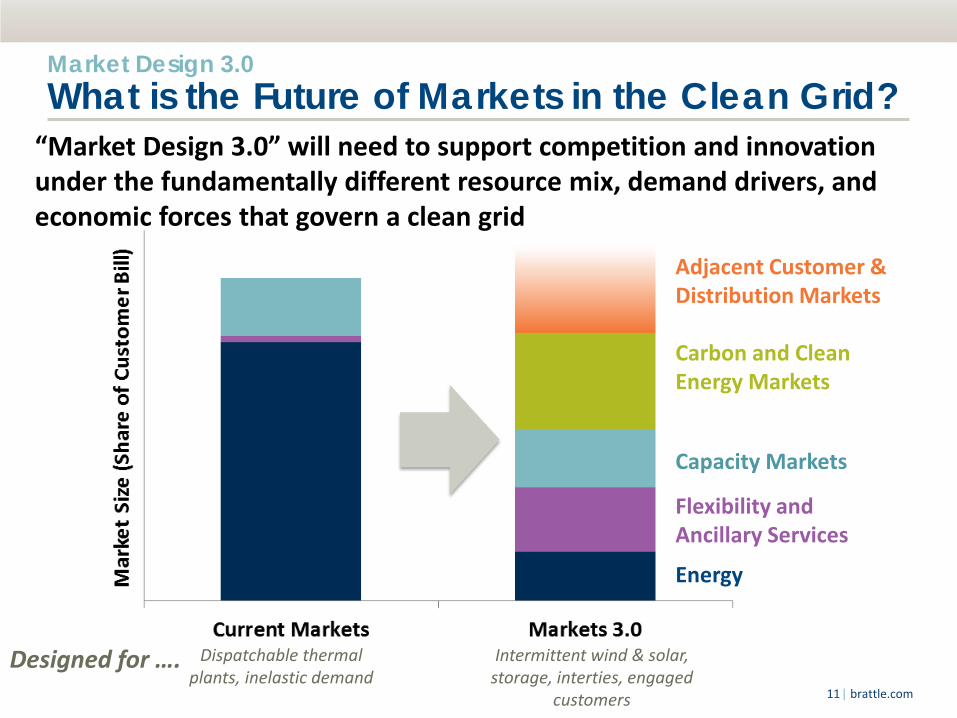
Market Design 3.0 What is the Future of Markets in the Clean Grid?
“Market Design 3.0” will need to support competition and innovation under the fundamentally different resource mix, demand drivers, and economic forces that govern a clean grid
Adjacent Customer & Distribution Markets Carbon and Clean Energy Markets
Capacity Markets
Flexibility and Ancillary Services
Energy
Designed for …. Dispatchable thermal plants, inelastic demand
Intermittent wind & solar, storage, interties, engaged
customers

| brattle.com 12
Market Design 3.0 Energy Market “Bottoms Out” with a Clean Fleet Ontario experience shows very low/negative prices with a 90% clean fleet & highlights the need for focused incentives for delivery when and where needed (currently missing from prices)
Energy prices have fallen 79% with low gas prices and decarbonisation
| brattle.com 13
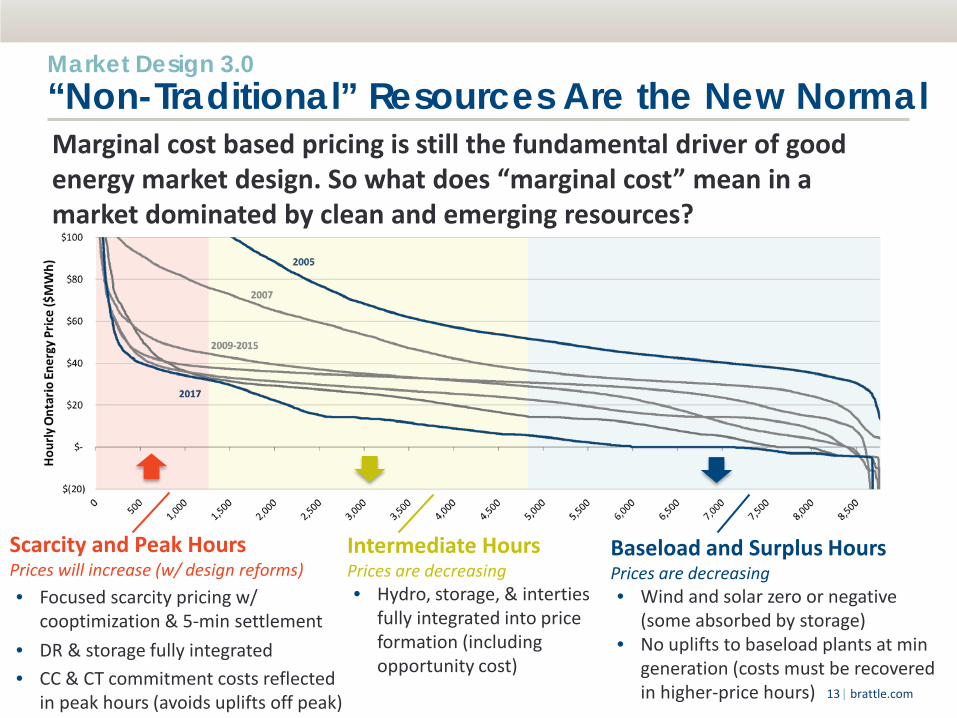
Market Design 3.0 “Non-Traditional” Resources Are the New Normal
Scarcity and Peak Hours Prices will increase (w/ design reforms) • Focused scarcity pricing w/
cooptimization & 5-min settlement • DR & storage fully integrated • CC & CT commitment costs reflected
in peak hours (avoids uplifts off peak)
Intermediate Hours Prices are decreasing • Hydro, storage, & interties
fully integrated into price formation (including opportunity cost)
Baseload and Surplus Hours Prices are decreasing • Wind and solar zero or negative
(some absorbed by storage) • No uplifts to baseload plants at min
generation (costs must be recovered in higher-price hours)
Marginal cost based pricing is still the fundamental driver of good energy market design. So what does “marginal cost” mean in a market dominated by clean and emerging resources?
| brattle.com 14
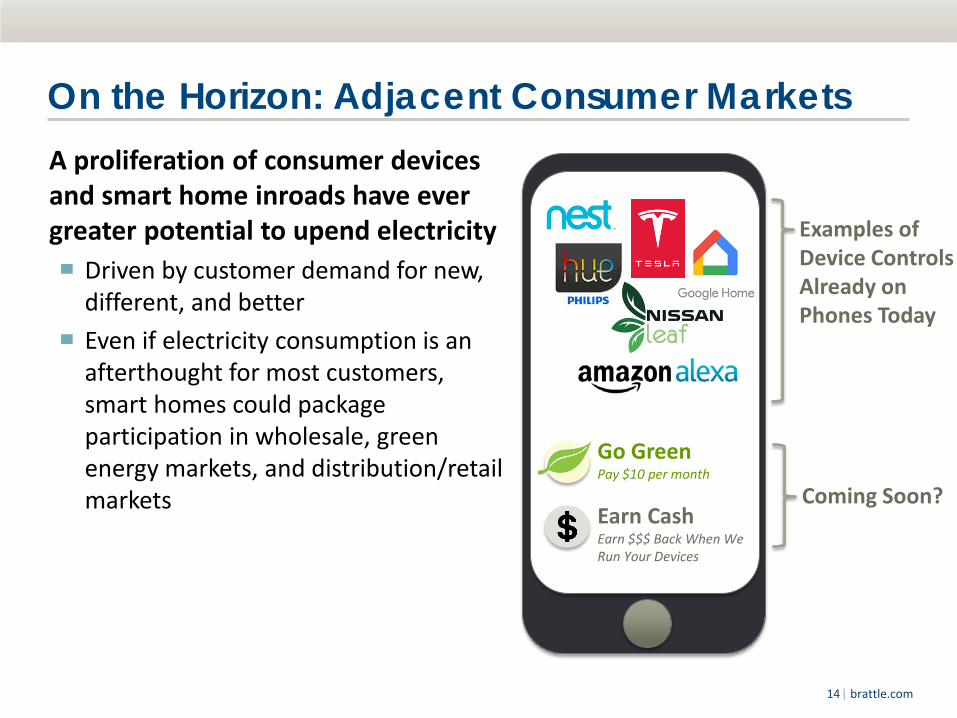
On the Horizon: Adjacent Consumer Markets A proliferation of consumer devices and smart home inroads have ever greater potential to upend electricity ▀ Driven by customer demand for new,
different, and better ▀ Even if electricity consumption is an
afterthought for most customers, smart homes could package participation in wholesale, green energy markets, and distribution/retail markets
Examples of Device Controls Already on Phones Today
Coming Soon?
Go Green Pay $10 per month
Earn Cash Earn $$$ Back When We Run Your Devices

| brattle.com 15
Market Design 3.0 Carbon and Clean Attribute Markets
Resource-neutral carbon and clean attribute markets are badly needed to resolve conflicts with wholesale markets and guide efficient investments to meet policy and customer demand for clean
Carbon Pricing Clean Energy Markets Already Working • Integration to achieve energy
market redispatch • Influences investment mix
• Attracting investment (under contracts)
• Attribute tracking
Needs Reform • Border pricing and leakage • Multiple CO2 prices in one
RTO system • Quantity-correction
mechanisms to address excess allowance bank and low prices
• Regulatory uncertainties that drive investment risk
• Resource neutrality • Negative energy offers (caused
by attribute product definition) • Product definition aligned with
CO2 abatement • Centralized procurement of
standard products • In-market treatment in capacity
market prices

| brattle.com 16
New York ISO Carbon Pricing Initiative

| brattle.com 17
NYISO Carbon Pricing New York has Goals, Mandates, and Mechanisms to Substantially Reduce CO2 Emissions State Energy Plan
▀ Reduce economy-wide greenhouse gas emissions 40% by 2030 and 80% by 2050, relative to 1990 levels
▀ 50% of electricity from renewables by 2030
Clean Energy Standard ▀ Renewable Energy Credits (RECs) ▀ Zero-Emission Credits (ZECs)
Numerous other policies ▀ Participation in the Regional Greenhouse Gas Initiative (RGGI) ▀ Reforming the Energy Vision ▀ Energy efficiency standards ▀ Governor’s proposal to eliminate coal-fired generation by 2020
Source: For more details, see https://www.nyiso.com/public/committees/calendar/index.jsp
| brattle.com 18
NYISO Carbon Pricing Process to Evaluate Feasibility of Carbon Pricing NYISO and NY State staff convened a stakeholder process to evaluate ways to incorporate the cost of carbon emissions into wholesale energy markets Straw Proposal
▀ NYISO wholesale markets incorporate a cost of carbon emissions ▀ Suppliers pay additional $/MWh charge reflecting the carbon embedded in
their energy ▀ Carbon charge would be set by the State; reflect social cost of carbon
(~$49/ton in 2025, net of RGGI) ▀ NYISO would charge importers and credit exporters to avoid leakage ▀ NYISO would return carbon charge residuals to customers

| brattle.com 19
NYISO Carbon Pricing Underlying Questions What are the incremental carbon reductions possible with a carbon charge?
How much of the economic gains are enjoyed by consumers vs. clean energy producers? Do customer costs rise?
How can implementation challenges be overcome?
| brattle.com 20
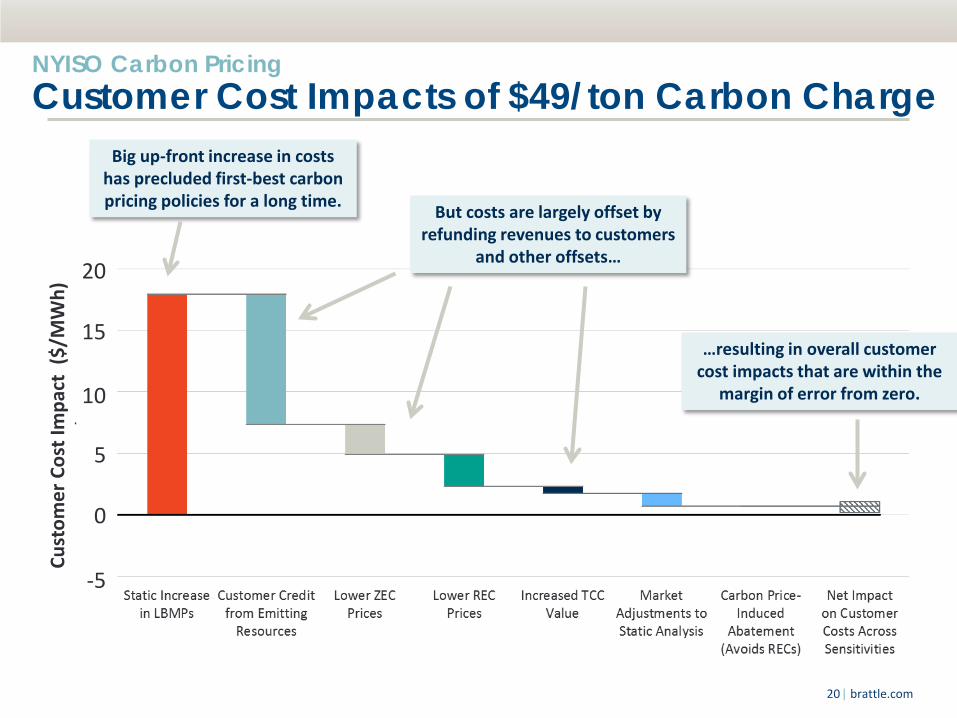
NYISO Carbon Pricing Customer Cost Impacts of $49/ton Carbon Charge
Cust
omer
Cos
t Im
pact
($/
MW
h)
Big up-front increase in costs has precluded first-best carbon pricing policies for a long time. But costs are largely offset by
refunding revenues to customers and other offsets…
…resulting in overall customer cost impacts that are within the
margin of error from zero.
-5
0
5
10
15
20

| brattle.com 21
NYISO Carbon Pricing Effect on Customer Costs As compared to existing policies alone
– LBMP effect partly offset by refund, lower REC prices, and energy efficiency
– But no ZEC savings and modest REC savings
– Limited dynamic response
– High volume RECs at lower prices
– No ZECs, but could retain Upstate nuclear
– More renewables shift Downstate
– Sizable ZEC, REC savings – Some new renewables
shift Downstate
+2.2% (+0.38¢/kWh)
+0.4% (+0.08¢/kWh)
-0.1% (-0.03¢/kWh)
Baseline New York Retail Rates from EIA’S AEO 2018
$42/ton $49/ton $45/ton Carbon Charge:
2020 2025 2030
| brattle.com 22
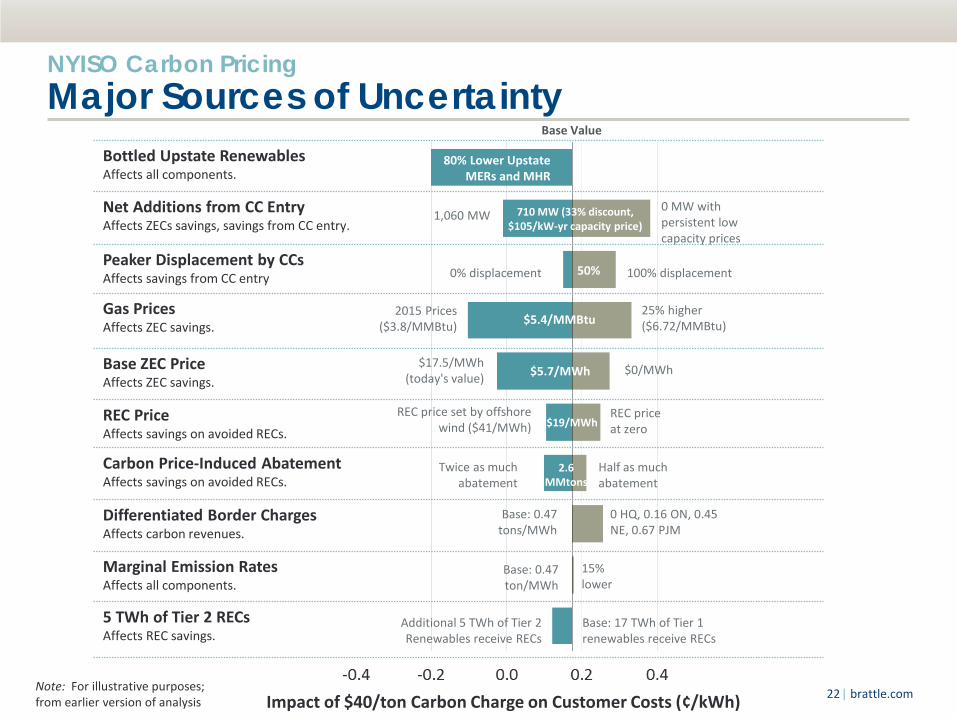
NYISO Carbon Pricing Major Sources of Uncertainty
Impact of $40/ton Carbon Charge on Customer Costs (¢/kWh)
Bottled Upstate Renewables Affects all components.
Net Additions from CC Entry Affects ZECs savings, savings from CC entry.
Peaker Displacement by CCs Affects savings from CC entry
Gas Prices Affects ZEC savings.
Base ZEC Price Affects ZEC savings.
REC Price Affects savings on avoided RECs.
Carbon Price-Induced Abatement Affects savings on avoided RECs.
Differentiated Border Charges Affects carbon revenues.
Marginal Emission Rates Affects all components.
5 TWh of Tier 2 RECs Affects REC savings.
2015 Prices ($3.8/MMBtu)
25% higher ($6.72/MMBtu)
$17.5/MWh (today's value)
$0/MWh
1,060 MW 0 MW with persistent low capacity prices
Twice as much abatement
Half as much abatement
REC price set by offshore wind ($41/MWh)
REC price at zero
0 HQ, 0.16 ON, 0.45 NE, 0.67 PJM
710 MW (33% discount, $105/kW-yr capacity price)
$5.4/MMBtu
Base: 0.47 tons/MWh
$5.7/MWh
$19/MWh
2.6 MMtons
Base Value
15% lower
Base: 0.47 ton/MWh
Additional 5 TWh of Tier 2 Renewables receive RECs
80% Lower Upstate MERs and MHR
Base: 17 TWh of Tier 1 renewables receive RECs
50% 100% displacement 0% displacement
Note: For illustrative purposes; from earlier version of analysis
| brattle.com 23
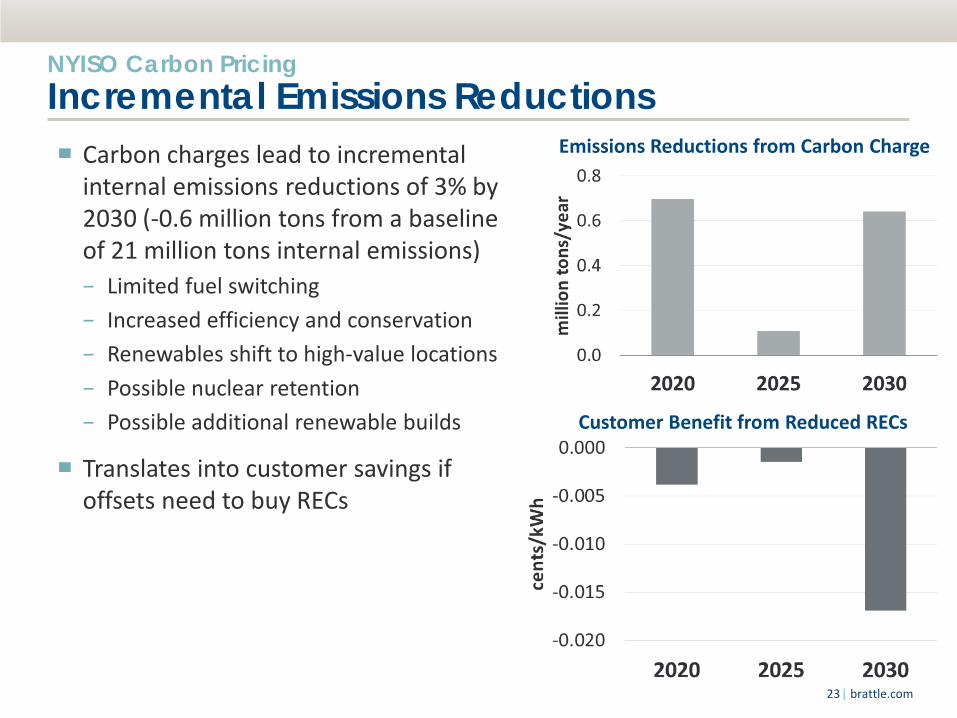
NYISO Carbon Pricing Incremental Emissions Reductions ▀ Carbon charges lead to incremental
internal emissions reductions of 3% by 2030 (-0.6 million tons from a baseline of 21 million tons internal emissions) − Limited fuel switching − Increased efficiency and conservation − Renewables shift to high-value locations − Possible nuclear retention − Possible additional renewable builds
▀ Translates into customer savings if offsets need to buy RECs
Customer Benefit from Reduced RECs
Emissions Reductions from Carbon Charge

| brattle.com 24
NYISO Carbon Pricing Implementation Challenge: Leakage
NYCA had net imports of 19 TWh in 2015, serving 12% of NYCA load
Absent border adjustments, internal carbon pricing could dramatically
increase imports to serve almost half of New York load

| brattle.com 25
ISO New England Integrating Markets and Public Policy Initiative

| brattle.com 26
▀ New England states are members of the RGGI cap and trade market, though prices are too low to achieve decarbonisation goals
▀ Decarbonisation largely achieved via: − Efficiency programs − Renewable portfolio standards − Recent and planned large-scale clean
energy procurements to procure renewables, Canadian hydro, and offshore wind
− Potential nuclear plant interventions ▀ Integrating Markets and Public Policy
(IMAPP) initiative aims to address growing disconnect between carbon policy and market design
ISO-NE IMAPP Clean Energy Market Integrating Markets and Public Policy Forum
New England Electricity Sector Historical CO₂ Emissions and Goals
Sources and Notes: EIA Annual Utility Sales, EIA Emissions. Assumes electric sector meets equal share of economy-wide emission target. Map from ISO-NE.
Emis
sion
s (m
illio
n to
ns C
O2)
2030 Goal
2050 Goal
Carbon Goal: 75-95% below 1990* levels by 2050 (state-specific, economy-wide)
Renewables Goal: 50% by 2030
Electricity Sector Carbon Market
linked with New York and Maryland
* Relative to 2003 levels for Maine, 2001 levels for CT.

| brattle.com 27
ISO-NE IMAPP Clean Energy Market Proposed Design and Objectives Brattle, Conservation Law Foundation, Brookfield, and Nextera proposed a clean energy market to achieve decarbonization goals within the market
Key Design Elements: ▀ Auction procures the clean energy attribute only (not bundled with energy) ▀ Award clean energy payments in proportion to marginal carbon abatement ▀ Purchases via this market fulfill majority of states needs, but possibly less than
100% ▀ Enable competition among all clean energy resources to yield least cost
portfolio to meet the states’ policy goals
A note on carbon pricing: The coalition recommend enhanced CO2 pricing as a means to efficiently contribute to achieving decarbonization goals. This clean energy market can work well alongside enhanced CO2 pricing, or on a stand-alone basis
Sources and Notes: See the full design proposal here: http://www.nepool.com/uploads/IMAPP_20170517_LT_Straw_Dynam_Clean_Energy_Market.pdf
| brattle.com 28
0
500
1,000
1,500
2,000
$0
$5
$10
$15
$20
1 2 3 4 5 6 7 8 9 10 11 12 13 14 15 16 17 18 19 20 21 22 23 24
Mar
gina
l Em
issi
ons
(lbs/
MW
h)
Clea
n En
ergy
Pay
men
ts ($
/MW
h)
0
500
1,000
1,500
2,000
$0
$5
$10
$15
$20
1 2 3 4 5 6 7 8 9 10 11 12 13 14 15 16 17 18 19 20 21 22 23 24
Mar
gina
l Em
issi
ons
(lbs/
MW
h)
Clea
n En
ergy
Pay
men
ts ($
/MW
h)
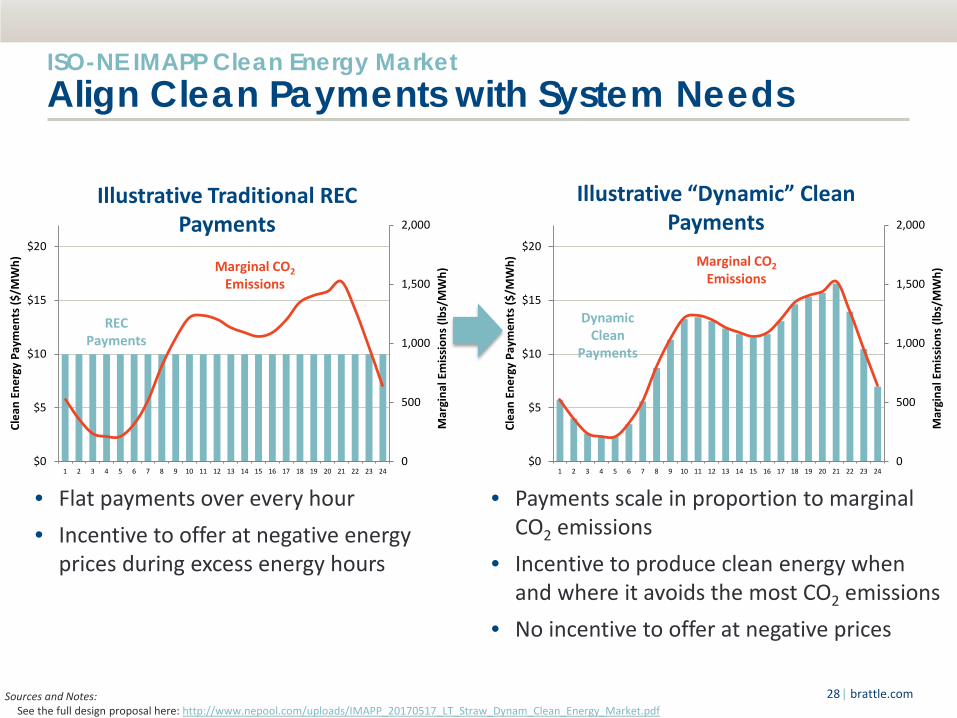
ISO-NE IMAPP Clean Energy Market Align Clean Payments with System Needs
• Flat payments over every hour • Incentive to offer at negative energy
prices during excess energy hours
• Payments scale in proportion to marginal CO2 emissions
• Incentive to produce clean energy when and where it avoids the most CO2 emissions
• No incentive to offer at negative prices
Illustrative Traditional REC Payments
Illustrative “Dynamic” Clean Payments
Marginal CO2 Emissions
REC Payments
Marginal CO2 Emissions
Dynamic Clean
Payments
Sources and Notes: See the full design proposal here: http://www.nepool.com/uploads/IMAPP_20170517_LT_Straw_Dynam_Clean_Energy_Market.pdf
| brattle.com 29
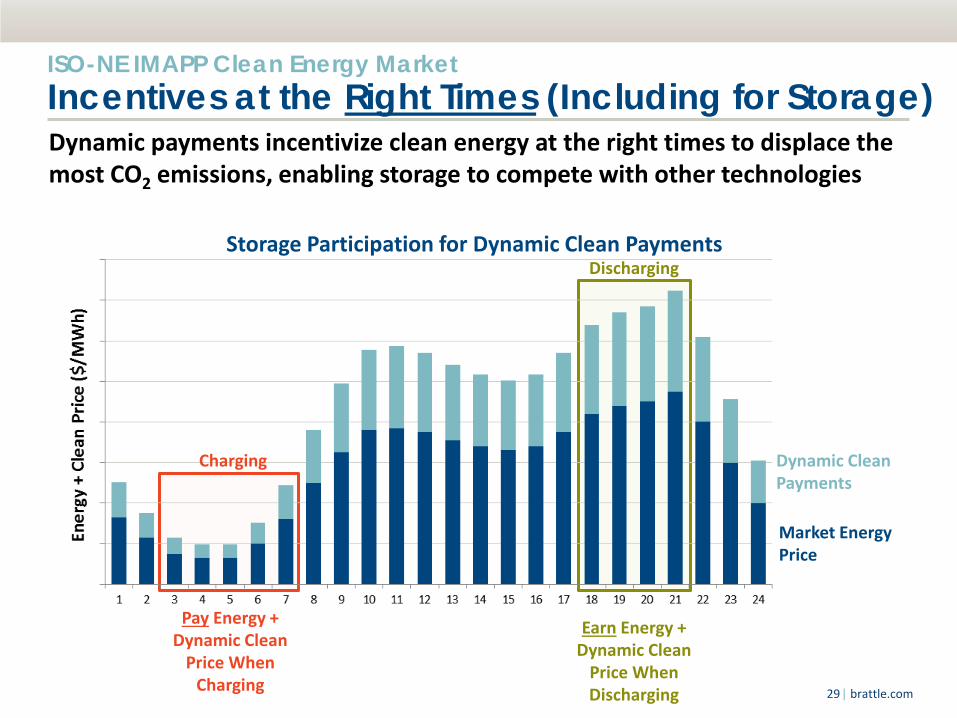
ISO-NE IMAPP Clean Energy Market Incentives at the Right Times (Including for Storage)
Dynamic Clean Payments
Market Energy Price
Pay Energy + Dynamic Clean
Price When Charging
Earn Energy + Dynamic Clean
Price When Discharging
Dynamic payments incentivize clean energy at the right times to displace the most CO2 emissions, enabling storage to compete with other technologies
Storage Participation for Dynamic Clean Payments
Charging
Discharging

| brattle.com 30
ISO-NE IMAPP Clean Energy Market Incentives for Clean Energy in the Right Locations Location-specific payments will focus incentives to develop new clean energy where they will displace the most CO2 emissions Low-Emitting Location
Generation pocket that is already saturated with wind. New clean energy will mostly displace the generation of existing wind resources (and will
earn fewer payments)
High-Emitting Location Load pocket where high-emitting steam oil units are often called on. Clean energy will displace
more emissions (and earn more payments)
Anchor Price Set in forward auction
Anchor Price Set in forward auction
Realized Payments
Realized Payments
| brattle.com 31
Takeaways Markets have demonstrated that they can achieve their design objectives at low cost by harnessing competition and innovation. This successful approach can be applied to decarbonization. ▀ Carbon prices are the gold standard ▀ Resource-specific procurements tend to be higher cost and less
competitive ▀ Extensive out-of-market policies can have unintended consequences ▀ Technology-neutral, market-based mechanisms can achieve well-defined
decarbonization policy objectives ▀ Leakage is a concern in a non-uniform carbon price world
| brattle.com 32
Presenter Information ROGER LUEKEN Associate │ Washington DC [email protected] +1.202.419.3321
Dr. Roger Lueken is an Associate in The Brattle Group’s Washington DC office with expertise in with expertise in wholesale electricity market modeling, market design, and energy storage. Dr. Lueken earned his Ph.D. in Engineering and Public Policy from the Carnegie Mellon Electricity Industry Center at Carnegie Mellon University, and a Masters of Engineering and Public Policy from the University of Maryland.
The views expressed in this presentation are strictly those of the presenter and do not necessarily state or reflect the views of The Brattle Group.

| brattle.com 33
Our Practices
ENERGY & UTILITIES Competition & Market Manipulation Distributed Energy Resources Electric Transmission Electricity Market Modeling & Resource Planning Energy Litigation Environmental Policy, Planning and Compliance Finance and Ratemaking Gas/Electric Coordination Market Design Natural Gas & Petroleum Nuclear Renewable & Alternative Energy
LITIGATION Accounting Analysis of Market Manipulation Antitrust/Competition Bankruptcy & Restructuring Big Data & Document Analytics Commercial Damages Environmental Litigation & Regulation Intellectual Property International Arbitration International Trade Labor & Employment Mergers & Acquisitions Litigation Product Liability Securities & Finance Tax Controversy & Transfer Pricing Valuation White Collar Investigations & Litigation
INDUSTRIES Electric Power Financial Institutions Natural Gas & Petroleum Pharmaceuticals & Medical Devices Telecommunications, Internet, and Media Transportation Water

| brattle.com 34
Offices
BOSTON NEW YORK SAN FRANCISCO
WASHINGTON, DC TORONTO LONDON
MADRID ROME SYDNEY
![market [in] design](https://static.fdocuments.net/doc/165x107/62b96d7a7ff7027d87431555/market-in-design.jpg)