Smallholder pig producers and their pork consumption practices in three districts in Uganda

GCP/INT/743/CFC Technical Report
PROJECT FOR THE ENHANCEMENT OF COFFEE QUALITY
THROUGH THE PREVENTION OF MOULD FORMATION
PROJECT GCP/INT/743/CFC
UGANDA
SURVEY ALONG COFFEE COMMODITY CHAIN IN UGANDA
ROUTES R1 & R3
REPORT BY
G.W. KULABA
National Consultant Coffee Production and Processing
(GCP/INT/743/CFC)
TO
FOOD AND AGRICULTURE ORGANISATION OF THE UNITED NATIONS

UGANDA COFFEE DEVELOPMENT AUTHORITY
KAMPALA OCTOBER 2004
TABLE OF CONTENTS PAGES ACKNOWLEDGEMENTS SUMMARY OF MAIN FUNDINGS AND RECOMMENDATIONS 1.0 INTRODUCTION ……………………………………………….……….……… 1
1.1 Motivations for a market chain analysis …………….………….….……… 1 1.2 Aims and objectives of the survey …………………………….………….. 2 1.3 Plan of work ……………………………………………….……….……… 2
2.0 ANALYSIS OF STRUCTURE AND FUNCTIONING
OF THE COFFEE COMMODITY CHAIN IN UGANDA ………………..…. 3
2.1 Introduction ……………………………………………….……………..… 3 2.2 Methodology ……………………………………………….………….…... 4 2.3 Findings ……………………………………………….……………….….. 7
2.3.1 Constraints during the study ……………………………………… 7 2.3.2 Levels and routes of coffee …………………………………...….. 8 2.3.3 Technical and Commercial activities ………………………...….. 8 2.3.4 Types of Stakeholders and relative functions …………………….. 9
2.4 Conclusions ……………………………………………….……………….. 10 2.5 Recommendations ……………………………………………………..….. 11
3.0 SOCIO-ECONOMIC SURVEY OF CHAIN OPERATORS ………………… 12
3.1 Introduction ……………………………………………………….………. 12 3.2 Methodology . ……………………………………………………….……. 12 3.3 Findings ……………………………………………….……………….….. 12
3.3.1 Farmers’ practices, behaviours, opportunities and constraints ……. 12 3.3.2 Practices, behaviours, opportunities and constraints of
middlemen at different levels …………………………………….. 26 3.3.3 Practices and problems at export level …………………………… 35
3.4 Conclusions ………………………………………………………………. 38 3.5 Recommendations …………………………………………………………. 42
4.0 PHYSICAL ANALYSIS OF SAMPLES AND ASSESSMENT OF LINKAGES ……………………………………………….. 43
4.1 Introduction ……………………………………………………………….. 43 4.2 Methodology ………………………….…………………………………… 43 4.3 Findings …………………………………………………………………… 44
4.3.1 AW and moisture content ………………………………………..… 44 4.3.2 Link between moisture content and transaction level/route ………. 45 4.3.3 Link between moisture content and trader function ……………… 45 4.3.4 Link between moisture content and transaction level ……………. 46
4.4 Conclusions ………………………………………………………………. 47 4.5 Recommendations …………………………………………………………. 48
5.0 ASSESSMENT OF EVOLUTION OF MOULD AND
OTA CONTAMINATION …………………………………………………….. 49
5.1 Introduction ……………………………………………………….……… 49 5.2 Methodology ………………………………………………………..…….. 49 5.3 Findings …………………………………………………………….…….. 49
5.3.1 Fungal species and infection rates ………………………………… 49 5.3.2 OTA contamination ……………………………………………….. 50 5.3.3 Link between contamination rate and moisture content ………..… 50 5.3.4 Link between contamination rate and trader function ……………. 50 5.3.5 Link between contamination rate and transaction level ………….. 50
5.4 Conclusions ………………………………………………………………. 50
5.4.1 Evolution of fungal contamination ……………………………….. 50 5.4.2 Evolution of OTA contamination ………………………………… 51
5.5 Recommendations …………………………………………………………. 51
TABLES – 1 – 25 ……………………………………………………………………….. 52 ANNEX 1 – Proposed Work Plan ………………………………………………………. 94 ANNEX II – Statistical Analytical Data ………………………………………………… 99

The views expressed in this report are those of the author and do not necessarily reflect the views of the Food and Agriculture Organization of the United Nations.

1.0 INTRODUCTION 1.1 Motivations for a market chain analysis:
The main aim of the current project is to find ways of preventing mould growth in coffee and thus eliminate or suppress evolution of OTA contamination in coffee beans.
The coffee processing and marketing situation in Uganda is such that: • Many farmers (over 70%) harvest unselectively, delay drying for 4-7 days after
harvesting and dry on bare soil. • The majority of berry (kiboko) and hulled coffee (FAQ) is traded above
recommended moisture levels all the way from farmer to exporter. Judging from the limited global current knowledge about OTA occurrence in coffee, it would appear that such practices entail a risk of increased mould and OTA contamination in the coffee commodity chain between the producer (farmer) and the exporter stages.
The project authorities have considered that such practices are closely linked to relations between stakeholders in the chain and that they affect producer attitudes.
Thus the motivations for the coffee commodity chain survey included: • The need to understand existing marketing practices and how they might influence
risk of OTA contamination. • The need to know the factors that determine the choices of the various economic
operators along the chain and also to identify opportunities to influence their behaviour towards the production of safer and better quality coffee.
• To gain insight into the efficiency of the marketing chain and how it might be improved, with particular emphasis on farmers’ returns and farmer welfare.
• To identify areas where technical interventions could reduce risk of OTA. • To gain appreciation of the current and potential impact of regulatory and control
policies and activities.
- 1 -

1.2. Aims and objectives of the current survey:
During the Western coffee season (May – August) in 2003, the current consultant attempted an analysis of the coffee chain structure in Uganda under the present project.
Although the report that ensued had some interesting results, there were some loopholes in the work, connected to sampling and the fact that the investigation was started too late, beyond the consultant’s control.
Therefore the current investigation was a follow up on similar lines.
The main aims and objectives of the study were:
1. To understand the structure and the functioning of the coffee chain in Uganda by:
- Reviewing identification of operational levels and routes of coffee from the farmer to the exporter.
- Structuring commercial and technical activities to determine typology of traders, including farmers, and their relative functions.
- Sampling along the longest and shortest routes of coffee to enable quick assessment of possible influences of routes and levels and their interactions.
2. To asses the evolution of fungi and OTA contamination along the chain by: - Analyzing samples taken at well-identified levels for the two selected
routes (short one or R1 and a long one or R3). 3. To collect socio-economic and technical data at each level for the two selected
routes by: - Collecting and recording information for each sample. - Conducting selected physical analysis.
1.3 Plan of work:
Annex I gives the proposals made, through consultation with the national coordination team and the central project team, in view of the objectives of the study.
- 2 -
2.0 ANALYSIS OF STURCTURE AND FUNCTIONING OF THE COFFEE COMMODITY CHAIN IN UGANDA
2.1 Introduction: The first task of the survey was to determine:-
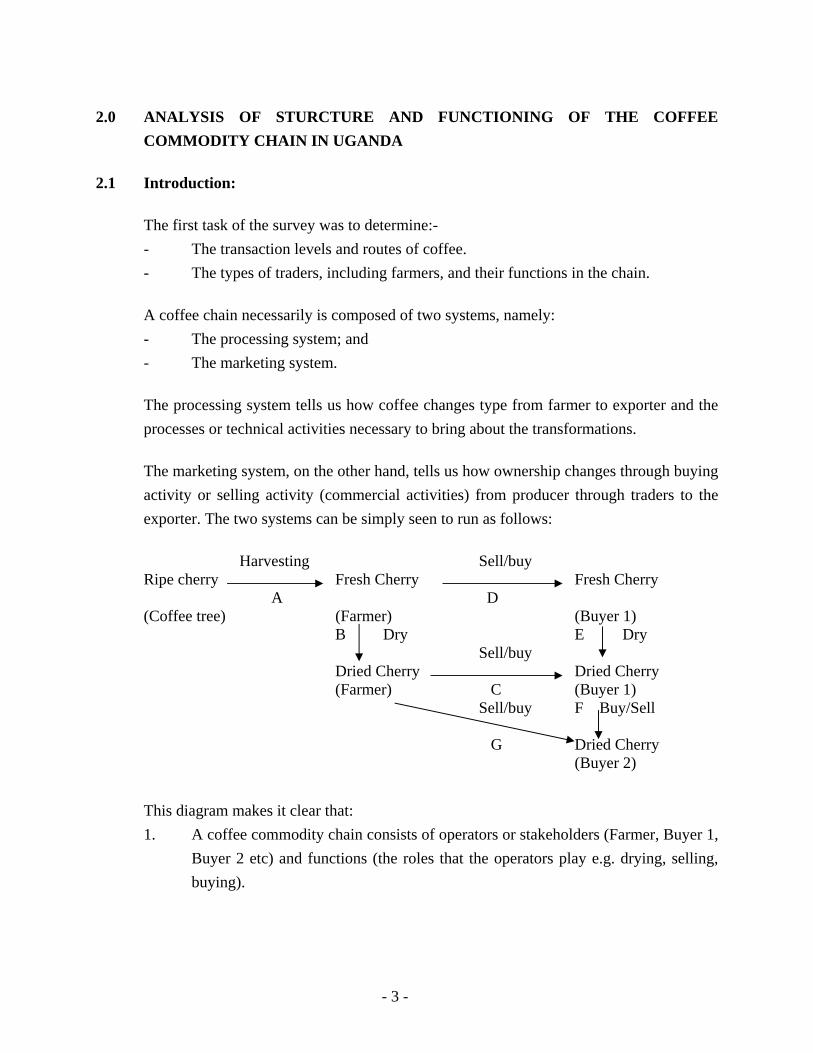
- The transaction levels and routes of coffee. - The types of traders, including farmers, and their functions in the chain. A coffee chain necessarily is composed of two systems, namely: - The processing system; and - The marketing system. The processing system tells us how coffee changes type from farmer to exporter and the processes or technical activities necessary to bring about the transformations. The marketing system, on the other hand, tells us how ownership changes through buying activity or selling activity (commercial activities) from producer through traders to the exporter. The two systems can be simply seen to run as follows: Harvesting Sell/buy Ripe cherry Fresh Cherry Fresh Cherry A D (Coffee tree) (Farmer) (Buyer 1) B Dry E Dry Sell/buy
Dried Cherry Dried Cherry (Farmer) C (Buyer 1) Sell/buy F Buy/Sell G Dried Cherry (Buyer 2)
This diagram makes it clear that: 1. A coffee commodity chain consists of operators or stakeholders (Farmer, Buyer 1,
Buyer 2 etc) and functions (the roles that the operators play e.g. drying, selling, buying).
- 3 -

2. To know the history of any coffee at a particular stage/level in the chain, one must identify all the operators who must have handled the coffee and the role each of these played. For instance, to know who dried the coffee with Buyer 2, it is necessary to ask Buyer 2 how he obtained it (activity/function) and from who (operator). If he bought then he never dried. If he bought via route G then the farmer dried it or else he bought via route F in which case Buyer 1 dried it.
3. Routes and levels can be identified from the path traced and the steps or the
number of hands/operators the coffee has exchanged between the producer (farmer) and the exporter (e.g. G and C F). Thus we can have levels 0,1,2,3,4 and routes one (R1) and three (R3) as follows: Level 0 1 2 3 4 E S1 S2 S3 F R3
S1 F R1
(E = Exporter, S = Supplier and F = Farmer). 2.2 Methodology:
To minimize samples, only two routes, R1 and R3, were studied (Annex 1)
2.2.1 Selection of study area October – January was Eastern season so Jinja, Iganga and Kamuli were the areas selected for study.
2.2.2 Selection of the 3 exporters
Preliminary interviews were held to find out which exporters operated significantly in the areas of study. Then advice was sought from relevant UCDA officials concerning the relative coffee volume and coffee quality performance of the various companies over the years.
- 4 -

Great Lakes (Company 1), Pan Afric Impex Ltd. (Company 2) and Unex (Company 3) export companies were selected, in view of the above considerations (See Table 8) and their readiness to cooperate.
2.2.3 Determination of number of survey samples
The anticipated levels, routes and their interactions were put into consideration (Annex 1) and the fact that samples had to be minimized because OTA contamination, among other things, was to be determined. An OTA test is very expensive (about US $ 45) and takes a long time (the consultant was told that the analyst requires a whole day per sample). The choice of 72 samples was considered reasonable although still low (gave only 12 samples per group) for statistical validity (at least 30 samples per treatment was required). The idea was to really test the potential of any possible relationships quickly and go over desirable ones more carefully later.
2.2.4 Determination of analytical coffee sample size
Two samples of 1 kg each from lots of < 0.5 MT and two samples of 2kg each from lots of > 0.5 MT coffee were taken as mush as was possible in the field.
These quantities were designed by the Central Project Team.
2.2.5 Selection and identification of stakeholders at different transaction levels Each of the selected exporters supplied names and telephone numbers of a number (at least 10) of some of their prominent S1 suppliers in addition to those the consultant did meet during the preliminary visits.
The consultant linked up with some of the S1 suppliers who then supplied names and telephone numbers of S2 suppliers. The UCDA District Coffee Coordinators were employed to identify most of the S3 and S4 suppliers. Actually once the S1 suppliers had been identified the next very important group was S2 and S3 suppliers to determine R1 and R3 cases.
- 5 -

2.2.6 Sampling for routes R1 and R 3
The task involved:
- Finding a correct active transaction at the right level. - Interviewing the operator to obtain socio-economic data and getting the
details to locate her/him when buying or selling at another level. - Taking the desired sample in sufficient quantity according to protocol. - Taking the necessary field measurements such as AW and % MC (meter) - Sealing the samples & transporting to UCDA laboratory to start necessary
laboratory analyses. 2.2.7 Interviews
The interviews with the stakeholders were unstructured. The key issues on which information was to be sought during the interviews were discussed with Dr. Rinata Clarke (Central project team) and are listed in Annex 1. This was adhered to as much as possible in this study.
2.2.8 OTA and mycology analysis
After drying the correct portion of sample to 12% mc at 60o C, according to the protocol from central project team, the dried sample was submitted via the national project coordination authority, for OTA determination by Vicam. Similarly, a mycology sample was taken immediately the field samples were brought to the laboratory for analysis by the mycologists according to protocol.
2.2.9 Moisture content and water activity measurement
During sampling in the field, moisture content of the coffee was determined using a rapid moisture meter, Sinar meter for dried bean (FAQ) below 16%MC (wmb) and the LDS-ID (Chinese) meter for dried cherry and moisture of dried beans > 16%MC. Also in the field, the HygroLab water activity meter was used to determine water activity.
- 6 -

In the laboratory, moisture content was re-determined for all the samples by drying in oven at 100-1050C for 16-24hrs using 200g dried-cherry and 100g dried-bean (FAQ) as per protocol from central project team.
2.2.10 Determining typology of traders and relative functions.
The results from the interviews and verification visits were used to identify and structure the activities in the chain, both commercial and technical. Each interviewed stakeholder was assigned his/her correct activities. This led to a classification of traders. For instance, some farmers harvest and sell cherries straight, therefore they do not dry, while other farmers dry to kiboko, and others yet still dry and hull the dried kiboko to obtain FAQ. Similarly some buyers deal in only FAQ others kiboko and others fresh cherry etc.
2.3 Findings:
2.3.1 Levels and routes of coffee From the interviews and the search for R1 and R3 suppliers from the coffee districts covered in the study (Masaka, Mukono, Luwero, Jinja and Kamuli) it was confirmed that there were essentially four supply levels for the longest route of coffee. The existing routes and levels can be represented as: R3: Exporter Supplier 1 Supplier 2 Supplier 3 Supplier 4 (farmer) R2: Exporter Supplier 1 Supplier 2 Supplier 3 (farmer) R1: Exporter Supplier 1 Supplier 2 (farmer) R0: Exporter Supplier 1 (farmer) The farmers who participated in the very short routes, R0 and R1 have been found to be those with quite large coffee acreage, such as stakeholders MAO6 (30 acres) MAO4 (30 acres) and MAO6 (30 acres) as can be seen in Table 4.
2.3.2 Technical and commercial activities
The Survey information is contained in Tables 2-8 (a) Commercial activities The main activities in the marketing chain of coffee in Uganda was found to be:
- 7 -

• Buying and selling • Transportation • Providing labour • Services e.g. hulling Buying and selling levels determine the routes of coffee in the chain. Buying / selling also determines the type of suppliers. For instance, farmers (producers) only sell and do not buy while the other traders buy and sell. (b) Technical activities The technical activities constitute the processing chain in which cherries are transformed into merchantable coffee beans. The main activities were found to be:
• At farmer level - Coffee husbandry and farm management - Coffee harvesting (picking) - Coffee drying - Coffee storage - Coffee transportation
• At processor level - Inspection, weighing and moisture content
determination. - Hulling and sorting - FAQ storage and transportation
• At export processing level
- FAQ inspection and determination of %MC, screen retention, % detects and foreign
matter. - Redrying of inadequately dried FAQ in
mechanical driers. - Cleaning, sorting and grading to produce
international market grades - Cup-brew test.
- 8 -

- Storage/bagging and transportation of clean bean coffee
2.3.4 Types of stakeholders and relative functions
The operations in the coffee commodity chain could be easily identified and classified judging from the socio-economic data gathered during visits and interviews (Tables 5-8). The main types of stakeholders were:
- Exporters - Farmers - Middlemen traders This classification excludes hullery operators who just do hulling as a business and are neither farmers nor middlemen traders. The farmers and middlemen traders could be classified further according to the details of their individual technical and commercial activities. The typology of traders and their relative functions is given as Table 1. The farmers are subdivided into three types:- FTI - These farmers produce fresh cherry, do not dry and sell fresh
cherry (FC) or semidried cherry (SDC). Table 2 gives more details. FT2 - These farmers harvest fresh cherry and dry or attempt to dry to
produce the dried cherry (kiboko) and sell it. Table 3 gives more details.
FT3 - These farmers harvest, dry cherries to kiboko or semi-dried kiboko and hull it before selling. Table 3 gives more details.
The middlemen traders could also be subdivided according to whether they dry/not dry and/or hull/not hull as follows: MT1 - Buy fresh cherry or semi-dried cherry and dry, selling as kiboko.
Table 1 and 5 gives more details.
- 9 -

MT2 - The traders buy fresh cherry or semi-dried cherry, dry and hull to
produce FAQ and sell as FAQ. Table 1 & 6 gives more details. MT3 - This trader buys kiboko or semidried kiboko from farmers or
MT1 traders and hulls to produce FAQ, which is sold. Table 1&6 give more details.
MT4 - The trader buys only FAQ from farmers FT3 and middlemen MT2
& MT3 and sells as FAQ. Tables 1 & 7 give more details.
Essentially, traders MT2 and MT3 could be grouped together since they both hull. Secondly, the kiboko the MT3 trader buys is not always dried to desirable level (it is semi-dried) and has to be dried or re-dried.
The differences between true FT2 and MT1, FT3 and MT2/MT3 are only that one member of each pair is a producer and the other is not.
It was also evident from the interviews that many of the farmers and middlemen play mixed roles. For instance, an MT3 trader can at times change to MT2 or MT4 role depending on circumstances. There is vertical integration as some farmers are also buyers and processors.
2.4 Conclusions:
2.4.1 Structure of the chain The coffee commodity chain in Uganda has up to four levels of supply (S1 – S4) and a number of coffee routes, including RO (farmer sells directly to exporter), R1 (one middleman between farmer and exporter), R2 (two middlemen between farmer and exporter) and R3 (minimum of three middlemen between farmer and exporter).
2.4.3 Functioning of the chain
The coffee commodity chain in Uganda functions basing on the major stakeholders and what they do.
- 10 -

The farmers produce the cherries, which they can process as far as FAQ through kiboko or sell to middlemen or directly to exporter. Their basic role is harvesting and drying. The middlemen can come in at the level of cherry buying from farmers. For the purposes of this study, they have been categorized according to whether they dry and not hull (MT1), dry and hull (MT2), do not dry but hull (MT3) and do not dry or hull and deal in FAQ (MT4). The exporter gets coffee from the middleman or farmer almost always in the form of FAQ and prepares clean beans for export. Throughout the chain, there is storage and temporary storage in between steps. One other characteristic which is evident from coffee moisture content analysis (See tables 9-13) is that every stakeholder is involved in some form of drying activity (drying FC, drying SDC/kiboko and drying semi-dried FAQ). There is trading in wet coffee all the way to the exporter. Therefore the role of drying has shifted from the farmer to middlemen and exporter. This could be having serious consequences on efficiency and quality performance.
2.5 Recommendations:
1. There is a need to study the structure and functioning of the coffee commodity chain in Uganda in more detail involving more routes and larger sample number with statistical validity.
- 11 -
3.0 SOCIO-ECONOMIC SURVEY OF CHAIN OPERATIONS
3.1 Introduction:
The main essence of this work was to find out: • The practices (good or bad) and behaviour of farmers and middlemen). • The opportunities and constraints of farmers and middlemen. • The practices and problems at export level. • Differences between routes R1 & R3. Both good and bad practices or behaviour translate from the perceptions and needs of the stakeholders, which may be linked to inter-relations between the various stakeholders. Therefore a clear understanding of the various socio-economic factors involved should go a long way in explaining why the stakeholders behave the way they do and also give insight into means of improving efficiency of the marketing chain and production of safer and better quality coffee.
3.2 Methodology:
The methodology was essentially that already described in section 2.2.
Each selected stakeholder was subjected to an unstructured interview, based on the key issues outlined on Annex 1 and was made to provide a sample at an active transaction. Among the important data requested was buying and selling price. Important data such as moisture content, was determined from the coffee samples collected. Only routes R1 and R3 were investigated.
3.3 Findings:
3.3.1 Farmers’ practices and behaviours, opportunities and constraints. Survey data concerning R1 and R3 farmers examined is reported in Tables 2 to 4.
- 12 -
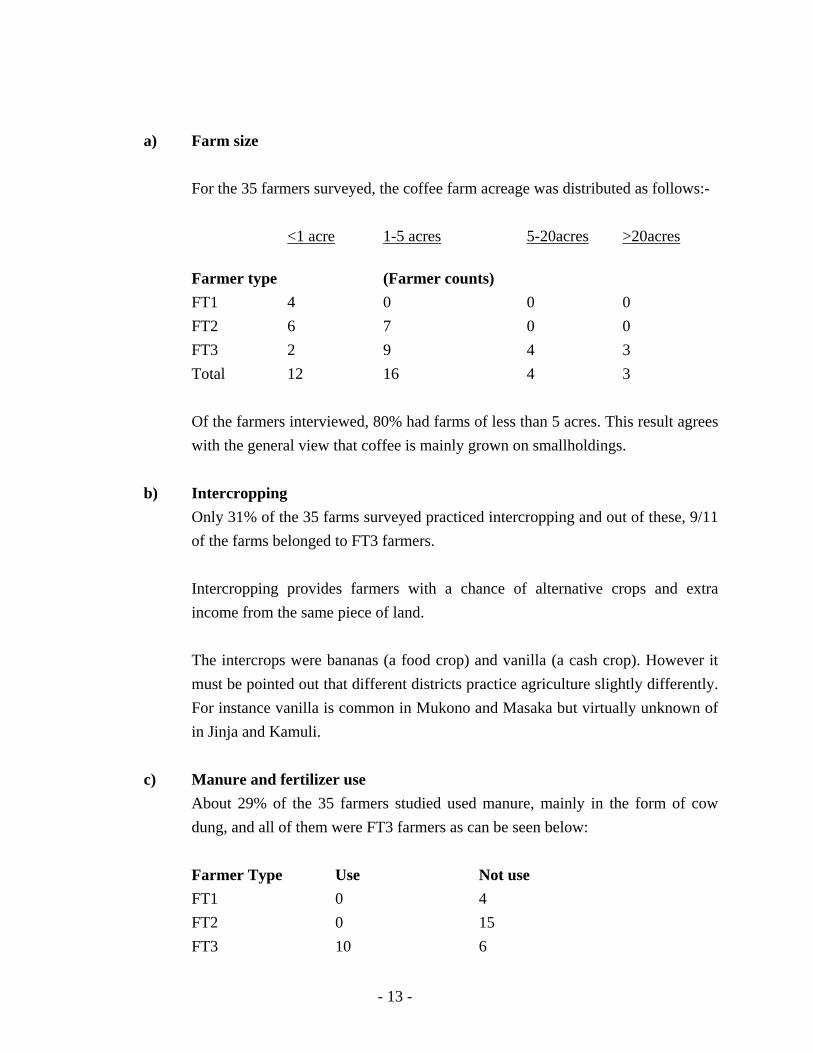
a) Farm size
For the 35 farmers surveyed, the coffee farm acreage was distributed as follows:-
<1 acre 1-5 acres 5-20acres >20acres Farmer type (Farmer counts) FT1 4 0 0 0 FT2 6 7 0 0 FT3 2 9 4 3 Total 12 16 4 3 Of the farmers interviewed, 80% had farms of less than 5 acres. This result agrees with the general view that coffee is mainly grown on smallholdings.
b) Intercropping
Only 31% of the 35 farms surveyed practiced intercropping and out of these, 9/11 of the farms belonged to FT3 farmers. Intercropping provides farmers with a chance of alternative crops and extra income from the same piece of land. The intercrops were bananas (a food crop) and vanilla (a cash crop). However it must be pointed out that different districts practice agriculture slightly differently. For instance vanilla is common in Mukono and Masaka but virtually unknown of in Jinja and Kamuli.
c) Manure and fertilizer use
About 29% of the 35 farmers studied used manure, mainly in the form of cow dung, and all of them were FT3 farmers as can be seen below: Farmer Type Use Not use FT1 0 4 FT2 0 15 FT3 10 6
- 13 -

Only one farmer claimed to use urea, otherwise none of the farmers applied commercial fertilizers. It is considered that most farmers find farm inputs such as fertilizers very costly. This was aired out by the farmers during the interviews.
d) Age of coffee trees
Over 50% of the farmers interviewed depended on old coffee trees over 30 years old.
e) Harvesting practices Data was gathered on:
- Selectivity of picking - Delay of drying after harvesting - Materials used - Source of labour for harvesting - Labour shortages during harvesting - Transport after picking coffee from field.
(i) Selectivity of picking
The result for cherry uniformity determination for the four FT1 farmers involved in this study was as follows:
LEVEL OF RIPENESS
Black + Overripe Ripe/Red Yellow + Green (under ripe) Code % % % J06 3 70 27 J07 6 73 21 J13 1 75 24 J14 5 58 37 Mean 4 69 27
- 14 -

The harvests showed a high level of under ripe cherries (27%) and therefore unselective picking of cherries. (ii) Drying delay A number of farmers interviewed (32%) indicated that they stored fresh cherries for three days or more before putting the coffee out to dry. This was not considered a good practice because it can promote mould growth in coffee.
(iii) Materials used in harvesting
A number of materials were used during harvesting which included: - Budeya (PP bags and sheets) - Baskets - Plastic basin, pail or cut jerrican - Mat
The most popular materials appeared to be budeya and baskets (over 50% of the cases interviewed). However, the locality also mattered. For instance, while in Masaka, Mukono and Luwero (Buganda) spread mats may be used, these items are not common in other areas like Kamuli or Jinja.
(iv) Source of labour for harvesting
The majority (77%) of the farmers interviewed used household labour force.
(v) Labour shortage during harvesting Harvesting of coffee competes with other activities of the farmers. Of the 35 farmers studied a high number (68%) indicated that they experience this problem. (vi) Transport after picking coffee from field Most of the farmers (89%) indicated that they did not need to have carriers other than their own heads to transfer harvested coffee to the drying site or home. However, carriers, such as bicycles, wheel barrows and even pick-ups were at times used on larger farms producing greater quantities of coffee.
- 15 -

f) Coffee dying information The following parameters were considered:-
- Drying period - Drying surface - Ways of telling end of drying - Drying space adequacy - Source of labour for drying - Views on widespread use of moisture meters.
All the farmers examined employed sun-drying method.
(i) Drying period Of the 31 farmers interviewed who dried their coffee, 26 (84%) claimed drying took 5 – 10 days and only 5 (16%) needed over 10 days.
(ii) Drying surface Of the 31 farmers interviewed, most of them (84%) dried the cherries on bare soil, 16% on tarpaulins, 7% on mats and 3% on cemented barbecue.
(iii) Ways of telling end of drying None of the farmers studied, including S2 cases, owned a moisture meter. The methods they used included biting, rattling/shaking, and cutting with a pair of scissors, looking at the bean inside after removing the husk and accessing the colour from experience.
(iv) Drying space adequacy The farmers who dried on cemented floor and/or tarpaulins claimed they experienced shortage of drying space.
Also, those farmers who had coffee acreage of over 10 acres expressed shortage of drying space even when drying was on bare ground.
(v) Source of labour for drying Although the majority of farmers relied on household labour, some proportion, 7/31 (23%), required hired labour to manage drying.
- 16 -

(vi) Views on widespread use of moisture meters Considering all operators involved in the study, 26% were not in favour of widespread use of moisture meters. Their reasons were that:- - Moisture meters like the Sinar moisture meter commonly in use at export
level was too costly (over one million Uganda shillings) for most traders, those below S1 supply level.
- The Sinar moisture meter was useless when it came to determining moisture content of kiboko or cherry during drying and also very wet FAQ. Such a moisture meter did not help traders and farmers handling cherry coffee.
- Most farmers and traders were able to assess moisture content of coffee reliably from experience and simple methods such as colour, shaking and listening, hardness of the bean, and so on.
- Moisture meters were being abused by traders and exporters for gains as a number of them were in use and yet not properly calibrated or synchronized with the standard meter kept by UCDA.
All of the FT1 farmers and the majority of FT2 were in opposition. Those operators who were in favour of widespread use of moisture meters (74%) appreciated their usefulness but suggested that the appropriate meter should:-
- Be able to record the moisture content of both kiboko and FAQ adequately to
within + 1% in the range of 17% - 10% MC. - Be affordable by both traders and farmers. Various proposals were made about affordable prices and these included:- - < Ugsh.50,000/= (35% of positive respondents). - Ugsh.50,000/= to 100,000/= (45% of respondents). - > Ugsh.100,000/= (20% of respondents). The operators were happy when the Consultant informed them about the Chinese meters and the possibility of getting simpler and cheaper moisture meters.
- 17 -

g) Storage information The following parameters were considered:-
- Storage period and type of coffee stored. - Where stored? - How stored? - Why stored?
(i) Storage period and type of coffee stored The FT1 farmers sold off their fresh cherries within 24 hours but one of the 4 farmers interviewed indicated that the period could be as long as 2 days (Table 2). The FT2 farmers had to keep kiboko until sale while the FT3 farmers had to keep kiboko till it was hulled to produce the FAQ. For the cases involved in this study, the FAQ produced from this source was sold immediately, within 24 hours. So, the storage period indicated in Tables 3 and 4 is for kiboko before sale (FT2, Table 3) or before hulling (FT3, Table 4). For the 31 FT2 and FT3 farmers, 48% stored kiboko for < 1 month, 36% stored for 1 – 2 months, 10% stored for 2 – 3 months, 3% stored for 4 – 5 months and 3% stored for 6 or more months. Only 19% of these farmers sold their kiboko coffee straight. (ii) Where and how FT2 and FT3 farmers stored dried/semi-dried cherries
The forms of storage included: - PP bags on cemented floor. - PP bags on uncemented floor - Heaping on uncemented floor - Others (Baskets, plastic containers).
The storage could be in own house or separate store.
Most farmers (84%) stored in PP bags and only a few (16%) heaped the coffee. All those who heaped the coffee had cemented floors.
- 18 -
Most of the farmers stored coffee in the main house and only a few (16%) had
separate stores. Of those with separate stores, only 25% of them had cemented
stores.
(iii) Reasons for not selling the coffee straight
The reasons given included:-
- The need to keep their money in form of coffee rather than ready cash, which
is difficult to keep. The coffee would be sold when a critical money problem
arose, just like how one would go to withdraw money from a bank to pay
school fees.
- The need to speculate on price. This arose from the fact that coffee prices
fluctuated very much and sometimes went far below what the farmers felt
was worth their effort in producing the coffee.
All the farmers interviewed felt that the current price of Ugsh.500/=per kg kiboko
was too low and many proposed a figure of Ugsh.700/= to Ugsh.1,000/= per kg
kiboko under the prevailing conditions in the country for coffee production to be
profitable.
h) Coffee hulling information
The following parameters were considered in this study:-
- Hulling fee.
- Cost of transferring coffee to the hulling station.
- Factors influencing a farmer to hull and sell FAQ rather than kiboko.
(i) Hulling fee
A hulling fee of Ugsh.20/= to Ugsh.30 per kg FAQ, depending on the location,
was charged for hulling kiboko to FAQ at the hullery.
- 19 -
(ii) Cost of transporting kiboko coffee to hulleries
Whether transport was by pick-up truck or bicycle or motorcycle, a bag of kiboko
(50 – 85kg) was charged around Ugsh.1,000/= for distances of 5 – 10km to
nearest hullery in the various districts of study. For instance in Masaka, an
operator paid Ugsh.20,000/= for transporting 1MT kiboko (20 bags averaging
50kg per bag) for a distance of 16km (10 miles) to the nearest hullery. This
translated to about Ugsh.1.3kg-1 km-1. However, negotiations could be made on
charges for much longer or much shorter distances.
(iii) Factors influencing a farmer to hull and sell FAQ rather than kiboko.
The farmers who did not hull reported that their problems were:-
- Having small volumes of coffee
- Having no sufficient money to cover transport to hullery.
The farmers who hulled expressed the views that preference to hull arose from:-
- The need to eliminate middlemen whom they said just cheat and reap profits
while spoiling quality.
- The need for better returns and make coffee production more profitable.
Some claimed that they get at least 10% more for their coffee if they sell as
FAQ.
- The need to cheaper access to husks for use as manure, say in banana
plantations, or in rearing chicken (poultry).
It therefore appeared that according to the operators, the factors influencing them
whether to hull or not were:-
- Amount of coffee produced or handled annually. This depended on the size
of the farm and its productivity in the case of farmers.
- Low price of kiboko compared to FAQ.
- Proximity to a hullery.
- Maximization of returns.
- Value for the coffee husks.
- 20 -

From Tables 2 – 4, it is evident that of the 16 FT3 farmers studied, 44% had
coffee acreage of over 5 acres while there was no FT1 or FT2 farmer with over 5
acres of coffee.
According to Farmer types (FT1, FT2 and FT3,) only FT3 farmers hulled, FT1
and FT2 did not.
Most hulleries were located near towns or townships where there was electrical
power and easier means of communication. It would be uneconomical for
individual farmers deep in the villages to bring small amounts of coffee to hull
even if FAQ price was high. However, it is considered that it would be easier for
these small and poor farmers if they associated and put the coffee together for
hulling.
The question of profitability between selling FC, kiboko or FAQ is handled
elsewhere in this report.
Calculations based on moisture content, price and conversion ratios between
different coffee types have given estimates of Ugsh.200,000/= earning from 1MT
cherry sold as FC by FT1, Ugsh.266,313 earning from 1MT cherry sold as kiboko
by FT2 and Ugsh.290,940/= earning from 1MT cherry sold as FAQ. This
translated to about 9% earning for FAQ over kiboko as it is traded in Uganda.
i) Coffee selling information
The following parameters were considered in the study:-
- Factors affecting choice of buyer
- Access to marketing information
- Factors which influence price when selling
- Characteristics of coffee that might be rejected by buyers.
- 21 -

(i) Factors affecting the choice of buyer
All operators interviewed submitted that they do not sell exclusively to any one
trader. The trader who pays more money for the coffee takes the coffee.
However, the farmers reported that one trader may buy frequently from one
supplier depending on:-
- Proximity of the trader to the supplier.
- Whether the trader has advanced credit to the farmer/supplier.
- Trader pays some extra amount beyond the usual price for coffee of
distinctive quality.
- Trader provides transport facilities.
- Trader does not apply unnecessary deductions when paying.
- Trader visits farmer frequently to check on the coffee.
- Trader is trustworthy when weighting and counting money.
(ii) Access to marketing information
Many of the operators, and farmers in particular complained about the fluctuating
prices. They claimed that this meant that traders could offer any price claiming
that things have changed. Cases were narrated whereby some traders had used
mobile phones to con farmers on price.
The farmers’ view and that of most medium sized middlemen (S1 & S3) is that
running prices for the day should be announced on local radio broadcast every
morning and also reported in daily newspapers right from the exporter level
through middlemen to farmer level. This would improve farmers’ knowledge
about prices and coffee marketing situation.
Some farmers listened to the coffee production and marketing programmes
offered by the UCDA on radio and TV broadcasts. A number of farmers
appreciated it but said that this was not enough. The farmers needed face-to-face
training sessions as better alternatives.
- 22 -

Many farmers rated coffee extension services in the districts covered by the
present study as being very weak and infrequent.
(iii) Factors which influence price when selling coffee
Prices for the coffee sampled during the study are given in Tables 2 to 4 and 16.
Average prices were Ugsh.200/= per kg cherry (average M.C. = 60.2% wmb),
Ugsh.486/= per kg kiboko (average M.C. = 18.6% wmb) and Ugsh.1,150/= per kg
FAQ (average M.C. = 14.2% wmb).
Thus different prices applied to FC, kiboko and FAQ in view of the varying
amounts of moisture and extraneous tissues present.
The following factors were identified as having influence on the price the trader
offered for the coffee in question:-
• FC Coffee - Buying prices of FAQ fixed by each exporter in Kampala.
- Quantity of foreign matter such as twigs, stones and soil.
- Quantity of green and immature berries or floats.
- Density and size of cherries.
- Competition and demand for coffee among traders.
• Kiboko - Buying price of FAQ fixed by exporters in Kampala
- Dirtiness/cleanliness of dried cherries and quantities of stone
debris and other foreign matter.
- Wetness as judged by biting, rattling and experience by sight.
- Density and size of dried cherries and uniformity of lot.
- Demand and competition on part of traders
- Volume on sale.
• FAQ Coffee - Buying prices fixed by exporters in Kampala
- Moisture content as determined by moisture meter.
- % content of foreign matter particularly stones, debris and soil.
- 23 -

- % content of defective beans, particularly blacks, chalky white,
floats and pods.
- Smelly/musty coffee.
- Screen retention or size distribution of beans and amount of
BHPs.
- Volume of coffee being sold.
- Area of production and quality performance history of supplier.
For FC and kiboko, the farmers added that although the traders demanded certain
requirements concerning quality, they hardly got price differentials for their
efforts to comply, so there was a tendency for them to give up.
A maximum of Ugsh.20/= to 30/= was sometimes given as token above the
regular price after great pressure.
For FAQ, reductions of 1% - 7% were normally applied, particularly at export
level, as penalties for excess moisture, excess defects and foreign matter, poor
retention and high BHP content beyond acceptable regulatory levels.
The exporters normally use a formula which may be stated as follows:-
- For wetness: (Coffee MC% - 13%) x 2 = X.
- For BHP: {(100 - % retained on Sc 12) – 5}/2 = Y
- For defects and foreign matter: % defects found = Z
Total percentage deduction would be X + Y + Z.
The application of deductions may not be as simple as this. This can be illustrated
using the case of one supplier who supplied to the same exporter at a number of
occasions as shown in Table 25.
- 24 -

(iv) Characteristics of coffee that might be rejected by buyers
When buying, traders could reject fresh cherry coffee only if it contained too
many immature and green berries (> 50%) and/or diseased/drought affected/very
light coffee.
Dried berries could be rejected if smelly, very light with many empty pods or
over-mixed (adulterated) with stones as judged by the eyes.
The criteria for rejecting FAQ Coffee included:-
- Smelly coffee.
- Over mixed coffee adulterated with too many stones and/or BHPs.
- Too wet, > 20% MC., when selling to smaller traders and > 17% when
selling directly to exporter.
- Too many blacks and discoloured beans.
j) Views about farmers’ groups and fixed trading relationships at farmer level
Many operators particularly those outside Masaka region, were very skeptical
about the idea of forming associations. This was probably due to a bad historical
experience about the defunct co-operative societies and unions of the 1960s and
1970s where officials were just embezzling money and the like.
Most operators (about 69%) were not in favour of farmers’ groups, saying that
they did not have any trust because they new any official put there will cheat and
that it would not help much.
The rest of the others (31%) were positive about associations and said that they
could be used to bring about incentives in coffee production and marketing.
However, they also insisted that the associations must be organized on completely
different lines from those of the old co-operative societies and unions, which
failed in the 60s and 70s. They were not sure of how the new type of association
they wanted should operate.
- 25 -

3.3.2 Practices, behaviours, opportunities and constraints of middlemen.
Survey data concerning middlemen involved in R1 and R3 sampling is presented in
Tables 5 – 7.
a) Coffee buying and selling
The study concentrated on:-
- Traded coffee volumes, coffee type and levels of trading.
- Buying and selling prices at each level for each type of coffee and the factors
which influence price when buying or selling.
- Traders’ choice of buyers when selling.
- Traders’ views about coffee quality and the characteristics of coffee that may
be rejected when buying or selling.
- Quality tests/checks carried out during transactions.
- Traders’ views about farmers’ groups and fixed trading relationships at
different levels of the chain.
- Marketing information available at each trading level and information the
traders thought they needed.
(i) Coffee traded and levels of trading
Generally, the traders that did not hull and were classified as MT1 in this study
dealt in relatively smaller volumes of coffee (average of about 5MT kiboko
annually for those sampled) compared to those who hulled and traded either as
MT2/MT3 middlemen (average of about 23MT of FAQ annually for those
sampled) or MT4 middlemen (average of over 400 MT of FAQ annually).
Since MT1 traders buy cherries from farmers and sell kiboko type coffee while
exporters, on the other hand, deal almost exclusively in FAQ type coffee, it
follows that MT1 traders hardly participated in the short R0 and R1 routes of
coffee in the chain. They are low-level traders. The other trader types (MT2,
MT3 and MT4) can supply coffee through any route apart from R0.
- 26 -

(ii) Buying and selling prices and factors which influence price when
buying/selling
The coffee prices for the active transactions observed during the study are
indicated in Tables 2 – 7 and 16.
The average prices were:-
- Ugsh.200/= per kg of cherry coffee (60.2%MC) when buying from FT1
farmers.
- Ugsh.483/= per kg of kiboko coffee (17.8%MC) when buying from MT1
middlemen traders.
- Ugsh.1,156/= per kg of FAQ coffee (15.0%MC) when buying from FT3
farmers.
- Ugsh.1,164/=per kg of FAQ coffee (14.4%MC) when buying from MT2/3
middlemen traders.
- Ugsh.1,148/=per kg of FAQ coffee (14.2%MC) when selling to exporter.
The problems with transaction prices in the liberalized coffee trade in Uganda are
that:-
- Lower level trading prices translated downwards from the buying prices for
FAQ fixed by the exporter in Kampala, probably guided by the international
market price of green coffee and the Bank of Uganda US$ exchange rate.
- Each exporter tends to set his own price, probably basing on competitive
advantage and how or where he sells the coffee. For example, on one day of
trading, 11 exporters fixed prices at Ugsh.1,085, Ugsh.1,100, Ugsh.1,120,
Ugsh.1,130, Ugsh.1,130, Ugsh.1,130, Ugsh.1,140, Ugsh.1,1,60 and
Ugsh.1,180.
- The prices fluctuate almost daily. The case of one trader selling to one of the
exporters over months is presented in Table 25.
Many of the traders interviewed said that a number of times they have to sell
coffee at prices lower than they bought it due to the frequent upwards and
- 27 -

downwards changes in prices at the different supply levels and that it made
planning and accountability of the business very difficult. They also pointed out
that this could be the major source of cheating and coffee adulteration
behaviours/practices attributed to some middlemen.
The factors identified as having influence on price when buying/selling coffee
actually translated from the expectations of the exporter. All the coffee traded
had to end up at the exporter and he implements penalties (Table 25) and sets
criteria for rejection of coffee (Table 8).
The same factors as identified under farmers (Section 3.3.1) also applied to
middlemen traders.
(iii) Choice of buyer when trader is selling
The most important criteria when selling appeared to be price and almost all of
the traders interviewed asserted that they sell to buyer offering the best price at
the time of selling. The consultant verified this when it was actually found, even
from the lists of S1 suppliers obtained from exporters, that one supplier dealt with
many exporters.
Therefore, in the present work, it did not appear very important to directly link
particular suppliers to a specific exporter.
The fact that some of the S1 traders sold their coffee to exporters who were not
offering the best price at the time (Table 2 – 7) could be either that the trader
lacked full price information or that some of the traders were lying about their non
exclusive sales to a particular buyer.
- 28 -

(iv) Traders’ views about coffee quality and criteria for rejecting coffee
when buying
The views aired were that coffee quality was lost due to:-
- Poor coffee husbandry due to poverty of most farmers leading to lack of farm
inputs and inadequate or even non-existent extension services leading to poor
agricultural practices.
- Non-appropriate harvesting and postharvest processing, leading to too many
immature, black and chalky white beans and inadequately dried (wet) kiboko
or FAQ, due to lack of knowledge (poor information network, weak
extension services), lack of finance (no appropriate credit schemes for coffee
producers and middlemen traders), lack of appropriate drying and storage
facilities and skills (no money, lack of effective training).
- Lack of adequate incentives to produce safe and quality coffee because the
production costs are high, the prices are low and there is no premium for
quality.
- Poorly designed and implemented coffee laws, rules and regulations which
allowed some operators, such as middlemen and exporters to operate the way
they want, leading to cheating of farmers on price offered for their coffee and
the massive trading in wet coffee through the chain, culminating in exporters
drying FAQ coffee in driers, which never happens elsewhere in the coffee
world.
- The malpractices of some middlemen who buy and heap coffee with no
sufficient capacity and skill to dry or store un-dried coffee cherries.
- The cheating behaviours of middlemen traders and exporters in the
determination of wetness and inequitable application of deductions on gross
volumes of coffee sold.
A number of these points have actually been verified in this study and also in
previous studies by the same consultant.
- 29 -

The consultant never witnessed any coffee being rejected by a buyer during the
study.
From discussions at different levels, the criteria for rejecting coffee when buying
included:-
• At export level (Table 8):-
- Very wet FAQ of MC > 17%. But coffee with MC > 20% was found
in S1 samples and the regulation is MC > 12.5%.
- Smelly coffee; such coffee must have been badly handled and
probably infested with mould and OTA contamination and therefore
unsafe and poor quality.
- Too many foreign matter (stones) and BHP. This would be
adulteration of coffee. It has been alleged that some traders
deliberately add stones and BHPs to cheat on mass.
• At S2 and S3 levels:-
- Smelly coffee.
- Too many stones, immatures, blacks, BHP and chalky white in FAQ.
- Too many empty pods in kiboko as in the case of diseased coffee.
Moisture content did not appear to be a very important factor since a deduction
was applied and the buyer just dried the coffee after purchase. The buyers
required coffee of MC < 20% desirable as discussed in Section 3.1.1.
(v) Quality tests carried out during the transactions
At the S3 level, coffee was inspected using experience and eyes only, unless
buying was transacted at a hulling station where there was a moisture meter for
FAQ coffee.
- 30 -

The buyer examined coffee for foreign matter and defects visually, smell by
olfaction and wetness by biting or rattling. Some operators used scissors. They
used hands to feel the weight.
At the S2 level, the buyer usually had access to a moisture meter when buying
FAQ brought to a hullery. Screen retention could also be possible here because
most hullery operators have the recommended set of screen sieves. Defects and
foreign matter were assessed visually just like the S3 buyers.
No care was put on the cleanness of the PP bags, which contain the coffee. Most
of the PP bags were in a sorry state with many holes and very dirty after many
rounds of use.
(vi) Traders’ view about farmers’ groups and fixed trading relationships
The same views as discussed under Section 3.3.1 were expressed.
(vii) Marketing information available and what is needed
A certain amount of information about international market prices was read from
newspapers from time to time. The UCDA runs some programmes on radio and
TV. Some information can be obtained from mobile phones. Also some training
courses had been conducted but only in some districts like Masaka. However,
most traders felt that this was not enough just as discussed under farmers (Section
3.1.1).
The main problem was that it was difficult to know the correct price each day
when buying. The request was that prices set by exporters be announced daily on
FM radios so that each trader is made aware of the changes and adjusts
accordingly.
- 31 -

b) Handling of cherry drying and redrying by MT1, MT2 and MT3 middlemen
traders
The study obtained formation on:-
- Cherry drying period
- Drying surface and adequacy of drying area
- Ways of telling end of drying
- Views on widespread use of moisture meters
- Technical advice required
(i) Cherry drying period
Drying of wet cherry was normally accomplished within 5-10 days (about 88% of
cases) just like it was observed for the farmers and only a few cases (6%) reported
taking over 10 days.
Re-drying of inadequately dried kiboko generally required 2-3 days.
However, judging from the average moisture contact of about 20.1%wmb for the
MT1 samples collected (Table 13), it would appear that there is a lot of under-
drying of the kiboko.
(ii) Drying surface and drying area adequacy
Most of the MT1 and MT2 middlemen traders (65%) dried on bare soil and had
no tarpaulin, while the rest dried on tarpaulin or tarpaulin plus soil.
About 14% of the traders expressed in adequacy of drying area, particularly in the
cases where tarpaulins were employed as the drying surface. None of the
operators sampled employed raised table or concrete barbecue.
(iii) Ways of telling end of drying
The most common method of determining wetness was that of experience,
particularly for MT1 traders, because moisture meters were considered too
- 32 -

expensive to be owned. The traders could recognize dried cherry by rattling or
cutting/biting or examining the colour of the bean when removed from the husk.
Dried beans were Khaki in colour, hard to bite and moved about when the dried
cherry was shaken making a rattling sound. Similar views about widespread use
of moisture meters as has already been discussed (section 3.3.1 (f) vi) were held.
c) Storage of kiboko coffee and FAQ
Information was gathered concerning length of storage, where, how and why
coffee was stored.
(i) Storage conditions for kiboko
Apart from MT1 traders who handled only kiboko coffee, the other categories of
traders (MT2, MT3 and MT4) handled both kiboko and FAQ. However, MT2 and
MT3 traders stay with FAQ for only a very limited time since the coffee is sold
once the kiboko is hulled to FAQ. It is the MT4 middlemen traders who take longer
time with FAQ coffee.
For MT1 middlemen traders, storage conditions were found to be as follows:-
Operators
Pp bags in uncemented (Mud-walled) family house - 8/9 (89%)
Pp bags in uncemented (Mud -walled) store - 1/9 (11%)
There was no storage in heaps in a store or own house for the coffee samples.
Most of the storage was in PP bags in the main house with uncemented floor/walls.
The storage periods were:-
Pp bags, mud -walled house: < 1 month - 6/9 (67%)
1-2 months - 2/9 (22%)
> 2 months - 1/9 (11%)
Pp bags, mud-walled store: > 2 months - 1/9 (11%)
1- 2 months - 0%
< 1 month - 0%
- 33 -

Therefore none of the coffee sampled had been carried forward from a previous
coffee season and most of it had not been stored for more than 2 months before
selling.
For the 15 MT2/3 middlemen traders sampled (Table 6), the kiboko coffee held
before hulling was stored for varying weeks not exceeding 1 month. All storage
was in form of pp bags (100% of operators) mostly kept in the family house (67%
of operators), which had either cemented floor (6/15 of operators) or mud (soil
floor 4/15 of operators). A few of the operators (33%) had specially built stores,
which were either mud-walled/uncemented floor (1/15 of operators) or cemented
floor (4/15 of operators).
(ii) Factors influencing traders’ decision to store coffee rather than selling
it immediately it is ready
As in the case of farmers (Section 3.3.1 g (iii) ) the reasons for not selling straight
were:-
- Speculations for higher coffee prices in near future
- To use coffee as a form of bank to store their money.
- To avoid losses by not selling coffee at lower price than the equivalent of
what it was bought due to the daily fluctuations in price.
(iii) Handling of FAQ
The sources of FAQ were the farmers (FT3) and the traders (MT2/3) who hulled
coffee.
Judging from the moisture content of samples (Tables 4, 6, 13 and 15), a high
proportion of the FAQ coffee passed on to MT4 middlemen traders or S1 suppliers
was inadequately dried and required drying down to about 13.0%MC to avoid
wetness deductions when selling to exporters.
- 34 -

For the 18 MT4 middlemen traders sampled, 14/18 (78%) had to re-dry the FAQ
for 1-3 days on tarpaulins in the sun.
All the 18 MT4 traders had cemented floor stores, where the FAQ was either
heaped (6% of cases) or stored in PP bags (94%).
(iv) Hulling and transport expenses to exporters
On average, a hulling fee of Ugsh.25/= was paid but in Masaka region, some
hullery operators charged as high as Ugsh.30/= and as low as Ugsh.20/= may be
due to level of demand and supply.
The rate for transporting FAQ from Jinja/Kamuli area to Kampala was given as
Ugsh.15/= per kg using covered trucks. For transportation from Masaka to
Kampala, traders hired trucks at a rate of Ugsh.30/= per kg.
Some exporters had agent buying stores in the districts. Some of the S1 suppliers
sold coffee there. The cost of transport from the hullery or S1 suppliers’ store to
the exporter agents’ store depends on the distance as explained for the FT2/3 and
FT3 farmers (section 3.3.1).
3.3.3 Practices and problems at export level
Information concerning exporters was gathered on the following aspects:-
- Quality tests/checks carried out when buying FAQ.
- Characteristics of coffee that may be rejected when buying.
- Ideas about coffee quality and what needs to be done.
- Buying price for FAQ and factors, which influence price when buying.
- Handling of inadequately dried FAQ and its implications for traders and farmers.
Most of the coffee exporters are located in and around Kampala and trade in FAQ coffee
supplied by S1 operators who may be farmers (R0 Cases) or middlemen traders (R1, R2
and R3 cases).
Selected socio-economic data about three representative exporters is given in Table 8.
- 35 -

a) Quality tests/checks carried out when exporter is buying
The following procedure was commonly practiced by the exporters visited:-
1. Negotiations between supplier and receiving office of the exporter to agree
on sale/purchase and acceptable price took place.
2. If both exporter and supplier agreed, then the truck of coffee was moved to
the reception area where sampling and recording of weights took place.
Each bag in the lot was sampled, using a coffee trier, as it was off-loaded
from the truck. About 6 bags were weighed together each time.
3. The coffee sampled from the lot was mixed up and taken to a laboratory to
determine physical characteristics.
4. In the laboratory, moisture content was determined using a Sinar moisture
meter. Screen retention was determined by manual sieving in a nest of test
screens, usually Sc 18 on top followed by Sc 15 then Sc 12 and bottom
receiver.
5. A sample of the coffee was taken for the buying manager for himself to
see and assess using visual and olfactory means.
6. Determination of bean defects (%w/w) and foreign matter (%w/w) was
conducted and total deductions worked out.
7. A report was made on a form by the buying Manager or Director.
8. More discussions between supplier and buyer took price, usually
concerning the deductions and to seek consent of the seller before a final
payment document was issued.
9. If the coffee was considered wet, then it was transferred into drying silos
and calculated mechanical drying carried out. If the coffee was considered
dry, then it was fed into the export grading system of machines to obtain
grades
10. Those companies with a coffee liquoring laboratory also subjected the
office to organoleptic test to determine cup-brew quality.
- 36 -

(b) Coffee rejection criteria
The characteristics of coffee that could be rejected by exporter were given as
follows:-
- Smelly coffee.
- Too wet coffee. The moisture content for rejection varied from MC > 15%
to MC > 20%.
- Over-mixed coffee with too many BHPs, stones and pods. Defects > 78%.
However, the Consultant did not see any rejected coffee. Some S1 samples
collected had moisture levels > 20%MC; meaning that the set criteria was not
being followed strictly.
c) Ideas about coffee quality
All the exporters interviewed pointed out that farmers were not carrying out
harvesting and drying properly and that farmers therefore needed training to
reduce on the high levels of wetness and physical defects and foreign matter in the
coffee supplied. They said that kiboko should be fully dried before it is hulled.
Exporters also suspected that some traders were deliberately adding stones and
BHPs to coffee for purposes of reaping huge profits.
(d) Factors which influence price when exporters are buying
Information on this topic has already been presented in this report in Section
3.3.1.
(e) Redrying of FAQ
Most of the exporters visited had a mechanical drier installed for drying FAQ.
This was a result of dealing in inadequately dried coffee.
Acceptance of wet FAQ and redrying it encourages farmers and traders not to dry
coffee completely before selling or reprocessing (hulling).
- 37 -

3.4 Conclusion
3.4.1 Coffee husbandry
From the results of this study, it may be concluded that:-
- In Uganda, coffee is mainly grown on smallholdings below 5 acres.
- Inter-cropping coffee with other crops, particularly bananas and vanilla, is
practiced to some extent, particularly in the Masaka and Mukono areas.
- The use of farm inputs such as manure and commercial fertilizer is very
limited.
- The coffee trees are old.
- Many coffee farms are not well attended to in terms of weeding, pruning,
mulching and so on.
This state of affairs does not easily lend itself to good agricultural practices or
having coffee plants of high vigour with high yield of sound coffee cherries to
process.
The major constraints on the farmers appeared to be:-
- Lack of money (poverty) to invest into better farming methods.
- High cost of inputs which is not readily affordable.
- Lack of technical know-how because the extension services are weak or
lacking in some areas and access to correct and useful information is
difficult.
- Small and fragmented plots of land.
The opportunity the farmers have is the favourable, climate which can enable
them grow alternative crops to feed themselves and also to augment family
incomes.
- 38 -

3.4.2 Coffee harvesting
The following conclusions could be drawn from the results:-
- Coffee cherries are mainly harvested into baskets and/or budeyas. The other
materials which can be used are mats and plastic containers.
- The main source of labour is the family (children, relatives and wife).
- Many farmers pick the cherries unselectively, carrying a high proportion of
immatures. This is not a good practice because the immature beans could
turn into black beans or floats as well as causing astringent taste in the brew
and thus quality reduction.
- A significant proportion of farmers (32%) delayed drying after harvesting.
This is not a good practice because it could lead to rotting or fermenting of
the bean inside resulting into undesirable bean defects after drying and
adverse taints in the liquor of brewed coffee.
Secondly, a delay of 4 or more days promoted mould growth and this could
promote OTA infection or contamination of the coffee.
The major constraints to the farmer appeared to be:-
- Lack of adequate finance to hire labour for harvesting and to buy more
suitable materials for use in harvesting, such as tarpaulin to cover the ground
and avoid cherries falling onto the soil.
- Lack of proper guidelines for harvesting.
- Lack of knowledge about OTA contamination and its hazardous effects.
Some farmers have had training opportunities through seminars and broadcasts by
UCDA. This has helped but it has not been enough.
- 39 -

3.4.3 Coffee drying
The following conclusions could be drawn from the results:-
1. Drying was deficient in that the cherry coffee was not adequately dried to the
desirable and regulatory moisture content of 10 – 12.5%MC for conservation
before hulling and instead the FAQ coffee so produced was redried either in the
sun or in mechanical driers by middlemen and exporters.
2. Liberalization in trader has brought about vertical integration of operators and the
shift in roles so that exporters and traders now share the role of farmers in drying
coffee.
3. Drying of cherry coffee was mainly on soil (bare ground).
This is not a good practice because it makes coffee dirty and contaminated,
possibly with undesirable moulds and even OTA.
4. Only a few farmers afforded the use of more expensive materials or surfaces such
as raised table, tarpaulin or concrete barbecue and hired labour for drying. Even
then, such farmers experienced shortage of drying space.
5. No moisture meters were being used to monitor cherry drying mainly because
existing moisture meters were too expensive for the operators and the ones
available did not give reliable results with berry coffee (kiboko or semi-dried
kiboko).
6. The farmers and low-level traders relied on their accumulated experience to tell
end of drying to kiboko. Level of wetness could be deduced from hardness of the
bean, colour of the bean and rattling of the beans inside the dried cherry.
7. In the regions sampled, drying to kiboko required about 5 – 10 days in good
sunny weather.
3.4.4 Coffee storage
Storage of kiboko was quite often improper in that the coffee stored was at relatively
higher and non-optimal moisture content level for storage, coupled with storage for long
periods (1 – 3 months) in PP bags without properly built stores.
- 40 -

However, the operators handling FAQ tended to hold it for quite shorter periods (< 1
month) and under relatively better conditions since stores were used and most of them
with cemented floor.
The fact that prices fluctuated was one factor among others causing operators to store
coffee rather than selling it straight.
3.4.5 Hulling and transportation
Whether to hull and sell FAQ or not, depended on a number of factors; the major ones
being:-
- Proximity and affordability of hulling fees and transport expenses for the coffee.
- The need to have better returns.
3.4.6 Buying and selling coffee
The following conclusions could be drawn:-
1. Buying and selling coffee was complicated by the frequent changes in price and
lack of real time information concerning price in most areas.
2. It was because of the fluctuating prices and the need to make profits that was
greatly responsible for the buying/selling malpractices such as cheating by
adulteration with stones and BHPs.
3. Decline in safety and quality of coffee in Uganda has been perpetuated by
inequitable application of deductions and accepting wet coffee by the exporter.
4. The marketing system does not provide sufficient incentives for quality
production as the same price is used for both bad and good coffee of the same
type.
- 41 -
3.5 Recommendations
1. There is need for government to find ways of assisting farmers and small-scale
coffee traders with money or subsidized facilities or inputs to improve coffee
husbandry, coffee harvesting and on-farm post-harvest processing and handling.
2. There is need for UCDA to strengthen establishment and implementation of
coffee regulations and by-laws.
3. There is need to improve on coffee extension services and access of price and
marketing information to coffee chain operators at different levels.
4. There is need to continue on the search for moisture meters appropriate for use by
farmers during drying and selling kiboko coffee.
5. There is need for collecting more socio-economic data and subsequent analysis to
understand more about the practices and behaviours of chain operators.
- 42 -
4.0 PHYSICAL ANALYSIS OF SAMPLES AND ASSESSMENT OF LINKAGES
4.1 Introduction
Moisture content (%MC) and water activity (Aw) were determined for each sample
gathering during the chain survey.
Water activity and moisture content are important parameters in preservation of stored
foodstuff as they are related to biochemical and microbiological stability or activity of the
food item.
The main interest in determining %MC and Aw of the chain samples was to establish the
amount of drying at each stage in the chain for the two routes (R1 and R3) under study
with a view to finding any of the following aspects:-
1. Coffee Sale Price
2. Trader function
3. Transaction or supply level.
4. Fungal contamination rate
5. OTA contamination rate
The first three aspects are discussed in this section while fungal and OTA linkages are
discussed in Section 5.0, which follows next.
4.2 Methodology
4.2.1 Determination of % m.c. and Aw
The procedures for moisture content and water activity determination were
exactly as described in Section 2.2.9 of this report.
- 43 -

4.2.2 Analysis of variance
ANOVA was employed to analyze variance to assess any possible linkages.
4.2.3 Comparison of prices of different types of coffee
The money obtainable from 1MT of fresh cherry equivalent was calculated basing
on the conversion ratios from accumulated data by the UCDA, the average
moisture content and price of fresh cherry and actual %MC and price of each
sample (Table 16).
The mass of 1MT cherry was converted to equivalent mass of kiboko or FAQ at
MC = 12.5% (wmb). Then the equivalent mass at the actual %MC (wmb) of the
sample was calculated. Finally, the money equivalent using the price of the
sampled coffee was obtained and the averages based on samples in each trader
function group determined for the comparison. The outturn conversion ratios
used were:-
1. Dry kiboko to fresh cherry = 0.39.
2. Dry clean coffee (FAQ) to kiboko = 0.54
3. Dry clean coffee (FAQ) to fresh cherry = 0.21
4.3 Findings
4.3.1 Results for Aw and %MC at different supply levels
The results of Aw and %MC is given in Table 9 for S1 samples, Table 10 for S2
samples, Table 11 for S3 samples and Table 12 for S4 samples.
For the analysis of variance using %MC (oven) wmb or dmb, the supply level had
a significant effect (p < 0.001) on %MC. The highest moisture content was
obtained at S4 level and the least at S1/S2 levels as shown below:-
- 44 -

Grand mean = 18.1
Supply level S1 S2 S3 S4
Means 14.5 14.5 18.7 27.5
Replicates 23 24 13 17
s.e.d = 3.25
Thus there was no effective drying at the S3 and S4 levels.
4.3.2 Link between moisture content and transaction circuit (routes) and levels
interactions
Table 14 gives the means for the different routes and levels of coffee.
The transaction circuit had a significant effect (p < 0.001) on %MC. The highest
%MC was at S4R3 and the lowest at S1R3. The %MC for S1R1 was higher than
that of S1R3 and also that of S2R1 was higher than that of S2R3 as shown
below:-
Transaction level (interaction) S1R1 S2R1 S1R3 S2R3 S3R3 S4R3
Means (%MC) 15.0 15.2 13.8 13.8 18.7 27.5
s.e.d = 3.81 (Replicates) 13 12 10 12 13 17
Thus the length of the route has an influence on %MC of coffee.
In the long route there are subsequent drying each time the coffee changes hands
and more checks whereas with the short route the %MC relies on the
effectiveness of one or two suppliers. This may explain why the longer route
results in lower average moisture
4.3.3 Link between moisture content and trader function
Table 13 gives the MC% (wmb) of samples from different types of traders,
including farmers.
- 45 -

The trader function had a significant effect (p < 0.001) on %MC.
For farmers, the highest %MC (wmb) was obtained at FT1 and lowest at FT3.
For the middlemen traders, the highest %MC was obtained at MT1 and the lowest
at MT4 as shown below:-
Grand mean 17.99
Typology of traders
Typology of traders FT1 FT2 FT3 MT1 MT2 MT3 MT4
Means (%MC) 60.15 17.76 15.01 20.10 19.60 14.06 13.36
Replications 4 15 16 9 1 14 18
s.e.d = 3.403
It would appear that the results indicate that the drying to kiboko is not effectively
carried out and neither is the subsequent storage. There is redrying of FAQ and
very little storage leading to lower moisture.
4.3.4 Link between moisture content/trader function and price
Table 16 gives the prices for different coffee samples falling under different trader
function groups and different moisture content means. The means were:-
Trader function FT1 FT2 FT3 MT1 MT2/3 MT4
Moisture content (%MC) 60.2 17.8 15.0 20.1 14.4 13.6
Price (Ugsh./kg) 200 483.3 1156 496 1164 1197
The money obtainable from 1 MT of cherry after applying the conversion as described in
methodology gave the following means:-
- 46 -

Typology of traders FT1 FT2 FT3 MT1 MT2/3 MT4
Money obtained (Mean, Ugsh.) 200,000 266,313 290,940 306,890 281,145 273,651
s.e.d = 3.403 4 15 16 9 15 18
The trader function or moisture content (p = 0.025) on the price.
For farmers, the price for 1MT cherry was highest at FT3 trader function (or 15.0 %MC)
and lowest at FT1 trader function (%MC = 60.2). The higher the moisture of the coffee,
the lower was the price benefit.
For middlemen traders, the highest price was obtained at MT1 and lowest at MT4.
This effect was the reverse of what was observed with the farmers. The explanation
might lie in the abnormally high %MC mean at MT1.
4.4. Conclusions
The analysis of variance indicated that all the following factors had significant effects on
%MC of coffee:-
- Length of route: The longer route (R3) favoured lower moisture contents of coffee
than the shorter route (R1) when samples at the same supply level were compared.
- Supply level: Moisture content reduced from S4 to S1 in route R3 and S2 to S1 in
R1.
- Trader function: Kiboko coffee was being traded at higher %MC levels than FAQ.
The link between trader function or %MC and price means that the farmers who dry or
dry and hull get better returns from the coffee but this does not take into account the
drying effort/expense, the cost of hulling and transportation.
The reverse effect for the link between trader function/%MC and price for middlemen
traders is a bit disturbing and needs more carefully worked out consideration and
reinvestigation.
- 47 -

4.5 Recommendations
There is a need to pursue the work on moisture content and influence of structure and
functioning of the chain.
- 48 -

5.0 ASSESSMENT OF EVOLUTION OF MOULD AND OTA CONTAMINATION
5.1 Introduction
Apart from %MC of coffee and price, the other set of important technical data obtained
was that of fungal and OTA rates of contamination. The data on mycology and OTA
analysis was sought with a view to finding out the relationships between contamination
rate and each of the following factors:-
1. Moisture content
2. Trader function
3. Supply level
4. Coffee circuit/route
5.2 Methodology
The procedures employed were those described in Section 2.2.8 of this report.
Statistical analysis was carried out using ANOVA.
5.3 Findings
5.3.1 Fungal species and infection rates
Tables 17 – 20 give the fungal species and percentage infection rates for the
samples taken at exporter, S1, S2 & S3 levels to cover suppliers S4 – S1, for route
R3 and S2 – S1 for route R1.
All samples contained A.niger at high infection rates.
Only 35/76 of the samples (47%) did not have A.ochre. It is considered that
A.ochre is one of the major sources of OTA contamination in coffee.
- 49 -
5.3.2 Results of OTA determination
Table 21 gives the contamination levels of OTA in the chain survey samples. The
consultant had not got results for 10 samples at the time of writing this report.
OTA contamination was detected in all the samples submitted for the test.
5.3.3 Link between fungal contamination rate and moisture content (Table 22)
No correlation was found between %MC and A.ochrecious contamination.
5.3.4 Link between OTA contamination and % m.c. (Table 22)
No correlation was found between %MC and OTA contamination.
5.3.5 Link between contamination rate (OTA, A. ochraceus) and trader function
(Table 22)
The trader function had no effect on either OTA (p = 0.329) or A.ochre
(p = 0.704).
5.3.6 Link between contamination rate (OTA, A.ochre) and supply level/route
(Table 23)
No effects were detected from statistical analysis.
5.3.7 Link between contamination rate (OTA, A.ochre) and supply level
(Table 24)
The supply level and route had not effect on OTA or A.ochre contamination rates.
5.4 Conclusions
5.4.1 Evolution of fungal contamination
No relationship was found between fungal contamination rate in terms of A.ochre
and %MC, trader function, routes and levels. Therefore no suggestions could be
given about evolution of fungal contamination.
- 50 -

5.4.2 Evolution of OTA contamination
No relationship was found between OTA contamination rate and %MC, trader
function, routes and levels. Therefore no suggestion could be given about the
evolution of contamination.
5.5 Recommendations
The work on mycology and OTA relationships with aspects of the structure and
functioning of the chain required a lot more effort in designing hypothesis before more
meaningful results can be derived.
- 51 -

Table 1: Typology of traders (including farmers) and their relative functions (Commercial and Technical activities).
What Coffee Where? Stakeholder/Trader Typology/Trader function
Major activities
FT1 Selling FC, not drying
Farm management, picking, transferring FC to drying yard/store, storing FC/SDC before selling. Negotiating price.
FT2 Selling DC, drying
As for FT1 plus drying, raking/turning, protection from showers/dew, determining end of drying, storing DC before selling. Negotiating price.
Farm Farmer/Producer
FT3 Selling FAQ drying and hulling
As for FT2 plus storing DC before hulling, bagging in PP bags, transfer to hullery/processor, pay hulling fee, bagging FAQ, store FAQ before transferring to middleman or export agent for sell. Negotiating price.
MT1 Buying FC/SDC, Selling DC, drying not hulling.
Buying FC/SDC, drying to DC as for FT2 and storing DC before selling. Negotiating price.
FC/SDC (Cherry)
Farm or Middleman’s home/buying store
Middleman/Buyer
MT2 Buying FC/SDC, selling FAQ, drying & hulling.
As for MT1 plus storing DC before hulling, bagging in PP bags, transfer to hullery/processor, pay hulling fee, bagging FAQ, storing FAQ before transferring to another middleman or export agent to sell. Negotiating price.
DC (Kiboko) Home or buying store
Middleman/Buyer MT3 Buying DC, selling FAQ, hulling but not drying. (May redry FAQ).
Buying DC, storing DC (and sometimes redrying) before transferring to hullery/processor to hull, pay hulling fee, bagging FAQ, storing and/or transferring FAQ to another bigger trader or exporter to sell. Redries FAQ (often) to meet next buyer’s moisture demands. Looking for buyer with best price.
DB (FAQ/green beam
Hullery and/or buying store
Middleman/Buyer MT4 Buying FAQ only and selling FAQ not drying, not hulling (May redry FAQ).
Receives and inspects FAQ for moisture (wetness) defects and foreign matter, size of beans before buying. Storing FAQ, bagging and transferring to a higher-level trader or exporter to sell FAQ. Looking for suitable buyer usually one with best price.
FC = Fresh cherry;, SDC = Semi-dried Cherry;, DC = Dried Cherry;, DB = Dry bean, MT1 = Middleman type one, FT1 = Farmer type one and FAQ = Fair average quality.
52

Table 2: Selected Socio-economic information about Farmers FT1 (Produce and sell fresh/semi-dried cherries). Code Location Coffee
farm acreage
Annual production (MT of cherries)
Coffee being sold (MT)
Sale price Ugshs./ kg
Moisture content % wmb
Supply level
Coffee husbandry Harvesting practices
Drying, Storage handling
Labour force
Information access
J 06 Budondo, Jinja
¼ 0.3 0.02 200 61.9 S4R3 Poor, not weeded regularly, no farm inputs like manure, fertilizer. Very old trees > 50yrs.
Use cut jerricans or budeya or plastic container (basin). Non-selective picking.
Sells straight.
Family labour.
No training received.
J 07 Budondo, Jinja
¼ 0.2 0.03 200 60.1 S4R3 No farm inputs like manure or fertilizer. Old trees > 40 yrs.
Uses plastic containers (bowl) plus budeyas. Sells straight. (Same day)
Keeps in basket or cut jerrican and waits or takes to local buyer.
Family/ Self.
No training received.
J 13 Budondo, Jinja
¼ 2.0 0.2 200 60.1 S4R3 No farm inputs like manure or fertilizer. Inter-planted with bananas.
Uses basket or budeyas. Sells immediately (same day).
Keeps in jerrican or basin till buyer comes (sends for him).
Family labour.
No training received.
J14 Budondo, Jinja
¼ 0.5 0.1 200 58.5 S4R3 No farm inputs, inter-planted with bananas, old trees > 20 yrs.
Uses basket or plastic container + budeyas PPbags. Does not dry, sells in 1-2 days time.
Keeps on cemented floor (1-2 days) in house.
Family labour.
No training received.
53

Table 3: Selected Socio-economic information about Farmers FT2. Code Location
Coffee farm acreage
Annual production (MT of kiboko)
Coffee being sold (MT)
Sale price Ugshs./kg
Moisture content % wmb
Supply level
Coffee husbandry Harvesting practices
Drying, Storage handling
Labour force
Information access
J 15 Budondo, Jinja
½ 1 0.1 450 21.4 S4R3 No inputs like fertilizer or manure. Old trees > 40 yrs.
Delays drying 3-4 days. Unselective picking. Uses budeyas + plastic basins.
Dries on bare soil. Bites to tell M.C. Dries 1wk. Sells to buyer with best price once considered.
Family labour.
No training received. Small capital cannot hull.
J 16 Budondo, (Kagera) Jinja
¼ 0.5 0.1 450 22.1 S4R3 No inputs such as fertilizer or manure. Old trees > 40 yrs.
Delays drying 3-4 days. Uses old plastic basins and pails.
Dries 1wk., bare soil. Stores, Sells once dry or buyer accepts.
Family labour force.
Listens to UCDA radio programs. No extension services.
K 06 Kasambira, Kamuli
3 2 0.5 450 19.6 S4R3 No farm inputs like fertilizers.
Dries straight, tells M.C. by experience.
Dries 7days, cemented area. Stores on cemented floor in house for 2-4wks.
Family labour.
Gets info from phone & radio programmes. Poor extension services.
54

K 07 Kasambira, Kamuli
3.5 2.5 1.0 450 20.1 S4R3 No inputs like fertilizer or manure. Trees 10-20 years.
Dries straight. Tells M.C. by experience. Stores for 1month or until there is critical money need.
Dries bare soil, 7 days. Stores in PP bags/baskets 1-2 weeks.
Family labour
Listens to radio UCDA programs, poor extension services.
K 08 Kasambira, Kamuli
3.5 3 0.8 450 21.0 S4R3 No farminputs like fertilizer. Old trees > 30 years
Uses baskets, budeyas or plastic containers. Selective picking encouraged.
Dries 7 days on bare ground. Stores 1-2 months in PP bags.
Family labour
No training. Extension weak.
K 09 Kasambira, Kamuli
4 3.4 0.5 450 19.0 S4R3 - do - - do - Dries 1wk., Bare ground. Stores in PP-bags/baskets 2-4 wks.
Family labour
No training. Needs more info on prices.
M 09 Kasawo Mukono
1/4 0.2 500 11.6 S4R3 No farminputs. Old trees > 40 yrs.
Uses budeya, baskets. Selective picking encouraged.
Dries 5-10 days, bare soil. Sells once dry.
Family labour
Listens to UCDA radio/T.V. programmes Extension weak.
M10 Bwegire Mukono
½ 1 0.5 500 11.6 S4R3 No farm inputs such as fertilizers. Old trees > 50 yrs.
Uses baskets, budeyas. Dries straight on bares soil.
Dries 5 – 10days on bare soil. Sells once dry.
Family labour
Listens to UCDA radio/T.V. programmes
55

M 11 Bwegire
Mukono ¼ 0.6 0.2 500 11.5 S4R3 No farm inputs
such as fertilizers. Old trees > 40 days
Uses budeyas, baskets, mat. No delayed drying.
Dries 5-14 days on bare soil. Sells once dry.
Family labour
Needs info on prices wilt disease.
M 12 Bwegire Mukono
¼ 0.8 0.1 500 11.5 S4R3 No farm inputs such as fertilizers. and manure.
Uses baskets/budeya. Dries straight.
Dries 5-10 days, bare ground. Sells once dried.
Family labour
Needs info on moulds, prices & wilt disease.
M 15 Bukoto (Buwunga) Masaka
1.5 0.6 0.2 500 17.0 S4R3 No farminputs as fertilizers, old trees > 40 years.
Uses baskets or budeyas.
Dries on bare soil. Stores 1-2 wks., basket/PP-bags, non-cemented floor.
Family labour
No training so far.
MA 16
Bukoto (Buwunga) Masaka
4 1 0.3 500 20.9 S4R3 No farminputs, old trees > 30 yrs.
Uses basket or plastic container. Delays drying 3 days.
Dries in thick layers, 1wk. Stores 1wk in house, and PP bags.
Family labour
Listens to radio programmes by UCDA.
MA 19
Bukoto (Kasaka) Masaka
1 1.5 0.08 500 19.2 S4R3 No farminputs, traditional robusta, intercrop beans.
Uses baskets or budeya. But mixes separate harvests.
Delays drying 3days. Dries on bare soil, 1wk. Stores 1wk, baskets, and PP bags.
Family labour
No effective extension work.
56

MA 21
Bukoto (Kasaka) Masaka
2 0.7 0.1 500 17.1 S2R1 No farminputs 50yrs old.
Uses basket, budeya or plastic container. Dries straight, mixes separate harvest.
No delays. Dries on bare soil. Stores 1-2 months.
Family labour
Extension serves weak.
MA 22
Bukoto (Buwunga) Masaka
2 0.5 0.08 500 22.8 S2R1 No farminputs, inter-planted with banana. Old trees.
Dries straight but mixes succeeding harvests. Stores 2-4 wks. PP bags.
Dries on bare soil, 1wk. Stores 2-4 wks., PP bags.
Family labour
Extension serves weak.
57

Table 4: Selected Socio-economic information about Farmers FT3 Code Location Coffee
acreage Annual produ-ction MT FAQ
Coffee on sale (MT)
Sale price Ugshs./ kg
M.C. % wmb
Supply level
Coffee husbandry Harvesting practices
Drying/ Storage handling
Labour & Expenses
Knowledge
J 04 Wakitaka, Jinja
½ 3 0.8 1,050 15.7 S2R1 No fertilizer, manure, herbicide, mulch. Banana intercrop, old (> 40 yrs) trees (traditional). Weeded.
Uses baskets and budeyas. Quite selective.
Dries immediately, 5-10 days, tarpaulin plus soil.
Family labour hulling 25/= per kg.
Has very good ideas about quality.
L 01 Luwero (Kasaala) Luwero
2 0.3 0.1 1,180 10.7 S2R1 Inter-planted with vanilla, banana. Old traditional trees + new 2½ yrs. Wilt diseases. No fertilizer/herbicide use.
Uses budeya (PP sheets). Pick from ground. Unselective.
Stores 1month, PP bags, cemented house. No M.C. meter, sells as it dries. Keeps in PP bags. Dries 5-10 days (tarpaulin)
Close to hullery. Household. Transport 1,000/= per bag hullery.
Training by plan interna-tional
58

L 02 Luwero
(Kiwogozi) Luwero
½ 6 0.3 1,220 12.8 S2R1 40yrs old trees. Uses cow dung, Wilt disease. Bananas intercrop.
Uses budeya, selective picking no delayed drying.
No M.C. meter bites/rattles. Dries on mat, 1wk. Sells once dry.
Family labour, transport 1,000/= per kg. Hulling 25/= per kg.
No training attended.
M 03 Namaliiri, Mukono
2 1.0 0.3 1,150 12.9 S2R1 No inter-cropping. No herbicide/ fertilizer use. Old trees > 30 years.
Uses baskets & budeyas. Quite uniform berries.
No M.C. meter, bites/ rattles to tell M.C. Dry 5-10days, bare soil. Stores 1-2 months, PP bags, ceme-nted store.
Family labour. Sales at hullery. Hire transport to hullery.
Price info Unsatis-factory, better announce on radio daily.
M 05 Kambogo, Kayunga, Mukono
3 0.3 0.1 1,200 13.6 S2R1 Vanila/bananas intercrop with clonal.
Dries straight, tarpaulin/ Concrete/ budeyas.
1% reduction for quality. Bites to tell M.C. Stores, heap 2-3 months, concrete floor.
Hulling 20/= per kg.
Lacks info on OTA, prices.
M 06 Kyampisi, Mukono
30 11 2 1,200 18.1 S1R1 Clonal10acres 1986. Nganda > 50 years. Banana/vanilla intercrop.
Waits to over ripen, budeya. Non-selective picking. Delay 4- 5 days.
Dry 2wks, tarpaulin. Stores kiboko 6 months, hulls when selling.
Hires labour for harvest-ing & drying.
Lacks info on market trends/predictions.
59

MA 01
Kabonera, Masaka
4 1 0.2 1,130 17.7 S2R1 Cow dungmanure, baskets, no intercrops. 3 acres, clonal 2 yrs, 1acre Nganda > 60yrs.
Uses baskets, recycles every 2wks. Quite selective.
2wks drying, bare soils, stores PP bags, baskets, 4 months, main house.
Hulling 30= per kg. Transport 500/= per bag to Masaka. Hired labour for harvest-ing/drying.
Training by Associ-ation four times.
MA 02
Kabonera, Masaka
6 2 0.4 1,130 13.8 S2R1 Bananaintercrop, clonal 5yrs, 3 acres. Cow dung/urea.
4 days delay (PP bags). Recycles every 3 wks., baskets
Dry 7 days, bare soil. Clonal 10 days. Store kiboko2 months, PP bags, garage.
Hired labour. Ugsh.30/= per kg., hulling Ugshs.500/= per bags kiboko transport.
Training 3 sessions this year.
MA 04
Bukoto, Masaka
30 80 10 1,180 12.9 S1R1 Bananainterplant, selective picking, clonal 1996.
Hired labour. Baskets/ budeyas. Delay 4 days before drying.
Dried 10 days, bare soil. Stores Kiboko, 600-bag-capacity. 2 months. Sales to exporter with good price.
Hulling 25/= per kg. Hired labour.
Has a lot of experience about coffee.
60

MA 05
Kinoni, Masaka
30 10 2 1,200 12.2 S1R1 Banana/vanilla intercrop. Cow dung manure. 10 years old.
Labour 500/= per basket. Unselective picking inadequate drying capacity.
No M.C. meter. Buyers come with it. Dries straight, tarpaulins. 2 months storage, concrete store, PP bags.
Hulling 30/= per kg. Hired labour.
Have coffee farmers’ associa-tion. Training inadequate
MA 11
Kabonera (Kitanga), Masaka
6 3 1.2 1,160 15.0 S1R1 Clonal 1acre,10yrs. Ngenda 4½ acres 20yrs. Heaps for 1wk before drying.
Uses baskets. Delays drying 1 week.
Stores Kiboko 1 month, heap, cemented floor. Dries 14 days. No M.C. meter.
Hired labour.
Inade-quate training.
MA 12
Bukoto (Buwunga), Masaka
1 0.2 0.06 1,130 16.4 S1R1 Uses cowdung. No intercropping. Old trees.
Uses baskets. Dries straight.
Dry bare soil, 2wks. No M.C. meter. Sells to buyer with best price. 3 months storage Kiboko in PP bags in house
Family labour. 1,000/= per bag to nearest hullery.
Needs info on diseases of coffee, drying techniques
MA 13
Bukoto (Buwunga), Masaka
2 0.5 0.4 1,150 23.3 S1R1 Uses cowdung, banana intercrop & old trees.
Uses baskets. No delayed drying.
3 months storage in PP bags, own house. No M.C. meter.
Hulling. 25/= per kg, transport 1,000/= per bag.
No training so far.
61

MA 14
Bukoto (Buwunga), Masaka
1.5 0.5 0.2 1,140 15.7 S2R1 Banana inter-crop. Old trees (> 30yrs)
Delay 1wk. Uses baskets.
No M.C. meter, dries on bare soil. Stores 1-2 months.
Family labour
No training so far.
MA 20
Bukoto (Kasaka), Masaka
10 10 1.7 1,140 14.9 S2R1 No inter-cropping. Clonal (20yrs). No fertilizers, no herbicide. Some manure.
Delays 4 days before drying.
Dry on tarpaulin plus bare soil. Stores 1month before hulling.
Hired labour.
Training not adequate. Needs market info.
MA 26
Buwunga, Masaka.
7 10 2 1,140 14.4 S2R1 No inter-cropping > 20yrs old. No fertilizers. No herbicide.
Delays 3-4 days before drying. Uses budeyas + baskets.
Dries on tarpaulin + bare soil. Stores, cemented floor, PP bags 2wks before hulling.
Hired labour.
Training not adequate. Needs Price/ market info
62

Table 5: Selected Socio-economic information about Middlemen MT1 Code Location Annual
volume (MT Kiboko)
Volume on sale MT
Sale price Ug.shs/ kg
MC % wmb
Supply level
Buying practices Drying practices Storage practices Selling practices Knowledge
J05 Budondo, Jinja
3 0.5 500 21.7 S3R3 No MC meter,checks for immatures + adulteration (foreign matter)
Dries 5 days, bare soil, thin layers (7cm). Turns at least twice a day.
Stores, PP bags in house, 3-4 days.
Sell to one with good price
No training seminars attended. Needs info on drying, OTA, prices.
J10 Budondo, Jinja
1.6 0.2 450 31.6 S3R3 No M.C. meterused. Checks for green berries and stones.
Dries 3 – 10 days. Keeps in bags every night in house. Adds new coffee to drying coffee.
Stores 3 days, PP bags in house, not cemented.
Buyers come home. Sells to any with satisfactory price.
No training received.
J11 Budondo, Jinja
5 0.5 500 18.5 S3R3 SP determinesBP of FC. Checks lights & immatures, uses bicycle to collect cherries.
Dries 6 days, bare soil, sufficient space. Thin layers.
Stores 1- 2 months in PP bags in family house.
Sells from home to buyer with good price.
Listens to radio programmes by UCDA.
K02 Kasambira, Kamuli
6 1 450 18.8 S3R3 Uses bicycle to look for coffee
Dries 5-10 days on bare soil.
Stores 1-2 weeks, PP bags, family house, uncemented.
Not enough coffee to hull. Sells to buyer with good price.
No training attended.
63

K05 Kasambira,
Kamuli 4 0.5 500 16.7 S3R3 Bicycle
transport. Checks for lights and immatures.
Dries 5-10 days on bare soil.
Stores 1 wk., PP bags, family house, uncemented.
Sell to buyer with good price
No training attended.
MA 03
Kabonera, Masaka
15 4 550 15.0 S3R3 Buys FC at 240/= per kg. Checks for heaviness and immatures.
Dries 7-10 days, tarpaulin plus soil. Clonal takes 15 days.
Stores some in PP bags plus soil, 1wk, mud-walled store waiting for better price.
Sells to buyer with best price to local association.
Training by Local Association.
MA 09
Bukoto town (Kabonera Masaka)
10 1.5 530 16.9 S3R3 Seeks cherriesfarmer to farmer. Buys FC 200/= per kg
10 days drying, bare soil + tarpaulins. Tells MC by experience
Stores 1 day in PP bags, uncemented floor before sale.
Sells to buyer with best price immediately coffee is dry.
No training attended.
MA 24
Bukoto (Buwunga Masaka)
1.5 0.8 530 17.8 S3R3 Checksimmatures. Can deduct up to 1% for quality.
1 week drying, bare soil plus tarpaulin. Tells M.C by rattling.
Mud-walled store, 3 months, PP bags.
Sells to buyer with best price
Listens to UCDA radio programmes
64

Table 6: Selected Socio-economic information about Middlemen MT2/MT3 Code Location Annual
volume (MT FAQ)
Volume on sale MT
Sale price Ug.shs/kg
MC % wmb
Supply level
Buying practices Drying/ redrying practices
Storage/transportation handling services
Processing/Selling practices
Knowledge
J02 Buwenge,Jinja
60 3 1,150 10.5 S2R3 SP determinesBP and fluctuates. Deducts up to 1% if too many immatures. Buys cherry & kiboko.
Household labour. Uses rattling/experience to tell moisture. Dry 7 days, bare soil, inadequate space.
Stores in house, PP bags, 3-4 days.
Sell to one with good price
Can read and write. Market/price info required daily.
J08 Budondo,Jinja
6 1 1,130 18.5 S2R3 Collects onbicycles. Uses bicycles inspects for immature and moisture level. No M.C. meter used.
Inadequate drying capacity. Dries 7days, bare soil. Keeps in house at night.
Stores Kiboko 2 wks, PP bags, family house, cemented.
Hulling Ugsh.25/= per kg. Hires Pickup 20,000/= to Buwenge to hull & sell. Best price.
Can read and write. Market/price info unsatisfactory
L03 Kabakedi,Luwero
5 0.5 1,220 10.6 S1R1 Buys kiboko from farmer to farmer on bicycle, no MC meter
Redries before hulling (2-3 days), Tarpaulin. Inadequate drying space.
Stores Kiboko 1wk. before hulling, stores PP bags, family house, cemented floor.
Hulling 25/= per kg. Pickup hire Ugsh.10 per kg to hullery. Sells best price.
Can read/write English. Radio information. Needs price info daily.
65

M 02 Bwegire,
Mukono 1.5 0.04 1,200 12.1 S3R3 SP of FAQ
determines BP of cherry/ kiboko each time. Tells MC by biting/ rattling. No rejections. Moves by bike.
Dries. Redries on bare soil. Inadequate drying capacity.
20 bags. Stores kiboko 2wks., before hulling, PP bags, cemented floor.
Hulling fee 30/= per kg. Sells at hullery to hullery operator (owner).
Can read/write. No info on OTA/moulds effects. Price info not satisfactory.
M 07 Mugango, Mukono
2 0.2 1,120 15.1 S3R3 Judges MC by experience.
Dries 7days/redries, bare soil. Keeps in house at night.
Stores 1-2 wks., PP bags, family house, un-cemented before hulling & selling.
Hulling fee 30/= per kg. Sells to hullery operators.
Can read and write. Extension services poor. Price info not readily available.
MA 10
Kitanga, Bukoto Masaka
60 5 1,250 13.8 S1R1 Buys kiboko,tells MC by experience. BP depends on SP of FAQ.
Cemented floor redries before hulling.
Stores 1-2 wks. PP bags, family house, before hulling to sell.
Sells at hullery to best price offer.
Does not talk English. Training inadequate.
MA 17
Bukoto, Buwunga, Masaka
2.5 0.2 1,150 15.2 S3R3 Tells moistureby biting. Buys FC & kiboko. Checks for immatures & mouldy berries.
Dries 2wks, bare soil for FC. Redries kiboko.
Stored 2wks, PP bags, family house, before hulling to sell.
Hulling fee 25/= per kg. Transport 1,000/= per bag to Masaka, sells at hullery.
Needs info. on pricing daily not to be cheated.
66

MA 18
Bukoto, Kasaka, Masaka.
10 1.5 1,150 19.2 S3R3 No moisturemeter used. Checks for immatures & adulteration. Pay what others pay.
Dries/redries 2-10 days, bare soil + tarpaulin.
Store 2wks, PP bags, cemented store before hulling to sell.
Hulling fee 25/= per kg. Transport shs.1,000/= per kiboko bag. Sells best price offer.
Needs drying info. Extension poor.
MA 23
Bukoto, Buwunga, Masaka
3 0.1 1,150 15.0 S2R3 Buys Kiboko.Checks by experience.
No re-drying. Store 1 wk., PP bags, family house, cemented floor.
Hulling fee 25/= per kg. transport shs.1,000 per kiboko bag. Best price offer.
Needs drying info. Extension poor.
MA 27
Buwunga, Masaka
4 0.2 1,180 14.3 S2R3 Checksmoisture by experience.
Dries/redries, tarpaulins, 2-10 days.
Store 2 wks, PP bags, cemented store before hulling & sale.
Hulling fee 25/= per kg. Sells at hullery.
Needs regular infor. on prices.
MA 28
Buwunga, Masaka
5 0.3 1,180 14.2 S2R3 - do - - do - - do - - do - - do -
67

M34 Kinoni
Masaka 72 3 1,160 12.6 S2R3 No MC meter,
judges by experience.
Redries, 1-2 days, tarpaulin, inadequate facilities.
Stores kiboko 1wk, PP bags, cemented store.
Hulling 25/= per kg. Transport shs.1,000/=per bag to hullery. Sells straight after hulling.
Need info. on drying, OTA and price changes.
MA 35
Bukoto Kyamuyibwa Masaka
3 0.3 1,160 12.7 S2R3 No meter forMC. inspects for immatures & adulteration.
Redries 1-2 days, tarpaulin.
Stores, family house, PP bags, uncemented floor.
Hulling 25/= per kg. Sells at hullery.
Needs info on drying & price marketing.
MA 36
Kinoni Masaka
3 1.6 1,160 13.0 S2R3 No MC. meter, uses experience.
Redries 1-3 days, bare soil + tarpaulin, inadequate space.
Stores kiboko 2wks, PP bags, uncemented, before hulling.
Hulling fee 25/= per kg. transport shs.35,000= to Masaka. Sells straight.
Needs info. about OTA, drying and prices/ marketing.
MA 07
4 0.8 1,100 19.6 S1R1 No MC meterused. Judges by experience. Buys FC/Kiboko
Dries/redries, 2-10 days, bare soil.
Stores 2wks, PP bags, cemented floor before hulling & sale.
Hulling 25/= per kg. hired transport 1,000/= to hullery. Sells to best price offer.
Needs training on drying and price changes.
68

Table 7: Selected Socio-economic information about Middlemen MT4. Code Location Annual
volume (MT FAQ)
Volume on sale MT
Sale price Ug.shs/ kg
MC % wmb
Supply level
Buying practices FAQ handling Selling practices Knowledge
K01 Kasambira,Kamuli
200 10 1,200 13.4 S1R3 FAQ BP fluctuates with BP of exporter. Measures MC (Sinar), rejects if too wet or many defects judged by eye.
Redries to 13-15% MC on tarpaulin & sun. Inadequate drying space. Store 1wk, PP bags, cemented floor. Transport, covered lorry to Kampala.
Checks with exporters and sells to one with best price. Transport FAQ, covered lorry to Kampala.
Can read and write English. Price information not readily available.
K03 Kasambira,Kamuli
40 3 1,180 14.6 S2R3 Checks MC by biting, rattle & defects/smell by eye/nose. No moisture meter. Buys at hullery and own store up to 1% deduction for wetness plus defects
Redries FAQ to MC acceptable to buyer. Store 3 days, PP bags, cemented floor.
Buyer collects coffee from seller’s store. Sells to buyer with most agreeable price.
Can read/write English. Unsatisfactory extension services. Some training by UCDA. Marketing information lacking.
K04 Kasambira,Kamuli
40 2 1,180 11.7 S2R3 - do - - do - - do - - do -
69

M01 Nakituma
Mukono 800 27 1,220 12.1 S1R1 Checks MC, Sinar
moisture meter. Can reject if M.C. > 16% & too many BHP, blacks. Deducts up to 3% for poor quality.
Redry FAQ (tarpaulin/sun) 1-2 days. Store 3 days, PP bags, cemented floor.
Hired transport (12/= per kg.). to exporter with favourable price.
Can read and write English. Inadequate marketing/ price information. Extension services lacking.
M04 Kasawo,Mukono
80 10 1,210 11.7 S1R1 Checks moisture (Sinar meter) & rejects if M.C. > 14.5%. Buys at own hullery.
Store 1wk., G/bags, cemented store. Redries FAQ (tarpaulin sun). Inadequate drying capacity.
Hired transport exporter. Checks prices and sells to best price.
Senior Secondary educ. Marketing/ price information not readily accessed.
M08 Kasawo,Mukono
1500 15 1,250 11.7 S1R3 Measure M.C.(Sinar meter) & rejects if M.C.>16% or too many detects/smells.
Store 1 wk., cemented floor then PP bags and transport to K’la. Redries FAQ (tarpaulin sun) MC.>13%.
Hired transport to K’la. Sells to exporter with favourable price.
Can read/ write English. Needs info.on OTA/moulds and prices/ external marketing.
L04 800 40 1,250 11.7 S1R1 Measures M.C. (Sinar & rejects M.C. > 16%. Seeks FAQ at hulleries through agents. Price fluctuates.
Store 2wks., cemented floor, bags 1 day before delivery to exporter. Redries on tarpaulin/sun.
Hired transport to K’la.Nego-tiates price & sells to most favourable exporter.
Can read/write English. Price info inade-quate & poor extension services.
70

J01 400 30 1,180 13.5 S1R3 Measures M.C. (Sinar) and screen separation. Inspects defects by sight. Rejects if smelly, too many defects, BHP (over mixed)
Stored 2 wk, cemented floor (heap) & bagged 1 day before transport to K’la. Redries FAQ in sun/ tarpaulin (1-2 days)
Hired lorry to K’la 15/= per kg. Sells to exporter with best price.
Senior Secondary educ. Training by UCDA., not adequate.
J03 Mafubira,Wakitaka, Jinja
700 7 1,220 11.3 S1R3 Rejects M.C. > 20%, bad smell, too many blacks, discoloured (over mixed). No moisture meter (uses experience).
Redries (2-3 days). Stores 2-5 days, PP bags, cemented store.
Has contract with Great Lakes. Hired transport 100,000/= per 7MT to K’la
Reads/Writes English. Attended Seminars but not sufficient info.
MA 06
Kinoni Masaka
480 20 1,200 17.4 S1R3 Seeks FAQ fromdifferent hulleries. Measures M.C. (Sinar), screen, and separation. Defects judged by sight
Stored in PP bags, 2-3days, cemented store. No redrying.
Hired lorry 500,000/= to Kampala. Sells to best price.
Can talk English/write (Secondary educ. level) UCDA training.
M 08 Kabonera, (Bukoto town) Masaka
80 2 1,160 15.0 S1R3 Rejects if too wet plus stones. No moisture meter. Estimate M.C., by experience.
Stored 2 days, PP bags, cemented store. Redries (tarpaulins/sun)
Transport 15/= per kg. to Masaka or Kalisizo. Sells to best price.
Can read/write. Marketing/price info not readily accessed.
71

MA 25
Masaka town, Masaka
300 15 1,150 15.7 S1R1 Seeks FAQ fromhulleries. Checks M.C. (Sinar) & defects (eyes/experience).
Store 1 wk, PP bags, cemented store. Redries to MC. required by exporter.
Transport 25/= per kg. to K’la. Sells to best price exporter.
UCDA training can read/write. Needs daily prices announced on radio.
MA 29
Masaka town Masaka
40 2 1,150 13.5 S1R1 Rejects it too wet, too many blacks broken. Uses sinar moisture meter from hullery. Deducts up to 3%
Stored 1 day at hullery, PP bags, cemented floor.
Transport 6,000/= per MT. Sells to buyer with best price.
Can read and write. UCDA training. Lacks info on OTA/moulds.
MA 30
Bukoto, Masaka
200 4 1,180 13.6 S1R3 Measures M.C. (Sinar) 4 screen separation. Defects/adulteration by sight. Deducts up to 3% for quality.
Stored 2 days, PP bags, cemented store.
Covered hired transport to exporter. Sells to buyer with best price.
Speaks/reads English, UCDA training. Satisfactory.
MA 31
Masaka town Masaka
200 12 1,180 13.9 S1R3 Checks M.C. (Sinar) and defects + screen size. Price set by Kampala BP
Stored 3 days, PP bags, cemented store
Hire lorry, sells to exporter with best price.
Can read/write English. UCDA training.
MA 32
Kinoni Masaka
800 7 1,180 11.7 S1R3 Checks M.C. (Sinar), Screen separation + defects. Price fluctuation set by BP
Stored 1 wk. PP bags, no pallets, cemented store
Hired transport 30/= per kg. to Kampala.
Can read and write/speak English. UCDA training. More required
72
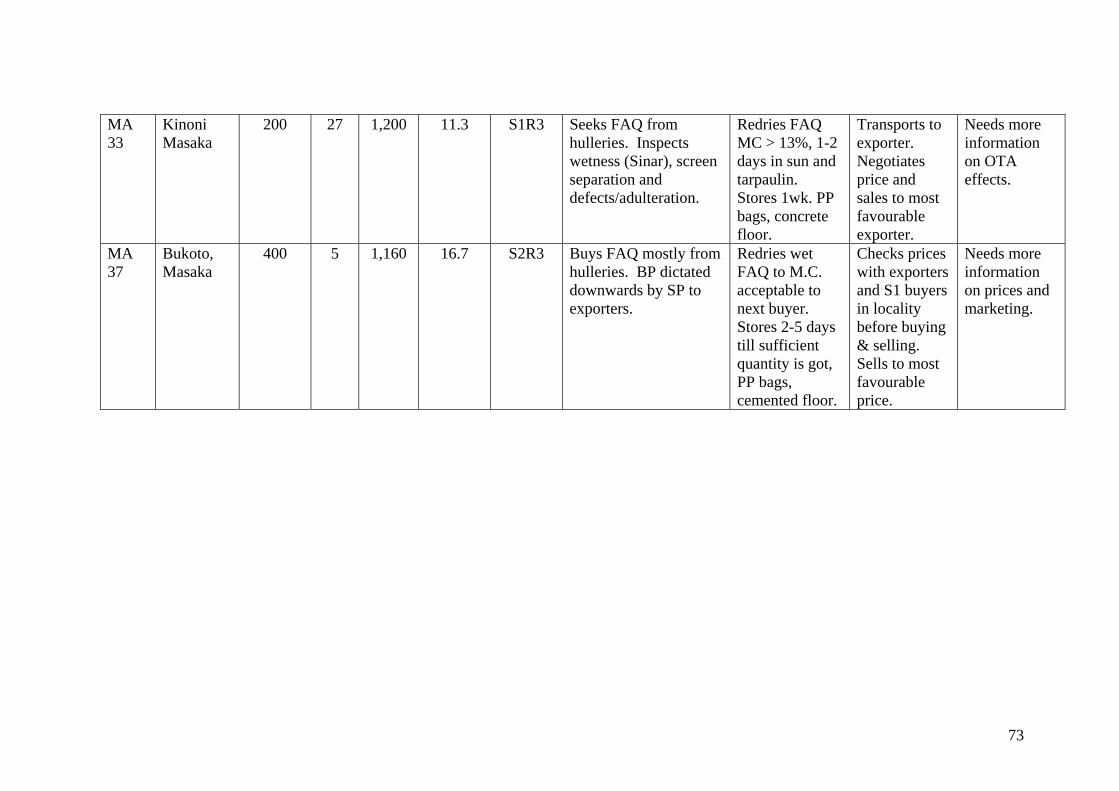
MA 33
Kinoni Masaka
200 27 1,200 11.3 S1R3 Seeks FAQ fromhulleries. Inspects wetness (Sinar), screen separation and defects/adulteration.
Redries FAQ MC > 13%, 1-2 days in sun and tarpaulin. Stores 1wk. PP bags, concrete floor.
Transports to exporter. Negotiates price and sales to most favourable exporter.
Needs more information on OTA effects.
MA 37
Bukoto, Masaka
400 5 1,160 16.7 S2R3 Buys FAQ mostly from hulleries. BP dictated downwards by SP to exporters.
Redries wet FAQ to M.C. acceptable to next buyer. Stores 2-5 days till sufficient quantity is got, PP bags, cemented floor.
Checks prices with exporters and S1 buyers in locality before buying & selling. Sells to most favourable price.
Needs more information on prices and marketing.
73

Table 8: Selected Socio-economic information about three coffee exporters.
ITEM EXPORT COMPANY 1 2 3 1. Export (2002/3) 319,254 267,172 42,580 60kg bags (12% National export) (10% National export) (1.6% National Export) 2. Rating (UCDA) Big exporter Big exporter Small exporter according to export volume 3. Quality performance 1294 (0.4%) 1336 (0.5%) 970 (2.3%) (UCDA) from 60kg bag (Wet, discoloured) (Wet) (Wet, low screen retention rejected (2002/3) for Sc 18, high defect count. 4. Coffee rejection criteria a) All FAQ of MC > 16% a) All FAQ of MC > 17% a) All FAQ of MC > 15% when buying. b) Trace of smelly/ b) Smelly/chalky white b) Smelly coffee mouldy coffees. coffees c) Over mixed coffee adulte- c) All over mixed coffees c) Too many foreign matter rated with BHPs, stones. adulterated with and BHP. blacks, hull & stones. 5. Export grading capacity 7 7 Hires Jamal Rami MT/HR Curring Company (7) 6. Coffee buying methods Buys through agents & Buys from Private traders Buys through agents in Private traders only Masaka, Kayunga, Luwero and Ishaka.
74

7. Coffee reception & a) Samples each bag in Same Same inspection lot with trier as off- loaded from truck and weighs b) Determines %MC, Screen retention, defects & foreign matter content. 8. Buying practices a) Sets price each day Same Same b) Applies reduction formula to bad coffee 9. FAQ handling practices a) Redries semi-dried Same Same FAQ. b) Cleans, grades, green coffee into Same Same Exportable grades c) Stores & overseas Same Same safe shipage of export
75

Table 9: Aw and moisture content of S1 samples. Sample Aw (Temp) Moisture (Oven) Moisture (Meter) % dmb % wmb % dmb J 01 0.76 (29.0) 15.6 13.5 15.1J 03 0.70 (23.1) 12.7 11.3 13.1K 01 0.72 (24.1) 15.4 13.4 15.1L 03 0.69 (28.5) 11.8 10.6 12L 04 0.70 (24.3) 13.2 11.7 12.6M 01 0.72 (29.0) 13.7 12.1 13.9M 06 0.84 (24.7) 22.1 18.1 22.2M 08 0.70 (24.4) 13.3 11.7 13.4MA 04 0.75 (22.6) 14.8 12.9 15MA 05 0.67 (26.5) 13.8 12.2 14MA 06 0.84 (22.7) 21 17.4 22MA 07 0.94 (22.5) 24.3 19.6 24.5MA 08 0.82 (22.4) 17.6 15 17.6MA 10 0.77 (24.1) 16.1 13.8 15.8MA 11 0.76 (27.4) 17.6 15 17MA 12 0.86 (24.1) 19.6 16.4 18.8MA 13 0.92 (25.3) 30.3 23.3 28MA 25 0.78 (23.5) 18.6 15.7 18.8MA 29 0.72 (24.2) 15.6 13.5 15.7MA 30 0.92 (26.9) 15.7 13.6 16MA 31 0.71 (28.4) 16.1 13.9 15.8MA 32 0.65 (23.9) 13.3 11.7 12.7MA 33 0.68 (24.4) 12.8 11.3 13Mean 0.8 16.7 14.2 16.6
L = Luwero, J = Jinja, K = Kamuli, M = Mukono, MA = Masaka,
76

Table 10: Aw and moisture content of S2 samples.
Sample Aw (Temp) Moisture (Oven) Moisture (Meter)
% dmb % wmb % dmb J 02 0.66 (28.3) 11.7 10.5 12.5J 04 0.77 (27.2) 18.6 15.7 18.5J 08 0.84(25.2) 22.8 18.5 22K 03 0.78 (23.8) 17.2 14.6 17.8K 04 0.75 (22.1) 13.2 11.7 13.2L 01 0.69 (28.9) 11.9 10.7 12L 02 0.73 (28.5) 14.7 12.8 14.5M 03 0.75 (25.1) 14.9 12.9 14.1M 04 0.72 (29.0) 13.3 11.7 13.8M 05 0.70 (22.2) 15.7 13.6 15.5MA 01 0.86 (26.3) 21.5 17.7 22MA 02 0.70 (26.4) 15.9 13.8 15.8MA 14 0.78 (23.8) 18.6 15.7 18MA 20 0.82 (26.2) 17.5 14.9 17.4MA 21 0.86 (26.2) 20.6 17.1 21.6MA 22 0.96 (24.2) 29.6 22.8 26.3MA 23 0.83 (26.2) 17.6 15 17.5MA 26 0.77 (26.9) 16.9 14.4 17MA 27 0.77 (25.9) 16.7 14.3 17MA 28 0.77(28.1) 16.6 14.2 16.1MA 34 0.68 (24.8) 14.4 12.6 14.4MA 35 0.67 (22.9) 14.5 12.7 14.2MA 36 0.72 (27.9) 14.9 13 15.8MA 37 0.75 (27.5) 20.1 16.7 20.4Mean 17.1 14.5 17.0
77

Table 11: Aw and moisture content of S3 samples Sample Aw (Temp) Moisture (Oven) Moisture (Meter) % dmb % wmb % dmb J 05 0.92 (23.0) 27.6 21.7 26.2J 10 ND 46.3 31.6 NDJ 11 0.86 (21.6) 22.7 18.5 19J 12 0.97 (24.4) 31.5 23.9 26.2K 02 0.88 (22.1) 23.2 18.8 22K 05 0.80 (21.3) 20 16.7 19.8M 02 0.73 (25.1) 13.6 12.1 13.7M 07 077 (22.5) 17.8 15.1 17.5MA 03 081 (22.6) 17.6 15 18MA 09 081 (26.5) 20.3 16.9 20MA 17 081 (24.5) 17.9 15.2 19.1MA 18 089 (24.1) 23.7 19.2 22MA 24 083 (23.0) 21.6 17.8 22.1Mean 23.4 18.7 20.5
78

Table 12: Aw and moisture content of S4 samples. Sample Aw (Temp) Moisture (Oven) Moisture (Meter) % dmb % wmb % dmb J 06 ND 162.1 61.9 NDJ 07 ND 154.3 60.1 NDJ 13 ND 153.7 60.1 NDJ 14 ND 142.1 58.5 NDJ 15 ND 27.2 21.4 NDJ 16 ND 28.3 22.1 NDK 06 0.90 (21.2) 24.3 19.6 19K 07 0.86 (24.4) 25.1 20.1 19.7K 08 0.93 (21.5) 26.6 21 20.7K 09 0.87 (21.4) 23.5 19 17.9M 09 0.68 (27.2) 13.2 11.6 12.2M 10 0.68 (26.0) 13.2 11.6 11.8M 11 0.67 (24.4) 13 11.5 12.3M 12 0.68 (24.4) 12.9 11.5 11.9MA 15 0.86 (26.2) 20.5 17 17.6MA 16 0.87 (26.4) 26.5 20.9 19.2MA 19 0.91 (26.2) 23.8 19.2 20.1Mean 52.4 27.5 16.6
79

Table 13: Variation of moisture content with trader function.
FT 1 FT 2 FT 3 MT 1 MT 2 MT 3 MT 4 Sample % MC Sample % MC Sample % MC Sample % MC Sample % MC Sample % MC Sample % MC J 06 61.9 J 15 21.4 J 04 15.7 J 05 21.7 MA 07 19.6 J 02 10.5 K 03 14.6 J 07 60.1 J 16 22.1 L 01 10.7 J 10 31.6 J 08 18.5 K 04 11.7 J 13 60.1 K 06 19.6 L 02 12.8 J 11 18.5 M 02 12.1 M 01 12.1 J 14 58.5 K 07 20.1 M 03 12.9 J 12 23.9 L 03 10.6 M 04 11.7 K 08 21 M 05 13.6 K 02 18.8 M 07 15.1 M 08 11.7 K 09 19 M 06 18.1 K 05 16.7 MA 23 15 MA 37 16.7 M 09 11.6 MA 01 17.7 MA 03 15 MA 27 14.3 J 01 13.5 M 10 11.6 MA 02 13.8 MA 09 16.9 MA 17 15.2 J 03 11.3 M 11 11.5 MA 14 15.7 MA 24 17.8 MA 18 19.2 K 01 13.4 M 12 11.5 MA 20 14.9 MA 34 12.6 MA 06 17.4 MA 15 17 MA 26 14.4 MA 35 12.7 MA 25 15.7 MA 16 20.9 MA 04 12.9 MA 36 13 MA 29 13.5 MA 19 19.2 MA 05 12.2 MA 10 13.8 MA 08 20 MA 21 17.1 MA 11 15 MA 28 14.2 MA 30 13.6 MA 22 22.8 MA 12 16.4 MA 31 13.9 MA 13 23.3 MA 32 11.7
MA 33 11.3
Mean 60.2 17.8 15.0 20.1 19.6 14.1 13.8
80

Table 14: Moisture content of samples from different transaction levels.
S1R1 S1R3 S2R1 S4R3 S3R3 S2R3Sample MC% wmb Sample MC% wmb Sample MC% wmb Sample MC% wmb Sample MC% wmb Sample MC% wmb L 03 10.6 J 01 13.5 J 04 15.7 J 06 61.9 J 05 21.7 J 02 10.5L 04 11.7 J 03 11.3 L 01 10.7 J 07 60.1 1 10 31.6 J 08 18.5M 01 12.1 K 01 13.4 L 02 12.8 J 13 60.1 J 11 18.5 K 03 14.6M 06 18.1 M 08 11.7 M 03 12.9 J 14 58.5 J 12 23.9 K 04 11.7MA 04 12.9 MA 06 17.4 M 05 13.6 J 15 21.4 K 02 18.8 M 04 11.7MA 05 12.2 MA 08 15 MA 01 17.7 J 16 22.1 K 05 16.7 MA 23 15MA 07 19.6 MA 30 13.6 MA 02 13.8 K 06 19.6 M 02 12.1 MA 27 14.3MA 10 13.8 MA 31 13.9 MA 14 15.7 K 07 20.1 M 07 15.1 MA 28 14.2MA 11 15 MA 32 11.7 MA 20 14.9 K 08 21 MA 03 15 MA 34 12.6MA 12 16.4 MA 33 11.3 MA 21 17.1 K 09 19 MA 09 16.9 MA 35 12.7MA 13 23.3 MA 22 22.8 M 09 11.6 MA 17 15.2 MA 36 13MA 25 15.7 MA 26 14.4 M 10 11.6 MA 18 19.2 MA 37 16.7MA 29 13.5 M 11 11.5 MA 24 17.8 M 12 11.5 MA 15 17 MA 16 20.9 MA 19 19.2
Mean 15.0 13.3 15.2 27.5 18.7 13.8
81

Table 15: Percentage of samples falling in different moisture content ranges from various transaction levels in the chain
Percentage of samples
Transaction MC MC MC MC MC
Level 10.0 - 12.5%wmb 10.0 - 12.5%wmb 12.6 - 16.0%wmb 16.1 - 20.0%wmb > 20.0 %wmb
L 01
S 1 35 L 02 39 22 4
S 2 17 M 03 63 17 4
S 3 8 M 05 23 46 23
S 4 24 MA 01 0 18 53
SIR1 31 MA 02 31 23 8
S2R1 8 MA 14 67 17 8
S1R3 40 MA 20 50 10 0
S2R3 25 MA 21 58 17 0
S3R3 8 MA 22 23 46 23
S4R3 24 MA 26 0 18 53
82

Table 16: Coffee sale price and moisture content
Farmer FT1 Farmer FT2 Farmer FT3 Trader MT1 Trader MT2/MT3 Trader MT4 Sells FC/SDC (Cherry) Sells DC (Kiboko) Sells FAQ Sells DC Sells FAQ Buys & Sells FAQ
Sample Code
Moisture (%wmb)
Sale price (Ushs/kg)
Sample Code
Moisture (%wmb)
Sale price (Ushs/kg)
Sample Code
Moisture (%wmb)
Sale price (Ushs/kg)
Sample Code
Moisture (%wmb)
Sale price (Ushs/kg)
Sample Code
Moisture(%wmb)
Sale price (Ushs/kg)
Sample Code
Moisture (%wmb)
Sale price (Ushs/kg)
J 06 61.9 200 J 15 21.4 450 J 04 15.7 1050 J 05 21.7 500 J 02 10.5 1150 K 03 14.6 1180 J 07 60.1 200 J 16 22.1 450 L 01 10.7 1180 J 10 31.6 450 J 08 18.5 1130 K 04 11.7 1180 J 13 60.1 200 K 06 19.6 450 L 02 12.8 1220 J 11 18.5 500 M 02 12.1 1200 M 01 12.1 1220 J 14 58.5 200 K 07 20.1 450 M 03 12.9 1150 J 12 23.9 450 L 03 10.6 1220 M 04 11.7 1210 K 08 21 450 M 05 13.6 1200 K 02 18.8 450 M 07 15.1 1120 M 08 11.7 1250 K 09 19 450 M 06 18.1 1200 K 05 16.7 500 MA 23 15 1150 L 04 11.7 1250 M 09 11.6 500 MA 01 17.7 1130 MA 03 15 550 MA 27 14.3 1180 MA 37 16.7 1160 M 10 11.6 500 MA 02 13.8 1130 MA 09 16.9 530 MA 17 15.2 1150 J 01 13.5 1180 M 11 11.5 500 MA 14 15.7 1140 MA 24 17.8 530 MA 18 19.2 1150 J 03 11.3 1220 M 12 11.5 500 MA 20 14.9 1140 MA 34 12.6 1160 K 01 13.4 1200 MA 15 17 500 MA 26 14.4 1140 MA 35 12.7 1160 MA 06 17.4 1200 MA 16 20.9 500 MA 04 12.9 1180 MA 36 13 1160 MA 25 15.7 1150 MA 19 19.2 500 MA 05 12.2 1200 MA 10 13.8 1250 MA 29 13.5 1250 MA 21 17.1 500 MA 11 15 1160 MA 07 19.6 1100 MA 08 15 1160 MA 22 22.8 500 MA 12 16.4 1130 MA 28 14.2 1180 MA 30 13.6 1180 MA 13 23.3 1150 MA 31 13.9 1180
MA 32 11.7 1180
MA 33 11.3 1200
60.2 200.0 17.8 480.0 15.0 1156.3 20.1 495.6 14.4 1164.0 13.4 1197.2
83

Table 17: Mycology results for S1 level chain survey samples.
Sample Percentage infection of fungal species isolated from coffee beans.
A. Niger A. Ochre A. Glancus A. Wenti A. Flavus Alt. Fus. Pen. Rhiz. Free J 01 100 12 12 12 12.2 0 0 0 0 0J 03 99 7.1 3.1 2 0 0 0 0 0 0K 01 97.3 12.5 6.3 4.5 6.3 0 0 1 0 2.6L 03 87.8 4.1 2 0 0 0 4.1 0 0 8.2L 04 100 10.2 0 2 2 2 8.2 0 0 0M 01 93.8 25.7 2.9 11.4 5.7 0 0 0 0 0M 06 100 93.8 0 0 59.2 0 0 0 0 0M 08 100 4.1 20.4 8.2 8.2 0 6.1 0 0 0MA 04 100 0 0 0 2.1 0 0 0 0 0MA 05 100 0 0 0 0 0 4.3 1.3 0 0MA 06 92.1 0 0 0 2.1 0 0 4.3 0 7.9MA 07 65 1.4 0 0 0 0 1.4 0 0 35.7MA 08 100 0 0 0 2.1 0 0 0 0 0MA 10 100 0 0 0 12.1 2.1 0 2.1 0 0MA 11 100 0 0 0 10 0 0 4.3 0 0MA 12 100 0 0 0 0 0 0 4.3 0 0MA 13 100 0 0 0 0 0 3.6 0 0 0MA 25 94.3 0 0 0 0 0 11.4 11.4 0 11.4MA 29 85.7 0 0 0 2.1 5.7 0 2.1 0 10MA 30 97.1 0 0 0 0 0 0 0 0 2.9MA 31 100 0 0 0 0 0 0 0 0 0MA 32 78.6 7.1 0 0 0 0 0 0 0 14.3MA 33 92.8 10.7 0 0 0 0 0 0 0 7.1Mean 94.9 8.2 2.0 1.7 5.4 0.4 1.7 1.3 0.0 4.4
84

Table 18: Mycology results for S 2 level chain survey samples.
Sample Percentage infection of fungal species isolated from coffee beans. A. Niger A. Ochre A. Glancus A. Wenti A. Flavus Alt. Fus. Pen. Rhiz. Free
J 02 100 4.3 1.4 7.1 7.1 0 0 0 0 0J 04 100 61.9 0 16.7 21.4 0 0 0 2.3 0J 08 4.3 21.4 8.6 84.3 0 2.8 2.8 0 0 4.3K 03 98.9 18.4 6.1 13.3 8.2 0 2 2 1 0K 04 100 4.1 2 6.1 10.2 2 0 0 0 0L 01 64.2 0 3.6 21.4 0 1.8 0 0 0 17.9L 02 69.4 14.3 6.1 12.2 2 14.3 12.4 0 0 6.1M 03 46.9 8.2 6.1 18.4 0 0 20.5 2 0 6.1M 04 85.7 8.2 8.2 28.6 0 0 0 0 0 2M 05 100 75.5 8.2 26.5 0 0 0 0 0 0MA 01 95.7 0 0 0 0 0 0 28.6 0 4.3MA 02 100 0 0 0 0 4.3 0 7.9 0 0MA 14 100 0 0 0 2.1 0 0 2.1 0 0MA 20 100 24.3 0 4.3 2.1 0 0 2.1 0 0MA 21 100 0 0 0 0 0 4.3 0 0 0MA 22 71.4 0 0 0 0 12.1 16.4 36.4 0 0MA 23 100 0 0 0 0 10 2.1 2.1 0 0MA 26 94.3 0 0 0 0 0 4.3 0 0 6.4MA 27 100 2.1 0 0 0 7.9 0 0 0 0MA 28 94.3 2.1 0 0 0 6.4 0 0 0 6.4MA 34 100 0 0 0 0 0 0 0 0 0MA 35 100 0 0 0 0 0 0 0 0 0MA 36 78.6 35.7 0 0 0 0 0 0 0 0MA 37 93.1 32 0 0 0 0 0 0 0 0Mean 87.4 13.0 2.1 10.0 2.2 2.6 2.7 3.5 0.1 2.2
85

Table 19: Mycology results for S 3 level chain survey samples.
Sample Percentage infection of fungal species isolated from coffee beans. A. Niger A. Ochre A. Glancus A. Wenti A. Flavus Alt. Fus. Pen. Rhiz. Free J 05 89.7 4.3 0 2.1 6.1 4.1 20.4 0 0 4.1J 10 52 61.9 0 0 9.2 2.1 14.3 2.1 1 34.7J 11 100 21.4 0 6.1 40.8 1 0 0 0 0 4.J 12 45.7 18.4 0 0 1.4 5.7 32.8 0 0 4.3K 05 45.7 0 87.1 20 0 0 0 22.9 0 1.4M 02 42.8 14.3 2 12 0 2 2 18.4 0 14.3M 07 100 8.2 1 13.3 4.1 1 0 1 0 0 MA 03 100 8.2 0 0 0 4.3 20.7 0 0MA 09 100 75.5 0 0 0 0 0 0 0 0 MA 17 100 0 0 0 2.1 4 0 0 0 0 6.MA 18 100 0 0 0 0 0 0 6.4 0 0 MA 24 100 0 0 0 0 0 0 0 0 0 Mean 81.3 17.7 7.5 4.5 5.3 2.5 6.3 6.0 0.1 4.9
86

Table 20: Mycology results for S 4 level chain survey samples.
Sample Percentage infection of fungal species isolated from coffee beans.
A. Niger A. Ochre A. Glancus A. Wenti A. Flavus Alt. Fus. Pen. Rhiz. Free J 06 0 0 0 0 0 0 24.5 0 0 75.5 J 07 15.3 0 1 0 0 0 11.2 0 0 64.2 J 13 0 0 0 0 0 10.2 0 0 0 89.8 J 14 5.7 0 0 0 0 14.3 0 0 0 77.1 J 15 50.5 18.9 1.6 5.1 5.1 0.5 0.5 0.5 0 39.8J 16 53 51 9.2 3.1 10.2 0 1 0 0 35.7K 06 84.7 2 12.2 6.1 13.3 10.2 0 2 0 7.1K 07 99 4 0 5.1 1 0 0 0 0 0K 08 88.9 0 11.1 85.7 0 0 0 1.6 0 3.2K 09 78 9.8 14.3 24.2 18.7 11 0 0 0 0M 09 100 6 0 0 0 0 4 1 0 0 M 10 100 3 0 0 0 0 3 0 0 0 M 11 100 2 0 1 0 0 0 2 0 0 M 12 100 4 0 0 0 0 0 1 0 0 MA 15 100 0 0 0 0 0 0 0 0 0 MA 16 100 0 0 0 0 0 0 2 0 0 MA 19 100 0 0 0 0 4.3 0 6.4 0 0 Mean 69.1 5.9 2.9 7.7 2.8 2.3 2.6 1.0 0.0 23.7
87

Table 21: OTA contamination at different supply levels in the Coffee market chain. Sample OTA/PPb Sample OTA/PPb Sample OTA/PPb Sample OTA/PPbJ 01 NR J 02 0.2 J 05 NR J 06 0.6J 03 0.2 J 04 0.5 J 10 15 J 07 0.2K 01 1.2 J 08 0.2 J 11 1.5 J 13 0.5L 03 0.4 K 03 1.9 J 12 1.3 J 14 1.3L 04 0 K 04 1.3 K 02 0 J 15 0.4M 01 1.2 L 01 1.3 K 05 4.8 J 16 2.1M 06 0.1 L 02 1.2 M 02 0.5 K 06 0.5M 08 0.2 M 03 1.1 M 07 2 K 07 2.8MA 04 2.1 M 04 0 MA 03 4 K 08 2MA 05 2.9 M 05 0.2 MA 09 4.6 K 09 0.6MA 06 4.3 MA 01 2.7 MA 17 2.1 M 09 0.4MA 07 5.4 MA 02 3 MA 18 2.2 M 10 0.7MA 08 5 MA 14 5.6 MA 24 1.9 M 11 0.5MA 10 NR MA 20 3.4 M 12 1.2MA 11 NR MA 21 5.4 MA 15 1.9MA 12 NR MA 22 6.4 MA 16 1.9MA 13 NR MA 23 2.2 MA 19 3.6MA 25 2.2 MA 26 NR MA 29 NR MA 27 NR MA 30 1 MA 28 NR MA 31 12 MA 34 0.6 MA 32 0.6 MA 35 11 MA 33 1.9 MA 36 1.1 MA 37 2 Mean 2.4 2.4 3.3 1.2 (2.3 excluding J10) . NR = Not Received
88

Table 22: A. Ochrecious and OTA Contamination for different trader functions.
FT1 FT2 FT3 MT1 MT2 MT3 MT4 % MC A. ochre OTA
(ppb) % MC A. ochre OTA
(ppb) % MC A. ochre OTA
(ppb) % MC A. ochre OTA
(ppb) % MC A. ochre OTA
(ppb) % MC A. ochre OTA
(ppb) % MC A. ochre OTA
(ppb)
61.9 0 0.6 21.4 18.9 0.4 15.7 61.9 0.5 21.7 0 NR 19.6 1.4 5.4 10.5 4.3 0.2 14.6 8.4 1.9 60.1 0 0.2 22.1 51 2.1 10.7 0 1.3 31.6 1 15 18.5 21.4 0.2 11.7 4.1 1.3 60.1 0 0.5 19.6 2 0.5 12.8 14.3 1.2 18.5 89.8 1.5 12.1 12.2 0.5 12.1 25.7 1.2 58.5 0 1.3 20.1 4 2.8 12.9 8.2 1.1 23.9 1.4 1.3 10.6 4.1 0.4 11.7 8.2 0
21 0 2 13.6 75.5 0.2 18.8 - 0 15.1 69.4 2 11.7 4.1 0.2 19 9.8 0.6 18.1 93.8 0.1 16.7 0 4.8 15 0 2.2 16.7 10.2 0 11.6 6 0.4 17.7 0 2.7 15 0 4 14.3 2.1 NR 13.5 12 NR 11.6 3 0.7 13.8 0 3 16.9 0 4.6 15.2 4.3 2.1 11.3 7.1 0.2 11.5 2 0.5 15.7 0 5.6 17.8 16.4 1.9 19.2 0 2.2 13.4 12.5 1.2 11.5 4 1.2 14.9 24.3 3.4 12.6 0 0.6 17.4 0 4.3 17 0 1.9 14.4 0 NR 12.7 0 11 15.7 0 2.2 20.9 0 1.9 12.9 0 2.1 13 35.7 1.1 13.5 0 NR 19.2 0 3.6 12.2 0 2.9 13.8 0 NR 20 0 5 17.1 0 5.4 15 0 NR 13.6 0 1 22.8 0 6.4 16.4 0 NR 13.9 0 12 23.3 0 NR 11.7 7.1 0.6 11.3 10.7 1.9
60.2 0.0 0.7 17.8 6.7 2.0 15.0 17.4 2.0 20.1 13.6 4.1 19.6 1.4 5.4 14.0 11.8 2.0 13.8 6.5 2.2
89

Table 23: A. Ochrecious infection rate (%) and OTA Contamination at different transaction levels.
S1R1 S1R3 S2R1 S4R3 S3R3 S2R3 Sample A. ochre OTA
(ppb) Sample A. ochre OTA (ppb) Sample A. ochre OTA
(ppb) Sample A. ochre OTA (ppb) Sample A. ochre OTA (ppb) Sample A. ochre OTA (ppb)
L 03 4.1 0.4 J 01 12 NR J 04 61.9 0.5 J 06 0 0.6 J 05 0 NR J 02 4.3 0.2 L 04 10.2 0 J 03 7.1 0.2 L 01 0 1.3 J 07 0 0.2 1 10 1 15 J 08 21.4 0.2 M 01 25.7 1.2 K 01 12.5 1.2 L 02 14.3 1.2 J 13 0 0.5 J 11 89.8 1.5 K 03 18.4 1.9 M 06 93.8 0.1 M 08 4.1 0.2 M 03 8.2 1.1 J 14 0 1.3 J 12 1.4 1.3 K 04 4.1 1.3 MA 04 0 2.1 MA 06 0 4.3 M 05 75.5 0.2 J 15 18.9 0.4 K 02 NR 0 M 04 8.2 0 MA 05 0 2.9 MA 08 0 5 MA 01 0 2.7 J 16 51 2.1 K 05 0 4.8 MA 23 0 2.2 MA 07 1.4 5.4 MA 30 0 1 MA 02 0 3 K 06 2 0.5 M 02 12.2 0.5 MA 27 2.1 NR MA 10 0 NR MA 31 0 12 MA 14 0 5.6 K 07 4 2.8 M 07 69.4 2 MA 28 2.1 NR MA 11 0 NR MA 32 7.1 0.6 MA 20 24.3 3.4 K 08 0 2 MA 03 0 4 MA 34 0 0.6 MA 12 0 NR MA 33 10.7 1.9 MA 21 0 5.4 K 09 9.8 0.6 MA 09 0 4.6 MA 35 0 11 MA 13 0 NR MA 22 0 6.4 M 09 6 0.4 MA 17 4.3 2.1 MA 36 35.7 1.1 MA 25 0 2.2 MA 26 0 NR M 10 3 0.7 MA 18 0 2.2 MA 37 32 2 MA 29 0 NR M 11 2 0.5 MA 24 16.4 1.9 M 12 4 1.2 MA 15 0 1.9 MA 16 0 1.9 MA 19 0 3.6 Mean 10.4 1.8 5.4 2.9 15.4 2.8 5.9 1.2 16.2 3.3 10.7 2.1
90

Table 24: Results of OTA determination (Interactions of Routes and Levels)
S1R1 S1R3 S2R1 S4R3 S3R3 S2R3 Sample OTA/ppb Sample OTA/ppb Sample OTA/ppb Sample OTA/ppb Sample OTA/ppb Sample OTA/ppb
L 03 0.4 J 01 NR J 04 0.5 J 06 0.6 J 05 NR J 02 0.2 L 04 0 J 03 0.2 L 01 1.3 J 07 0.2 1 10 15 J 08 0.2 M 01 1.2 K 01 1.2 L 02 1.2 J 13 0.5 J 11 1.5 K 03 1.9 M 06 0.1 M 08 0.2 M 03 1.1 J 14 1.3 J 12 1.3 K 04 1.3 MA 04 2.1 MA 06 4.3 M 05 0.2 J 15 0.4 K 02 0 M 04 0 MA 05 2.9 MA 08 5 MA 01 2.7 J 16 2.1 K 05 4.8 MA 23 2.2 MA 07 5.4 MA 30 1 MA 02 3 K 06 0.5 M 02 0.5 MA 27 NR MA 10 NR MA 31 12 MA 14 5.6 K 07 2.8 M 07 2 MA 28 NR MA 11 NR MA 32 0.6 MA 20 3.4 K 08 2 MA 03 4 MA 34 0.6 MA 12 NR MA 33 1.9 MA 21 5.4 K 09 0.6 MA 09 4.6 MA 35 11 MA 13 NR MA 22 6.4 M 09 0.4 MA 17 2.1 MA 36 1.1 MA 25 2.2 MA 26 NR M 10 0.7 MA 18 2.2 MA 37 2 MA 29 NR M 11 0.5 MA 24 1.9 M 12 1.2 MA 15 1.9 MA 16 1.9 MA 19 3.6 Mean 1.8 2.9 2.8 1.2 3.3 2.1 NR - Not Received.
91

Table 25: Coffee Sales of one S1 supplier to a particular exporter to show price fluctuations and application of penalties at export level. Date FAQ Price
DEDUCTIONS Gross volume Net after
deduction Money obtained Effective price
Ugsh./kg Defects Wetness Screen Total Sold
% BB % CW % Pod % MC % BHP % (Kg FAQ) (Kg) (Ugsh.) (Ugsh.)
29/04/04 1,140 4 2 0.5 13.3 1 1 4,677 4,630 5,278,200 1,129 01/05/04 1,230 4 3 0.5 13.2 1.5 1.5 6,001 5,911 7,270,530 1,212 04/05/04 1,230 2.5 2.5 0.5 13.1 1 1 6,061 6,000 7,380,000 1,218 13/05/04 1,190 3 1.5 0.5 13.1 1.5 1 5,051 5,000 5,950,000 1,178 24/05/04 1,220 1 3.5 0.5 13 1 0.5 4,764 4,740 5,982,800 1,214 29/05/04 1,192 3 1.5 0.5 13.1 1.5 1 6,181 6,119 7,281,610 1,178 10/06/04 1,250 3 4 0.5 13.1 2 1 6,080 6,019 7,523,750 1,238 15/06/04 1,300 5.5 3 0.5 13.5 2 2 7,619 7,467 9,707,100 1,274 24/06/04 1,230 3 4 0.5 13.4 1.5 1 7,010 6,940 8,536,200 1,218 01/07/04 1,220 4 2 1.5 13.3 1 1 4,607 4,561 5,564,420 1,208 06/07/04 1,120 7 3 0.5 14.3 1.5 3 4,184 4,059 4,546,080 1,087 14/07/04 1,060 7.5 2.5 0.5 13.1 1 1 6,761 6,693 7,094,580 1,049 01/08/04 1,250 4 3 0.5 13.1 2 3 5,882 5,706 7,132,500 1,213 05/08/04 1,250 6 3 0.5 13 2.5 3 4,135 4,011 5,013,750 1,213 07/08/04 1,280 5.5 3 0.5 13.7 2 3 5,136 4,982 6,376,960 1,242 16/08/04 1,180 5.5 3.5 0.5 14 2.5 3 4,297 4,168 4,918,240 1,145
92

29/08/04 1,030 6.5 4.5 0.5 13.2 2 4 4,675 4,488 4,622,640 989 03/09/04 1,000 6.5 1 0.5 13 1.5 2 4,996 4,896 4,896,000 980 13/09/04 920 5 4 1 13.6 1.5 4 5,653 5,427 4,992,840 883 02/10/04 1,000 7 4.5 1 13.5 1.5 3 4,434 4,301 4,301,000 970 10/10/04 910 7 6 0.5 13.2 1.5 4 6,180 5,933 5,399,030 874 15/10/04 850 5.5 6.5 0.5 13.2 2 3 8,850 8,585 7,297,250 825 01/11/04 800 4.5 5 0.5 13.4 2 3 5,569 5,402 4,321,600 776 11/11/04 830 5 3 0.5 13.5 3 2.5 5,608 5,441 4,516,030 809
BB = Black bean, CW = Chalky white and BHP = Broken and hand picked. * Obtained by dividing Gross Volume sold into money obtained.
93

ANNEX. 1.
Proposed sampling for next part of market chain survey 1. Routes to be surveyed: R1 and R3 2. Levels of sampling:
• Export, Level 0 (for S1 samples)
• B3/S1, Level 1 ( for S2 Samples)
• B2/S2, Level 2 (for S 3 Samples)
• B1/S3, Level 3 (for S4 Samples)
3. Desired interactions:
Route Supplier
R0 R1 R2 R3
S1 S1RO S1R1 S1R3
S2 S2R1 S2R3
S3 S3R3
S4 S4R3
4. Number of samples:
• Route R1: 12 farmers S2;
12 buyers S1 who buy directly from farmers only.
• Route R3: 12 farmers S4;
12 buyers S3 who buy from S4 farmers.
12 buyers S2 who do not buy from farmers directly
12 buyers S1 who do not buy from farmers
A total of 72 samples is envisaged (excludes S1R0 case).
For statistical varidity, large number of samples at least 30 is required. The choice of
72 was made to minimize the samples for OTA analysis which required one day per
sample.
94

95
5. Sampling procedure:
• Selection of 3 export companies
- One with large coffee volume, poor quality performance.
- One with large volume, good quality performance.
- One with small/medium coffee volume, good/bad quality performance.
• Selection of interviees and samples
• Selection of sampling area – Iganga, Jinja, Kamuli (Eastern Season October to
January).
Selection, interviewing and collection of samples will be structured according to the figure
below:-
Level 0
Level 1 level 2
Level 3
Level 4
Producer Buyer
Company 1 Company 2 Company 3

6. Sampling Programme:
• Identification of Level 0 and Level 1 participants; interviewing and taking
samples ( Monday 8/12/03 – Saturday 13/12/03).
• Identification , interviewing and taking samples.
Jinja/Iganga (Monday 15/12/03 – Saturday 20/12/03).
Mukono (Monday 22/12/03 – Wednesday 24/12/03), then
(Monday 29/12/03 – Saturday 3/01/04).
• Identification of level 3 and Level 4 participants, interviewing and taking samples.
Jinja/Iganga (Monday 5/01/04 – Saturday 10/01/04).
Mukono (Monday 12/01/04 – Saturday 17/01/04).
7. Key issues on which information is to be sought during interviews will as much
as possible include:-
• Type of coffee traded (whether fresh cherry,kiboko, parchment or FAQ.
• Volumes of coffee traded (MT, bags) both at time of transaction and annually.
• Location of place (town, village) where buying/selling transaction took place, date
of transaction and place (village, parish, sub-county, county, district ) of origin of
supplier/coffee being sold.
• Names of stakeholders (supplier and buyer for each active transaction.
• Buying/selling price for the coffee in question.
• Factors which influence price when buying / selling.
• Characteristics of coffee that may be rejected at different stages.
• Methods of measuring coffee moisture content and ways the stakeholders
determine dryness/wetness of coffee at different levels in chain.
• Views of operators about widespread use of moisture meters and specification for
the type of meter desired at each level (if needed) including affordable price and
performance characteristics.
• Activities of the stakeholder (supplier, exporter ) and how coffee is handled when
he/she holds it including:
96

♦ Coffee husbandry , inter cropping, age, acreage.
♦ Harvesting practices (for producers). Problems.
♦ Drying regimes and facilities plus ways of telling end of drying. Problems.
♦ Storage conditions (where, capacity, how long, why, when, type of coffee,
what is in storage at the time, problems).
♦ Redrying (for buyers, exporters). Facilities and operation. Problems.
♦ Hulling and sorting. Costs. Problems.
♦ Quality tests/checks carried out at each stage/level when buying.
♦ Transport handling conditions and packaging at different stages.
• Extension/technical advice/support received and operators’ views on the sort of
technical support advice they think they need.
• Ideas of operators at different levels about coffee quality and what they think are
the most important consideration of their buyers.
• Marketing information available at each level and information operators think
they need.
• Views of operators about farmers’ groups and “fixed” trading relationships at
different levels of the chain. What is commonly accepTable?
• Behaviours:-
♦ How schedule and other responsibilities of each operator affects his / her
ability to operate in a way that is consistent with production of good quality
coffee.
♦ Factors influencing farmers’/traders decision to store coffee rather than sell it
immeditely it is ready e.g. basis for deciding that the price is too low.
♦ Factors influencing farmer to hull and sell FAQ rather than kiboko.
♦ Whether farmer/trader mixes in coffee of a previous season, when and why.
♦ Whether farmer/trader supplies exclusively to one trader/exporter, whom,
when and why.
8. Coffee sample size:
Two samples of 1kg each from lots of ≤ 0.5 MT and two samples of 2 kg each from
lots of > 0.5 MT coffee.
97

9. Analysis of samples for technical data.
• In field:
- Moisture content determination during sampling with a moisture meter.
(Sinar and Chinese).
- Aw taken during sampling using the HygroLab.
• In laboratory:
- Moisture content by oven.
- Myclogical analysis (Samples forwarded to myclogy lab. for analysis.
- OTA analysis (by UNBS lab.)
98
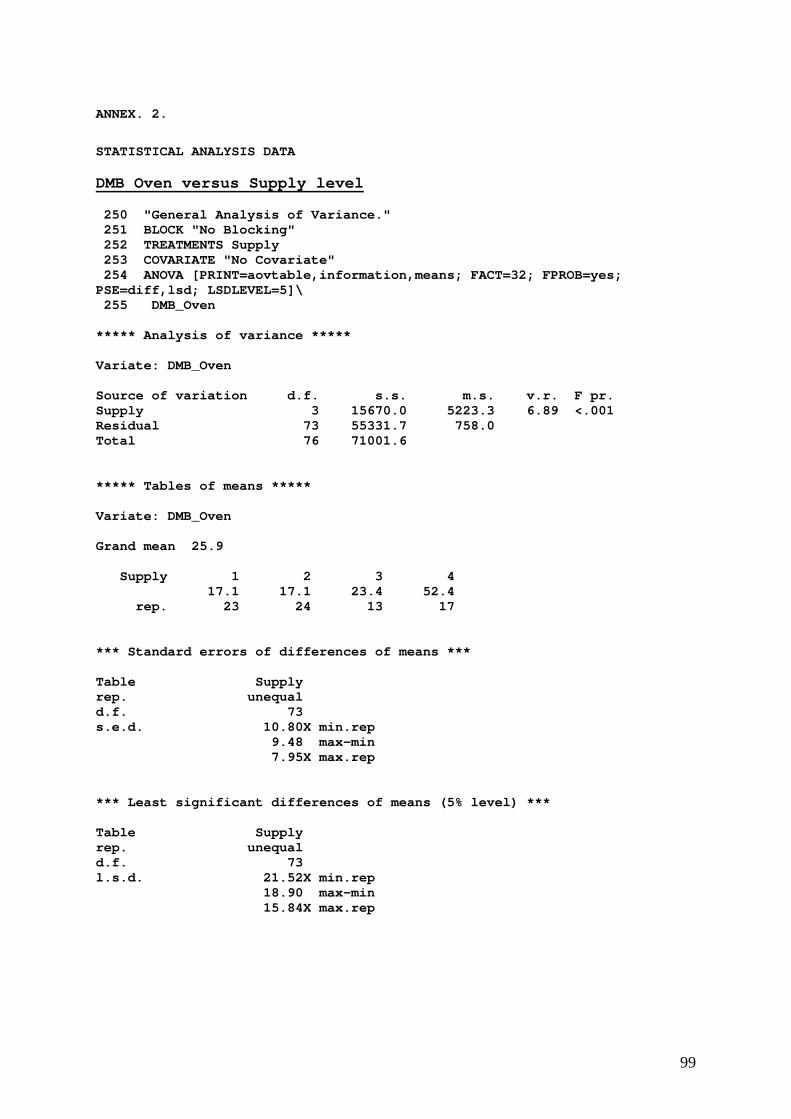
ANNEX. 2.
STATISTICAL ANALYSIS DATA DMB Oven versus Supply level 250 "General Analysis of Variance." 251 BLOCK "No Blocking" 252 TREATMENTS Supply 253 COVARIATE "No Covariate" 254 ANOVA [PRINT=aovtable,information,means; FACT=32; FPROB=yes; PSE=diff,lsd; LSDLEVEL=5]\ 255 DMB_Oven ***** Analysis of variance ***** Variate: DMB_Oven Source of variation d.f. s.s. m.s. v.r. F pr. Supply 3 15670.0 5223.3 6.89 <.001 Residual 73 55331.7 758.0 Total 76 71001.6 ***** Tables of means ***** Variate: DMB_Oven Grand mean 25.9 Supply 1 2 3 4 17.1 17.1 23.4 52.4 rep. 23 24 13 17 *** Standard errors of differences of means *** Table Supply rep. unequal d.f. 73 s.e.d. 10.80X min.rep 9.48 max-min 7.95X max.rep *** Least significant differences of means (5% level) *** Table Supply rep. unequal d.f. 73 l.s.d. 21.52X min.rep 18.90 max-min 15.84X max.rep
99

WMB versus Supply level 256 "General Analysis of Variance." 257 BLOCK "No Blocking" 258 TREATMENTS Supply 259 COVARIATE "No Covariate" 260 ANOVA [PRINT=aovtable,information,means; FACT=32; FPROB=yes; PSE=diff,lsd; LSDLEVEL=5]\ 261 WMB ***** Analysis of variance ***** Variate: WMB Source of variation d.f. s.s. m.s. v.r. F pr. Supply 3 2116.20 705.40 7.91 <.001 Residual 73 6511.63 89.20 Total 76 8627.83 ***** Tables of means ***** Variate: WMB Grand mean 18.1 Supply 1 2 3 4 14.5 14.5 18.7 27.5 rep. 23 24 13 17 *** Standard errors of differences of means *** Table Supply rep. unequal d.f. 73 s.e.d. 3.70X min.rep 3.25 max-min 2.73X max.rep *** Least significant differences of means (5% level) *** Table Supply rep. unequal d.f. 73 l.s.d. 7.38X min.rep 6.48 max-min 5.43X max.rep
100

Price versus Trader Function 57 "General Analysis of Variance." 58 BLOCK "No Blocking" 59 TREATMENTS Typology 60 COVARIATE "No Covariate" 61 ANOVA [PRINT=aovtable,information,means; FACT=32; FPROB=yes; PSE=diff,lsd; LSDLEVEL=5]\ 62 Amount ***** Analysis of variance ***** Variate: Amount Source of variation d.f. s.s. m.s. v.r. F pr. Typology 5 3.703E+10 7.406E+09 2.74 0.025 Residual 71 1.917E+11 2.700E+09 Total 76 2.287E+11 ***** Tables of means ***** Variate: Amount Grand mean 277333. Typology FT1 FT2 FT3 MT1 MT2/3 MT4 200000. 266313. 290940. 306890. 281145. 273651. rep. 4 15 16 9 15 18 *** Standard errors of differences of means *** Table Typology rep. unequal d.f. 71 s.e.d. 36739.1X min.rep 28720.3 max-min 17319.0X max.rep (No comparisons in categories where s.e.d. marked with an X) *** Least significant differences of means (5% level) *** Table Typology rep. unequal d.f. 71 l.s.d. 73255.8X min.rep 57266.7 max-min 34533.1X max.rep
101

MC (WMB) versus Transaction level 307 "General Analysis of Variance." 308 BLOCK "No Blocking" 309 TREATMENTS TransL 310 COVARIATE "No Covariate" 311 ANOVA [PRINT=aovtable,information,means; FACT=32; FPROB=yes; PSE=diff,lsd; LSDLEVEL=5]\ 312 MC%WMB ***** Analysis of variance ***** Variate: MC%WMB Source of variation d.f. s.s. m.s. v.r. F pr. TransL 5 2135.99 427.20 4.67 <.001 Residual 71 6491.84 91.43 Total 76 8627.83 ***** Tables of means ***** Variate: MC%WMB Grand mean 18.1 TransL S1R1 S2R1 S1R3 S3R3 S4R3 S2R3 15.0 15.2 13.8 18.7 27.5 13.8 rep. 13 12 10 13 17 12 *** Standard errors of differences of means *** Table TransL rep. unequal d.f. 71 s.e.d. 4.28X min.rep 3.81 max-min 3.28X max.rep *** Least significant differences of means (5% level) *** Table TransL rep. unequal d.f. 71 l.s.d. 8.53X min.rep 7.60 max-min 6.54X max.rep (No comparisons in categories where s.e.d. marked with an X)
102

OTA versus Transaction Level 600 "General Analysis of Variance." 601 BLOCK "No Blocking" 602 TREATMENTS TransL 603 COVARIATE "No Covariate" 604 ANOVA [PRINT=aovtable,information,means; FACT=32; FPROB=yes; PSE=diff,lsd; LSDLEVEL=5]\ 605 OTA ***** Analysis of variance ***** Variate: OTA Source of variation d.f. s.s. m.s. v.r. F pr. TransL 5 40.526 8.105 1.05 0.397 Residual 61 470.919 7.720 Total 66 511.445 ***** Tables of means ***** Variate: OTA Grand mean 2.29 TransL 1 2 3 4 5 6 1.79 2.80 2.93 1.25 3.32 2.05 rep. 8 11 9 17 12 10 *** Standard errors of differences of means *** Table TransL rep. unequal d.f. 61 s.e.d. 1.389X min.rep 1.191 max-min 0.953X max.rep *** Least significant differences of means (5% level) *** Table TransL rep. unequal d.f. 61 l.s.d. 2.778X min.rep 2.382 max-min 1.906X max.rep
103

A_Ochre versus Transaction level 606 "General Analysis of Variance." 607 BLOCK "No Blocking" 608 TREATMENTS TransL 609 COVARIATE "No Covariate" 610 ANOVA [PRINT=aovtable,information,means; FACT=32; FPROB=yes; PSE=diff,lsd; LSDLEVEL=5]\ 611 A_Ochre ***** Analysis of variance ***** Variate: A_Ochre Source of variation d.f.(m.v.) s.s. m.s. v.r. F pr. TransL 5 1947.4 389.5 0.81 0.548 Residual 60(1) 28884.2 481.4 Total 65(1) 30797.7 ***** Tables of means ***** Variate: A_Ochre Grand mean 11.9 TransL 1 2 3 4 5 6 16.9 16.7 4.6 5.9 17.7 12.4 rep. 8 11 9 17 12 10 *** Standard errors of differences of means *** Table TransL rep. unequal d.f. 60 s.e.d. 10.97X min.rep 9.41 max-min 7.53X max.rep *** Least significant differences of means (5% level) *** Table TransL rep. unequal d.f. 60 l.s.d. 21.94X min.rep 18.82 max-min 15.05X max.rep
104

A_Ochre Versus Supply level and Route (Interaction) 639 "General Analysis of Variance." 640 BLOCK "No Blocking" 641 TREATMENTS Supply_level*Route 642 COVARIATE "No Covariate" 643 ANOVA [PRINT=aovtable,information,means; FACT=32; FPROB=yes; PSE=diff,lsd; LSDLEVEL=5]\ 644 A_Ochre ***** Analysis of variance ***** Variate: A_Ochre Source of variation d.f. s.s. m.s. v.r. F pr. Supply_level 1 172.6 172.6 0.36 0.554 Route 1 589.9 589.9 1.22 0.277 Supply_level.Route 1 148.1 148.1 0.31 0.584 Residual 34 16460.9 484.1 Total 37 17371.6 ***** Information summary ***** Model term e.f. non-orthogonal terms Route 0.997 Supply_level ***** Tables of means ***** Variate: A_Ochre Grand mean 12.8 Supply_level 1 2 10.4 14.7 rep. 17 21 Route 1.00 3.00 16.7 8.8 *** Standard errors of differences of means *** Table Supply_level Route rep. unequal 19 d.f. 34 34 s.e.d. 7.18 7.15 *** Least significant differences of means (5% level) *** Table Supply_level Route rep. unequal 19 d.f. 34 34 l.s.d. 14.59 14.53
105

OTA Versus Supply level and Route (Interaction) 645 "General Analysis of Variance." 646 BLOCK "No Blocking" 647 TREATMENTS Supply_level*Route 648 COVARIATE "No Covariate" 649 ANOVA [PRINT=aovtable,information,means; FACT=32; FPROB=yes; PSE=diff,lsd; LSDLEVEL=5]\ 650 OTA ***** Analysis of variance ***** Variate: OTA Source of variation d.f. s.s. m.s. v.r. F pr. Supply_level 1 0.022 0.022 0.00 0.959 Route 1 0.090 0.090 0.01 0.918 Supply_level.Route 1 8.417 8.417 1.02 0.321 Residual 34 281.894 8.291 Total 37 290.423 ***** Information summary ***** Model term e.f. non-orthogonal terms Route 0.997 Supply_level ***** Tables of means ***** Variate: OTA Grand mean 2.42 Supply_level 1 2 3 4 2.39 2.44 rep. 17 21 Route 1.00 3.00 2.37 2.47 *** Standard errors of differences of means *** Table Supply_level Route rep. unequal 19 d.f. 34 34 s.e.d. 0.939 0.936 *** Least significant differences of means (5% level) *** Table Supply_level Route rep. unequal 19 d.f. 34 34 l.s.d. 1.909 1.901
106

MC versus Typology 397 "General Analysis of Variance." 398 BLOCK "No Blocking" 399 TREATMENTS Typology 400 COVARIATE "No Covariate" 401 ANOVA [PRINT=aovtable,information,means; FACT=32; FPROB=yes; PSE=diff,lsd; LSDLEVEL=5]\ 402 %MC ***** Analysis of variance ***** Variate: %MC Source of variation d.f. s.s. m.s. v.r. F pr. Typology 6 7897.98 1316.33 119.97 <.001 Residual 70 768.03 10.97 Total 76 8666.01 ***** Tables of means ***** Variate: %MC Grand mean 17.99 Typology FT1 FT2 FT3 MT1 MT2 MT3 MT4 60.15 17.76 15.01 20.10 19.60 14.06 13.36 rep. 4 15 16 9 1 14 18 *** Standard errors of differences of means *** Table Typology rep. unequal d.f. 70 s.e.d. 4.684X min.rep 3.403 max-min 1.104X max.rep (No comparisons in categories where s.e.d. marked with an X) *** Least significant differences of means (5% level) *** Table Typology rep. unequal d.f. 70 l.s.d. 9.343X min.rep 6.787 max-min 2.202X max.rep (No comparisons in categories where s.e.d. marked with an X) %MC verses A_Ochre, OTA CORRELATE [PRINT=correlations] %MC,A_Ochre,OTA *** Correlation matrix *** %MC 1.000 A_Ochre -0.113 1.000 OTA 0.007 -0.237 1.000 %MC A_Ochre OTA
107

OTA versus Trader function 686 "General Analysis of Variance." 687 BLOCK "No Blocking" 688 TREATMENTS Typology 689 COVARIATE "No Covariate" 690 ANOVA [PRINT=aovtable,information,means; FACT=32; FPROB=yes; PSE=diff,lsd; LSDLEVEL=5]\ 691 OTA ***** Analysis of variance ***** Variate: OTA Source of variation d.f.(m.v.) s.s. m.s. v.r. F pr. Typology 6 54.421 9.070 1.18 0.329 Residual 60(9) 460.892 7.682 Total 66(9) 511.445 ***** Tables of means ***** Variate: OTA Grand mean 2.29 Typology FT1 FT2 FT3 MT1 MT2 MT3 MT4 0.65 2.03 2.01 4.14 5.40 2.05 2.19 rep. 4 15 16 9 1 13 18 *** Standard errors of differences of means *** Table Typology rep. unequal d.f. 60 s.e.d. 3.920X min.rep 2.848 max-min 0.924X max.rep *** Least significant differences of means (5% level) *** Table Typology rep. unequal d.f. 60 l.s.d. 7.840X min.rep 5.696 max-min 1.848X max.rep
108

A_Ochre versus Trader function 692 "General Analysis of Variance." 693 BLOCK "No Blocking" 694 TREATMENTS Typology 695 COVARIATE "No Covariate" 696 ANOVA [PRINT=aovtable,information,means; FACT=32; FPROB=yes; PSE=diff,lsd; LSDLEVEL=5]\ 697 A_Ochre ***** Analysis of variance ***** Variate: A_Ochre Source of variation d.f.(m.v.) s.s. m.s. v.r. F pr. Typology 6 1676.8 279.5 0.63 0.704 Residual 68(1) 30088.8 442.5 Total 74(1) 31756.9 ***** Tables of means ***** Variate: A_Ochre Grand mean 10.6 Typology FT1 FT2 FT3 MT1 MT2 MT3 MT4 0.0 6.7 17.4 13.6 1.4 11.8 8.5 rep. 4 15 16 9 1 13 18 *** Standard errors of differences of means *** Table Typology rep. unequal d.f. 68 s.e.d. 29.75X min.rep 21.61 max-min 7.01X max.rep *** Least significant differences of means (5% level) *** Table Typology l.s.d. 59.36X min.rep rep. Unequal 43.13 max-min d.f. 68 13.99X max.rep
109