
Market based mechanism - the PMR
18
MARKET BASED MECHANISM Perform, Achieve and Trade India
Transcript of Market based mechanism - the PMR

MARKET BASED
MECHANISM Perform, Achieve and Trade
India
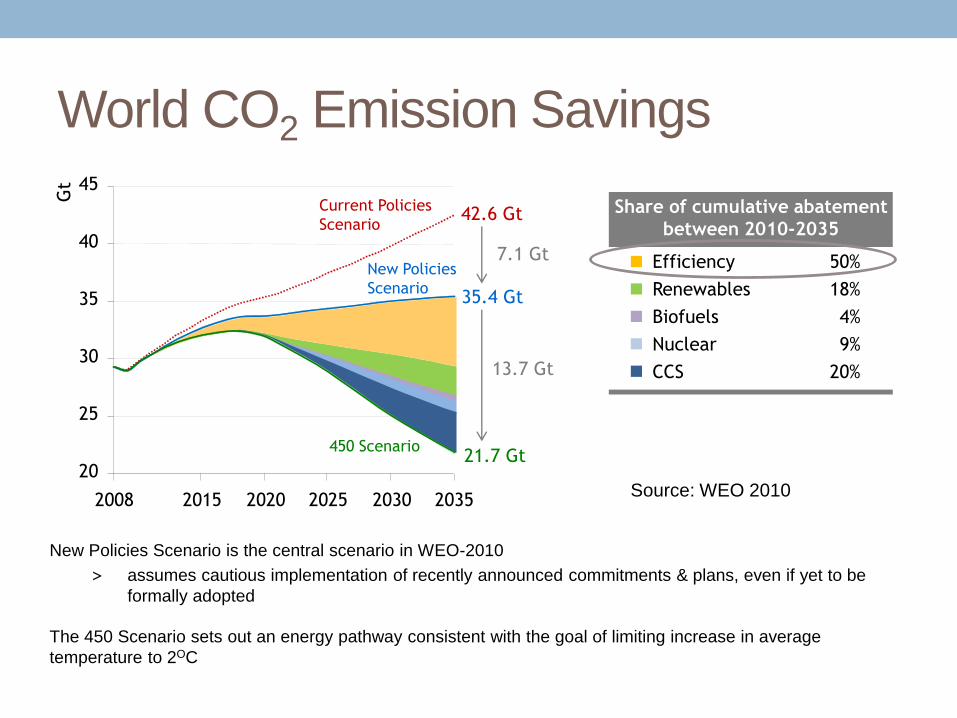
World CO2 Emission Savings
20
25
30
35
40
45
2008 2015 2020 2025 2030 2035
Gt
42.6 Gt
35.4 Gt
21.7 Gt
Current Policies
Scenario
450 Scenario
New Policies
Scenario
13.7 Gt
7.1 Gt Efficiency 50%
Renewables 18%
Biofuels 4%
Nuclear 9%
CCS 20%
Share of cumulative abatement
between 2010-2035
New Policies Scenario is the central scenario in WEO-2010
> assumes cautious implementation of recently announced commitments & plans, even if yet to be
formally adopted
The 450 Scenario sets out an energy pathway consistent with the goal of limiting increase in average
temperature to 2OC
Source: WEO 2010

India – CO2 Emission Reduction
Efficiency 51%
Renewables 32%
Biofuels 1%
Nuclear 8%
CCS 8%
Share of cumulative abatement
between 2010-2035

Energy Profile - India
140
145
150
155
160
165
170
175
180
185
190
3
3.05
3.1
3.15
3.2
3.25
3.3
2004-05 2005-06 2006-07 2007-08 2008-09
Energy Intensity of industry sector (mtoe per Billion Rs. GDP)
Commercial energy consumption in Industry (in mtoe)
Energy Intensity - Industrial Sector GHG Emissions Across Sectors

PAT Scheme Goals and action points
Accelerating the shift to energy efficient appliances
in designated sectors through innovative
measures to make the products more affordable.
Creation of mechanisms that would help finance
demand side management programs in all sectors by capturing future energy
savings.
Developing fiscal instruments to promote
energy efficiency
Specific Energy Consumption (SEC)
reduction targets for the 477 energy-intensive units
which are designated consumers under the
Energy Conservation Act

Perform, Achieve & Trade (PAT) Mechanism
• The market based mechanism to enhance the cost effectiveness in improving the Energy Efficiency
in Energy Intensive industries through certification of energy saving which can be traded
Administrator
• Set target and compliance period
Designated Consumers
• 8 sectors Thermal Power Plant, Steel, Cement, Fertilizer, Pulp & Paper, Textile, Aluminium, Chlor-alkali
Auditing Agencies
• Independent
• Monitor, verify and certify
Market Place
• Transaction of energy efficiency instrument
Reward over
achiever
Penalize under
performer
Sta
ke
ho
lders
Set Targets
•Setting targets on the basis of current specific energy consumption
•Set compliance period
•May take into account Location, Vintage, Technology, raw materials, product mix etc.
Monitoring & verification of targets by Designated Energy
Auditors (DENA)
•Check if designated consumer has achieved targets
•Underachievement: Obligations to buy ESCerts or pay penalty
•Overachievement: Issuance of ESCerts for banking for later use or trade
Trading of ESCerts
•Participation by Designated consumers on platform provided by Power Exchanges
•Symmetrical flow of information
Pro
ce
sses In
vo
lve
d
Market Based Mechanism

Getting Information Through Base Line
Format
Data Compilation/ Evaluation
Target Setting
[Declaration of Base Year, Target Year ]
Communication to Designated Consumer
Preparation Performance Assessment
Document (PAD)
Communication to BEE and SDA
Verification of PAD through DENA
Validation of PAD through DENA &
submission of compliance doc.
PAT Activity Flow Sheet
Issuance of e-Certs after successful M&V
Baseline & Target Setting (based on last three years)
Market for
Trade
(Annual submission but the target compliance for three years)

Challenges
Mandatory Voluntary
Entity Project
Market Regulated
3rd Party Self Verification
Potential Investments
Measured and Verified Self certification
Mechanism
Approach
ESCerts Price
MRV
Targets
Baseline

Challenges
• Technical
• Scale of Production (Installed Capacities)
• Use of Raw Material
• Process Technology
• Vintage
• O & M Practices
• Type of Product Output
• Variation in output/product
• Plant boundary
• Variation in fuel quality
• Plant load factor
• Monitoring & Verification
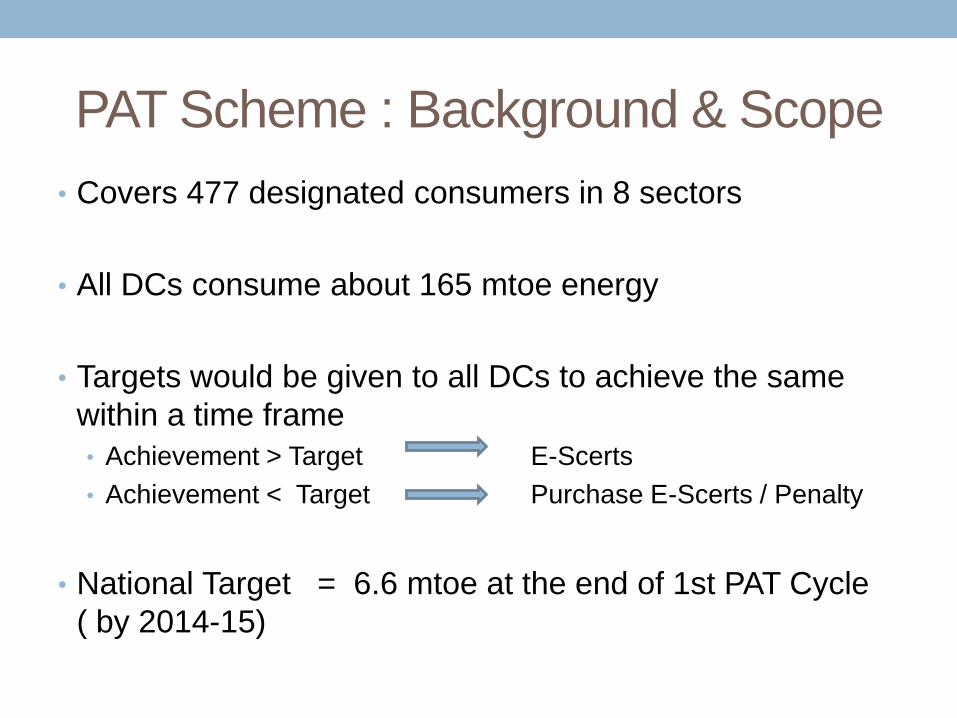
PAT Scheme : Background & Scope
• Covers 477 designated consumers in 8 sectors
• All DCs consume about 165 mtoe energy
• Targets would be given to all DCs to achieve the same
within a time frame
• Achievement > Target E-Scerts
• Achievement < Target Purchase E-Scerts / Penalty
• National Target = 6.6 mtoe at the end of 1st PAT Cycle
( by 2014-15)

Target
Baseline
SEC
Target
SEC
Achieved SEC
Scenario 1 Scenario 2
Compliance
Issued Escerts
Purchase
Escerts
Penalty
Concept of Target, Compliance, Escerts &
Penalty

Specific Energy Consumption
• As the SEC is calculated on a Gate-to-Gate concept, the definition of plant
boundary plays an important role.
PROCESS
Electricity (KWH)
FO (Ltr)
NG (SCM)
Coal (KG)
Others (KG or Ltr)
Product (Kg)
All forms of Energy
E P
SEC = E / P
Plant Boundary
Baseline SEC
Target SEC
Reduction in SEC
Year 1 Year 2 Year 3
SE
C
12

PAT Scheme : Approach Towards Target
Setting • Sectoral Target will be on pro-rata basis of energy
consumption among 8 sectors to achieve National Target
• Establishment of Baseline : • As per reported data of last 5 years (2005-06 to 2009-10)
• Normalization Factor (capacity utilization)
• Arithmetic Average of last 3 years value
• Targets to be statistically calculated based on relative SEC approach after grouping the DCs suitably
• The target reviewed by an expert committee before notification

General Rules for Establishing Baseline
• Definitions:
• Baseline Year : 2009-10
• Baseline Production (Pbase) : Avg. of 2007-8, 2008-9 & 2009-10
• Baseline SEC (SECbase) : Avg. of 2007-8, 2008-9 & 2009-10
• Baseline CU% (CUbase) : Avg. of 2007-8, 2008-9 & 2009-10
• Target SEC (SECtarget) : SEC as estimated in 2014-15
• Target : % reduction from SECbase
• Estimation of Energy Saving (MTOE) :
P base ( SEC base – SEC target )

• Covers units using about
165 million toe/year • Gate-to-gate specific energy
consumption, collectively, to
be about 5.5% less in 2013-14 than it was
in 2008-09
• Less efficient units have
larger SEC %-reduction targets
– so that the collective SEC
reduction is 5.5%
• Energy Savings Certificates (and
penalties) would be based on
difference between the achieved SEC
& the target SEC and the base year
Production
Target is Plant Specific …… Less for Energy Efficient &
High for Energy Inefficient Plant

SEC Spread in Baseline & Target Year

Wood :
Ch. Pulping + NSP
100% market Pulp
Wood : Ch. Pulping + SP
Agro based RCF :
News Print
Wood : News Print
RCF : Non-News Print
SEC Spread as per Grouping of DCs
in Pulp & Paper Sector