MARKERS OF CHRONIC IMMUNE ACTIVATION AND T-CELL …
97
i MARKERS OF CHRONIC IMMUNE ACTIVATION AND T-CELL FUNCTION IN HYPERGLYCAEMIA by TAWANDA MAURICE NYAMBUYA Thesis submitted in fulfilment of the requirements for the degree Master of Science: Biomedical Sciences in the Faculty of Health and Wellness Sciences at the Cape Peninsula University of Technology Supervisor: Prof G Davison Co-supervisor: Dr BB Nkambule, Prof T Matsha Bellville 2017 CPUT copyright information The dissertation/thesis may not be published either in part (in scholarly, scientific or technical journals), or as a whole (as a monograph), unless permission has been obtained from the University
Transcript of MARKERS OF CHRONIC IMMUNE ACTIVATION AND T-CELL …

i
MARKERS OF CHRONIC IMMUNE ACTIVATION AND T-CELL FUNCTION IN
HYPERGLYCAEMIA
by
TAWANDA MAURICE NYAMBUYA
Thesis submitted in fulfilment of the requirements for the degree
Master of Science: Biomedical Sciences
in the
Faculty of Health and Wellness Sciences
at the
Cape Peninsula University of Technology
Supervisor: Prof G Davison
Co-supervisor: Dr BB Nkambule, Prof T Matsha
Bellville
2017
CPUT copyright information
The dissertation/thesis may not be published either in part (in scholarly, scientific or technical
journals), or as a whole (as a monograph), unless permission has been obtained from the
University

ii
DECLARATION
I, Tawanda Maurice Nyambuya, declare that the contents of this thesis represent my own
unaided work, and that the thesis has not previously been submitted for academic
examination towards any qualification. Furthermore, it represents my own opinions and not
necessarily those of the Cape Peninsula University of Technology.
Signed Date

iii
ABSTRACT
Introduction
Type 2 diabetes mellitus (T2DM) is a chronic inflammatory condition characterised by
hyperglycaemia; continuous activation of T-lymphocytes and immune dysregulation.
Although the exact mechanisms of these phenomena are not fully understood, there is strong
evidence suggesting the involvement of T-cells in the chronic inflammatory environment
which could predispose diabetics to infections and thrombotic events. The effect of
hyperglycaemia on cells of the innate immune system in T2DM has been well described and
implicated in the progression of the disorder and the development of its complications.
However, studies investigating the adaptive immune response still remain scarce and
controversial. Thus, investigating T-cells in hyperglycaemic conditions could provide further
insight into the immune dysfunction observed in T2DM and assist in identifying pathways
which could be targeted in the disease management and treatment. Therefore, this study
aimed to investigate chronic immune activation by measuring the expression of T-cell
activation markers in hyperglycaemia and compare the results to those in the
normoglycaemic group.
Method
A total of 69 participants were recruited from Bellville South, Western Cape, South Africa.
Thirty four (34) of the participants were hyperglycaemic, that is a 2hr oral glucose tolerance
test (OGTT) value of > 7.8mmol/l (140mg/dl) (included individuals with DM, IFG and/or IGT
according to the WHO classification) and 35 were normoglycaemic. Standard flow cytometry
methods were used to measure baseline levels of CD95, CD38, HLA-DR and PD-1 on T-
cells in the hyperglycaemic group and the results were compared to those of a cohort of
normoglycaemic individuals prior to incubating with glucose (pre glucose incubation). Thirty
one (31) participants were randomly selected from the total sample population and sub
grouped. Their T-cells were incubated with glucose before flow analysis (post glucose
incubation). The expression of T-cell activation and exhaustion markers were correlated with
glucose metabolism, routine biochemical and inflammation markers.
Results
Our results demonstrated no significant difference in the expression of T-cell activation
antigens between the hyperglycaemic and normoglycaemic group pre incubation with
glucose. Furthermore, the results showed no correlations between T-cell antigen expression
and glucose metabolism. However, there was a significant correlation between ultra-sensitive
C-reactive protein (CRP) and the expression of HLA-DR on CD4+ T-cells and CD95 on all T-
cell subsets. In the subgroup of participants whose T-cells were incubated with glucose,
there was a significant difference in the mean florescence intensity (MFI) of HLA-DR on CD4+

iv
T-cells between the normoglycaemic and hyperglycaemic group at baseline. In addition,
incubation with high concentrations of glucose significantly decreased the percentage of
CD4+ T-cells expressing CD95 in both groups.
Conclusion
We hypothesize that high concentrations of glucose suppress the immune system by
decreasing the expression of CD4+ T-cell activation markers which may lead to immune
exhaustion.
v
ACKNOWLEDGEMENTS
I wish to thank:
God Almighty, for whom without his grace, all this would not have been possible.
My supervisor, Prof GM Davison and co-supervisors, Dr BB Nkambule and Prof TE
Matsha for their valuable assistance, patience, guidance and unwavering support in
all aspects of this research project.
Dr G Hon and the entire Cardiometabolic Health Research Unit staff for their support,
dedication and hard work.
My family and close friends for their continuous support, love and faith in me
Fellow students and peers, Zibusiso Mkandla, Tinashe Mutize, Brighton Mutepfe and
Dr D Soita.
Cape Peninsula University of Technology (CPUT) University Research Fund (URF)
and the South African Medical Research Council (SA MRC) for their financial support.
The financial assistance of the National Research Foundation towards this research
is acknowledged. Opinions expressed in this thesis and the conclusions arrived at,
are those of the author, and are not necessarily to be attributed to the National
Research Foundation.

vi
DEDICATION
To my beloved mother, Nespah Makoni.
Thank you for the unwavering support, unconditional love, patience, and sacrifices you made
throughout my entire life. Last but not least, thank you for raising and moulding me into the
man that I am today.
I love you!

vii
TABLE OF CONTENTS
DECLARATION ..................................................................................................................... ii
ABSTRACT ........................................................................................................................... iii
ACKNOWLEDGEMENTS...................................................................................................... v
TABLE OF CONTENTS……………………………………………….……………………………vii
LIST OF FIGURES ............................................................................................................... xi
LIST OF TABLES ................................................................................................................. xii
LIST OF ABBREVIATIONS ................................................................................................. xiii
CHAPTER ONE ..................................................................................................................... 1
1.1 Statement of research problem ................................................................................ 1
1.2 Background to the research problem ....................................................................... 1
1.3 Research aim .......................................................................................................... 1
1.4 Research objectives ................................................................................................ 1
CHAPTER TWO .................................................................................................................... 2
2. Introduction ................................................................................................................. 2
2.1 Definition and classification of Diabetes Mellitus ...................................................... 3
2.1.2 Pre diabetes ..................................................................................................... 3
2.1.2 Type 1 DM ........................................................................................................ 4
2.1.3 Type 2 DM ........................................................................................................ 4
2.2 The Immune system ................................................................................................ 6
2.2.1 Innate immunity ................................................................................................ 6
2.2.2 Adaptive immunity ............................................................................................... 7
2.3 Inflammation ........................................................................................................... 8

viii
2.3.1 Acute inflammation ........................................................................................... 9
2.3.2 Chronic-inflammation ...................................................................................... 10
2.4 T-cell maturation and tolerance .............................................................................. 10
2.4.1 Central tolerance ............................................................................................ 11
2.4.2 Peripheral tolerance ........................................................................................ 12
2.5 Markers of T-cell immune activation ...................................................................... 15
2.5.1 Human Leukocyte Antigen-D Related (HLA-DR) ............................................... 15
2.5.2 cyclic ADP ribose hydrolase (CD38) ............................................................... 16
2.6 Regulatory markers of T-cell activation .................................................................. 17
2.6.1 The Fas signalling pathway ............................................................................ 17
2.6.2 Programmed cell death 1 (PD-1) .................................................................... 19
2.7 T-cell function in inflammatory conditions. ............................................................. 21
2.7.1 CD38 and HLA-DR in inflammatory conditions ............................................... 21
2.7.2 PD-1 and Fas in inflammatory conditions .......................................................... 22
2.8 Immune dysregulation and dysfunction in T2DM ................................................... 23
2.8.1 T-cell function in hyperglycaemia .................................................................... 25
2.9 Conclusions ........................................................................................................... 27
CHAPTER THREE .............................................................................................................. 29
3.1 Participants and Sampling ..................................................................................... 29
3.1.1 Inclusion Criteria ............................................................................................... 29
3.1.2 Exclusion Criteria ............................................................................................ 29
3.1.3 Sample Collection ........................................................................................... 29
3.1.4 Clinical Measurements ................................................................................... 30

ix
3.1.5 Biochemical Measurements ............................................................................ 30
3.2 Flow Cytometry Analysis........................................................................................ 31
3.2.1 Instrument Setup ............................................................................................... 31
3.2.2 Detector Settings ............................................................................................... 31
3.2.3 Antibodies and Reagents ................................................................................ 31
3.2.4 Fluorescence Minus One (FMO) ..................................................................... 32
3.3. Optimisation ........................................................................................................... 32
3.3.1 Antibody Titration .............................................................................................. 32
3.3.2 Glucose Incubation Time ................................................................................ 32
3.3.3 T-Cell Viability Control Test ............................................................................ 32
3.4. Immune Measurements ........................................................................................ 33
3.4.1 Baseline Protocol ............................................................................................ 33
3.4.2 Incubation protocol ......................................................................................... 33
3.4.3 Gating Strategy ................................................................................................. 34
3.6 Statistical Analysis ................................................................................................. 34
CHAPTER FOUR ................................................................................................................ 36
4.1 Individual demographics ........................................................................................ 36
4.2 Biochemical parameters ........................................................................................ 36
4.3 Haematological parameters ................................................................................... 38
4.4 T-cell antigen expression in normoglycaemia and hyperglycaemia participants ..... 39
4.5 The effects of glucose on T-cell antigen expression ............................................... 40
4.5.1 Fas (CD95) ........................................................................................................... 40
4.5.2 HLA-DR ................................................................................................................ 41
x
4.5.3 PD-1 ..................................................................................................................... 43
4.5.4 CD38 .................................................................................................................... 44
4.6 T-cell antigen expression in hypoglycaemic and hyperglycaemic conditions .......... 44
4.7 Correlations between T-cell markers, glucose metabolism and inflammation ......... 45
CHAPTER FIVE .................................................................................................................. 49
CHAPTER SIX ..................................................................................................................... 54
BIBLIOGRAPHY ................................................................................................................. 55
APPENDICES ..................................................................................................................... 67
Appendix 1: Quality Control (QC) ....................................................................................... 67
Appendix 2: Fluorescence Minus One (FMOs) ................................................................... 69
Appendix 3: Titrations ......................................................................................................... 70
Appendix 4: Incubation Time Optimisation ......................................................................... 71
Appendix 5: Viability Marker Control ................................................................................... 72
ADDENDA ........................................................................................................................... 74
ADDENDUM 1: Participant Information Leaflet and Consent Form ...................................... 74
ADDENDUM 2: Ethical Clearance ....................................................................................... 82
Addendum 3: Research Outputs ........................................................................................ 83

xi
LIST OF FIGURES
CHAPTER TWO
Figure 2.1: Etiology and pathogenesis of T2DM .................................................................... 5
Figure 2.2: T cell activation by dendritic cells ....................................................................... 7
Figure 2.3: T and B cells in adaptive immunity ..................................................................... 8
Figure 2.4: The acute-phase inflammatory response ............................................................ 9
Figure 2.5: TCR–MHC interactions in positive and negative selection of thymocytes .......... 11
Figure 2.6: PD-1 pathway and CTLA-4 in peripheral anergy ............................................... 13
Figure 2.7: Fas mediated apoptosis in peripheral tolerance ................................................ 14
Figure 2.8: Regulatory T-cells inhibiting T-cell effector function. ......................................... 15
Figure 2.9: CD38 signalling pathway……………………………………..………………………17
Figure 2.10: Fas apoptosis signalling pathway .................................................................... 18
Figure 2.11: PD-1 signalling pathway in T-cell function.. ..................................................... 19
Figure 2.12: Regulation of PD-1 signalling pathway………..……………………….………….21
Figure 2.13: PD-1 pathway inducing T-cell dysfunction in chronic viral inflammation…...….23
CHAPTER THREE
Figure 3.1: Forward and side scatter parameters at linear-scale………………….…………..31
Figure 3.2: T-cell gating strategy…………………………………………………………………34
CHAPTER FOUR
Figure 4.1: CD95 expression on CD4+ T-cells in normoglycaemia and hyperglycaemia……40
Figure 4.2: HLA-DR expression on CD4+ T-cells in normoglycaemia and hyperglycaemia...42
Figure 4.3: PD-1 expression on CD3+ T-cells in normoglycaemia and hyperglycaemia…….43
Figure 4.4: CD95 expression in varying concentrations of glucose……………..…………….44

xii
LIST OF TABLES
CHAPTER TWO
Table 2.1: Criteria for the diagnosis of diabetes mellitus ........................................................ 3
Table 2.2: Criteria for the diagnosis of pre- diabetes……………………………………………..4
CHAPTER THREE
Table 3.1: Biochemical and routine haematological parameters measured …………………30
CHAPTER FOUR
Table 4.1: Biochemical parameters ..................................................................................... 36
CHAPTER FIVE
Table 4.1: Participants demographics……………………………………………………………36
Table 4.2: Biochemical parameters……………………………………………………………….37
Table 4.3: Haematological parameters……………………………………………………………38
Table 4.4: Pre incubation summary of T-cell marker expression………………………………39
Table 4.5: CD95 expression on T-cells pre and post glucose incubation………………….....41
Table 4.6: HLA-DR expression on T-cells pre and post glucose incubation………………….42
Table 4.7: PD-1 expression on T-cells pre and post glucose incubation……..………………43
Table 4.8: Changes in T-cell antigen expression with increasing glucose concentration…...45
Table 4.9: Correlation between CD3 marker, glucose metabolism and inflammation……….46
Table 4.10: Correlation between CD4 marker, glucose metabolism and inflammation……..47
Table 4.11: Correlation between CD8 marker, glucose metabolism and inflammation……..48

xiii
LIST OF ABBREVIATIONS
ADA Association American Diabetes
AIDS Acquired immunodeficiency syndrome
AICD Activation induced cell death
ARV Anti-retroviral drugs
AGEs Advanced glycation end products
APCs Antigen presenting cells
BMI Body mass index
CD Cluster Designation
CD3 T-cell back bone marker
CD4 T-helper cells
CD8 Cytotoxic T-cells
CD28 T-cell costimulatory molecule that binds to B7
CD38 cyclic ADP ribose hydrolase
CRP C-reactive protein
CTLA-4 Cytotoxic T-lymphocyte-associated protein 4
CVDs Cardiovascular diseases
DM Diabetes Mellitus
Fas CD95/Apo-1
FMO Fluorescence minus one
HbA1c Glycated haemoglobin
HDL High-density lipoprotein
HIV Human Immuno-deficiency virus
HLA-DR Human Leucocyte Antigen- D related
HG Hyperglycaemia (high blood glucose)
IDF International Diabetes Federation
IFG Impaired fasting glucose
IGT Impaired glucose tolerance
IL Interleukin

xiv
INF Interferon
IRS-1 Insulin receptor substrate 1
ITAMs Immuno-receptor tyrosine-based activation motifs
ITIM Immuno-receptor tyrosine-based inhibiting motifs
ITSM Immuno-receptor tyrosine-based switch motif
LDL Low-density lipoprotein
MAP kinase Mitogen-activated protein kinase
MFI Mean fluorescence intensity
MCP-1 Monocyte chemotactic protein-1
MHC Major-histocompatibility complex
MPO Myeloperoxidase pathway
NF-kB Nuclear factor-kappaB (transcriptional factor)
PAMPs Pathogen associated molecular patterns
PD-1 Programmed cell death 1
PI3k/Akt Phosphatidylinositol 3-kinase pathway
PKC Protein kinase C
PMN Polymorphonuclear leukocytes
RAGE Receptor for AGEs
ROS Reactive oxygen species
Teff Effector T-cells
Treg Regulatory T-cells
TCR T-cell receptor
TLR Toll-like receptors
TNF-α Tumour necrotizing factor-α
T1DM Type 1 Diabetes Mellitus
T2DM Type 2 Diabetes Mellitus
WCC White cell count
WHO World Health Organisation

1
CHAPTER ONE
INTRODUCTION
1.1 Statement of research problem
Type 2 diabetes mellitus (T2DM) is a chronic inflammatory condition characterised by
hyperglycaemia; continuous activation of T-lymphocytes and immune dysregulation (Pickup,
2004; Lontchi-Yimagou et al., 2013; Schietinger & Greenberg, 2014; Schietinger & Philip D,
2015). Although the exact mechanisms of these phenomena are not fully understood, chronic
inflammation has been implicated in predisposing diabetics to infections, thrombosis and
subsequently cardiovascular complications (Geerlings & Hoepelman, 1999; Erasmus et al.,
2012; Matsha et al., 2012). Therefore, it is the intension of this study to investigate chronic
immune activation and T-cell function in hyperglycaemia.
1.2 Background to the research problem
Studies investigating the role of cell-mediated immunity in diabetic patients and their
susceptibility to infections are limited. Although results from various studies generally
suggest impairment of immune function, the effects of hyperglycaemia on peripheral T-
lymphocytes remain scarce (Geerlings & Hoepelman, 1999; Stegenga et al., 2008; Wu et al.,
2011). In addition, the effects of glucotoxicity on peripheral T-cell function have not been
reported in the targeted South African mixed ancestry population (Erasmus et al., 2012;
Matsha et al., 2012). In this study, T-cell activation state and effects of high glucose
concentrations on T-cell antigen expression will be investigated.
1.3 Research aim
To investigate markers of chronic immune activation and T-cell function in
hyperglycaemia.
1.4 Research objectives
To measure the expression of activation and exhaustion markers on T-cells in
hyperglycaemic and normoglycaemic individuals.
To investigate the effects of varying concentrations of glucose on T-cell antigen
expression.
To correlate the expression of T-cell activation and exhaustion markers with
glucose metabolism, routine biochemical markers and inflammation.

2
CHAPTER TWO
LITERATURE REVIEW
2. Introduction
The global prevalence of diabetes mellitus (DM) has significantly increased from 4.7% in
1980 to 8.5% in 2014 (WHO, 2016).This increase has been attributed to urbanisation and
modernisation of the developing world, particularly in Sub-Saharan Africa (Mbanya et al.,
2010; Matsha et al., 2012; Renzaho, 2015). Estimates from 2009 by the International
Diabetes Federation (IDF) suggested that the prevalence of DM in Sub-Saharan Africa will
increase from 4.8% to 5.3% by the year 2035 (IDF, 2009). Despite the high rate of
undiagnosed DM cases in Sub-Saharan Africa (Mbanya et al., 2010), a total of 19.8 million
cases of overt diabetes and a prevalence of about 7.1% has been reported in the year 2013
and 2014 respectively (IDF, 2013; WHO, 2016).
In South Africa, a total of 3.5 million people, about 8% of the total population, is diabetic
(Molleutze & Levitt, 2006; IDF, 2013). A previous report indicated that DM is the fifth highest
cause of natural deaths in South Africa and number one in the Western Cape province
(Statistics South Africa, 2013). Furthermore, studies have shown that the mixed ancestral
population of South Africa has the second highest prevalence of DM after the Indian
population (Levitt et al., 1999; Motala et al., 2003).
Type 2 Diabetes Mellitus (T2DM), is an inflammatory condition associated with increased risk
of cardiovascular diseases (CVDs) and thrombosis (Matsha et al., 2012; Vazzana et al.,
2012). The chronic hyperglycaemia observed in this disorder induces a state of low grade
systemic inflammation responsible for the immune activation that precedes insulin resistance
in the pathogenesis of the disease (Dokken, 2008; Lontchi-Yimagou et al., 2013). This
suggests that there is a strong relationship between hyperglycaemia, inflammation, immune
activation and CVDs. Consequently, the hyperglycaemic state in uncontrolled T2DM seems
to induce chronic activation, exhaustion and ultimately the dysfunction of T-lymphocytes
(Brod, 2000; McKinney et al., 2007; Wang et al., 2014).
The aim of this review is to examine the process of inflammation, immune activation and
exhaustion and how these processes are linked to the pathogenesis of T2DM. Literature was
searched on Google scholar and PubMed using terms “Immune system”, “Inflammation”, “T-
cell function”, “T2DM”, “T-cell activation and exhaustion”, “Programmed cell death
(apoptosis)” and “T-cell dysfunction in DM and other inflammatory conditions’’.

3
2.1 Definition and classification of Diabetes Mellitus
Diabetes Mellitus is a group of disorders characterised by chronic hyperglycaemia due to
defects in insulin secretion, action or both (ADA, 2009). Individuals with uncontrolled
hyperglycaemia often present with polyuria, polydipsia and unexplained weight loss which is
sometimes coupled with polyphagia and blurred vision (ADA, 2009; Kitabchi et al., 2009).
The clinical criteria for the diagnosis of DM includes (Table 2.1), a fasting plasma glucose
(FPG) of ≥ 7.0 mmol/l (126mg/dl) or 2-hour plasma glucose of ≥ 11.1mmol/l (200mg/dl)
(WHO, 2006)
Table 2.1: Criteria for the diagnosis of DM (compiled by author, based on work WHO, 2006)
1. FPG > 7.0mmol/l (126mg/dl). Fasting is defined as no caloric intake for at least 8
hours.
Or
2. A 2-hour plasma glucose of ≥ 11.1mmol/l (200mg/dl) during an oral glucose tolerance
test (OGTT).
2.1.2 Pre diabetes
The World Health Organisation (WHO) identified an intermediate group of individuals whose
glucose levels do not meet the criteria to be diagnosed as diabetics, yet their levels are
higher than those considered to be normal (Harris et al., 1997). These individuals have been
referred to as pre-diabetics and can be identified as having either impaired fasting glucose
(IFG) or impaired glucose tolerance (IGT) (Alberti, 2007; Grundy, 2012). Global statistics
have indicated that an estimated 316 million people are pre-diabetic and have a high risk of
developing T2DM (Grundy, 2012; IDF, 2013). A previous report indicated that the prevalence
of pre-diabetics in the Cape Town mixed ancestry population was 4.3% (Erasmus et al.,
2012).
The use of the term “pre-diabetes” has been debated over the years and the WHO
discouraged its use during the 1980s as it was reported that many of these individuals did
not proceed to clinical T2DM (Grundy, 2012). The term, pre-diabetes was however re-
introduced in 2005 by the American Diabetes Association (ADA) to describe individuals with
impaired glucose tolerance (IGT) of 7.8–11.0mmol/l (140–199mg/dl), impaired fasting
glucose of 6.1–7.0 mmol/l(110–125mg/dl) and most recently HbA1c (5.7–6.4%) (ADA, 2009).
The WHO in 2006, introduced the term “intermediate hyperglycaemia” to describe IGT and
IFG since these individuals can either revert back to a normoglycaemic state or proceed to
clinical T2DM (Table 2.2) (WHO, 2006).

4
Table 2.2: Criteria for the diagnosis of intermediate hyperglycaemia (compiled by author, based on
work WHO, 2009).
1. Impaired fasting glucose (IFG) of 6.1–6.9mmol/l (110–125mg/dl)
Or
2. Impaired glucose tolerance (IGT):
Fasting plasma glucose of < 7.0mmol/l (125mg/dl)
and
A 2hr plasma glucose of > 7.8mmol/l (140mg/dl) and < 11.0mmol/l (200mg/dl)
2.1.2 Type 1 DM
Type 1 diabetes mellitus (T1DM) is an autoimmune disorder characterised by β-cell
destruction induced by auto antibodies directed against the insulin secreting pancreatic β-cell
(Cnop et al., 2014). Although strong evidence of immune dysfunction has been reported in
the pathogenesis of T1DM (Al Homsi & Lukic, 1992.; Ozougwu, 2013), it is beyond the scope
of this study.
2.1.3 Type 2 DM
Type 2 diabetes mellitus (T2DM) is characterised by a combination of insulin resistance and
an inadequate compensatory insulin secretory response with relative insulin deficiency
(Kahn, 2003; ADA, 2009). This type is usually diagnosed in older patients with predisposing
risk factors such as obesity, hypertension and hypercholesterolaemia (Kohei, 2010). Type 2
DM accounts for over 90% of diabetes cases in Sub-Saharan Africa (Levitt, 2008) and in
South Africa, it has a prevalence of 8 % (IDF, 2013). Provincial statistics have shown that
the Western Province has the highest prevalence of DM with an incidence of 8.1% (Erasmus
et al., 2012).
In normal glucose metabolism, a narrow plasma glucose concentration range is maintained
despite wide fluctuations in supply and demand. This is achieved by regulated interactions
between tissue sensitivity to insulin (especially in liver) and insulin secretion (ADA, 2009;
Ozougwu, 2013). However, in T2DM, a combination of genetic factors related to impaired
insulin resistance (especially by the liver cells), insulin secretion (dysfunctional pancreatic β
cells) as well as environmental factors such as obesity, lack of exercise and stress (Fig 2.1)
are implicated in the disruption of the plasma glucose balance and the development of T2DM
(Kohei, 2010; Ozougwu, 2013). Biochemically, T2DM may present with a high white cell
count, pro-inflammatory cytokines and chemokines, coagulation factors (such as fibrinogen

5
and plasminogen activator inhibitor 1) and acute-phase proteins (King, 2008; Esser et al.,
2014; Hu et al., 2015).
Figure 2.1: Etiology and pathogenesis of T2DM (adapted from Kohei, 2010). Type 2 DM is a multifactorial disease involving a combination of genetic and life style environmental factors related to impaired insulin secretion and resistance.
Previous studies have demonstrated a link between T2DM, obesity and abdominal adipose
tissue. The adipose tissue adipocytes become hypertrophic in an effort to accommodate
excess triglyceride storage and eventually undergo apoptotic cell death and adipokine
secretion (Chng et al., 2015; Ip et al., 2015). This process attracts cells of the innate immune
system such as macrophages and monocytes which trigger the production of pro-
inflammatory cytokines and initiate an adaptive immune response (Chng et al., 2015).
Notably, the secretion of these pro-inflammatory biomarkers by the adipocytes correlates
with the prevalence and incidence of complications associated with T2DM such as
thrombosis and CVDs (Lontchi-Yimagou et al., 2013). Although the abdominal adipose tissue
has been identified as a source of pro-inflammatory cytokines and chemokines such as IL-6,
TNF-α and monocyte chemoattractant protein-1 (Hotamisligil et al., 1995; Fried et al., 1998;
Catalán et al., 2007), the bulk of these pro-inflammatory biomarkers are secreted by
circulating and tissue-associated immune cells (King, 2008; Hameed et al., 2015).

6
2.2 The Immune system
The immune system is an organization of cells and molecules with specialized roles and has
the ability to distinguish self from non-self in defending the body against infection (Medzhitov,
2007). Two general forms of the immune system exist, namely innate immunity and adaptive
immunity (Parkin & Cohen, 2001).
2.2.1 Innate immunity
The innate immunity is classically known to be antigen non-specific and lack immunological
memory. This includes physical barriers, phagocytic cells (neutrophils, monocytes and
macrophages), cells that release inflammatory mediators, basophils, mast cells, eosinophils
and natural killer cells (Delves & Roitt, 2000). The innate response also includes soluble
proteins such as complement, cytokines and chemokines that are either naturally present in
biological fluids or are released from cells as they are activated (Chaplin, 2010).
Macrophages, possess receptors for carbohydrates such as mannose, which are not
normally exposed on vertebrate cells (Delves & Roitt, 2000). During phagocytosis, the
engulfed microbes are subjected to neutralising toxic intracellular molecules, which includes
superoxide anion, hydroxyl radicals, antimicrobial cationic proteins and lysozyme (Delves &
Roitt, 2000). In addition, these phagocytes are responsible for the clearance of apoptotic
and/or necrotic cells and subsequently release pro-inflammatory mediators (Savill, 1997).
The innate immune system activates the adaptive immune response by presenting antigens
to T-lymphocytes (Fig 2.2). The dendritic cells are activated via the recognition of distinctive
pathogen-associated molecular patterns (PAMPs) which are present on the surface of a
micro-organism (Medzhitov, 2008). This leads to the presentation of antigen by antigen
presenting cells (APCs) via major-histocompatibility-complex (MHC) molecules and the
activation of naive T cells (Kronin et al., 2001; Medzhitov, 2007). Furthermore, the activation
of dendritic cells enhances the surface expression of B7 (CD80/86), a co-stimulatory
molecule which is essential for providing the second co-stimulatory signal in addition to the
antigenic signal, for successful T-cell activation (Harris & Ronchese, 1999). Antigen
presenting cells present the MHC and antigen complex to the T-cell receptors (TCR) on
CD28+ naïve T-cells which become activated and initiate the adaptive immune response
(Delves & Roitt, 2000).
7
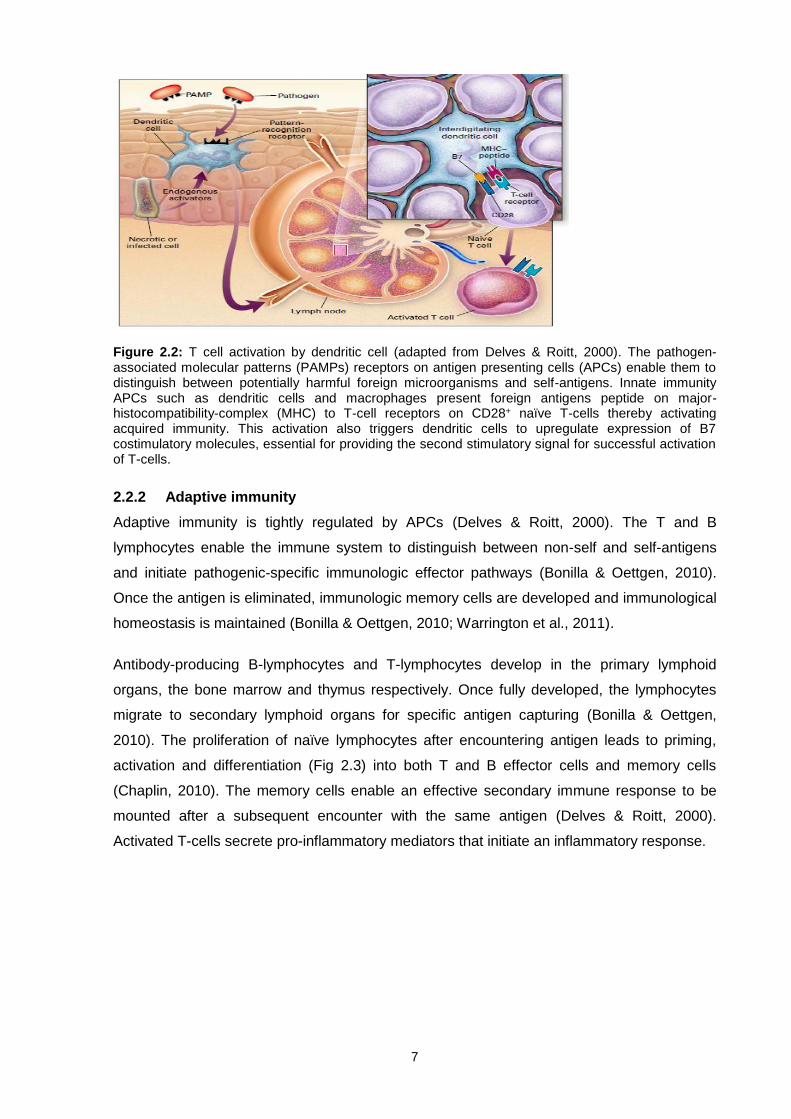
Figure 2.2: T cell activation by dendritic cell (adapted from Delves & Roitt, 2000). The pathogen-associated molecular patterns (PAMPs) receptors on antigen presenting cells (APCs) enable them to distinguish between potentially harmful foreign microorganisms and self-antigens. Innate immunity APCs such as dendritic cells and macrophages present foreign antigens peptide on major-histocompatibility-complex (MHC) to T-cell receptors on CD28+ naïve T-cells thereby activating acquired immunity. This activation also triggers dendritic cells to upregulate expression of B7 costimulatory molecules, essential for providing the second stimulatory signal for successful activation of T-cells.
2.2.2 Adaptive immunity
Adaptive immunity is tightly regulated by APCs (Delves & Roitt, 2000). The T and B
lymphocytes enable the immune system to distinguish between non-self and self-antigens
and initiate pathogenic-specific immunologic effector pathways (Bonilla & Oettgen, 2010).
Once the antigen is eliminated, immunologic memory cells are developed and immunological
homeostasis is maintained (Bonilla & Oettgen, 2010; Warrington et al., 2011).
Antibody-producing B-lymphocytes and T-lymphocytes develop in the primary lymphoid
organs, the bone marrow and thymus respectively. Once fully developed, the lymphocytes
migrate to secondary lymphoid organs for specific antigen capturing (Bonilla & Oettgen,
2010). The proliferation of naïve lymphocytes after encountering antigen leads to priming,
activation and differentiation (Fig 2.3) into both T and B effector cells and memory cells
(Chaplin, 2010). The memory cells enable an effective secondary immune response to be
mounted after a subsequent encounter with the same antigen (Delves & Roitt, 2000).
Activated T-cells secrete pro-inflammatory mediators that initiate an inflammatory response.

8
Figure 2.3: T and B cells in adaptive immunity (adapted from Parkin & Cohen, 2001). The hall mark of adaptive immunity is the use of antigen-specific receptors on T and B-cells to drive targeted effector responses. The initial presentation of antigens to naïve T and B-cell by antigen presenting cells (APCs) leads to cell priming, activation, and differentiation. The activated T and B-cells then migrate from the lymphoid tissue to the inflammation site and release of plasma antibodies into blood and tissue fluid respectively.
2.3 Inflammation
Inflammation can be divided into two phases, namely the acute phase and the chronic
phase which is characterised primarily by its persistence and lack of clear resolution (Ward,
2010; Maskrey et al., 2011). During inflammation, vascular permeability and blood flow is
increased. As a result leukocytes, platelets and plasma constituents migrate from the blood
vessels into the injured tissue (Ley et al., 2007; Maskrey et al., 2011; Wu & Chen, 2014).
Mediators of inflammation involve both humoral and cellular factors as well as molecular
factors (Cicala & Cirino, 1998; Maskrey et al., 2011). Acute inflammation subsides shortly
after neutralization of the infection is achieved and repair of the damaged tissue is initiated
(Maskrey et al., 2011). However, in T2DM, the inflammation process is unregulated and
chronic, leading to chronic immune activation, exhaustion and ultimate immune dysfunction
(Pickup, 2004; Schietinger & Greenberg, 2014).
9
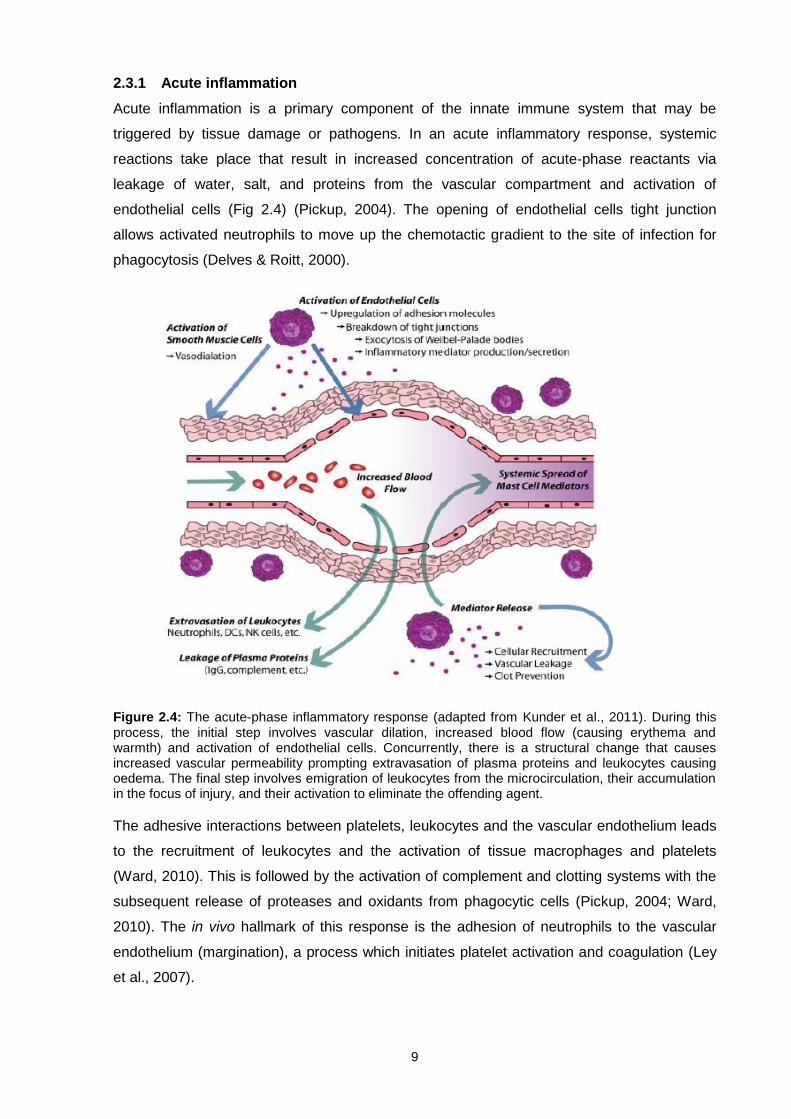
2.3.1 Acute inflammation
Acute inflammation is a primary component of the innate immune system that may be
triggered by tissue damage or pathogens. In an acute inflammatory response, systemic
reactions take place that result in increased concentration of acute-phase reactants via
leakage of water, salt, and proteins from the vascular compartment and activation of
endothelial cells (Fig 2.4) (Pickup, 2004). The opening of endothelial cells tight junction
allows activated neutrophils to move up the chemotactic gradient to the site of infection for
phagocytosis (Delves & Roitt, 2000).
Figure 2.4: The acute-phase inflammatory response (adapted from Kunder et al., 2011). During this process, the initial step involves vascular dilation, increased blood flow (causing erythema and warmth) and activation of endothelial cells. Concurrently, there is a structural change that causes increased vascular permeability prompting extravasation of plasma proteins and leukocytes causing oedema. The final step involves emigration of leukocytes from the microcirculation, their accumulation in the focus of injury, and their activation to eliminate the offending agent.
The adhesive interactions between platelets, leukocytes and the vascular endothelium leads
to the recruitment of leukocytes and the activation of tissue macrophages and platelets
(Ward, 2010). This is followed by the activation of complement and clotting systems with the
subsequent release of proteases and oxidants from phagocytic cells (Pickup, 2004; Ward,
2010). The in vivo hallmark of this response is the adhesion of neutrophils to the vascular
endothelium (margination), a process which initiates platelet activation and coagulation (Ley
et al., 2007).

10
When an acute inflammatory response is triggered, complement is activated which triggers
the degranulation of mast cells. This results in the release of histamines responsible for
contraction of smooth muscles and an increase in vascular permeability (Delves & Roitt,
2000; Kunder et al., 2011). This results in the activation of endothelial cells and the up-
regulation of endothelial adhesion molecules and tissue factor (TF) (Rivera-Nieves et al.,
2008; Ward, 2010). The rolling of neutrophils along the vessel wall is halted by the
expression of adhesion molecules which bind to selectins and integrins expressed on the cell
surface of activated neutrophils (Delves & Roitt, 2000). The leukocyte-endothelial
interactions initiate the release of pro-inflammatory cytokines and chemokines at the site of
inflammation (Wahi et al., 1996). These pro-inflammatory molecules chemotactically attract
and activate neutrophils prior to their transmigration into the extravascular matrix (Wahi et al.,
1996; Rivera-Nieves et al., 2008; Ward, 2010).
Once resolution is achieved, natural occurring anti-inflammatory factors are released to
downregulate the inflammatory process before causing tissue damage (Pickup, 2004; Ward,
2010; Wu & Chen, 2014). These anti-inflammatory factors include cytokines (Interleukin (IL)
4, IL-10, IL 12), protease inhibitors; antioxidant enzymes; lipoxins; kinases and transcriptional
factors (Ward, 2010). Despite the acute phase inflammatory response being tightly regulated
and short lived, in T2DM, it is unregulated and chronic (Pickup, 2004).
2.3.2 Chronic-inflammation
The chronic inflammatory phase is a prolonged and dysregulated immune response that
involves active inflammation, tissue destruction and attempts at tissue repair (Ward, 2010;
Murakami & Hirano, 2012). This is due to a persistent stimulus and failure of the acute-phase
response to provide any resolution (Weiss, 2008). In the chronic inflammatory response, the
neutrophils are replaced by macrophages, plasma cells and T cells (Weiss, 2008). Upon
failure of the acute inflammatory process and macrophages to phagocytose pathogens,
tertiary lymphoid tissues get involved and in certain diseases, granulomas are formed
(Medzhitov, 2008; Weiss, 2008).
Therefore, chronic inflammation is characterised by the persistent activation of T-cells, which
is the hallmark of chronic inflammatory conditions such as T2DM and CVDs (Levine, 2005;
Medzhitov, 2008). Thus, T-cells play an important role in the pathogenesis and progression
of T2DM as a chronic inflammatory condition.
2.4 T-cell maturation and tolerance
The maturation of bone marrow stem cells consist of three processes namely, proliferation of
immature cells, expression of receptor chains by VDJ gene recombination (Mikkola & Orkin,
2006; Chaplin, 2010). During the VDJ recombination process, T-cells which fail to express

11
functional receptors do not receive survival signals and undergo apoptosis (Goldrath &
Bevan, 1999). After leaving the bone marrow, immature T-cells migrate to the thymus where
they become thymocytes and are educated to be self-tolerant prior to their departure to the
secondary lymphoid organs (Delves & Roitt, 2000).
Figure 2.5: T-cell receptor-major-histocompatibility complex (TCR–MHC) interactions in positive and
negative selection of thymocytes (adapted from Delves & Roitt, 2000). The TCR-MHC affinity interactions facilitate maturation, survival, proliferation or apoptotic cell death (ACD) of thymocytes. Thymocytes that express TCR with high affinity to MHC complex either trigger programmed cell death or differentiate into Treg via the negative selection. Those with intermediate affinity undergo positive selection and differentiate into single-positive effector CD4+ or CD8+ and migrate to secondary lymphoid organs. Thymocytes that show no sign of affinity die by neglect.
T-cell selection is determined by their binding affinity to MHC molecules (Fig 2.5) (Goldrath &
Bevan, 1999; Camara et al., 2012). When T-lymphocytes are exposed to antigens they may
become activated, proliferate and differentiate into effector cells leading to an immune
response (Camara et al., 2012). When T-cells undergo apoptosis or are functionally inactive
during the selection process, they are said to be tolerant. Immunological tolerance of self-
reactive T-cells in the thymus and peripheral lymphoid organs is termed central tolerance
and peripheral tolerance, respectively (Romagnani, 2006). The phenomenon of
immunological tolerance is important in several aspects as its failure may result in
autoimmunity and immune dysfunction.
2.4.1 Central tolerance
The thymus mediates the selection process by providing a suitable microenvironment with a
specific combination of stromal cells, cytokines and chemokines to generate functional T-
cells (Goldrath & Bevan, 1999; Luckheeram et al., 2012). When immature double negative
(CD4-CD8-) T-cells migrate from the bone marrow into the thymus, most of them express an
αβ T-cell receptor (Delves & Roitt, 2000; Parkin & Cohen, 2001). The expression of the αβ
TCR heterodimers and upregulation of CD4+CD8+ (double positive) thymocytes allows cells

12
with a functional TCR to be positively selected by MHC in the thymic cortex (Metzger &
Anderson, 2012). Thymocytes with intermediate affinity to a particular self-MHC haplotype
survive and mature to either CD4+ or CD8+ single positive T-cells (Goldrath & Bevan, 1999;
Camara et al., 2012; Luckheeram et al., 2012; Metzger & Anderson, 2012).
T-cells that have passed the positive selection process migrate to the thymic medulla where
they undergo negative selection (Goldrath & Bevan, 1999). This process prevents the
maturation of T-cells with strong affinity to the MHC-self peptide complexes present on the
surface of medullary epithelial cells (MEC) (Romagnani, 2006). Although the number of self-
antigens present within the thymus are limited, the promiscous gene expression (pGE)
regulated by the autoimmune regulator (AIRE) gene, allows the MEC to present a vast range
of self-antigens.(Romagnani, 2006; Metzger & Anderson, 2012). Thymocytes expressing a
TCR with very high affinity or no affinity to self-antigens expressed on the MHC complex
undergo negative selection by either apoptotic cell death (ACD) or differentiation into natural
regulatory T-cells (Treg) (Goldrath & Bevan, 1999; Camara et al., 2012). Only 3% of
thymocytes in the thymus survives both positive and negative selection processes
(Romagnani, 2006).
2.4.2 Peripheral tolerance
Despite the efficient central tolerance mechanisms, not all self-reactive T-cells are eliminated
and may migrate to secondary lymphoid organs where they pose a risk of mounting an
autoimmune response. Therefore, a secondary mechanism termed peripheral tolerance
takes place to prevent the activation of autoreactive T-cells. This involves three key
mechanisms that include; anergy, deletion and immune suppression.
2.4.2.1 Anergy
Both the TCR and CD28 co-stimulatory molecule signals are required for successful
activation of T-cells (Fig 2.9) (Harber et al., 2000). In the absence of a co-stimulatory signal,
a hypo-responsive state of T-cells termed anergy is induced. This occurs despite active TCR
signalling and IL-2 expression (Xing & Hogquist, 2012). Therefore, albeit co-stimulatory
signals are essential for T-cell activation, they can also provide a negative signal that may
inhibit the activation process, induce tolerance and prevent autoimmunity (Fig 2.6)
(Liechtenstein et al., 2012; Xing & Hogquist, 2012). The programmed cell death 1 (PD-1)
receptor and its ligands (PD-L1 and PD-L2) and the cytotoxic T-lymphocyte-associated
protein 4 (CTLA-4) pathways also play an important role in controlling the immune response
by inducing T-cell anergy (Liechtenstein et al., 2012).

13
Figure 2.6: Programmed cell death-1 and its ligands (PD1-L) pathway and cytotoxic T-lymphocyte-associated 4 (CTLA-4) in peripheral anergy (adapted from Liechtenstein et al., 2012) .The TCR-MHC and CD28-CD80/86; CD40-CD40L ligation provides initial and co-stimulatory signals respectively for successful activation of T-cells and subsequent release of cytokines. The PD1-L pathway and the CD80-CTLA-4 provide negative co-stimulatory signals which inhibit T cell activation resulting in
anergy. T-cell anergy is essential in inducing T-cell peripheral tolerance that would otherwise result in autoimmunity.
The PD-1 receptor is a member of the CD28 superfamily that delivers an inhibitory signal
upon ligand binding (Jin et al., 2011) The co-stimulatory response of the PD-1-L pathway
occurs during antigen presentation to naïve T-cells by APCs or during cytotoxic T-cell attack
(Liechtenstein et al., 2012). Upon activation, T-cells up-regulate PD-1 interactions with PD1-L
resulting in co-stimulation and ligand-induced TCR down-modulation (Liechtenstein et al.,
2012). In turn, TCR down-modulation terminates the intracellular signal transduction pathway
by the recruitment of phosphatase (SHIP-1 and SHIP-2) (Liechtenstein et al., 2012; Xing &
Hogquist, 2012). SHIP-1 dephosphorylates proximal signalling molecules and inhibits the
PI3K pathway which is essential for T-cell activation (Liechtenstein et al., 2012; Xing &
Hogquist, 2012; Jin et al., 2011).
In addition, T-cell activation also induces the up-regulation of CTLA-4, which competes with
the CD28 co-stimulatory molecule for binding to B7 (CD80/86) (McCoy & Le Gros, 1999).
Once the CTLA-4 binds to B7, it delivers an inhibitory signal that inhibits T-cell activation
(Romagnani, 2006). Therefore, T-cells do not necessarily die but persist in the body as
functionally inactive effector cells termed anergy.
2.4.2.2 Deletion
This mechanism of peripheral tolerance is based on ACD which is mediated by Fas/APO-1
(CD95) and other death receptors on the surface of the T-cell (Fig 2.7) (Askenasy et al.,
2005). Chronic activation of T-cells induces the upregulation of Fas and Fas ligand (FasL)
which triggers apoptosis (Askenasy et al., 2005). The Fas/FasL pathway activates a cascade
of caspase enzymes that results in activation-induced cell death (AICD) (Van Parijs et al.,
1996; Romagnani, 2006; Askenasy et al., 2005). Consequently, dysregulation of the
Fas/FasL pathway may result in lymphoproliferative disease, autoimmune diseases as well

14
as dysfunctional T-cell mediated adaptive immune response (Geerlings & Hoepelman, 1999;
Schietinger & Philip D, 2015)
Figure 2.7: Fas mediated apoptosis in peripheral tolerance (adapted from Askenasy et al., 2005). Activation of T-cells results in the upregulation of Fas and Fas ligand expression. Chronic T-cell activation may trigger the Fas/FasL mediated autocrine and paracrine apoptosis termed activation-induced cell death (AICD). The AICD results in the elimination of self- reactive T-cells.
2.4.2.3 Immune suppression by natural T regulatory cells
T regulatory (Treg) cells are thymus derived T-cell subsets that are CD4+ CD25+ and express
FOXP3, a transcription factor that plays an important role in their development and function
(Alpdogan & Van den Brink, 2012). They do not respond to TCR stimulation and possess the
ability to suppress the proliferation of other T-cells (Fritzsching et al., 2009; Alpdogan & Van
den Brink, 2012). The Treg cells are essential in inducing immunologic self-tolerance following
antigen priming in a relevant cytokine environment (Sakaguchi et al., 2006) (Sakaguchi et al.,
2006; Fritzsching et al., 2009; Alpdogan & Van den Brink, 2012).
The survival and function of Treg is also dependent on IL-2, a pro-inflammatory cytokine which
promotes the differentiation of T-cells into Treg cells (Wan & Flavell, 2007) and therefore
express CD25 (IL-2R) (Alpdogan, 2013). The expression of FOXP3 may be upregulated on
naïve T-cells during chronic activation in the presence of transforming growth factor (TGF)- β
(Chen et al., 2003). In addition, the secretion of inhibitory cytokines such as TGF-β and IL-10
by Treg and their direct interaction with B7 (CD80/CD86) via the CTLA-4 molecule results in
the suppression of effector T-cells (Teff) (Fig 2.8) (Alpdogan, 2013).

15
Figure 2.8: Regulatory T-cells (Treg) inhibiting T-cell effector (Teff) function (adapted from Alpdogan, 2013). Treg suppress Teff cells by secreting inhibitory cytokines such as transforming growth factor (TGF)-β and interleukin-10 (IL10) which decreases T-cell activity by promoting the expansion of Treg cells and inducing either anergy or apoptosis respectively. In addition, the interaction of T reg cells expressing CTLA-4 with antigen presenting cells (APCs) activate the indoleamine 2,3 dioxygenase (IDO) enzyme which initiate the production of T-cell function inhibitory molecules such as kynurenine. Interluekin-2 (IL-2) is essential for the survival and function of Treg cells.
2.5 Markers of T-cell immune activation
Numerous cell surface antigens have been utilised to investigate levels of T-cell activation
and include CD25, CD69, CD70, CD38 and HLA-DR (Deeks et al., 2004; Eggena et al.,
2005; Saber et al., 2007; Dieterlen et al., 2014). For this study, CD38 and HLA-DR were the
markers of choice as they have been widely accepted as robust markers of T-cell activation
(Hertoghe et al., 2000; Feuth et al., 2013; Funderburg et al., 2013; B. Nkambule et al., 2015).
2.5.1 Human Leukocyte Antigen-D Related (HLA-DR)
The Human Leukocyte Antigen-D antigen (HLA-DR) is a well-known marker of immune
activation due to its increased expression on activated leukocytes (Hertoghe et al., 2000;
Feuth et al., 2013). It is a MHC class II cell surface receptor encoded by the human
leukocyte antigen complex that binds with the TCR in T-cell activation (Chung et al., 1994).
The expression of HLA-DR antigens is upregulated on activated APCs (B-cells,
monocytes/macrophages and dendritic cells) in order to present antigen to CD4+ T-cells
(Chaplin, 2010). This stimulates an adaptive immune response resulting in pro-inflammatory
cytokine production (Salgado et al., 2002; Ueno et al., 2007). Therefore, since the expression
of HLA-DR is normally absent on resting T-cells and subsequently up-regulated on activated
T-cells, it is a robust activation marker that indicates active proliferation of immune cells as
well as production of pro-inflammatory cytokines (Viallard et al., 2001; Salgado et al., 2002).
The combinational use of CD38 and HLA-DR as activation markers has been used in several
studies of inflammatory conditions (Hunt et al., 2008; Feuth et al., 2013; Funderburg et al.,
2013; Smith et al., 2013).

16
2.5.2 Cyclic ADP ribose hydrolase (CD38)
CD38 is an immunoregulator ectoenzyme which catalyses the synthesis and hydrolysis of
cyclic adenosine diphosphate–ribose (cADPR) which is responsible for both the synthesis
and degradation of several Ca2+ depended second messengers (Pavon et al., 2013). In
addition, CD38 catalyses the transglycosylation reaction by converting nicotinamide adenine
dinucleotide (NAD) into another important intracellular transduction signalling molecule,
nicotinic acid adenine dinucleotide phosphate (NAADP), hence it is referred to as a bi-
functional ectoenzyme (Hamblin, 2003; Pavon et al., 2013).
Normally, early bone marrow T-cell precursors, thymocytes and peripheral T-cells have
approximately 6%, 90% and 8% expression of CD38 on their cell surfaces respectively
(Malavasi et al., 1992). The expression of CD38 on the cell surface is highly dependent on
the state of cellular activation and differentiation (Mehta et al., 1996; Pavon et al., 2013). In
activated T-cells, the expression of CD38 is upregulated hence it is useful in the study of T-
cell activation (Funderburg et al., 2013; Smith et al., 2013; Nkambule et al., 2015).
Interestingly, high glucose-utilising tissue particularly the pancreas, naturally express high
levels of CD38, which is believed to play a pivotal role in glucose-induced insulin secretion
from the islets cells (Mehta et al., 1996).
2.5.2.1 CD38 signalling pathway
The cyclic ADP ribose hydrolase pathway is responsible for the synthesis of two second
messengers responsible for mobilising Ca2+ stores namely cADPR and NAADP (Fig 2.9). The
main ADP-ribosyl cyclase in mammals is CD38 (Wei et al., 2014). The cADPR acts on the
ryanodine receptors (RyR) inside the endoplasmic reticulum and NAADP mobilises the
endolysosomes via the two-pore channels (TPC) (Lee, 2012). The endogenous Ca2+
mobilising nucleotide, cADPR which is responsible for calcium release or influx is
synthesised from NAD in the presence of CD38 (Wei et al., 2014) and NAADP is derived
from NAD via the catalysis of the CD38 enzyme (Lee, 2012; Wei et al., 2014). The CD38
pathway modulates various processes including insulin secretions (Mehta et al., 1996),
cardiac regulation (Reyes et al., 2015) and inflammation (Deshpande et al., 2004; Sathish et
al., 2014). Since the discovery of CD38 as a lymphocyte antigen, its pathway has been
shown to play a crucial role in inflammatory processes (Horenstein et al., 2013).

17
Figure 2.9: CD38 signalling pathway (adapted from Lee, 2012). The cADPR synthesised from NAD via the action CD38 acts on the ryanodine receptors (RyR) inside the endoplasmic reticulum and causes Ca2 release. The nicotinic acid adenine dinucleotide phosphate (NAADP) formed from nicotinamide adenine dinucleotide (NAD) via the transglycosylation process mediated by CD38, mobilises the endolysosomes (Ly) via the activation of two-pore channels (TPC). CD38 is co-expressed as both type II and type III with its catalytic C-terminal domain facing outside and inside the cell respectively. Therefore the NAD is transported out of the cell via transporter proteins such as connexin-43 (Cnx) hemichannels and gets cyclized to form cADPR via type II CD38. The cADPR is then transported back into the cell via nucleoside transporters (NuT). Type III is responsible for the general intracellular phosphorylation processes.
2.6 Regulatory markers of T-cell activation
T-cell activation is tightly controlled by a number of mechanisms (see section 2.4.2). A
disruption in the balance of inhibition and activation of T-cells could lead to a state of T-cell
exhaustion. This can occur when there is a deficiency of positive co-stimulatory molecules
required for successful activation or the up-regulation of negative regulators such as PD-1
and Fas (Askenasy et al., 2005; Sachdeva et al., 2010; Nakanjako et al., 2011; Shi et al.,
2013, Dieterlen et al., 2014).
2.6.1 The Fas signalling pathway
Fas (also called CD95 or APO-1) is a member of the tumour necrosis factor (TNF) cell
surface receptor that transduces apoptotic death signals upon activation (Felderhoff-Mueser
et al., 2000; Peter et al., 2015). The Fas/FasL pathway is activated by the ligation of Fas and
its ligand (FasL) (Askenasy et al., 2005). Pro-inflammatory cytokines such as TNF-α, IL-1β,
IL-2, INF-ᵧ and IL-24 have been reported to stimulate the Fas/FasL signalling pathway and
activation-induced cell death (AICD) of T-cells (Kawakami et al., 1998; Refaeli et al., 1998;
Gopalan et al., 2005). Thus, these pro-inflammatory cytokines may contribute to the chronic
inflammation observed in T2DM and induce the up-regulation of Fas and Fas/FasL signalling
pathway.

18
Fas mediated apoptosis is driven by either the intrinsic or extrinsic pathway (Fig 2.10) (Xu et
al., 2016). The extrinsic apoptotic pathway is initiated by the binding of Fas to its ligand
resulting in death receptor aggregation and the recruitment of adaptor proteins to the death
domain (DD) (Xu et al., 2016). The subsequent activation of caspase-8 leads to the
assembling of a death inducing signalling complex (DISC) (Barnhart et al., 2003), consisting
of adapter protein Fas-associated death domain (FADD), Fas and cellular FLICE inhibitory
protein (cFLIP) (Fulda & Debatin, 2006). The activation of the DISC results in the formation
of large amounts of caspase-8 which cleaves procaspase-3 and triggers the activation of
effector caspases 3, 6 and 7 (Bobé, 2002; Gordon & Kleinerman, 2010). These activated
effector caspases destroy cellular and nuclear structural proteins resulting in apoptosis
(Bobé, 2002).
The intrinsic pathway is activated by internal stimuli such as DNA damage (Xu et al., 2016).
This pathway is initiated by mitochondrial release of cytochrome c and Smac/Diablo, which
intensify caspase-3 concentration (Barnhart et al., 2003; Gordon & Kleinerman, 2010).
Figure 2.10: Fas apoptosis signalling pathway (adapted from Gordon & Kleinerman, 2010). The extrinsic (Type I) pathway is triggered by the ligation of Fas and its ligand FasL. This results in the formation of a death-inducing signalling complex (DISC) and subsequent activation of caspase-8. The activated caspase-8 cleaves effector caspases 3, 6 and 7 resulting in apoptosis. The intrinsic (Type II) pathway is triggered by internal stimuli and results in the formation of very little DISC and caspase-8 which is amplified by the formation of an apoptosome. The caspase-8 induces the mitochondria to release pro-apoptotic molecules cytochrome c and Smac/Diablo that intensifies caspase-3 concentration resulting in apoptosis.
Although AICD is a tightly regulated process, in chronic inflammatory conditions such T2DM,
the upregulation of Fas and PD-1 expression on activated T-cells inhibits the immune
response and may lead to T-cell exhaustion. (Nakanjako et al., 2011; Feuth et al., 2013) and
T-cell dysfunction (Cope, 2002; Schietinger & Greenberg, 2014)
19
2.6.2 Programmed cell death 1 (PD-1)
Programmed cell death 1 (CD279) is an immunoreceptor belonging to the CD28/CTLA-4
family that delivers a negative signal upon interacting with its two ligands programed ligand 1
(PD-L1) or programed ligand 2 (PD-L2) (Sharpe et al., 2007; Jin et al., 2011). The PD-1
receptor is expressed on activated T and B lymphocytes, monocytes, macrophages and
dendritic cells (Sharpe et al., 2007; Chinai et al., 2015). Thus, the expression of PD-1 on
CD4+ and CD8+ T-cells is indicative of on-going cell activation (Okazaki & Honjo, 2007;
Liechtenstein et al., 2012).
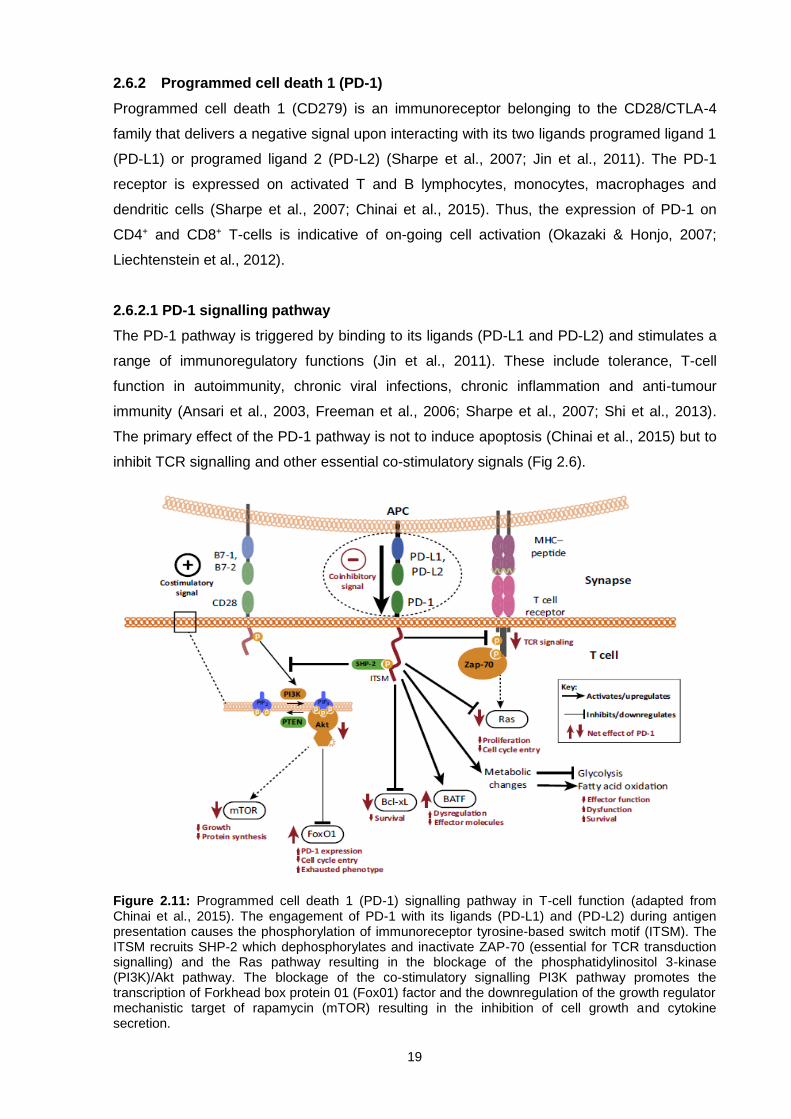
2.6.2.1 PD-1 signalling pathway
The PD-1 pathway is triggered by binding to its ligands (PD-L1 and PD-L2) and stimulates a
range of immunoregulatory functions (Jin et al., 2011). These include tolerance, T-cell
function in autoimmunity, chronic viral infections, chronic inflammation and anti-tumour
immunity (Ansari et al., 2003, Freeman et al., 2006; Sharpe et al., 2007; Shi et al., 2013).
The primary effect of the PD-1 pathway is not to induce apoptosis (Chinai et al., 2015) but to
inhibit TCR signalling and other essential co-stimulatory signals (Fig 2.6).
Figure 2.11: Programmed cell death 1 (PD-1) signalling pathway in T-cell function (adapted from Chinai et al., 2015). The engagement of PD-1 with its ligands (PD-L1) and (PD-L2) during antigen presentation causes the phosphorylation of immunoreceptor tyrosine-based switch motif (ITSM). The ITSM recruits SHP-2 which dephosphorylates and inactivate ZAP-70 (essential for TCR transduction signalling) and the Ras pathway resulting in the blockage of the phosphatidylinositol 3-kinase (PI3K)/Akt pathway. The blockage of the co-stimulatory signalling PI3K pathway promotes the transcription of Forkhead box protein 01 (Fox01) factor and the downregulation of the growth regulator mechanistic target of rapamycin (mTOR) resulting in the inhibition of cell growth and cytokine secretion.
20
The engagement of PD-1 with its ligands leads to inhibition of TCR transduction signalling by
inhibiting the phosphorylation of CD3ζ chain and Zap-70 resulting in the downregulation of
the Ras pathway responsible for cell survival and proliferation (Fig 2.11) (Chinai et al., 2015;
Wherry & Kurachi, 2015). In addition, PD-1 signalling initiates the phosphorylation of
intracellular immunoreceptor tyrosine-based switch motif (ITSM) and the immunoreceptor
tyrosine-based inhibitory motif (ITIM) (Liechtenstein et al., 2012).These phosphorylated
motifs initiate the recruitment of tyrosine phosphates, SHIP-1 and/or SHIP-2 which block the
co-stimulatory signalling phosphatidylinositol 3-kinase (PI3K)/Akt pathway (Xing & Hogquist,
2012; Chinai et al., 2015; Wherry & Kurachi, 2015). This pathway is crucial in delivering the
CD28 co-stimulatory signal essential for T-cell activation (Jin et al., 2011).
The blockage of the PI3K pathway increases the half-life of the transcription factor Forkhead
box protein 01 (Fox01) and downregulates the growth regulator mechanistic target of
rapamycin (mTOR) which collectively leads to the upregulation of PD-1 expression (Chinai et
al., 2015). Therefore, the PD-1 pathway provides co-inhibitory signalling that blocks CD28-
mediated activation of the PIK3 pathway resulting in reduced Akt phosphorylation and
glucose metabolism in T-cells (Freeman et al., 2006).
2.6.2.2 Regulation of PD-1 expression
The expression of PD-1 is upregulated on T-cells by TCR-mediated signalling and is
amplified by tumour necrosis factor (TNF) (Jin et al., 2011). Cytokine signalling plays a very
critical role in regulating the expression of PD-1. The release of IL-2, IL-7, IL-15 and IL-21
up-regulates PD-1 expression on T-cells (Chinai et al., 2015). Furthermore, IL-6 and IL-12
increases PD-1 expression by promoting the transcription of Pdcd1 gene that codes for PD-1
(Austin et al., 2014). Transcription factors such as T-bet directly repress transcription of
Pdcd1 gene (Kao et al., 2012).
However, in chronic inflammation, T-bet is downregulated promoting increased interaction of
FOX01 and the PD-1 promoter region resulting in the up-regulation of PD-1 expression
(Chinai et al., 2015). When T-cells are activated, members of the Nuclear Factor of Activated
T-Cells (NFAT) such as NFATc1 translocate into the nucleus and initiates the transcription of
the Pdcd1 gene leading to the up-regulation of PD-1 expression (Oestreich et al., 2009;
Austin et al., 2014). Therefore, the expression of PD-1 on T-cells is tightly regulated by a
combination of transcription factors and cytokine signalling (Fig 2.12).

21
Figure 2.12: Regulation of PD-1 expression by transcriptional factors and cytokine signalling (adapted from Chinai et al., 2015). Cytokine signalling via interleukin (IL) 2, IL-7, IL-15 and IL-21 upregulates the expression of PD-1. Furthermore, IL-6 and IL-12 acting via signal transducer and activator of transcription (STAT) 3 and 4 respectively, up-regulated PD-1 expression by activating the Pdcd1 gene via distal regulatory elements. Transcriptional factors such as Nuclear Factor of Activated T-Cells (NFAT)-c1 and Forkhead box protein 01 (Fox01) promotes the up-regulation of PD-1 by promoting the transcription of Pdcd1 gene. T-bet and Blimp-1 provides the negative inhibition of PD-1 by blocking the transcription of the Pdcd1 gene.
2.7 T-cell function in inflammatory conditions.
Antigen activation of naïve T-cells is key in the activation of adaptive immunity (Bonilla &
Oettgen, 2010). A fine balance between stimulatory and inhibitory regulation signals is
essential in maintaining immune homeostasis (Felderhoff-Mueser et al., 2000). However, in
T2DM, due to chronic inflammation, which is characterised by elevated levels of cytokine and
chemokines, the cell mediated signalling is persistently dysregulated (Lontchi-Yimagou et al.,
2013; Ozougwu, 2013). Thus, this dysregulation leads to chronic immune activation
characterised by upregulation of immune activation markers such as CD38 and HLA-DR on
T-cells (Smith et al., 2013).
After prolonged activation, the balance between activation antigens and inhibitory receptors
(FAS/PD-1 and others) is disrupted and ultimately leads to AICD (Freeman et al., 2006;
Sachdeva et al., 2010; Ward, 2010). This may also result in T-cell exhaustion, which is
characterised by the down regulation of positive co-stimulatory molecules such as CD28 and
the up-regulation of negative co-stimulatory molecules such as CTLA-4, PD-1 and Fas
(Askenasy et al., 2005; Sachdeva et al., 2010; Nakanjako et al., 2011; Shi et al., 2013,
Dieterlen et al., 2014).
2.7.1 CD38 and HLA-DR in inflammatory conditions
In inflammatory bowel disease (IBD), elevated levels of HLA-DR and CD38 on both CD4+ and
CD8+ T-cell have been reported (Funderburg et al., 2013). Furthermore, these were
associated with increased levels of pro-inflammatory cytokines (IL-2, IL-6, interferon ᵧ) and C-

22
reactive protein (CRP), which led to the conclusion that the damage to the gastrointestinal
tract in this condition may be due to dysregulated chronic T-cell activation (Funderburg et al.,
2013). Elevated expression of these markers on the surface of CD4+ and CD8+ T-cells have
also been described in individuals with Systemic lupus erythematosus (SLE), a chronic
autoimmune disorder which is also characterised by inflammation and cytokine release
imbalances (Viallard et al., 2001; Pavon et al., 2013). Increased HLA-DR expression on
circulating T-cells has also been reported in dilated cardiomyopathy, implicating chronic
inflammation as a contributing factor to the ongoing immune response observed in this
condition (Ueno et al., 2007).
The implications of inflammation and immune activation in human immunodeficiency virus
(HIV) infection has been extensively reported in the literature (Nakanjako et al., 2011; B.
Nkambule et al., 2015). The HIV induces a chronic inflammatory state that triggers immune
activation characterised by increased levels of pro-inflammatory cytokines and chemokines
and an up-regulation in the expression of immune activation markers (such as CD38 and
HLA-DR) on T-cells (Smith et al., 2013). Despite the use of antiretroviral (ARV) drugs, HIV
seropositive individuals still display increased T-cell activation (B. Nkambule et al., 2015),
albeit lower than in ARV naïve HIV seropositives (Hunt et al., 2008). The abnormally highly
activated (CD38+ HLA-DR+) T-cells observed in HIV infection is assumed to contribute to
progressive CD4 T-cell loss and progression to Acquired Immune Deficiency Syndrome
(AIDS) related death (Hunt et al., 2008; Smith et al., 2013).
Increased levels of HLA-DR and CD38 expression on both CD4+ and CD8+ T-cells have also
been reported in HIV/Hepatitis C virus (HCV) co-infection indicating increased immune
activation and poor prognosis (Feuth et al., 2013). In addition, high levels of alanine
transaminase (ALT), produced by the liver due to HCV infection have been correlated with
the up-regulated expression of CD38 and HLA-DR on T-cells (Feuth et al., 2013).
2.7.2 PD-1 and Fas in inflammatory conditions
Viruses exploit the PD-1/PD-L pathway to evade host immune effector mechanisms by
inducing anergy in virus-specific CD8+ T-cells (Fig 2.13) (Butte et al., 2007; Sharpe et al.,
2007). This has been described in chronic HIV infection, in which specific effector CD8+ T
cells showed a reduced capacity to produce cytokines and proliferate (Trautmann et al.,
2006). High immune exhaustion measured by increased levels of PD-1 on CD4+ and CD8+ T-
cells has been reported in HIV seropositive individuals (Trautmann et al., 2006; Nakanjako et
al., 2011). In hepatitis B virus (HBV) infection, upregulated levels of PD-1 on both CD4+ and
CD8+ intrahepatic mice T-cells has also been described (Tzeng et al., 2012). These studies
indicate that PD-1 expression on T-cells may serve as a useful and robust marker to
measure T-cell exhaustion in chronic immune activation states.

23
The expression of CD95 (Fas) on T-cells has been described in several studies as a pro-
apoptotic receptor in AICD (Bäumler et al., 1996; Tanner & Alfieri, 1999; Felderhoff-Mueser
et al., 2000). In that context, Fas mediated T-cell exhaustion was reported in HIV/HCV co-
infection (Feuth et al., 2013). Furthermore, increased CD4+ and CD8+ Fas mediated
apoptosis has also been described in HIV infection (Bäumler et al., 1996; Merlini et al.,
2012). The depletion of CD4+ in HIV infections is believed to contribute significantly to the
immunodeficiency observed in AIDS (Peter et al., 1997). Fas mediated T-cell apoptosis has
further been described in Epstein-Barr viral infection (Tanner & Alfieri, 1999).
Figure 2.13: PD-1-PD-L pathway inducing T-cell dysfunction in chronic viral inflammation (adapted from Freeman et al., 2006). A) Activated antigen presenting cell (APC) express the CD80/CD86 receptor complex that binds to CD28 expressed on the surface of naïve T-cells. This leads to the activation of T-cells and differentiation into effector T-cells. B) Upon activation, T-cells proliferate and provide effector responses by enhanced cytotoxic activity and pro-inflammatory cytokine production. C) Once the infection or stimulus resolves, long-lived memory T-cells are formed which express cell surface CD122 and CD127. D) However, if infection persists, as in the case of a chronic viral infection, T-cells upregulate the surface expression of PD-1 which upon binding to its ligand expressed on the surface of activated APC induces T-cell exhaustion.
Therefore, it appears that in chronic inflammatory conditions, in which there is prolonged
activation of T-cells, there is up-regulation and elevated expression of negative regulators
such as Fas and PD-1 on T-cells leading to exhaustion. Measurement of these markers
could therefore be utilised to analyse T-cell exhaustion.
2.8 Immune dysregulation and dysfunction in T2DM
Pro-inflammatory signalling from cytokines such as TNF-α, IL-1β and INF-ᵞ have been
reported to inhibit insulin signalling and induce obesity associated IR and subsequent
hyperglycaemia in T2DM (Hotamisligil et al., 1995; Chng et al., 2015). Hyperglycaemia
triggers pathways such as the aldose reduction pathway, advanced glycation end product
(AGE) pathway, reactive oxygen intermediate pathway and PKC pathway which collectively
24
give rise to the production of reactive oxygen species (ROS) and inflammatory mediators
(King, 2008).
The interaction between AGEs and its receptor RAGE, attracts immune cells into diffused
glycated tissue and subsequently activates them to induce a pro-inflammatory response by
secretion of pro-inflammatory cytokines in T2DM (Hu et al., 2015). Furthermore, the AGE-
RAGE interaction upregulates RAGE expression which activates the NF-kB, PI3K/Akt and
MAP kinase pathways resulting in further amplification of pro-inflammatory signals (King,
2008; Hu et al., 2015).
Altered lipolysis and necrosis of the hypertrophic adipose tissue causes an elevation of pro-
inflammatory saturated fatty acids which act as ligands for Toll-like receptors (TLRs) initiating
adipose tissue inflammation (Nikolajczyk et al., 2011). Interestingly, unlike in classical
inflammation, the adipose tissue infiltration starts with neutrophils followed by B-cells, T-cells
and finally monocytes/macrophages (Nikolajczyk et al., 2011). Hyperglycaemia has been
reported to induce neutrophil dysfunction by interfering with the myeloperoxidase (MPO) (Xiu
et al., 2014). Furthermore, activated neutrophils in T2DM have been reported to have
elevated levels of RAGE expression, increased adherence to adipocytes and impaired
phagocytic function (Nikolajczyk et al., 2011; Hu et al., 2015).
Peripheral blood monocytes in hyperglycaemia have been reported to secrete high levels of
pro-inflammatory cytokines such as TNF-α, IL-1β and IL-6 (Nikolajczyk et al., 2011; Xiu et al.,
2014). Interleukin 6 (IL-6) has also been reported to induce insulin resistance in
hyperglycaemia (Xiu et al., 2014). The activation of monocytes in T2DM has been attributed
to the presence of a TLR ligand rich milieu. However, contrary to these findings,
hyperglycaemia has been reported to supress HLA-DR expression on monocytes, thus
impairing its antigen presenting activity (Turina et al., 2006). In support of this, another study
reported that hyperglycaemia inhibits ROS production and the secretion of pro-inflammatory
cytokines (IL-6, IL-8, macrophage inflammatory protein-1 and TNF-α) by monocytes (Qadan
et al., 2010). These inconsistent results on the effect of hyperglycaemia on monocytes
cytokine secretion may be due to different model systems used in these studies.
Macrophages are important regulators of inflammation with the “M1” macrophages classified
as pro-inflammatory whilst the “M2” subset as anti-inflammatory (Nikolajczyk et al., 2011).
Reports suggest that tissue macrophages in obese and T2DM individuals are activated and
are major sources of pro-inflammatory cytokines (Nikolajczyk et al., 2011). In addition, both
“M1” and “M2” macrophages utilise glucose and fatty acids as energy sources (Nikolajczyk et
al., 2011). A further study reported on the effects of hyperglycaemia on cytokine secretion by
macrophages revealed that hyperglycaemia induced the secretion of IL-1β, TNF-α (pro-
25
inflammatory) and IL-1Ra (anti- inflammatory) cytokines whilst suppressing the production of
macrophage inflammatory protein-4 (MIP-4) (Moganti et al., 2016). These studies suggest
that hyperglycaemia could induce an unbalanced production of inflammatory cytokines which
may contribute to the chronic inflammatory state observed in individuals with
hyperglycaemia.
Therefore, low grade chronic inflammation, cytokine generation and the activation of innate
immune cells play an important role in the development of insulin resistance and the
pathogenesis of T2DM (Pickup & Crook, 1998; King, 2008; Kumar et al., 2014; Chng et al.,
2015; Moganti et al., 2016). However, recent findings have revealed that these processes
are not only limited to the innate immune response but also involves the adaptive immune
response mediated by T-cells (Wu et al., 2011; Fang et al., 2015)
2.8.1 T-cell function in hyperglycaemia
Hyperglycaemia in T2DM has been reported to induce macrophages to produce IL-12 which
stimulates the CD4+ T-cell subset to produce INF-ᵞ which in turn primes macrophages to
stimulate the T-helper (Th) pro-inflammatory subsets (Th1 and Th17) (Wu et al., 2011; Ip et
al., 2015). The frequency of these circulating Th pro-inflammatory subsets is increased
compared to Tregs, thus resulting in a systemic pro-inflammatory state in T2DM (Wu et al.,
2011; Chng et al., 2015). A flow cytometry based study on the effects of hyperglycaemia on
myocardial infarction (MI) showed that newly diagnosed and hyperglycaemic patients with MI
who had not received therapy, had higher expression of HLA-DR on T-cells (both CD4+ and
CD8+ subsets) and increased CRP levels compared to the normoglycaemic patients (Marfella
et al., 2003). These results suggest that hyperglycaemia may cause activation of T-cells.
However, the diagnosis of hyperglycaemia in this study was done solely based on random
glucose levels upon admission to the emergency department. This criterion did not take into
account factors such as diet which may elevate the glucose levels.
In support of these findings, elevated levels of T-cell pro-inflammatory cytokines (IL-2, IL-1β
and TNF-α) was reported in hyperglycaemia-induced T-cells from healthy non-diabetic
individuals (Stentz & Kitabchi, 2005). Although these findings suggests that hyperglycaemia
may cause further activation of the immune system by pro-inflammatory cytokine release, the
sample size of only five (5) participants was too small to make conclusions. Interestingly, this
study also revealed that hyperglycaemia induces the development of insulin signalling
protein such as insulin receptor substrate 1 (IRS-1) on T-cells which may be a protective
mechanism against glucotoxicity (Stentz & Kitabchi, 2005). Further studies are required to
investigate T-cell insulin receptors in chronic hyperglycaemia.

26
The secretion of the pro-inflammatory cytokine IL-17 by CD4+ T-cells in T2DM has been
reported to trigger the NF-kB pathway and stimulate granulocytes (Nikolajczyk et al., 2011).
Collectively, these studies suggest that hyperglycaemia may induce the activation of T-cells
with the release of pro-inflammatory cytokines which ultimately results in chronic
inflammation.
In contrast to the above, decreased tyrosine-phosphorylation was reported in hyperglycaemic
Jurkat T-cells compared to an untreated control group (Boldizsar et al., 2002). This flow
cytometry based study reported glucose concentration-depended elevation of basal cytosolic
free calcium levels at a baseline state. Both these findings resulted in abnormal calcium
homeostasis and reduction in calcium mediated T-cell transduction signalling which is
essential for the activation of T-cells (Guy & Vignali, 2009). This study therefore suggested
that hyperglycaemia inhibits T-cell activation by disrupting calcium transduction signalling.
However it is essential to note that the T-cells used in this study were Jurkat cells and may
not reflect normal T-cells in vivo. Based on these reports, the activation state of T-cells in
T2DM still requires investigation. The use of T-cell activation markers such as HLA-DR and
CD38 may help clarify if the T-cell dysfunction in T2DM is due to hyperglycaemia inducing or
inhibiting T-cell activation.
The dysregulation of T-cell negative co-stimulatory factors have been implicated in the
pathogenesis of T2DM. Upregulation of PD-1 on CD4+ T-cells and their subsequent
resistance to apoptotic signalling was described as a contributing factor to T-cell dysfunction
in T2DM (Shi et al., 2013). In a nonobese diabetic (NOD) mouse model, inhibition of the PD-
1-L pathway by addition of anti PD-1 and anti-PD-L1 to pre-diabetic NOD mice, led to rapid
and exacerbated diabetes with both CD4+and CD8+ T-cells releasing increased
concentrations of pro-inflammatory factors (INF-ᵧ and TNF), responsible for insulitis in T1DM
(Ansari et al., 2003). Thus, the PD-1 pathway is crucial in regulating effector T-cell function
by inhibiting auto-immune responses in T1DM.
A study investigating the expression of PD-1 on T-cells in known T2DM and severe sepsis
reported an upregulation of PD-1 on CD4+ and CD8+ circulating T-cells in both conditions
compared to healthy controls (Jia et al., 2016). These findings suggest that there is a
significant level of immune exhaustion in T2DM and severe sepsis, which predispose
individuals to infections. In concordance with these findings, increased levels of PD-1
expression on lymphocytes was reported in both proliferative diabetic retinopathy and known
T2DM cases compared to normoglycaemic controls (Fang et al., 2015). Interestingly, the
same study reported decreased messenger RNA (mRNA) expression of PD-1 in both
conditions compared to the normoglycaemic group using real time polymerase chain reaction
(PCR) (Fang et al., 2015). It is important to note that this study analysed PD-1 expression on
27
all lymphocytes and did not isolate any specific T-cell subset. Collectively, these findings
support the theory that hyperglycaemia is involved in the initiation of diabetic pathologies and
may induce activation-induced apoptosis of lymphocytes by PD-1.
Contrary to this, a further study showed that hyperglycaemia inhibits the expression of CTLA-
4 (a negative co-stimulatory marker) on T-cells (Marfella et al., 2003). This further supports
the findings that hyperglycaemia interferes with the autoregulation of activated T-cells.
However, this raises a question; “Does hyperglycaemia cause an increase or decrease in the
expression of negative co-stimulatory markers on T-cells”?
These contradictory findings in the literature could be explained by differences in the
population groups, medication and methodologies. Therefore, further research is required to
investigate the effects of hyperglycaemia on the activation and control of T-cell function.
Fas-induced lymphocytes and pancreatic β-cell death has been well described in the
pathogenesis of T1DM (DeFranco et al., 2001; Cnop et al., 2014). In T2DM, an upregulation
of Fas expression in the adipose tissue and pancreatic β-cells has been reported to cause
insulin insensitivity, hyperglycaemia and pro-inflammatory cytokine release (Nolsøe et al.,
2006; Blüher et al., 2014). Although these studies indicate Fas involvement in the
inflammation process and immune dysfunction in T2DM, studies investigating the effect of
hyperglycaemia on Fas expression on T-cells in T2DM are limited. Therefore this study aims
to investigate this unknown phenomenon.
2.9 Conclusions
The effect of hyperglycaemia on cells of the innate immune system in T2DM has been well
described and implicated in the progression of the disease and the development of
complications such as increased susceptibility to infection and thrombotic events. However,
studies investigating the adaptive immune response, mediated by T-cells, and their role in
the pathogenesis still remain scarce and controversial.
The T-cell mediated adaptive immune response has been well described in the pathogenesis
and progression of various other chronic inflammatory conditions. Notably, the continuous
activation of T-cells marked by expression of activation markers and their subsequent
release of pro-inflammatory cytokines has the potential to induce T-cell exhaustion and
initiate AICD. Therefore, the investigation of T-cells in hyperglycaemic conditions could
provide further insight into the immune dysfunction in T2DM as well as assist in identifying
pathways which could be targeted in disease management and treatment.
The aim of this study is to investigate markers of chronic immune activation and T-cell
function in hyperglycaemia and to test the hypothesis; “Hyperglycaemia in uncontrolled

28
hyperglycaemic individuals induces a low grade chronic inflammatory state that causes
continuous activation of T-cells which may result in immune dysregulation and exhaustion”.

29
CHAPTER THREE
MATERIALS AND METHODS
3.1 Participants and Sampling
Sixty nine (69) participants of mixed ancestry were recruited from the Bellville South, Ward 9
area, under the Tygerberg District of Bellville in the Western Cape, South Africa. Informed
consent was obtained from participants (see Addendum 1) and this project forms part of an
ethically approved (CPUT/HW-REC 2013/H44) larger study. Ethical clearance was obtained
for this study from the Cape Peninsula University of Technology (CPUT) research ethics
committee; Ref No CPUT/HW-REC 2015/H26 (see Addendum 2). The study was conducted
according to the Code of Ethics of the World Medical Association (Declaration of Helsinki
2013) and all participants signed written informed consent after all the procedures had been
fully explained in the language of their choice. Computer generated codes were used to
identify all participants in order to protect their confidentiality and to avoid bias. The glucose
status of all participants was not revealed to the researcher until after data analysis.
3.1.1 Inclusion Criteria
Participants included in this study gave informed consent, were over 20 years of age, fasting,
not pregnant and had not taken any medication for recent infection.
3.1.2 Exclusion Criteria
Participants were excluded if they showed and/or reported any evidence of; current or recent
acute illness, co-existing chronic illness, use of steatogenic medications or drugs that
interfere with the immune system and family history of atopy. This was achieved by use of
questionnaires and interviews.
3.1.3 Sample Collection
Fasting and two hours post the oral glucose tolerance test (OGTT), venous blood was
collected into 4.5ml and 10ml tubes of EDTA, sodium citrate and serum separator tube (SST)
by qualified nurses/phlebotomists. Blood collected in sodium citrate was used in flow
cytometry analysis as it has been reported to be suitable for T-cell activation studies
(Hoffmeister et al., 2003; Mallone et al., 2011). Blood drawn in EDTA, SST and sodium
citrate (10ml) was used for biochemical and routine haematological analysis. Samples were
kept at room temperature to avoid any effects of temperature fluctuations on T-cell viability
and activation. The time frame from sample collection to analysis was limited to 1-2 hours.

30
3.1.4 Clinical Measurements
Clinical parameters were measured by trained clinical personnel and included weight, height,
hip-to-waist circumference and blood pressure. Other parameters such as the body mass
index (BMI) were calculated using the formula BMI = 𝐵𝑜𝑑𝑦 𝑚𝑎𝑠𝑠 (𝐾𝑔)
ℎ𝑒𝑖𝑔ℎ𝑡 (𝑚)2 (Catalán et al., 2007).
3.1.5 Biochemical Measurements
Biochemical and routine haematological parameters tests were performed at the National
Heath Laboratory Service (NHLS) and Pathcare laboratories which are both accredited by
the South African National Accreditation Systems (SANAS). The analytes and parameters
measured are shown in table 3.1. Other parameters measured were serum CRP levels, full
lipid profile, white cell differential count and full blood counts (FBC).
Table 3.1: Biochemical and routine haematological parameters measured
Analyte Method Equipment used
Plasma glucose (mmol/L)
Enzymatic Hexokinase Beckman AU (Beckman Coulter, Miami, USA)
HbA1c (%)
High Performance Liquid Chromatography
Bio-Rad Variant Turbo (Bio-Rad, California,
USA)
Insulin (mmol/L)
Paramagnetic Particle Chemiluminescence
Assay
Beckman DXI (Beckman Coulter, Miami, USA)
Lymphocyte Absolute count
Impedance Method Coulter LH 750 Haematology Analyser
(Beckman Coulter, Miami, USA)
Lipids Profile (mmol/L)
Friedwald’s Formula Cobas 600 Roche Diagnostics
(Indiana, USA)
Full blood count (cells/µl)
Impedance Method Coulter LH 750 Haematology Analyser
(Beckman Coulter, Miami, USA)
Ultra-sensitive (U-CRP)
Latex Particle Immunoturbidimetric
Beckman AU (Beckman Coulter, Miami, USA)
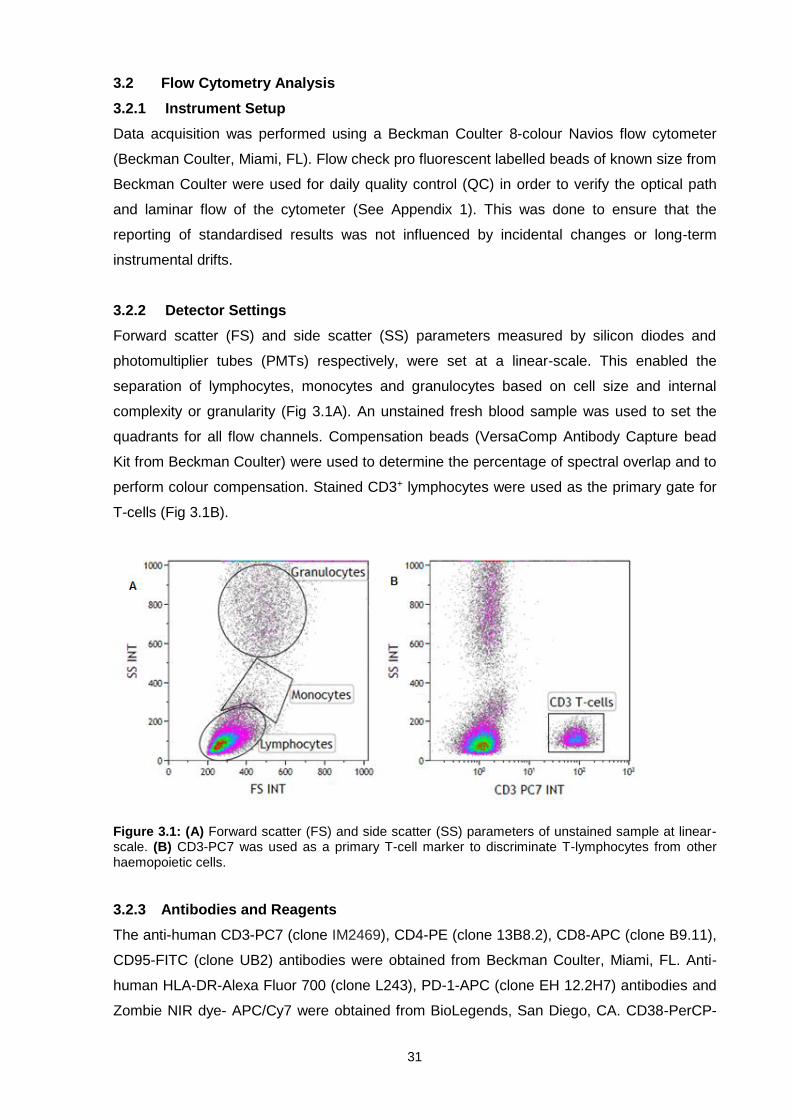
31
3.2 Flow Cytometry Analysis
3.2.1 Instrument Setup
Data acquisition was performed using a Beckman Coulter 8-colour Navios flow cytometer
(Beckman Coulter, Miami, FL). Flow check pro fluorescent labelled beads of known size from
Beckman Coulter were used for daily quality control (QC) in order to verify the optical path
and laminar flow of the cytometer (See Appendix 1). This was done to ensure that the
reporting of standardised results was not influenced by incidental changes or long-term
instrumental drifts.
3.2.2 Detector Settings
Forward scatter (FS) and side scatter (SS) parameters measured by silicon diodes and
photomultiplier tubes (PMTs) respectively, were set at a linear-scale. This enabled the
separation of lymphocytes, monocytes and granulocytes based on cell size and internal
complexity or granularity (Fig 3.1A). An unstained fresh blood sample was used to set the
quadrants for all flow channels. Compensation beads (VersaComp Antibody Capture bead
Kit from Beckman Coulter) were used to determine the percentage of spectral overlap and to
perform colour compensation. Stained CD3+ lymphocytes were used as the primary gate for
T-cells (Fig 3.1B).
Figure 3.1: (A) Forward scatter (FS) and side scatter (SS) parameters of unstained sample at linear-scale. (B) CD3-PC7 was used as a primary T-cell marker to discriminate T-lymphocytes from other haemopoietic cells.
3.2.3 Antibodies and Reagents
The anti-human CD3-PC7 (clone IM2469), CD4-PE (clone 13B8.2), CD8-APC (clone B9.11),
CD95-FITC (clone UB2) antibodies were obtained from Beckman Coulter, Miami, FL. Anti-
human HLA-DR-Alexa Fluor 700 (clone L243), PD-1-APC (clone EH 12.2H7) antibodies and
Zombie NIR dye- APC/Cy7 were obtained from BioLegends, San Diego, CA. CD38-PerCP-

32
Cy5.5 (clone HIT2) was obtained from Becton, Dickinson, New Jersey . Phosphate buffered
saline (PBS) without Ca2+ or Mg2+ was obtained from Lonza, Belgium and VersaLyse buffer
from Beckman Coulter, Miami, FL.
3.2.4 Fluorescence Minus One (FMO)
Fluorescence minus one (FMO) controls were used to accurately identify positive events by
discriminating cells that exhibited fluorescence signals from those that did not (see Appendix
2). An FMO control sample contains all other flourochrome-conjugated antibodies except for
the one of interest. Positive events were defined by a higher mean fluorescence intensity
(MFI) value than that of the negative MFI. The use of an FMO control was important in this
study as it enabled the identification of cell surface markers that can be up-regulated or
down-regulated as well as the discrimination of low signals when the positive population
does not separate well from the negative. Furthermore, quadrants were then set close to the
negative population as possible to exclude non-specific binding and/or auto-fluorescence.
3.3. Optimisation
3.3.1 Antibody Titration
Five (5) different concentrations of each monoclonal antibody (mAb) were used to determine
the optimal concentration of each antibody to be used when making up the mAb cocktail.
Signal to noise ratios were then calculated using formula; Signal to noise ratio = 𝑃𝑜𝑠𝑖𝑡𝑖𝑣𝑒 𝑀𝐹𝐼
𝑁𝑒𝑔𝑎𝑡𝑖𝑣𝑒 𝑀𝐹𝐼 x
100 (Hulspas, 2010). The volume with the highest signal to noise ratio was chosen as the
optimum mAb volume titration for each particular antibody used in a specific panel (see
Appendix 3).
3.3.2 Glucose Incubation Time
Fifty microliters (50µl) of sodium citrate blood from three samples was added to 20µl of three
different glucose concentrations (2mmol/l, 5mmol/l and 30mmol/l) mimicking hypoglycaemia,
normoglycaemia and hyperglycaemia respectively (Oleszczak et al., 2012). Four 15 minutes
incubation time intervals (15, 30, 45 and 60 minutes) were investigated to determine the best
optimum glucose incubation time for the functional test protocol prior to the staining
procedure. This was achieved by measuring percentages of T-cell (CD4) recovery (see
Appendix 4). An incubation period of 45 minutes was selected and used as the optimum
glucose incubation time.
3.3.3 T-Cell Viability Control Test
Zombie NIR-APC/Cy7 fixable viability kit dye was used to verify the viability of cells and T-
cell recovery post the 45 minutes incubation. The T-cell viability control test demonstrated
33
that the incubation time and staining techniques applied in this study did not influence cell
survival (see Appendix 5).
3.4. Immune Measurements
3.4.1 Baseline Protocol
3.4.1.1 Baseline measurements of T-cell antigen expression
In order to determine the baseline levels of immune activation, 50µl of citrated whole blood
was pipetted into two tubes. The first tube was stained with 5µl of a mAb cocktail containing
CD3-PC7 (clone IM2469), CD4-PE (clone 13B8.2), CD8-APC (clone B9.11), CD38-PerCP-
Cy5.5 (clone HIT2), HLA-DR-Alexa Fluor 700 (clone L243) and CD95-FITC (clone UB2). The
second tube was stained with CD3-PC7 (clone IM2469), CD4-PE (clone 13B8.2), CD38-
PerCP-Cy5.5 (clone HIT2), CD95-FITC (clone UB2) and PD-1-APC (clone EH 12.2H7).
Thereafter, the mixture was incubated at room temperature in the dark for 15 minutes. Five
hundred microliters (500µl) of VersaLyse lysing buffer (Beckman Coulter, Miami, FL) was
then added (to lyse RBCs) and incubated at room temperature in the dark for a further 15
minutes. Thereafter, 500µl of dilution buffer (PBS without Ca2+ or Mg2+) (Lonza, Belgium) was
added and the samples were acquired using the 8-colour Navios flow cytometer (Beckman
Coulter, Miami, FL). The Kaluza analysis software (V1.3) (Beckman Coulter, Miami, FL) was
used for data analysis. The percentage expression and MFI of the selected markers were
then recorded.
3.4.2 Incubation protocol
3.4.2.1 The effects of glucose on T-cell antigen expression
A total of 31 participants (16 with hyperglycaemia and 15 controls) from the total population
of 69 were randomly selected into this protocol. In order to evaluate the effects of glucose on
T-cell antigen expression, 20µl of three different glucose concentrations (2mmol/l, 5mmol/l
and 30mmol/l) mimicking hypoglycaemia, normoglycaemia and hyperglycaemia respectively
(Oleszczak et al., 2012) were used. Briefly, 50µl of citrated whole blood was incubated at
37oC for 45 minutes in the presence of glucose at varying concentrations (2mmol/l, 5mmol/l
and 30mmol/l). The samples were then stained using 5µl of mAb cocktail containing CD3-
PC7 (clone IM2469), CD4-PE (clone 13B8.2), CD8-APC (clone B9.11), CD38-PerCP-Cy5.5
(clone HIT2), HLA-DR-Alexa Fluor 700 (clone L243), CD95-FITC (clone UB2) and PD-1-APC
(clone EH 12.2H7). The mixture was then incubated at room temperature in the dark for 15
minutes. Five hundred microliters (500µl) of VersaLyse lysing buffer (Beckman Coulter,
Miami, FL) was then added and incubated at room temperature in the dark for 15 minutes.
Thereafter, 500µl of PBS (without Ca2+ or Mg2+) (Lonza, Belgium) was added and the
samples were then loaded into the 8- colour Navios flow cytometer (Beckman Coulter) for

34
acquisition. The Kaluza analysis software (V1.3) (Beckman Coulter, Miami, FL) was used for
data analysis.
3.4.3 Gating Strategy
An unstained fresh blood sample was used as the negative control in all histograms to
correct for autofluorescence as well as distinguishing positive from negative events (Fig
3.2C-F). The T-cell population was identified by using CD3-PC7 and SS (Fig 3.2A) and T-
helper and T-cytotoxic cells were identified as CD3+CD4+ and CD3+CD8+ respectively (Fig
3.2B). The percentage (%) expression and MFI of CD38, HLA-DR, CD95 and PD-1 on T-
cells were assessed and recorded. A total of 10 000 events were acquired per sample and
in the case of those with low cell count, acquisition was done up to 3 minutes.
Figure 3.2: T-cell gating strategy. Plot A Illustrates the primary gate for T lymphocytes using the side scatter properties and CD3+ events. Plot B shows further sub-classification of T-cells into T-helper cells (CD3+CD4+) and cytotoxic T-cells (CD3+CD8+). C-F) The histograms illustrates how positive events were determined from negative events using FMOs. The percentage expression and MFI of HLA-DR (C), CD38 (D), PD-1 (E) and CD95 (F) on T-cells were then recorded.
3.6 Statistical Analysis
Statistica statistical software was used for all statistical analysis. Medians and/or means were
used as measures of central location for ordinal and continuous responses and standard
deviations and quartiles as indicators of spread. Relationships between two continuous

35
variables were analysed with regression analysis and the strength of the relationship
measured with the Pearson correlation and where the continuous variables were not
normally distributed, Spearman correlation was used. When one continuous response
variable was related to several other continuous input variables, multiple regression analysis
was used and the strength of the relationship was measured with multiple correlations.
For randomized non-parametric designs, the Mann-Whitney U test or the Kruskal-Wallis test
was used and data was presented as median and interquartile ranges. The student t-test
was used for parametric data and results presented as mean (±2SD) and standard deviation.
The relationship between two nominal variables was investigated with contingency tables
and likelihood ratio chi-square tests. A p-value of p < 0.05 represented statistical significance
in hypothesis testing and 95% confidence intervals were used to describe the estimation of
unknown parameters.

36
CHAPTER FOUR
RESULTS
4.1 Individual demographics
This cross-sectional study included a total of 69 participants from Bellville South, Western
Cape, South Africa. Of these, 34 were hyperglycaemic, that is with a 2hr oral glucose
tolerance test (OGTT) value of > 7.8mmol/l (140mg/dl) and included individuals with DM, IFG
and/or IGT according to the WHO classification and 35 were normoglycaemic (WHO, 2006).
The median age of the normoglycaemic group was 53.0 years (40.0-61.5) and 56.0 years
(52.0-62.0) in the hyperglycaemic group, p=0.0567. The median BMI was above the normal
reference range (18.50-24.99) in both groups with a value of 29.2 (24.4-34.5) in
normoglycaemia compared to 31.3 (29.3-34.9) in the hyperglycaemic group, p=0.1041 (see
table 4.1). A total of 14% of the participants were male and 86% were female.
Table 4.1: Participants demographics
Parameter Total N69
Normal N35
Hyperglycaemia N34
P=value
Median (25Q-75Q)
Age (years) 56.0 (47.0-62.0) 53.0 (40.0-61.5) 56.0 (52.0-62.0) 0.0567
BMI 30.5 (26.2-34.8) 29.2 (24.4-34.5) 31.3 (29.3-34.9) 0.1041
Waist (cm) 97.5 (88.5-105.0) 94.0 (80.3-102.8) 100.9 (92.8-106.8) 0.0866
4.2 Biochemical parameters
The hyperglycaemic group had significantly elevated fasting glucose levels with median
values of 5.90mmol/L (5.40-6.20) compared to the normoglycaemic group with a value of
5.10mmol/L (4.65-5.40), p<0001. In addition, the 2 hour oral glucose tolerance test (OGTT)
was significantly increased in the hyperglycaemic group 9.25mmol/L (8.40-11.00) compared
to the normoglycaemic group 5.85mmol/L (4.85-7.00), p<0.0001. The HbA1c levels were
also significantly increased in the hyperglycaemic group at 6.30% (6.00-6.60) compared to
the normoglycaemic group 5.75% (5.40-6.05), p < 0.001.
Likewise, the median insulin levels were significantly higher in the hyperglycaemic group
9.95mIU/L (7.20-16.30) compared to the normoglycaemic group 6.55mIU/L (4.10-9.35),
p=0.0092. Median values for ultra-sensitive C-reactive protein (CRP) and lipids (triglycerides,
LDL Cholesterol and HDL cholesterol) were higher in the hyperglycaemic group than in the
normoglycaemic group. However, there was no statistical significant difference between the
two groups of individuals (see Table 4.2).

37
Table 4.2: Biochemical parameters
Parameter Reference
ranges
Median (25Q-75Q)
P=value
Normal N35
Hyperglycaemia N34
Fasting Glucose (mmol/L)
4.10 - 5.60 5.10 (4.65-5.40) 5.90 (5.40-6.20) 0.0001
2 hr OGTT (mmol/L)
<7.80 5.85 (4.85-7.00) 9.25 (8.40-
11.00) < 0.0001
HbA1c (%)
4.50-6.30
5.75 (5.40-6.05) 6.30 (6.00-6.60) < 0.0001
Insulin Fasting (mIU/L)
0.20-9.40
6.55 (4.10-9.35) 9.95 (7.20-
16.30) 0.0092
Triglycerides (mmol/L)
1.80-2.20
1.13 (0.95-1.56) 1.63 (1.28-2.36) 0.1368
LDL Cholesterol (mmol/L)
1.00-3.00
3.65 (3.20-4.55) 3.95 (3.20-4.50) 0.9586
HDL Cholesterol (mmol/L)
1.00-1.50 1.20 (1.10-1.50) 1.40 (1.10-1.50) 0.6398
Ultra-sensitive CRP
(mg/L) 1.00-3.00 4.84 (2.49-6.83)
8.72 (3.37-18.36)
0.1764
Significant values (p<0.05) are in bold text, Median [IQR].

38
4.3 Haematological parameters
There was no significant difference in the haematological parameters between the
hyperglycaemic and control group (table 4.3).
Table 4.3: Haematological parameters
Full blood counts
Reference range
Median (25Q-75Q)
P=value Normal
N35
Hyperglycaemia N34
Red Cell Count (x1012/L) 4.5-5.5 x10¹²/L 4.61 (4.19-4.90 ) 4.76 (4.54-5.01 ) 0.2617
Haematocrit (L/L) 40.0-50.0 % 0.41 (0.38-0.43) 0.41 (0.41-0.44) 0.2210
Haemoglobin (g/dL) 13.0-17.0 g/dL 12.9 (12.4-14.0) 13.6 (12.9-14.3) 0.2056
MCV (fl) 79.1-98.9 fl 88.0 (83.0-92.0) 87.5 (84.0-92.0) 0.8296
MCH (pg) 27.0-32.0 pg 29.0 (26.0-30.0) 28.0 (27.0-30.0) 0.7982
MCHC (g/dL) 32.0-36.0 g/dL 32.0 (32.0-33.0) 33.0 (32.0-33.0) 0.7049
RDW (%) 11.6-14.0 % 14.4 (13.5-15.0) 14.2 (13.5-15.0) 0.3762
White Cell Count (x109/L)
4.0-10.0 x10⁹/L 6.60 (5.60-7.90) 7.50 (6.50-9.40) 0.1444
Lymphocytes % 20-40 % 30.7 (25.5-40.0) 31.5 (25.4-39.0) 0.9024
Lymphocytes ABS (x109/L)
1.0-3.0 x10⁹/L 2.20 (1.80-2.55) 2.35 (1.90-3.00) 0.1107
Monocytes % 2.0-10.0 % 6.05 (5.05-7.60) 5.30 (4.50-7.10) 0.1886
Monocytes ABS (x109/L) 0.2-1.0 x10⁹/L 0.40 (0.36-0.50) 0.40 (0.37-0.50) 0.6968
Neutrophils % 40-80 % 58.9 (50.2-65.6) 59.3 (51.8-68.0) 0.7301
Neutrophils ABS (x109/L)
2.0-7.0 x10⁹/L 3.95 (2.85-4.90) 4.75 (3.30-6.00) 0.2342
Basophils % <1.0-2.0 % 0.40 (0.30-0.50) 0.40 (0.30-0.50) 0.5576
Basophils ABS (x109/L) 0.02-.01 x109/L 0.01 (0.01-0.01) 0.01 (0.01-0.01) 0.1361
Eosinophils % 1.0-6.0 % 2.15 (1.55-3.80) 1.65 (1.20-2.80) 0.2642
Eosinophils ABS (x109/L)
0.02-0.5 x10⁹/L 0.20 (0.10-0.20) 0.10 (0.10-0.20) 0.6033
Platelet Count (x109/L) 137-373 x109/L 264 (229-308) 259 (226-327) 0.9808

39
4.4 T-cell antigen expression in normoglycaemia and hyperglycaemia participants
The percentage (%) of T-cells expressing CD95, CD38 and HLA-DR was not significantly
different in the hyperglycaemic group when compared to the normoglycaemic group pre
glucose incubation. The same pattern was observed when the mean fluorescent intensity
(MFI) was compared between the two groups. There was also no significant difference
between the % of T-cells expressing PD-1 between the two groups, p=0.8837. The same
trend was observed when comparing the MFI, p=0.5904 (see table 4.4).
Table 4.4: Pre incubation T-cell marker expression in hyperglycaemia and normoglycaemia
%
Median (Q25-75)
P MFI
Median (Q25-75)
P
Normal
HG
Normal
HG
CD3 CD3
CD3+
%CD95+
30.17 (25.62-36.37)
N35
28.67 (25.73-35.33)
N34 0.7225
CD3+
MFICD95+
3.25 (3.13-3.34)
N35
3.20 (3.10-3.27)
N35 0.2615
CD3+
%HLA-DR+
20.99 (16.29-26.32)
N24
17.81 (13.65-24.30)
N26 0.3570
CD3+
MFIHLA-DR+
2.09 (1.92-2.32)
N24
2.22 (1.94-3.19)
N26 0.9245
CD3+
%CD38+
10.57 (7.60-22.22)
N3
17.95 (11.80-23.34)
N7 0.4337
CD3+
MFICD38+
5.06 (2.82-5.27)
N3
2.97 (2.61-3.15)
N7 0.4899
CD3+
%PD1+
22.09 (16.99-26.05)
N26
19.85 (15.97-25.72)
N27 0.8837
CD3+
MFIPD1+
18.32 (17.38-19.79) N26
17.91 (15.82-20.45)
N28 0.5904
CD4 CD4
CD4+
%CD95+
50.18 (45.29-54.70)
N35
50.75 (43.93-56.60)
N34 0.9282
CD4+
MFICD95+
3.06 (2.93-3.15)
N35
2.98 (2.89-3.12)
N35 0.2578
CD4+ %HLA-
DR+
11.04 (7.80-14.77)
N24
11.53 (8.36-16.31)
N26 0.9393
CD4+
MFIHLA-DR+
2.99 (2.70-4.92)
N24
3.17 (2.69-4.26)
N25 0.3348
CD4+
%CD38+
25.25 (18.25-32.25)
N2
29.44 (15.13-38.14)
N7 0.8261
CD4+
MFICD38+
3.48 (3.29-3.66)
N2
3.18 (2.75-4.44)
N7 0.8897
CD4+
%PD1+
19.05 (16.82-23.91)
N26
20.96 (16.53-25.87)
N27 0.5196
CD4+
MFIPD1+
18.81 (17.10-20.70) N26
18.97 (17.33-20.82)
N28 0.8095
CD8 CD8
CD8+
%CD95+
25.27 (14.95-32.12)
N35
22.51 (18.49-30.93)
N34 0.8268
CD8+
MFICD95+
2.50 (2.43-2.60)
N35
2.49 (2.37-2.56)
N34 0.4691
CD8+
%HLA-DR+
29.21 (21.80-34.55)
N23
25.40 (16.37-37.25)
N24 0.4776
CD8+
MFIHLA-DR+
2.16 (2.00-2.51)
N23
2.24 (2.01-2.60)
N23 0.3636
CD8+
%CD38+
17.03 (17.03-17.03)
N1
26.50 (25.27-42.51)
N5
0.4383 CD8+
MFICD38+
2.64 (2.64-2.64)
N1
4.34 (3.25-4.74)
N5 0.2130
HG- Hyperglycaemia

40
4.5 The effects of glucose on T-cell antigen expression
To investigate the effects of ex vivo hyperglycaemic conditions on antigen expression, 31 (16
hyperglycaemic and 15 normoglycaemic individuals) of the 69 participants were randomly
selected and their T-cells incubated with 30mmol/L glucose concentration for 45 minutes.
4.5.1 Fas (CD95)
Although not statistically significant, the MFI and % of CD3+ T-cells expressing CD95 after
exposure to glucose was decreased in both hyperglycaemic and normoglycaemic groups.
There was however a significantly decreased percentage of CD4+ T-cells expressing CD95
after incubation with glucose in the normoglycaemic group (p=0.0213) and while the MFI was
also lower after incubation this was not statistically significant. A similar pattern was
observed in the hyperglycaemic group of participants, in which a significantly reduced
percentage of CD4+ T-cells expressed CD95 in hyperglycaemic conditions (p=0.0349) (See
Fig 4.1 and Table 4.5).
Figure 4.1: The percentage of CD4+ T-cells expressing CD95 in normoglycaemia and hyperglycaemia. Plot A shows how the percentage expression and MFI of CD95 was determined. An FMO was used as a negative control to distinguish positive from negative evens. B) The median % of CD4+ T-cells expressing CD95 was significantly decreased in both normoglycaemic and hyperglycaemic group after incubating with 30 mmol/L glucose, p=values 0.0213 and 0.0349 respectively.

41
Table 4.5: CD95 expression on T-cells pre and post glucose incubation
Median IQR
Normoglycaemia
P
Pre incubation Post incubation
CD3+%CD95+ 31.8(26.9-40.4) 26.5(21.3-32.1) 0.0967
CD4+%CD95+ 51.35(46.56-56.34) 42.82(37.64-48.80) 0.0213
CD8+%CD95+ 27.1(17.1-33.4) 21.4(14.7-26.6) 0.2186
CD3+MFICD95+ 3.27(3.20-3.33) 3.17(3.09-3.24) 0.0620
CD4+MFICD95+ 3.06(2.96-3.11) 2.96(2.85-3.01) 0.0924
CD8+MFICD95+ 2.50(2.44-2.61) 2.48(2.41-2.59) 0.5867
Hyperglycaemia
Pre incubation Post incubation
CD3+%CD95+ 29.9(26.3-34.0) 23.3(18.6-32.4) 0.1103
CD4+%CD95+ 49.27(44.13-55.76) 41.73(29.34-53.84) 0.0349
CD8+%CD95+ 24.0(19.0-31.9) 18.1(13.7-28.3) 0.2556
CD3+MFICD95+ 3.14(3.09-3.25) 3.09(2.99-3.17) 0.1080
CD4+MFICD95+ 2.96(2.84-3.06) 2.84(2.73-2.97) 0.1242
CD8+MFICD95+ 2.49(2.39-2.56) 2.45(2.38-2.52) 0.4690
Significant values (p<0.05) are in bold text, median [IQR].
4.5.2 HLA-DR
Although after incubation with glucose, the percentage and MFI of T-cells expressing HLA-
DR was lower this was not statistically significant in all T-cell subsets (see table 4.6).
Analysis of the 31 patients in these experiments did however demonstrate a significant
difference in the MFI of HLA-DR expression between the normoglycaemic and
hyperglycaemic on CD4+ T-cells, p=0.0252. This further decreased after incubation with
glucose but the difference was not significant (see Fig 4.2).

42
Table 4.6: HLA-DR expression on T-cells pre and post glucose incubation
Median IQR
Normoglycaemia
P Pre incubation Post incubation
CD3+%HLA-DR+ 19.6(17.3-22.9) 13.7(13.7-20.8) 0.5355
CD4+% HLA-DR+ 11.04(10.11-13.54) 8.92(6.22-11.67) 0.5332
CD8+% HLA-DR+ 21.9(15.9-28.4) 17.9(11.7-25.3) 0.6063
CD3+MFI HLA-DR+ 6.77(3.26-6.92) 6.39(5.85-7.12) 0.4036
CD4+MFI HLA-DR+ 7.44(7.25-7.98) 6.62(5.58-7.68) 0.6790
CD8+MFI HLA-DR+ 2.75(2.36-3.28) 2.94(2.44-3.34) 0.8458
Hyperglycaemia
Pre incubation
Post incubation
CD3+% HLA-DR+ 11.7(7.9-17.3) 11.2(6.0-13.2) 0.1678
CD4+% HLA-DR+ 8.75(6.02-14.45) 7.13(4.42-9.53) 0.2540
CD8+% HLA-DR+ 16.7(13.2-28.3) 20.9(16.6-26.0) 0.9951
CD3+MFI HLA-DR+ 4.09(3.37-5.17) 3.55(3.15-5.28) 0.8798
CD4+MFI HLA-DR+ 4.20(2.39-5.34) 4.04(2.63-6.08) 0.1494
CD8+MFI HLA-DR+ 2.76(2.60-3.01) 2.67(2.49-2.74) 0.7036
Figure 4.2: The MFI of HLA-DR on CD4+ T-cells in normoglycaemic and hyperglycaemic groups. Plot A illustrates the gating strategy of HLA-DR. B) At baseline, the HLA-DR median was significantly lower in the hyperglycaemic group 4.20(2.39-5.34) compared to the normoglycaemic group 7.44(7.25-7.98), p=value 0.0252. Incubation with glucose further decreased HLA-DR expression although the P-values were insignificant.

43
4.5.3 PD-1
There was no significant difference in the expression of PD-1 post incubation with glucose.
This pattern was similar in both groups of participants. (See table 4.7 and Fig 4.3).
Table 4.7: PD-1 expression on T-cells pre and post glucose incubation
Median IQR
Normoglycaemia
P Pre incubation Post incubation
CD3+%PD-1+ 17.8(13.2-22.1) 16.2(13.4-17.3) 0.5574
CD4+% PD-1+ 16.1(10.1-20.7) 15.3(10.5-19.2) 0.6143
CD3+MFI PD-1+ 16.2(15.9-17.9) 16.2(15.2-16.9) 0.4900
CD4+MFI PD-1+ 17.0(16.2-18.2) 17.3(16.8-17.8) 0.9283
Hyperglycaemia
Pre incubation
Post incubation
CD3+% PD-1+ 19.4(16.3-22.3) 18.2(16.5-22.4)
0.2209
CD4+% PD-1+ 18.3(14.6-21.0) 16.7(14.2-19.8) 0.2047
CD3+MFI PD-1+ 16.0(15.4-17.4) 15.9(15.4-16.8) 0.8773
CD4+MFI PD-1+ 17.8(16.3-19.5) 17.4 (16.0-17.7) 0.7608
Figure 4.3: PD-1 expression on CD3+ T-cells in normoglycaemia and hyperglycaemia. Plot A illustrates PD-1 gating strategy. B) The median % expression of PD-1 was not significantly increased in the hyperglycaemic group compared to the normoglycaemic group and there was no significant difference after incubation with glucose.

44
4.5.4 CD38
Ten (10) samples were processed for the expression of CD38 of which 3 were
normoglycaemic and 7 were hyperglycaemic. Incubation with 30mmol/L glucose resulted in a
decreased % of CD3+ T-cells expressing CD38. A similar pattern was observed when
examining the MFI. These results were similar in both the CD4+ and CD8+ subsets.
Furthermore, the hyperglycaemic group had lower percentages of all T-cell subsets
expressing the antigen when compared to the normoglycaemic group in both the pre- and
post-incubation analysis. Due to the low numbers of samples in this group statistical analysis
could not be performed.
4.6 T-cell antigen expression in hypoglycaemic and hyperglycaemic conditions
The T-cells of 31 participants were incubated with increasing concentrations of glucose
(2mmol/l, 5mmol/l and 30mmol/l) mimicking hypoglycaemia, normoglycaemia and
hyperglycaemia respectively (Oleszczak et al., 2012). Incubation with glucose showed a
general decrease in the median % of cells expressing CD95 and MFI. These results further
confirmed that the % of CD4+ T-cells expressing CD95 significantly decreased with
increasing concentrations of glucose in both the normo and hyperglycaemic groups (see Fig
4.4 and table 4.8). There was however no significant differences when the CD3+ and CD8+
subsets were analysed.
Figure 4.4: CD95 expression in varying concentrations of glucose. Plot A and Plot B illustrates the % of CD4+ T-cells expressing CD95 in the control group and test group at pre-incubation and post-incubation in 2 mmol/L, 5 mmol/L and 30mmol/L glucose concentrations. Plot C & D illustrates the MFI of CD95 on CD4 T-cells in control and test group, respectively.

45
Table 4.8: Changes in T-cell antigen expression with increasing glucose concentration in both groups.
Parameters P-values
{2} {3} {4} {5} {6} {7} {8}
CD4+ %CD95+
Normal {1} 0.477 0.0716 0.0058 0.0359 0.0081 0.0198 0.0067
CD4+ %CD95+
Hyperglycaemia {2} 0.2592 0.0351 0.1515 0.0466 0.0941 0.0394
CD4+ %CD95+ 2mmol
Normal {3} 0.3371 0.7610 0.3997 0.5865 0.3614
CD4+ %CD95+ 2mmol
Hyperglycaemia {4} 0.5143 0.9042 0.6828 0.9614
CD4+ %CD95+ 5mmol
Normal {5} 0.5934 0.8103 0.5454
CD4+ %CD95+ 5mmol
Hyperglycaemia {6} 0.7715 0.9426
CD4+%CD95+
30 mmol Normal {7} 0.7180
CD4+%CD95+
30mmol
Hyperglycaemia {8}
Significant values (p<0.05) are in bold text. For example, the difference the expression of
CD95 expression on CD4+ T-cells in the hyperglycaemic group at baseline {2} and 2mmol/l
{4}, 5mmol/l {6} and 30mmol/l {8} glucose concentration was significant, p=0.0351, p=0.0466
and 0.0394 respectively.
4.7 Correlations between T-cell markers, glucose metabolism and inflammation
There were no significant correlations between T-cell antigens expression, fasting glucose,
2hr OGTT and HbA1c. However, there was a significant correlation between the
inflammatory marker CRP and the % of CD3+ T cells expressing CD95, p=0.0242. The same
correlation was seen with both CD4+ and CD8+ T-cells expressing CD95, p=0.0073 and
0.0087 respectively. The MFI of CD4+ T-cells expressing HLA-DR also showed significant
correlation with CRP marker, p=0.0362. Furthermore, there was a significant correlation
between insulin fasting and % of CD3+ and CD8+ T-cells expressing CD38, p=0.0158 and
0.0048. The same insulin fasting correlation was seen with CD4+ T-cells expressing PD-1,
p=0.0313 (see table 4.9, 4.10 and 4.11).

46
Table 4.9: Correlation between CD3 marker, glucose metabolism and inflammation.
CD3 Marker Variables N Results in % Results in MFI
R P R P
CD3+CD95+
Fasting Glucose (mmol/L) 69 -0.0842 0.4916 -0.0622 0.6119
2 hr OGTT (mmol/L) 69 0.1130 0.3554 -0.1591 0.1916
HbA1c (%) 69 0.0608 0.6195 -0.1908 0.1163
Insulin Fasting (mIU/L) 69 -0.0884 0.4701 -0.0857 0.4838
Ultra-sensitive CRP (mg/L) 69 0.2712 0.0242 0.2292 0.0582
CD3+HLA-DR+
Fasting Glucose (mmol/L) 50 -0.0741 0.6090 -0.0458 0.7524
2 hr OGTT (mmol/L) 50 -0.1456 0.3130 0.1871 0.1933
HbA1c (%) 50 -0.1356 0.3476 -0.1316 0.3623
Insulin Fasting (mIU/L) 50 0.0444 0.7596 -0.0562 0.6984
Ultra-sensitive CRP (mg/L) 50 0.1427 0.3228 -0.1558 0.2801
CD3+PD1+
Fasting Glucose (mmol/L) 53 -0.0286 0.8391 0.0562 0.6863
2 hr OGTT (mmol/L) 53 -0.0790 0.5740 -0.0521 0.7085
HbA1c (%) 53 -0.0905 0.5191 0.0165 0.9056
Insulin Fasting (mIU/L) 53 0.1468 0.2942 -0.0278 0.8419
Ultra-sensitive CRP (mg/L) 53 0.1737 0.2136 0.0148 0.9152
CD3+CD38+
Fasting Glucose (mmol/L) 10 0.2675 0.4550 -0.1945 0.5902
2 hr OGTT (mmol/L) 10 0.2121 0.5563 -0.5394 0.1076
HbA1c (%) 10 0.4377 0.2058 -0.3891 0.2665
Insulin Fasting (mIU/L) 10 0.7333 0.0158 0.0667 0.8548
Ultra-sensitive CRP (mg/L) 10 0.1216 0.7379 0.3951 0.2584
Significant values (p<0.05) are in bold text

47
Table 4.10: Correlation between CD4 marker, glucose metabolism and inflammation.
CD4 Marker Variables N Results in % Results in MFI
R P R P
CD4+CD95+
Fasting Glucose (mmol/L) 69
-0.0119 0.9227 -0.0623 0.6111
2 hr OGTT (mmol/L) 69
0.0338 0.7831 -0.1742 0.1522
HbA1c (%) 69
0.0904 0.4601 -0.2223 0.0664
Insulin Fasting (mIU/L) 69
-0.0404 0.7414 -0.1542 0.2059
Ultra-sensitive CRP (mg/L) 69
0.3203 0.0073 0.1713 0.1593
CD4+HLA-DR+
Fasting Glucose (mmol/L) 50 -0.0041 0.9775 -0.0995 0.4962
2 hr OGTT (mmol/L) 50 0.0445 0.7589 -0.0376 0.7975
HbA1c (%) 50 -0.0168 0.9078 -0.2595 0.0718
Insulin Fasting (mIU/L) 50 0.2616 0.0665 -0.2661 0.0646
Ultra-sensitive CRP (mg/L) 50 0.1545 0.2841 -0.3000 0.0362
CD4+PD1+
Fasting Glucose (mmol/L) 54 0.1436 0.3051 0.1535 0.2679
2 hr OGTT (mmol/L) 54 -0.0016 0.9911 -0.0177 0.8992
HbA1c (%) 54 0.1026 0.4646 -0.0941 0.4983
Insulin Fasting (mIU/L) 54 0.2962 0.0313 -0.0032 0.9818
Ultra-sensitive CRP (mg/L) 54 0.2269 0.1023 -0.0030 0.9828
CD4+CD38+
Fasting Glucose (mmol/L) 9 0.0502 0.8979 -0.1590 0.6828
2 hr OGTT (mmol/L) 9
-0.0167 0.9661 -0.3667 0.3317
HbA1c (%) 9
0.0333 0.9322 -0.1167 0.7650
Insulin Fasting (mIU/L) 9
0.6000 0.0876 0.2500 0.5165
Ultra-sensitive CRP (mg/L) 9
0.4167 0.2646 0.6333 0.0671
Significant values (p<0.05) are in bold text

48
Table 4.11: Correlation between CD8 marker, glucose metabolism and inflammation.
CD8 Marker Variables N Results in % Results in MFI
R P R P
CD8+CD95+
Fasting Glucose (mmol/L) 69
-0.0208 0.8650 -0.0657 0.5917
2 hr OGTT (mmol/L) 69
0.1553 0.2025 -0.0134 0.9133
HbA1c (%) 69
0.0147 0.9048 -0.0536 0.6621
Insulin Fasting (mIU/L) 69
-0.1463 0.2303 0.0298 0.8077
Ultra-sensitive CRP (mg/L) 69 0.1378 0.2589 0.3094 0.0097
CD8+HLA-DR+
Fasting Glucose (mmol/L) 47 0.0166 0.9120 -0.0547 0.7179
2 hr OGTT (mmol/L) 47 -0.0068 0.9637 0.2390 0.1097
HbA1c (%) 47 -0.0140 0.9257 0.0002 0.9990
Insulin Fasting (mIU/L) 47 0.1019 0.4953 -0.1636 0.2774
Ultra-sensitive CRP (mg/L) 47 0.1583 0.2879 -0.1131 0.4544
CD8+CD38+
Fasting Glucose (mmol/L) 6 0.5798 0.2278 0.0580 0.9131
2 hr OGTT (mmol/L) 6
0.2571 0.6228 0.1429 0.7872
HbA1c (%) 6
0.7714 0.0724 -0.0857 0.8717
Insulin Fasting (mIU/L) 6
0.9429 0.0048 -0.2571 0.6228
Ultra-sensitive CRP (mg/L) 6
0.5429 0.2657 0.4857 0.3287
Significant values (p<0.05) are in bold text
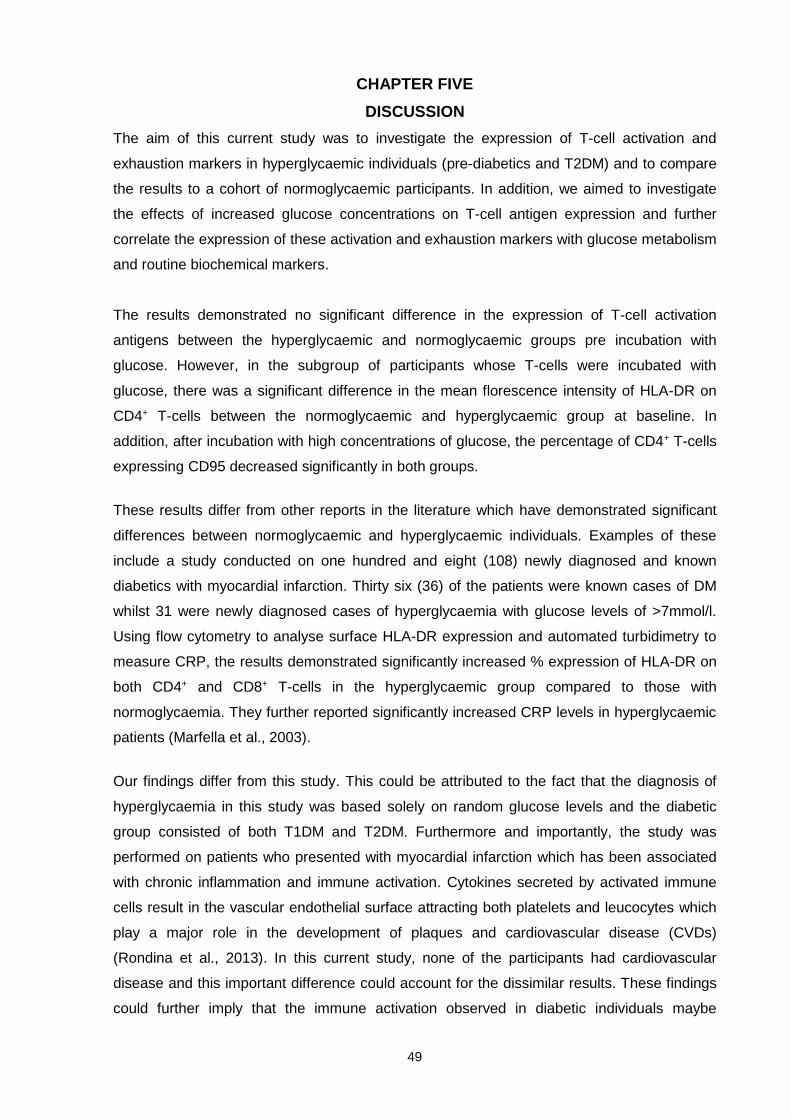
49
CHAPTER FIVE
DISCUSSION
The aim of this current study was to investigate the expression of T-cell activation and
exhaustion markers in hyperglycaemic individuals (pre-diabetics and T2DM) and to compare
the results to a cohort of normoglycaemic participants. In addition, we aimed to investigate
the effects of increased glucose concentrations on T-cell antigen expression and further
correlate the expression of these activation and exhaustion markers with glucose metabolism
and routine biochemical markers.
The results demonstrated no significant difference in the expression of T-cell activation
antigens between the hyperglycaemic and normoglycaemic groups pre incubation with
glucose. However, in the subgroup of participants whose T-cells were incubated with
glucose, there was a significant difference in the mean florescence intensity of HLA-DR on
CD4+ T-cells between the normoglycaemic and hyperglycaemic group at baseline. In
addition, after incubation with high concentrations of glucose, the percentage of CD4+ T-cells
expressing CD95 decreased significantly in both groups.
These results differ from other reports in the literature which have demonstrated significant
differences between normoglycaemic and hyperglycaemic individuals. Examples of these
include a study conducted on one hundred and eight (108) newly diagnosed and known
diabetics with myocardial infarction. Thirty six (36) of the patients were known cases of DM
whilst 31 were newly diagnosed cases of hyperglycaemia with glucose levels of >7mmol/l.
Using flow cytometry to analyse surface HLA-DR expression and automated turbidimetry to
measure CRP, the results demonstrated significantly increased % expression of HLA-DR on
both CD4+ and CD8+ T-cells in the hyperglycaemic group compared to those with
normoglycaemia. They further reported significantly increased CRP levels in hyperglycaemic
patients (Marfella et al., 2003).
Our findings differ from this study. This could be attributed to the fact that the diagnosis of
hyperglycaemia in this study was based solely on random glucose levels and the diabetic
group consisted of both T1DM and T2DM. Furthermore and importantly, the study was
performed on patients who presented with myocardial infarction which has been associated
with chronic inflammation and immune activation. Cytokines secreted by activated immune
cells result in the vascular endothelial surface attracting both platelets and leucocytes which
play a major role in the development of plaques and cardiovascular disease (CVDs)
(Rondina et al., 2013). In this current study, none of the participants had cardiovascular
disease and this important difference could account for the dissimilar results. These findings
could further imply that the immune activation observed in diabetic individuals maybe

50
associated with the acceleration of the disease and the development of complications such
as CVDs.
Researches investigating the expression of PD-1 on the surface of T-cells have also
demonstrated increased positivity in association with diabetic complications such
atherosclerosis, sepsis and retinopathy (Shi et al., 2013; Fang et al., 2015; Jia et al., 2016).
Jia et al investigated the cell surface expression of PD-1, in 245 patients. Of these, 80 were
known cases of T2DM without infection, 77 were known T2DM with severe sepsis and 88
were non-diabetic patients with severe sepsis. The results were compared to 50 healthy
controls. The authors reported significantly increased percentage of CD4+ and CD8+ T-cells
expressing PD1 together with high levels of C-reactive protein (CRP) (Jia et al., 2016). These
results were similar to another study of 125 T2DM patients in which significantly increased
PD-1 expression on CD4+ T-cells was reported. In this investigation, 48 of the DM patients
had atherosclerotic macrovascular complications and 25 had acute coronary syndrome (Shi
et al., 2013). A further investigation examined PD-1 expression in 79 patients with
proliferative diabetic retinopathy and compared the results to 60 without proliferative
retinopathy and 93 normal controls. The patients with retinopathy once again had
significantly increased expression of PD-1 compared to those who did not have this
complication (Fang et al., 2015). The above studies strongly suggest that the increased
expression of activation and exhaustion antigens observed on the surface of T-cells is
associated with the development of diabetic complications. These observations could explain
the differences observed in the current study which excluded long term diabetics with
complications.
PD-1 is an immunoreceptor that inhibits T-cell function by delivering a negative co-
stimulatory signal upon interacting with its ligands (Jin et al., 2011; Riella et al., 2012).
Resting T-cells do not express PD-1 but it is upregulated on activated T-cells (Chinai et al.,
2015) and is indicative of on-going T-cell activation (Okazaki & Honjo, 2007; Liechtenstein et
al., 2012). The up-regulation of PD-1 on T-cells induces a hypo-responsive state termed
exhaustion or anergy (Xing & Hogquist, 2012). These findings suggest that hyperglycaemia
could induce T-cell exhaustion by increasing PD-1 expression. This may lead to loss of their
effector function and the ability to mount an effective immune response predisposing
individuals with T2DM to increased infections and sepsis.
Obesity is a major cause of chronic inflammation which results in the activation of T-cells and
increased T-cell antigen expression. This phenomenon could provide a further explanation
for the fact that there was no significant difference in the expression of T-cell activation
antigens between the normoglycaemic and hyperglycaemic participants. In this current study

51
both the normoglycaemic and hyperglycaemic participants had increased BMI’s (>26), with
the majority of the participants fulfilling the criteria of obesity (BMI=>30). This theory is further
supported by the high levels of Ultra-sensitive CRP, a marker of inflammation, in both
groups. Obesity is an important cause of chronic inflammation and is initiated by adipose
tissue adipocytes becoming hypertrophic in an effort to accommodate excess triglyceride
storage (Chng et al., 2015; Ip et al., 2015). The adipocytes eventually undergo apoptotic
death which triggers the production of pro-inflammatory cytokines and adipokines. This
continual process leads to chronic inflammation with the consequent activation of T-cells and
other cells of the immune system (Lontchi-Yimagou et al., 2013). The results from this
current study imply that obesity as well as hyperglycaemia could be an important driver in the
chronic inflammation observed in these individuals.
A further explanation for the dissimilar results could be the differing population groups and
methodologies used to analyse the expression of T-cell antigens. In the current study,
participants with pre-diabetes and newly diagnosed diabetics were grouped together as
hyperglycaemia, whereas the other reports have included long term diabetic patients. As the
activation of both the innate and adaptive immune responses could vary across the different
glucose tolerance groups, it is important to increase participant numbers in order to study
and compare each subgroup individually. In addition our study has attempted to analyse
specific T-cell subsets as opposed to analysing all lymphocytes.
However, although the majority of reports differ from ours, similar findings were reported by
another flow cytometry based study. The authors of this article demonstrated no significant
differences between the expression of CD95 on the T-cells in T2DM and the control group. A
total of 30 patients were included of which 22 had T1DM, 8 had T2DM and 12 were controls.
The patients were classified according the National Diabetes Data Group criteria (Giordano
et al., 1995).
In order to further investigate the effect of hyperglycaemia on T-cell antigen expression, we
incubated the lymphocytes of 32 of the 69 participants, with increased concentrations of
glucose. The results of this experiment demonstrated a significantly decreased surface
expression of HLA-DR and CD95 on the CD4+ T-cell subset in both normoglycaemic and
hyperglycaemic individuals. These results were further supported by incubating the T-cells
with increasing doses of glucose which resulted in a steady decrease in CD95 expression on
the CD4+ subset but not on CD8+ T-cells. These observations seem to imply that high
concentrations of glucose inhibit CD4+ T-cell activation by decreasing the expression of T-cell
activation markers which could possibly induce a state of immune exhaustion.
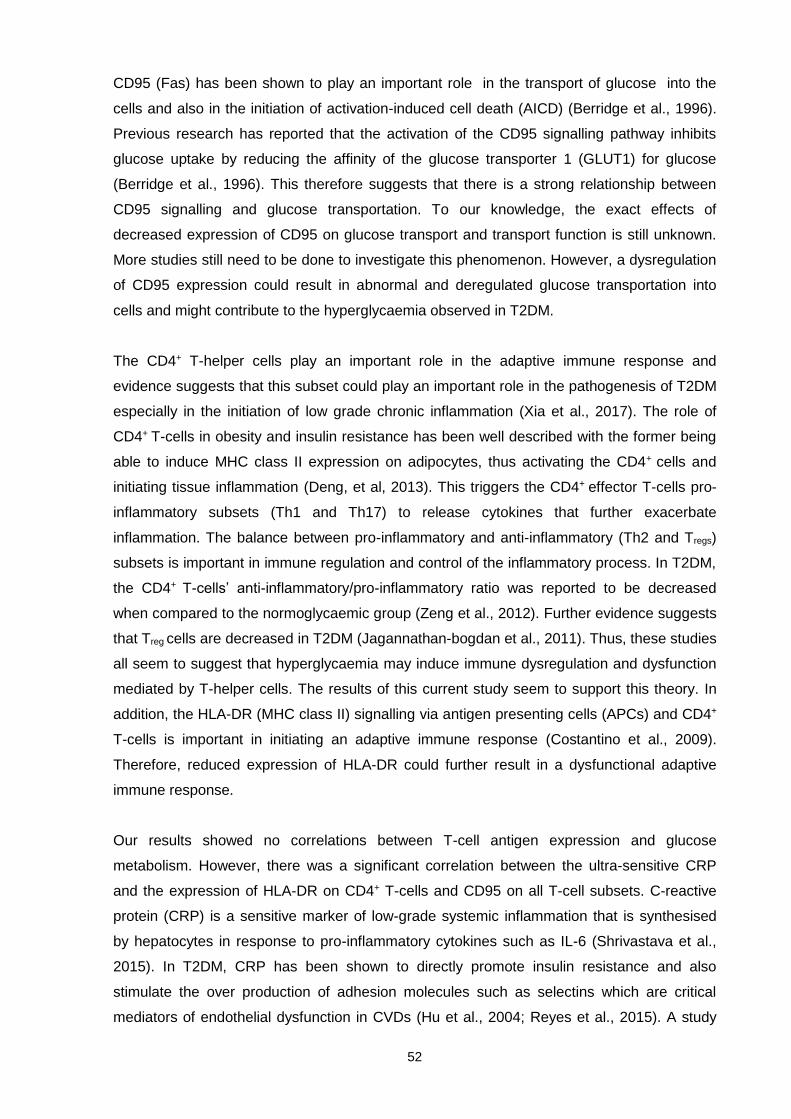
52
CD95 (Fas) has been shown to play an important role in the transport of glucose into the
cells and also in the initiation of activation-induced cell death (AICD) (Berridge et al., 1996).
Previous research has reported that the activation of the CD95 signalling pathway inhibits
glucose uptake by reducing the affinity of the glucose transporter 1 (GLUT1) for glucose
(Berridge et al., 1996). This therefore suggests that there is a strong relationship between
CD95 signalling and glucose transportation. To our knowledge, the exact effects of
decreased expression of CD95 on glucose transport and transport function is still unknown.
More studies still need to be done to investigate this phenomenon. However, a dysregulation
of CD95 expression could result in abnormal and deregulated glucose transportation into
cells and might contribute to the hyperglycaemia observed in T2DM.
The CD4+ T-helper cells play an important role in the adaptive immune response and
evidence suggests that this subset could play an important role in the pathogenesis of T2DM
especially in the initiation of low grade chronic inflammation (Xia et al., 2017). The role of
CD4+ T-cells in obesity and insulin resistance has been well described with the former being
able to induce MHC class II expression on adipocytes, thus activating the CD4+ cells and
initiating tissue inflammation (Deng, et al, 2013). This triggers the CD4+ effector T-cells pro-
inflammatory subsets (Th1 and Th17) to release cytokines that further exacerbate
inflammation. The balance between pro-inflammatory and anti-inflammatory (Th2 and Tregs)
subsets is important in immune regulation and control of the inflammatory process. In T2DM,
the CD4+ T-cells’ anti-inflammatory/pro-inflammatory ratio was reported to be decreased
when compared to the normoglycaemic group (Zeng et al., 2012). Further evidence suggests
that Treg cells are decreased in T2DM (Jagannathan-bogdan et al., 2011). Thus, these studies
all seem to suggest that hyperglycaemia may induce immune dysregulation and dysfunction
mediated by T-helper cells. The results of this current study seem to support this theory. In
addition, the HLA-DR (MHC class II) signalling via antigen presenting cells (APCs) and CD4+
T-cells is important in initiating an adaptive immune response (Costantino et al., 2009).
Therefore, reduced expression of HLA-DR could further result in a dysfunctional adaptive
immune response.
Our results showed no correlations between T-cell antigen expression and glucose
metabolism. However, there was a significant correlation between the ultra-sensitive CRP
and the expression of HLA-DR on CD4+ T-cells and CD95 on all T-cell subsets. C-reactive
protein (CRP) is a sensitive marker of low-grade systemic inflammation that is synthesised
by hepatocytes in response to pro-inflammatory cytokines such as IL-6 (Shrivastava et al.,
2015). In T2DM, CRP has been shown to directly promote insulin resistance and also
stimulate the over production of adhesion molecules such as selectins which are critical
mediators of endothelial dysfunction in CVDs (Hu et al., 2004; Reyes et al., 2015). A study

53
examining inflammatory markers in T2DM reported increased CRP levels compared to
normal controls (Hu et al., 2004). The results of our study have demonstrated elevated levels
of CRP in both the hyperglycaemic and normoglycaemic individuals which could be attributed
to the increased obesity rather than the abnormal glucose metabolism.
Like any other cross-sectional study, this study was subjected to limitations. No causative
could be determined but only associations and correlations between T-cell markers and the
studied parameters. Future longitudinal follow-up studies should be done to address this gap.
Furthermore, although individuals with seasonal diseases such as flue and allergies that may
affect the immune activation state were excluded in the study, we did not account for other
inflammatory conditions and/or infections such as HIV and tuberculosis. Participants were
only screened for clinical parameters and no viral or bacterial assays were performed.
Additionally, the sample size on the effects of glucose on T-cell antigen expression was too
small; a bigger sample size with subgroups (pre-diabetics, newly diagnosed T2DM and
known T2DM) could have painted a more robust picture on the effect of glucose on T-cells
antigen expression. On the flow cytometry technical aspects of this study, our compensation
matrix values were solely determined by compensation beads. The inclusion of cells could
have corrected the spill-over better. There were also a few methodological concerns in the
functional aspect of this study. Firstly, the mere exposure of T-cells to glucose did not
produce any dramatic change in marker expression as expected. The use of additional T-cell
stimulants such as anti-CD3/CD28 or mitogen phytohaemagglutinin (PHA) could have
addressed the actual effect of glucose on T-cell function. This needs to be considered in
future studies. Secondly, the 45 minutes incubation time may have been too short. Most
recent T-cell functional experiments have used about 4 hours of stimulation to detect real
changes in marker expression. The calculated sample size (311) was quite higher than the
number of samples ran in this study (69). This was due to high cost of mAbs and intermittent
availability of samples as participants were recruited as they came in the clinic. These were
huge limitations as it attributed to the difference in sample sizes for the different marker and
made it impossible to perform any statistical analysis for other markers such as CD38.
The positives of this study are that the measurement of T-cell antigen expression using flow
cytometry offers a highly sensitive and rapid method for both qualitative and quantitative
measurements of immune activation. Moreover, numerous pre-analytical and analytical
methodological considerations were made to minimize in vivo artefacts. These included the
choice of anticoagulant and the sample processing time. Furthermore, the use of a T-cell
viability marker in the glucose incubation protocol ensured that the cells that were being
measured were viable. The incubation time and staining techniques applied in this study did
not introduce any in vivo artefacts.

54
CHAPTER SIX
CONCLUSION
The results of this study have demonstrated no significant difference in the percentage of T-
cells expressing activation antigens (HLA-DR and CD38) between individuals with
hyperglycaemia and those with normal glucose levels at baseline. Similar results were
obtained after analysing the expression of CD95 and PD-1. Furthermore, the results showed
no correlations between T-cell antigen expression and glucose metabolism. However, there
was a significant correlation between thee ultra-sensitive C-reactive protein (CRP) and the
expression of HLA-DR on CD4+ T-cells and CD95 on all T-cell subsets. In the subgroup of
participants whose T-cells were incubated with glucose, there was a significant difference in
the mean florescence intensity of HLA-DR on CD4+ T-cells between the normoglycaemic and
hyperglycaemic group at baseline. In addition, incubation with high concentrations of glucose
significantly decreased the percentage of CD4+ T-cells expressing CD95 in both groups.
The CD4+ T-cells play an important role in the immune response, and future studies should
continue to investigate the role of CD4+T-cell subsets such as Tregs, Th17, Th1 and Th2 in the
evolution of T2DM and the development of chronic inflammation. Furthermore, future studies
should include more participants that can be sub-grouped into pre-diabetics, newly
diagnosed T2DM and known T2DM. These studies could have important implications in
understanding the progression of the disease and the development of immune dysregulation
and complications such as cardiovascular diseases which are often associated with T2DM.
To conclude, we hypothesize that high concentrations of glucose suppress the immune
system by decreasing the expression of CD4+ T-cell activation markers which may lead to
immune exhaustion. Furthermore, the chronic inflammation observed in T2DM may indicate
the development of complications such as cardiovascular diseases and therefore immune
monitoring could play an important role in therapeutic decisions to prevent these.

55
BIBLIOGRAPHY
ADA see American Diabetes Association
Alberti, K.G.M.M. 2007. Screening and diagnosis of prediabetes: where are we headed? Diabetes, Obesity and Metabolism, 9(s1): 12–16.
Al Homsi, M.F. & Lukic, M.L. 1992. An Update on the pathogenesis of Diabetes Mellitus. Department of Pathology and Medical Microbiology(Immunology Unit) Faculty of Medicine and Health Sciences, UAE University, Al Ain, United Arab Emirates.
Alpdogan, O. 2013. Advances in Immune Regulation in Transplantation. Discovery Medicine, 15(82): 150–159.
Alpdogan, O. & Van den Brink, M.R. 2012. Immune Tolerance and Transplantaion. Seminers in Oncology, 39(6): 629–642.
American Diabetes Association. 2009. Diagnosis and classification of diabetes mellitus. Diabetes Care, 32(1): S62–S67.
Ansari, M.J.I., Salama, A.D., Chitnis, T., Smith, R.N., Yagita, H., Akiba, H., Yamazaki, T., Azuma, M., Iwai, H., Khoury, S.J., Auchincloss, H. & Sayegh, M.H. 2003. The Programmed Death-1 ( PD-1 ) Pathway Regulates Autoimmune Diabetes in Nonobese Diabetic ( NOD ) Mice The Journal of Experimental Medicine. The Journal of experimental medicine, 198(1): 0–6.
Askenasy, N., Yolcu, E.S., Yaniv, I. & Shirwan, H. 2005. Induction of tolerance using Fas ligand : a double-edged immunomodulator. Blood Journal, 105(4): 1396–1405.
Austin, J.W., Lu, P., Majumder, P., Ahmed, R. & Boss, J.M. 2014. STAT3, STAT4, NFATc1, and CTCF regulate PD-1 through multiple novel regulatory regions in murine T cells. Journal of Immunology, 192(10): 4876–4886.
Barnhart, B.C., Alappat, E.C. & Peter, M.E. 2003. The CD95 Type I / Type II model. Seminers in Immunology, 15: 185–193.
Bäumler, C.B., Böhler, T., Herr, I., Benner, A., Krammer, P.H. & Debatin, K.M. 1996. Activation of the CD95 (APO-1/Fas) system in T cells from human immunodeficiency virus type-1-infected children. Blood Journal, 88(5): 1741–1746.
Berridge, M., Tan, A., McCoy, K., Kansara, M. & Rudert, F. 1996. CD95 ( Fas / Apo-1 ) -induced apoptosis results in loss of glucose transporter function. The Journal of Immunology, 156: 4092–4099.
Blüher, M., Klöting, N., Wueest, S., Schoenle, E.J., Schön, M.R., Dietrich, A., Fasshauer, M., Stumvoll, M. & Konrad, D. 2014. Fas and FasL Expression in Human Adipose Tissue Is Related to Obesity, Insulin Resistance, and Type 2 Diabetes. The Journal of Clinical Endocrinology & Metabolism, 99(1): E36–E44.
Bobé, P. 2002. The Fas - Fas Ligand apoptotic pathway. Atlas of Genetics and Cytogenetics in Oncology and Haematology, 2: 381–391.
Boldizsar, F., Berki, T., Miseta, A. & Nemeth, P. 2002. Effect of hyperglycemia on the basal cytosolic free calcium level, calcium signal and tyrosine-phosphorylation in human T-cells. Immunology Letters, 82: 159–164.
Bonilla, F.A. & Oettgen, H.C. 2010. Adaptive immunity. The Journal of allergy and clinical

56
immunology, 125(2): S33-40.
Brod, S.A. 2000. Unregulated inflammation shortens human functional longevity. Inflamm Res, 49(11): 561–570.
Butte, M.J., Keir, M.E., Phamduy, T.B., Sharpe, A.H. & Freeman, G.J. 2007. Programmed Death-1 Ligand 1 Interacts Specifically with the B7-1 Costimulatory Molecule to Inhibit T Cell Responses. Immunity, 27(1): 111–122.
Camara, N.O.S., Lepique, A.P. & Basso, A.S. 2012. Lymphocyte Differentiation and Effector Functions. Journal of Immunology Research, 2012.
Catalán, V., Gómez-ambrosi, J., Ramirez, B., Rotellar, F., Pastor, C., Silva, C., Gil, M.J., Cienfuegos, J.A. & Frühbeck, G. 2007. Proinflammatory Cytokines in Obesity : Impact of Type 2 Diabetes Mellitus and Gastric Bypass. Obesity Surgery, 1: 1464–1474.
Chaplin, D.D. 2010. Overview of the immune response. Journal of Allergy and Clinical Immunology, 125(2 SUPPL. 2): S3–S23. http://dx.doi.org/10.1016/j.jaci.2009.12.980\n3.
Chen, W., Jin, W., Hardegen, N., Lei, K., Li, L., Marinos, N., Mcgrady, G. & Wahl, S.M. 2003. Conversion of Peripheral CD4+ CD25- Naive T Cells to CD4+ CD25+ Regulatory T Cells by TGF- B Induction of Transcription Factor Foxp3. The Journal of experimental medicine, 198(12): 1875–1886.
Chinai, J.M., Janakiram, M., Chen, F., Chen, W., Kaplan, M. & Zang, X. 2015. New immunotherapies targeting the PD-1 pathway. Trends in Pharmacological Sciences, 36(9): 587–595.
Chng, M.H.Y., Alonso, M.N., Barnes, S.E., Nguyen, K.D. & Engleman, E.G. 2015. Adaptive Immunity and Antigen-Specific Activation in Obesity-Associated Insulin Resistance. Mediators of Inflammation, 2015: 1–15.
Chung, S., Wucherpfennig, K.W., Friedman, S.M., Hafler, D. a & Strominger, J.L. 1994. Functional three-domain single-chain T-cell receptors. Proceedings of the National Academy of Sciences of the United States of America, 91(26): 12654–12568.
Cicala, C. & Cirino, G. 1998. Linkage between inflammation and coagulation: An update on the molecular basis of the crosstalk. Life Sciences, 62(20): 1817–1824.
Cnop, M., Welsh, N., Jonas, J., Jo, A. & Lenzen, S. 2014. Many Differences, Few Similarities. , 54(December 2005): 97–107.
Cope, A.P. 2002. Studies of T-cell activation in chronic inflammation. Arthritis research, 4(3): S197–S211.
Costantino, C.M., Ploegh, H.L. & Hafler, D.A. 2009. Cathepsin S regulates class II MHC processing in human CD4+ HLA-DR+ T cells. The Journal of Immunology, 183(2): 945–952.
Deeks, S.G., Kitchen, C.M.R., Liu, L., Guo, H., Gascon, R., Narva, A.B., Hunt, P., Martin, J.N., Kahn, J.O., Levy, J., Mcgrath, M.S. & Hecht, F.M. 2004. Immune activation set point during early HIV infection predicts subsequent CD4 ϩ T-cell changes independent of viral load. The American Society of Hematology, 104(4): 942–948.
DeFranco, S., Bonissoni, S., Cerutti, F., Bona, G., Bottarel, F., Cadario, F., Brusco, A., Loffredo, G., Rabbone, I., Corrias, A., Pignata, C., Ramenghi, U. & Dianzani, U. 2001. Defective Function of Fas in Patients With Type 1 Diabetes Associated With Other

57
Autoimmune Diseases. Diabetes, 50(March): 8–10.
Delves, P.J. & Roitt, I.M. 2000. The Immune System. Advances in Immunology, 343(1): 37–49.
Deshpande, D.A., Dogan, S., Walseth, T.F., Miller, S.M., Amrani, Y., Panettieri, R.A. & Kannan, M.S. 2004. Modulation of Calcium Signaling by Interleukin-13 in Human Airway Smooth Muscle Role of CD38 / Cyclic Adenosine Diphosphate Ribose Pathway. American Journal of Respiratory Cell And Molecular Biology, 31(11): 36–42.
Dieterlen, M., Bittner, H.B., Tarnok, A., Garbade, J., Dhein, S., Mohr, F.W. & Barten, M.J. 2014. Flow Cytometric Evaluation of T Cell Activation Markers after Cardiopulmonary Bypass. , 2014.
Dokken, B.B. 2008. The Pathophysiology of Cardiovascular Disease and Diabetes : Beyond Blood Pressure and Lipids. Diabetes Spectrum, 21.
Eggena, M.P., Barugahare, B., Jones, N., Mutalya, S., Kityo, C., Mugyenyi, P., Cao, H., Eggena, M.P., Barugahare, B., Jones, N., Okello, M., Mutalya, S., Kityo, C., Mugyenyi, P. & Cao, H. 2005. Depletion of Regulatory T Cells in HIV Infection Is Associated with Immune Activation 1. The American Association of Immunologists, 174(7): 4407–4414.
Erasmus, R.T., Soita, D.J., Hassan, M.S., Blanco-Blanco, E., Vergotine, Z., Kengne, A.P. & Matsha, T.E. 2012. High prevalence of diabetes mellitus and metabolic syndrome in a South African coloured population: Baseline data of a study in Bellville, Cape Town. South African Medical Journal, 102(11): 841–844.
Esser, N., Legrand-poels, S., Piette, J., Scheen, J. & Paquot, N. 2014. Inflammation as a link between obesity , metabolic syndrome and type 2 diabetes. Diabetes Research and Clinical Practice, 105: 141–150.
Fang, M., Meng, Q., Guo, H., Wang, L., Zhao, Z., Zhang, L. & Kuang, J. 2015. Programmed death 1 ( PD-1 ) is involved in the development of proliferative diabetic retinopathy by mediating activation-induced apoptosis. Molecular Vision, 21(August): 901–910.
Felderhoff-Mueser, U., Taylor, D.L., Greenwood, K., Kozma, M., Stibenz, D., Joashi, U.C., Edwards, a D. & Mehmet, H. 2000. Fas/CD95/APO-1 can function as a death receptor for neuronal cells in vitro and in vivo and is upregulated following cerebral hypoxic-ischemic injury to the developing rat brain. Brain pathology (Zurich, Switzerland), 10(1): 17–29.
Feuth, T., Arends, J.E., Fransen, J.H., Nanlohy, N.M., van Erpecum, K.J., Siersema, P.D., Hoepelman, A.I.M. & van Baarle, D. 2013. Complementary role of HCV and HIV in T-cell activation and exhaustion in HIV/HCV coinfection. PloS one, 8(3): 1–9.
Freeman, G.J., Wherry, E.J., Ahmed, R. & Sharpe, A.H. 2006. Reinvigorating exhausted HIV-specific T cells via PD-1-PD-1 ligand blockade. The Journal of experimental medicine, 203(10): 2223–2227.
Fried, S.K., Bunkin, D.A. & Greenberg, A.S. 1998. Omental and Subcutaneous Adipose Tissues of Obese Subjects Release Interleukin-6 : Depot Difference and Regulation by Glucocorticoid *. Journal of Clinical Endocrinology and Metabolism, 83(3): 30–33.
Fritzsching, E., Kunz, P., Maurer, B., Pöschl, J. & Fritzsching, B. 2009. Regulatory T cells and tolerance induction. Clinical Transplantation, 23(21): 10–14.
Fulda, S. & Debatin, K. 2006. Extrinsic versus intrinsic apoptosis pathways in anticancer

58
chemotherapy. Oncogene, 25: 4798–4811.
Funderburg, N.T., Stubblefield Park, S.R., Sung, H.C., Hardy, G., Clagett, B., Ignatz-Hoover, J., Harding, C. V., Fu, P., Katz, J.A., Lederman, M.M. & Levine, A.D. 2013. Circulating CD4+ and CD8+ T cells are activated in inflammatory bowel disease and are associated with plasma markers of inflammation. Immunology, 140(1): 87–97.
Geerlings, S.E. & Hoepelman, a I. 1999. Immune dysfunction in patients with diabetes mellitus (DM). FEMS immunology and medical microbiology, 26(3–4): 259–265.
Giordano, C., De Maria, R., Stassi, G., Todaro, M., Richiusa, P., Giordano, M., Testi, R. & Galluzzo, A. 1995. Defective expression of the apoptosis-inducing CD95 (Fas/APO-1) molecule on T and B cells in IDDM. Diabetologia, 38: 1449–1454.
Goldrath, A.W. & Bevan, M.J. 1999. Selecting and maintaining a diverse T-cell repertoire. Nature, 402: 255–262.
Gopalan, B., Litvak, A., Sharma, S., Mhashilkar, A.M. & Chada, S. 2005. Activation of the Fas-FasL Signaling Pathway by MDA-7 / IL-24 Kills Human Ovarian Cancer Cells. Cancer Research, (8): 3017–3024.
Gordon, N. & Kleinerman, E.S. 2010. Aerosol Therapy for the Treatment of Osteosarcoma Lung Metastases : Targeting the Fas/ FasL Pathway and Rationale for the Use of Gemcitabine. JOURNAL OF AEROSOL MEDICINE AND PULMONARY DRUG DELIVERY, 23(4): 189–196.
Grundy, S.M. 2012. Pre-diabetes, metabolic syndrome, and cardiovascular risk. Journal of the American College of Cardiology, 59(7): 635–643.
Guy, C.S. & Vignali, D.A. 2009. Organization of proximal signal initiation at the TCR:CD3 complex. Immunological Reviews, 232(1): 7–21.
Hamblin, T.J. 2003. CD38: what is it there for? Blood, 102(6): 1939–1940. http://www.bloodjournal.org/content/bloodjournal/102/6/1939.2.full.pdf.
Hameed, I., Masoodi, S.R., Mir, S.A., Nabi, M., Ghazanfar, K. & Ganai, B.A. 2015. Type 2 diabetes mellitus: From a metabolic disorder to an inflammatory condition. World journal of diabetes, 6(4): 598–612.
Harber, M., Sundstedt, A. & Wraith, D. 2000. The role of signals 1 and 2 in T-cell activation. Cambridge University Press, (November 2000): 3994. http://journals.cambridge.org/fulltext_content/ERM/ERM2_09/S1462399400002143sup004.htm.
Harris, M.I., Eastman, R.C., Cowie, C., Flegal, K. & Mark, E. 1997. Comparison of Diabetes Diagnostic Categories in the U.S. Population According to 1997 American Diabetes Association and 1980-1985 World Health Organization Diagnostic Criteria. Diabetes, 20(12): 1859–1862.
Harris, N.L. & Ronchese, F. 1999. The role of B7 costimulation in T-cell immunity. Immunology and Cell Biology, 77(4): 304–311.
Hertoghe, T., Wajja, A., Ntambi, P., Okwera, A., Aziz, A., Hirsch¶, C., Johnson, J., Toossi, Z., Mugerwa, R., Mugyenyi, P., Colebunders, R., Ellner, J. & Vanham, G. 2000. T cell activation , apoptosis and cytokine dysregulation in the ( co ) pathogenesis of HIV and pulmonary tuberculosis ( TB ). Clinical & Experimental Immunology, 122: 350–357.

59
Hoffmeister, B., Bunde, T., Rudawsky, I.M., Volk, H. & Kern, F. 2003. Detection of antigen-specific T cells by cytokine flow cytometry : The use of whole blood may underestimate frequencies underestimate frequencies. European Journal of Immunology, 33: 3484–3492.
Horenstein, A.L., Chillemi, A., Zaccarello, G., Bruzzone, S., Quarona, V., Zito, A., Serra, S. & Malavasi, F. 2013. A CD38 / CD203a / CD73 ectoenzymatic pathway independent of CD39 drives a novel adenosinergic loop in human T lymphocytes. Oncoimmunology, 2(9): e262461–e2624614.
Hotamisligil, G.S., Arner, P., Caro, J.F., Atkinson, R.L. & Spiegelman, B.M. 1995. Increased Adipose Tissue Expression of Tumor Necrosis Factor-α in Human Obesity and Insulin Resistance. The Journal of Clinical Investigation, 95: 2409–2415.
Hu, F.B., Meigs, J.B., Li, T.Y., Rifai, N. & Manson, J.E. 2004. Inflammatory Markers and Risk of Developing Type 2 Diabetes in Women. Diabetes, 53: 693–700.
Hu, H., Jiang, H., Ren, H., Hu, X., Wang, X. & Han, C. 2015. AGEs and chronic subclinical in fl ammation in diabetes : disorders of immune system. Diabetes Metabolism Research and Reviews, 31: 127–137.
Hulspas, R. 2010. Titration of Fluorochrome-Conjugated Antibodies for Labeling Cell Surface Markers on Live Cells. In Current potocols of flowcytometry. 6.29.1-6.29.9.
Hunt, P.W., Brenchley, J., Sinclair, E., McCune, J.M., Roland, M., Page-Shafer, K., Hsue, P., Emu, B., Krone, M., Lampiris, H., Douek, D., Martin, J.N. & Deeks, S.G. 2008. Relationship between T Cell Activation and CD4 + T Cell Count in HIV Seropositive Individuals with Undetectable Plasma HIV RNA Levels in the Absence of Therapy. The Journal of Infectious Diseases, 197(1): 126–133.
IDF see International Diabetes Federation
International Diabetes Federation. 2009. IDF Diabetes Atlas 4th Edition.
International Diabetes Federation. 2013. IDF Diabetes Atlas 6th Edition. http://scholar.google.com/scholar?hl=en&btnG=Search&q=intitle:Diabetes+Atlas#5\nhttp://dro.deakin.edu.au/view/DU:30060687\nhttp://hdl.handle.net/10536/DRO/DU:30060687.
Ip, B.C., Hogan, A.E. & Nikolajczyk, B.S. 2015. Lymphocyte roles in metabolic dysfunction : of men and mice. Trends Endocrinology Metabolisim, 26(2): 91–100.
Jagannathan-bogdan, M., Mcdonnell, M.E., Shin, H., Rehman, Q., Hasturk, H., Caroline, M. & Nikolajczyk, B.S. 2011. Elevated Proinflammatory Cytokine Production by a Skewed T Cell Compartment Requires Monocytes and Promotes Inflammation in Type 2 Diabetes. The Journal of Immunology, 186: 1162–1172.
Jia, Y., Zhao, Y., Li, C. & Shao, R. 2016. The Expression of Programmed Death-1 on CD4+ and CD8+ T Lymphocytes in Patients with Type 2 Diabetes and Severe Sepsis. PLOS ONE, 11(7): 1–12.
Jin, H.-T., Ahmed, R. & Okazaki, T. 2011. Role of PD-1 in Regulating T-Cell Immunity. Current topics in microbiology and immunology, 358(January): 17–37.
Kahn, S.E. 2003. The relative contributions of insulin resistance and beta-cell dysfunction to the pathophysiology of Type 2 diabetes. Diabetologia, 46(1): 3–19.

60
Kao, C., Oestreich, K.J., Paley, M.A., Crawford, A., Jill, M., Ali, M.A., Intlekofer, A.M., Boss, J.M., Reiner, S.L., Weinmann, A.S. & Wherry, E.J. 2012. T-bet represses expression of PD-1 and sustains virus-specific CD8 T cell responses during chronic infection. Nature immunology, 12(7): 663–671.
Kawakami, A., Eguchi, K., Matsuoka, N., Tsuboi, M., Urayama, S., Nakashima, T. & Kawabe, Y. 1998. Expression and function of Fas and Fas ligand on peripheral blood lymphocytes in normal subjects. Journal of Laboratory and Clinical Medicine, 132(5): 404–413.
King, G.L. 2008. The role of inflammatory cytokines in diabetes and its complications. Journal of periodontology, 79(8): 1527–1534.
Kitabchi, A.E., Umpierrez, G.E., Miles, J.M. & Fisher, J.N. 2009. Hyperglycemic crises in adult patients with diabetes. Diabetes Care, 32(7): 1335–1343.
Kohei, K. 2010. Pathophysiology of Type 2 Diabetes and Its Treatment policy. Journal of the Japan Medical Association, 53(1): 41–46.
Kronin, V., Fitzmaurice, C.J., Caminschi, I., Shortman, K., Jackson, D.C. & Brown, L.E. 2001. Differential effect of CD8(+) and CD8(-) dendritic cells in the stimulation of secondary CD4(+) T cells. International immunology, 13(4): 465–73.
Kumar, N.P., Sridhar, R., Nair, D., Banurekha, V. V., Nutman, T.B. & Babu, S. 2014. Type 2 diabetes mellitus is associated with altered CD8+ T and natural killer cell function in pulmonary tuberculosis. Immunology, 144(4): 677–686.
Kunder, C. a, St John, A.L. & Abraham, S.N. 2011. Mast cell modulation of the vascular and lymphatic endothelium. Blood Journal, 118(20): 5383–93.
Lee, H.C. 2012. Cyclic ADP-ribose and Nicotinic Acid Adenine Dinucleotide Phosphate ( NAADP ) as Messengers for Calcium. Journal Of Biological Chemistry, 287(38): 31633–31640.
Levine, A.D. 2005. Early And Late Inflammatory Responses. Journal of Pediatric Gastroenterology and Nutrition, 10: 24–25.
Levitt, N. 2008. Diabetes in Africa : epidemiology , management and healthcare challenges . Heart. Heart, 94: 1376–1382.
Levitt, N.S., Steyn, K., Lombard, C.J., Fourie, J.M. & Rossouw, K. 1999. Modifiable risk factors for Type 2 diabetes mellitus in a peri-urban community in South Africa. Diabetic Medicine, 16: 946–950.
Ley, K., Laudanna, C., Cybulsky, M.I. & Nourshargh, S. 2007. Getting to the site of inflammation : the leukocyte adhesion cascade updated. Nature reviews. Immunology, 7: 678–689.
Liechtenstein, T., Dufait, I., Bricogne, C., Lanna, A., Pen, J., Breckpot, K. & Escors, D. 2012. PD-L1 / PD-1 Co-Stimulation , a Brake for T cell Activation and a T cell Differentiation Signal. Journal of Clinical & Cellular Immunology, 241(1): 1–14.
Lontchi-Yimagou, E., Sobngwi, E., Matsha, T.E. & Kengne, A.P. 2013. Diabetes Mellitus and Inflammation. Current Diabetes Reports, 13(3): 435–444.
Luckheeram, R.V., Zhou, R., Verma, A.D. & Xia, B. 2012. CD4 + T Cells : Differentiation and Functions. Clinical and Developmental Immunology, 2012: 1–12.

61
Malavasi, F., Funaro, A., Alessio, M., Demonte, L.B., Ausiello, C.M., Dianzani, U., Lanza, F., Magrini, E., Momo, M., Roggero, S., Genetica, D., Medica, C., Cii, C., Sperimentale, O., Torino, U., Ematologia, C. & Ferrara, U. 1992. CD38 : A multi-lineage cell activation molecule with a split personality. International Journal of Clinical and Laboratory Research, 22(1): 73–80.
Mallone, R., Mannering, S.I., Brooks-Worrell, B.M., Durinovic-Belló, I., Cilio, C.M., Wong, F.S. & Schloot, N.C. 2011. Isolation And Preservation Of Peripheral Blood Mononuclear cells for analysis of islet antigen-reactive T cell responses: Position statement of the T-Cell Workshop Committee of the Immunology of Diabetes Society. Clinical and Experimental Immunology, 163(1): 33–49.
Marfella, R., Siniscalchi, M., Esposito, K., Sellitto, A., de Fanis, U., Romano, C., Portoghese, M., Siciliano, S., Nappo, F., Sasso, Ferdinando Carlo Mininni, N., Cacciapuoti, Federico Lucivero, G., Giunta, R., Verza, M. & Giugliano, D. 2003. Effects of Stress Hyperglycemia on Acute Myocardial Infarction. Diabetes Care, 26(11): 3129–3135.
Maskrey, B.H., Megson, I.L., Whitfield, P.D. & Rossi, A.G. 2011. Mechanisms of Resolution of Inflammation A Focus on Cardiovascular Disease. Arterioscler Thromb Vasc Biology: 1001–1006.
Matsha, T.E., Hassan, M.S., Kidd, M. & Erasmus, R.T. 2012. The 30-year cardiovascular risk profile of South Africans with diagnosed diabetes, undiagnosed diabetes, pre-diabetes or normoglycaemia : the Bellville, South Africa pilot study. Cardiovascular Journal of Africa, 23(1): 5–11.
Mbanya, J.C.N., Motala, A.A., Sobngwi, E., Assah, F.K. & Enoru, S.T. 2010. Diabetes in sub-Saharan Africa. The Lancet, 375(9733): 2254–2266.
McCoy, K.D. & Le Gros, G. 1999. The role of CTLA-4 in the regulation of T cell immune responses. Immunology and cell biology, 77(1): 1–10.
McKinney, E., Lee, J., Jayne, D., Lyons, P. & Smith, P. 2007. T Cell Exhaustion Portends Better Outcomes in Autoimmunity. Literature watch: 2535.
Medzhitov, R. 2008. Origin and physiological roles of inflammation. nature insight, 454(July): 428–435.
Medzhitov, R. 2007. Recognition of microorganisms and activation of the immune response. Nature, 449(October).
Mehta, K., Shahid, U. & Malavasi, F. 1996. Human CD38, a cell-surface protein with multiple functions. The FASEB Journal, 10(12): 1408–1417.
Merlini, E., Luzi, K., Suardi, E., Barassi, A. & Cerrone, M. 2012. T-Cell Phenotypes , Apoptosis and Inflammation in HIV + Patients on Virologically Effective cART with Early Atherosclerosis. PLOS ONE, 7(9): 1–12.
Metzger, T.C. & Anderson, M.S. 2012. Control of Central and Peripheral Tolerance by Aire. Immunological Reviews, 241(1): 89–103.
Mikkola, H.K.A. & Orkin, S.H. 2006. The journey of developing hematopoietic stem cells. Development, 133(19): 3733–3744.
Moganti, K., Li, F., Schmuttermaier, C. & Riemann, S. 2016. Hyperglycemia induces mixed M1/M2 cytokine profile in primary human monocyte-derived macrophages. Immunobiology: 1–9.

62
Molleutze, W. & Levitt, N.S. 2006. Diabetes mellitus and impaired glucose tolerance in South Africa. Chronic Diseases of Lifestyle in South Africa: 1995 - 2005: 109–121.
Motala, A.A., Pirie, F.J., Gouws, E., Amod, A. & Omar, M.A.K. 2003. High incidence of Type 2 diabetes mellitus in South African Indians : a 10-year follow-up study. Diabetic Medicine, 20: 23–30.
Murakami, M. & Hirano, T. 2012. The molecular mechanisms of chronic inflammation development. Frontiers in Immunology, 3(November): 1–2.
Nakanjako, D., Ssewanyana, I., Mayanja-Kizza, H., Kiragga, A., Colebunders, R., Manabe, Y.C., Nabatanzi, R., Kamya, M.R. & Cao, H. 2011. High T-cell immune activation and immune exhaustion among individuals with suboptimal CD4 recovery after 4 years of antiretroviral therapy in an African cohort. BMC infectious diseases, 11(1): 43.
Nikolajczyk, B.S., Shin, H. & Gyurko, R. 2011. State of the union between metabolism and the immune system in type 2 diabetes. Genes and Immunity, 12(4): 239–250.
Nkambule, B., Davison, G.M. & Ipp, H. 2015. The evaluation of platelet indices and markers of inflammation, coagulation and disease progression in treatment-na??ve, asymptomatic HIV-infected individuals. International Journal of Laboratory Hematology, 37(4): 450–458.
Nkambule, B.B., Davison, G. & Ipp, H. 2015. The value of flow cytometry in the measurement of platelet activation and aggregation in human immunodeficiency virus infection. Platelets, 26(3): 250–257.
Nolsøe, R.L., Hamid, Y.H., Pociot, F., Paulsen, S., Andersen, K.M. & Drivsholm, T. 2006. Association of a microsatellite in FASL to type II diabetes and of the FAS-670G > A genotype to insulin resistance. Genes and Immunity, 7: 316–321.
Oestreich, K.J., Yoon, H., Ahmed, R. & Boss, J.M. 2009. NFATc1 Regulates Programmed Death-1 Expression Upon T Cell Activation. Journal of Immunology, 181(7): 4832–4839.
Okazaki, T. & Honjo, T. 2007. PD-1 and PD-1 ligands: From discovery to clinical application. International Immunology, 19(7): 813–824.
Oleszczak, B., Szablewski, L. & Pliszka, M. 2012. The effect of hyperglycemia and hypoglycemia on glucose transport and expression of glucose transporters in human lymphocytes B and T : An in vitro study. Diabetes Research and Clinical Practice, 96: 170–178.
Ozougwu, O. 2013. The pathogenesis and pathophysiology of type 1 and type 2 diabetes mellitus. Journal of Physiology and Pathophysiology, 4(4): 46–57.
Parkin, J. & Cohen, B. 2001. An overview of the immune system. Lancet, 357(9270): 1777–1789.
Pavon, E.J., Zumaquero, E., Rosal-Vela, A., Khoo, K.M., Cerezo-Wallis, D., Garcia-Rodriguez, S., Carrascal, M., Abian, J., Graeff, R., Callejas-Rubio, J.-L., Ortego-Centeno, N., Malavasi, F., Zubiaur, M. & Sancho, J. 2013. Increased CD38 expression in T cells and circulating anti-CD38 IgG autoantibodies differentially correlate with distinct cytokine profiles and disease activity in systemic lupus erythematosus patients. Cytokine, 62(2): 232–243.
Peter, M.E., Ehret, A., Berndt, C. & Krammer, P.H. 1997. AIDS and the death receptors. British Medical Bulletin, 53(3): 604–16.
63
Peter, M.E., Hadji, A., Murmann, A.E., Brockway, S., Putzbach, W., Pattanayak, A. & Ceppi, P. 2015. The role of CD95 and CD95 ligand in cancer. Cell death and differentiation, 22(4): 549–59. http://dx.doi.org/10.1038/cdd.2015.3.
Pickup, J.C. 2004. Inflammation and activated innate immunity in the pathogenesis of type 2 diabetes. Diabetes care, 27(3): 813–823.
Pickup, J.C. & Crook, M.A. 1998. Is type II diabetes mellitus a disease of the innate immune system? Diabetologia, 41(10): 1241–1248.
Qadan, M., Ed, M., Weller, E.B., Gardner, S.A., Maldonado, C., Fry, D.E. & Polk, H.C. 2010. Glucose and Surgical Sepsis : A Study of Underlying Immunologic Mechanisms. Journal of the American College of Surgeons, 210(6): 966–974.
Refaeli, Y., Parijs, L. Van & London, C.A. 1998. Biochemical Mechanisms of IL-2 – Regulated Fas-Mediated T Cell Apoptosis. Immunity, 8: 615–623.
Renzaho, A.M.N. 2015. The post-2015 development agenda for diabetes in sub-Saharan Africa: challenges and future directions. Global Health Action, 8: 1–8.
Reyes, L.A., Boslett, J., Varadharaj, S., Pascali, F. De & Hemann, C. 2015. Depletion of NADP (H) due to CD38 activation triggers endothelial dysfunction in the postischemic heart. Proceedings of the National Academy of Sciences of the United States of America, 112(37): 11648–11653.
Riella, L. V, Paterson, A.M., Sharpe, A.H. & Chandraker, A. 2012. Role of the PD-1 Pathway in the Immune Response. American Journal of Transplantation, 12(10): 2575–2587.
Rivera-Nieves, J., Gorfu, G. & Ley, K. 2008. Regulation of leukocyte adhesion and signaling in inflammation and disease. Infammatory Bowel Disease, 14(12): 1715–1735.
Romagnani, S. 2006. Regulation of the T cell response. Clinical and experimental allergy : journal of the British Society for Allergy and Clinical Immunology, 36(11): 1357–1366.
Rondina, M.T., Weyrich, A.S. & Zimmerman, G.A. 2013. Platelets as Cellualr Effectors of Inflammation in Vascular Diseases. Circulation research, 112(11): 1506–1519.
Saber, K., Ramzy, T. & Hanna, A. 2007. The Study of CD 69 as an Early Marker of SLE Activity in Pediatrics. Journal of Medical Science, 7(1): 74–80.
Sachdeva, M., Fischl, M.A., Pahwa, R., Sachdeva, N. & Pahwa, S. 2010. Immune Exhaustion Occurs Concomitantly with Immune Activation and Decrease in Regulatory T Cells in Viremic Chronically HIV-1 Infected Patients. Journal of Acquired Immune Deficiency Syndrome, 54(5): 447–454.
Sakaguchi, S., Ono, M., Setoguchi, R., Yagi, H., Hori, S., Fehervari, Z., Shimizu, J., Takahashi, T. & Nomura, T. 2006. Foxp3+ CD25+ CD4+ natural regulatory T cells in dominant self-tolerance and autoimmune disease. Immunological Reviews, 212: 8–27.
Salgado, F.J., Lojo, J., Fernández-alonso, C.M., Viñuela, J.E. & Cordero, O.J. 2002. Interleukin-dependent modulation of HLA-DR expression on CD4 and CD8 activated T cells. Immunology and Cell Biology, 80: 138–147.
Sathish, V., Thompson, M.A., Sinha, S., Sieck, G.C., Prakash, Y. & Pabelick, C.M. 2014. Inflammation, Caveolae And Cd38-Mediated Calcium Regulation In Human Airway Smooth Muscle. Biochimica et Biophysica Acta, 1843(2): 346–351.
64
Savill, J. 1997. Recognition and phagocytosis of cells undergoing apoptosis. British Medical Bulletin, 53(3): 491–508.
Schietinger, A. & Greenberg, P.D. 2014. Tolerance and exhaustion: Defining mechanisms of T cell dysfunction. Trends in Immunology, 35(2): 51–60. http://dx.doi.org/10.1016/j.it.2013.10.001.
Schietinger, A. & Philip D, G. 2015. Tolerance and Exhaustion: Defining Mechanisms of T cell Dysfunction. Trends in Immunology, 35(2): 51–60.
Sharpe, A.H., Wherry, E.J., Ahmed, R. & Freeman, G.J. 2007. The function of programmed cell death 1 and its ligands in regulating autoimmunity and infection. Nature immunology, 8(3): 239–45.
Shi, B., Du, X., Wang, Q., Chen, Y. & Zhang, X. 2013. Increased PD-1 on CD4+CD28- T cell and soluble PD-1 ligand-1 in patients with T2DM: Association with atherosclerotic macrovascular diseases. Metabolism: Clinical and Experimental, 62(6): 778–785.
Shrivastava, A.K., Singh, H.V., Raizada, A. & Singh, S.K. 2015. Egyptian Society of Cardiology C-reactive protein , inflammation and coronary heart disease. The Egyptian Heart Journal, 67(2): 89–97.
Smith, M.Z., Bastidas, S., Karrer, U. & Oxenius, A. 2013. Impact of antigen specificity on CD4+ T cell activation in chronic HIV-1 infection. BMC Infectious Diseases, 13(1): 100.
Statistics South Africa. 2014. Mortality and causes of death in South Africa, 2012: Findings from death notification. statssa.gov.za, (November): 1–115. http://www.statssa.gov.za/Publications/P03093/P030932010.pdf\nhttp://www.statssa.gov.za/Publications/P03093/P030932009.pdf.
Stegenga, M.E., Crabben, S.N. Van Der, Blu, R.M.E., Levi, M., Meijers, J.C.M., Serlie, M.J., Tanck, M.W.T., Sauerwein, H.P. & Poll, T. Van Der. 2008. Hyperglycemia enhances coagulation and reduces neutrophil degranulation , whereas hyperinsulinemia inhibits fibrinolysis during human endotoxemia. Blood Journal, 112(1): 82–90.
Stentz, F.B. & Kitabchi, A.E. 2005. Hyperglycemia-induced activation of human T-lymphocytes with de novo emergence of insulin receptors and generation of reactive oxygen species. Biochemical and Biophysical Research Communications, 335: 491–495.
Tanner, J.E. & Alfieri, C. 1999. Epstein-Barr virus induces Fas (CD95) in T cells and Fas ligand in B cells leading to T-cell apoptosis. Blood, 94(10): 3439–47.
Trautmann, L., Janbazian, L., Chomont, N., Said, E.A., Gimmig, S., Bessette, B., Boulassel, M., Delwart, E., Sepulveda, H., Balderas, R.S., Routy, J., Haddad, E.K. & Sekaly, R. 2006. Upregulation of PD-1 expression on HIV-specific CD8 + T cells leads to reversible immune dysfunction. Nature medicine, 12(10): 1198–1203.
Tung, J.W., Heydari, K., Tirouvanziam, R., Sahaf, B., Parks, D.R., Herzenberg, L.A. & Herzenberg, L.A. 2007. Moden Flow Cytometry: A Practical Approach. Clinics in Laboratory Medicine, 27(3): 453–468.
Turina, M., Miller, F.N. & Tucker, C.F. 2006. Short-term Hyperglycemia in Surgical Patients and a Study of Related Cellular Mechanisms. Annal sof Surgery, 243(6): 845–853.
Tzeng, H., Tsai, H., Liao, H., Lin, Y., Chen, L., Chen, P. & Hsu, N. 2012. PD-1 Blockage Reverses Immune Dysfunction and Hepatitis B Viral Persistence in a Mouse Animal

65
Model. PLOS ONE, 7(6): 1–9.
Ueno, A., Murasaki, K., Hagiwara, N. & Kasanuki, H. 2007. Increases in circulating T lymphocytes expressing HLA-DR and CD40 ligand in patients with dilated cardiomyophthy. Heart and Vessels, 22(5): 316–321.
Van Parijs, L., Ibraghimov, A. & Abbas, A.K. 1996. The Roles of Costimulation and Fas in T Cell Apoptosis and Peripheral Tolerance. Immunity, 4: 321–328.
Vazzana, N., Ranalli, P., Cuccurullo, C. & Davì, G. 2012. Diabetes mellitus and thrombosis. Thrombosis Research, 129(3): 371–377.
Viallard, J., Bloch-Michel, C., Neau-Cransac, M., Taupin, J., Garrigue, S., Miossec, V., Mercie, P., Pellegrin, J. & Moreau, J. 2001. HLA-DR expression on lymphocyte subsets as a marker of disease activity in patients with systemic lupus erythematosus. Clinical & Experimental Immunology, 125: 485–491.
Wahi, S.M., Feldman, G.M. & Mccarthy, J.B. 1996. Regulation of leukocyte adhesion and signaling in inflammation. , 59: 789–796.
Wan, Y.Y. & Flavell, R.A. 2007. Regulatory T Cells , Transforming Growth Factor -β and Immune Suppression. Proceedings Of The American Thoracic Society, 4(17): 271–276.
Wang, Q., Zhai, X., Chen, X., Lu, J., Zhang, Y. & Huang, Q. 2014. Dysregulation of circulating CD4+CXCR5+ T cells in type 2 diabetes mellitus. Apmis, 123(2): 146–151.
Ward, P.A. 2010. More information Acute and Chronic Inflammation. Fundamentals of Inflammation, 1: 1–10.
Warrington, R., Watson, W., Kim, H.L. & Antonetti, F. 2011. An introduction to immunology and immunopathology. Allergy, Asthma & Clinical Immunology, 7(1): 1–8.
Wei, W., Graeff, R. & Yue, J. 2014. Roles and mechanisms of the CD38/cyclic adenosine diphosphate ribose/Ca2+ signaling pathway. World Journal of Biological Chemistry, 5(1): 58–68.
Weiss, U. 2008. Inflammation. nature insight, 454(7203): 7203.
Wherry, E.J. & Kurachi, M. 2015. Molecular and cellular insights into T cell exhaustion. Nature immunology, 15(8): 486–499.
WHO see World Health Organisation.
World Health Organisation. 2006. Definition and Diagnosis of Diabetes Mellitus and Intermediate Hyperglycaemia. Geneva.
World Health Organisation. 2016. Global Report On Diabetes. Geneva.
Wu, C.-C., Sytwu, H.-K., Lu, K.-C. & Lin, Y.-F. 2011. Role of T Cells in Type 2 Diabetic Nephropathy. Experimental Diabetes Research: 1–9.
Wu, Y.S. & Chen, S.N. 2014. Apoptotic cell: Linkage of inflammation and wound healing. Frontiers in Pharmacology, 5: 1–6.
Xia, C., Rao, X. & Zhong, J. 2017. Role of T Lymphocytes in Type 2 Diabetes and Diabetes-Associated Inflammation. Journal of Diabetes Research, 2017: 1–6.
66
Xing, Y. & Hogquist, K.A. 2012. T-Cell Tolerance : Central and Peripheral. Cold Spring Harbour Perspectivies Biology, 4: 1–16.
Xiu, F., Stanojcic, M., Diao, L. & Jeschke, M.G. 2014. Stress Hyperglycemia , Insulin Treatment , and Innate Immune Cells. international Journal of Endocrinology, 2014: 1–9.
Xu, Y.Z., Kanagaratham, C. & Youssef, M. 2016. New Frontiers in Cancer Chemotherapy — Targeting Cell Death Pathways. In S. Najman, ed. Cell Biology New insights. 93–140.

67
APPENDICES
Appendix 1: Quality Control (QC)
Daily QC protocol was run on the instrument prior to any sample acquisition. Flow check
fluorophores of uniformly sized microbeads (Beckman Coulter, Miami, FL) were used to
standardise the optical path and laminar flow. The microbeads had predefined levels of
fluorescence intensity and the half peak coefficient of variation (HP-CV) of each flow channel
(FL1-FL8) was then measured. For the QC to pass, the HP-CVs of the flow channels should
have been within set values and small since the beads fluoresce the same intensity (Fig 1).
Levey-Jennings graphs were then used to plot the values obtained daily and determine
action to implement should parameters fall outside the expected ranges.

68
Figure 1: The figure illustrates plots of a QC that has passed. Plot A shows the primary gates on the red and blue fluorophores. Plots B-F illustrates flow fluorescent channels (FL1-FL5) on blue laser with HP X-CVs within the manufacturer’s stipulated ranges. Plot G-I shows FL6-FL-8 channels on red lesser as well as their HP X-CVs within set ranges.

69
Appendix 2: Fluorescence Minus One (FMOs)
For markers that can be either up-regulated or down-regulated, such as HLA-DR, CD38 and
PD-1 amongst other surface markers used in this study, FMO controls were used to
distinguish between positive and negative events (Fig 1). An FMO control contains all the
flourochromes in a panel except for the one that is being measured. Thus FMOs take into
account the intrinsic autofluorescence of the cell and fluorescence due to the antibody
binding detected in that flow channel (Tung et al., 2007).
Figure 1: Florescence Minus One (FMO) controls. Plot A illustrates the primary gating for T-cells used in the FMOs. Plots B, C, D and E illustrate FMOs of CD38-PerCP-Cy5.5, HLA-DR-Alexa Fluor 700, CD95-FITC and PD-1-APC respectively, which were used to independently determine the boundaries between positive and negative events. A positive event was defined as greater than 1% and conversely, events less than 1% were considered to be negative

70
.
Appendix 3: Titrations
Antibody titrations assays were done on all monoclonal antibodies (mAbs) used in this study
to minimise non-specific antibody binding (Hulspas, 2010). Five (5) tubes per mAb titration
were prepared using different antibody volumes from 0.5-2.5μl. The samples were then
stained, incubated, lysed and acquired in the same manner as in the baseline protocols.
Signal to noise ratios were then calculated using the formula below and the volume with the
highest signal to noise ratio was chosen as the optimum antibody volume titration for each
specific mAb used in a specific panel (Fig 1).
Formula: Signal to noise ratio = 𝑃𝑜𝑠𝑖𝑡𝑖𝑣𝑒 𝑀𝐹𝐼
𝑁𝑒𝑔𝑎𝑡𝑖𝑣𝑒 𝑀𝐹𝐼 x 100.
This process was implemented on all the mAbs that were used in this study. Figure 1 below
illustrates how the optimum volume of CD3 was determined.
Figure 1: CD3-PC7 antibody titration. Plots A-E illustrates the positive and negative mean fluorescence index (MFI) of CD3-PC7 at different antibody volumes (1μl; 1.4μl; 1.8μl; 2.1μl and 2.5μl). The MFI’s were then used to calculate the signal to noise ratio using the formula above and the results were plotted in graph (F). For this particular antibody (CD3-PC7), a volume of 2.1μl had the highest signal to noise ratio of 446% hence it was selected as the optimum volume of CD3-PC7 in the panels used in this study. This process was done on all other mAbs used in this study.
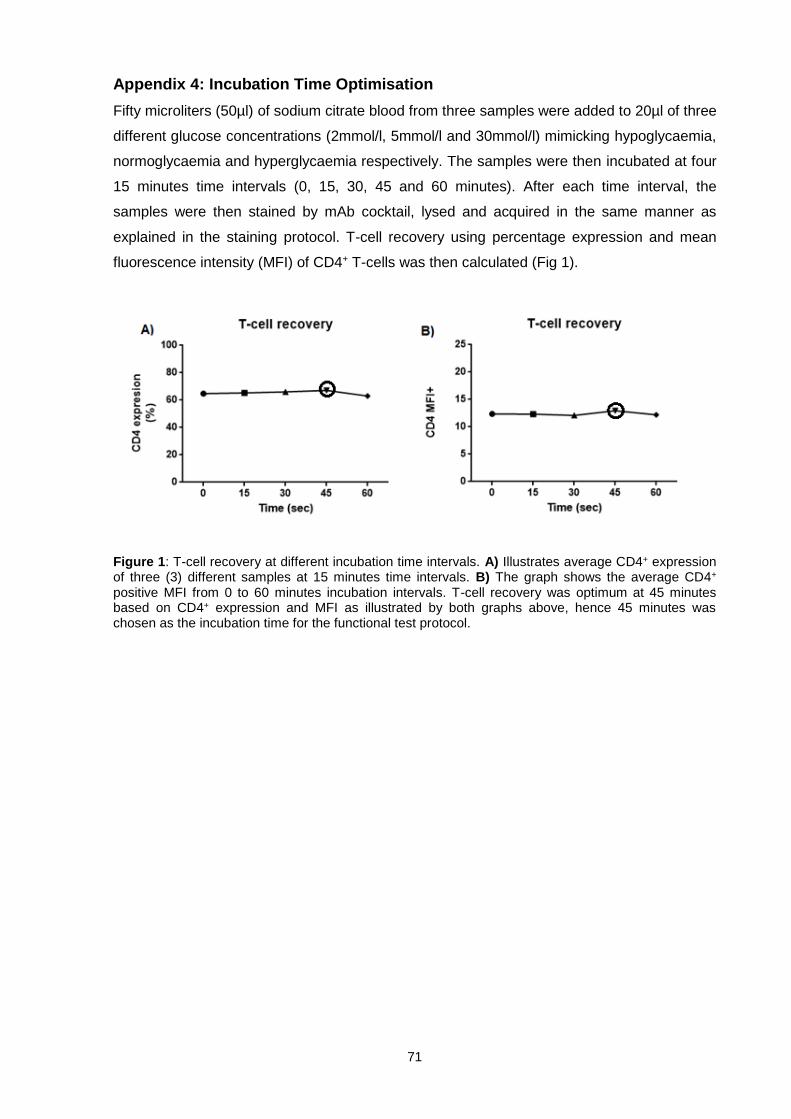
71
Appendix 4: Incubation Time Optimisation
Fifty microliters (50µl) of sodium citrate blood from three samples were added to 20µl of three
different glucose concentrations (2mmol/l, 5mmol/l and 30mmol/l) mimicking hypoglycaemia,
normoglycaemia and hyperglycaemia respectively. The samples were then incubated at four
15 minutes time intervals (0, 15, 30, 45 and 60 minutes). After each time interval, the
samples were then stained by mAb cocktail, lysed and acquired in the same manner as
explained in the staining protocol. T-cell recovery using percentage expression and mean
fluorescence intensity (MFI) of CD4+ T-cells was then calculated (Fig 1).
Figure 1: T-cell recovery at different incubation time intervals. A) Illustrates average CD4+ expression of three (3) different samples at 15 minutes time intervals. B) The graph shows the average CD4+ positive MFI from 0 to 60 minutes incubation intervals. T-cell recovery was optimum at 45 minutes based on CD4+ expression and MFI as illustrated by both graphs above, hence 45 minutes was chosen as the incubation time for the functional test protocol.

72
Appendix 5: Viability Marker Control
The T-cell viability control test was done to investigate whether or not, the 45 minutes
incubation time had any influence on cell survival. For the test control, 100µl of citrate blood
were placed in a water bath at 65oC for 5 minutes. 50µl of the heat-shocked cells were then
stained and acquired in parallel with the unstained fresh cells (Fig 1A). An unstained sample
was used to discriminate positive events from negative (Fig 1B). Three (3) samples were
then incubated at 37oC for 45minutes in the 3 different glucose concentrations (2mmol/l,
5mmoml/l and 30mmol/l), stained using the stimulation protocol for both the activation and
exhaustion panels with addition of Zombie NIR-APC/Cy7 fixable viability dye. This T-cell
viability test demonstrated that the incubation time used in this study did not influence cell
survival and viability (Fig 2).
Figure 1: Viability marker control test. Pot A) Distinguishes live cells from dead cells using the Zombie NIR-APC/Cy7 dye. Plot B) Demonstrates how the negative events were distinguished from positive events using fresh unstained blood sample by the use of mean fluorescence intensity (MFI).

73
Figure 2: T-cell viability test. Percentages of dead cells using the Zombie NIR viability dye was measured in three (3) samples post 45 minutes incubation at 37oC in 2mmol/l, 5mmol/l and 30mmol/l glucose concentration, represented by A, B and C respectively. The plots illustrate that the incubation time, the glucose concentrations and research methods applied in this study did not cause cells to die.

74
ADDENDA
ADDENDUM 1: Participant Information Leaflet and Consent Form

75
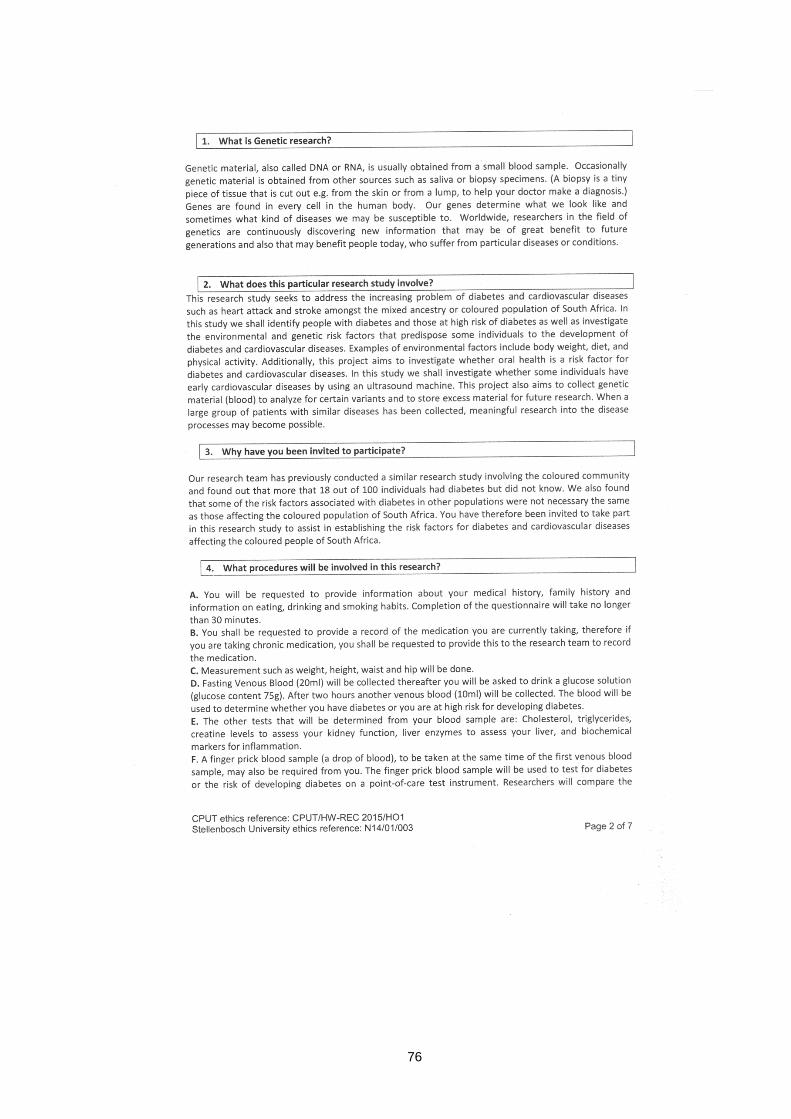
76

77
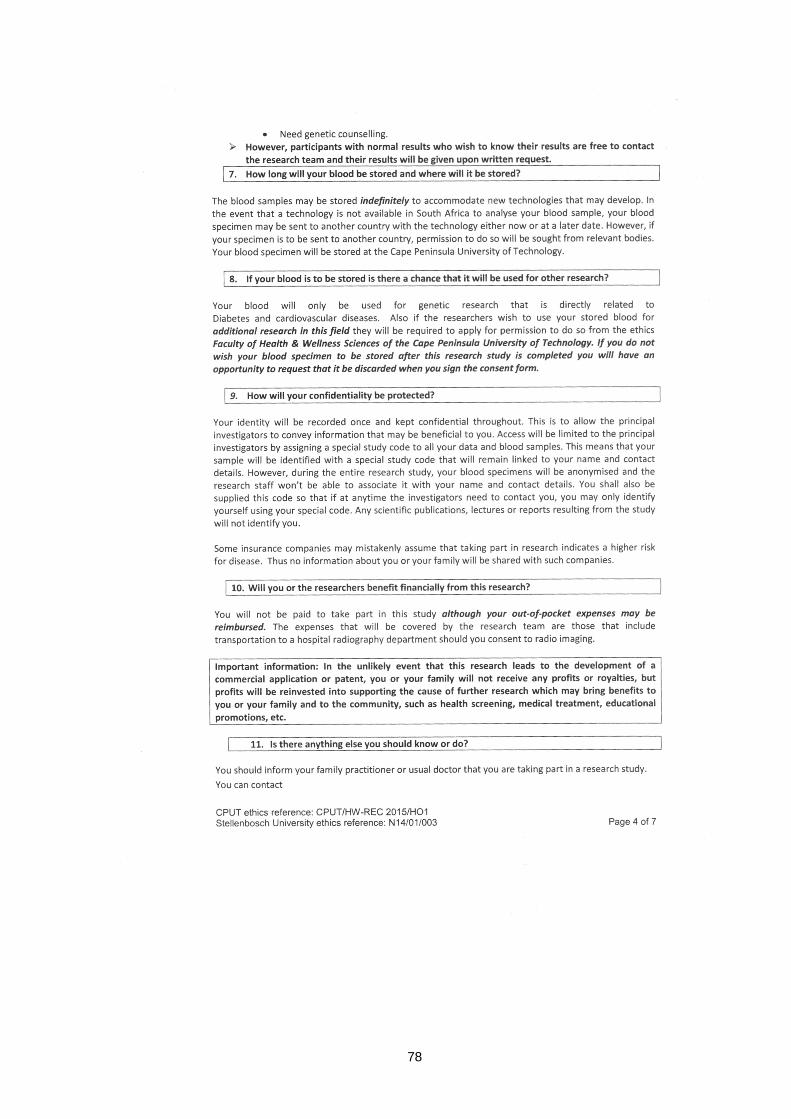
78

79

80
81
82
ADDENDUM 2: Ethical Clearance

83
Addendum 3: Research Outputs
Conference Presentations
Poster presentations
S.T.E.M congress, October 27th- 29th 2015, Johannesburg, South Africa
Fas signalling pathway in hyperglycaemia. Nyambuya T.M1, Nkambule BB1, Davison
GM1, Matsha TE1. Department of Biomedical sciences, Faculty of Health and wellness
sciences, Cape Peninsula University of Technology, Bellville, South Africa1.
Oral presentations
Laboratory Medicine congress, May 18th – 21st 2017, Durban, South Africa
PD-1 and HLA-DR expression in Hyperglycaemia. Nyambuya, TM1, Davison, GM1,
Nkambule, BB1, 2, Matsha T1. Department of Biomedical sciences, Faculty of Health and
wellness sciences, Cape Peninsula University of Technology, Bellville, South Africa1. School
of Laboratory Medicine and Medical Sciences, University of KwaZulu-Natal, Durban, South
Africa2.