
MARK HAY - Kuwait 3rd Flow Measurement Technology...
19
Transcript of MARK HAY - Kuwait 3rd Flow Measurement Technology...


MARK HAY Operations Manager, KELTON
Graduated in Electronic and Electrical Engineering Various roles have included: • Research into differential pressure generating devices at
the UK National Physical Laboratory • Measurement Consultant KELTON Engineering • Head of Allocation and Measurement for Maersk Oil
North Sea
Now responsible for the KELTON range of software products.
Comparison between using historical look-up tables vs. algorithms for crude oil volume correction factor (VCF) determination.
Study conducted by James Speight and Mark Hay of KELTON Engineering.
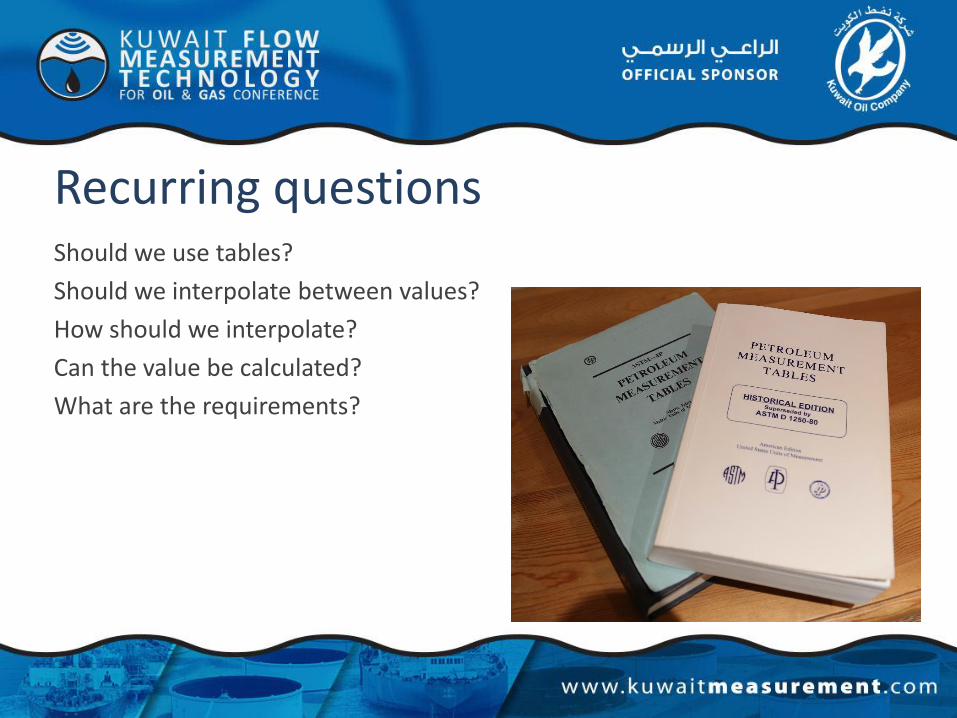
Recurring questions Should we use tables?
Should we interpolate between values?
How should we interpolate?
Can the value be calculated?
What are the requirements?
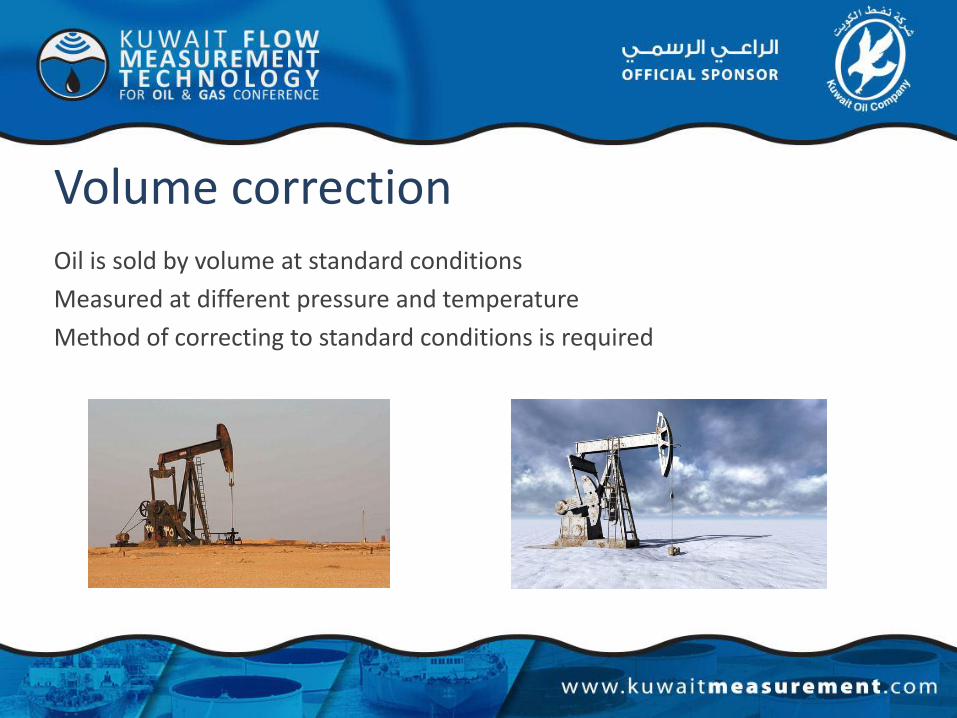
Volume correction Oil is sold by volume at standard conditions
Measured at different pressure and temperature
Method of correcting to standard conditions is required

It’s good to fill cars on a cold day
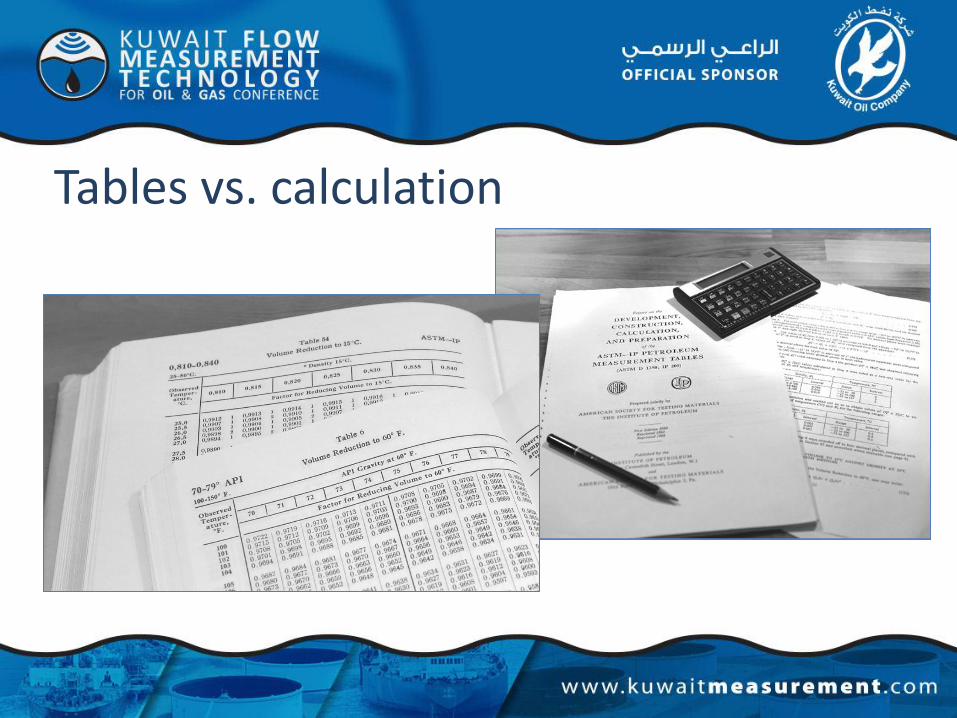
Tables vs. calculation

ASTM-IP Petroleum Measurement Tables Table 54
Table 6

Calculated VCF ASTM D1250, IP 200 - Report on the Development, Construction, Calculation, and Preparation of the ASTM-IP Petroleum Measurement Tables (1960)
Implemented in FLOCALC®.net
Calculation F073 - Table 54:1952
Calculation F084 - Table 6:1952
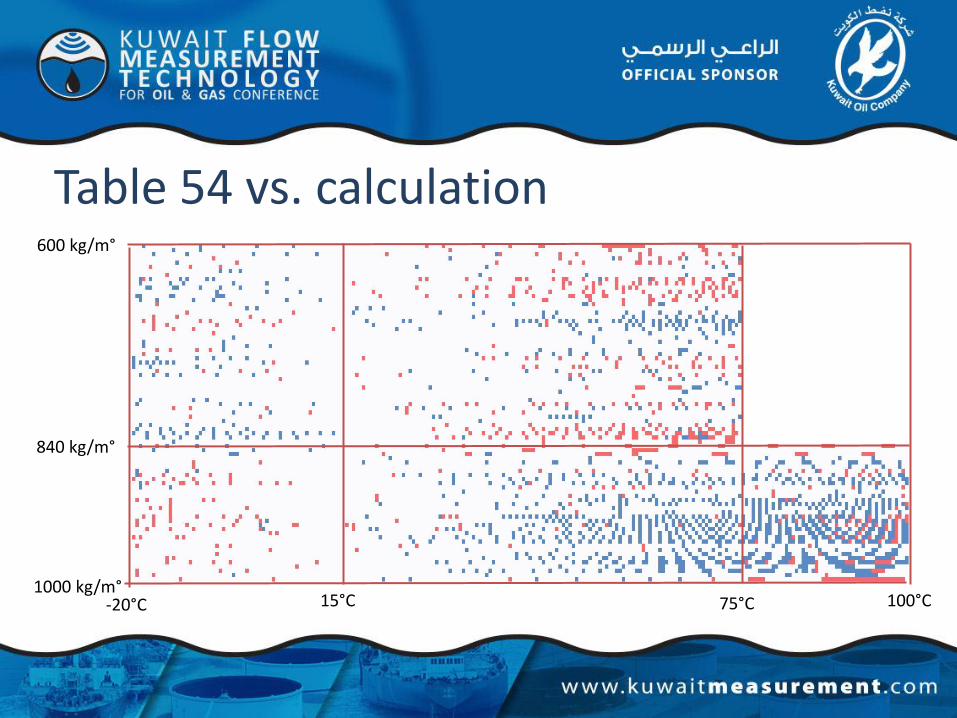
Table 54 vs. calculation
75°C 15°C -20°C 100°C
600 kg/m°
840 kg/m°
1000 kg/m°

Table 6 vs. calculation
150°F 60°F 0°F 250°F
0 °API
40 °API
1000 kg/m°
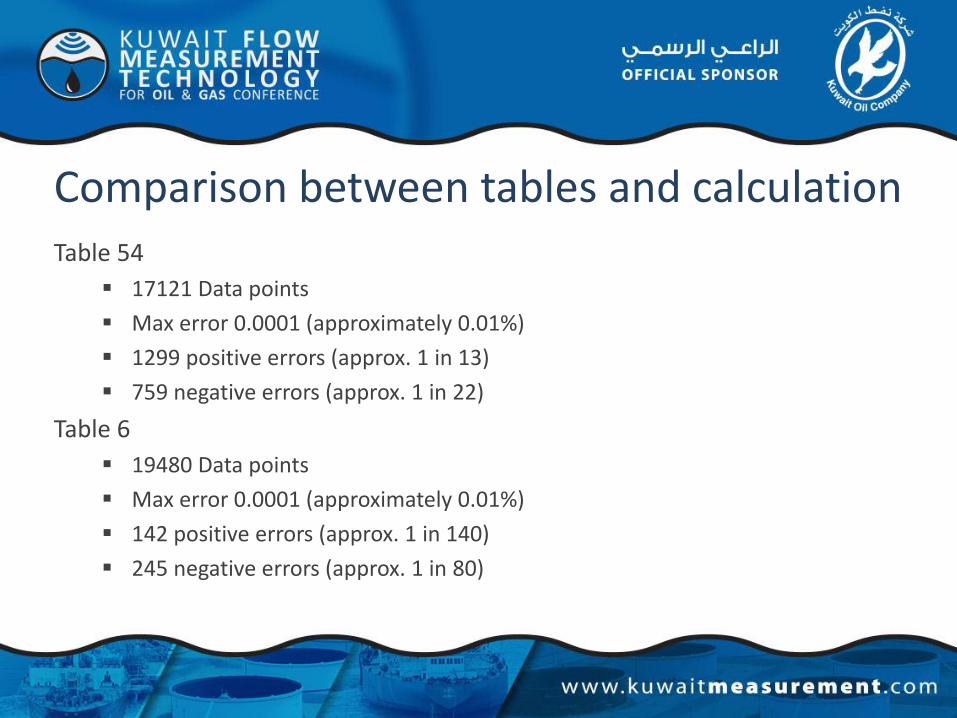
Comparison between tables and calculation Table 54
17121 Data points
Max error 0.0001 (approximately 0.01%)
1299 positive errors (approx. 1 in 13)
759 negative errors (approx. 1 in 22)
Table 6
19480 Data points
Max error 0.0001 (approximately 0.01%)
142 positive errors (approx. 1 in 140)
245 negative errors (approx. 1 in 80)
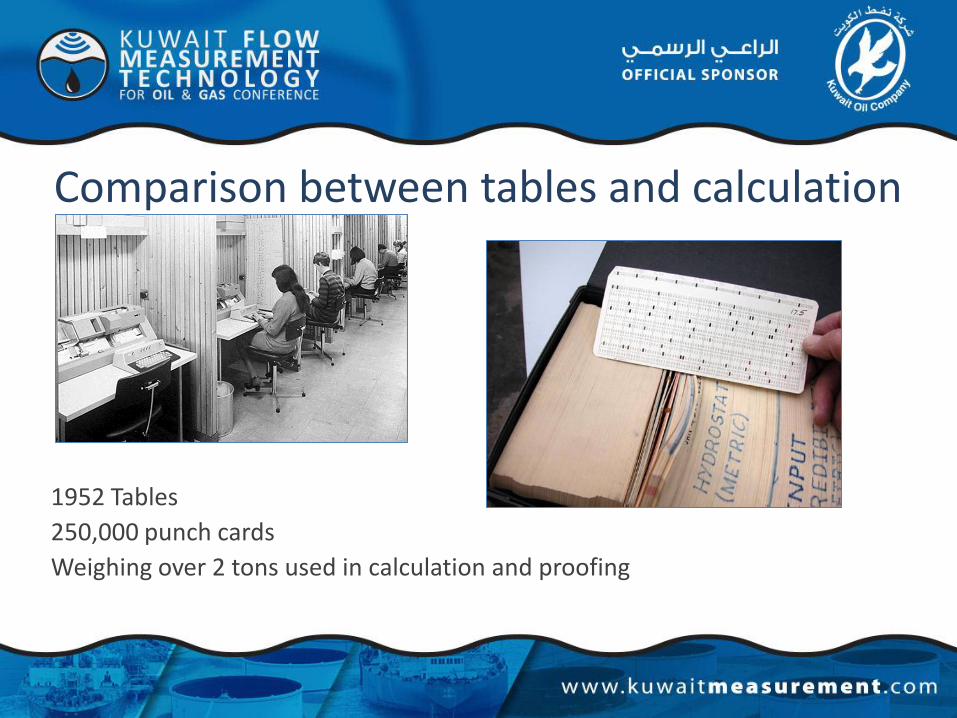
Comparison between tables and calculation
1952 Tables
250,000 punch cards
Weighing over 2 tons used in calculation and proofing

Significance of discrepancy
0.9770
0.9775
0.9780
0.9785
0.9790
0.9795
41.5 42.0 42.5 43.0 43.5 44.0
Vo
lum
e co
rrec
tio
n f
acto
r
Temperature/°C
Table 54: 1952
850 kg/m³ 855 kg/m³ 860 kg/m³ 865 kg/m³ 870 kg/m³

Significance of discrepancy
0.9765
0.9770
0.9775
0.9780
0.9785
0.9790
0.9795
41.0 41.5 42.0 42.5 43.0 43.5 44.0 44.5
Vo
lum
e co
rrec
tio
n f
acto
r
Temperature/°C
Table 54: 1952 vs. 2004
1952: 865 kg/m³ 1952: 870 kg/m³ 2004: 865 kg/m³ 2004: 870 kg/m³
Flow computer implementation Look-up tables
Tables implemented to include error
Interpolation between API or Density
Temperature rounded to nearest interval
Calculation
Interpolation not required
Which is correct?
Does it make any difference to the integrity of the measurement system?
Conclusions 1952 Tables are not 100% consistent with the calculations they are based
on.
The discrepancy is generally less than the least significant digit (0.0001).
The error is insignificant compared with uncertainty in the measurement and differences between table editions.
The method of interpolation is insignificant and will not result in a detectable bias
Recommend using the calculation as this is easier to reproduce and validate.

Thank you


