MARITIME TECHNOLOGY COOPERATION CENTRE FOR AFRICA …
76
MARITIME TECHNOLOGY COOPERATION CENTRE FOR AFRICA (MTCC-Africa) CAPACITY BUILDING FOR CLIMATE MITIGATION IN THE MARITIME SHIPPING INDUSTRY THE GLOBAL MTCC NETWORK (GMN) PROJECT MTCC-AFRICA PILOT PROJECT 1 UPTAKE OF PORT ENERGY EFFICIENT TECHNOLOGIES AND OPERATIONS HOST OF MTCC AFRICA
Transcript of MARITIME TECHNOLOGY COOPERATION CENTRE FOR AFRICA …
MARITIME TECHNOLOGY COOPERATION CENTRE FOR AFRICA
(MTCC-Africa)
CAPACITY BUILDING FOR CLIMATE MITIGATION IN THE MARITIME
SHIPPING INDUSTRY
THE GLOBAL MTCC NETWORK (GMN) PROJECT
MTCC-AFRICA PILOT PROJECT 1
UPTAKE OF PORT ENERGY EFFICIENT TECHNOLOGIES AND
OPERATIONS
HOST OF
MTCC AFRICA

ii
TABLE OF CONTENTS TABLE OF CONTENTS ........................................................................................................................ ii
LIST OF TABLES ............................................................................................................................. - 1 -
LIST OF FIGURES ........................................................................................................................... - 2 -
1.0 INTRODUCTION ....................................................................................................................... - 1 -
2.0 REPORTS AND ANALYSIS ON PREVIOUS ENERGY AUDITS DONE FOR THE PORT OF
MOMBASA. ...................................................................................................................................... - 1 -
2.1 BACKGOUND OF PORT AUDITS AND ENABLING ENVIRONMENT .......................... - 1 -
2.2 KPA LEVEL I ENERGY AUDIT AND ITS RECOMMEDATIONS .................................... - 2 -
2.3 ENERGY COST REDUCTION OPPORTUNITIES AT KENYA PORTS AUTHORITY .. - 4 -
2. 3.1 POWER FACTOR CORRECTION ................................................................................ - 4 -
2. 3.2 CHILLER AND AC IMPROVEMENTS: ....................................................................... - 5 -
2.3.3 USE OF AIR CURTAINS ................................................................................................ - 5 -
2.3.4 LIGHTING IMPROVEMENTS ....................................................................................... - 6 -
2.3.5 USE OF OCCUPANCY SENSORS ................................................................................. - 6 -
2.3.6 USE OF SOLAR WATER HEATERS FOR BANDARI COLLEGE HOSTEL &
KITCHEN .................................................................................................................................. - 7 -
2.3.7 LIFT CONTROLS UPGRADE ........................................................................................ - 8 -
2.3.8 RETROFIT (USE OF PREMIUM EFFICIENCY MOTORS) MOTOR .......................... - 8 -
2.3.9 ENERGY MANAGEMENT SYSTEM .......................................................................... - 10 -
2.3.10 SOLAR POWER GENERATION OPTION: ............................................................... - 11 -
2.3.11 ENERGY SAVINGS ON COMPUTERS .................................................................... - 11 -
2.3.12 ENERGY EFFICIENCY IN USE OF CONTAINER CRANES .................................. - 13 -
2.3.13 GENERAL AREAS OF IMPROVEMENT: ................................................................ - 14 -
2.4 SUMMARY OF VIABLE PROJECTS AS PER ENERGY AUDIT 2015 REPORT ........... - 14 -
2.5 OTHER ENERGY AUDITS AND EMMISSION REDUCTION STUDIES CONDUCTED IN
THE PORT OF MOMBASA AND THEIR RECOMMENDATIONS ....................................... - 15 -
2.5.1 ANALYTICAL ASSESSMENT OF PORT ENERGY EFFICIENCY AND
MANAGEMENT: A CASE STUDY OF THE KENYA PORTS AUTHORITY ................... - 16 -
2.5.2 THE GREEN PORT POLICY ........................................................................................ - 20 -
2.5.3 CONSULTANCY SERVICES FOR THE PROPOSED STUDY OF ENERGY NEEDS,
ALTERNATIVE ENERGY SOURCES AND PROVISION OF SHORE POWER (COLD
IRONING) FOR THE PORT OF MOMBASA ...................................................................... - 22 -
2.5.4 MONETARY AND ECOLOGICAL COST-BENEFIT ANALYSIS OF ONSHORE
POWER SUPPLY; A CASE STUDY OF THE PORT OF MOMBASA................................ - 24 -

iii
2.6 ANALYSIS OF THE RECOMMENDATIONS OF THE VARIOUS ENERGY AUDIT
REPORTS/STUDIES CARRIED OUT ON THE PORT OF MOMBASA ................................ - 25 -
2.7 CONCLUSION ON ANALYSIS OF PREVIOUS AUDITS CARRIED OUT AT THE POM .... -
27 -
3.0 IMPACTS OF THE PROPOSED ENERGY SAVING/EMISSION REDUCTION STRATEGIES
AT THE PORT OF MOMBASA..................................................................................................... - 28 -
3.1 BACKGOUND OF STUDY ................................................................................................. - 28 -
3.2 IMPACTS OF THE PROPOSED ENERGY SAVING MEASURES................................... - 29 -
3.2.1 POWER FACTOR CORRECTION ............................................................................... - 29 -
3.2.2 CHILLER IMPROVEMENTS: .......................................................................................... - 30 -
3.2.3 SAVINGS ON USE OF AIRCOSAVERS ON AIR CONDITIONERS ........................ - 32 -
3.2.3 IMPACTS ON LIGHTING IMPROVEMENTS ............................................................ - 34 -
3.2.4 POTENTIAL IMPACTS ON USE OF OCCUPANCY SENSORS ............................... - 35 -
3.2.5 USE OF SOLAR WATER HEATERS FOR BANDARI COLLEGE HOSTEL &
KITCHEN IMPACTS .............................................................................................................. - 37 -
3.2.6 LIFT CONTROLS UPGRADE ...................................................................................... - 40 -
3.2.7 USE OF PREMIUM EFFICIENCY MOTORS .............................................................. - 40 -
3.2.8 ENERGY SAVING FROM THE ENERGY MANAGEMENT SYSTEM .................... - 41 -
3.2.9 SOLAR POWER GENERATION OPTION: ..................................................................... - 42 -
3.2.10 ENERGY SAVINGS ON COMPUTERS .................................................................... - 43 -
3.2.11 ENERGY EFFICIENCY IN USE OF CONTAINER CRANES .................................. - 44 -
3.2.12 SHORE POWER IMPACTS FOR THE PORT OF MOMBASA ................................ - 44 -
3.2.13 IMPACT ON EMS 14001:2015(ENVIRONMENTAL MANAGEMENT SYSTEM)
IMPLEMENTATION AND OLD TRUCKS REMOVAL FROM THE ROAD .................... - 47 -
3.3 STATUS OF ENERGY SAVING MEASURES IMPLEMENTATION AT THE PORT OF
MOMBASA. ................................................................................................................................ - 49 -
3.4 CHALLENGES/BARRIERS IN IMPLEMENTATION OF THE PROPOSED ENERGY
SAVING MEASURES. ............................................................................................................... - 51 -
4.0 LEVEL 2 ENERGY AUDIT FOR THE PORT OF MOMBASA AND LEVEL 1 ENERGY
AUDIT FOR THE PORT OF DOUALA ........................................................................................ - 52 -
4.1 EXECUTIVE SUMMARY.................................................................................................... - 52 -
4.2 INTRODUCTION ................................................................................................................. - 53 -
4.2.1 SITE LOCATION ........................................................................................................... - 53 -
4.2.2 INFRASTRUCTURE AND EQUIPMENT .................................................................... - 53 -
4.2.3 OBJECTIVE OF THE AUDIT ....................................................................................... - 53 -
4.3 AUDIT METHODOLOGY ................................................................................................... - 54 -
4.4 AUDIT FINDINGS, RECOMMENDATIONS AND CONCLUSION - POM ..................... - 55 -

iv
4.4.1 FINDINGS ON POM ENERGY AUDIT ....................................................................... - 55 -
4.5 RECOMMENDATIONS FOR THE POM ............................................................................ - 60 -
4.6 CONCLUSIONS ON POM AUDIT ...................................................................................... - 60 -
4.7 AUDIT FINDINGS, RECOMMENDATIONS AND CONCLUSION – PAD ..................... - 61 -
4.7.1 ELECTRICAL DISTRIBUTION SYSTEM................................................................... - 61 -
4.7.2 EQUIPMENT ENERGY SUPPLY ............................................................................... - 63 -
4.7.3 PAD MASTER PLAN .................................................................................................... - 64 -
4.7.4 RENEWABLE ENERGY USE. ......................................................................................... - 64 -
4.7.5 PORT LIGHTING STATUS .......................................................................................... - 65 -
4.7.6 AIR-CONDITIONING OF OFFICE BLOCKS.............................................................. - 65 -
4.8. TRAINING ON GLOMEEP ................................................................................................. - 66 -
4.9 RECOMMEDATIONS AND CONCLUSION FOR THE PAD AUDIT .............................. - 66 -
5.0 REPORT CONCLUSION.......................................................................................................... - 67 -
6.0 REFERENCES .......................................................................................................................... - 70 -

MTCC –Africa Pilot Project 1: Uptake of Port Energy Efficient Technologies and Operations
- 1 -
LIST OF TABLES TABLE 2.1 SPECIFICATIONS FOR THE PORT HEADQUARTERS LIFT …………..….……..……………8
TABLE 2.2: MOTOR SPECIFICATIONS IN THE AUTHORITY………………………………...……………8
TABLE 2.3 EXISTING MOTOR SPECIFICATIONS FOR GANTRY CRANES………………...…….………9
TABLE 2.4 COMPARISON BETWEEN LCD MONITORS AND LED MONITORS……..……………...…..12
TABLE 2.5 STANDARD AND HIGH EFFICIENCY MOTORS SPECIFICATIONS…………..………...…..13
TABLE 2.6 VIABLE AND IMPLEMENTABLE PROJECTS FOR THE PORT OF MOMBASA….……...…15
TABLE 2.7 SUMMARY OF GAP ANALYSIS IN MOMBASA PORT………………………...……………..17
TABLE 2.8 MATRIX OF PROPOSED EMISSION REDUCTION MEASURES AND IMPLEMENTATION
STATUS……………………………………………………………,……………………………………………25
TABLE 3.1 KPA ADMINISTRATION BLOCK 2 CHILLER DETAILS……..……………………………….30
TABLE 3.2 ADMINISTRATION BLOCK 2 CHILLER PERFORMANCE CHARACTERISTICS……….….30
TABLE 3.3 RECOMMENDATIONS ON CHILLER IMPROVEMENT……………………….…………...…31
TABLE 3.4: AC INVENTORY IN OFFICES……………………………………………………………..…….33
TABLE 3.5: SAVINGS ON ACS ON AIRCOSAVERS INSTALLATION…………………...…………….....33
TABLE 3.6 EXISTING LIGHTS AND PROBABLE RETROFIT……………………………...………………34
TABLE 3.7: AREAS WITH INTERLOCKS AND OCCUPANCY SENSOR ENERGY SAVINGS
POTENTIAL……………………………………………………………………………………………………..36
TABLE 3.8 POTENTIAL SAVING ON REPLACING LPG WITH SOLAR HEATING………………..…….37
TABLE 3.9 OPPORTUNITIES FOR ENERGY SAVINGS IN SOLAR WATER HEATERS INSTALLATION-
BANDARI COLLEGE HOSTELS…………………………………………………..……………..……………39
TABLE 3.10: DIFFERENT MOTOR CAPACITIES AND THEIR EFFICIENCIES…………….…………….40
TABLE 3.11 COMPUTED ENERGY SAVINGS WITH AMPLEX SMARTHABOUR………………..….….41
TABLE 3.12 COST BENEFIT ANALYSIS OF A 500KW SOLAR POWER PLANT………………...………42
TABLE 3.13: JUSTIFICATION FOR EFFICIENT USE OF COMPUTERS…………………………..……....43
TABLE 3.14 SAVINGS ON SHORE POWER CONSIDERING ENVIRONMENTAL BENEFITS……….…45
TABLE 3.15 CALCULATED FUEL USED (HFO &OFF-ROAD DIESEL) USING SOF, LF AND
KWH……..……………………………………………………………………………………………………....46
TABLE 3.16 EMISSION VALUES (TONNES) ANALYZED USING EMISSION FACTORS AND
UTILIZED POWER…………………………………………………………………………………..………….46
TABLE 3.17 TOTAL COST OF EXTERNALITIESSTS…………………………………………..…………...47
TABLE 3.18 SUMMARY OF PROJECT COSTS………………………………………………………………47
TABLE 3.19: IMPLEMENTATION STATUS AND CHALLENGES FOR ENERGY SAVING MEASURES
AT THE PORT OF MOMBASA…………………………………………………………………………...……49
TABLE 4.1 PROPOSED ENERGY SAVING INITIATIVES, INITIATIVES IMPLEMETATION STATUS,
PROJECT IMPACTS AND CHALLENGES FACING ENERGY SAVING PROJECTS IN KPA………....…56

MTCC –Africa Pilot Project 1: Uptake of Port Energy Efficient Technologies and Operations
- 2 -
LIST OF FIGURES FIGURE 2.1 PRIORITISED GREENING PROJECTS IN THE PORT………………………..……………….22
FIGURE 3.1 BASIS FOR FUTURE GHG EMISSIONS …………………………………….….....…………48
FIGURE 3.2 FOOTPRINT OF FUTURE GHG EMISSIONS…………………………………………………..49

MTCC –Africa Pilot Project 1: Uptake of Port Energy Efficient Technologies and Operations
- 1 -
1.0 INTRODUCTION
The main objective of this pilot project is to promote the uptake of energy efficient
technologies and operations within the African ports through the implementation of energy
efficiency strategies. More specifically, the project aims at collecting and analyzing the
various audit reports undertaken for the Port of Mombasa (POM), Determining the impacts of
the proposed energy saving/emission reduction strategies at the Port of Mombasa, undertake
a level 2 Energy Audit for the POM and a level 1 energy audit on one African ports for
purposes of obtaining baseline data on the current situation on the ports and identifying the
various measures that can help to improve energy efficiency.
2.0 REPORTS AND ANALYSIS ON PREVIOUS ENERGY AUDITS
DONE FOR THE PORT OF MOMBASA.
2.1 BACKGOUND OF PORT AUDITS AND ENABLING ENVIRONMENT
The Port of Mombasa is the gateway to East and Central Africa and is one of the busiest Ports
along the East African coastline. The Port provides direct connectivity to over 80 Ports
worldwide and is linked to a vast hinterland comprising Uganda, Rwanda, Burundi, Eastern
Democratic Republic of Congo, Northern Tanzania, Southern Sudan, Somalia and Ethiopia
by road. A railway line also runs from the Port to Uganda and Tanzania.
Established in January 1978 under an Act of Parliament, KPA is mandated to manage and
operate the Port of Mombasa and all scheduled seaports along Kenya’s coastline that include
Lamu, Malindi, Kilifi, Mtwapa, Kiunga, Shimoni, Funzi and Vanga. In addition, the
Authority manages Inland Waterways as well as Inland Container Depots at Embakasi,
Eldoret and Kisumu.
Being a public entity, the port is by law required to adhere to guidelines on Energy
conservation in factories and buildings according to the Energy Act 2006. This Act stipulates
that the occupier of a building/factory shall conserve energy, audit and analyze energy
consumption in his building/factory in accordance with the standards, criteria, and procedures
as prescribed in the regulations. The act stipulates that a person who fails to comply with the
energy conservation provision commits an offence and shall, on conviction, be liable to a fine

MTCC –Africa Pilot Project 1: Uptake of Port Energy Efficient Technologies and Operations
- 2 -
not exceeding one million shillings, or to a maximum term of imprisonment of one year, or to
both.
To broaden the scope of the Energy Act 2006, the parliament enacted the Energy Act 2019.
This Act of Parliament consolidate the laws relating to energy, to provide for National and
County Government functions in relation to energy, to provide for the establishment, powers
and functions of the energy sector entities; promotion of renewable energy; exploration,
recovery and commercial utilization of geothermal energy; regulation of midstream and
downstream petroleum and coal activities; regulation, production, supply and use of
electricity and other energy forms; and for connected purposes.
In addition to the provisions in Energy Act 2006, Energy Act 2019 stipulates that The
Authority shall coordinate the development and implementation of a prudent national energy
efficiency and conservation programme. In addition, the Cabinet Secretary has powers to
enforce efficient use of energy and its conservation. This includes but not limited to specify
the norms for processes and energy consumption standards for any equipment, appliances
which consumes, generates, transmits or supplies energy; specify equipment or appliance or
class of equipment or appliances, as the case may be, for the purposes of this Act and
prohibit manufacture or sale or purchase or import of equipment or appliance specified under
paragraph (b) unless such equipment or appliances conform to minimum energy efficiency
performance standards. The penalty for contravention of the energy saving provision in the
Energy Act 2019 is reduced to a fine not exceeding five hundred thousand shillings but the
imprisonment term is extended to a period not exceeding two years or both.
2.2 KPA LEVEL I ENERGY AUDIT AND ITS RECOMMEDATIONS
The Port of Mombasa conducted its first investment grade energy audit in 2014.EMS
Consultants Ltd was contracted by the Kenya Ports Authority to carry out an investment
grade energy audit at Kenya Ports Authority facilities in Mombasa and Nairobi in order to
identify opportunities for energy efficiency and conform to the energy regulations 2012
issued by the Energy regulatory commission (ERC).
The audit entailed interviews with site management and staff, measurement of energy
parameters using various audit instruments, identification of energy efficiency opportunities,
a financial analysis of the energy conservation (efficiency) measures; covering life cycle cost
and internal rate of return (IRR). This approach took into account the energy savings and
maintenance costs during the life of the project. The audit report provided financial

MTCC –Africa Pilot Project 1: Uptake of Port Energy Efficient Technologies and Operations
- 3 -
justification for the key energy conservation measures which enabled the executing
departments to seek budgetary allocations for their implementation.
The sources of energy at Kenya Ports Authority Ltd, were identified as electricity and
automotive diesel. The Company then owned fifteen (15) transformers and twenty-two (22)
standby power generators.
During the energy Audit (October to December 2014) electricity was supplied to the facility
by KPLC at 11 KV at tariff CI2 and distributed through fifteen (15) transformers. However,
during the presentation of the draft energy audit report on 14th January, 2015, the
organization had completed the installation and commissioning of a 132KV substation under
the new tariff CI5.
At the time of audit, the port had already implemented the following energy saving measures-
:
a) The Company had replaced some of the 4ft long x 36 w T8 fluorescent tubes with T5
4ft long x 28w especially at Bandari College
b) Timer switches and photocell had been installed to control the switching on and off of
Monopole/tower lights and security lights
c) Aircosavers have been installed in some of the air conditioners on a pilot basis
d) Compact Fluorescent lamps had been installed in the corridors and security lights of
Bandari College
e) The organization has completed the installation of a 132KV substation thus enabling
tariff migration from CI2 to CI5.
In achieving their tasks, EMS Consultant limited used the below audit procedure
methodology
1. A desk review of the energy and service levels at Kenya Ports Authority
2. Energy management 3-day training for key staff
3. One-hour sessions of Energy management awareness for various departments
4. A physical survey of the facilities to develop an appreciation of the scope of work,
understand the key energy consumers and to help in planning for measurements.
5. Measurements of the energy parameters using various instruments
6. Interviews with various staff regarding modes of operation
7. Taking photos of areas with potential for energy saving
8. Technical and financial analyses to determine opportunities for energy efficiency and
9. Compiling of the energy audit report.

MTCC –Africa Pilot Project 1: Uptake of Port Energy Efficient Technologies and Operations
- 4 -
The audit involved carrying out measurements in various parts of the building and
installations. The instruments used include:
• Power loggers
• Power quality analyzers
• Tong Testers
• Light Meters
• Vane Anemometers
• Dry and Wet bulb Thermometers
• Humidity and Temperature meters and
• Infra-red thermometers
2.3 ENERGY COST REDUCTION OPPORTUNITIES AT KENYA PORTS
AUTHORITY
The consultant (EMS) identified the following as energy saving opportunities within the port
precincts.
2. 3.1 POWER FACTOR CORRECTION
2.3.1.1 EMS Findings
The power factor was noted to be low at 0.62, 0.76 and 0.60 for substation Q, T and A
respectively prior to the audit. The Kenya power company supplies total power to the port via
the main substations at Kipevu and Shimanzi where metering is done. The total power
demand (KVA) will be less with higher power-factor at downstream substations due to
reduced overall reactive power. If total power is less, the I²R losses in the intermediate
conductors will also be less thus enhancing the life of the conductors.
2.3.1.2 Recommendations
EMS recommended Installation of capacitor banks to correct the power factor to 0.98 in all
substations. Power factor correction is same as power factor improvement from any value to
another value closer to unity. The Power factor for these substations have since been
improved to above 0.98.

MTCC –Africa Pilot Project 1: Uptake of Port Energy Efficient Technologies and Operations
- 5 -
2. 3.2 CHILLER AND AC IMPROVEMENTS:
2.3.2.1 EMS Findings
• The condenser fins (heat exchange surfaces) on the old chillers were found clogged
mainly due to dust generated during offloading of dusty materials from the ships
including clinker, coal and cement
• The volume damper for makeup air for Theatre air conditioning is not graduated.
• The coefficient of performance of the old chillers is poor at an average of 1.7
compared to a new chiller with an average of 3.3.
• The old chillers use R22 refrigerant (not environmentally friendly) whereas the new
ones use R410A which is environmentally friendly
The coefficient of performance (COP) of the chiller is the ratio of cooling effect (kw) divided
by the electrical power input (kw).
2.3.2.2 Description of energy conservation measure:
To improve COP, the following measures were proposed-:
a) Establish a policy to procure window and split air conditioners that meet the
minimum energy performance standards in Kenya.
b) Install Aircosavers on the air conditioning units detailed
c) improve compressor efficiency by overhauling (replacement of worn out parts)
d) Replace the air-cooled condensers as cleaning alone will not achieve the rated heat
transfer efficiency
e) Install occupancy sensors in areas served by the chillers including the training and
meeting rooms
f) Descaling of the evaporators to improve heat transfer efficiency
However, the expenses associated with the above may be enormous and replacement with
new chillers which use environmentally friendly refrigerants is the preferred option.
2.3.3 USE OF AIR CURTAINS
2.3.3.1 EMS Findings
• The door to the Bandari college main kitchen cold room is frequently opened when
storing or removing goods. The doorway is fitted with plastic strips (curtains) to
minimize air infiltration when the door is opened.
• The main door to the library is frequently opened when users go in and out. The door
is fitted with a door closer to minimize air infiltration

MTCC –Africa Pilot Project 1: Uptake of Port Energy Efficient Technologies and Operations
- 6 -
2.3.3.2 Recommendations
• Install an air curtain and interlock with the cold room door so that air curtain runs
only when the door is open.
• Install an air curtain and interlock with the Library main door so that the air
curtain runs only when the door is open.
2.3.4 LIGHTING IMPROVEMENTS
2.3.4.1 EMS Findings
Several areas of the port do not have skylights and thus do not allow the facility to take full
advantage of natural lighting. This leads to use of artificial lights in several places especially
workshops (Mobile, Motor Vehicle and Electrical workshops) during the day. Different types
of lamps are in use at Kenya Ports Authority including the following:
• 5ft long T8 twin fluorescent lamps (58W)
• 4ft long T8 twin Fluorescent Lamps (36W)
• 2 ft long T8 twin fluorescent lamps (18W)
• 50w Downlighters
• 11w Compact Fluorescent lamps
2.3.4.2 Recommendations on Lighting Improvements
• Install LED lamps as a replacement of all the existing less efficient lamps
• Replace electromagnetic ballasts with electronic type.
• Replace basic T8 fluorescent tubes with standard OSRAM T5 tubes
• Use of skylights to facilitate use of natural lights during the day
• Replace the old skylights in the plant
• Install skylights on the roof of workshops (Mobile, Electrical and Motor vehicle
workshops).
2.3.5 USE OF OCCUPANCY SENSORS
2.3.5.1 EMS Findings
There are no electrical/ electronic interlocks between doors and the air conditioning
equipment and lights in the hostel rooms and conference rooms resulting in situations where
lights remain on when rooms are not occupied and air conditioning equipment sometime runs
with windows open leading to energy losses.

MTCC –Africa Pilot Project 1: Uptake of Port Energy Efficient Technologies and Operations
- 7 -
2.3.5.2 Description of Energy Conservation Measure:
• Install magnetic switches on doors and windows in both hostel rooms and conference
rooms and interlock with air conditioners to ensure they don’t run with windows or
doors open.
• Install occupancy sensors (dual type) in training and conference rooms and interlock
with lights and air conditioners to ensure no air conditioning and lighting without
room occupancy.
• Fit foam inserts in the gaps between window type AC units and the walling and seal
using timber to minimize infiltration.
• Seal all openings at high level in the common office for senior electrical engineers to
minimize infiltration and thus air conditioning load.
• Adjust AC temperature setting for the common office to a minimum of 20°C
2.3.5.3 Alternatives to Occupancy Sensors
Occupancy sensors are used in place of establishing the occupants’ behavior to shut off
lights upon exiting a room. For applications where the installation of occupancy sensors is
cost prohibitive, the following options were proposed:
• raise awareness for building occupants with light switch stickers and educational
materials,
• require custodial and security personnel to turn lights off and consider controlling
lights with timers or through existing energy management systems.
2.3.6 USE OF SOLAR WATER HEATERS FOR BANDARI COLLEGE HOSTEL &
KITCHEN
2.3.6.1 EMS Findings
• Bandari college kitchen uses LPG for water heating
• Bandari college hostel showers are equipped with 69 No. of instant hot water heaters each
with a rating of 2kw.
2.3.6.2 Description of energy conservation measure:
• Install solar water heaters to supply hot water to Bandari kitchen.
• Install solar water heaters to supply hot water to Bandari hostels:
MTCC –Africa Pilot Project 1: Uptake of Port Energy Efficient Technologies and Operations
- 8 -
2.3.7 LIFT CONTROLS UPGRADE
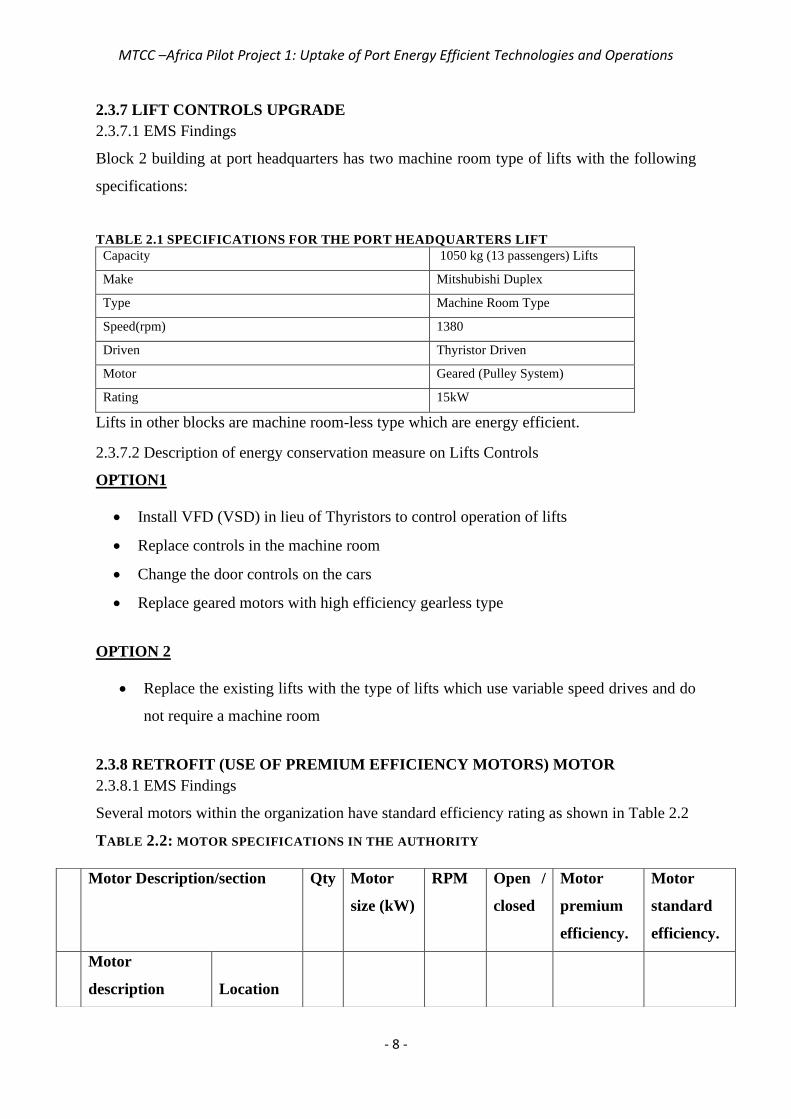
2.3.7.1 EMS Findings
Block 2 building at port headquarters has two machine room type of lifts with the following
specifications:
TABLE 2.1 SPECIFICATIONS FOR THE PORT HEADQUARTERS LIFT
Capacity 1050 kg (13 passengers) Lifts
Make Mitshubishi Duplex
Type Machine Room Type
Speed(rpm) 1380
Driven Thyristor Driven
Motor Geared (Pulley System)
Rating 15kW
Lifts in other blocks are machine room-less type which are energy efficient.
2.3.7.2 Description of energy conservation measure on Lifts Controls
OPTION1
• Install VFD (VSD) in lieu of Thyristors to control operation of lifts
• Replace controls in the machine room
• Change the door controls on the cars
• Replace geared motors with high efficiency gearless type
OPTION 2
• Replace the existing lifts with the type of lifts which use variable speed drives and do
not require a machine room
2.3.8 RETROFIT (USE OF PREMIUM EFFICIENCY MOTORS) MOTOR
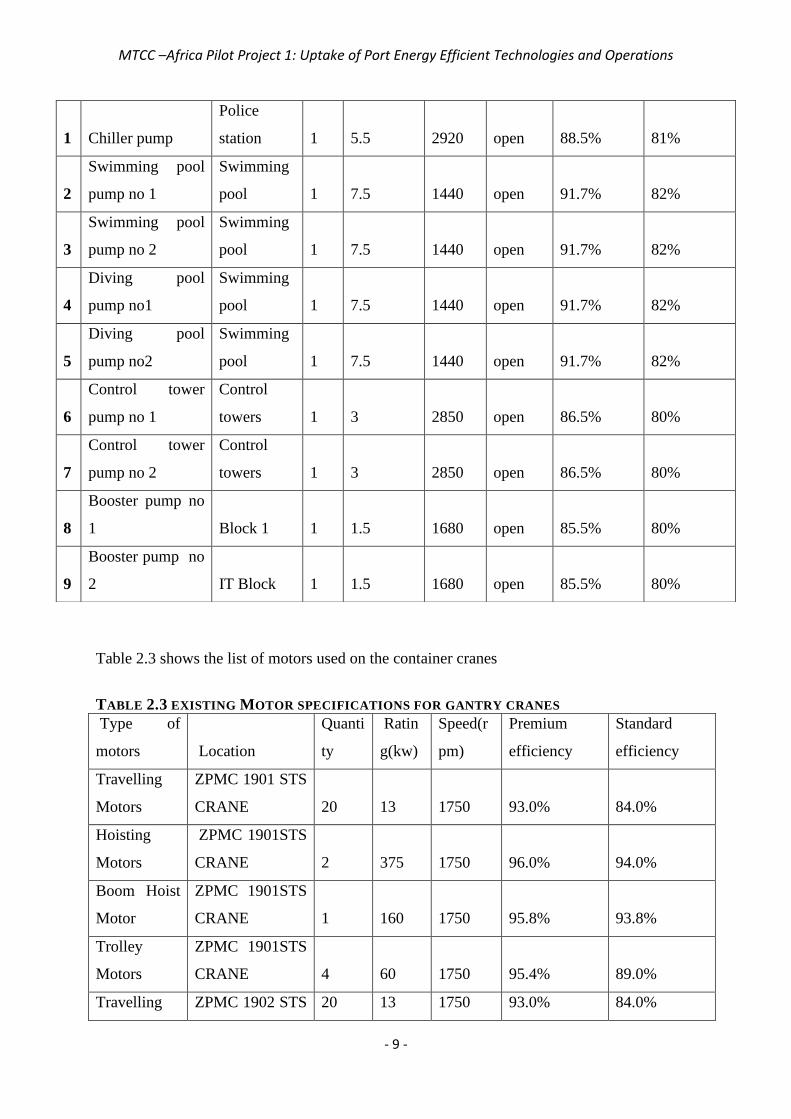
2.3.8.1 EMS Findings
Several motors within the organization have standard efficiency rating as shown in Table 2.2
TABLE 2.2: MOTOR SPECIFICATIONS IN THE AUTHORITY
Motor Description/section
Qty Motor
size (kW)
RPM Open /
closed
Motor
premium
efficiency.
Motor
standard
efficiency.
Motor
description Location
MTCC –Africa Pilot Project 1: Uptake of Port Energy Efficient Technologies and Operations
- 9 -
Table 2.3 shows the list of motors used on the container cranes
TABLE 2.3 EXISTING MOTOR SPECIFICATIONS FOR GANTRY CRANES
Type of
motors Location
Quanti
ty
Ratin
g(kw)
Speed(r
pm)
Premium
efficiency
Standard
efficiency
Travelling
Motors
ZPMC 1901 STS
CRANE 20 13 1750 93.0% 84.0%
Hoisting
Motors
ZPMC 1901STS
CRANE 2 375 1750 96.0% 94.0%
Boom Hoist
Motor
ZPMC 1901STS
CRANE 1 160 1750 95.8% 93.8%
Trolley
Motors
ZPMC 1901STS
CRANE 4 60 1750 95.4% 89.0%
Travelling ZPMC 1902 STS 20 13 1750 93.0% 84.0%
1 Chiller pump
Police
station 1 5.5 2920 open 88.5% 81%
2
Swimming pool
pump no 1
Swimming
pool 1 7.5 1440 open 91.7% 82%
3
Swimming pool
pump no 2
Swimming
pool 1 7.5 1440 open 91.7% 82%
4
Diving pool
pump no1
Swimming
pool 1 7.5 1440 open 91.7% 82%
5
Diving pool
pump no2
Swimming
pool 1 7.5 1440 open 91.7% 82%
6
Control tower
pump no 1
Control
towers 1 3 2850 open 86.5%
80%
7
Control tower
pump no 2
Control
towers 1 3 2850 open 86.5% 80%
8
Booster pump no
1 Block 1 1 1.5 1680 open 85.5% 80%
9
Booster pump no
2 IT Block 1 1.5 1680 open 85.5% 80%

MTCC –Africa Pilot Project 1: Uptake of Port Energy Efficient Technologies and Operations
- 10 -
Motors CRANE
Hoisting
Motors
ZPMC 1902STS
CRANE 2 375 1750 96.0% 94.0%
Trolleys
Motors
ZPMC 1902 STS
CRANE 4 60 1750 95.4% 89.0%
Travelling
Motors
OLD ZPMC
STS CRANE 20 17.5 1750 93.6% 84.0%
Hoisting
Motors
OLD ZPMC STS
CRANE 2 400 1750 96.0% 94.0%
Hoisting
Motors
RTG OLD
KALMAR STS
CRANE 2 200 1486 0.917 0.82
2.3.8.2 Description of energy conservation measure on Motor Efficiency
• Establish a procurement policy to replace standard efficiency with premium efficiency
motors.
• Replace the standard efficiency motors with the premium efficiency type as detailed in t
he tables
Note: Depending on availability of funds, the motors which are rated above 100kw (Capital i
ntensive) may be replaced at the end of useful life.
2.3.9 ENERGY MANAGEMENT SYSTEM
2.3.9.1 EMS findings on Energy Management System
The Kenya ports Authority is supplied with electricity through two KPLC energy meters
which are located at Shimanzi and Kipevu substations. However, the energy consumption
data can only be obtained from KPLC electricity bills or by taking readings from the energy
meters. The trends of consumption can be worked out by using a Microsoft excel sheet. The
energy data is combined for all the port departments and utilities and it is not possible to
determine the actual consumption by each department or utility from the KPLC energy
meters or the electricity bills.

MTCC –Africa Pilot Project 1: Uptake of Port Energy Efficient Technologies and Operations
- 11 -
2.3.9.2 Description of Energy Conservation Measure on Energy Management
• Install smart meters and energy management software to monitor energy consumption by
the following units on real time basis: substations, workshops, office blocks, bandari
college, chillers, server rooms, electrically driven cranes and the ‘reefer’ containers power
supply system. The recommended system is "AMPLEX SMARTHARBOUR"
• The key benefit of the proposed energy management system is to facilitate timely
response for corrective action to promote energy efficiency.
2.3.10 SOLAR POWER GENERATION OPTION:
2.3.10.1 EMS Findings
The Kenya Ports Authority has two sources of electrical power viz. the national Grid (Kenya
power and Lighting Company) and diesel generators in the event of failure of grid power.
It is advisable to make use of a renewable energy source as a supplement to the other two
sources. This will reduce greenhouse gas emissions and contribute to mitigation of climate
change
2.3.10.2 Description of Energy Conservation Measure on Solar Power
Install a 500kw solar power system (Renewable energy source) to supplement the supply
from the Grid and diesel power generators. The proposal is to replace the Asbestos roofs for
the port Electrical and Mechanical Engineering workshops with solar panels that will serve as
both roof covering and electricity sources. The power generated will be fed into one of the
substations and made available to several facilities including mechanical workshop, electrical
workshop, civil Engineering workshop, dockyard and terminal Engineering workshops
subject to a maximum power demand of 500kw. In case the load exceeds the capacity of the
solar plant, part of the load will be shed and then supplied from the national Grid through an
automatic change-over arrangement. However, a similar solar power plant can be installed at
the Civil Engineering, Dockyard and terminal Engineering workshops.
2.3.11 ENERGY SAVINGS ON COMPUTERS
2.3.11.1 EMS Findings
• The company has LCD Computer monitors.
• Some computers are left on 24 hours a day even though they are not used during the
night.

MTCC –Africa Pilot Project 1: Uptake of Port Energy Efficient Technologies and Operations
- 12 -
2.3.11.2 Description of Energy Conservation Measure on Computers
• Conduct staff training to promote operation in energy saving mode and Switching off
computers and other office equipment when not in use
• Establish a procurement policy to replace LCD Monitors with LED type or more
efficient models
Table 2.4 shows the comparison between LCD monitors and LED Monitors and their associat
ed characteristics
TABLE 2.4 COMPARISON BETWEEN LCD MONITORS AND LED MONITORS
Parameter
LCD Monitor LED Monitor
Slim design
Factor
Bulky, the back size is
proportionate to the size of the
monitor
LED backlighting allows for a slim,
sleek design. LED monitors are much
thinner and lighter than LCDs monitors
because LED do not use fluorescent
bulbs. This slimness brings along a host
of advantages such as space saving and
portability.
Viewable
screen
The viewable area is always about
0.9 - 1.1 inch smaller than the size
specified on paper. This is due to
the frame around the glass screen.
A 15-inch LED always has a same size
of viewable area as the specifications
say.
Larger displays may have their
viewable area reduced by at most 0.1
inches.
Screen
Flatness
Many manufacturers tout true
flatness for their LCD monitors,
but the sad truth is that most are
fake.
100% ninety degrees true perfect flat
screen
Power
Requirements
Higher power usage, more than
30-50% to an LED of equivalent
size.
Considerably lower power usage.
Display Slightly less sharp images - but it LED monitors have impressive contrast

MTCC –Africa Pilot Project 1: Uptake of Port Energy Efficient Technologies and Operations
- 13 -
Sharpness is noticeable when comparing
with LEDs
ratios that deliver a brighter picture and
Sharp images.
2.3.12 ENERGY EFFICIENCY IN USE OF CONTAINER CRANES
2.3.12.1 EMS Findings
• The company has several container cranes which use diesel generated electricity
• The Company also has container handling cranes powered electrically at 3.3kv (STS &
RMG) and mobile Harbor cranes powered at 415 volts.
• RTG& RMG cranes have standard efficiency motors i.e. Travelling motors and
hoisting motors as detailed in Table 2.5
TABLE 2.5 STANDARD AND HIGH EFFICIENCY MOTORS SPECIFICATIONS
Type of
motors
Location Quantity Rating(k
w)
Speed(rpm
)
Premium
efficiency
Standard
efficiency
Travelling
Motors
ZPMC 1901 STS
CRANE 20 13 1750 93.0% 84.0%
Hoisting Motors
ZPMC 1901STS
CRANE 2 375 1750 96.0% 94.0%
Boom Hoist
Motor
ZPMC 1901STS
CRANE 1 160 1750 95.8% 93.8%
Trolley Motors
ZPMC 1901STS
CRANE 4 60 1750 95.4% 89.0%
Travelling
Motors
ZPMC 1902 STS
CRANE 20 13 1750 93.0% 84.0%
Hoisting Motors
ZPMC 1902STS
CRANE 2 375 1750 96.0% 94.0%
Trolleys Motors
ZPMC 1902 STS
CRANE 4 60 1750 95.4% 89.0%
Travelling
Motors
OLD ZPMC STS
CRANE 20 17.5 1750 93.6% 84.0%
Hoisting Motors
OLD ZPMC STS
CRANE 2 400 1750 96.0% 94.0%
Hoisting Motors
RTG OLD
KALMAR STS
CRANE 2 200 1486 0.917 0.82

MTCC –Africa Pilot Project 1: Uptake of Port Energy Efficient Technologies and Operations
- 14 -
2.3.12.2 Description of Energy Conservation Measure on Cranes
• Install premium efficiency motors to replace the existing standard efficiency motors
(Note; -Motor retrofit for cranes should be done only upon consultation with the manuf
acturers)
• Install the RIS-GA system to monitor and control the running of diesel generators in RT
G &MHC cranes
2.3.12.3 The Justification for the Use of RIS-GA System on RTG and MHC
With the increase in fuel prices, maximizing fuel efficiency is more important than ever.
Control Techniques offers an innovative solution to reduce consumption.RIS.GA.is a
compact low-cost fuel saving system that can be easily installed on new or existing RTG and
MHC diesel electric cranes. It reduces the speed of the diesel generator during the crane’s
stand-by mode and typically reduces total fuel consumption by 20%.
Diesel generators on-board RTG crane usually run at a constant speed to supply the drive
system and auxiliaries regardless of whether the crane is in operation or in stand-by mode.
This means that during stand-by the system is highly inefficient as it consumes excessive fuel
while producing minimal power. RIS.GA. manages the diesel generator allowing its speed to
be reduced during stand-by, while still supplying power for auxiliary equipment.
2.3.13 GENERAL AREAS OF IMPROVEMENT:
• Switch off unnecessary lighting
• Introduce occupancy sensors in washrooms to control lights
• In future replace washroom sanitary ware with dual flush (6litre/9litre) toilets,
infrared operated urinals and wash hand basins.
2.4 SUMMARY OF VIABLE PROJECTS AS PER ENERGY AUDIT 2015 REPORT
From the above analysis, the first-grade energy audit came up with the projects detailed in
Table 2.6 as viable and implementable projects for the Port of Mombasa. The Potential
savings in Tonnes of CO2, estimated investment costs, the simple payback period and
potential energy savings of the projects are all tabulated in the same table.

MTCC –Africa Pilot Project 1: Uptake of Port Energy Efficient Technologies and Operations
- 15 -
TABLE 2.6 VIABLE AND IMPLEMENTABLE PROJECTS FOR THE PORT OF MOMBASA
No. Opportunity Potential
Savings
kwh p.a
(electrical)/
kg p.a
(Thermal)
Potential
Savings GJ.
p.a
Potential
Savings
metric
tonnes
CO2.
p.a
Potential
Savings
Kshs p.a
Estimated
Investment
Cost
(Kshs)
Simple
Payback
Period(yrs)
Simple
Payback
Period
(Months)
1 power factor
correction
0.0
653,883
800,000
1.2 14.7
2 Chiller
improvement
347,982
1253 226.7
5,855,940
16,000,000
2.7 32.8
3 Use of Aircosaver
in Air
conditioning
176,470
635 115.0
2,969,693
1,584,000
0.5 6.4
4
Use of Curtains
7,068
25 4.6
118,943
200,000
1.7 20.2
5 Use of LED
lamps
376,382
1355 245.2
6,333,868
18,449,933
2.9 35.0
6
Motor Retrofit
495,343
1783 322.7
8,335,785
21,421,162
2.6 30.8
7 Use of
Occupancy
sensors
301,724
1086
5,078,020
4,500,000
0.9 10.6
8 Use of solar water
heaters
25,658
92 16.7
431,773
1,285,000
3.0 35.7
9 Lift controls
upgrade
28,120
101
473,205
1,000,000
2.1 25.4
10 Energy
management
systems.
0.0
931
6,404,298
17,544,462
2.7 32.9
11 Energy savings
on Computers
34,398
124
578,860
300,000
0.5 6.2
TOTAL
1,793,145
6,455
1,862
37,234,268
83,084,556
Annual energy
bill
320,214,912
% potential
savings 12
Average
payback period
(years)
2.2
Grid emission factor for Kenya (kg of CO2/ mwh) 0.6515
1 TJ = 1000 GJ 1 kwh = 3.6MJ 3.6
2.5 OTHER ENERGY AUDITS AND EMMISSION REDUCTION STUDIES
CONDUCTED IN THE PORT OF MOMBASA AND THEIR RECOMMENDATIONS

MTCC –Africa Pilot Project 1: Uptake of Port Energy Efficient Technologies and Operations
- 16 -
2.5.1 ANALYTICAL ASSESSMENT OF PORT ENERGY EFFICIENCY AND
MANAGEMENT: A CASE STUDY OF THE KENYA PORTS AUTHORITY
This dissertation study was carried out by a World Maritime student Ms. Mariam Kidere in
Partial Fulfilment of the Requirements for the Award of a Master’s Degree in Maritime
Energy Management in the year 2017. In her study, Kidere (2017) zoned the port depending
on functional areas and analyzed these areas in terms of their energy consumption. The areas
considered were KPA Headquarters, Marine operations and Engineering; Terminal I and
Terminal II operations and engineering; Convectional Cargo terminal; Port Integrated
Security Systems; Oil Terminals; Yard Lightings and the Old Port office.
The study found out that Terminal I (Operations & Engineering) has the highest installed
capacity of generators at 2283KVA, and the highest fuel consumption at 448 litters / hour
during outages. Through this data, it was concluded that the table could be useful in enabling
the Port to focus its attention on areas with high fuel consumption- especially when
considering alternative fuels or low Sulphur fuels for the generators.
2.5.1.1 Gap analysis of Mombasa Port.
The study carried out an analysis of the Ports status quo on various aspects such as the ports
operations, applied technologies, governing policies and international standardizations all
geared towards improved energy efficiency and improved productivity. Table 2.7 gives the
summary of the Gap analysis in Mombasa Port as per the study.
The study concluded that in addition to the energy efficiency and emissions reduction
measures currently in place, and the identified areas for potential improvement, there are
additional measures that can be implemented alongside. These include setting ambitious
energy use reduction targets, systematic monitoring and analysis of energy use at the port,
energy audits, identifying areas of high energy consumption and waste and taking reduction
measures, identification and implementation of energy-saving measures that are techno-
economically feasible, application of energy efficiency indicators and calculation of carbon
footprint, capacity building related to knowledge of the various options for energy
procurement as well as creation and implementation of a good energy procurement strategy.
TABLE 2.7 SUMMARY OF GAP ANALYSIS IN MOMBASA PORT

MTCC –Africa Pilot Project 1: Uptake of Port Energy Efficient Technologies and Operations
- 17 -
CATEGORY ASPECT STATUS QUO POSSIBILITIES
Policy
ISO 14001:2015-
Environmental
Management System
(EMS)
Process of
implementation
If implemented it will
lead to clean air
quality, reduction in
GHG emissions,
reduce health risks from
toxic
pollutions and improve
port efficiency.
Its certification will lead
to make the
port to be the Green Eco
Ports
ISO 18001:2015
Occupational Health &
Safety Management
System (OHSAS)
Process of
implementation
This standard will lead to
proper
working conditions
improvement,
reduction in near miss
incidents,
number of accidents,
GHG emissions,
operating cost,
breakdowns and
general safety
improvement.
Port Energy Policy Attained 2011 Gives overall directions
on energy
efficiency and
management
“Green Eco Port
Policy”
Process started in
2015
Once attained will enable
the port to
minimize environmental
impact whilst
addressing energy
efficiency.
ISO 26000-Corporate
Social Responsibility
(CSR)
Attained in 2010 Building up
responsibility /sensitivity
to the environmental
effects on ports
activities

MTCC –Africa Pilot Project 1: Uptake of Port Energy Efficient Technologies and Operations
- 18 -
ISO 50001- Energy
Management
System(EMS)
Not yet
implemented
If implemented it can
lead to
realization of benefits
such as Energy
Cost Reduction, Energy
Efficiency,
Energy Management and
GHG
emission Reduction
Prioritization of
projects policy
No policy to
prioritize
accomplishment
of
important project
Adoption of this policy
will assist the
Port in decision making
process and
give priority to most
urgent and
necessary projects.
Star Rating Policy Not yet
implemented
Adoption of a formal
policy on Star
Rating Criteria when
procuring of new
equipment will enable
port to select
high quality, standard
and modern
equipment.
Operatio
nal
Monitoring,
Verification & Review
(MVR)
No Data
Verification &
Reviewing
Supervisory Control And
Data
Acquisition System
(SCADA) will
lead to availability of
energy
consumption trends data,
tracking of
power fluctuations,
monitoring of
most power consumer
areas/ sections
reviewing of energy
consumptions and
reduce cost of power by
eliminating
unrealistic power billing.
Emission Control
measures on Vehicles
operating within the
Port
No Control
measures in
place
Deliberate Policy to bar
High emitting
Vehicles from Accessing
the Port.
Just-In Time Port
arrivals
Vessels give 14-
days
14-days’ notice can be
extended,

MTCC –Africa Pilot Project 1: Uptake of Port Energy Efficient Technologies and Operations
- 19 -
Pre-Arrivals
notice. A
large number of
anchorage where
vessels wait up to
several days for
berth
availability
besides that a one stop
vessel handling
window can be
implemented
Tech
nolo
gies
Renewable Energy
Technology –Solar PV
Installation in
progress
It will increase Power
reliability and
sustainability, reduce
GHG emissions
Alternative Fuels –
Low Sulphur Fuels
No restrictions on
fuel
quality
If implemented can lead
to reduction
of SOx emission in the
port.
Automated Mooring-
Tug boats & Pilot boats
Manual mooring If implemented it will cut
down
emissions, reduce
mooring time,
reduce accidents
Electrification of cargo
handling equipment
Mostly diesel
Powered
Equipment.
Electrification of cargo
handling
equipment will lead to
increase turnover,
reduce turnaround time,
reduce
emissions, and reduce
energy
consumption, Increase
port efficiency
and breakdowns.
Institu
tional
Sensitization on
importance of Energy
Efficiency &
Management Measures
Attained through
Sensitization
program
conducted in
2015
More staffs and port
users are aware of
the Ports Energy
efficiency and
management programs
and measures.
This will make the Port
staffs/ port
users more responsible
while at work
and reduces energy
wastage
Training on energy
Efficiency and
Management
Technologies
Attained and still
going
on (the author is
an
example of staffs
More energy managers
experts will
lead to a n energy
efficiency working
environment, port will

MTCC –Africa Pilot Project 1: Uptake of Port Energy Efficient Technologies and Operations
- 20 -
on
training on
Energy
Efficiency &
Management at
WMU)
have energy
professionals who can
manage modern
technologies in energy,
new energy
projects and save the
ports large sum
of cash in improving
port’s efficiency.
Source: Kidere (2017)
2.5.2 THE GREEN PORT POLICY
The Port engaged the services of The Cornell Group, Inc., USA in 2014 to develop a green
port policy and its implementation plan. This was funded by Trade Mark East Africa as an
initiative to make the port operations sustainable.
The consultant had the following as the scope of works-:
Conduct a Situation Analysis, including KPA’s current port operations impacts on
environmental degradation, identify current best practices, evaluate KPA’s green port
practices and how KPA may comply with international best practices;
Develop monitoring methods and baselines, including inventory of direct and indirect
Greenhouse Gas Emissions (GHG) baseline and forecast, establish Key Performance
Indicators (KPIs) and determine KPA’s capacity to implement international conventions;
Develop a comprehensive Green Port Policy and Implementation Plan for the Port of
Mombasa.
The key output presented in their report was an actionable Green Port Policy and
Implementation Plan for the Port of Mombasa that is consistent with a “triple bottom line”
approach, and which focuses on the economic, environmental, and social value of an
investment, including investments in improving the environment.
The following conclusions and recommendations were made from the green port policy
report-:
There are immediate and urgent environmental pollution problems caused by port operations
at Mombasa that can and must be immediately addressed to minimize and limit the harm
caused to the health of port workers and the surrounding community; Environmental
pollution at other KPA ports and facilities is not significant in comparison with Mombasa.
In comparison with major world-class ports, Mombasa Port produces high concentrations of
Green House Gas, caused primarily by ships using heavier fuel and running their generators
MTCC –Africa Pilot Project 1: Uptake of Port Energy Efficient Technologies and Operations
- 21 -
while in port, and the Port’s inability or unwillingness to restrict access by older, polluting
vehicles to the port premises.
There is a noticeable degradation of the bio-diversity systems caused by port operations,
which if not reversed will cause significant economic and environmental harm to the natural
resources around the port.
KPA has the ability, for a period of over 10 years, to match the emissions reduction targets of
world-class ports by investment in “cold ironing” systems for ships at port and restricting
truck entry to non-polluting trucks. The new rail system planned for the port will also limit
truck traffic and reduce emissions.
Although a signatory to all the key international environmental conventions and local laws
and regulations, KPA does not have the organizational capability at this time to apply and
conform to international conventions and regulations for environmental protection, nor does
it have an Environmental Audit or Environmental Management System in place
The report proposed and recommended a number of practical and implementable GHG
reduction strategies focusing on (a) reduction of electricity and fuel consumption primarily by
vessels, trucks and port equipment, (b) implementation of an equipment replacement policy
with electric-powered or “clean fuel” equipment, (c) planting trees and (d) complying with
ISO 14001 certification. In addition, the report required the port to implement a regular
Environmental Audit System and install an Environmental Management System to track,
monitor and control environmental pollution. Stakeholders are fully interested in
implementing a Green Port Policy at Mombasa Port, and have prioritized actions that the Port
must take to “green” the port: These Greening Projects are as given in Figure 4.4.
Both Stakeholders and KPA Management are broadly in agreement about the prioritization of
Green Port Policy strategies and objectives of the port:
KPA Green Port Objectives - Prioritized:
• Put People First
• Invest in New Technology
• Co-opt Stakeholders
• Phase in & share in econ sustainable changes
• Green Port Leadership
• Maintain Stewardship of planet

MTCC –Africa Pilot Project 1: Uptake of Port Energy Efficient Technologies and Operations
- 22 -
Energy efficiency measures
The following are energy improvement measures contained in the report. The measures focus
mainly on the reduction of Greenhouse gas emission
1. Provision of shore power to ships at berth
2. Electricity from renewable energy
3. Cargo handling equipment switched to electricity
4. Switching of freight transport from road to rail
FIGURE 2.1 PRIORITISED GREENING PROJECTS IN THE PORT
Source: The Cornell Group (2014)
2.5.3 CONSULTANCY SERVICES FOR THE PROPOSED STUDY OF ENERGY
NEEDS, ALTERNATIVE ENERGY SOURCES AND PROVISION OF SHORE POWER
(COLD IRONING) FOR THE PORT OF MOMBASA
As part of implementation of the Green Port Policy, KPA with a grant from Trade Mark East
Africa (TMEA) appointed Royal HaskoningDHV (RHDHV), in association with Howard
Humphreys to do a feasibility study on energy needs, alternative energy sources and
provision of shore power (cold ironing) for the port of Mombasa.

MTCC –Africa Pilot Project 1: Uptake of Port Energy Efficient Technologies and Operations
- 23 -
This feasibility study report made an in-depth analysis of current energy situation and
investigated the environmental and social impact of prevailing energy situation as part of
Phase I deliverables.
The study was executed by RHDHV and Howard Humphreys in the period from July 2016 to
February 2017.
The study was divided into two main phases namely phase I and phase II.
Phase I comprises the following scope:
a) Conduct detailed assessment of the port’s energy needs taking into account existing and
planned port development programmes in line with the port master plan.
b) Analyse alternative energy sources for the port including a detailed feasibility study on the
alternative sources with emphasis on renewable energy for the port.
c) Conduct a detailed analysis for the provision of shore power (cold ironing) taking into
consideration the different vessel categories calling at the port of Mombasa.
Phase II which essentially encompasses the design and implementation planning comprises
the following scope:
a) Prepare the scope of works and detailed technical specifications of the recommended
system/s to improve the existing power supply quality; come up with detailed designs and
bills of quantities and prepare tender documents.
b) Prepare the scope of works and detailed technical specifications of the recommended
alternative energy sources for the port; come up with detailed designs and bills of quantities
and prepare tender document/s for the recommended alternative energy sources.
c) Prepare the scope of works and detailed technical specifications for cold ironing; come up
with detailed designs and Bills of Quantities and prepare tender documents for the proposed
cold ironing system.
2.5.3 1 RHDHV Study Findings
The results of the study show that:
• The internal electrical power distribution system is generally in good condition and
has sufficient capacity also for the expected growth in the near future; The Power
quality is however poor, which is caused by external circumstances;
• If improvement of power quality by the public grid operator is not possible POM can
take their own measures. Three options were available, and a choice needs to be made

MTCC –Africa Pilot Project 1: Uptake of Port Energy Efficient Technologies and Operations
- 24 -
in close coordination with POM as each measure has its specific benefits and
drawbacks;
• Solar power generation potential within the POM is high, even more than the actual
consumption of electricity. Large scale solar power application requires additional
measures such as feedback into the grid at acceptable commercial conditions, large
scale energy storage and/or automatic balancing of power generation and
consumption. Other methods of renewable power generation are not feasible within
the POM.
• Reduction of diesel fuel consumption can best be achieved by electrification of
RTG’s. Other methods need further investigation before a conclusion on feasibility
can be drawn;
• Cold ironing is currently not economically feasible due to the high cost price of power
from the public grid, the high initial investment and the limited number of shore
power ready ships. In combination with large scale solar, shore power can become
more feasible. Cold ironing should therefore not be considered as highest priority. In
future, with solar power available and more ships prepared to connect, it will become
an effective measure to improve the environmental performance of POM.
2.5.4 MONETARY AND ECOLOGICAL COST-BENEFIT ANALYSIS OF
ONSHORE POWER SUPPLY; A CASE STUDY OF THE PORT OF MOMBASA
This dissertation study was carried out in 2013 by Mr. D. Mulwa as part of his study work for
the attainment of a Master’s Degree in Shipping and Port and management. The report is a
quantitative analysis of the Consumption levels of all the vessels that visited the Port of
Mombasa in the year 2012. The research draws up the vessels’ profiles of power and other
properties, comes up with a relationship between these properties and hotelling power
demand and then empirically calculates the overall fuel quantity consumed by these vessels
while in port, total cost of these bunkers and the externality costs.
Additionally, an OPS system capable of supplying the total vessel visits with OPS was
designed and quotations for its costs obtained. A likely power bill had the vessels used OPS,
is calculated using the then current prevailing power rates in Kenya. A project appraisal was
then undertaken taking into consideration all the above costs and recommendations based on
the outcome of the appraisal are made to Kenya Ports Authority.
Based on the above, the following recommendations were made to Kenya Ports Authority-:

MTCC –Africa Pilot Project 1: Uptake of Port Energy Efficient Technologies and Operations
- 25 -
Having analysed the vessel power characteristics and cost of implementing an OPS and after
carrying out an appraisal of the project, which was found to be a viable undertaking, the
report recommended to KPA that the authority should consider offering this important service
to the visiting vessels.
The OPS project need not be implemented in one go due to the financial implications
involved. Phasing-out the project in four parts may make the implementation process less
taxing to the port authority in fiscal terms. In its recommendation, the Port Electrical
Department, through the Head of Port Electrical Engineering, should advocate and push for
increase in their budgetary provisions so as to accommodate a phased-in implementation of
OPS. There are currently trenches running along the berths where PVG rails for the power
supply to the conventional slewing gantry cranes used to be. These are found in the Bulk
Carrier berths, near the SOT and the berths near the KPA Headquarters from Berth 11 to
Berth 14. These trenches can be easily converted to house OPS cables by installing PVC
ducts and covering them permanently with concrete to achieve a secure working
environment. By doing so, a large proportion of the OPS trenching costs could be saved.
A very large amount of power, roughly 7GWh, was consumed by visiting tugs, KPA tugs and
other small vessels, especially patrol crafts. Most of these vessels take long times at the berth
side and can be good users of OPS. More than 90% of the average loads of these vessels’ AE
rating are less than 500kW and with an applicable loading factor of 22%, it is very easy to
connect these vessels to OPS, even on LV systems, with relatively small sizes of cables from
a distribution board located near the shore. These vessels should serve as the starting point in
the OPS implementation.
2.6 ANALYSIS OF THE RECOMMENDATIONS OF THE VARIOUS ENERGY
AUDIT REPORTS/STUDIES CARRIED OUT ON THE PORT OF MOMBASA
Several recommendations and conclusions cut across all or most of the studies that have been
carried out at the port of Mombasa. Key among them are as given in Table 2.8 below: -
TABLE 2.8 MATRIX OF PROPOSED EMISSION REDUCTION MEASURES AND
IMPLEMENTATION STATUS INITIATIVE GREEN
PORT
POLICY
ENERGY
AUDIT
REPORT
RHDNV
REPORT
MS. KIDERE
REPORT
MR. D
MULWA
REPORT
IMPLEMENTAT
ION SITUATION
COMMEN
TS
Implement
Shore power
for the Port of
Mombasa
Recommende
d
Recommende
d
Recommende
d with a rider
on prior
Installation of
Solar Power
Recommende
d
Recommende
d based on
Consideration
of Ecological
Costs
Pilot project on
shore power
under execution.
Tender
evaluation
Capital
intensive
and
sensitive
project.

MTCC –Africa Pilot Project 1: Uptake of Port Energy Efficient Technologies and Operations
- 26 -
scheduled for end
of July 2019
Main
project
awaiting
funding
Renewable
Energy
Technology –
Solar PV
Recommende
d
500kw solar
power system
Proposed
Recommende
d 5MWpk
Solar Power
Recommende
d
Recommende
d
Two pilot solar
power plants
already installed
on roof tops with
capacities of
400kWpk and
350KWpk
The
proposed
main plant
of 5MWpk
awaiting
funding
from
Trademark
East Africa
Electrification
of cargo
handling
equipment
Recommende
d
ERTG
Proposed
Recommende
d
Plans in place to
electrify the
Habour Mobile
Cranes through
provision of shore
power
Projects
like
retrofiting
of eRTG
are capital
intensive
and
requires
major
changes on
the
operation
yard that
would mean
stoppage of
operations
hence
difficult to
implement
Install LED
lamps as a
replacement
of all the
existing less
efficient
lamps
Recommende
d
Recommende
d
Recommende
d
Recommende
d
Phased
replacement of
conventional
lighting system
ongoing starting
with offices and
monopoles
Full
implementa
tion is
capital
intensive
hence the
phased
approach
Sensitization
on
importance of
Energy
Efficiency &
Management
Measures
Recommende
d
Recommende
d
Recommende
d
Recommende
d
Recommende
d
Ongoing Attitude
change and
working
patterns
affecting
fast
implementa
tion
Training on
energy
Efficiency
and
Management
Technologies
Recommende
d
Recommende
d
Recommende
d
Ongoing at
different
capacities of the
workforce
Training
budget
among the
key hurdles
Energy
Efficiency in
Use Of
Container
Cranes
RIS.GA.
proposed
Recommende
d
Implementation
yet to start
Issues of
manafuctur
er’s
warranty
and liability
at play
Old trucks
removed from
the road
Recommende
d
Recommende
d
Recommende
d
Recommende
d
Previous attempts
proved not
successful due to
external
interference and
replacement cost
Good will
from all
stakeholder
s required

MTCC –Africa Pilot Project 1: Uptake of Port Energy Efficient Technologies and Operations
- 27 -
considerations
Use of
Premium
Efficiency
Motors
Recommende
d
Recommende
d
Effected
during old motors
replacement
Procuring
policy
favoring
high
efficiency
motors/equi
pment not
yet in place
ISO
14001:2015-
Environment
al
Management
System
(EMS)
Recommende
d
Recommende
d
Kenya Bureau of
Standards to has
started to develop
EMS ISO14001
and ISO 45001
Capacity
barriers
and need
for
awareness/
training
Ships within
port area
burning low
Sulphur fuel
Recommende
d
Recommende
d
recommended Recommende
d
Standards of fuel
for ships being
adopted
Currently
3.5%S
being used
GHG offset
from tree
planting
Recommende
d
Recommende
d
Recommende
d
17,000 Trees
planted in
Mombasa and
neighboring
Counties.
More
budget
being
sought for
increased
forest cover
acreage
Star Rating
Policy
Recommende
d
Recommende
d
Not yet
implemented
Awaiting
favorable
procuremen
t policy
Power Factor
Correction
Recommende
d
Fully
Implemented
Factored in
procuremen
t plans
Energy
Management
System
Recommende
d
AMPLEX
SMARTHAR
BOUR"
Proposed
Recommende
d
Not Yet
Implemented
Not yet
factored in
the
procuremen
t plans
Source: Author
2.7 CONCLUSION ON ANALYSIS OF PREVIOUS AUDITS CARRIED OUT AT
THE POM
Based on the review of the different reports and from the implementation matrix it is quite
clear that the port of Mombasa has implemented a number of the recommendations focusing
on energy efficiency and control of emissions. This is part of the efforts of the port to
implement the framework green Port Policy. However, a lot needs to be done to achieve the
desired objectives and to integrate sustainability into port operations and development.

MTCC –Africa Pilot Project 1: Uptake of Port Energy Efficient Technologies and Operations
- 28 -
Three projects have been implemented based on the recommendations that is; installation of
400kWpk Grid Tie solar Power plant, LED lights, power-factor correction and tree planting
which contributes to a national drive by the government to attain a 10% forest cover by 2022.
Other phases of some of the projects are ongoing. The projects that in the process of
implementations include installation of 350kWpk Grid Tie solar Power plant, development of
ISO 14001 and ISO 45001 and installation of a 2000kVA, 60hz,6.6kV shore power at Berth
No.1.
There are however other flagship projects that the port should have started due to the
importance attached to their outcomes. Key among these are the installation of the Energy
Management system (EMS). This project will be a milestone in analyzing the energy flow to
the different functional areas of the port with the aim of energy saving by controlling and
containing any power wastages that may be found from analysis of the PMS outcomes.
The Port should also be keen on implementing the Star Rating Procurement Policy to ensure
that only high energy saving equipment are procured by the authority. Other projects that
need urgent attention include implementation of policies to ensure that Ships within port area
burn only low Sulphur fuels, Use of Premium Efficiency Motors Old, development of
policies to ensure that old and polluting trucks are removed from Port precincts, Sensitization
on importance of Energy Efficiency & Management Measures and Electrification of cargo
handling equipment.
3.0 IMPACTS OF THE PROPOSED ENERGY SAVING/EMISSION REDUCTION
STRATEGIES AT THE PORT OF MOMBASA.
3.1 BACKGOUND OF STUDY
Further to the report on analysis of all energy audit reports done for the Port of Mombasa;
this report delves to study the impacts of the proposed energy saving/emission reduction
strategies at the Port. In detail, the report would aim at determining which of the proposed
energy saving measures have been implemented at the Port of Mombasa, Estimating the
impacts of the implemented strategies on the energy consumption and emissions at the Port of
Mombasa; Identifying the energy saving measures that are yet to be implemented at the Port
of Mombasa and eventually Identifying the challenges/barriers that have been encountered

MTCC –Africa Pilot Project 1: Uptake of Port Energy Efficient Technologies and Operations
- 29 -
the in implementation of the proposed energy saving measures and then proposing measures
that can be put in place to ensure that more energy savings are realized.
These energy saving measures and their impacts will be drawn from the five reports earlier
analyzed namely the first investment grade energy audit of 2015 by EMS Consultants Ltd;
Analytical Assessment of Port Energy Efficiency and Management: A Case Study of the
Kenya Ports Authority of 2017 by Ms. Kidere; The Green Port Policy done by the Cornell
Group, Inc., USA of 2014; The Consultancy Services For The Proposed Study Of Energy
Needs, Alternative Energy Sources And Provision Of Shore Power (Cold Ironing) For The
Port Of Mombasa by the Royal HaskoningDHV (RHDHV) in association with Howard
Humphreys and finally the study on Monetary and Ecological Cost-Benefit Analysis of
Onshore Power Supply; A Case Study Of The Port Of Mombasa by of 2013 Mr. Denis
Mulwa.
These impacts have been given on monetary terms with the presumed assumptions for each
case well highlighted besides the impacts. These results were arrived at after measurement of
energy parameters using various audit instruments, identification of energy efficiency
opportunities, a financial analysis of the energy conservation (efficiency) measures covering
life cycle cost and internal rate of return (IRR) and taking into account energy savings and
maintenance costs during the entire project life.
3.2 IMPACTS OF THE PROPOSED ENERGY SAVING MEASURES
3.2.1 POWER FACTOR CORRECTION
Following the energy audit conducted by EMS consultants in the month of November 2014,
Power factor correction was implemented in the following substations as detailed below;
Substation Initial Power factor Current Power factor
Q 0.62 0.96
T 0.76 0.94
The period considered for the base line information is from January to September, 2014;
period after which the audit was conducted.
Facility operating hours per annum: 8736(All year round)
MTCC –Africa Pilot Project 1: Uptake of Port Energy Efficient Technologies and Operations
- 30 -
The base year energy use was 2014; the energy consumption is measured in terms of kWh
and average consumption during the base year was 1,582,148 kWh /Month. This translates
averagely to approximately 2MW of consumption every hour.
The Projected energy savings due to power factor correction amount to Kshs. 653,883 per
annum. The estimated cost of investment is Kshs. 570,000with a simple payback period of
0.9 year.
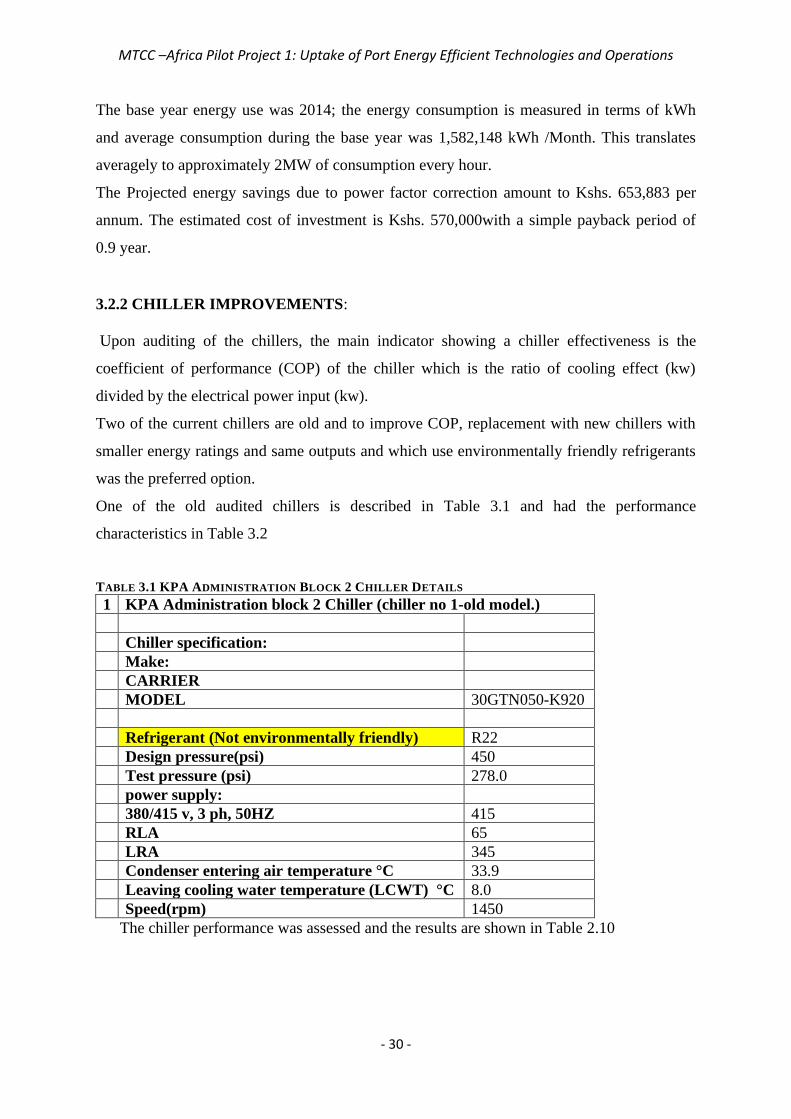
3.2.2 CHILLER IMPROVEMENTS:
Upon auditing of the chillers, the main indicator showing a chiller effectiveness is the
coefficient of performance (COP) of the chiller which is the ratio of cooling effect (kw)
divided by the electrical power input (kw).
Two of the current chillers are old and to improve COP, replacement with new chillers with
smaller energy ratings and same outputs and which use environmentally friendly refrigerants
was the preferred option.
One of the old audited chillers is described in Table 3.1 and had the performance
characteristics in Table 3.2
TABLE 3.1 KPA ADMINISTRATION BLOCK 2 CHILLER DETAILS
1 KPA Administration block 2 Chiller (chiller no 1-old model.)
Chiller specification:
Make:
CARRIER
MODEL 30GTN050-K920
Refrigerant (Not environmentally friendly) R22
Design pressure(psi) 450
Test pressure (psi) 278.0
power supply:
380/415 v, 3 ph, 50HZ 415
RLA 65
LRA 345
Condenser entering air temperature °C 33.9
Leaving cooling water temperature (LCWT) °C 8.0
Speed(rpm) 1450
The chiller performance was assessed and the results are shown in Table 2.10

MTCC –Africa Pilot Project 1: Uptake of Port Energy Efficient Technologies and Operations
- 31 -
TABLE 3.2 ADMINISTRATION BLOCK 2 CHILLER PERFORMANCE CHARACTERISTICS
The performance chart indicates the following:
cooling kw 187.3
input power (kw) 60.8
cooling water flow rate (l/s) 8.1
Corresponding COP 3.08
Leaving cooling water
temperature (LCWT) °C 8
Using the Carnot formula
Useful work (kw) 54.84 cooling effect
% loading (step 1) 29
power input to compressor (kw) 33.50
measured by
logger
Coefficient of performance COP 1.64
evaporator temperature
(measured) T1 8 281
condenser temperature
(measured) T2 111 384
Based on the performance chart above, the chiller was on step 1 during the audit.
Assuming that the chiller runs 42% loaded on average i.e at step 2, then the energy consumption
scenario will be as detailed below:
Useful work (kw) 78.67 cooling effect
% loading (step 2) 42
power input to compressor (kw) 48.06
Coefficient of performance COP 1.64
evaporator temperature T1 8 281
condenser temperature T2 111 384
From the foregoing, a new chiller of equivalent cooling capacity would have a far much less
power consumption requirements resulting in very large energy savings. A new chiller would
have the properties detailed in Table 3.3 and the resultant payback period for such a new
investment would be 2.6 years.
It therefore follows that considering the operation & maintenance cost savings and taking the
period from January to September 2014 as the base year and Chiller Operating hours per
annum being 4680hours, the average energy consumed during the base year was 1,582,148
kWh /Month. With the new chillers, the projected energy savings due to chiller
improvements amount to 173,991 kWh equivalent to Kshs 2,927,970 p.a. The estimated
investment cost is Kshs.8,000,000 with a simple payback period of 2.6 years
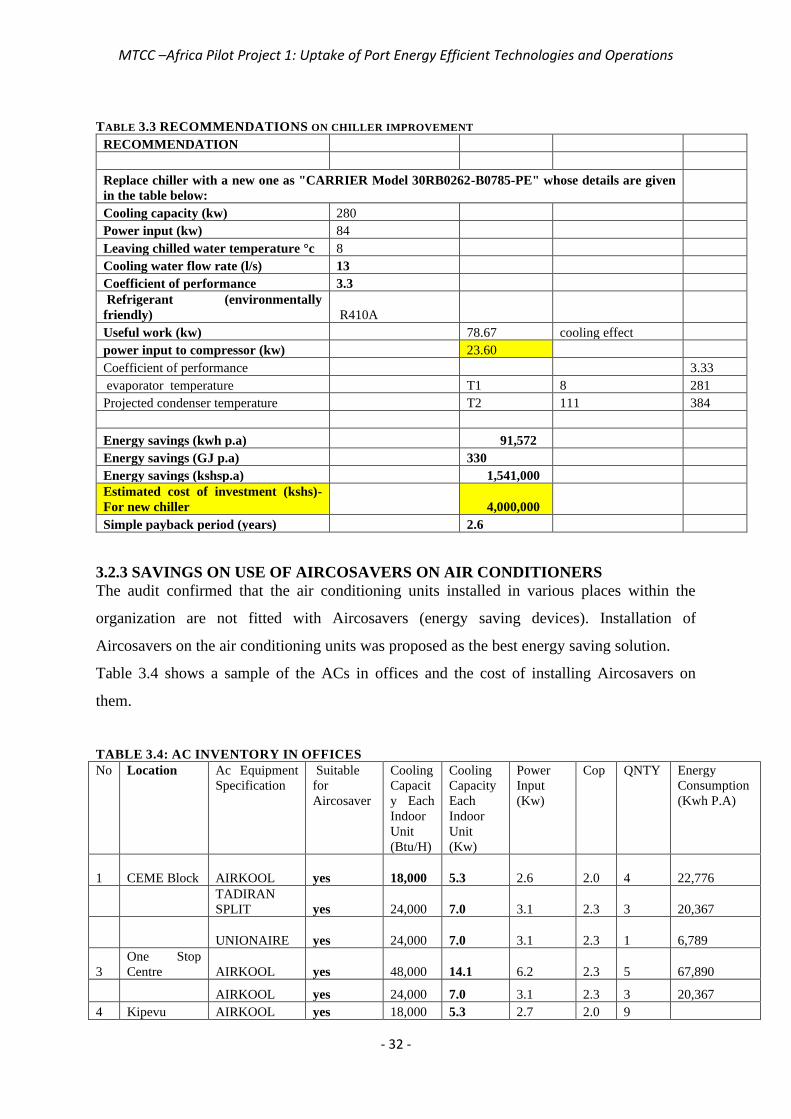
MTCC –Africa Pilot Project 1: Uptake of Port Energy Efficient Technologies and Operations
- 32 -
TABLE 3.3 RECOMMENDATIONS ON CHILLER IMPROVEMENT
RECOMMENDATION
Replace chiller with a new one as "CARRIER Model 30RB0262-B0785-PE" whose details are given
in the table below:
Cooling capacity (kw) 280
Power input (kw) 84
Leaving chilled water temperature °c 8
Cooling water flow rate (l/s) 13
Coefficient of performance 3.3
Refrigerant (environmentally
friendly) R410A
Useful work (kw) 78.67 cooling effect
power input to compressor (kw) 23.60
Coefficient of performance 3.33
evaporator temperature T1 8 281
Projected condenser temperature T2 111 384
Energy savings (kwh p.a) 91,572
Energy savings (GJ p.a) 330
Energy savings (kshsp.a) 1,541,000
Estimated cost of investment (kshs)-
For new chiller 4,000,000
Simple payback period (years) 2.6
3.2.3 SAVINGS ON USE OF AIRCOSAVERS ON AIR CONDITIONERS
The audit confirmed that the air conditioning units installed in various places within the
organization are not fitted with Aircosavers (energy saving devices). Installation of
Aircosavers on the air conditioning units was proposed as the best energy saving solution.
Table 3.4 shows a sample of the ACs in offices and the cost of installing Aircosavers on
them.
TABLE 3.4: AC INVENTORY IN OFFICES
No Location Ac Equipment
Specification
Suitable
for
Aircosaver
Cooling
Capacit
y Each
Indoor
Unit
(Btu/H)
Cooling
Capacity
Each
Indoor
Unit
(Kw)
Power
Input
(Kw)
Cop QNTY Energy
Consumption
(Kwh P.A)
1 CEME Block AIRKOOL yes 18,000 5.3 2.6 2.0 4
22,776
TADIRAN
SPLIT yes 24,000 7.0 3.1 2.3 3
20,367
UNIONAIRE yes 24,000 7.0 3.1 2.3 1
6,789
3
One Stop
Centre AIRKOOL yes 48,000 14.1 6.2 2.3 5
67,890
AIRKOOL yes 24,000 7.0 3.1 2.3 3 20,367
4 Kipevu AIRKOOL yes 18,000 5.3 2.7 2.0 9
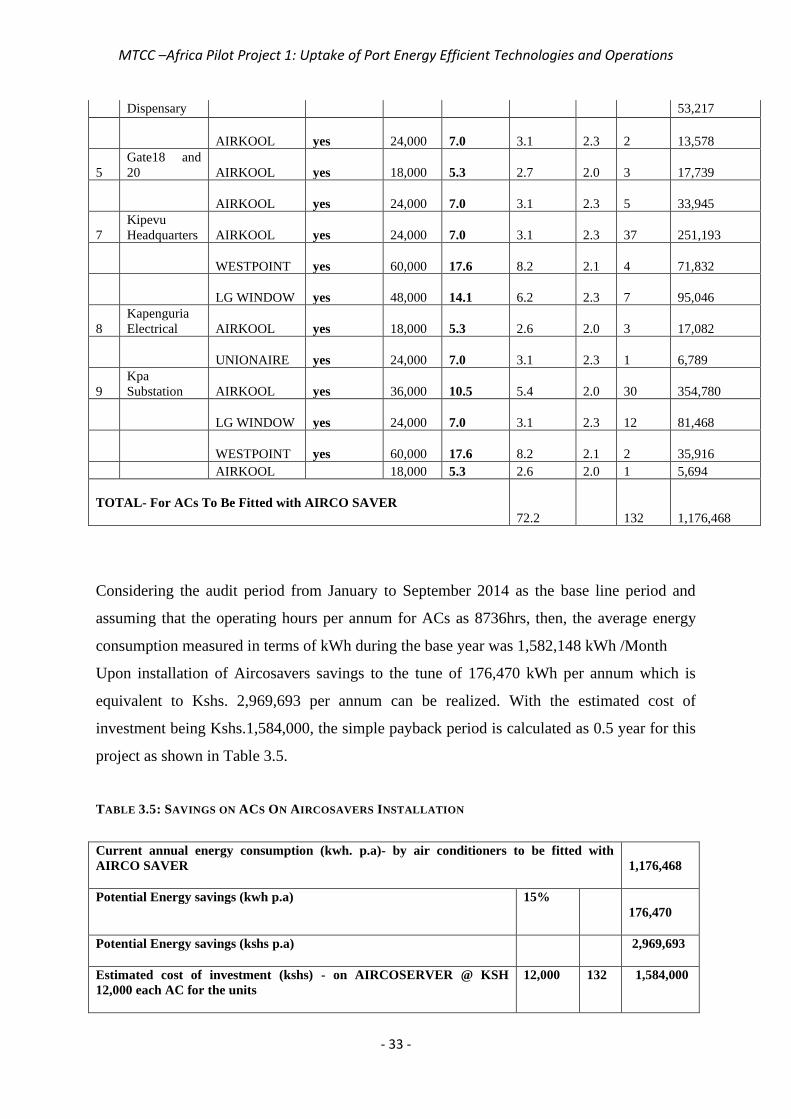
MTCC –Africa Pilot Project 1: Uptake of Port Energy Efficient Technologies and Operations
- 33 -
Dispensary 53,217
AIRKOOL yes 24,000 7.0 3.1 2.3 2
13,578
5
Gate18 and
20 AIRKOOL yes 18,000 5.3 2.7 2.0 3
17,739
AIRKOOL yes 24,000 7.0 3.1 2.3 5
33,945
7
Kipevu
Headquarters AIRKOOL yes 24,000 7.0 3.1 2.3 37
251,193
WESTPOINT yes 60,000 17.6 8.2 2.1 4
71,832
LG WINDOW yes 48,000 14.1 6.2 2.3 7
95,046
8
Kapenguria
Electrical AIRKOOL yes 18,000 5.3 2.6 2.0 3
17,082
UNIONAIRE yes 24,000 7.0 3.1 2.3 1
6,789
9
Kpa
Substation AIRKOOL yes 36,000 10.5 5.4 2.0 30
354,780
LG WINDOW yes 24,000 7.0 3.1 2.3 12
81,468
WESTPOINT yes 60,000 17.6 8.2 2.1 2
35,916
AIRKOOL 18,000 5.3 2.6 2.0 1 5,694
TOTAL- For ACs To Be Fitted with AIRCO SAVER
72.2 132 1,176,468
Considering the audit period from January to September 2014 as the base line period and
assuming that the operating hours per annum for ACs as 8736hrs, then, the average energy
consumption measured in terms of kWh during the base year was 1,582,148 kWh /Month
Upon installation of Aircosavers savings to the tune of 176,470 kWh per annum which is
equivalent to Kshs. 2,969,693 per annum can be realized. With the estimated cost of
investment being Kshs.1,584,000, the simple payback period is calculated as 0.5 year for this
project as shown in Table 3.5.
TABLE 3.5: SAVINGS ON ACS ON AIRCOSAVERS INSTALLATION
Current annual energy consumption (kwh. p.a)- by air conditioners to be fitted with
AIRCO SAVER
1,176,468
Potential Energy savings (kwh p.a)
15%
176,470
Potential Energy savings (kshs p.a)
2,969,693
Estimated cost of investment (kshs) - on AIRCOSERVER @ KSH
12,000 each AC for the units
12,000 132 1,584,000
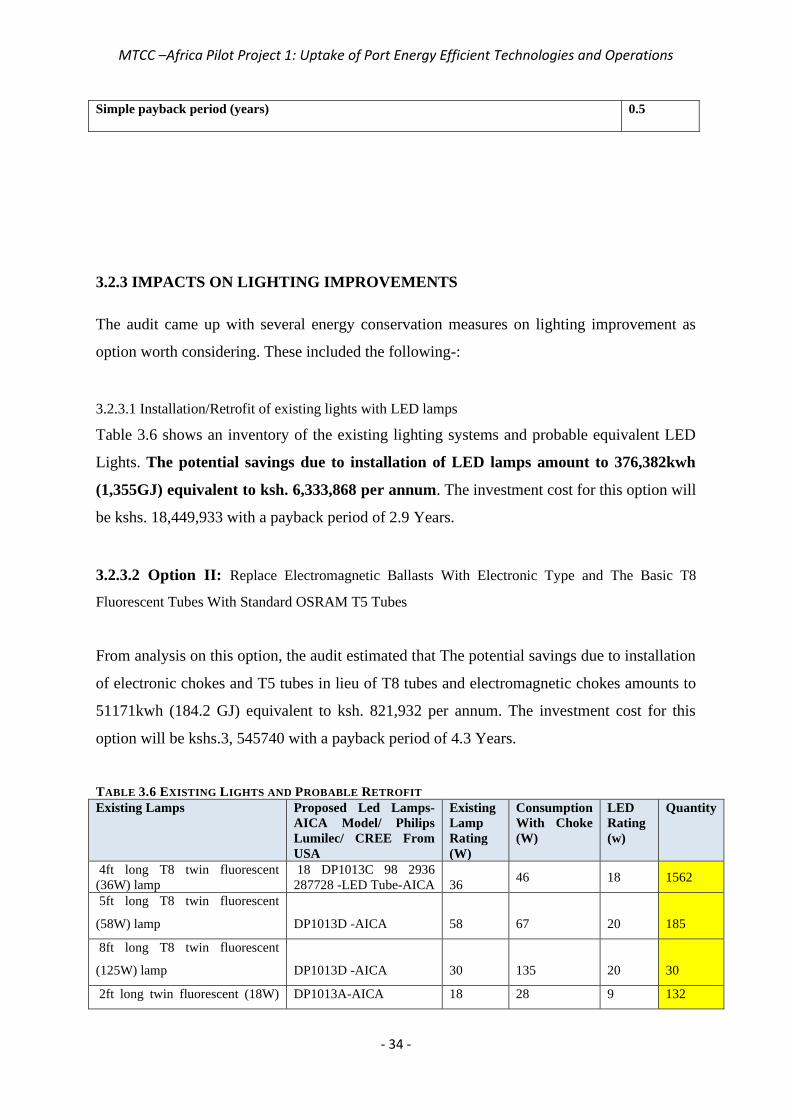
MTCC –Africa Pilot Project 1: Uptake of Port Energy Efficient Technologies and Operations
- 34 -
Simple payback period (years)
0.5
3.2.3 IMPACTS ON LIGHTING IMPROVEMENTS
The audit came up with several energy conservation measures on lighting improvement as
option worth considering. These included the following-:
3.2.3.1 Installation/Retrofit of existing lights with LED lamps
Table 3.6 shows an inventory of the existing lighting systems and probable equivalent LED
Lights. The potential savings due to installation of LED lamps amount to 376,382kwh
(1,355GJ) equivalent to ksh. 6,333,868 per annum. The investment cost for this option will
be kshs. 18,449,933 with a payback period of 2.9 Years.
3.2.3.2 Option II: Replace Electromagnetic Ballasts With Electronic Type and The Basic T8
Fluorescent Tubes With Standard OSRAM T5 Tubes
From analysis on this option, the audit estimated that The potential savings due to installation
of electronic chokes and T5 tubes in lieu of T8 tubes and electromagnetic chokes amounts to
51171kwh (184.2 GJ) equivalent to ksh. 821,932 per annum. The investment cost for this
option will be kshs.3, 545740 with a payback period of 4.3 Years.
TABLE 3.6 EXISTING LIGHTS AND PROBABLE RETROFIT
Existing Lamps Proposed Led Lamps-
AICA Model/ Philips
Lumilec/ CREE From
USA
Existing
Lamp
Rating
(W)
Consumption
With Choke
(W)
LED
Rating
(w)
Quantity
4ft long T8 twin fluorescent
(36W) lamp
18 DP1013C 98 2936
287728 -LED Tube-AICA 36 46 18 1562
5ft long T8 twin fluorescent
(58W) lamp DP1013D -AICA 58 67 20 185
8ft long T8 twin fluorescent
(125W) lamp DP1013D -AICA 30 135 20 30
2ft long twin fluorescent (18W) DP1013A-AICA 18 28 9 132
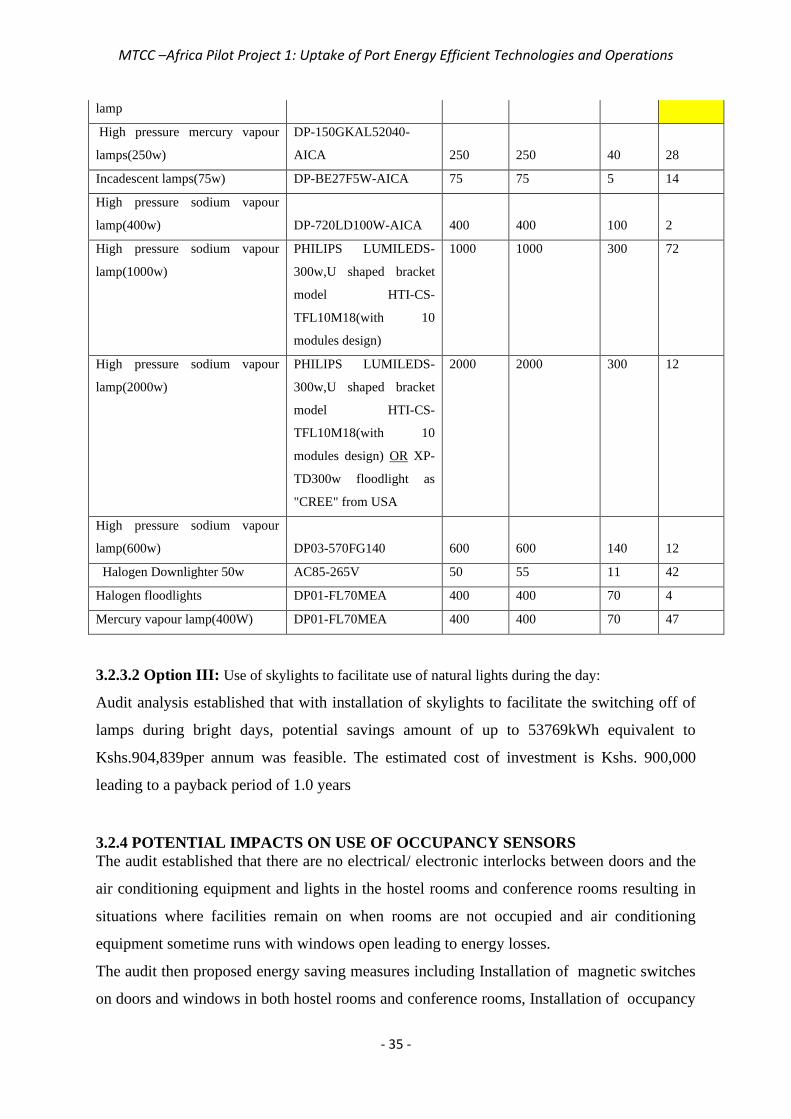
MTCC –Africa Pilot Project 1: Uptake of Port Energy Efficient Technologies and Operations
- 35 -
lamp
High pressure mercury vapour
lamps(250w)
DP-150GKAL52040-
AICA 250 250 40 28
Incadescent lamps(75w) DP-BE27F5W-AICA 75 75 5 14
High pressure sodium vapour
lamp(400w) DP-720LD100W-AICA 400 400 100 2
High pressure sodium vapour
lamp(1000w)
PHILIPS LUMILEDS-
300w,U shaped bracket
model HTI-CS-
TFL10M18(with 10
modules design)
1000 1000 300 72
High pressure sodium vapour
lamp(2000w)
PHILIPS LUMILEDS-
300w,U shaped bracket
model HTI-CS-
TFL10M18(with 10
modules design) OR XP-
TD300w floodlight as
"CREE" from USA
2000 2000 300 12
High pressure sodium vapour
lamp(600w) DP03-570FG140 600 600 140 12
Halogen Downlighter 50w AC85-265V 50 55 11 42
Halogen floodlights DP01-FL70MEA 400 400 70 4
Mercury vapour lamp(400W) DP01-FL70MEA 400 400 70 47
3.2.3.2 Option III: Use of skylights to facilitate use of natural lights during the day:
Audit analysis established that with installation of skylights to facilitate the switching off of
lamps during bright days, potential savings amount of up to 53769kWh equivalent to
Kshs.904,839per annum was feasible. The estimated cost of investment is Kshs. 900,000
leading to a payback period of 1.0 years
3.2.4 POTENTIAL IMPACTS ON USE OF OCCUPANCY SENSORS
The audit established that there are no electrical/ electronic interlocks between doors and the
air conditioning equipment and lights in the hostel rooms and conference rooms resulting in
situations where facilities remain on when rooms are not occupied and air conditioning
equipment sometime runs with windows open leading to energy losses.
The audit then proposed energy saving measures including Installation of magnetic switches
on doors and windows in both hostel rooms and conference rooms, Installation of occupancy

MTCC –Africa Pilot Project 1: Uptake of Port Energy Efficient Technologies and Operations
- 36 -
sensors (dual type)in training and conference rooms and fitting foam inserts in the gaps
between window type AC units and the walling and sealing using timber to minimize
infiltration.
Table 3.7 shows the areas to be fitted with occupancy sensors and air conditioner interlocks.
From this analysis, it was established that with installation of interlocks and occupancy
sensors, Savings amounting to 301,724kWh(1086GJ)per annum equivalent to Kshs
5,078,020 p.a were feasible. The estimated investment cost is Kshs.4,500,000 with simple
payback period of 0.9years
TABLE 3.7: AREAS WITH INTERLOCKS AND OCCUPANCY SENSOR ENERGY SAVINGS POTENTIAL
Section Air
conditioner
capacity
(Btu/hr)
AC
capacity
(kw)
Qnt of
rooms
Energy
Consump-
tionp.a(kWh
)
Type of
lamp
Rating
(W)
Consump
-tion with
choke
(w)incase
of
fluoresent
lamps
Quantity
of lamps
Energy
Consump
-
tionp.a(k
Wh)
A) BANDARI COLLEGE
Hostel
Rooms &
Bathrooms
12,000 3.5 69
371,184
Compact
Flouresce
nt
20 20 138
24,178
Common
Wash Room
hostels
- T8 single
fluorescen
t
36 46 6
2,418
- T8
Flouresce
nt
tubes(twi
n)
36 46 4
1,612
Theatre 120,000 35.2 1 53,795 Compact
Flouresce
nt(flower
type)
60 60 8
4,205
- Compact
Flouresce
nt(Downli
ghters)
20 20 12
2,102
Theatre
Washrooms
- T8
Flouresce
nt
tubes(twi
n)
36 46 10
4,030
B) PORT ELECTRICAL DEPARTMENT
Conference
room
(18,000btu/hx
4No.)
18,000 5.3 4 32,277
Senior
Electrical
Engineers'
60,000 17.6 1 26,897
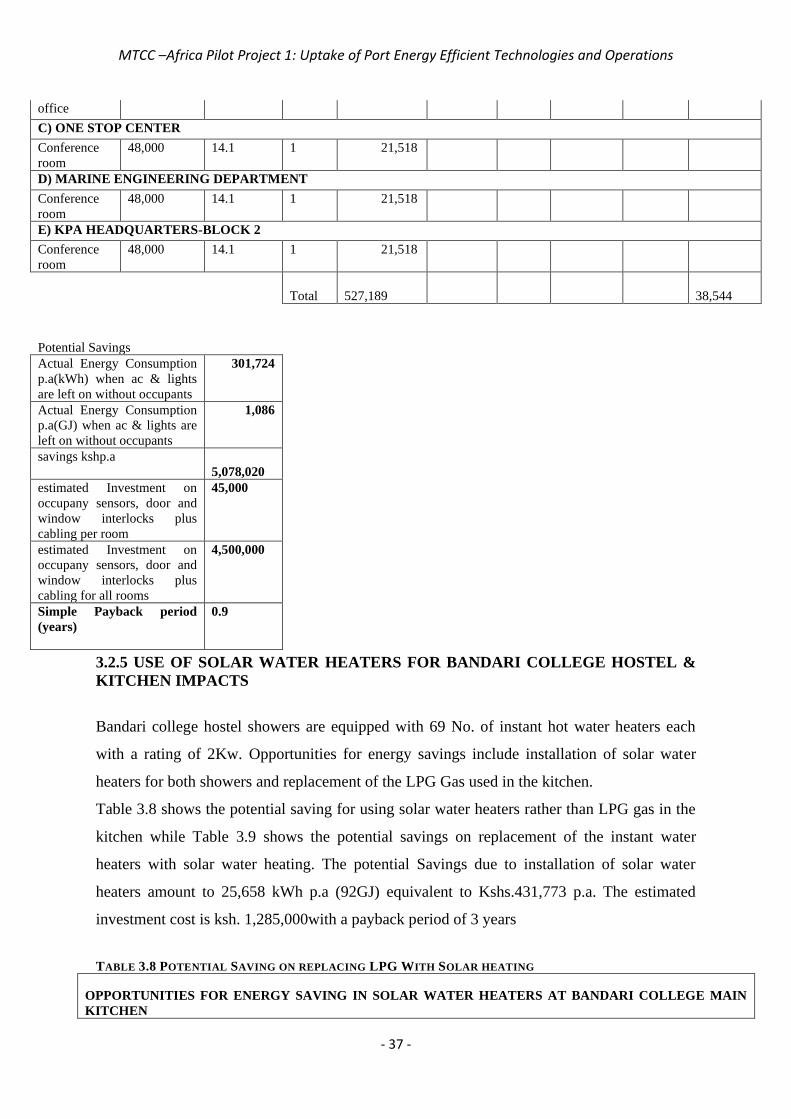
MTCC –Africa Pilot Project 1: Uptake of Port Energy Efficient Technologies and Operations
- 37 -
3.2.5 USE OF SOLAR WATER HEATERS FOR BANDARI COLLEGE HOSTEL &
KITCHEN IMPACTS
Bandari college hostel showers are equipped with 69 No. of instant hot water heaters each
with a rating of 2Kw. Opportunities for energy savings include installation of solar water
heaters for both showers and replacement of the LPG Gas used in the kitchen.
Table 3.8 shows the potential saving for using solar water heaters rather than LPG gas in the
kitchen while Table 3.9 shows the potential savings on replacement of the instant water
heaters with solar water heating. The potential Savings due to installation of solar water
heaters amount to 25,658 kWh p.a (92GJ) equivalent to Kshs.431,773 p.a. The estimated
investment cost is ksh. 1,285,000with a payback period of 3 years
TABLE 3.8 POTENTIAL SAVING ON REPLACING LPG WITH SOLAR HEATING
OPPORTUNITIES FOR ENERGY SAVING IN SOLAR WATER HEATERS AT BANDARI COLLEGE MAIN
KITCHEN
office
C) ONE STOP CENTER
Conference
room
48,000 14.1 1 21,518
D) MARINE ENGINEERING DEPARTMENT
Conference
room
48,000 14.1 1 21,518
E) KPA HEADQUARTERS-BLOCK 2
Conference
room
48,000 14.1 1 21,518
Total
527,189
38,544
Potential Savings Actual Energy Consumption
p.a(kWh) when ac & lights
are left on without occupants
301,724
Actual Energy Consumption
p.a(GJ) when ac & lights are
left on without occupants
1,086
savings kshp.a
5,078,020 estimated Investment on
occupany sensors, door and
window interlocks plus
cabling per room
45,000
estimated Investment on
occupany sensors, door and
window interlocks plus
cabling for all rooms
4,500,000
Simple Payback period
(years)
0.9
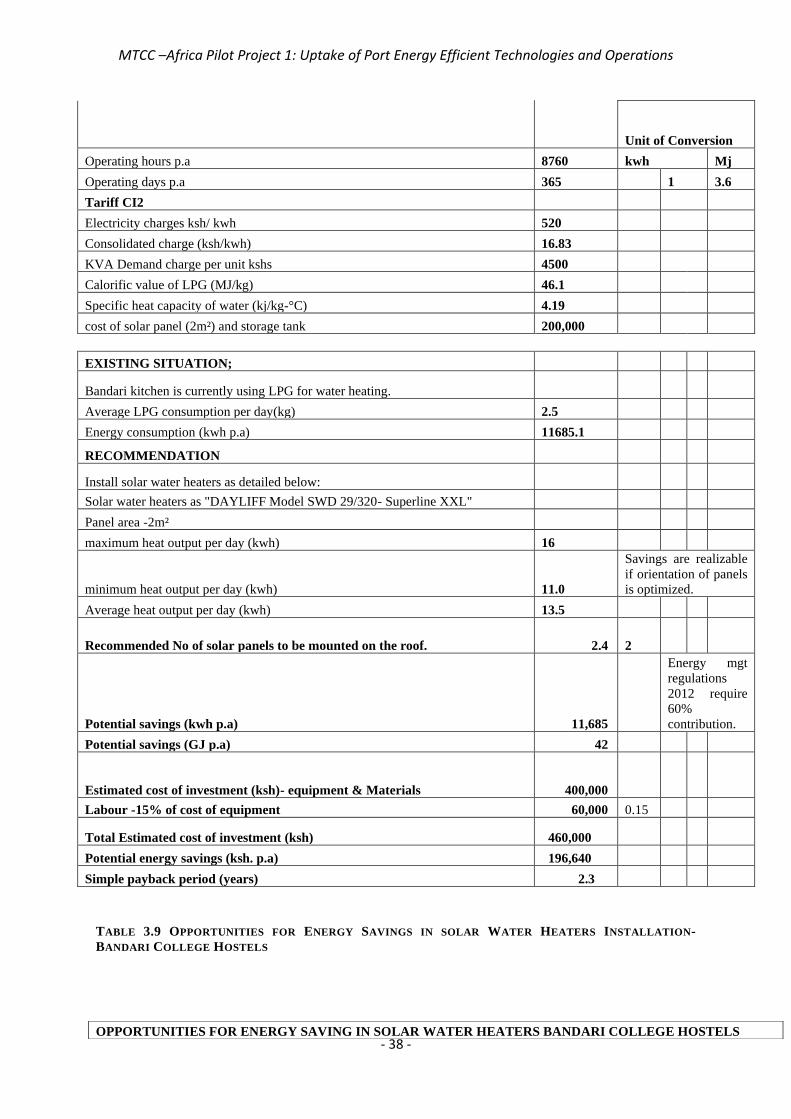
MTCC –Africa Pilot Project 1: Uptake of Port Energy Efficient Technologies and Operations
- 38 -
Unit of Conversion
Operating hours p.a 8760 kwh Mj
Operating days p.a 365 1 3.6
Tariff CI2
Electricity charges ksh/ kwh 520
Consolidated charge (ksh/kwh) 16.83
KVA Demand charge per unit kshs 4500
Calorific value of LPG (MJ/kg) 46.1
Specific heat capacity of water (kj/kg-°C) 4.19
cost of solar panel (2m²) and storage tank 200,000
EXISTING SITUATION;
Bandari kitchen is currently using LPG for water heating.
Average LPG consumption per day(kg) 2.5
Energy consumption (kwh p.a) 11685.1
RECOMMENDATION
Install solar water heaters as detailed below:
Solar water heaters as "DAYLIFF Model SWD 29/320- Superline XXL"
Panel area -2m²
maximum heat output per day (kwh) 16
minimum heat output per day (kwh) 11.0
Savings are realizable
if orientation of panels
is optimized.
Average heat output per day (kwh) 13.5
Recommended No of solar panels to be mounted on the roof. 2.4 2
Potential savings (kwh p.a) 11,685
Energy mgt
regulations
2012 require
60%
contribution.
Potential savings (GJ p.a) 42
Estimated cost of investment (ksh)- equipment & Materials 400,000
Labour -15% of cost of equipment 60,000 0.15
Total Estimated cost of investment (ksh) 460,000
Potential energy savings (ksh. p.a) 196,640
Simple payback period (years) 2.3
TABLE 3.9 OPPORTUNITIES FOR ENERGY SAVINGS IN SOLAR WATER HEATERS INSTALLATION-
BANDARI COLLEGE HOSTELS
OPPORTUNITIES FOR ENERGY SAVING IN SOLAR WATER HEATERS BANDARI COLLEGE HOSTELS

MTCC –Africa Pilot Project 1: Uptake of Port Energy Efficient Technologies and Operations
- 39 -
Unit of Conversion
Operating hours p.a 8760 kwh Mj
Operating days p.a 225 1 3.6
Tariff CI2
Electricity charges ksh/ kwh 4.73
Consolidated charge (ksh/kwh) 16.83
KVA Demand charge per unit kshs 400
Calorific value of LPG (MJ/kg) 46.1
Specific heat capacity of water (kj/kg-°C) 4.19
cost of solar panel (2m²) and storage tank 130,000
EXISTING SITUATION;
Bandari hostel showers are equipped with 69 No. of instant water heaters each
with a rating of 2kw
Number of instant water heaters -Electric 69
Capacity of instant water heaters (kw) 2
Total maximum kw demand 138
Duration of usage (hours per day) 0.50
Average occupancy level (%) 0.90
Energy consumption(kwh p.a) 13972.5
RECOMMENDATION
Install solar water heaters as detailed below:
Solar water heaters as "DAYLIFF Model SWD 29/320- Superline XXL"
Panel area -2m²
maximum heat output per day (kwh) 16
minimum heat output per day (kwh) 11.0
Savings are realizable if
orientation of panels is
optimized.
Average heat output per day (kwh) 13.5
Recommended No of solar panels to be mounted on the roof.
4.6 5
Potential savings (kwh p.a) 13,973
Potential savings (GJ p.a)
50
Estimated cost of investment (ksh)- solar panels, common tank, circulating
pump & pipework
750,000
Labour -10% of cost of equipment 5,000 0.1
Total Estimated cost of investment (ksh) 825,000
Potential energy savings (ksh. p.a) 235,133
Simple payback period (years) 3.5

MTCC –Africa Pilot Project 1: Uptake of Port Energy Efficient Technologies and Operations
- 40 -
3.2.6 LIFT CONTROLS UPGRADE
By replacing the two Lifts in blocks 2 at the KPA headquarters with machine room-less type
which are energy efficient, Savings amounting up to 28120kWh equivalent to Kshs.473,205
p.a can be realized. The estimated investment cost is Kshs.18,000,000 with a simple payback
period of 38years. This option has a very long payback period. A better option proposed was
upgrade of Lift controls to VSDs which has savings amounting up to 28120 kWh equivalent
to Kshs.473,205p.a. The estimated investment cost is Kshs.1, 000,000with a simple payback
period of 2.1 years.
3.2.7 USE OF PREMIUM EFFICIENCY MOTORS
With the establishment of a procurement policy to replace standard efficiency with premium
efficiency motors and replacement of standard efficiency motors with premium efficiency
type, and taking base line information as from January to September, 2014 (period of audit)
with the Facility Operating 8736 hours per annum, The average energy consumption in
terms of kWh is 1,582,148kWh /Month. Installation of premium efficiency motors would
result to a saving of 495,343 kWh (1783GJ) per annum equivalent to Kshs 8,335,785 p.a. The
estimated investment cost is Kshs. 21,421,162 with simple payback period of 2.6 years.
This saving is as a result of the different efficiencies as shown in Table 3.10
TABLE 3.10: DIFFERENT MOTOR CAPACITIES AND THEIR EFFICIENCIES
Type of
motors Location
Quantit
y
Rating
(kw)
Speed(rp
m)
Premium
efficiency
Standard
efficiency
1. Travelli
ng
Motors
ZPMC 1901 STS
CRANE 20 13 1750 93.0% 84.0%
Hoisting
Motors
ZPMC 1901STS
CRANE 2 375 1750 96.0% 94.0%
Boom Hoist
Motor
ZPMC 1901STS
CRANE 1 160 1750 95.8% 93.8%
Trolley
Motors
ZPMC 1901STS
CRANE 4 60 1750 95.4% 89.0%
Travelling
Motors
ZPMC 1902 STS
CRANE 20 13 1750 93.0% 84.0%
Hoisting
Motors
ZPMC 1902STS
CRANE 2 375 1750 96.0% 94.0%
Trolleys
Motors
ZPMC 1902 STS
CRANE 4 60 1750 95.4% 89.0%
Travelling
Motors
OLD ZPMC STS
CRANE 20 17.5 1750 93.6% 84.0%
Hoisting
Motors
OLD ZPMC STS
CRANE 2 400 1750 96.0% 94.0%
Hoisting RTG OLD 2 200 1486 0.917 0.82

MTCC –Africa Pilot Project 1: Uptake of Port Energy Efficient Technologies and Operations
- 41 -
Motors KALMAR STS
CRANE
3.2.8 ENERGY SAVING FROM THE ENERGY MANAGEMENT SYSTEM
The main cost for this system is the Installation smart meters and energy management
software to monitor energy consumption by the following units on real time basis:
substations, workshops, office blocks, Bandari College, chillers, server rooms, electrically
driven cranes and the ‘reefer’ containers power supply system. The recommended system is
“AMPLEX SMARTHARBOUR"
The Projected energy savings with this system is estimated to amount to Kshs 6,404,298 p.a.
The estimated investment is Kshs.17, 544, 462 with a simple payback period of 2.7 years.
Table 3.11 shows the costing and computation of these savings.
TABLE 3.11 COMPUTED ENERGY SAVINGS WITH AMPLEX SMARTHABOUR
Port Operating hours p.a 8760 Euro Ksh
No of days per annum 365 1 108
No of days per week 52 No of days per week 7
Tariff CI2 Electricity charges ksh/ kwh 8.25 KVA Demand charge per unit kshs 520 Consolidated electricity charge kshs. 16.83
The following are the components of the proposed Energy Management system:
ITEM DESCRIPTION QUANTITY Factor UNIT COST
(EUROS)
AMOUNT
(EUROS)
AMOUNT
(KSHS)
Hardware,software & hosting Lot 100,030 10,803,240
Shipping, installation, configuration &
training (40%) 0.4 40,012 4,321,296
SUBTOTAL 140,042 15,124,536
16% VAT 0.16 22,407 2,419,926
TOTAL 162,449 17,544,462
Annual energy bill (ksh) 320,214,912

MTCC –Africa Pilot Project 1: Uptake of Port Energy Efficient Technologies and Operations
- 42 -
Total savings (ksh p.a)-2% of annual
bill 6,404,298 0.02
(As a result of timely
interventions for corrective
action)
Investment cost (kshs) 17,544,462
Simple payback period (years) 2.7
Annual hosting cost (Euros) 5,757 Annual hosting cost (ksh) 621,756 Maintenance
3.2.9 SOLAR POWER GENERATION OPTION:
The energy conservation measure proposed Level 1 audit was installation of a 500kw solar
power system (Renewable energy source) to supplement the supply from the Grid and diesel
power generators.
The Cost benefit analysis showing computed savings on installation of such a solar power
plant is as in Table 3.12.
TABLE 3.12 COST BENEFIT ANALYSIS OF A 500KW SOLAR POWER PLANT
Average maximum KVA demand during baseline period 3264
Capacity of proposed solar power plant (kw) 500
Estimated investment cost on plant (Euro) 620,987
Estimated investment cost on plant (ksh) 67,066,596
Savings from avoided expenditure on resincoat sheets(kshs) 1,792,896
Estimated Net investment cost on plant (ksh) 65,273,700
Projected annual energy pv output (mwh) 775
Projected annual energy feed to Grid (mwh) 723
Feed in tariff for solar Grid (US cents/kwh) 12
Feed in tariff for solar Grid (ksh/kwh) 11.04
Operating hours p.a 4380 USD Ksh.
No. of operating hours per day 12 1 92
Operating days per week 7
No. of weeks p.a 52 Euro ksh
Operating days p.a 365 1 108
Tariff- CI2 Consolidated Electricity charges (Kshs/kWh) 16.83 Tariff charge (Kshs/kWh) 8.25
Demand charge (Kshs/KVA) 520

MTCC –Africa Pilot Project 1: Uptake of Port Energy Efficient Technologies and Operations
- 43 -
Potential savings -Amount Paid To Kplc For Equivalent Energy (kshp.a) 12,168,090
Simple payback period (Years) 5
The Consultancy Services for the Proposed Study of Energy Needs, Alternative Energy
Sources And Provision Of Shore Power (Cold Ironing) For The Port Of Mombasa also did
their own detailed analysis on Solar Power Plant installation. According to this report, the
solar power generation potential in Kenya is quite high with the yearly solar irradiation for
Kenya being approximately 2200kWh per m2 per year.
In their report, installing solar panels on all available locations will require an investment in
the order of magnitude of 45M USD. Taking into account a yearly percentage of 7% for
interest, maintenance and depreciation the cost price per MWh will be approx. USD60 per
MWh, which is less than 50% of the current price for grid power.
3.2.10 ENERGY SAVINGS ON COMPUTERS
The computed potential savings due to awareness training to promote operation in energy
saving mode and switching off computers and other office equipment when not in use
amounts to 34,398 kWh equivalent to Kshs. 578,860 per annum. The estimated cost of
investments is Kshs. 300,000 leading to a payback period of 0.5 year. Table 3.13 shows the
justification for awareness training on efficient use of computers and usage of LED
Computers as opposed to LCD
TABLE 3.13: JUSTIFICATION FOR EFFICIENT USE OF COMPUTERS
Assumed Operating Hours per day 9 Operating days per week 5 Operating weeks per annum 52 Operating Hours per annum 2340 Tariff CI2 Electricity charges Ksh/ kWh 8.25 KVA Demand charge per unit Kshs 520 Consolidated energy charge (ksh/kwh) 16.83
kWh MJ

MTCC –Africa Pilot Project 1: Uptake of Port Energy Efficient Technologies and Operations
- 44 -
1 3.6
No. Equipment rating(W) rating(kW)
1 computers (CPU ) 55 0.055
2 17" CRT Computer monitor 90 0.090
3 17" LCD Computer monitor 35 0.035
4 19" CRT Computer monitor 110 0.110
5 19" LCD Computer monitor 35 0.035
6 19" LED Computer monitor 20 0.020
7 17" LED Computer monitor 18 0.018
Estimated cost of 17" LED Computer monitor (ksh) 9,000
Switch off computers after work. 10% Assume 10% of computers currently left on 24 hours a day 24
Potential energy savings (kwh p.a)
34,398
Potential energy savings (kshs. p.a)
578,860
Estimated investment - staff awareness to operate in power
saving mode and switch off computers when not in use (ksh)
300,000
Simple payback period (years) 0.5
3.2.11 ENERGY EFFICIENCY IN USE OF CONTAINER CRANES
The energy conservation measure proposed for the fuel consuming gantry cranes is the
installation of the RIS-GA system to monitor and control the running of diesel generators in
RTG and MHC cranes.
The RIS-GA system reduces the speed of the diesel generator during the crane’s stand-by
mode and typically reduces total fuel consumption by 20%.
RIS.GA. field tests show that terminal operators can save up to 50% of fuel consumption
during the crane’s stand-by mode and more than 20% fuel consumption overall. This
produces a fast ROI, typically one to two years (depending on the country oil cost) and long-
term savings.
3.2.12 SHORE POWER IMPACTS FOR THE PORT OF MOMBASA
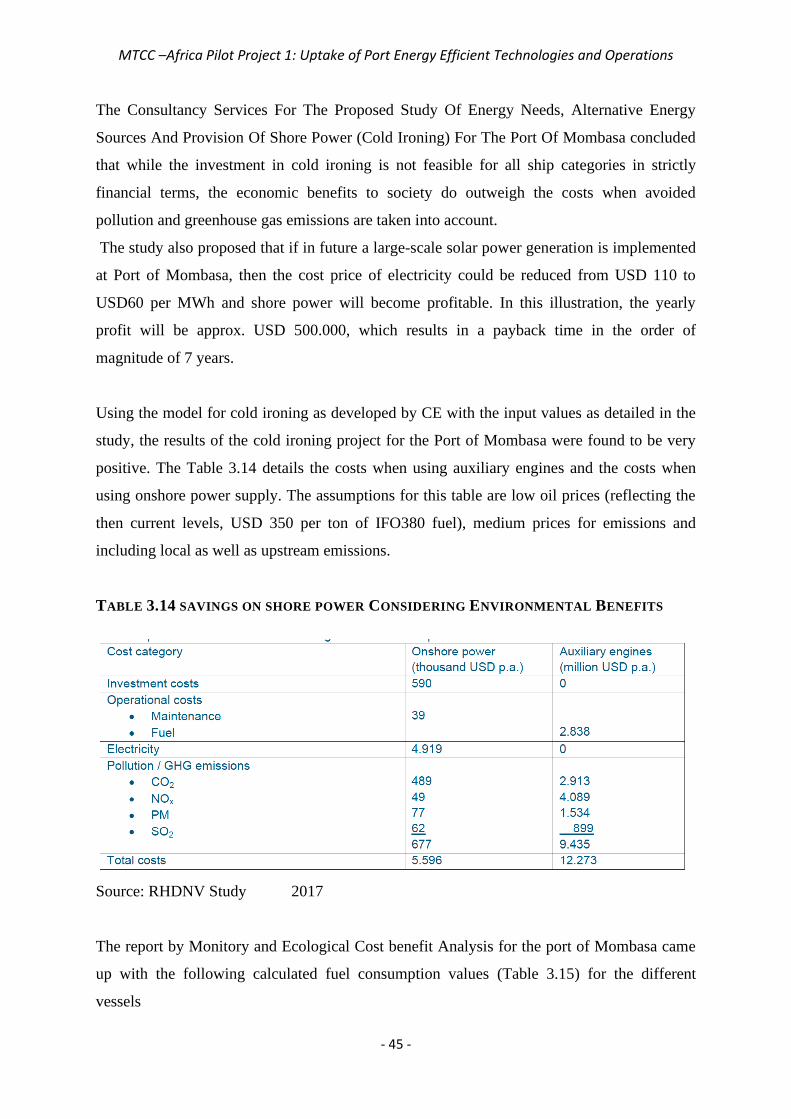
MTCC –Africa Pilot Project 1: Uptake of Port Energy Efficient Technologies and Operations
- 45 -
The Consultancy Services For The Proposed Study Of Energy Needs, Alternative Energy
Sources And Provision Of Shore Power (Cold Ironing) For The Port Of Mombasa concluded
that while the investment in cold ironing is not feasible for all ship categories in strictly
financial terms, the economic benefits to society do outweigh the costs when avoided
pollution and greenhouse gas emissions are taken into account.
The study also proposed that if in future a large-scale solar power generation is implemented
at Port of Mombasa, then the cost price of electricity could be reduced from USD 110 to
USD60 per MWh and shore power will become profitable. In this illustration, the yearly
profit will be approx. USD 500.000, which results in a payback time in the order of
magnitude of 7 years.
Using the model for cold ironing as developed by CE with the input values as detailed in the
study, the results of the cold ironing project for the Port of Mombasa were found to be very
positive. The Table 3.14 details the costs when using auxiliary engines and the costs when
using onshore power supply. The assumptions for this table are low oil prices (reflecting the
then current levels, USD 350 per ton of IFO380 fuel), medium prices for emissions and
including local as well as upstream emissions.
TABLE 3.14 SAVINGS ON SHORE POWER CONSIDERING ENVIRONMENTAL BENEFITS
Source: RHDNV Study 2017
The report by Monitory and Ecological Cost benefit Analysis for the port of Mombasa came
up with the following calculated fuel consumption values (Table 3.15) for the different
vessels

MTCC –Africa Pilot Project 1: Uptake of Port Energy Efficient Technologies and Operations
- 46 -
TABLE 3.16 EMISSION VALUES (TONNES) ANALYZED USING EMISSION FACTORS AND UTILIZED POWER
VESSEL TYPE CO2 NOx SO
2 PM
CONTAINERS 31,308.17 637.44 533.37 43.36
BULK CARRIERS 2,861.89 58.27 48.76 3.96
RO-RO 6,643.17 135.26 113.17 9.20
PRODUCT CARRIERS 12,944.82 263.56 220.53 17.93
GENERAL CARGO 5,821.87 118.53 99.18 8.06
TUGS 1,191.49 24.26 20.30 1.65
KPA OWN VESSELS 4,018.71 81.82 68.46 5.57
TOTAL 64,790.11 1,319.13 1,103.77 89.74
Table 3.16 shows the emission values associated with the consumed fuels by the different
vessels while Table 3.17 shows the total costs of these externalities as extracted from the
study.
TABLE 3.17 TOTAL COST OF EXTERNALITIES Pollutant Amount(Tonnes) Cost per Tonne Env. Cost(USD)
CO2
64,790.11 7.20
466,488
NOx 417.60
TABLE 3.15 CALCULATED FUEL USED (HFO &OFF-ROAD DIESEL) USING SOF, LF AND KWH

MTCC –Africa Pilot Project 1: Uptake of Port Energy Efficient Technologies and Operations
- 47 -
1,319.13 550,870
SO2
1,103.77 619.20
683,451
PM
89.74 17107.20
1,535,149
Total Environmental Costs (Year 2012)
3,235,959.23
From the foregoing, a project appraisal is conducted considering all the costs. These costs
include the cost of pollution, cost of alternative shore power bill, the OPS project costs and
fuel costs. Table 3.18 gives a summary of the project costs and the figurative project cash
inflow from the project undertaking. The power costs are subtracted from the sum of fuel
costs and cost of externalities because it is the opportunity cost of the two.
TABLE 3.18 SUMMARY OF PROJECT COSTS
Project Costs Summary (USD)
OPS Costs Opportunity Costs
Total OPS Installation Cost 14,267,895.60
Fuel Costs 12,268,455.02
Cost of Externalities 3,235,959.23
Less Power Costs - 13,178,142.13
Total 14,267,895.60 2,326,272.12
Upon appraisal, the NPV was positive on considering the cost of externalities and hence
using this method, the project is accepted on the basis that the NPV> 0 (Positive). This
project also has a IRR of 14% over a period of 15 years upon using the IRR appraisal method
proving its viability.
3.2.13 IMPACT ON EMS 14001:2015(ENVIRONMENTAL MANAGEMENT
SYSTEM) IMPLEMENTATION AND OLD TRUCKS REMOVAL FROM THE
ROAD
Building upon the GHG inventory and Baseline developed by the Green Port Policy, a
forecast of future GHG emissions was developed for the port of Mombasa. This was based on
the then latest available business forecasts from the KPA Business Plan 2012/13 to

MTCC –Africa Pilot Project 1: Uptake of Port Energy Efficient Technologies and Operations
- 48 -
2014/2015 (Nov 2012) and the KPA Master Plan (Sep 2009). Table 2.19 shows the 5- year
projected traffic increase, modelled on the Master Plan projection data. The resulting forecast
of total GHG emissions in tCO2e (Tonnes of CO2 emissions), classified by Scope, is shown
in Table 3.20
It is evident that the carbon foot print profile from port operations has a steady incline and a
lot need to be done to reduce this trend including implementation of the ISO 14001:2015EMS
and banning of old polluting trucks from accessing the Port.
FIGURE 3.1 BASIS FOR FUTURE GHG EMISSIONS
FIGURE 3.2 FOOTPRINT OF FUTURE GHG EMISSIONS

MTCC –Africa Pilot Project 1: Uptake of Port Energy Efficient Technologies and Operations
- 49 -
3.3 STATUS OF ENERGY SAVING MEASURES IMPLEMENTATION AT THE
PORT OF MOMBASA.
TABLE 3.19: IMPLEMENTATION STATUS AND CHALLENGES FOR ENERGY SAVING MEASURES AT THE
PORT OF MOMBASA
Initiative Implementation Status Challenges
Implement Shore power
for the Port of Mombasa
Pilot project on shore power
already evaluated. The project
cost is USD.2.5Million.
• Installation costs very high.
The Cost for installation of
one container berth is over
USD.6.5Million.
• Not many ships are shore
power ready. There is a
likelihood of the system
remaining underutilized
hence less zeal for its
installation
Renewable Energy
Technology –Solar PV
Three sites of 400kW, 350KW
and 500kW already installed at
the Port.
• The cost of implementing
the 5MWpk solar power
plant is very high.
Awaiting funding from
TradeMark East Africa for
its execution
Electrification of cargo
handling equipment
Not actioned yet • Projects like retrofitting of
eRTG are capital intensive
and requires major changes
on the operation yard that
would mean stoppage of
operations hence difficult
to implement
Install LED lamps as a
replacement of all the
existing less efficient
lamps
Project rolled out especially for
offices and some of the
floodlights
• Full implementation is
capital intensive hence the
phased approach
Sensitization on
importance of Energy
Efficiency &
Process Ongoing • Attitude change and
working patterns affecting
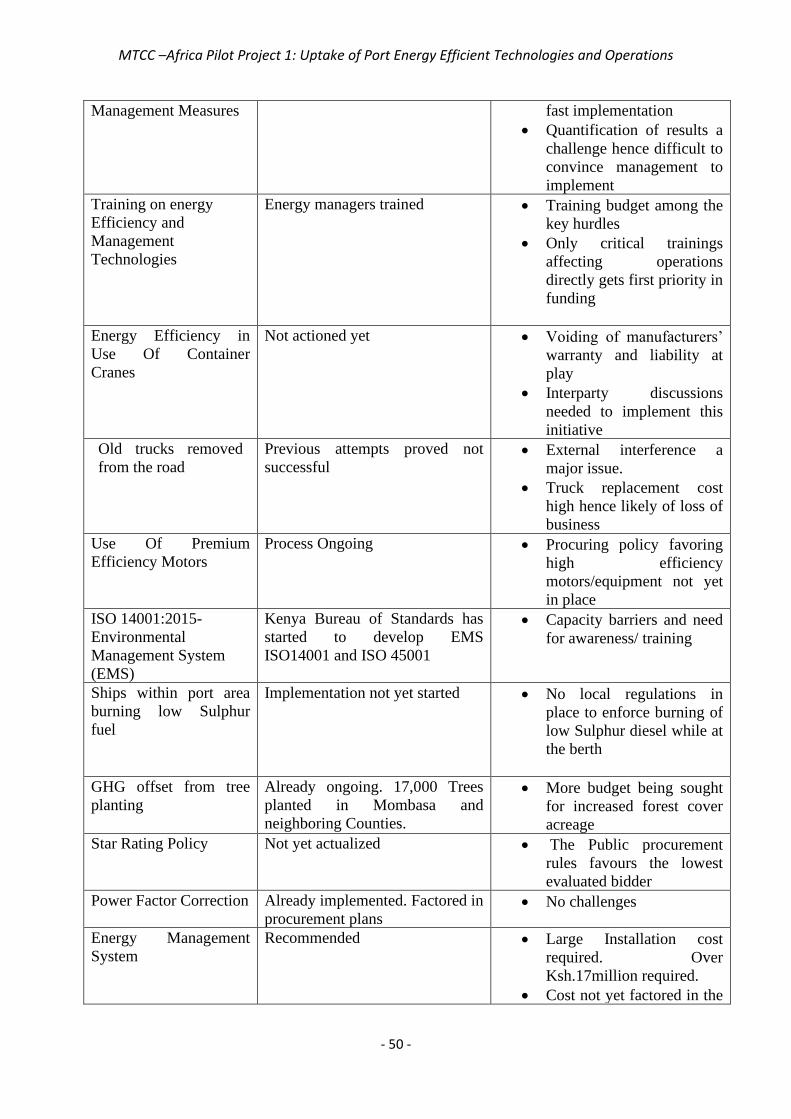
MTCC –Africa Pilot Project 1: Uptake of Port Energy Efficient Technologies and Operations
- 50 -
Management Measures fast implementation
• Quantification of results a
challenge hence difficult to
convince management to
implement
Training on energy
Efficiency and
Management
Technologies
Energy managers trained • Training budget among the
key hurdles
• Only critical trainings
affecting operations
directly gets first priority in
funding
Energy Efficiency in
Use Of Container
Cranes
Not actioned yet • Voiding of manufacturers’
warranty and liability at
play
• Interparty discussions
needed to implement this
initiative
Old trucks removed
from the road
Previous attempts proved not
successful • External interference a
major issue.
• Truck replacement cost
high hence likely of loss of
business
Use Of Premium
Efficiency Motors
Process Ongoing • Procuring policy favoring
high efficiency
motors/equipment not yet
in place
ISO 14001:2015-
Environmental
Management System
(EMS)
Kenya Bureau of Standards has
started to develop EMS
ISO14001 and ISO 45001
• Capacity barriers and need
for awareness/ training
Ships within port area
burning low Sulphur
fuel
Implementation not yet started • No local regulations in
place to enforce burning of
low Sulphur diesel while at
the berth
GHG offset from tree
planting
Already ongoing. 17,000 Trees
planted in Mombasa and
neighboring Counties.
• More budget being sought
for increased forest cover
acreage
Star Rating Policy Not yet actualized • The Public procurement
rules favours the lowest
evaluated bidder
Power Factor Correction
Already implemented. Factored in
procurement plans • No challenges
Energy Management
System
Recommended • Large Installation cost
required. Over
Ksh.17million required.
• Cost not yet factored in the

MTCC –Africa Pilot Project 1: Uptake of Port Energy Efficient Technologies and Operations
- 51 -
procurement plans
3.4 CHALLENGES/BARRIERS IN IMPLEMENTATION OF THE PROPOSED
ENERGY SAVING MEASURES.
• Lack adequate capital for implementing energy efficiency measures. The investment
priorities of the organization tend to favour other infrastructural projects as opposed to
energy efficiency projects hence low budget allocation.
• Lack of harmonized approach by the different functions/ departments of the
organization (operations, mechanical engineering, electrical engineering and Marine
engineering) in implementing energy saving measures. The departments may not be
on the same page in terms of energy management and each department manages its
own budget.
• Information and awareness levels on the benefits of energy efficiency is generally
low. Lack of adequate information on the subject hinders implementation.
• Some of the energy efficiency technologies/projects are costly with long pay-back
period and this discourages top management to give such projects a priority. One
common barrier in the utility sector is the perception that energy efficiency actions
will reduce the company’s revenue. While true in some cases, energy efficiency
programs can help electricity companies better manage peak demand and also defer
the need for investing in new power infrastructure, and thus can be very profitable for
electricity companies.

MTCC –Africa Pilot Project 1: Uptake of Port Energy Efficient Technologies and Operations
- 52 -
4.0 LEVEL 2 ENERGY AUDIT FOR THE PORT OF MOMBASA AND
LEVEL 1 ENERGY AUDIT FOR THE PORT OF DOUALA
4.1 EXECUTIVE SUMMARY
The Maritime Technology Cooperation Centre-Africa carried out level 2 energy audit at the
Port of Mombasa from 7th – 8th November 2019 and level 1 audit at the Port of Douala from
20th – 22nd November 2019 as part of the implementation of its commitment under pilot
project 1 on energy efficiency.
The Port of Mombasa (POM) is located on the waterfront of Kilindini Channel. The
geographic position of the port is approximately 4' 00' S, 39" 40' E. It is one of the busiest
Ports along the East African coastline and a gateway to East and Central Africa. The Port of
Douala (PAD) is the largest and a significant Port in Cameroon, which is located on the
shores of Wouri river estuary in the city of Douala, the largest and economic capital of
Cameroon
The main cargoes handled at the POM are containers, oils (fuel, vegetable), motor vehicles,
general cargo, dry bulk cargo (Clinker and Coal), grains, agricultural inputs (fertilizer) among
others . The main services offered include; Marine services, stevedoring services, shore
handling services, conventional cargo operations, container terminal operations
The main sections of PAD are: Container terminal, Cement terminal, Timber areas, fruit
exports, general cargoes and fishing port. The PAD operates the general cargo and fishing
activities while the other sections are operated privately through concessions.
The Energy Audit covered all of the sections of the two ports and data collected through
desktop discussions, site visits to different parts of the port and site interviews on the
operations, energy types and consumption.
The current energy infrastructure at POM is quite stable and able to support the energy
demand of the port operations and all ports installations.
The annual energy consumption at POM is approximately 24GWh with the Ship-to-shore
cranes being the biggest consumers of electric power at the port of Mombasa while the heavy
diesel fuel consumers include the RTG cranes, marine crafts and terminal tractors.
The PAD is currently supplied by the utility supplier ENEO through 11 independently
positioned substations that serve the different port areas. Supplied at a low voltage of 410V,
the current energy infrastructure at PAD is not able to supports the energy demand of the port
operation hence the use diesel generators especially at the container terminal and other port
areas.

MTCC –Africa Pilot Project 1: Uptake of Port Energy Efficient Technologies and Operations
- 53 -
To realize the potential energy saving measures at the port disposal, It is imperative that PAD
upgrades its reticulation network to allow for a robust port power distribution system and
redundancy in its operation. In line with this, the technical team requested for benchmarking
with the Port of Mombasa and further asked for frequent follow-up on the initiatives that
MTCC Africa will suggest further to their mission.
4.2 INTRODUCTION
4.2.1 SITE LOCATION
The Port of Mombasa is located on the waterfront of Kilindini Channel. It is one of the
busiest Ports along the East African coastline and a gateway to East and Central Africa. The
Port of Douala is the largest and a significant Port in Cameroon, which is located on the
shores of Wouri river estuary in the city of Douala, the largest and economic capital of
Cameroon
4.2.2 INFRASTRUCTURE AND EQUIPMENT
The major activities and infrastructure at the POM are; Two container terminals, General
Cargo handling berths, Bulk cargo handling berths, Two oil terminals, Bulk grain handling
terminal (privately operated), Dockyard/dry dock facilities. Equipment include ship to shore
cranes, terminal tractors, marine crafts (pilot and tug boats, mooring boats), rubber-tyre
cranes, reach stackers, forklifts.
The major activities and infrastructure at the Port of Douala are; Container handling, Fish
landing, General Cargo handling, Bulk cargo handling especially clinker, Timber yards
Equipment include ship to shore cranes, terminal tractors, marine crafts (pilot and tug boats),
rubber-tyred cranes, reach stackers, forklifts floating barges and excavators for handling of
timber/wood logs.Other infrastructure at the two ports include large storage sheds and offices.
4.2.3 OBJECTIVE OF THE AUDIT
The main objective of the audit was fulfil the commitment by MTCC-Africa to carry out an
energy for two ports in Africa where Port Douala for Level 1 Audit while the Port of
Mombasa was selected for a follow up audit (Level 2). The audits were conducted together
with IMO preferred consultants, Royal HaskoningDHV to establish energy infrastructure and
energy use at the ports, energy saving potential available, energy saving measures already
undertaken and identify areas of improvements.
The objectives of the level 2 Audit as per the Terms of Reference for Pilot Project 2 on
Uptake of Port Energy Efficient Technologies and Operations included-:

MTCC –Africa Pilot Project 1: Uptake of Port Energy Efficient Technologies and Operations
- 54 -
1. Determining which of the proposed energy saving measures have been implemented
at the Port of Mombasa.
2. Estimating the impacts of the implemented strategies on the energy consumption and
emissions at the Port of Mombasa with the assistance of an IMO consultant.
3. Identifying the energy saving measures that are yet to be implemented at the Port of
Mombasa.
4. Identifying the challenges/barriers in implementation of the proposed energy saving
measures and proposing measures that can be put in place to ensure that more energy
savings are realized.
5. Utilizing and based on the Global maritime energy efficiency partnerships
(GloMEEP) project Port Emission Toolkit, provide training on developing an
Emissions Reduction Strategy (ERS) to relevant stakeholders at the selected port(s).
4.3 AUDIT METHODOLOGY
Different techniques were used to collect information during the audit as follows-:
• Opening meeting with senior staff from selected departments at the POM including
Electrical engineering, terminal engineering and Marine operations. The audit
questionnaire earlier sent by the IMO consultants was discussed. Tasks were assigned to
the port staff with regards to submission of all the information requested by the
consultants. A similar meeting was held with senior staff at PAD where the schedule of
activities were discussed, reviewed and some verbal data received.
• Separate meetings with staff at selected relevant departments
• Request for data through email where the relevant department were addressed to provide
specific information requested especially for the department that were not represented in
the opening meeting.

MTCC –Africa Pilot Project 1: Uptake of Port Energy Efficient Technologies and Operations
- 55 -
• Site inspection at sections of the ports
• Interviews of staff at the visited sites
4.4 AUDIT FINDINGS, RECOMMENDATIONS AND CONCLUSION - POM
4.4.1 FINDINGS ON POM ENERGY AUDIT
The POM has consistently continued to implement energy saving initiatives recommended in
past energy audits. This has especially been so on the areas of replacement of existing lamps
to energy saving lights, installation of Solar power plants, replacement of old computers with
LED ones, drive to implement shore Power and implementation of ISO 14001:2015-
Environmental Management System (EMS).
The port will be undertaking the second statutory energy audit in the year 2020 in line with
the energy act 2019. According to the Act, the occupier of a building/factory shall conserve
energy, audit and analyze energy consumption in his building/factory in accordance with the
standards, criteria, and procedures as prescribed in the regulations. The act stipulates that a
person who fails to comply with the energy conservation provision commits an offence and
shall, on conviction, be liable to a fine not exceeding one million shillings, or to a maximum
term of imprisonment of one year, or to both.
Table 4.1 shows the energy saving initiatives that have been proposed for the Port of
Mombasa, the implementation status for these initiatives, the impacts of the full
implementation of the initiatives and the associated challenges with the project
implementations.

Level 2 Audit Report for the Port of Mombasa (POM)
- 56 -
TABLE 4.1 PROPOSED ENERGY SAVING INITIATIVES, INITIATIVES IMPLEMETATION STATUS, PROJECT IMPACTS AND
CHALLENGES FACING ENERGY SAVING PROJECTS IN KPA
Initiative Proposed Implementation Status Impacts Challenges
Implement Shore power
for the Port of Mombasa
Evaluation report for Tender No.
KPA/082/2018-19/EE on
Provision of shore power for ships at Berth No.
1 was held on 29th and 30th July 2019. The
project has since been awarded but awaiting
funding approval from Parent Ministry
Pilot project estimated to cost
USD.2.5Million.
1. Major challenge facing shore power
Installation is the very high installation cost
The Cost for installation of one container
berth is over USD.6.5Million.
2. Not many ships are shore power ready. There
is a likelihood of the system remaining
under-utilized for long period hence less zeal
for its installation
Installation of LED lamps
as a replacement of all the
existing less efficient
lamps
Offices have all been fitted with LED Lights.
23 out of 79 monopoles already retrofitted with
600W LED lights from the original 1000W
sodium Lamps.
A tender for retrofitting all the remaining
sodium lamps and installation of fully
compliant additional LED monopoles awarded
and ongoing
Cost of Tender No.
KPA/80/2018-19/EE for LED
Lights retrofitting on monopoles
with LED lamps already
awarded at a cost of
USD:4Million
The potential savings on
installation of LED lamps
amount to 376,382kwh
(1,355GJ) equivalent to ksh.
6,333,868 per annum
1. Full implementation is capital intensive
hence the phased approach. The last batch
already under installation
Installation of Renewable
Energy
Technology –Solar PV
Three sites of 400kW, 350KW and 300kW
already installed at the Port.
The estimated savings on Power
for the three sites is USD242,
800.The cost for the 3 sites is
roughly 3Million USD. Payback
period is 12 Years
1. The cost of implementing the 5MWpk solar
power plant is very high. Awaiting funding
from TradeMark East Africa for its execution
ISO 14001:2015-
Environmental
Management System
(EMS)
Kenya Bureau of Standards has started to
develop EMS ISO14001 and ISO 45001
Already ongoing. 17,000 Trees
planted in Mombasa and
neighboring Counties.
1. Capacity barriers and need for awareness/
training
2. More budget being sought for increased
forest cover acreage
Use of Premium Efficiency
Motors
Replacement of Standard efficiency motors with
premium efficiency type upon end of useful
time.
Installation of premium
efficiency motors would result to
a saving of 495,343 kWh
(1783GJ) per annum equivalent
1. Procuring policy favoring high efficiency
motors/equipment not yet in place
2. Award of Contracts to lowest evaluated
bidders leads to substandard products at the

Level 2 Audit Report for the Port of Mombasa (POM)
- 57 -
to Kshs 8,335,785 p.a. The
estimated investment cost is
Kshs. 21,421,162 with simple
payback period of 2.6 years.
expense of energy efficiency
Electrification of cargo
handling equipment
Not actioned yet
The actual impact needs to be
determined from power versus
fuel consumption savings study.
Social costs of carbon also need
to be established.
1. Projects like retrofiting of eRTG are capital
intensive and requires major changes on the
operation yard that would mean stoppage of
operations hence difficult to implement
Energy Saving From The
Energy Management
System
Partly implemented. Mains power supply and
feeder to main substations metered. Individual
leads still not metered
“AMPLEX
SMARTHARBOUR" system
recommended.
The Projected energy savings
amount to Kshs 6,404,298 p.a.
The estimated investment is
Kshs.17, 544, 462 with a simple
payback period of 2.7 years.
1. Project cost included in 2019/2020 FY
budget
Sensitization on
importance of Energy
Efficiency &
Management Measures
and Training on energy
Efficiency and
Management
Technologies
Process Ongoing. Energy Managers trained The computed potential savings
due to awareness training to
promote operation in energy
saving mode and switching off
computers and other office
equipment when not in use
amounts to 34,398 kWh
equivalent to Kshs. 578,860 per
annum. The estimated cost of
investments is Kshs. 300,000
leading to a payback period of
0.5 year
1. Attitude change and working patterns
affecting fast implementation
2. Quantification of results a challenge hence
difficult to convince management to
implement
3. Training budget among the key hurdles
4. Only critical trainings affecting operations
directly gets first priority in funding
Energy Efficiency in Use
Of Container Cranes
Not actioned yet RIS.GA. field tests show that
terminal operators can save up to
50% of fuel consumption during
the crane’s stand-by mode and
more than 20% fuel
consumption overall. This
produces a fast ROI, typically
one to two years (depending on
the country oil cost) and long-
1. Interparty discussions needed to implement
this initiative
2. Voiding of manufacturers’ warranty and
liability at play

Level 2 Audit Report for the Port of Mombasa (POM)
- 58 -
term savings.
Old trucks removed
from the road
Previous attempts proved not successful The projected carbon foot print
profile from port operations has
a steady incline and a lot need to
be done to reduce this trend
including implementation of the
ISO 14001:2015EMS and
banning of old polluting trucks
from accessing the Port. The
pollution by 2028 will reach
529,000tCO2 from the 2018
value of 421000tCO2 if not
implemented
• External interference a major issue.
• Truck replacement cost high hence likely of
loss of business
Use of Premium Efficiency
Motors
Replacement of Standard efficiency motors with
premium efficiency type upon end of useful
time.
Installation of premium
efficiency motors would result to
a saving of 495,343 kWh
(1783GJ) per annum equivalent
to Kshs 8,335,785 p.a. The
estimated investment cost is
Kshs. 21,421,162 with simple
payback period of 2.6 years.
• Procuring policy favoring high efficiency
motors/equipment not yet in place
Ships within port area
burning low Sulphur fuel
Implementation not yet started The Sulphur Cap 2020 will
eliminate this challenge. A total
of 6000tSO2 to be saved
• No local regulations in place to enforce
burning of low Sulphur diesel while at the
berth
•
Power Factor Correction
Already implemented. Factored in all
procurement plans
Surcharges from the utility
supplier eliminated. The
Projected energy savings due to
power factor correction amount
to ksh. 653,883 per annum. The
estimated cost of investment is
Kshs. 570,000with a simple
payback period of 0.9 year.
• No challenges. Project undertaken
Chiller Improvement All 5 chiller plants at the Authority Headquarter
replaced with New energy efficient ones with
With the new chillers, the
projected energy savings due to • 2 Port Police Chillers awaiting budget for
replacement

Level 2 Audit Report for the Port of Mombasa (POM)
- 59 -
environmentally friendly refrigerant
All split units use user friendly refrigerant R401
chiller improvements amount to
173,991 kWh equivalent to Kshs
2,927,970 p.a. The estimated
investment cost is
Kshs.8,000,000 with a simple
payback period of 2.6 years
Savings on use of
aircosavers on air
conditioners
Aircosavers installed on pilot project basis on
some split units. Full retrofitting on all ACs not
yet done
Upon installation of Aircosavers
savings to the tune of 176,470
kWh per annum which is
equivalent to Kshs. 2,969,693
per annum can be realised. With
the estimated cost of investment
being Kshs.1,584,000, the
simple payback period is
calculated as 0.5 year for this
project
1. Budget for Aircosaver Implementation not
yet set aside

MTCC Africa Draft Report on Previous Audits Done for The Port of Mombasa and an Analysis of
the Proposed Recommendations on Energy Efficiency and Emissions Reduction Strategies
- 60 -
4.5 RECOMMENDATIONS FOR THE POM
This audit recommends that the port should continue with the implementation of energy
saving projects as recommended by various audit reports.
Key among the projects that the Port is recommend to undertake in order of priority include-:
1. Finalize on the implementation of pilot project on shore power at berth No.1.
2. Implement the Solar PV arrays project for the 5MWpK project recommended in the
2017 RHDHV design study.
3. Complete the programme of Yard Lighting upgrades on LED Lamps
4. Undertake a study to determine how the dirty cargo can be handled efficiently and
with little pollution especially on Particulate matter at the New Service Area.
5. Develop and implement a programme of studies to determine the extent to which
vehicles and cargo handling plant within the Port of Mombasa could be electrified.
4.6 CONCLUSIONS ON POM AUDIT
Based on Level 2 energy audit findings, it is clear that the port of Mombasa has implemented
a number of the recommendations focusing on energy efficiency and control of emissions.
This is partly because of the statutory requirements as per the Energy Act 2019 and partly
because of own initiatives based on efforts to implement the green Port Policy. However, a
lot needs to be done to achieve the desired objectives and to integrate sustainability into port
operations and development.
Three projects have been implemented based on the recommendations that is; installation of
400kWpk Grid Tie solar Power plant, LED lights, power-factor correction and tree planting
which contributes to a national drive by the government to attain a 10% forest cover by 2022.
Other phases of some of the projects are ongoing. The projects that are in the process of
implementations include installation of 350kWpk Grid Tie solar Power plant, development of
ISO 14001 and ISO 45001 and installation of a 2000kVA, 60hz,6.6kV shore power at Berth
No.1.
There are however other flagship projects that the port should have started due to the
importance attached to their outcomes. Key among these are the installation of the Energy
Management system (EMS) which is set for budgeting in the 2020/2021 financial year. This
project will be a milestone in analyzing the energy flow to the different functional areas of

MTCC Africa Draft Report on Previous Audits Done for The Port of Mombasa and an Analysis of
the Proposed Recommendations on Energy Efficiency and Emissions Reduction Strategies
- 61 -
the port with the aim of energy saving by controlling and containing any power wastages that
may be found from analysis of the PMS outcomes.
The Port should also be keen on implementing the Star Rating Procurement Policy to ensure
that only high energy saving equipment are procured by the authority. Other projects that
need urgent attention include implementation of policies to ensure that Ships within port area
burn only low Sulphur fuels, Use of Premium Efficiency Motors Old, development of
policies to ensure that old and polluting trucks are removed from Port precincts, Sensitization
on importance of Energy Efficiency & Management Measures and Electrification of cargo
handling equipment.
4.7 AUDIT FINDINGS, RECOMMENDATIONS AND CONCLUSION – PAD
4.7.1 ELECTRICAL DISTRIBUTION SYSTEM
PAD is supplied by the Utility Company ENEO from 11 substations distributed along the
port area. The substations are supplied at 415V and due to the Port equipment rating of 380V,
the power is taken through a transformation process to achieve 380V. This results in
unnecessary no load losses of around 1.5% as a result of hysteresis and eddy current losses.
In addition, there is no monitoring system for the billing system that the port can use to
crosscheck the readings submitted for payments by the utility supplier. This has had the
impact of irregular and high readings and surcharges to the port that it cannot cross check.
The Substations themselves are not interlinked and therefore there is no redundancy as a
result of spur operations of the substations from the utility supplier. The low supply voltage is
also susceptible to frequent outages as a result of sharing with all customers around the port
hence being affected by operations of immediate neighbors such as voltage swings as a
results on starting of large motors from the neighboring firms.
MTCC Africa Draft Report on Previous Audits Done for The Port of Mombasa and an Analysis of
the Proposed Recommendations on Energy Efficiency and Emissions Reduction Strategies
- 62 -
4.7.1.1 Recommendation on the Current Electrical Distribution System
NEO Cameroun S.A. currently operates three independent transmission and distribution
networks in Cameroon-:
• The Southern Interconnected Grid (RIS): 225 kV network connecting the major
hydropower stations (Edea and Song Loulou) and 6 main thermal power plants to
supply the main consumption areas around Yaoundé (90% consumption).
• The Northern Interconnected Grid (RIN): 110 kV and 90 kV structure dispatching the
power generated by Lagdo power station sufficient to cover the region’s modest
demand.
• The Eastern Isolated Grid (RIE): low voltage distribution grid of 30 kV, supplied
mainly by isolated diesel power plants with the capacity of ~43 MW.
Being a strategic asset, The PAD should invest in a new main substation supplied at high
voltage and tapped from the national grid at levels of either 225kV or 110kV.This substation
should then supply the other smaller substations that could be located at the positions of the
current substations for ease of upgrading from one system to the other. The reticulation
system can be done at 11kV or 33kV and then transformed to the equipment voltage of 380V
at the various substations. Alternatively, the Port could also upgrade the equipment to modern
ones at voltages of 400/415V progressively as it phases out the old system. The substations
should be connected to each other via several loops to ensure redundancy of supply in case of
faults and outages in some of the substations. A second incomer station, capable of carrying
the whole Port load should also be envisaged and included in the power modernization
program.
The port should also invest in a power management system to ensure that its consumption
patterns and levels are well monitored and analyzed.

MTCC Africa Draft Report on Previous Audits Done for The Port of Mombasa and an Analysis of
the Proposed Recommendations on Energy Efficiency and Emissions Reduction Strategies
- 63 -
Smart meters and energy management software should be installed at the main substation and
in each of the other 11substations to monitor energy consumption by the following units on
real time basis: substations, workshops, office blocks, electrically driven cranes, ‘reefer’
containers power supply system and the yard lighting. This power management system
would also be instrumental in monitoring of Power Factor values to avoid unnecessary
surcharges by ENEO.
The key benefit of the proposed energy management system is to facilitate timely response
for corrective action to promote energy efficiency and power management controls.
4.7.2 EQUIPMENT ENERGY SUPPLY
All Quay side and yard equipment are all diesel driven including the STS, HMC and RTGs.
The reefer points at the container terminal are partly electric and partly generator supplied.
This has a lot of impact on environmental pollution as the generators have to run
continuously to supply the loads. The disadvantage with this is high fuel consumption, low
efficiency especially when idling and high wear and tear as a result of the continuous
running.
4.7.2.1 Recommendation on the Equipment Energy Supply
The PAD should invest in supplying power to all quay and yard equipment. The port should
start with electrification of STS and Reefer points then progressively invest in powering the
HMCs and establishment of eRTGs.
In the meantime, before this is done, the container terminal should consider Installation of the
RIS-GA system to monitor and control the running of diesel generators in the reefer points,
STS, MHC and RTG cranes. This system reduces the speed of the diesel generator during the
crane’s stand-by mode and typically reduces total fuel consumption by 20%. By so doing, a
lot of savings on fuel, maintenance and emissions can be achieved.

MTCC Africa Draft Report on Previous Audits Done for The Port of Mombasa and an Analysis of
the Proposed Recommendations on Energy Efficiency and Emissions Reduction Strategies
- 64 -
4.7.3 PAD MASTER PLAN
PAD has developed a port master plan which contains major port infrastructure
improvements at the port up to the years 2050. The masterplan includes building of new
container yards, New quays and terminals, modern office blocks and additional maintenance
workshop. The master has however not incorporated energy management aspects and Eco-
friendly infrastructure in its designs
4.7.3.1 Recommendation on the Port Masterplan
Being at design stage, it is important for PAD to include energy efficiency measures in all
projects and in particular use of renewable energy and energy saving techniques in all
planned infrastructure. Back bone infrastructure for facilities like shore power, ERTGs,
renewable energy connection sites, power duct to all quay equipment and reforestation
programs should be included in the designs and initial civil works.
4.7.4 RENEWABLE ENERGY USE.
The PAD is considering demolition and renovation of old sheds in the Port yards. The plans
for this exercise are underway and a large surface area will be availed in terms of roof
surface.
4.7.4.1 Recommendation on Renewable Energy Use
The renovation of the roofs provides a perfect timing for the installation of solar power
plants. It is advisable to make use of a renewable energy source as a supplement to the
current power sources most of which are diesel driven generators. This will reduce
greenhouse gas emissions and contribute to mitigation of climate change.
Being large surface areas, the energy potential for solar placed on the roofs is enough to
power operations not only in the shed themselves, but also supply power to other port areas.
PAD should consider including solar power plants on the roofs of the shed as part of the
deliverables of the projects.
MTCC Africa Draft Report on Previous Audits Done for The Port of Mombasa and an Analysis of
the Proposed Recommendations on Energy Efficiency and Emissions Reduction Strategies
- 65 -
4.7.5 PORT LIGHTING STATUS
The port has monopoles all installed with the 1000W Mercury lamps. Several areas of the
port offices are still supplied with the fluorescent tubes and energy saving bulbs. The
workshops do not have skylights and thus do not allow the facility to take full advantage of
natural lighting. This leads to use of artificial lights in several places especially workshops
during the day.
4.7.5.1 Recommendation on Renewable Energy Use
It is highly recommended that the PAD takes advantage of the long life and energy saving
nature of the LED Lights. The 1000W mercury bulbs should be replaced/ retrofitted with
either the 400W or 600W LED floodlights. This report therefore recommends as follows-:
• Installation of LED lamps as a replacement of all the existing less efficient la
mps as shown in the Port
• Replace electromagnetic ballasts with electronic type.
• Replace basic T8 fluorescent tubes with standard OSRAM T5 tubes
• Use of skylights to facilitate use of natural lights during the day:
4.7.6 AIR-CONDITIONING OF OFFICE BLOCKS
The PAD main office is air-conditioned by use of split units installed all along the office
walls. Being a large office block, a lot of energy is required as a result of the large numbers
of the units installed and the efficiency of the high numbers.
4.7.6.1 Recommendation on Air Conditioning
It is highly recommended that the PAD installs a central cooling system for the office block.
This will reduce dramatically the cooling power requirements. The outdoor units on the
clocks will also be removed making the office block to be presentable. A chiller system for
the block is advisable the coefficient of performance of the compared to a new chiller at an
average 3.3 is very good and all new chillers come with environmentally friendly
refrigerants.

MTCC Africa Draft Report on Previous Audits Done for The Port of Mombasa and an Analysis of
the Proposed Recommendations on Energy Efficiency and Emissions Reduction Strategies
- 66 -
The other offices can have their ACs installed with Aircosavers while the port establishes a
policy to procure window and split air conditioners that meet the minimum energy
performance standards in Cameroon.
4.8. TRAINING ON GLOMEEP
The IMO consultants conducted the training and awareness sessions on GloMEEP for both
the MTCC Africa Staff, Kenya Ports Authority Staff and the Port Authority of Douala Staff
at the Port of Douala. MTCC Africa staff comprised of the Energy efficiency experts and the
Project Head (PH) while PAD staff were mainly drawn from engineering and environment
department staff. The training focused Port energy efficiency in terms less demand for
energy, use of cleaner energy sources, cleaner fuels and generation of renewable energy.
Several technologies available to achieve energy efficiency at port were presented and
discussed.
The consultant gave practical examples of implemented projects at the Port of Mombasa,
Kenya especially on solar power generation. The session was quite participatory especially
the question and answer session.
During the training, the team was briefed on documents detailing the first environmental
audit undertaken for the Port Douala with a section on status on energy management and
improvement areas.
4.9 RECOMMEDATIONS AND CONCLUSION FOR THE PAD AUDIT
The main concern for the port of Douala in terms of energy saving is the power reticulation
network. Supplied on low voltage, the port misses out on improved tariffs associated with
large power consumers, gets frequent interruptions as a result of the operations of nearby
clients and suffers power distribution losses as a result of high i2r losses associated with low
voltage supply. The power supply and reticulation network upgrade for the port is therefore
of utmost necessity if any power saving initiatives are to be implemented.

MTCC Africa Draft Report on Previous Audits Done for The Port of Mombasa and an Analysis of
the Proposed Recommendations on Energy Efficiency and Emissions Reduction Strategies
- 67 -
Powering of port equipment especially quay side gantry cranes and the reefer points with
diesel run engines is also an issue that demands for immediate action. The issue of frequent
voltage fluctuations as the reason for running on Diesel engines should be sorted by tapping
high on the power grid. It’s therefore imperative that these two programs should run together.
The masterplan presents a very important opportunity for PAD to be green. Backbone
Infrastructure for ecofriendly and green port should be put in place at the design stage and
implemented from the onset to achieve a very low-cost implementation of the suggested
initiatives compared to having to retrofit them on completed infrastructure.
5.0 REPORT CONCLUSION
Based on analysis of previous energy audit reports and the energy audits carried out in the
two ports, the following conclusions have been drawn-:
The solar power generation potential in Africa is quite high. Kenya and the surrounding
countries for example have solar irradiation of approximately 2200kWh per m2 per year.
Maximizing and optimally utilizing this potential can result in great savings in carbon
footprint and stabilization of the power supply systems for the African Ports. Some ports are
already taking advantage of this natural asset and have installed grid tied mini solar grids to
supplement the local utility supplies.
On 1 January 2020 the UN IMO global Sulphur cap 2020 took full effect and will be strictly
enforced by the world’s Port State Control authorities. This requires all ships to use fuels with
Sulphur content values of less than 0.05% while staying in Ports. These requirements all the
more makes the implementation of shore power for visiting vessels very attractive. In
addition, studies have confirmed that with a clean electricity mix coupled with installation of
solar power plants in ports makes the shore power implementation very viable considering
environmental benefits. Shore power systems for small crafts which are comparatively less

MTCC Africa Draft Report on Previous Audits Done for The Port of Mombasa and an Analysis of
the Proposed Recommendations on Energy Efficiency and Emissions Reduction Strategies
- 68 -
expensive cost-wise have been touted as having great environmental benefits in terms of
savings in carbon footprint and the best starting points for implementation of shore power.
The coastal zones of most African ports are prone to high temperature and humidity. These
two attributes make office cooling the African ports a necessity. Air conditioning is one of
the main power consumers in most of the ports and therefore the use of highly efficient AC
systems with environmentally friendly refrigerants such as R401A and R 410A to mitigate
climate change cannot be over emphasized. Also, paramount is the prioritization of the use of
AirCo-Savers on the window type and split unit ACs to optimize on energy consumption.
As was witnessed with the Port Authority of Douala, some ports in Africa still use fossil fuels
to power their operations. These ports use diesel generators to run their gantry cranes and
cool their reefer containers. This situation is highly polluting and expensive. Investing in
electrical power systems with strong and robust distribution infrastructure with redundancy
systems and with power supply tapped high on the countries’ grid would ensure clean
operations, reliable supply to the ports and conducive work environment. These ports also
need to invest in Power Management Systems (PMS), SCADA Systems and Power factor
Correction Banks (PFCBs) in tandem to avoid surcharges from the respective utility
suppliers.
Policies such as implementation of ISO 14001:2015, the Star Rating Policy and use of
premium efficiency motors not only help in reduction of GHG gases but also greatly impacts
on cost control improvements. Implementation of ISO14001:2015 for example helps in not
only improving a firms’ image and credibility internationally as customers are getting
increasingly concerned about the environmental practices of the companies that produce the
services/products they consume but also ensures high rate of success when implementing
changes and enables quick improvement of the process.

MTCC Africa Draft Report on Previous Audits Done for The Port of Mombasa and an Analysis of
the Proposed Recommendations on Energy Efficiency and Emissions Reduction Strategies
- 69 -
In conclusion, while acknowledging the great disparity between the two ports surveyed in
terms of the strides made in reducing carbon footprint, the survey observed that the great
need for MTCC-Africa to make follow-up on the measures and recommendations proposed to
the ports visited. It would also be imperative for the IMO and the GMN to consider how to
sustainably run these centres of excellence in order to continue promoting energy efficient
technologies and operations and to realize the goal of capacity building for climate change
mitigation in the maritime shipping industry by reaching out to the other ports that are yet to
be covered by the past initiatives.

MTCC Africa Draft Report on Previous Audits Done for The Port of Mombasa and an Analysis of
the Proposed Recommendations on Energy Efficiency and Emissions Reduction Strategies
- 70 -
6.0 REFERENCES
EMS Consultants Ltd, “A Report on an Investment Grade Energy Audit Conducted at Kenya
Ports Authority, Mombasa” (2015). Kenya Ports Authority; Mombasa
Kidere, M. (2017). "Analytical assessment of port energy efficiency and management.: a
case study of the Kenya Ports Authority". World Maritime University Dissertations. 585.
http://commons.wmu.se/all_dissertations/585
Mulwa, D.(2013). "Monetary and ecological cost-benefit analysis of onshore power supply: a
case study of the port of Mombasa" (2013). World Maritime University Dissertations. 219.
http://commons.wmu.se/all_dissertations/21
RoyalhaskoningDHV and Howard Humphreys, “Consultancy Services for the Proposed
Study of Energy Needs, Alternative Energy Sources and Provision of Shore Power (Cold
Ironing) for the Port of Mombasa” (2017). Kenya Ports Authority; Mombasa
The Cornell Group, “Development of a Green Port Policy and implementation plan” (2014).
Kenya Ports Authority; Mombasa