Marine Water Quality Dashboard - Bureau of · PDF fileMarine Water Quality Dashboard Timely...
2
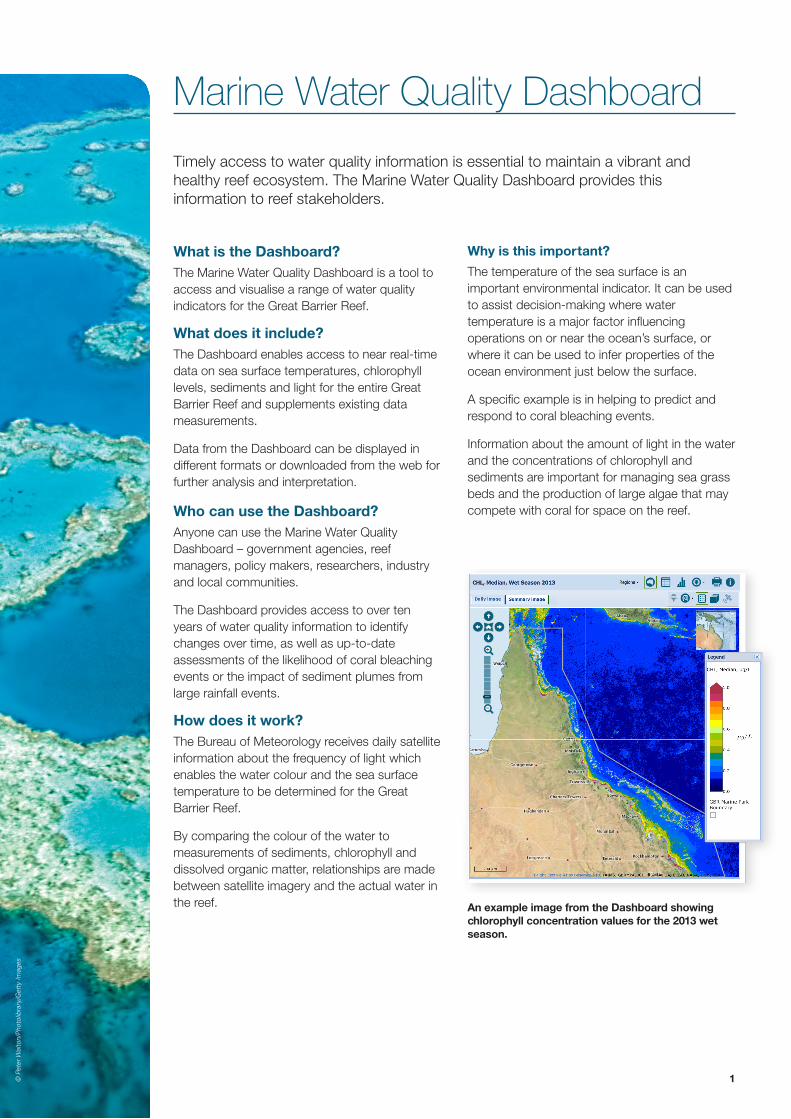
© Peter Walton/Photolibrary/Getty Images 1 Marine Water Quality Dashboard Timelyaccesstowaterqualityinformationisessentialtomaintainavibrantand healthyreefecosystem.TheMarineWaterQualityDashboardprovidesthis informationtoreefstakeholders. What is the Dashboard? TheMarineWaterQualityDashboardisatoolto accessandvisualisearangeofwaterquality indicatorsfortheGreatBarrierReef. What does it include? TheDashboardenablesaccesstonearreal-time dataonseasurfacetemperatures,chlorophyll levels,sedimentsandlightfortheentireGreat BarrierReefandsupplementsexistingdata measurements. DatafromtheDashboardcanbedisplayedin differentformatsordownloadedfromthewebfor furtheranalysisandinterpretation. Who can use the Dashboard? AnyonecanusetheMarineWaterQuality Dashboard–governmentagencies,reef managers,policymakers,researchers,industry andlocalcommunities. TheDashboardprovidesaccesstooverten yearsofwaterqualityinformationtoidentify changesovertime,aswellasup-to-date assessmentsofthelikelihoodofcoralbleaching eventsortheimpactofsedimentplumesfrom largerainfallevents. How does it work? TheBureauofMeteorologyreceivesdailysatellite informationaboutthefrequencyoflightwhich enablesthewatercolourandtheseasurface temperaturetobedeterminedfortheGreat BarrierReef. Bycomparingthecolourofthewaterto measurementsofsediments,chlorophylland dissolvedorganicmatter,relationshipsaremade betweensatelliteimageryandtheactualwaterin thereef. Why is this important? Thetemperatureoftheseasurfaceisan importantenvironmentalindicator.Itcanbeused toassistdecision-makingwherewater temperatureisamajorfactorinfluencing operationsonorneartheocean’ssurface,or whereitcanbeusedtoinferpropertiesofthe oceanenvironmentjustbelowthesurface. Aspecificexampleisinhelpingtopredictand respondtocoralbleachingevents. Informationabouttheamountoflightinthewater andtheconcentrationsofchlorophylland sedimentsareimportantformanagingseagrass bedsandtheproductionoflargealgaethatmay competewithcoralforspaceonthereef. An example image from the Dashboard showing chlorophyll concentration values for the 2013 wet season.
Transcript of Marine Water Quality Dashboard - Bureau of · PDF fileMarine Water Quality Dashboard Timely...
© P
eter
Wal
ton/
Pho
tolib
rary
/Get
ty Im
ages
� 1
Marine Water Quality Dashboard
Timely�access�to�water�quality�information�is�essential�to�maintain�a�vibrant�and�healthy�reef�ecosystem.�The�Marine�Water�Quality�Dashboard�provides�this�information�to�reef�stakeholders.
What is the Dashboard?The�Marine�Water�Quality�Dashboard�is�a�tool�to�access�and�visualise�a�range�of�water�quality�indicators�for�the�Great�Barrier�Reef.�
What does it include?The�Dashboard�enables�access�to�near�real-time�data�on�sea�surface�temperatures,�chlorophyll�levels,�sediments�and�light�for�the�entire�Great�Barrier�Reef�and�supplements�existing�data�measurements.�
Data�from�the�Dashboard�can�be�displayed�in�different�formats�or�downloaded�from�the�web�for�further�analysis�and�interpretation.
Who can use the Dashboard?Anyone�can�use�the�Marine�Water�Quality�Dashboard�–�government�agencies,�reef�managers,�policy�makers,�researchers,�industry�and�local�communities.
The�Dashboard�provides�access�to�over�ten�years�of�water�quality�information�to�identify�changes�over�time,�as�well�as�up-to-date�assessments�of�the�likelihood�of�coral�bleaching�events�or�the�impact�of�sediment�plumes�from�large�rainfall�events.
How does it work?The�Bureau�of�Meteorology�receives�daily�satellite�information�about�the�frequency�of�light�which�enables�the�water�colour�and�the�sea�surface�temperature�to�be�determined�for�the�Great�Barrier�Reef.��
By�comparing�the�colour�of�the�water�to�measurements�of�sediments,�chlorophyll�and�dissolved�organic�matter,�relationships�are�made�between�satellite�imagery�and�the�actual�water�in�the�reef.�
Why is this important?The�temperature�of�the�sea�surface�is�an�important�environmental�indicator.�It�can�be�used�to�assist�decision-making�where�water�temperature�is�a�major�factor�influencing�operations�on�or�near�the�ocean’s�surface,�or�where�it�can�be�used�to�infer�properties�of�the�ocean�environment�just�below�the�surface.
A�specific�example�is�in�helping�to�predict�and�respond�to�coral�bleaching�events.
Information�about�the�amount�of�light�in�the�water�and�the�concentrations�of�chlorophyll�and�sediments�are�important�for�managing�sea�grass�beds�and�the�production�of�large�algae�that�may�compete�with�coral�for�space�on�the�reef.
An example image from the Dashboard showing chlorophyll concentration values for the 2013 wet season.
©�Commonwealth�of�Australia,�October�2014� 2
A collaborative projectThe�Dashboard�has�been�developed�through�collaboration�between�the�Australian�Institute�of�Marine�Science,�Bureau�of�Meteorology,�CSIRO,�Great�Barrier�Reef�Foundation�and�the�Queensland�Government.�
The�Dashboard�is�delivered�as�part�of�eReefs,�a�project�that�is�contributing�to�the�sustainability�of�the�Great�Barrier�Reef.�eReefs�commenced�in�
January�2012�and�forms�a�significant�step�in�building�a�comprehensive�coastal�information�system�for�Australia.
For more informationFor�further�information�about�the�Marine�Water�Quality�Dashboard,�visit:www.bom.gov.au/marinewaterquality/�or�contact�[email protected]
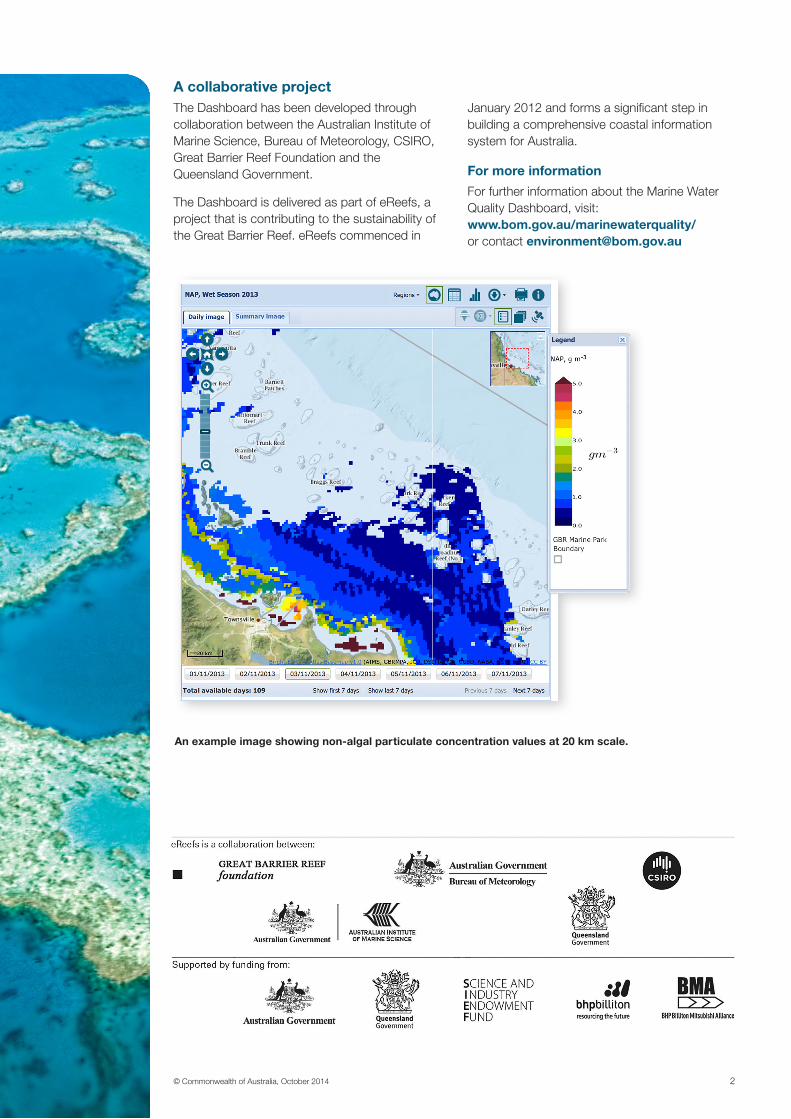
An example image showing non-algal particulate concentration values at 20 km scale.