
Marine toxins in bivalves: accumulation, kinetics and ... · Marine toxins in bivalves:...
201
Dezembro, 2014 Maria João Vieira Botelho Henriques Licenciada em Engenharia Química, ramo Química Aplicada, Mestre em Engenharia Química Marine toxins in bivalves: accumulation, kinetics and subcellular responses Dissertação para obtenção do Grau de Doutor em Ambiente Orientador: Doutor Carlos Alberto Garcia do Vale, Investigador Coordenador, Instituto Português do Mar e da Atmosfera Co-orientador: Prof. Doutor João Pedro Salgueiro Gomes Ferreira, Professor Associado com Agregação, Faculdade de Ciências e Tecnologia da Universidade Nova de Lisboa Júri: Presidente: Prof. Doutora Maria Paula Baptista da Costa Antunes Arguentes: Prof. Doutora Patricia M. Glibert Prof. Doutora Lúcia Maria das Candeias Guilhermino Vogais: Prof. Doutora Ana Gago-Martínez Prof. Doutora Maria Helena Ferrão Ribeiro da Costa
Transcript of Marine toxins in bivalves: accumulation, kinetics and ... · Marine toxins in bivalves:...

Dezembro, 2014
Maria João Vieira Botelho Henriques
Licenciada em Engenharia Química, ramo Química Aplicada, Mestre em Engenharia Química
Marine toxins in bivalves:
accumulation, kinetics and subcellular responses
Dissertação para obtenção do Grau de Doutor em
Ambiente
Orientador: Doutor Carlos Alberto Garcia do Vale, Investigador Coordenador, Instituto Português do Mar e da Atmosfera
Co-orientador: Prof. Doutor João Pedro Salgueiro Gomes Ferreira, Professor Associado com Agregação, Faculdade de Ciências e Tecnologia da Universidade Nova de Lisboa Júri: Presidente: Prof. Doutora Maria Paula Baptista da Costa Antunes Arguentes: Prof. Doutora Patricia M. Glibert Prof. Doutora Lúcia Maria das Candeias Guilhermino Vogais: Prof. Doutora Ana Gago-Martínez Prof. Doutora Maria Helena Ferrão Ribeiro da Costa

ii

iii
Marine toxins in bivalves: accumulation, kinetics and subcellular responses
Copyright © Maria João Vieira Botelho Henriques, Faculdade de Ciências e Tecnologia,
Universidade Nova de Lisboa.
A Faculdade de Ciências e Tecnologia e a Universidade Nova de Lisboa têm o direito, perpétuo
e sem limites geográficos, de arquivar e publicar esta dissertação através de exemplares
impressos reproduzidos em papel ou de forma digital, ou por qualquer outro meio conhecido
ou que venha a ser inventado, e de a divulgar através de repositórios científicos e de admitir a
sua cópia e distribuição com objectivos educacionais ou de investigação, não comerciais, desde
que seja dado crédito ao autor e editor. Os direitos de cópia dos artigos apresentados nesta
dissertação foram transferidos para editoras e estes artigos são reproduzidos sob permissão
dos editores originais e sujeitos às restrições de cópia impostos pelos mesmos.

iv

v
“It is good to have an end to journey toward; but it is the journey that matters,
in the end.”―Ernest Hemingway
To my Grandparents
Luzinha and Álvaro

vi

vii
Preface
This dissertation is submitted as partial fulfillment of the requirements for the Doctoral Degree
in Environmental Sciences and includes the results of my PhD study carried out from
September 2010 to August of 2014 in the Faculty of Sciences and Technology, New University
of Lisbon and in the Portuguese Institute of Sea and Atmosphere, Division of Environmental
Oceanography and Bioprospection.
I hereby declare that, as the first author of four manuscripts, I provided the major contribution
to the research and experimental work developed, to the interpretation of results, and to the
preparation of the manuscripts submitted during the PhD study. Also a relevant contribution
was given in an article where I appear as second author. The copyright of the publications was
transferred to the publishers, and these articles are reproduced with their permission and
subject to copyright restrictions imposed by them.

viii

ix
Acknowledgments
I am deeply grateful to Carlos Vale for welcoming me into his research group, for his
encouragement, friendship, knowledge and guidance necessary to complete this thesis.
Gratitude is also expressed to Professor João Gomes Ferreira for his support, for providing
insightful comments and ideas. The DivOA at the Portuguese Institute of Sea and Atmosphere
provided the conditions needed for my research. I thank also to the Faculdade de Ciências e
Tecnologia da Universidade Nova de Lisboa.
I would like to thank to my colleagues Joana and Patricia for sharing their experience and
knowledge and friendship, Susana, Paulo and Pedro for sharing historical data and long
companionship in the laboratory work, and Sandra Joaquim, Domitília Matias and Rui Silva for
support on experimental work. My gratitude is also extended to my colleagues from the
Laboratory of Contaminants and Laboratory of Marine Toxins for their help and support during
this period.
Gratitude is due to my parents, Pedro and Francisco for their continuous support and
encouragement. I also thank to my friends for their support, particularly in the final stages of
this PhD.
This work has received financial support from the projects Quasus (Environmental quality and
sustainability of biologic resources in Ria Formosa) and Forward (Framework for Ria Formosa
water quality, aquaculture, and resource development) financed by Sociedade Polis Litoral Ria
Formosa, and the project Toxigest (Effect of toxic compounds in the conservation and
management of fishery resources) financed by PROMAR (2007-2013).

x

xi
Abstract
Toxicity of bivalves by paralytic shellfish toxins is a worldwide problem, with severe effects in
humans, and in production and harvest of bivalves. To address this issue several studies have
been performed in this thesis. Laboratory experiments with the clam Ruditapes decussatus fed
with Gymnodinium catenatum cells allowed an estimate of uptake and depuration rates of
individual paralytic shellfish toxins. Approximately 95% of C1+2 and 85% of B1, the major
toxins produced by G. catenatum cells supplied to the clams, were converted into other toxins
or lost in solution. An example is dcSTX, the only toxin quantified in feaces produced by clams.
Studies on the nutrient pool, phytoplankton assemblages, and mussel toxicity in a eutrophic
coastal lagoon and adjacent coastal area displaying frequent upwelling episodes and bivalve
toxicity pointed to longer and more acute bivalve toxicity episodes in the lagoon. This was
interpreted as the effect of changes in the nutrient pool, promoting the abundance of toxic
cells imported from the coastal water. The partitioning of toxins among sub-cellular fractions in
digestive glands of cockles (Cerastoderma edule) exposed to a G. catenatum bloom and under
post-bloom conditions indicated changes of organelle toxin profiles after exposure, despite
high affinity of toxins to the insoluble cellular fraction. A review of the toxicity caused by G.
catenatum in mussels (Mytilus spp.), cockles (C. edule), wedge clams (Donax trunculus) and
surf clams (Spisula solida) from the Portuguese areas was executed for the period 1994-2012.
An irregular multi-annual variation of toxicity episodes was registered, including a prolonged
period (1996-2004) of low toxicity by PSTs. In other years, a seasonal signal was found in
autumn/early winter. Connectivity of toxicity episodes among three estuarine systems, and
between a coastal lagoon and the adjacent coastal area, was identified. Toxin profiles in 405
composite samples of mussels, cockles, wedge clams and surf clams pointed to changes
between bivalves of low and high toxicity, mirroring toxin biotransformation after blooms.
Biotransformation seems to be faster in S. solida due to the prevalence of decarbamoyl
derivates independently of the toxicity value. Keywords: Paralytic shellfish toxins; Bivalves;
Kinetics; Subcellular partitioning; Biotransformation

xii

xiii
Resumo
A toxicidade em bivalves devido a toxinas marinhas paralisantes é um problema mundial, com
efeitos severos no Homem e na produção e apanha de bivalves. De modo a aprofundar esta
temática foram realizados vários estudos. Os estudos em laboratório com fornecimento de
células de Gymnodinium catenatum a amêijoas (Ruditapes decussatus) permitiram estimar
taxas de captação e depuração de toxinas marinhas paralisantes. Aproximadamente 95% de
C1+2 e 85% de B1, as toxinas maioritárias produzidas pela alga tóxica, foram convertidas em
outras toxinas ou perdidas em solução. A toxina dcSTX é um exemplo, tendo sido a única toxina
quantificada nas fezes produzidas pelas amêijoas. Os estudos sobre nutrientes, espécies de
fitoplâncton e toxicidade em mexilhões, provenientes de uma lagoa eutrófica costeira e da
zona costeira adjacente, apontaram para a ocorrência de episódios mais intensos e
prolongados na lagoa. Estas ocorrências foram interpretadas como o efeito das alterações nas
razões de nutrientes promovendo a abundância de células tóxicas importadas da zona costeira.
A partição de toxinas nas frações sub-celulares das glândulas digestivas do berbigão
Cerastoderma edule exposto a um florescimento de G. catenatum e sob condições de
pós-florescimento, indicaram a alteração dos perfis de toxinas nos organelos após a exposição,
apesar da elevada afinidade para a fração insolúvel. Foi realizada uma revisão dos dados de
toxicidade paralisante (1994-2012) em mexilhão (Mytilus spp.), berbigão (C. edule), conquilha
(Donax trunculus) e amêijoa-branca (Spisula solida) da costa portuguesa, tendo-se verificado
uma variação plurianual dos episódios, com picos no outono/início de inverno, incluindo um
período prolongado (1996-2004) de reduzida toxicidade. Foi identificada conectividade de
episódios entre três sistemas estuarinos e entre uma lagoa costeira e zona costeira adjacente.
Os perfis de toxinas em 405 amostras de mexilhão, berbigão, conquilha e amêijoa-branca
apresentaram diferenças entre amostras de toxicidade reduzida e elevada, refletindo a
biotransformação de toxinas após os florescimentos. Esta biotransformação aparenta ser mais
rápida na S. solida devido à prevalência dos compostos decarbamoilados independentemente
do valor de toxicidade. Palavras-chave: Toxinas marinhas paralisantes; Bivalves; Cinética;
Partição-subcelular; Biotransformação

xiv

xv
Contents
1. Introduction 1
1.1. Marine toxins 1
1.2. Paralytic shellfish toxins (PSTs) 4
1.2.1. Chemical structures 4
1.2.2. Properties 7
1.2.3. Mechanism of toxicity 8
1.2.4. PST-producing species and their geographic distributions 8
1.2.5. Toxin composition and environmental conditions 10
1.2.6. Marine organisms sensitive to PSTs 10
1.3. Bioaccumulation processes 11
1.3.1. Uptake of PSTs 12
1.3.2. Biotransformation of PSTs 14
1.3.3. Elimination of PSTs 15
1.3.4. Responses at organism level to accumulated toxins 16
1.4. Effects of ingested PSTs on humans 17
1.5. Monitoring of toxin-producing species and bivalve toxicity 18
1.5.1 Design of monitoring programmes 18
1.5.2. Closure of legal harvest of bivalves 19
1.6. Economic impact of PSTs 20
1.7. The Portuguese situation 20
1.8. Motivation and objectives 21
1.9. Dissertation outline and content 22
2. Methodologies 25
2.1. Algal cultures 25
2.1.1. Gymnodinium catenatum 25
2.1.2. Isochrysis galbana 25
2.2. Collection and processing of samples 26
2.2.1. Algal culture 26
xvi
2.2.2. Seawater 26
2.2.3. Particulate organic matter 26
2.2.4. Bivalves 27
2.2.5. Sub-cellular fractionation of digestive glands 27
2.3. Phytoplakton and nutrients 28
2.3.1. Phytoplankton 28
2.3.2. Water quality and nutrients 28
2.4. Paralytic shellfish toxins 29
2.4.1. Chemical methodologies for PSTs 29
2.4.2. Toxin extraction, cleanup and oxidation 30
2.4.3. Liquid chromatography analysis 32
2.4.4. Identification and quantification of PSTs 33
2.4.5. Estimation of B2 concentration 36
2.4.6. Certified reference materials 37
2.4.7. Performance and quality control 37
3. Uptake and release of paralytic shellfish toxins by the clam Ruditapes decussatus exposed to Gymnodinium catenatum and subsequent depuration 39
Abstract 40
3.1. Introduction 40
3.2. Material and Methods 42
3.2.1. Algal culture 42
3.2.2. Clams 42
3.2.3. Feeding experiment 42
3.2.4. Samples 43
3.2.5. Reagents 44
3.2.6. Toxin extraction and oxidation 44
3.2.7. LC-FLD analysis 45
3.2.8. Quality control 45
3.2.9. Mass balance calculation 46
3.2.10. Statistical analysis 47

xvii
3.3. Results 47
3.3.1. Toxin profile of Gymnodinium catenatum 47
3.3.2. Toxin concentrations in Ruditapes decussatus 47
3.3.3. Best-fitting curves 49
3.3.4. Toxin composition of particulate organic matter 49
3.3.5. Mass balance calculation 51
3.4. Discussion 52
3.4.1. Conversion of toxins assimilated by clams into decarbamoyl toxins 52
3.4.2. Elimination of dcSTX through clam faeces/pseudo-faeces 55
3.5. Conclusion 56
Acknowledgments 57
4. Winter-summer nutrient composition linkage to algae-produced toxins in shellfish at a eutrophic coastal lagoon (Óbidos lagoon, Portugal) 59
Highlights 59
Abstract 60
4.1. Introduction 61
4.2. Materials and Methods 62
4.2.1. The Óbidos lagoon study area 62
4.2.2. Sampling 64
4.2.3. Chemical analysis and phytoplankton 65
4.2.4. Data analyses 66
4.3. Results 66
4.3.1. Physicochemical characteristics 66
4.3.2. Nutrients and chlorophyll a 69
4.3.3. Principal Component Analysis (PCA) 69
4.3.4. Nutrient molar ratios 70
4.3.5. Phytoplankton assemblages 76
4.3.6. Toxins in mussels 77
4.4. Discussion 79
4.4.1. Winter-summer decoupling of phosphorus from nitrogen and silicon 79

xviii
4.4.2. Impact of nutrient ratios on phytoplankton assemblages 81
4.4.3. Enhancement of mussel toxicities in the lagoon 82
4.5. Conclusions 84
Acknowledgements 84
5. Partitioning of paralytic shellfish toxins in sub-cellular fractions of the digestive gland of the cockle Cerastoderma edule: changes under post-bloom natural conditions 85
Highlights 85
Abstract 86
5. 1. Introduction 86
5.2. Materials and Methods 88
5.2.1. Samples 88
5.2.2. Reagents 88
5.2.3. Treatment of samples 88
5.2.4. Sub-cellular fractionation 89
5.2.5. Toxin extraction and oxidation 89
5.2.6. Estimation of B2 concentration 90
5.2.7. LC-FLD analysis 91
5.2.8. Performance and quality control 91
5.2.9. Calculation and statistical analysis 93
5.3. Results 94
5.3.1. Toxins in the digestive gland 94
5.3.2. Toxins in sub-cellular particulate fractions 95
5.3.3. Toxins in the cytosolic fraction 96
5.4. Discussion 97
5.4.1. Reduction of toxin content under post-bloom conditions 98
5.4.2. Toxin profiles in sub-cellular fractions 99
5.4.3. Interconversion of toxins in mitochondrial and lysosomal fractions 99
5.5. Conclusions 101
Acknowledgements 102

xix
6. Identification of seasonal and multi-annual trends of bivalve toxicity by PSTs in Portuguese estuarine and coastal waters 103
Highlights 103
Abstract 104
6.1. Introduction 105
6.2. Bivalve toxicity and data analysis 106
6.2.1. Biotoxin monitoring programme 106
6.2.2. Formulas and calculations 108
6.3. Results 110
6.3.1. Data selection 110
6.3.2. Interannual variation of bivalve toxicity by PSTs 112
6.3.3. Seasonal variation of bivalve toxicity by PSTs 114
6.3.4. Molar proportion of the toxins C1+2 and B1 in bivalves 116
6.4. Discussion 119
6.4.1. Uptake and biotransformation/elimination of toxins 120
6.4.2. Import of G. catenatum cells to estuaries 121
6.4.3. Unpredictability of bivalve toxicity episodes on decadal scale 122
6.4.4. Seasonality of toxicity episodes 123
6.4.5. Connectivity of PST episodes 124
6.5. Conclusions 126
Acknowledgements 126
7. Profiles of paralytic shellfish toxins in bivalves of low and elevated toxicities following exposure to Gymnodinium catenatum blooms in Portuguese estuarine and coastal waters 127
Highlights 127
Abstract 128
7.1. Introduction 129
7.2. Material and Methods 130
7.2.1. Bivalve toxicity database 130
7.2.2. Selection of bivalve species and harvesting areas 131

xx
7.2.3. Number of samples and bivalve toxicity values 132
7.2.4. Sampling of seston and determination of PSTs 134
7.2.5. Statistical analyses 136
7.3. Results 137
7.3.1. PST composition in bivalve species 137
7.3.2. Temporal and spatial variability of toxins 138
7.3.3. PST composition in bivalves with different toxicity values 139
7.3.4. Toxin profile of PSTs in Gymnodinum catenatum 141
7.4. Discussion 142
7.4.1. Toxin profiles of G. catenatum cells from the NW coast 142
7.4.2. Alteration of major ingested PSTs by bivalves 143
7.4.3. Prevalence of decarbamoyl derivates in surf clams 145
7.5. Conclusions 146
Acknowledgements 146
8. Final considerations 147
8.1. General discussion 147
8.2. Perspectives and future work 154
8.3. Management applications 154
References 159

xxi
List of Figures
Figure 1.1. Toxic algae in the food chain and their routes of exposure (adapted from
Gerssen et al., 2010).
Figure 1.2. Schematic representation of a one-compartment model for bioaccumulation
(adapted from Connell and Miller, 1984).
Figure 1.3. The global expansion in the distribution of PSTs in bivalves and PSP episodes –
1970 versus 2005. (Credit: U.S. National Office for Harmful Algal Blooms, Woods Hole
Oceanographic Institution, Woods Hole, MA; adapted from Anderson, 2009).
Figure 2.1. Light microscopy photo of Gymnodinium catenatum; marine toxic algae
collection (IPMA, ex-IPIMAR); scale bar=30 µm.
Figure 2.2. Schematic procedure of the sub-cellular fractionation by sequential
centrifugation; S - supernatant fraction; P - pellet fraction.
Figure 2.3. Flow diagram with the sequence of oxidation reactions and corresponding
toxin identification after C18 cleanup or SPE-COOH fractionation (1=peroxide oxidation
of C18 extract; 2=periodate oxidation of C18 extract; 3=periodate oxidation of fractions 1
to 3).
Figure 2.4. Chromatograms obtained for a mussel sample with a toxic profile
characteristic of Gymnodinium catenatum. (a) quantification of dcGTX2+3, C1+2, dcSTX,
GTX2+3, B1 and STX (peroxide-C18); (b) quantification of dcNEO (periodate-C18); (c)
detection of C3+4 (periodate-SPE-COOH-F1); (d) quantification of GTX1+4 and detection
of B2 (periodate-SPE-COOH-F2); (e) quantification of NEO (periodate-SPE-COOH-F3).
Figure 3.1. Schematic representation of the laboratory feeding experiment.
Figure 3.2. Median, percentile 25% and 75%, minimum and maximum of C1+2, B1,
dcSTX, dcGTX2+3 concentrations (nmol g-1) in the culture of Gymnodinium catenatum at
days 2, 7 and 12 of the clam exposure experiment; four replicates at each sampling date.
Figure 3.3. Concentrations of the toxins C1+2, B1, dcSTX and dcGTX2+3 (nmol g-1) in the
clam Ruditates decussatus exposed 14 days to Gymnodinium catenatum and 15 days
under depuration conditions; mean concentrations (n=3; ±SD) and best fitting curves for
exposure and depuration periods.
Figure 3.4. Variation of the amount (mg) of particulate organic matter (POM) produced
by 100 individuals of Ruditapes decussatus exposure to Gymnodinium catenatum and
under depuration conditions; concentrations (nmol g-1) of the toxins B1 and dcSTX in the
POM.
4
12
18
25
28
34
35
43
48
50
51

xxii
Figure 4.1. Location of the sampling sites at Óbidos lagoon and coastal area: A - lower
lagoon; B1 and B2 - middle lagoon; C and D - upper lagoon (Bom-Sucesso branch and
Barrosa branch, respectively); E1 and E2 - coastal area adjacent to the Óbidos lagoon; F -
southern coastal area.
Figure 4.2. Projection of environmental parameters, and sampling sites in summer (open
symbols) and winter (black symbols) campaigns obtained from the principal component
analyses (PCA) performed on three data sets: site D - Barrosa branch (PCA1); sites A, B1,
B2 and C all together – lagoon, except Barrosa branch (PCA2); and sites E1, E2 - coastal
area adjacent to the Óbidos lagoon (PCA3). Percentage of total variance is indicated in
brackets close to principal components axes.
Figure 4.3. Median, percentile 25% and 75%, maximum and minimum of molar ratios
DIN:P, DIN:Si and SI:P in summer (open box) and in winter (shaded box). Three data sets
were considered for the surveyed period 2006-2010. Sites A, B1, B2 and C all together –
lagoon, except Barrosa branch; site D - Barrosa branch; and sites E1, E2 - coastal area
adjacent to the Óbidos lagoon. Outliers () and extreme (∆) values are identified.
Results of Kruskal-Wallis test are presented.
Figure 4.4. Phytoplankton main groups contribution (%) to total biomass, at sites A
(lower lagoon), C (Bom-Sucesso branch) and D (Barrosa branch), during summer and
winter campaigns of 2009.
Figure 4.5. Annual variation of toxicity derived from accumulated paralytic shellfish
toxins (PSTs, µg STX eq/100g) and diarrheic shellfish toxins (DSTs, µg OA eq/100g) in
Mytilus galloprovincialis collected at site A (lower lagoon) and site F (coastal area south
of the Óbidos lagoon). Data of 2006 and 2009 are presented.
Figure 5.1. Chromatograms obtained for two standard mixtures of C1+2, GTX2+3, B1 and
STX after peroxide oxidation (a), of dcGTX2+3 and dcSTX after peroxide oxidation (b),
and for a selected cockle sample (sub-cellular particulate fraction P3-lysosomes);
quantification of dcGTX2+3, C1+2, dcSTX, GTX2+3 and B1 after peroxide oxidation of the
C18-cleaned extract(c).
Figure 5.2. Quantities (nmol) of the toxins C1+2, B1, B2, dcGTX2+3, dcSTX, GTX2+3 and
STX in composite samples of digestive glands of the cockle Cerastoderma edule exposed
to a bloom of Gymnodinium catenatum (day 0) and the subsequent 25 days under
post-bloom conditions; mass unit: one g wet weight of digestive gland; mean values
(n=3; ±SD) for C1+2, B1, dcGTX2+3, dcSTX, GTX2+3 and STX, and individual values of
selected samples for B2.
63
74
75
77
79
92
95

xxiii
Figure 5.3. Quantities (nmol) of the toxins C1+2, B1, dcGTX2+3, dcSTX, GTX2+3 and STX
in the sub-cellular particulate fractions (nuclei+debris - P1, mitochondria - P2, lysosomes
- P3, microsomes - P4) of digestive glands of the cockle Cerastoderma edule over the 25
days under post-bloom conditions; mass unit: one g wet weight of digestive gland; mean
values(n=3;±SD).
Figure 5.4. Estimated quantities (nmol) of the toxins C1+2, B1, dcGTX2+3, dcSTX, GTX2+3
and STX in the cytosolic fraction of digestive glands of the cockle Cerastoderma edule
over the 25 days under post-bloom conditions; mass unit: one g wet weight of digestive
gland; mean values (n=3; ±SD).
Figure 5.5. Toxin profiles expressed as molar ratios (%) between the quantity of each
toxin and the quantity of all the quantified toxins in the particulate fractions
nuclei+debris - P1, mitochondria - P2, lysosomes - P3, and microsomes - P4 and in the
cytosolic fraction of digestive glands of the cockle Cerastoderma edule over the 25 days
under post-bloom conditions; mass unit: one g wet weight of digestive gland; mean
values (n=3).
Figure 6.1. Harvesting areas of mollusc bivalves: Aveiro, Mondego, Óbidos, and Formosa
(estuarine systems), and Aguda, Comporta and Culatra (open coastal areas).
Figure 6.2. Annual proportion of elevated toxicity samples (bars, TSY) and confidence
levels (squares, CL); mussels (M) and cockles (C) from Aveiro, Mondego, Óbidos and
Formosa, between 1994 and 2012.
Figure 6.3. Annual proportion of elevated toxicity samples (bars, TSY) and confidence
levels (squares, CL); surf clams (SC) from Aguda and Culatra, and wedge clams (WeC)
from Comporta and Culatra, between 1994 and 2012.
Figure 6.4. Monthly proportion of elevated toxicity samples (black and grey bars, TSM)
and confidence levels (squares and triangles, CL); mussels (M) and cockles (C) from
Aveiro, Mondego and Óbidos; cockles from Formosa; surf clams (SC) from Aguda and
Culatra; wedge clams (WeC) from Comporta and Culatra; period: 1994-1995; black bars
and squares represent mussels and surf clams; grey bars and triangles represent cockles
and wedge clams.
Figure 6.5. Monthly proportion of elevated toxicity samples (black and grey bars, TSM)
and confidence levels (squares and triangles, CL); mussels (M) and cockles (C) from
Aveiro, Mondego and Óbidos; cockles from Formosa; surf clams (SC) from Aguda and
Culatra; wedge clams (WeC) from Comporta and Culatra; period: 2005-2009; black bars
and squares represent mussels and surf clams; grey bars and triangles represent cockles
and wedge clams.
95
97
100
107
113
114
115
117

xxiv
Figure 6.6. Median, 25th and 75th percentile, minimum and maximum molar proportions
of (C1+2)+B1 to the total quantified PSTs (%), between 2007 and 2011; proportions
calculated to elevated toxicity samples; mussels and cockles from Aveiro, Mondego,
Óbidos; cockles from Formosa; wedge clams from Comporta and Culatra; n varied from 3
(wedge clams, Culatra, 2009) to 23 (mussels, Aveiro, 2008); * p<0.05.
Figure 6.7. Connectivity Index (CI) for Aveiro-Mondego-Óbidos (mussel and cockle),
Aguda-Aveiro (surf clam versus mussel) and Culatra-Formosa (cockle versus wedge clam),
for the periods 1994-1995 and 2005-2009; CI scored from 0 to 4 based on the number of
weeks per month with toxicity values above regulatory limit.
Figure 7.1. Harvesting areas of mollusc bivalves: Aveiro, Mondego, Óbidos, and Formosa
(estuarine systems), and Aguda, Comporta and Culatra (open coastal areas).
Figure 7.2. Median, maximum, minimum, 75th and 25th percentiles of molar fractions of
quantified PSTs (%) in samples of surf clam, wedge clam, cockle and mussel presenting
toxicity values above the PST regulatory limit; period of time: 2007 - 2012;
methodologies used: (a) C1+2, B1, dcSTX, dcGTX2+3, GTX2+3 and STX (method A), (b)
C1+2, B1, "dcSTX", "dcGTX2+3", "GTX2+3" and "STX" (method B).
Figure 7.3. Median, maximum, minimum, 75th and 25th percentiles of molar fractions of
quantified PSTs (%) in two sets of samples of surf clam, wedge clam, cockle and mussel
presenting toxicity values above and below the PST regulatory limit (RL) between 2007
and 2012; (a) C1+2, B1, dcSTX, dcGTX2+3, GTX2+3 and STX (method A); (b) C1+2, B1,
"dcSTX", "dcGTX2+3", "GTX2+3" and "STX" (method B).
Figure 7.4. Median, maximum, minimum, 75th and 25th percentiles of molar fractions of
toxins C1+2, B1, dcSTX, and dcGTX2+3 (%) quantified in seston samples (n=9) during a
bloom of G. catenatum in coastal waters adjacent to Óbidos lagoon in 2008 (method A).
Figure 7.5. Median, maximum, minimum, 75th and 25th percentiles of the molar ratios
R1=(C1+2):B1 and R2=[(dcSTX)+(dcGTX2+3)]:[(C1+2)+(B1)] calculated for samples of surf
clam, wedge clam, cockle and mussel presenting toxicity values above and below the PST
regulatory limit (RL), as well as for samples of seston during a bloom of toxic algae (G.
catenatum) in coastal waters adjacent to Óbidos lagoon in 2008 (method A); period of
time for bivalves: 2007 – 2012; methodologies used: (a) method A; (b) method B.
120
126
132
138
140
141
144
xxv
List of Tables
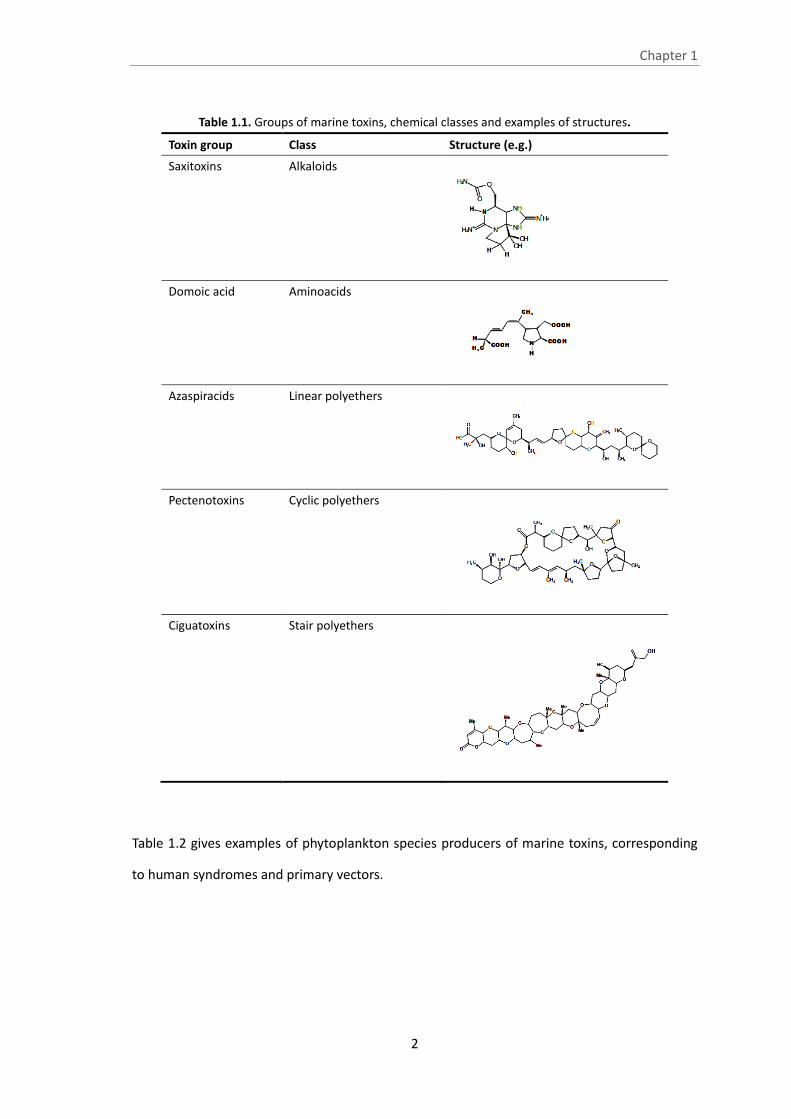
Table 1.1. Groups of marine toxins, chemical classes and examples of structures.
Table 1.2. Marine toxin groups and their phytoplankton species producers (adapted from
Gerssen et al., 2010).
Table 1.3. The paralytic shellfish toxins produced by marine phytoplankton or resulted
from metabolic transformation (adapted from Wiese et al., 2010).
Table 3.1. Best fitting curves for C1+2, B1, dcSTX and dcGTX2+3 in Ruditapes decussatus
during phase I (exposure) and phase II (depuration); calculated parameters (standard
error); correlation coefficients (r) and levels of significance (p).
Table 3.2. Mass (nmol) of toxins accumulated in Ruditapes decussatus (Tc), supplied to
the experiment (Ta) and present in particulate organic matter (Tp) after phase I, phase II,
and phases I+II. Values of Tng were computed according to Eq. 3.2. Amounts were
calculated for a basis of 100 clams.
Table 4.1. Water temperature (T), salinity, O2, and pH at five sites in the Óbidos lagoon: A
– lower lagoon, B1 and B2 - middle lagoon, Bom-Sucesso branch – C and Barrosa branch -
D. Minimum and maximum intervals are presented for 2006 and 2009, and single values
for 2007, 2008 and 2010.
Table 4.2. Values of NH4+, NO3
-+NO2-, dissolved organic nitrogen (DON), PO4
3-, dissolved
organic phosphorous (DOP), Si(OH)4 and chlorophyll a (Chl a) registered at five sites in
the Óbidos lagoon: A – lower lagoon, B1 and B2 - middle lagoon, C – Bom-Sucesso
branch and D – Barrosa branch. Minimum and maximum intervals are presented for
2006 and 2009, and single values for 2007, 2008 and 2010.
Table 4.3. Values of NH4+, NO3
-+NO2-, PO4
3-, Si(OH)4 and chlorophyll a (Chl a) registered at
2 sites located at the adjacent coast to the Óbidos lagoon: E1 and E2. Minimum and
maximum intervals are presented for winter and summer of 2006, 2007, 2008 and 2009.
Table 4.4. Phytoplankton species observed in winter and summer campaigns of 2009 in
the Óbidos lagoon: lower lagoon (site A), Bom-Sucesso branch (site C) and Barrosa
branch (site D). Species identified both in winter and summer 2009, at each site are
shown within a shaded box. Potentially toxic species are highlighted in bold.
2
3
5
50
53
67
71
73
78

xxvi
Table 6.1. Annual sampling representativeness (%) between 1994 and 2012 in Aveiro,
Mondego, Óbidos, and Formosa (mussel and cockle), Aguda (surf clam), Comporta
(wedge clam) and Culatra (surf clam and wedge clam).
Table 7.1. Annual number of samples, between 2007 and 2012, with toxicity values
below and above the regulatory limit for PSTs; surf clam (Aguda-AG, Comporta-CO and
Culatra-CU), wedge clam (Comporta-CO and Culatra-CU), cockle (Aveiro-AV,
Mondego-MO, Óbidos-OB and Formosa-FO) and mussel (Aveiro-AV, Mondego-MO and
Óbidos-OB); 2007-2008 - method B; 2009-2012 - method A.
Table 7.2. Median and the interval of minimum and maximum of PST toxicity ratios (total
toxicity value/regulatory limit) between 2007 and 2012; surf clam (Aguda-AG,
Comporta-CO and Culatra-CU), wedge clam (Comporta-CO and Culatra-CU), cockle
(Aveiro-AV, Mondego-MO, Óbidos-OB and Formosa-FO) and mussel (Aveiro-AV,
Mondego-MO and Óbidos-OB); 2007-2008 - method B; 2009-2012 - method A.
111
133
135

xxvii
Acronyms and Abbreviations
ANOVA
AOAC
ASP
AZP
CFP
CRM
dcGTX
dcNEO
dcSTX
DIN
DO
doGTX
DON
DOP
doSTX
DSP
DST
EFSA
EU
FAO
GTX
HAB
IPCC
LC-FLD
LD50
LOD
Analysis of variance
Association of official analytical chemists
Amnesic shellfish poisoning
Azaspiracid shellfish poisoning
Ciguatera fish poisoning
Certified reference material
Decarbamoylgonyautoxin
Decarbamoylneosaxitoxin
Decarbamoylsaxitoxin
Dissolved inorganic nitrogen
Dissolved oxygen
13-deoxy-decarbamoylgonyautoxin
Dissolved organic nitrogen
Dissolved organic phosphorus
13-deoxy-decarbamoylsaxitoxin
Diarrhetic shellfish poisoning
Diarrheic shellfish toxin
European Food Safety Authority
European Union
Food and Agriculture Organization of the United Nations
Gonyautoxin
Harmful algal bloom
Intergovernmental Panel of Climate Change
Liquid chromatography with fluorescence detection
Lethal dose – the dose required to kill half the members of a tested animal population
Limit of detection

xxviii
MSFD
MU
NEO
NSP
OA
PCA
POM
PSP
RL
SPE
SPE- COOH
STX
TEF
WFD
Marine Strategy Framework Directive
Mouse unit
Neosaxitoxin
Neurologic shellfish poisoning
Okadaic acid
Principal component analysis
Particulate organic matter
Paralytic shellfish poisoning
Regulatory limit
Solid phase extraction
SPE - ion exchange cartridge with carboxylic acidsiliane
Saxitoxin
Toxicity equivalence factor
Water Framework Directive

Chapter 1
1
1. Introduction
1.1. Marine toxins
Marine toxins are chemical compounds naturally produced by microalgae or bacteria.
Their chemical structure may be included in the classes of alkaloids, amino acids, carboxylic
acids, and linear, stair and cyclic polyethers (Yasumoto, 2001) (Table 1.1).
Of the approximately 4,000 phytoplankton species documented to date only 200 of
them have a high proliferation rate under specific circumstances (Zingone and Enevoldsen,
2000; Masó and Garcés, 2006). Those circumstances are not fully understood, although specific
climatic and hydrographical conditions have been pointed out as key factors to algal blooms
(Sellner et al., 2003; Moore et al., 2008). Of the 200 species, approximately 80 species,
belonging either to dinoflagellates or diatoms, are natural producers of marine toxins (Zingone
and Enevoldsen, 2000). During a toxin-producer algal bloom, toxins mainly associated with the
phytoplankton cells may be ingested by shellfish (both molluscs and crustaceans), and
planktivorous fish, leading to responses at organism and sub-cellular level and death under
extreme episodes (White et al., 1981; Bricelj et al., 1991; Scholin et al., 2000; Deeds et al.,
2008). Suspension-feeding mollusc bivalves are the principal vectors for the transfer of several
major groups of toxins, due to their ability to pump large volumes of seawater and to
concentrate toxins without massive mortality. Consumption of bivalves and other marine
organisms containing high toxin concentrations may lead to human health problems (Wang,
2008; Gerssen et al., 2010) (Figure 1.1). Indeed, the deleterious effects of toxins in humans
have been given the names paralytic, diarrhetic, neurotoxic and amnesic shellfish poisoning
(PSP, DSP, NSP and ASP, respectively) to the corresponding toxins. Syndromes are caused by
toxins mainly synthesized by dinoflagellates, although ASP is known to be associated with
diatoms.
1
Chapter 1
2
Table 1.1. Groups of marine toxins, chemical classes and examples of structures.
Toxin group Class Structure (e.g.)
Saxitoxins Alkaloids
Domoic acid Aminoacids
Azaspiracids Linear polyethers
Pectenotoxins Cyclic polyethers
Ciguatoxins Stair polyethers
Table 1.2 gives examples of phytoplankton species producers of marine toxins, corresponding
to human syndromes and primary vectors.

Chapter 1
3
Table 1.2. Marine toxin groups and their phytoplankton species producers (adapted from Gerssen et al., 2010).
Toxin group Syndrome Primary vector Genus Species References
Saxitoxins PSP Bivalves Alexandrium
Gymnodinium
Pyrodinium
angustitabulatum, catenella,
fundyense, lusitanium, minutum
tamarense, tamiyavanichii
catenatum
bahamense
Beppu et al., 2008
Martin et al., 2009
MacKenzie et al., 2004
Oshima et al., 1987
Usup et al, 2012
Domoic acid ASP Bivalves Pseudo-nitzchia australis, calliantha, cuspidata, delicatissima,
pseudodelicatissima,
multiseries, fraudulenta, multistriata,
pugens, seriata,galaxiae, turgidula
Bates and Trainer, 2006
Brevetoxins NSP Bivalves Karenia
Chatonella
brevis, brevisulcata, mikimotoi, selliformis, papilionacea
cf. Verruculosa
Lansberg and Flewelling, 2009
Watkings et al., 2008
Okadaic acid,
dinophysistoxins
and pectenotoxins
DSP Bivalves Phalacroma
Prorocentrum
Dinophysis
rotundatum
lima, arenarium, belizeanium, concavum,
acuminata, acuta, caudata, arenarium, fortii, mitra,
norvergica, ovum, rotundata, sacculus, tripos
Caroppo et al., 1999
Nascimento et al., 2005
Draisci et al., 1996; MacKenzie et al.,
2005; Kamiyama and Suzuki, 2009
Yessotoxins - Bivalves Protoceratium
Lingulodinium
Gonyaulax
reticulatum
polyedrum
spinifera
Loader et al., 2007
Paz et al., 2004
Rhodes et al., 2006
Azaspiracids AZP Bivalves Azadinium Spinosum Tillmann et al., 2009
Spirolides - Bivalves Alexandrium ostenfeldii, peruvianum Cembella et al., 2000; Touzet et al., 2008
Gymnodimines - Bivalves Karenia
Gymnodinium
selliforme
mikimotoi
Miles et al., 2003
Seki et al., 1995
Ciguatoxins CFP Fish Gambierdiscus australes, pacificus, plynesiensis, toxicus, yasumotoi Litaker et al., 2010
Palytoxins Palytoxin poisoning Fish Ostreopsis Siamensis Ciminiello et al., 2013

Chapter 1
4
Figure 1.1. Toxic algae in the food chain and their routes of exposure (adapted from
Gerssen et al., 2010).
1.2. Paralytic shellfish toxins (PSTs)
1.2.1. Chemical structures
The PSTs form a group of closely related tetrahydropurine compounds, which can be
broadly characterized as hydrophilic or hydrophobic, generally divided into sub-groups based
on substituent side chains such as carbamate, sulfate, hydroxyl, hydroxybenzoate, or acetate
(Llewellyn, 2006). The basic structures of PSTs are composed of a 3,4-propinoperhydropurine
tricyclic system (Shimizu, 2000). Since its initial discovery, 57 naturally occurring PSTs have been
identified, mainly derived from marine dinoflagellates or resulted of metabolic transformation
in bivalves (Wiese et al., 2010) (Table 1.3).
The first isolated toxin of the group PSTs was saxitoxin (STX), obtained from the Alaskan butter
clam, Saxidomus giganteus in 1957 (Schantz et al., 1957). The structure of STX was
characterised by means of x-ray crystallographic and nuclear magnetic resonance spectroscopic
studies (Bordner et al., 1975; Schantz et al., 1975). STX is included in the group of
guanidinium-containing marine natural products, due to the presence of two guanidino groups
which are responsible for its high polarity. Subsequently, gonyautoxins (GTX1-6) and
Humans
Birds
Bivalves
Toxic algae
Whales
Fish
Seals

Chapter 1
5
Table 1.3. The paralytic shellfish toxins produced by marine phytoplankton or
resulted from metabolic transformation (adapted from Wiese et al., 2010).
Toxin R1 R2 R3
ΩR4 R5
STX H H H OCONH2 OH
NEO OH H H OCONH2 OH
Mono-sulfated
GTX1 OH H OSO3- OCONH2 OH
GTX2 H H OSO3- OCONH2 OH
GTX3 H OSO3- H OCONH2 OH
GTX4 OH OSO3- H OCONH2 OH
GTX5 (B1) H H H OCONHSO3- OH
GTX6 (B2) OH H H OCONHSO3- OH
Di-sulfated
C1 H H OSO3- OCONHSO3
- OH
C2 H OSO3- H OCONHSO3
- OH
C3 OH H OSO3- OCONHSO3
- OH
C4 OH OSO3- H OCONHSO3
- OH
Decarbamoylated
dcSTX H H H OH OH
dcNEO OH H H OH OH
dcGTX1 OH H OSO3- OH OH
dcGTX2 H H OSO3- OH OH
dcGTX3 H OSO3- H OH OH
dcGTX4 OH OSO3- H OH OH
Deoxy-Decarbomoylated
doSTX H H H H OH
doGTX1 OH H OSO3- H OH
doGTX2 H H OSO3- H OH
Mono-Hydroxy Benzoate Analogs
GC1 H H OSO3- OCOPhOH OH
GC2 H OSO3- H OCOPhOH OH
GC3 H H H OCOPhOH OH *GC4 OH H OSO3
- OCOPhOH OH
*GC5 OH OSO3
- H OCOPhOH OH
*GC6 OH H H OCOPhOH OH
R1 R2 R3
H H H
H H OSO3-
H OSO3- H
OH H H
OH H OSO3-
OH OSO3- H
NH
NHNH2N+
N+NH2
OHOH
R3R2
H
R1
R4
1
2 3 4
56
78
9
10 11
12
O
O NH2Unregistered PLT
O
O NHSO3-
OH
R4
Carbamoyl Sulfocarbamoyl Decarbamoyl
STX(1) B1(0.06) dcSTX(0.51)
GTX2(0.36) C1(0.006) dcGTX2(0.15)
GTX3(0.64) C2(0.10) dcGTX3(0.38)
Neo(0.92) B2(0.06) dcNeo(nk)
GTX1(0.99) C3(0.01) dcGTX1(nk)
GTX4(0.73) C4(0.06) dcGTX4(nk)
R1 R2 R3
H H H
H H OSO3-
H OSO3- H
OH H H
OH H OSO3-
OH OSO3- H
NH
NHNH2N+
N+NH2
OHOH
R3R2
H
R1
R4
1
2 3 4
56
78
9
10 11
12
NH
NHNH2N+
N+NH2
OHOH
R3R2
H
R1
R4
1
2 3 4
56
78
9
10 11
12
O
O NH2Unregistered PLT
O
O NHSO3-
O
O NHSO3-
OHOH
R4
Carbamoyl Sulfocarbamoyl Decarbamoyl
STX(1) B1(0.06) dcSTX(0.51)
GTX2(0.36) C1(0.006) dcGTX2(0.15)
GTX3(0.64) C2(0.10) dcGTX3(0.38)
Neo(0.92) B2(0.06) dcNeo(nk)
GTX1(0.99) C3(0.01) dcGTX1(nk)
GTX4(0.73) C4(0.06) dcGTX4(nk)

Chapter 1
6
Table 1.3. (cont.)
Toxin R1 R2 R3 ΩR4 R5
Di-Hydroxy Benzoate Analogs ⱡGC1a H H OSO3
- DHB OH
ⱡGC2a H OSO3
- H DHB OH
ⱡGC3a H H H DHB OH
ⱡGC4a OH H OSO3
- DHB OH
ⱡGC5a OH OSO3
- H DHB OH
ⱡGC6a OH H H DHB OH
Sulfated Benzoate Analogs ⱡGC1b H H OSO3
- SB OH
ⱡGC2b H OSO3
- H SB OH
ⱡGC3b H H H SB OH
ⱡGC4b OH H OSO3
- SB OH
ⱡGC5b OH OSO3
- H SB OH
ⱡGC6b OH H H SB OH
Other PST Analogs
M1 H OH H OCONHSO3- OH
M2 H OH H OCONH2 OH
M3 H OH OH OCONHSO3- OH
M4 H OH OH OCONH2 OH *M5
*Not structurally characterized
ⱡ R4 group putatively assigned based on major ions obtained via MS
ΩDHB: Di-hydroxil-benzoate
ΩSB: Sulfated-benzoate

Chapter 1
7
neosaxitoxin (neoSTX/NEO) were isolated from toxic bivalves and dinoflagellates and their
structures identified (Shimizu, 2000).
Usually, a PST-producing organism synthesises a characteristic suite of toxins made up of
several PST analogues. These analogues differ in side group moieties and thus are
commonly grouped according to these variable residues (Wiese et al., 2010). The most
commonly occurring PSTs are hydrophilic and may be non-sulfated, such as STX and NEO,
mono-sulfated, such as the GTX1-6, or di-sulfated (C1-4 toxins) (Llewellyn, 2006) (Table 1.3).
Decarbamoyl variants of these analogues also exist, such as decarbamoylsaxitoxins (dcSTX,
dcNEO), decarbamoylgonyautoxins (dcGTX1-4), and the 13-deoxy-decarbamoyl derivatives
(doSTX, doGTX1-2). Three structural families of STX are named by the identity of the R4 side
chain as either N-sulfocarbamoyl (OCONHSO3-), decarbamoyl (OH), or carbamoyl toxins
(OCONH2).
1.2.2. Properties
The stability of toxins varies greatly depending on their structures and pH of the
medium. STX is extremely stable even at high temperature and low pH. However, above pH
8 it degrades rapidly at ambient temperature, which suggests STX may not survive in
seawater too long unless it is stabilized by complexation with other dissolved substances.
Toxins with the presence of N1-hydroxyl groups, such as NEO, are also more labile to acid
and heat than STX. Only heated at low pH (between 2 to 4), the toxins with the
N-sulfocarbamoyl moiety may be partially converted to the corresponding carbamate toxins
through hydrolysis (Shimizu, 2000). In aqueous solution, STX possesses two pKa´s of 8.22
and 11.28 which belong to the 7,8,9 and 1,2,3 guanidinium groups, respectively (Rogers and
Rapoport, 1980). This polarity nature explains the ready solubility of STX in water and lower
alcohols and insolubility in organic solvents. The net charge of the PSTs, which is an
important factor to consider in analytical separations, varies with the pH and structures
(Shimizu, 2000).

Chapter 1
8
1.2.3. Mechanism of toxicity
The mechanism of action of these compounds is the blockage of sodium channels of
nerve membranes, which results in stoppage of the propagation of neural impulses and
paralysis of neuromuscular systems (Kao, 1966). This is mediated by the interaction
between the positively charged guadinium groups of the PSTs with negatively charged
carboxyl groups at site 1 of the voltage-gated sodium channels in a equimolar ratio
(Catterall et al., 1980). It is documented that PSTs also bind to calcium and potassium
channels (Llewellyn, 2006).
The toxicity of the PSTs is usually expressed as STX or STX equivalents. The toxicity
was defined in terms of a mouse unit (MU) to quantify toxic activity, as the mouse is more
sensitive to the PSTs when compared to species such as fish, amphibians, reptiles and
animals of a low order (Mons et al., 1998). The MU is defined as the dose of toxin which kills
one 20 g mouse in 15 min (Sommer and Meyer, 1937). STX presents a LD50 (intraperitoneal
route) in mice of only 10 µg kg-1 body weight and an oral LD50 of 263 µg kg-1 body weight
(Batoréu et al., 2005). The relative toxicity of STX analogues has been studied in mouse
bioassays (Genenah and Shimizu, 1981; Koehn et al., 1982; Oshima, 1995a; Sullivan et al.,
1983; Vale et al., 2008) and in vitro (Vale et al., 2008). Based on an evaluation of the relative
potencies of PSTs studied since 1981, and giving greater weight to more recent data, in 2009
the European Food Safety Authority (EFSA) proposed new toxicity equivalence factor (TEF)
values of each analogue based on intraperitoneal acute toxicity in mice (EFSA, 2009). Due to
side chain variability, each PST has a different binding affinity to voltage-gated sodium
channel receptors, which consequently results in different toxicities. Substitutions at N-1
and/or C-11 decrease the toxicity relatively to STX (Genenah and Shimizu, 1981). The
toxicity equivalence factor varies from 1.0 for STX, NEO, GTX1 and dcSTX to 0.1 attributed to
B1, B2, C2 and C4 (EFSA, 2009).
1.2.4. PST-producing species and their geographic distributions
Paralytic shellfish toxins (PSTs) are synthetised by a limited number of marine toxic

Chapter 1
9
dinoflagellates, namely Pyrodinium bahamense, Alexandrium spp. and Gymnodinium
catenatum (Llewellyn, 2006), and by marine bacteria (Ogata et al., 1990; Kodama et al.,
1990), and freshwater cyanobacteria (Carmichael, 1997). Pyrodinium bahamense is
responsible for the occurrence of PSTs in the Indo-West Pacific waters (Usup et al., 2012),
Alexandrium spp. in temperate waters of both Atlantic and Pacific oceans (Beppu et al.,
2008; Martin et al., 2009; MacKenzie et al., 2004), and G. catenatum in a large geographic
area from California, Mexico, Argentina, Venezuela, Japan, Philippines, Tasmania and Iberian
Peninsula (Hallegraeff et al., 2012).
G. catenatum is a unarmored chain-forming dinoflagellate, usually with 8-16 cells,
sometimes reaching up to 64 cells in length. The optimal growth of G. catenatum has been
observed in culture for temperature range of 15-20oC and salinity interval of 23-34
(Blackburn et al., 1989).
Hallegraeff et al. (2012) have proposed two possible mechanisms for G. catenatum
blooms: (i) the autochthonous case - high abundance of cells derived from an inoculum by
local cyst beds or motile cells triggered by organic enrichment related to rainfall events (e.g.,
Tasmanian estuaries); (ii) the allochthonous case - G. catenatum blooms that are inoculated
from offshore, and build up during upwelling relaxation (e.g., NW Spanish Rias). Blooms in
Portuguese coastal waters have been reported at mid-shelf, related to the relaxation of
upwelling events in the western region (Moita et al., 1998, 2003). Slow currents or close
circulation contribute to the maintenance of this species near the coast (Pitcher et al.,
2010).
Chemical confirmation of toxin production by G. catenatum was first achieved by
Oshima et al. (1987) using specimens from Tasmania, Australia. Since then, this organism
has been reported in several geographic areas as producer of more than 20 STX derivatives
(Negri et al., 2007). The toxin profile of PSTs varies among strains and populations and, so
far, no single population has been found to contain all STX derivatives (Camino-Ordás et al.,
2004; Park et al., 2004; Band-Schmidt et al., 2005). A high proportion of C1+2 and/or C3+4
in the toxin profile seems to be a characteristic of G. catenatum worldwide, except for

Chapter 1
10
Singaporean and Malay strains that lack C toxins entirely or have only a low proportion of
C1+2 (Holmes et al., 2002; Mohammad-Noor, 2010). Only north-eastern Atlantic strains
have a higher B1 and B2 content (>25% molar fraction) although either or both derivatives
are absent in some Andalusian strains (Camino-Ordás et al., 2004). Strains from the Gulf of
California and the Mexican coast are characterised by a high proportion of NEO (up to 46%),
(Band-Schmidt et al., 2006), whereas this derivative generally occurs in lower molar
percentages (less than 14%) in Singaporean and Spanish strains (except for one Andalucian
strain, Camino-Ordás et al., 2004).
1.2.5. Toxin composition and environmental conditions
Culture-related factors such as growth temperature, chemical compostion of the
medium, and chain-length are known to modify both total toxin content and the relative
proportions among PSTs (Granéli and Flynn, 2006; Band-Schmidt et al., 2010). Paralytic
shellfish toxins are a suite of nitrogen-rich alkaloids, and consequently sufficient nitrogen
supply from water is essential for the biosynthesis of these toxins. A number of studies
found that nitrogen deficiency could decrease the PST yield and cellular toxin content in
toxic species of Alexandrium (Anderson et al., 1990; Yu et al., 2001; Leong et al., 2004),
while excess nitrogen availability under phosphorus-limitation condition could increase the
cellular toxin content (Flynn et al., 1994; John and Flynn, 2000; Murata et al., 2006;
Hattenrath et al., 2010). G. catenatum showed slower responses of the cellular toxin
content to changes in the nutrient regime than Alexandrium spp. (Flynn et al., 1996).
1.2.6. Marine organisms sensitive to PSTs
Bivalve molluscs show marked inter-species variation in their capacity to accumulate
PSTs, which has a neural basis (Twarog et al., 1972). In general, bivalve species with nerves
insensitive to PSTs (e.g., Mytilus edulis) readily feed on toxic cells (Bricelj et al., 1990) and
thereby accumulate high toxin levels. In contrast, species that attain relatively low toxicities
such as the oyster Crassostrea spp. are highly sensitive to PSTs and exhibit physiological and
Chapter 1
11
behavioural mechanisms to avoid or reduce exposure to toxic cells (Lassus et al., 1999; Tran
et al., 2010). These mechanisms range from feeding rate inhibition to shell clapping and
complete shell valve closure (Shumway and Cucci, 1987; Bricelj and Shumway, 1998).
Softshell clams (Mya arenaria) from areas exposed to toxic blooms are more resistant to
PSTs, as demonstrated by whole-nerve assays, and accumulate toxins at greater rates than
sensitive clams from unexposed areas. Resistance is caused by natural mutation of a single
aminoacid residue, which causes a 1,000-fold decrease in affinity at the STX-binding site in
the sodium channel pore of resistant clams (Bricelj et al., 2005). Histological observations of
tissues of mussels and oysters exposed to PST producers indicated the presence of
hemocytes in the gills, as well as degeneration of muscle tissue (Galimany et al., 2008;
Haberkorn et al., 2010). Although PST-producing Alexandrium tamarense did not affect the
survival and metamorphosis of the scallop Argopecten irradians concentricus at its early
development stages, scallop activity, including mobility of D-shape larvae, attachment and
climbing ability of juveniles, were affected in acute experiments indicating that A.
tamarense has a detrimental impact on bivalves at early life stages (Yan et al., 2003).
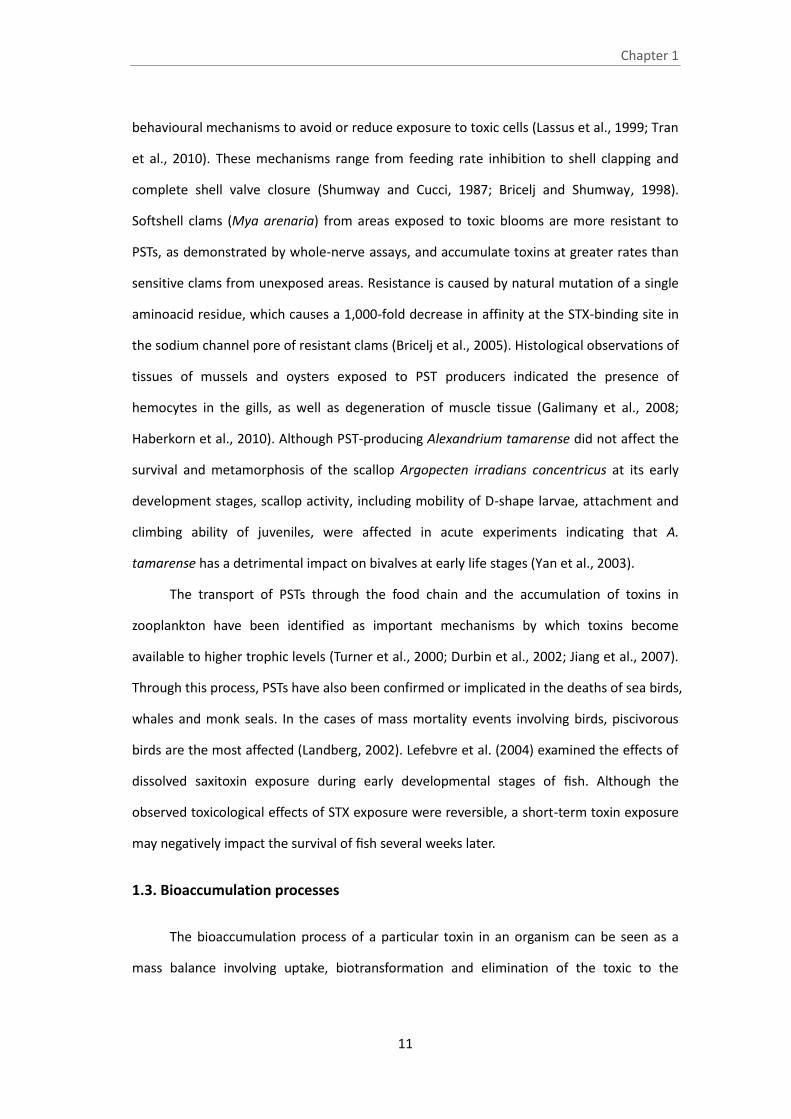
The transport of PSTs through the food chain and the accumulation of toxins in
zooplankton have been identified as important mechanisms by which toxins become
available to higher trophic levels (Turner et al., 2000; Durbin et al., 2002; Jiang et al., 2007).
Through this process, PSTs have also been confirmed or implicated in the deaths of sea birds,
whales and monk seals. In the cases of mass mortality events involving birds, piscivorous
birds are the most affected (Landberg, 2002). Lefebvre et al. (2004) examined the effects of
dissolved saxitoxin exposure during early developmental stages of fish. Although the
observed toxicological effects of STX exposure were reversible, a short-term toxin exposure
may negatively impact the survival of fish several weeks later.
1.3. Bioaccumulation processes
The bioaccumulation process of a particular toxin in an organism can be seen as a
mass balance involving uptake, biotransformation and elimination of the toxic to the
Chapter 1
12
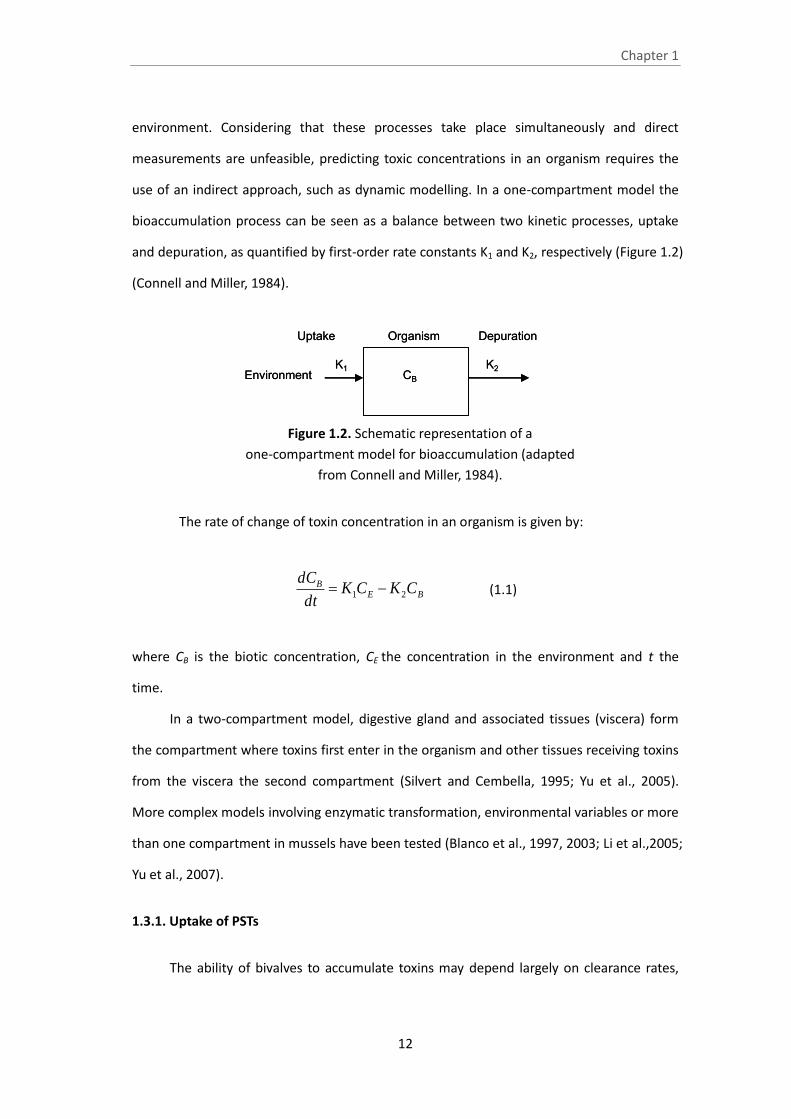
environment. Considering that these processes take place simultaneously and direct
measurements are unfeasible, predicting toxic concentrations in an organism requires the
use of an indirect approach, such as dynamic modelling. In a one-compartment model the
bioaccumulation process can be seen as a balance between two kinetic processes, uptake
and depuration, as quantified by first-order rate constants K1 and K2, respectively (Figure 1.2)
(Connell and Miller, 1984).
Figure 1.2. Schematic representation of a
one-compartment model for bioaccumulation (adapted
from Connell and Miller, 1984).
The rate of change of toxin concentration in an organism is given by:
BEB CKCK
dt
dC21 (1.1)
where CB is the biotic concentration, CE the concentration in the environment and t the
time.
In a two-compartment model, digestive gland and associated tissues (viscera) form
the compartment where toxins first enter in the organism and other tissues receiving toxins
from the viscera the second compartment (Silvert and Cembella, 1995; Yu et al., 2005).
More complex models involving enzymatic transformation, environmental variables or more
than one compartment in mussels have been tested (Blanco et al., 1997, 2003; Li et al.,2005;
Yu et al., 2007).
1.3.1. Uptake of PSTs
The ability of bivalves to accumulate toxins may depend largely on clearance rates,
DepurationOrganismUptake
EnvironmentK1 K2
CB
DepurationOrganismUptake
EnvironmentK1 K2
CB

Chapter 1
13
individual species` capabilities for selective ingestion and/or absorption of toxic cells, as
well as the density and distribution of the toxic dinoflagellates in the water column
(Shumway et al., 1985). Clearance rate representing filtration ability provides a useful index
to compare the toxin sensitivity and, thus, the potential for uptake by various species
(Shumway and Cucci, 1987; Bricelj et al., 1991). In particular, the mussel Mytilus edulis can
maintain a relatively constant feeding rate over a wide range of acclimation temperatures
(ca. 10 to 20oC), therefore, toxin uptake in this species is likely to be less affected by
geographical or seasonal differences in temperature than in species where clearance rate is
strongly influenced by seasonal temperature (Bricelj and Shumway, 1998). In addition,
clearance rate can be used to compare the response within a species to variations in
dinoflagellate cell density (Bricelj et al., 1996). The species-specific differences in the
clearance rate found by Contreras et al. (2011) during short-term exposure to PSTs in five
bivalve species of New Zealand were reflected in the total content of toxins in the tissues.
The scallop Pecten novazelandiae and the clam Paphies donacina decreased their clearance
rates in the presence of Alexandium tamarense and also accumulated fewer toxins in their
tissues than the most resistant bivalves (Perna canaliculus and Dosinia anus).
As with organic matter, not all the toxin contained in phytoplankton cells is absorved
by the bivalve. The main variables that seem to control the process are the gut transit time
(the time the food is maintained in the digestive system) and the digestibility and/or the
post-ingestive selection of the toxic cells (Moroño et al., 2001). One important factor
affecting the assimilation of toxins is the relative amount of toxins (in relation to the total
seston volume) available in the food (Moroño et al., 2001). These authors argued that the
toxin assimilation efficiency is regulated mainly by the probability of contact between toxins
and cellular walls of the digestive system.
As mentioned before, bivalves exhibit differential behaviour responses when exposed
to a bloom in order to avoid or reduce exposure to toxic cells (Wildish et al., 1998; Tran et
al, 2010). These responses that influence the toxin uptake may be related to the relative
toxicity of compounds produced by the algae, toxin content in the tissues of bivalves (Bricelj

Chapter 1
14
et al., 1996), and the history of toxic algal bloom exposure in any given ecosystem
(Shumway and Cucci, 1987).
1.3.2. Biotransformation of PSTs
Cell extracts of PST-producing dinoflagellates are capable of enzymatically modifying
PSTs. Oshima et al. (1995b) showed that GTX2+3 can be converted into GTX1+4 by
incubation with Alexandrium tamarense homogenate. In addition, the introduction of a
sulfate moiety on the carbamoyl group, resulting in the formation of C1 and C2 toxins, has
been shown following incubation with G. catenatum homogenate. In dinoflagellates,
biotransformation is likely to occur via PST tailoring enzymes which are a part of the PST
biosynthesic pathway (Wiese et al., 2010).
Contaminated bivalves contain a mixture of several PSTs, and may have different toxin
profiles from those of the dinoflagellate to which they were exposed. For example, in
controlled feeding experiments, N-sulfocarbamoyl toxins produced by dinoflagellates are
converted to more toxic decarbamoyl derivatives in the Spisula solidissima, whereas toxin
conversion in the Mya arenaria, are limited primarily to epimerization of N-sulfocarbamoyl
derivatives and gonyautoxins, e. g., transformation of toxin C2 to C1 and GTX3 to GTX2
(Bricelj et al., 1996). The conversion of the GTXs and NEO to STX by reductive elimination of
O-sulfate and N1-hydroxyl groups, respectively, has been observed when toxins were
incubated with the homogenate of the scallop Placopecten magellanicus, pointing to the
action of reductant, such as cysteine and glutathione (Shimizu and Yoshioka, 1981; Oshima,
1995b). Moreoever, enzymatic conversion of N-sulfocarbamoyl PSTs to the respective
decarbamoyl derivatives was confirmed in incubated tissue homogenates of littleneck clams
(Prothotheca staminea) recognising carbamoylase as the enzyme responsible for the toxin
conversion (Sullivan et al., 1983). Incubation in vitro of bivalve tissues with toxic
dinoflagellates or purified toxin extracts allowed elucidation of the role of enzymatic
activities (Fast et al., 2006; Artigas et al., 2007). The purification and characterization of the
PST-transforming enzymes carbamoylase I from Mactra chinensis and sulfocarbamoylase I

Chapter 1
15
from Peronidia venulosa confirmed the conversion of the carbamoyl or N-sulfocarbamoyl
moieties of PSTs through enzymatic hydrolysis (Lin et al., 2004; Cho et al., 2008).
Biotransformation of the PSTs by bacteria was first suggested by Kotaki and
co-authors who proposed that marine bacteria, such as Vibrio and Pseudomonas spp., are
capable of metabolizing PSTs (Kotaki et al., 1985). The ability of bacteria to degrade PSTs has
been further described by Smith et al. (2001), who screened marine bacterial isolates from
various bivalve species for their ability to metabolize a range of PSTs suggesting that
bacteria may play an important role in the clearance of PSTs from bivalves.
1.3.3. Elimination of PSTs
Feeding experiments with toxic algae are commonly used to estimate depuration
rates in laboratory assays (Bricelj et al., 1991; Blanco et al., 2003; Estrada et al., 2007).
Depuration studies with natural contaminated bivalves after a toxic bloom are much less
documented (Blanco et al., 1997; Botelho et al., 2010a). The relevance of assessing
depuration kinetics in bivalves previously exposed to toxins comes from the importance to
predict the time required to reduce the total PST concentration to a level that is safe for
human consumption. Depuration rates of PSTs vary greatly among bivalve species. For
example, depuration of PSTs in the mussel Mytilus edulis is relatively fast (Bricelj and
Shumway, 1998), whereas removal of toxins from the butter clam is comparatively slow due
to the strong binding of the siphon tissue with the toxin STX (Beitler and Liston, 1990). Once
incorporated by a bivalve, PSTs will be transported differentially to various tissues, from
which they are eliminated at varying rates (Yu et al., 2005). In general, PSTs accumulate at
highest levels in the viscera of bivalves, but the ranking of toxicity among tissues often shifts
during depuration (Bricelj et al., 1990). Several studies have also shown that depuration
occurs most rapidly in the viscera (e.g., Waiwood et al., 1995).
In most cases, depuration patterns could be adequately fitted by a
single-compartment, negative exponential model. However, this simple approach often
markedly underestimated the time required to reach the PSTs regulatory level, especially in

Chapter 1
16
species such as Saxidomus giganteus and Spisula solidissima (Bricelj and Shumway, 1998). A
better fit to the data, and more accurate prediction of the time required to reach safety
levels for human consumption, was provided in some cases by a biphasic detoxification
model, consisting of an initial more rapid detoxification phase and subsequent slower
(exponential) phase of toxin elimination (Bricelj and Cembella, 1995; Silvert and Cembella,
1995). It has been suggested that the initial detoxification phase represents gut evacuation
of unassimilated toxin, whereas the second phase represents the release of toxins
assimilated and incorporated in tissues (Bricelj and Shumway, 1998).
Various studies reported the accumulation and depuration profiles of individual PSTs
(C1, C2, GTX1, GTX2, GTX3, GTX4, dcGTX2, dcGTX3, dcSTX, STX and NEO) after exposure to
Alexandrium species or G. catenatum (Sekiguchi et al., 2001; Choi et al., 2003; Samsur et al.,
2006, 2007). However, the elucidation of how individual PSTs behave during depuration was
mainly focused on the toxins C1, C2, GTX1, GTX2, GTX3, GTX4, STX and NEO, which are
characteristic of bivalves exposed to Alexandrium spp. (Ichimi et al., 2001; Blanco et al.,
2003). Botelho et al. (2010a) studied the depuration kinetics of B1, dcSTX and dcGTX2+3,
which are characteristic of the toxin profile in bivalves exposed to G. catenatum, under
depuration laboratory conditions and over a declining bloom of the dinoflagellate in the
field.
1.3.4. Responses at organism level to accumulated toxins
In general, when organisms are exposed to toxic substances, detoxifying enzymes will
be induced to metabolize the toxic chemicals into more polar forms to facilitate excretion.
During these metabolic processes reactive oxygen species may be formed as by-products
causing widespread damage. To counterbalance this, many organisms have evolved
antioxidant defence systems to prevent the formation of these free radicals (De Zwart et al.,
1999). The changes in the antioxidant defence systems are often used to monitor oxidative
stress in biological systems. Choi et al. (2006) examined the oxidative stress-related
responses in clams (Ruditapes philippinarum) exposed to PSTs produced by Alexandrium

Chapter 1
17
tamarense, predominantly C2 toxins. It appears that not all the antioxidant parameters
showed responses to the increasing PST concentrations. In particular, clams showed
considerable variations in their antioxidative responses. In a study with giant lions-paw
scallops (Nodipecten subnodosus) exposed to G. catenatum, the digestive gland showed
higher CAT and glutathione peroxidase (GPX) activities than other tissues (Estrada et al.,
2007).
The sub-cellular distribution of domoic acid (ASP toxin) in the digestive gland cells
suggests that it is weakly bound or free in the cytosol (Mauriz and Blanco, 2010). The
sub-cellular partitioning of okadaic acid (DSP toxin) in the digestive gland of Mytilus
galloprovincialis indicates its association with high-density lipoproteins (Rossignoli and
Blanco, 2010). This approach was not used to provide better knowledge in the distribution
and linkage of PSTs in bivalve tissues.
1.4. Effects of ingested PSTs on humans
Human can develop PSP through ingestion of contaminated bivalves, gastropods, or
crustaceans containing high concentrations of PSTs (Gessner and Middaugh, 1995).
Symptoms in humans associated with mild to moderate levels of intoxication consist of
tingling and numbness of the perioral area and extremities, loss of motor control,
drowsiness, incoherence, nausea, vomiting and diarrhoea. In the cases of severe
intoxication, muscular paralysis and pronounced respiratory difficulties also occur (Van
Dolah, 2000). PSP may be fatal through respiratory paralysis occurring within 2-24 h after
ingestion (Gessner and Middaugh, 1980). There is no specific antidote for PSP, thus the
clinical management of intoxicated victims is entirely supportive (Kao, 1993). This syndrome
has been identified a serious risk for shellfish consumers for centuries. The first description
of PSP dates from 1793 in the Pacific Northwest of North America (Halstead and Schantz,
1984). The location of these cases is related to the global distribution of the various
PST-producing species. Figure 1.3 shows the cumulative global increase in the recorded
distribution of the causative species and the confirmed appearance of PSTs in bivalves

Chapter 1
18
(Anderson, 2009). While numerous fatal cases of PSP have been reported globally, the
successful implementation of monitoring programs in many countries has helped to reduce
human illnesses and fatalities (Etheridge, 2000).
Figure 1.3. The global expansion in the distribution of PSTs in
bivalves and PSP episodes - 1970 versus 2005. (Credit: U.S.
National Office for Harmful Algal Blooms, Woods Hole
Oceanographic Institution, Woods Hole, MA; adapted from
Anderson, 2009)
1.5. Monitoring of toxin-producing species and bivalve toxicity
1.5.1 Design of monitoring programmes
Since the 1970s to 1980s, several countries run national programmes to survey
PST-producing species and marine toxin concentrations in bivalves to alert the consumers
about toxicity episodes (Mons et al., 1998; Batoréu et al., 2005). Currently, more than 50
countries are combining monitoring of toxin-producing species and commercial bivalve
toxicity (Anderson, 2009). Estimation of uptake and elimination rates of toxin in bivalves

Chapter 1
19
was the first step to select the best species to be used in surveillance programmes. Species
that rapidly achieve elevated toxin levels when exposed to toxic algae, such as Mytilus spp.,
are suitable as sentinel organisms providing early warning of a bivalve toxicity episode. This
species has long been used as the primary indicator for monitoring levels of PSTs in several
geographic areas. This ability was confirmed in coastal waters of Maine, USA, since PST
levels in Mytilus edulis occurred several days earlier than those in Mya arenaria, thus
providing an adequate protection of harvesting of this species. It is also known that M.
edulis generally becomes 2 to 4 times more toxic than neighbouring Mya arenaria (Bricelj
and Shumway, 1998).
Monitoring bivalve toxicity provides a valuable, time- and space- integrated historical
record of the occurrence and intensity of toxic blooms. Continuous time series of PST
toxicity for the same bivalve species sampled at the same location are useful to learn about
possible seasonal and multi-annual trends of toxicity episodes.
1.5.2. Closure of legal harvest of bivalves
Legal controls of marine toxins in bivalves are prescribed by the European food safety
legislation (Anon., 2004a; Anon., 2004b). This legislation requires all European Union (EU)
member states to have in place an official control monitoring system that ensures there are
checks for the presence of marine toxins in bivalve production areas. Production area is
here interpreted as a natural production area or aquaculture area. There is also a
requirement for the monitoring of toxin-producing phytoplankton in those areas. Every time
a sample presents toxicity values exceeding the EU regulatory limit (RL), the closure of legal
harvest of bivalves is mandatory. The sector regains the activity when two consecutive
samples (sampled at least 48 hours apart) show values below RL (Anon., 2004b). In the EU
and USA (Anon., 2004b), as well as in most countries (FAO, 2004), the RL for PSTs is 800 µg
STX di-HCl equivalents per kg of shellfish meat. This value has been lowered to 300 and 400
µg STX di-HCl equiv. kg-1 in Mexico and the Philippines, respectively (FAO, 2004).
Exceptionally, harvest of Acanthocardia tuberculata (Mediterranean cockle) is authorised by

Chapter 1
20
the European Commission to Spain in areas where the PST level in edible parts of those
molluscs is between 800 and 3000 μg per kg tissue, if heat treatment is carried out (EC,
1996).
1.6. Economic impact of PSTs
The toxicity episodes by PSTs have a array of economic impacts, including the costs of
conducting monitoring programmes for bivalves and other affected resources, short- and
long-termed closure of harvestable bivalves, reductions in seafood sales, mortalities of wild
and farmed fish, impacts on tourism and tourism-based related businesses, and medical
treatment of exposed populations (Anderson et al., 2009). The annual cost of monitoring
PSTs in the Bay of Fundy and British Columbia, Canada, was valued at US $102 K and $82 K,
respectively, representing about 4 to 5% of the value of shellfish harvested in 1988
(Cembella and Todd, 1993). As example of single PST episodes, the total economic loss to
the oyster industry on the Pacific U.S. coast in 1980 was estimated at US $ 0.6 million, and
an 8-month closure on mussel harvesting in the Philippines in 1983, resulted in an
estimated loss of $US 2.2 million (Bricelj and Shumway, 1998).
1.7. The Portuguese situation
The first association of G. catenatum blooms with PSP episodes in Portugal was
reported in 1986 (Franca and Almeida, 1989). A detailed neurological characterization of
PSP symptoms was performed on hospitalised patients due to a severe event in 1994 after
consumption of mussels harvested in the NW coast (Carvalho et al., 1998). The Portuguese
monitoring programme for marine toxins was started in 1994 by the Portuguese Institute of
Marine Research (IPIMAR) and subsequent Governmental Institutes (Sampayo et al., 1997;
Vale et al., 2008). PSTs were one of the first toxin groups under surveillance, accomplished
by the monitoring of their phytoplankton producers (Sampayo et al., 1997; Vale et al., 2008).
Currently, the programme covers 38 production areas located in coastal lagoons, estuaries
and open coastal zones including most of the commercial bivalve species harvested in these

Chapter 1
21
areas (Mytilus spp., Cerastoderma edule, Ruditapes decussatus, Venerupis pullastra,
Scrobicularia plana, Ensis spp., Solen spp., Venus verrucosa, Ostrea spp., Crassostrea spp.,
Spisula solida, Donax trunculus, Ensis siliqua, Callista chione and Chamelea gallina) (IPMA
database, 2014).
A review of marine toxin monitoring in bivalves from Portugal between 1986 and
2006 indicated that PSTs occurred intermittently in autumn (Vale et al., 2008). In recent
years, high concentrations of PSTs in bivalves have been sporadically registered (IPMA
database, 2014).
1.8. Motivation and objectives
The first works on marine toxins were focused on the assessment of bivalve toxicity in
order to protect human health. Whole bivalve toxicity was first assessed through bioassays.
As chemical methodologies were improved, bioassays were progressively substituted by
analytical procedures providing the possibility to quantify individual toxins, and thus to
characterise the toxin profiles both in algae and bivalves. Paralytic shellfish poisoning is a
key issue due to severity of symptoms in humans. In addition, toxin-producing species may
produce a variety of paralytic shellfish toxins, some of them poorly documented. Individual
quantification of those toxins, in particular the less documented compounds, or those that
are recurrently found in bivalves from the Iberian waters, will help to elucidate tissue
partitioning of toxins, kinetics, and transformation mechanisms of the assimilated toxins.
This thesis focused on the accumulation of PSTs in commercial bivalve species
harvested in Portuguese estuarine and coastal waters, including kinetics of assimilated
toxins, sub-cellular partitioning, and differences in profiles of PSTs between bivalves
exposed to G. catenatum blooms and bivalves with low toxicity values. Moreover, an
overview of the occurrence of PSTs episodes in Portugal was carried out, as well as the
linkage between nutrient composition and toxins in bivalves.
The scientific objectives of this study include:

Chapter 1
22
To search differences between uptake and depuration kinetics of the major toxins
produced by G. catenatum cells (dcGTX2+3, dcSTX, B1, C1+2) in the clam Ruditapes
decussatus; the selection of this species is related to the high production in Portugal;
To test whether nutrient concentration and composition influence the abundance of
toxic dinoflagellates and consequently the bivalve toxicity; this hypothesis was
tested in a eutrophic lagoon and adjacent coastal waters with recurrent toxicity
episodes;
To investigate the sub-cellular partitioning of the major toxins produced by G.
catenatum cells (dcGTX2+3, dcSTX, B1, C1+2) in the cockle Cerastoderma edule,
under post-bloom natural conditions; this species is highly abundant in estuarine
and coastal lagoons;
To examine the inter-annual and seasonal variation of bivalve toxicity episodes by
PSTs in the Portuguese waters; the commercial bivalve species Spisula solida, Donax
trunculus, Mytilus spp., Cerastoderma edule were considered.
To compare profiles of PSTs between bivalves exposed to G. catenatum blooms and
bivalves of low toxicity; differences between these two circumstances were
examined in Spisula solida, Donax trunculus, Mytilus spp., and Cerastoderma edule
from Portuguese waters.
1.9. Dissertation outline and content
After this introductory chapter, Chapter 2 presents a synthesis of the experimental and
analytical methodologies used to reach the objectives. Chapters 3 to 7 include the following
scientific articles published or submitted at peer-reviewed journals developed during the
PhD study:

Chapter 1
23
Botelho, M.J., Vale, C., Grilo, R.V., Ferreira, J.G., 2012. Uptake and release of
paralytic shellfish toxins by the clam Ruditapes decussatus exposed to
Gymnodinium catenatum and subsequent depuration. Marine Environmental
Research 77, 23-29.
Pereira, P., Botelho, M.J., Cabrita, M.T., Vale, C., Moita, M.T., Gonçalves, C., 2012.
Winter-summer nutrient composition linkage to algae-produced toxins in shellfish
at a eutrophic coastal lagoon (Óbidos lagoon, Portugal). Estuarine Coastal and Shelf
Science 112, 61-72.
Botelho, M.J., Raimundo, J., Vale, C., Ferreira, J.G., 2014. Partitioning of paralytic
shellfish toxins in sub-cellular fractions of the digestive gland of the cockle
Cerastoderma edule: Changes under post-bloom natural conditions. Ecotoxicology
and Environmental Safety 104, 365-372.
Botelho, M.J., Vale, C., Ferreira, J.G. Identification of seasonal and multi-annual
trends of bivalve toxicity by PSTs in Portuguese estuarine and coastal waters.
Estuarine, Coastal and Shelf Science, in submission.
Botelho, M.J., Vale, C., Ferreira, J.G. Profiles of paralytic shellfish toxins in bivalves of
low and elevated toxicities following exposure to Gymnodinium catenatum blooms
in Portuguese estuarine and coastal waters. Chemosphere, in submission.
The order of the chapters reflects the chronological order of the aforementioned
publications. Chapter 3 deals with the uptake and depuration kinetics of paralytic shellfish
toxins in the clam Ruditapes decussatus exposed to toxic algae. Chapter 4 examines the
possible effect of the nutrient pool in the water column on the maintenance of high
abundance of toxic cells, and consequently increasing the duration of bivalve toxicity
episodes. After these studies published in 2012, the partitioning of those toxins in
sub-cellular fractions of the digestive gland of the cockle Cerastorderme edule was
investigated, as well as alterations due to toxin biotransformation under post-bloom

Chapter 1
24
conditions (Chapter 5). Historical data on paralytic shellfish toxin concentrations and
toxicity of commercial species harvest in Portugal was used to examine multi-annual and
seasonal variations. Bivalve species and geographical areas more vulnerable to toxicity
episodes were identified (Chapter 6). Chapter 7 shows the different toxin profiles of
commercial bivalves, emphasizing the effect of biotransformation of the assimilated toxins
under post-bloom conditions. Chapter 8 presents a review of the various topics dealt with
in Chapters 3 to 7, and provides an integrative discussion to key questions linked to the
thesis objectives. Supplementary areas of research related to this thesis were identified.
Chapter 8 contains a broad discussion on the management application of this work.

Chapter 2
25
2. Methodologies
2.1. Algal cultures
2.1.1. Gymnodinium catenatum
The culture of the dinoflagellate Gymnodinium catenatum (strain C37-07, Figure 2.1)
was obtained from the IPMA algae collection and was originally isolated in 2007 from the
adjacent coastal area of Aveiro, Portugal. This strain was maintained in natural seawater
enriched with GSe medium (salinity 28, Blackburn et al., 2001) at 18oC under a 16 h light: 8
h dark photocycle with a light intensity of 15 µE m-2 s-1. The strain was then mass cultured in
10 L culture flasks under the same conditions. Cells of the toxic microalgae were counted in
Palmer-Maloney chambers under an Zeiss IM 35 inverted microscope (Hallegraeff et al.,
1995).
Figure 2.1. Light microscopy photo of Gymnodinium catenatum;
marine toxic algae collection (IPMA, ex-IPIMAR); scale bar=30 µm
2.1.2. Isochrysis galbana
The non-toxic microalga Isochrysis galbana was grown in Wallerstein and Miquel
medium (Bandarra et al., 2003) at 18oC in 75 L plastic bags under constant illumination at
salinity 25. Cells of I. galbana were counted in an automatic particle counter (Coulter EPICS
2
30 m

Chapter 2
26
XL).
2.2. Collection and processing of samples
2.2.1. Algal culture
Aliquots of 400 mL G. catenatum culture were harvested in the late exponential
growth phase. Algal mass was obtained by filtering the culture under light vacuum pressure
(100 mmHg) through GF/C glass filters (1.2 µm), and freezing in 0.1 M acetic acid at -80oC
until toxin analyses.
2.2.2. Seawater
Surface water samples were collected for phytoplankton identification, cell counting
and toxin analysis. The samples for phytoplankton identification and cell counting were
preserved in Lugol’s solution immediately after collection. The samples for toxin analysis
passed through a GF/C glass filters (1.2 µm), under light vacuum pressure (100 mmHg), and
the material retained in the filters was frozen in 0.1 M acetic acid at -80oC until analysis.
Water samples for measure of phytoplankton biomass as chlorophyll a (Chl a)
concentration, and for nutrient determination were collected at surface (0.5 m), middle (10
m) and bottom (20 m) at each sampling site. For Chl a quantification, samples were filtered
through GF/F glass filters and frozen at -20oC until analysis. Samples were filtered through
MSI Acetate Plus filters for determination of nutrients.
2.2.3. Particulate organic matter
Particulate organic matter released by bivalves (faeces and pseudofaeces) during a
laboratory feeding experiment was collected from the 5 L plastic tanks. Seawater from three
tanks was transferred to an inverted conic recipient and particles were left to settle for 12
hours. Material was then collected by filtration through 0.45 µm polycarbonate membranes,
and kept frozen in 0.1 M acetic acid at -80oC until toxin analyses.

Chapter 2
27
2.2.4. Bivalves
Whole soft tissues. Bivalves from three pools of 10 specimens each were dissected
and composite samples (n=10) of whole soft tissues were weighed and stored at -80oC until
toxin analyses.
Digestive glands. Bivalves were dissected and composite samples of digestive glands
(three pools of 10 specimens) were weighed and frozen at -80oC until toxin analysis.
2.2.5. Sub-cellular fractionation of digestive glands
For sub-cellular toxin analyses, bivalve digestive gland samples were homogenised in
a buffer solution and subjected to differential fractionation (Figure 2.2) according to the
procedure adopted from Campbell et al. (2005) and Raimundo et al. (2008).
Treatment of samples. The digestive gland composite samples were placed in an ice
bath and homogenised in a buffer solution (5 mL of buffer g-1 of digestive gland), consisting
of 0.1 M Tris-HCl and ammonium formate 0.15 M to a final pH of 7.8 (Mauriz and Blanco,
2010; Raimundo et al., 2008). The homogenisation was completed in 3 min at 11000 rpm in
a Polytron Kinematica AG homogenizer (Rossignoli and Blanco, 2010). A 3 g aliquot of the
homogenate tissue was taken as initial sample for toxin extraction and the remaining
homogenate was used for differential fractionation.
Differential fractionation. The aliquots of each homogenate pool of digestive glands
were transferred to centrifuge tubes. The homogenate was first fractioned by centrifugation
at 700 x g for 15 min at 4oC to separate the nuclei, granules and plasmatic membranes,
designated as "nuclei+debris" fraction (P1); the supernatant was further centrifuged at 9
000 x g for 20 min at 4oC to separate the mitochondria fraction (P2); the lysosomes (P3),
and microsomes (P4) fractions were obtained by centrifuging the supernatant at 30 000 x g
for 25 min, and at 100 000 x g for 40 min at 4oC, respectively. The remained soluble part,
mainly constituted by cytosolic components, was designated by cytosolic fraction.

Chapter 2
28
Figure 2.2. Schematic procedure of the sub-cellular fractionation by sequential
centrifugation; S - supernatant fraction; P - pellet fraction.
2.3. Phytoplakton and nutrients
2.3.1. Phytoplankton
Phytoplankton identification and cell counts were performed following the
sedimentation method of Uthermöl (1958). In water samples with high sediment particles
content overlapping of cells and sediment particles are likely to occur. To minimize the
underestimation of small phytoplankton species 5-25 mL of water were used in counting
chambers. Cell identification and counting were carried out under an inverted microscope
Zeiss IM 35.
Phytoplankton biomass was measured as Chl a concentration determined by
fluorescence (Perkin Elmer Fluorometer) using the modified method of Lorenzen (1966).
2.3.2. Water quality and nutrients
Temperature, salinity, dissolved oxygen and pH were measured in situ in surface
(0.2-0.5 m), middle (10 m) and bottom (20 m) waters using a YSI (650 m) multi-parametric
probe.
The determinations of nitrate+nitrite (NO3-+NO2
-), ammonium (NH4+), phosphate
100 000 x g; 40 min; 4oC
30 000 x g; 25 min; 4oC
9 000 x g; 20 min; 4oC
Tissue homogenate
Lysosomes (P3)
Microsomes (P4)
Nuclei + Granules (P1)
700 x g; 10 min; 4oC
Mitochondria (P2)
S1
S2
S3
S4Cytosolic fraction

Chapter 2
29
(PO43-) and silicate Si(OH)4 were carried out using a TRAACS 2000 (Bran+Luebbe)
autoanalyser (Grasshoff et al., 1983). In addition, total dissolved nitrogen and total
dissolved phosphorus were measured according to Koroleff´s method (1983) modified by
the ISO 11905-1 (1997). Dissolved organic nitrogen and dissolved organic phosphorus were
estimated by subtracting the mass of dissolved inorganic nitrogen (NO3-+NO2
-+ NH4+) and of
PO43- from the mass of total dissolved nitrogen and total dissolved phosphorus, respectively.
2.4. Paralytic shellfish toxins
2.4.1. Chemical methodologies for PSTs
During the last decades, chemical methodologies for determination of PSTs have
been under development and validation, attempting to replace the mouse bioassay as the
official method (Anon., 2005a). A instrumental chemical method of liquid chromatography
with fluorescence detection (LC-FLD) involving pre-chromatographic oxidation was adopted
by the Association of Official Analytical Chemists (AOAC 2005.06) as an official method for
determination of PSTs in bivalves (Anon., 2005b). After validation through a collaborative
study for STX, NEO, GTX2+3, GTX1+4, dcSTX, B1, C1+2 and C3+4 in bivalves (mussels, clams,
oysters, and scallops) the method was integrated in European Directives to act as a legal
alternative to the mouse bioassay (Lawrence et al., 2005; Anon., 2006). Recently, a
refinement and extension of the AOAC method to other bivalve species, offers possibilities
to achieve reliable analytical alternatives, as well as including the additional toxins dcNEO
and dcGTX2+3 (Turner et al., 2009; 2010). As the method was applied in routine analysis
difficulties have been reported for profiles derived from various toxin-producer
phytoplankton species (Ben-Gigirey et al., 2007).
The AOAC method, also called ‘‘the Lawrence method’’ was primarily developed for
bivalve samples contaminated by Alexandrium spp. blooms, where N-sulfocarbamoyl and
decarbamoyl toxins made a smaller contribution to the PSTs profile (Lawrence et al., 1991).
A different situation occurs with bivalves contaminated by Gymnodinium catenatum in
Portuguese and Galician waters. The non-hydroxylated compounds (B1, C1+2, dcSTX,

Chapter 2
30
dcGTX2+3) emerge as major components of the toxin profiles (Franca et al., 1989;
Camino-Ordás et al., 2004). Due to these specificities in toxin profiles in bivalves exposed to
G. catenatum an adaptation of this method was developed. The modification was centered
on the inversion of the sequence of oxidation reactions of the AOAC method, firstly
quantifying the non-hydroxylated toxins in the peroxide oxidation (Botelho et al., 2010).
Under these conditions one can assume that if non-N-hydroxylated compounds are absent,
then N-hydroxylated toxins will also be absent. Consequently, no further action is necessary,
having the merit of being less-time consuming.
The determination of PSTs in samples of bivalve tissues, toxic algae, and particulate
organic matter presented in this thesis were based on AOAC 2005.06 (Anon., 2005b).
2.4.2. Toxin extraction, cleanup and oxidation
Bivalve samples
The extraction, cleanup and oxidation procedures for PSTs determination in bivalve
samples were performed according to the following steps:
Acid extraction. Three mL of 1% acetic acid were added to approximately 5 g bivalve
homogenate in a centrifuge tube, mixed by vortexing, and the mixture boiled for 5 min in a
water bath. The tubes were then placed in a beaker of cold water for 5 min to cool down
and centrifuged at 3600 x g for 10 min at room temperature. The supernatant was saved,
and the pellet was extracted again with 3 mL of 1% acetic acid. The two supernatants were
mixed, and the final volume was brought up to 10 mL with water.
Cleanup. An octadecyl bonded phase silica C18 SPE (Solid Phase Extraction) cartridge
(500 mg/3 mL) (Supelclean, Supelco, USA) was preconditioned with 6 mL of methanol
followed by 6 mL of water. Then 1 mL of extract (0.5 g bivalve equivalent) was loaded into
the cartridge, washed with 2 mL of water and the washing was combined with the effluent.
The pH of the extract was adjusted to 6.5 with 0.2 M NaOH and diluted to exactly 4 mL.
Aliquots of this extract were used for oxidation of PSTs with peroxide and periodate
respectively prior to LC analyses.

Chapter 2
31
Sequential fractionation. A second column purification, SPE ion exchange cartridge
with carboxylic acidsiliane (COOH) bonded to silica gel (500 mg/3 mL) (Bakerbond, J.T. Baker,
USA) was used only for extracts found to contain N-hydroxylated PSTs after C18 cleanup.
This procedure was necessary to separate NEO from B2, and GTX1+4 from C3+4 toxins since
they produced the same oxidation product. The cartridges were conditioned by washing
with 10 mL of 0.01 M aqueous ammonium acetate. A 2 mL aliquot of C18 clean extract was
placed on the column and the eluate collected into a 15 mL graduated conical test tube. The
column was eluted with 4 mL of ultrapure water and the eluates combined and adjusted to
6 mL of final volume. Fraction 1 was considered to contain the C toxins. The same COOH
cartridge was again eluted with 4 mL of 0.05 M NaCl solution, the eluate collected and the
volume adjusted to 4 mL with ultrapure water (fraction 2). This fraction contains toxins
GTX1+4, GTX2+3, B1, B2 and dcGTX2+3. Further elution of the column with 5 mL of 0.3 M
NaCl solution followed by adjustment to 5 mL with ultrapure water, produces fraction 3,
which contains toxins STX, NEO, dcSTX and dcNEO.
Peroxide oxidation. Aqueous hydrogen peroxide (25 µL, 10% v/v) was added to 250 µL
of 1 M NaOH in a 1.5 mL glass vial and vortex mixed. Then 100 µL PST standard solution or
sample extract after C18 or ion exchange cleanup was added, and allowed to react for 2 min
at room temperature. Glacial acetic acid (20 µL) was added and vortex mixed before
analysis by LC.
Periodate oxidation. The periodate reagent was prepared daily by mixing 5 mL each of
0.03 M periodic acid, 0.03 M ammonium formate and 0.3 M disodium hydrogen phosphate
and the pH was adjusted to 8.2 with 0.2 M NaOH (Gago-Martínez et al., 2001). A matrix
modifier was made with an extract prepared from PST-free oysters as described below for
C18 cleanup. Aliquots (100 µL) of PSTs standard solution, or sample extract after C18 or ion
exchange COOH, were added to 100 µL of matrix modifier solution in a 1.5 mL glass vial.
Periodate oxidant (500 µL) was added and the mixture thoroughly mixed and allowed to
react during 1 min. Then glacial acetic acid (5 µL) was added and the mixture was allowed to
stand for a further 10 min before analysis by LC.
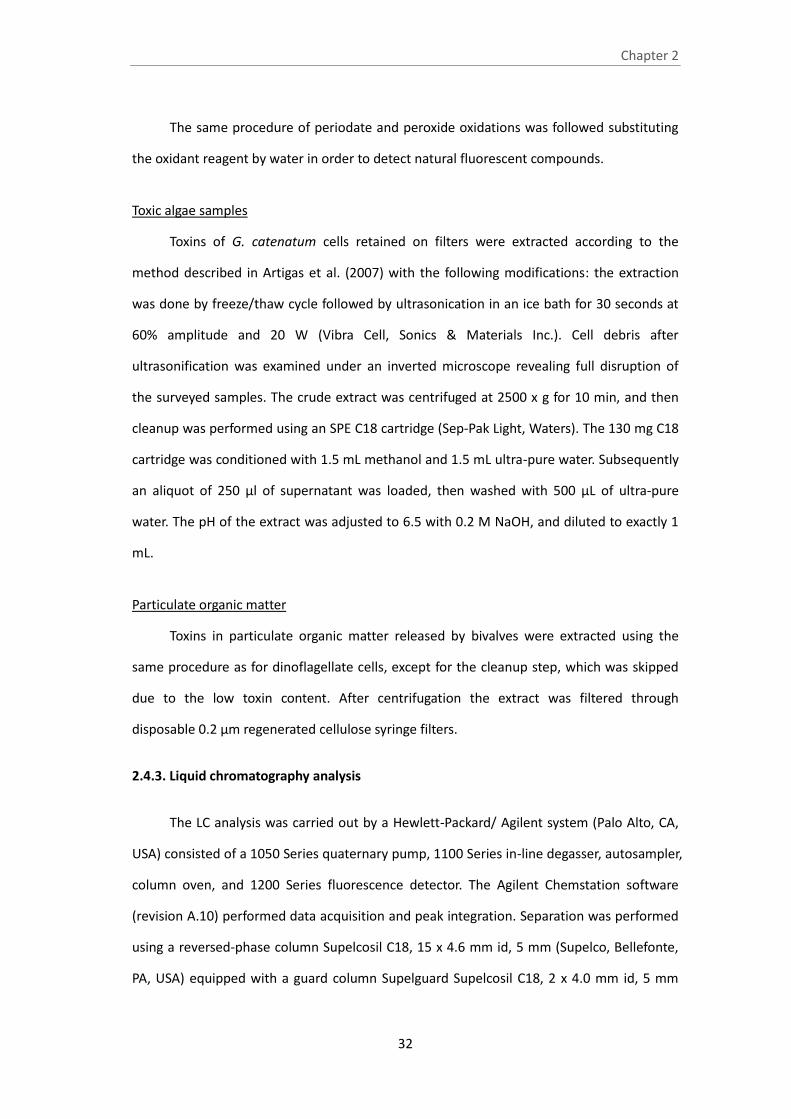
Chapter 2
32
The same procedure of periodate and peroxide oxidations was followed substituting
the oxidant reagent by water in order to detect natural fluorescent compounds.
Toxic algae samples
Toxins of G. catenatum cells retained on filters were extracted according to the
method described in Artigas et al. (2007) with the following modifications: the extraction
was done by freeze/thaw cycle followed by ultrasonication in an ice bath for 30 seconds at
60% amplitude and 20 W (Vibra Cell, Sonics & Materials Inc.). Cell debris after
ultrasonification was examined under an inverted microscope revealing full disruption of
the surveyed samples. The crude extract was centrifuged at 2500 x g for 10 min, and then
cleanup was performed using an SPE C18 cartridge (Sep-Pak Light, Waters). The 130 mg C18
cartridge was conditioned with 1.5 mL methanol and 1.5 mL ultra-pure water. Subsequently
an aliquot of 250 µl of supernatant was loaded, then washed with 500 µL of ultra-pure
water. The pH of the extract was adjusted to 6.5 with 0.2 M NaOH, and diluted to exactly 1
mL.
Particulate organic matter
Toxins in particulate organic matter released by bivalves were extracted using the
same procedure as for dinoflagellate cells, except for the cleanup step, which was skipped
due to the low toxin content. After centrifugation the extract was filtered through
disposable 0.2 µm regenerated cellulose syringe filters.
2.4.3. Liquid chromatography analysis
The LC analysis was carried out by a Hewlett-Packard/ Agilent system (Palo Alto, CA,
USA) consisted of a 1050 Series quaternary pump, 1100 Series in-line degasser, autosampler,
column oven, and 1200 Series fluorescence detector. The Agilent Chemstation software
(revision A.10) performed data acquisition and peak integration. Separation was performed
using a reversed-phase column Supelcosil C18, 15 x 4.6 mm id, 5 mm (Supelco, Bellefonte,
PA, USA) equipped with a guard column Supelguard Supelcosil C18, 2 x 4.0 mm id, 5 mm

Chapter 2
33
(Supelco, Bellefonte, PA, USA). The column was kept in a column oven at 30oC. Detection
wavelengths were set at 340 nm for excitation and 395 nm for emission. The mobile phase
gradient used to elute the PST oxidation products consisted of 2 mobile phases under the
following conditions: 0–5% B (0.1 M ammonium formate in 5% acetonitrile, pH=6) in the
first 5 min, 5–70% B for the next 4 min and 100% mobile phase A (0.1 M ammonium
formate, pH=6) was used for 5 min before next injection. The flow rate was 1 mL min-1. The
injection volumes were 50 mL and 100 mL, for the oxidation products of peroxide and
periodate reaction, respectively.
2.4.4. Identification and quantification of PSTs
All PSTs were identified and quantified by comparison of peak areas of sample
oxidation products and of working standards. The compounds GTX2+3, GTX1+4, C1+2 and
C3+4 were quantified jointly due to the fact that the oxidation process creates the same
oxidation product. Due to the lack of commercial standards, the identification of C3+4 and
B2 was done taking into account their retention time described in the LC method
(Ben-Gigirey et al., 2007; Lawrence and Niedzwiadek, 2001).
Since the non-N-hydroxylated toxins form highly fluorescent derivatives with
hydrogen peroxide oxidation but not N-hydroxylated toxins, chromatograms of peroxide
oxidised samples are used for the detection and quantification of non-N-hydroxylated toxins
(dcGTX2+3, C1+2, dcSTX, B1, GTX2+3 and STX) (Figure 2.3). Periodate oxidation of the C18
extract was used to quantify the dcNEO toxin, avoiding dilution effect during the SPE-COOH
fractionation. This toxin may also be determined from the C18-fraction 3-periodate
oxidation extract as mentioned in Turner et al. (2009). To separate N-hydroxylated toxins,
namely C3+4 from GTX1+4, and B2 from NEO, an SPE-COOH ion exchange column was used.
The LC measurements after periodate oxidation of each fraction allowed to detect and/or
quantify potential N-hydroxylated toxins (C3+4 in fraction 1; GTX1+4 and B2 in fraction 2;
NEO in fraction 3). The peaks used for quantification of GTX1+4 and NEO were those
recommended by Lawrence et al. (2005). Figure 2.4 presents chromatograms illustrating

Chapter 2
34
toxin separation in a mussel sample with a toxic profile characteristic of Gymnodinium
catenatum after peroxide and periodate oxidation of C18 extract, and periodate oxidation
of fractions 1 to 3.
Figure 2.3. Flow diagram with the sequence of oxidation reactions and corresponding toxin
identification after C18 cleanup or SPE-COOH fractionation (1=peroxide oxidation of C18 extract;
2=periodate oxidation of C18 extract; 3=periodate oxidation of fractions 1 to 3)
Acid extraction
Cleanup (C18)
LC analysis I
SPE-COOH fractionation
Peroxide oxidation
dcGTX2+3, B1, C1+2, dcSTX,
GTX2+3 and STX
1
Periodate oxidation
C3+4 , GTX1+4, B2 and NEO
dcNEOLC analysis II
LC analysis IIIPeriodate oxidation
32

Chapter 2
35
Figure 2.4. Chromatograms obtained for a mussel sample with a toxic profile characteristic of
Gymnodinium catenatum. (a) quantification of dcGTX2+3, C1+2, dcSTX, GTX2+3, B1 and STX
(peroxide-C18); (b) quantification of dcNEO (periodate-C18); (c) detection of C3+4
(periodate-SPE-COOH-F1); (d) quantification of GTX1+4 and detection of B2
(periodate-SPE-COOH-F2).
0
10
20
30
40
50
60
70
0 2 4 6 8 10 12min
Dete
cto
r re
sponse (
LU
)
dcSTX
dcGTX2,3
C1,2
B1
GTX2,3 STX
0
20
40
60
80
100
120
0 2 4 6 8 10 12
min
Dete
cto
r re
sponse (
LU
)
dcSTX
dcNEO
0
10
20
30
0 2 4 6 8 10 12
min
Dete
cto
r re
sponse (
LU
)
C3+4 ?
(c)
0
10
20
30
40
0 2 4 6 8 10 12
min
Dete
cto
r re
sponse (
LU
)
dcGTX2+3 (2º)
dcGTX2+3 (1º)
B2 (1º)?
B2 (2º)?
B2 (3º)?
Naturally fluorescent
peak
(d)
(c)
(b)
(a)
(d)

Chapter 2
36
Figure 2.4. (cont.) (e) quantification of NEO (periodate-SPE-COOH-F3).
The abundant dcSTX in extracts from shellfish samples contaminated by Gymnodinum
catenatum frequently leads to the interference in the dcNEO quantification due to similar
retention time after periodate oxidation (Botelho et al., 2010). To resolve the overlapped
areas, dcNEO was quantified by subtracting the dcSTX contribution. This contribution was
estimated from the calibration curve oxidized with periodate, using the dcSTX concentration
obtained previously under perioxide oxidation. A similar calculation was applied to quantify
(i) GTX1+4 in the extract from fraction 2 followed by periodate oxidation, subtracting the
contribution of dcGTX2+3, and (ii) NEO in the extract from fraction 3 followed by periodate
oxidation, subtracting the contribution of dcNEO and dcSTX. The procedure to quantify
N-hydroxylated toxins in presence of dcSTX has been adopted in Turner et al. (2009).
2.4.5. Estimation of B2 concentration
Despite the unavailability of commercial certified reference material for the toxin B2,
its concentration was estimated through the hydrolysis conversion into NEO toxin. The
analytical procedure was based on the Marine Biotoxins Report of the Community
Reference Laboratory for the determination of PSP toxins in shellfish including B2 (GTX6)
after hydrolysis (Anon., 2007). Aliquots of fraction 2 (SPE-COOH fractionation) containing
the toxin B2 were used for periodate oxidation, prior to LC-FLD analyses. The LC
measurements after periodate oxidation of this fraction allowed the detection of B2. 125 L
of 1 M chloridric acid solution were added to 500 L of fraction 2 in a glass tube. The tube
0
10
20
30
0 2 4 6 8 10 12
minD
ete
cto
r re
sponse (
LU
)
dcSTX
+
dcNEO
+
NEO
(e) (e)

Chapter 2
37
was closed and heated for 20 minutes at 90oC in a water bath, and then allowed to cool
down at room temperature. The reaction was then neutralized adding small volumes of 1 M
sodium hydroxide solution. The solution was mixed after each addition until a volume of
125 L was obtained. After neutralization, the pH of the hydrolyzed extract was adjusted to
8.2. Hydrolysed extracts were submitted to periodate oxidation and B2 toxin was indirectly
quantified through conversion into NEO. It was assumed that the molarity of B2 toxin
hydrolyzed was equal to the molarity of the NEO toxin present in fraction 2 after hydrolysis.
2.4.6. Certified reference materials
In order to check the precision and accuracy of the measurements, certified reference
materials were used in this work. Certified calibration solutions for PSTs were purchased
from the Certified Reference Materials Program of the Institute for Marine Biosciences,
National Research Council, Halifax, Canada (CRM-STX-e, CRM-NEO-b, CRM-GTX2&3-b,
CRM-GTX1&4-b, CRM-dcSTX, CRM-dcGTX2&3, CRM-GTX5-b (B1), CRM-C1&2, CRM dcNEO-b
and NEO-b. Working standard solutions were prepared by appropriate dilution of the
corresponding stock solution and stored at 4oC during 1 month. Two standard toxin
mixtures were prepared: GTX1+4 and NEO (Mix I); GTX2+3, dcGTX2+3, STX, dcSTX, B1 and
C1+2 (Mix II). The dcNEO was used individually in working standard solutions.
For quantification of PSTs in bivalve tissues, matrix-matched calibration curves with
cleaned-up bivalve tissue extract were used as described in Botelho et al. (2010). Calibration
curves prepared in solvent were used for toxin quantification in G. catenatum and particles
extracts.
2.4.7. Performance and quality control
Limits of detection (LOD) were experimentally determined using a signal:noise ratio
of 3:1. Oxidation of standard toxin mixtures and subsequent quantification in triplicate were
used to assess the variability of those amounts. The non-N-hydroxylated toxins exhibited
lower LODs than N-hydroxylated toxins, reflecting higher sensitivity of the methodology for
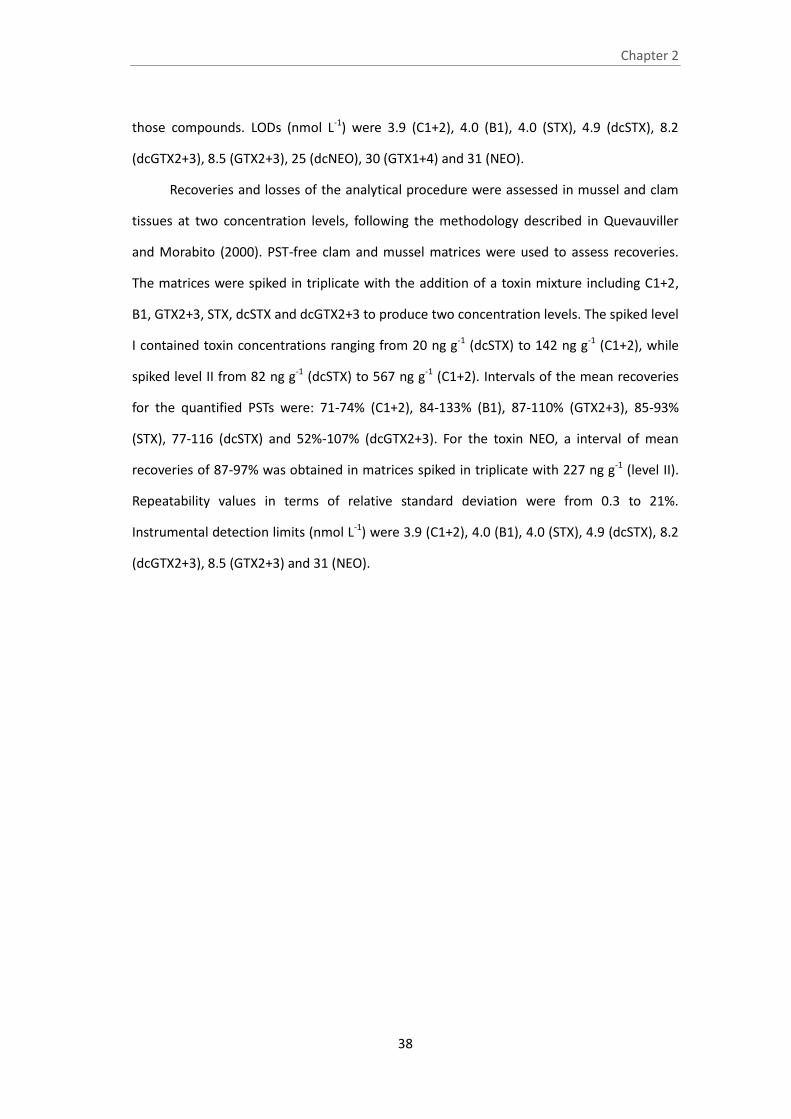
Chapter 2
38
those compounds. LODs (nmol L-1) were 3.9 (C1+2), 4.0 (B1), 4.0 (STX), 4.9 (dcSTX), 8.2
(dcGTX2+3), 8.5 (GTX2+3), 25 (dcNEO), 30 (GTX1+4) and 31 (NEO).
Recoveries and losses of the analytical procedure were assessed in mussel and clam
tissues at two concentration levels, following the methodology described in Quevauviller
and Morabito (2000). PST-free clam and mussel matrices were used to assess recoveries.
The matrices were spiked in triplicate with the addition of a toxin mixture including C1+2,
B1, GTX2+3, STX, dcSTX and dcGTX2+3 to produce two concentration levels. The spiked level
I contained toxin concentrations ranging from 20 ng g-1 (dcSTX) to 142 ng g-1 (C1+2), while
spiked level II from 82 ng g-1 (dcSTX) to 567 ng g-1 (C1+2). Intervals of the mean recoveries
for the quantified PSTs were: 71-74% (C1+2), 84-133% (B1), 87-110% (GTX2+3), 85-93%
(STX), 77-116 (dcSTX) and 52%-107% (dcGTX2+3). For the toxin NEO, a interval of mean
recoveries of 87-97% was obtained in matrices spiked in triplicate with 227 ng g-1 (level II).
Repeatability values in terms of relative standard deviation were from 0.3 to 21%.
Instrumental detection limits (nmol L-1) were 3.9 (C1+2), 4.0 (B1), 4.0 (STX), 4.9 (dcSTX), 8.2
(dcGTX2+3), 8.5 (GTX2+3) and 31 (NEO).

Chapter 3
39
3. Uptake and release of paralytic shellfish toxins by the clam Ruditapes
decussatus exposed to Gymnodinium catenatum and subsequent
depuration
Botelho, M.J., Vale, C., Grilo, R.V., Ferreira, J.G., 2012. Uptake and release of paralytic
shellfish toxins by the clam Ruditapes decussatus exposed to Gymnodinium catenatum and
subsequent depuration. Marine Environmental Research 77, 23-29.
(doi:10.1016/j.marenvres.2012.01.002).
3

Chapter 3
40
Abstract
A laboratory experiment was performed with the clam Ruditapes decussatus, fed with
the toxic dinoflagellate Gymnodinium catenatum and the non-toxic algae Isochrysis galbana
(14 days) and subsequently only with I. galbana (15 days). Individual paralytic shellfish toxins
were determined by LC-FLD in G. catenatum cells, whole clam tissues, and particulate organic
matter (POM) produced by clams. The toxins dcSTX and dcGTX2+3 in the algae were less
abundant than C1+2 and B1, but were predominant in clams during both the exposure and
depuration phases. The toxin dcNEO was only detected in clams during a short period,
indicating conversion from other compounds. The toxin composition of the POM indicated the
export of dcSTX as faeces or pseudo-faeces along the entire experiment (2.5-14 nmol mg-1), B1
was present in a short period of the exposure and C1+2 and dcGTX2+3 absent. A mass balance
calculation indicated that approximately 95% of C1+2 and 85% of B1 supplied to the clams
were converted into other toxins or lost in solution. Conversely, the net gain of 512, 61 and 31
nmol for dcSTX, dcGTX2+3 and dcNEO, respectively, suggests the conversion from other
assimilated compounds by clams during exposure and depuration phases.
Keywords: Paralytic shellfish toxins; Ruditapes decussatus; Particulate organic matter;
Uptake; Depuration; Mass balance
3.1. Introduction
Paralytic shellfish toxins (PSTs) are a group of neurotoxic alkaloids produced in the
marine environment by dinoflagellates like Alexandrium spp., Pyrodinium bahamense and
Gymnodinium catenatum (Llewellyn, 2006). The documented PSTs are grouped into three
structural families in decreasing order of toxicity (Oshima, 1995a; Anon., 2009): carbamate
(saxitoxin-STX, neosaxitoxin-NEO and gonyautoxins-GTX1 to GTX4), decarbamoyl (dcGTX1 to
dcGTX4, dcSTX and dcNEO), and N-sulfocarbamoyl (B1, B2, C1 to C4). Most of the Alexandrium
species have a carbamate-dominated toxin profile, while decarbamoyl and N-sulfocarbamoyl

Chapter 3
41
toxins are dominant components in G. catenatum (Cembella et al., 1987; Chou et al., 2004;
Ordás et al., 2004; Band-Schmidt et al., 2005; Costa et al., 2010). It is well documented that
PSTs are efficiently accumulated by filter-feeders during blooms of toxic phytoplankton species,
being causative agents of paralytic shellfish poisoning in humans (Sommer and Meyers, 1937;
Gessner and Middaugh, 1980).
Various studies have proved that shellfish exposed to dinoflagellates exhibit different
PSTs profiles from the toxin producers (Oshima et al., 1990; Bricelj et al., 1990; Cembella et al.,
1993; Samsur et al., 2006). Metabolic interconversion of assimilated PSTs achieved by
enzymatic and chemical reactions in shellfish tissues may contribute to those differences
(Shimizu and Yoshioka, 1981; Kotaki et al., 1985; Oshima, 1995b; Bricelj and Shumway, 1998).
Incubation in vitro of toxic dinoflagellates or purified toxins extracts allowed elucidating the
role of enzymatic activities (Sullivan et al., 1983; Fast et al., 2006; Artigas et al., 2007). Different
uptake and depuration kinetics of individual PSTs may also contribute to the registered
modifications on toxin profiles between the toxic algae and the exposed shellfish (Blanco et al.,
2003; Yu et al., 2007; Botelho et al., 2010a).
Despite the low concentration of individual toxins in the dissolved fraction their
quantification provides additional information on the elimination of individual PSTs (Bricelj and
Shumway, 1998; Sekiguchi et al., 2001). Toxins in particulate organic matter rejected by
shellfish are at higher concentrations, but may be difficult to interpret if encompassing
particles from different pathways, namely faeces, pseudofaeces and wasted food (Samsur et al.,
2006; Estrada et al., 2007; Samsur et al., 2007).
This work reports the levels of the toxins C1+2, B1, dcSTX, dcGTX2+3 and dcNEO in
whole tissues of the clam Ruditapes decussatus and in particulate organic matter rejected by
the clams during a 29-day feeding experiment, including exposure to Gymnodinium catenatum
and subsequent depuration. Toxin composition of toxic algae, clams and particulate fraction in
conjunction with mass balance calculations for individual toxins, allowed identifying the toxins
exported as faeces or pseudo-faeces, as well as the compounds biotransformed during
exposure and depuration phases.

Chapter 3
42
3.2. Material and Methods
3.2.1. Algal culture
The culture of the dinoflagellate Gymnodinium catenatum (strain C37-07, IPIMAR
collection) was maintained in natural seawater enriched with GSe medium (salinity 28,
Blackburn et al., 2001) at 18oC under a 16 h light: 8 h dark photocycle with a light intensity of
15 µmol photons m-2 s-1. The strain was then mass cultured in 10-L culture flasks under the
same conditions to supply to the clam feeding experiment. Cells of G. catenatum were
harvested in the late exponential growth phase. The non-toxic microalgae Isochrysis galbana
was grown in Wallerstein and Miquel medium (Bandarra et al., 2003) at 18oC in 75-L plastic
bags under constant illumination at salinity 25. Cells of the toxic microalgae were counted in
Palmer-Maloney chambers under an Zeiss IM 35 inverted microscope and of I. galbana in an
automatic particle counter (Coulter EPICS XL).
3.2.2. Clams
A total of 450 clams (Ruditapes decussatus) were obtained from growth banks at Ria
Formosa, a coastal lagoon located in southern Portugal with an annual production of 5000 T.
Clams were collected in November 2008, after several years of undetected G. catenatum
blooms in the lagoon or adjacent coastal zone. Animals were acclimatized during 15 days to the
laboratory conditions in a 50-L aerated polyethylene tank with filtered seawater and fed daily
with the non-toxic microalga I. galbana culture (2x10⁹ cells). Whole tissue wet weight and shell
length of the clams ranged within 1.3-1.8 g and 2.8-3.9 cm, respectively.
3.2.3. Feeding experiment
Clams were divided into 42 groups of 10 individuals each and placed into 5 L plastic tanks
filled with filtered natural seawater stored in a reservoir. The seawater in the tanks was
continuously aerated and renewed daily. Water temperature remained at 12±1oC. The feeding
experiment consisted of two phases schematically illustrated in figure 3.1. During phase I (14
days) each 10 clam group was fed twice a day with 1x10⁴ cells of G. catenatum culture and

Chapter 3
43
5x10⁷ cells of I. galbana culture. During phase II (15 days) clams were fed twice a day only with
5x10⁷ cells of I. galbana culture. No control animals were considered in the experiment, since I.
galbana does not produce toxins and clam responses to toxin exposure was not studied.
Throughout the 29 days of the experiment no clam deaths occurred and changes in the whole
tissue weight were negligible.
Figure 3.1. Schematic representation of the laboratory feeding experiment.
3.2.4. Samples
Toxic algae. Aliquots of 400 mL G. catenatum culture were harvested at days 3, 9 and 14
of the phase I for toxin analysis. Algal mass was obtained by filtering the culture under light
vacuum pressure (100 mmHg) through GF/C glass filters (1.2 µm), and freezing in 0.1 M acetic
acid at -80oC until analysis. Clams. Specimens from three pools of 10 clams each were
sacrificed in days 0, 3, 5, 7, 9, 11, 13, 15, 17, 19, 21, 23, 25, 27 and 29, dissected and composite
samples (n=10) of whole soft tissues were prepared and stored at -80oC until analysis.
Particulate organic matter. Particulate organic matter (POM) produced by clams was collected
from the experimental tanks daily after day 3. Seawater of three tanks was transferred to an
inverted conic recipient and particles were left settling for 12 hours. Material was then
collected by filtration through 0.45 µm polycarbonate membranes, and kept frozen in 0.1 M
acetic acid at -80oC until analysis.
Experimental Tank
Sets of
10 clams
Particulate organic matter (daily after day 3)
Gymnodinium catenatum +
Isochrysis galbana
Phase I: exposure (14 days)
Phase II: depuration (15 days)
(algae supplied twice a day)
Set of clams (day 0, day 3 and every two days)
Isochrysis galbana

Chapter 3
44
3.2.5. Reagents
All chemicals and solvents used were LC or analytical grade. Sodium hydroxide and
hydrogen peroxide were from Merck (Germany). Ultra-pure water was obtained by a Milli-Q
system Millipore (France). Acetonitrile, acetic acid, methanol and ammonium formate were
purchased from Sigma-Aldrich (Germany).
3.2.6. Toxin extraction and oxidation
Toxic algae. Toxins of G. catenatum cells retained on filters were extracted according to
the method described in Artigas et al. (2007), with the following modifications. The extraction
was done by freeze/thaw cycle followed by ultrasonication in an ice bath for 30 seconds at 60%
amplitude and 20 W (Vibra Cell, Sonics & Materials Inc.). Cell debris after ultrasonification was
examined under an inverted microscope revealing full disruption of the surveyed samples. The
crude extract was centrifuged at 2500 x g for 10 min, and then cleanup using a Solid Phase
Extraction (SPE) C18 cartridge (Sep-Pak Light, Waters, USA). The 130 mg C18 cartridge was
conditioned with 1.5 mL methanol and 1.5 mL ultra-pure water. Subsequently an aliquot of 250
µl of supernatant was loaded, then washed with 500 µL of ultra-pure water. The pH of the
extract was adjusted to 6.5 with 0.2 mol L-1 NaOH, and diluted to exactly 1 mL.
POM. Toxins in the collected POM were extracted using the same procedure as for
dinoflagellate cells, except for the cleanup step, which was skipped due to the low toxin
content. After centrifugation the extract was filtered through disposable 0.2 µm regenerated
cellulose syringe filters.
Clams. Approximately 5 g of clam homogenate were double-extracted with 1% acetic
acid solution (first extraction with heating), following AOAC 2005.06 (Anon., 2005b). The
extract passed through a SPE C18 cartridge (500 mg/3 mL, Supelclean, Supelco, USA).
Aliquots of G. catenatum, clams and particles extracts were used for peroxide and
periodate oxidation of PSTs prior to liquid chromatography with fluorescence detection (LC-FLD)
analyses. The procedure used in the oxidation of PSTs was based on the AOAC method (Anon.,
2005) with a procedural modification due to dominance of N-sulfocarbamoyl and decarbamoyl
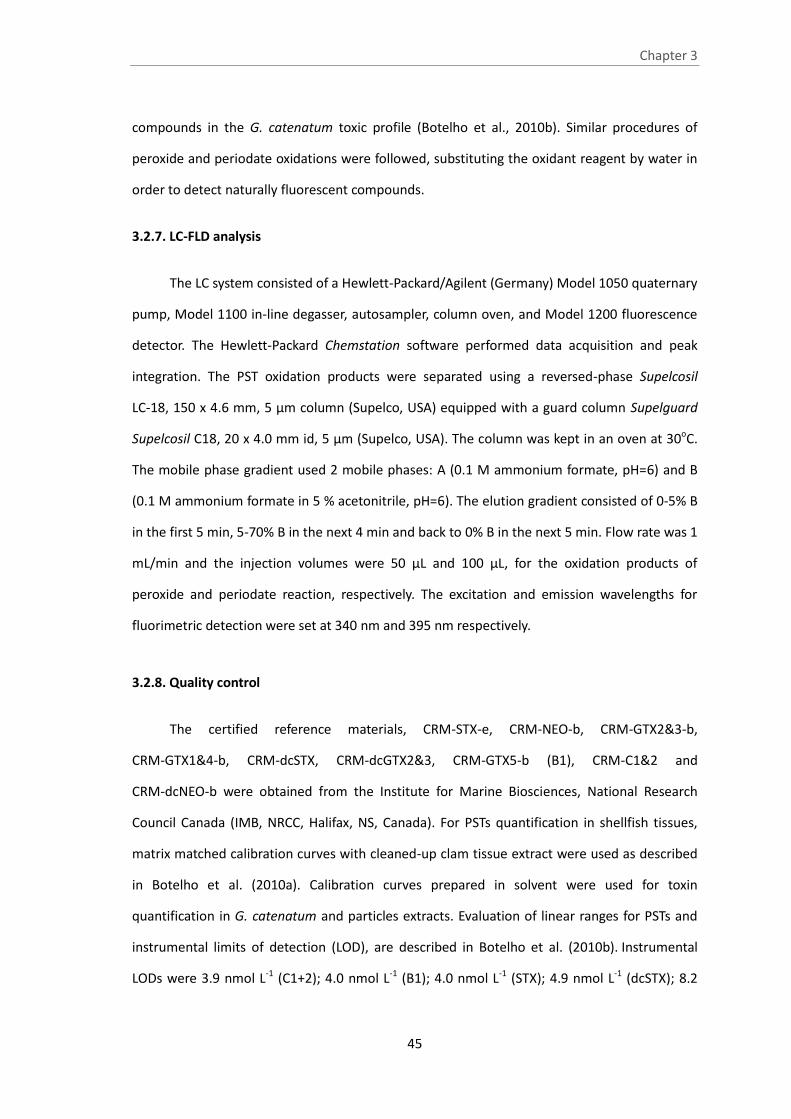
Chapter 3
45
compounds in the G. catenatum toxic profile (Botelho et al., 2010b). Similar procedures of
peroxide and periodate oxidations were followed, substituting the oxidant reagent by water in
order to detect naturally fluorescent compounds.
3.2.7. LC-FLD analysis
The LC system consisted of a Hewlett-Packard/Agilent (Germany) Model 1050 quaternary
pump, Model 1100 in-line degasser, autosampler, column oven, and Model 1200 fluorescence
detector. The Hewlett-Packard Chemstation software performed data acquisition and peak
integration. The PST oxidation products were separated using a reversed-phase Supelcosil
LC-18, 150 x 4.6 mm, 5 µm column (Supelco, USA) equipped with a guard column Supelguard
Supelcosil C18, 20 x 4.0 mm id, 5 µm (Supelco, USA). The column was kept in an oven at 30oC.
The mobile phase gradient used 2 mobile phases: A (0.1 M ammonium formate, pH=6) and B
(0.1 M ammonium formate in 5 % acetonitrile, pH=6). The elution gradient consisted of 0-5% B
in the first 5 min, 5-70% B in the next 4 min and back to 0% B in the next 5 min. Flow rate was 1
mL/min and the injection volumes were 50 µL and 100 µL, for the oxidation products of
peroxide and periodate reaction, respectively. The excitation and emission wavelengths for
fluorimetric detection were set at 340 nm and 395 nm respectively.
3.2.8. Quality control
The certified reference materials, CRM-STX-e, CRM-NEO-b, CRM-GTX2&3-b,
CRM-GTX1&4-b, CRM-dcSTX, CRM-dcGTX2&3, CRM-GTX5-b (B1), CRM-C1&2 and
CRM-dcNEO-b were obtained from the Institute for Marine Biosciences, National Research
Council Canada (IMB, NRCC, Halifax, NS, Canada). For PSTs quantification in shellfish tissues,
matrix matched calibration curves with cleaned-up clam tissue extract were used as described
in Botelho et al. (2010a). Calibration curves prepared in solvent were used for toxin
quantification in G. catenatum and particles extracts. Evaluation of linear ranges for PSTs and
instrumental limits of detection (LOD), are described in Botelho et al. (2010b). Instrumental
LODs were 3.9 nmol L-1 (C1+2); 4.0 nmol L-1 (B1); 4.0 nmol L-1 (STX); 4.9 nmol L-1 (dcSTX); 8.2
Chapter 3
46
nmol L-1 (dcGTX2+3); 8.5 nmol L-1 (GTX2+3); 25 nmol L-1 (dcNEO); 30 nmol L-1 (GTX1+4) and 31
nmol L-1 (NEO). Recoveries of the analytical procedure were assessed through clam tissues
spiked in triplicate, with the addition of a toxin mixture at two concentration levels. Intervals of
the mean recoveries for the quantified PSTs in clams were: 71-74% (C1+2), 97-98% (B1), 77-114%
(dcSTX), 85-107% (dcGTX2+3) and 55-56% (dcNEO). Repeatability values in terms of relative
standard deviation were from 1 to 18%. Moreover, recoveries were assessed in POM spiked
with B1 and dcSTX in triplicate at two concentration levels. Only the toxins quantified in POM
were considered. The following intervals were obtained: 101-107% (B1) and 76-97% (dcSTX).
Repeatability values were from 12 to 18%.
3.2.9. Mass balance calculation
The mass balance for individual toxins in clams was calculated for a basis of 100 clams by
the following equation:
Ta + Tg = Tc + Tp + Tl + Tr (3.1)
Where:
Ta: mass of individual toxin in the toxic algae supplied to the clams
Tg: mass of individual toxin in clams gained by conversion of other assimilated compounds
Tc: mass of individual toxin accumulated in whole clam tissues
Tp: mass of individual toxin in particulate organic matter of the experimental tanks
Tl: mass of individual toxin in clams lost by conversion
Tr: mass of individual toxin released by clams to solution
The mass balance was calculated assuming that clams have ingested the whole algal
mass supplied, and consequently the particulate organic matter collected in the experiments
tanks consisted of material produced by clams. This assumption is consistent with the lack of G.
catenatum intact cells in seawater from the tanks that was examined microscopically on a daily
basis. In equation 3.1 Tg, Tl and Tr are unknown terms, their sum being substituted by Tng that

Chapter 3
47
may be considered as a net gain quantity. By resolving the equation 3.1 Tng was calculated by:
Tng = Tc + Tp - Ta (3.2)
3.2.10. Statistical analysis
Data statistical analysis were performed using the STATISTICA 6.0 Statistical Software
System. The fitting of time-course variation of toxin concentrations to the experimental points
was assessed by SigmaPlot 8.0 (Systat Software Inc.).
3.3. Results
3.3.1. Toxin profile of Gymnodinium catenatum
Figure 3.2 shows the median, the percentile 25% and 75%, minimum and maximum of
concentrations of the toxins C1+2, B1, dcSTX and dcGTX2+3 quantified in the culture of
Gymnodinium catenatum. Samples were taken in replicates (n=4) every 5 days during the 14
days of the exposure phase of the experiment. The N-sulfocarbamoyl analogues B1 and C1+2
were the major toxins produced by this culture, concentrations exceeding one order of
magnitude the values found for the decarbamoyl analogues dcSTX and dcGTX2+3. Variation of
the concentrations for the three sampling periods was comparable to values of the four
replicates at each sampling period for C1+2 (33 and 31%), B1 (41 and 31%) and dcSTX (31 and
31%). A larger discrepancy was observed for dcGTX2+3 (42 and 19%). Modifications on cell size,
chain length, and toxin leakage may contribute to the observed variability (Granéli and Flynn,
2006; Band-Schmidt et al., 2010).
3.3.2. Toxin concentrations in Ruditapes decussatus
Mean concentrations (± one standard deviation) of the toxins C1+2, B1, dcSTX, and
dcGTX2+3 in whole soft tissues of R. decussatus collected at days 0, 3, 5, 7, 9, 11, 13, 15, 17, 19,
21, 23, 25, 27 and 29 are presented in figure 3.3. In general, toxin concentrations in clams

Chapter 3
48
increased during the feeding with G. catenatum, although the accumulation pattern differed
among the compounds. The first concentration augment was registered for dcSTX in day 3,
enhancements of B1 and dcGTX2+3 were found in day 5, while a sharp increase of C1+2 was
only observed 11 days after exposure to the toxic algae. The maximum levels of C1+2 and
dcGTX2+3 were registered by the end of the exposure period, while of B1 and dcSTX were
found three days after, during the subsequent depuration period. The maximum
concentrations pointed to a higher accumulation of decarbamoyl toxins (dcSTX and dcGTX2+3)
than N-sulfocarbamoyl (B1 and C1+2). In addition to the above mentioned toxins, dcNEO was
also found in clams (not shown). However, values were only above detection limit in days 11,
13 and 15 not exceeding 0.30 nmol g-1. Results showed an opposite PSTs composition between
clams and G. catenatum (Figures 3.2 and 3.3).
Figure 3.2. Median, percentile 25% and 75%, minimum and maximum of C1+2, B1, dcSTX,
dcGTX2+3 concentrations (nmol g-1
) in the culture of Gymnodinium catenatum at days 2,
7 and 12 of the clam exposure experiment; four replicates at each sampling date.
Clams fed by a non-toxic diet exhibited a substantial decrease of C1+2 concentrations (18%
of the peak value) eight days after depuration. Conversely, values of B1 and dcSTX remained at
68% and 50%, respectively, of the maximum concentrations after 14 days. An intermediate
situation was found for dcGTX2+3 that exhibited a reduction of 37% at the end of the
experiment. Furthermore a higher dispersion of dcGTX2+3 concentrations was registered
C1+2 B1 dcSTX dcGTX2+3
Toxin
0
200
400
600
Concentr
atio
n in
alg
ae c
ultu
re (
nm
ol g
-1)

Chapter 3
49
between replicates in days 9, 17, 19 and 21.
3.3.3. Best-fitting curves
The best fitting curves of the experimental points were searched for each quantified
toxin. Table 3.1 shows the two equation types for exposure and depuration conditions, power
equations (y=axb) and exponential decay equations (y=ae-bx), respectively. Correlation
coefficients and levels of significance are also given.
The calculated b values of the power equations were 2.45±1.07 (C1+2), 1.55±0.202 (B1),
1.18±0.122 (dcSTX) and 1.33±0.298 (dcGTX2+3). The fitting curve for C1+2 presented a level of
significance above 0.05 (Table 3.1). The equations governing the time-dependent toxin
concentrations under depuration conditions mirror a first-order kinetic, where a is the toxin
concentration in the clam at the initial depuration conditions and b is the depuration rate. The
levels of significance for C1+2, dcSTX and dcGTX2+3 curves were below 0.05, corroborating the
validity of the first-order decay approach. The calculated depuration rates (b) were 0.17±0.024
day-1 for C1+2, 0.049±0.012 day-1 for dcSTX and 0.065±0.0085 day-1 for dcGTX2+3. The fitting
curve for B1 presented a level of significance above 0.05 (Table 3.1), indicating a poorer
first-order decay approach. Figure 3.3 shows computed and measured toxin concentrations in
clams during the two phases of the experiment.
3.3.4. Toxin composition of particulate organic matter
The mass of particulate organic matter (POM) produced daily by 100 clams, from 10
experimental tanks, during phase I increased from 0.50 to 2.5 mg (Figure 3.4). The amount was
more irregular under depuration conditions, varying between 0.83 and 5.5 mg. Concentrations
of the toxins C1+2, dcGTX2+3 and dcNEO in POM were always below the detection limit.
Conversely, the toxin dcSTX was quantified, concentrations increasing from 2.5 to 5.9 nmol
mg-1 as clams were fed with the toxic algae, and ranging between 3.8 and 14 nmol mg-1, under
a non-toxic diet (Figure 3.4). Furthermore, three periods of dcSTX enrichment were observed in
the produced POM. An intermediate situation was found for B1, concentration being

Chapter 3
50
undetectable, except during 4 days of the phase I of the experiment that reached a maximum
of 2.5 nmol mg-1.
Figure 3.3. Concentrations of the toxins C1+2, B1, dcSTX and dcGTX2+3 (nmol g-1
) in the clam Ruditates
decussatus exposed 14 days to Gymnodinium catenatum and 15 days under depuration conditions;
mean concentrations (n=3; ±SD) and best fitting curves for exposure and depuration periods.
Table 3.1. Best fitting curves for C1+2, B1, dcSTX and dcGTX2+3 in Ruditapes decussatus
during phase I (exposure) and phase II (depuration); calculated parameters (standard error);
correlation coefficients (r) and levels of significance (p).
Phase I (exposure)
Equation type: y=ax b
Toxin a b r
C1+2 ǂ
0.0004 (0.001) 2.45 (1.07) 0.812**
B1 0.007 (0.004) 1.55 (0.202) 0.976*
dcSTX 0.076 (0.024) 1.18 (0.122) 0.986*
dcGTX2+3 0.065 (0.043) 1.33 (0.298) 0.967*
ǂ Valid to x>9
0.0
0.1
0.2
0.3
0.4
0.5
0 3 6 9 12 15 18 21 24 27 30
Co
ncentr
atio
n in c
lam
s (n m
ol g
-1) C1+2
0.0
0.2
0.4
0.6
0.8
1.0
0 3 6 9 12 15 18 21 24 27 30
B1
0.0
1.0
2.0
3.0
0 3 6 9 12 15 18 21 24 27 30
Co
ncentr
atio
n in c
lam
s (nm
ol g
-1)
Time (day)
dcSTX
0.0
1.0
2.0
3.0
0 3 6 9 12 15 18 21 24 27 30
Time (day)
dcGTX2+3
Co
ncentration
in c
lam
s(n
molg
-1)

Chapter 3
51
Table 3.1. (cont.)
Phase II (depuration)
Equation type: y= a exp –bx
Toxin a b r
C1+2 0.26 (0.021) 0.17 (0.024) 0.965*
B1 0.56 (0.038) 0.025 (0.010) 0.733**
dcSTX 2.06 (0.146) 0.049 (0.012) 0.886*
dcGTX2+3 1.61 (0.097) 0.065 (0.008) 0.948*
*p< 0.05 and
**p>0.05
Figure 3.4. Variation of the amount (mg) of particulate organic matter (POM) produced by 100
individuals of Ruditapes decussatus exposure to Gymnodinium catenatum and under depuration
conditions; concentrations (nmol g-1
) of the toxins B1 and dcSTX in the POM.
3.3.5. Mass balance calculation
Table 3.2 gives the amounts of toxins supplied to clams, accumulated in whole clam
tissues and in POM produced by clams during the exposure phase (I), depuration phase (II) and
the entire experiment. The quantities of C1+2, B1, dcSTX, dcGTX2+3 and dcNEO, expressed in
0
1
2
3
4
5
0
4
8
12
16
0 3 6 9 12 15 18 21 24 27 30
B1
in P
OM
(nm
o in
l g-1
)
dcS
TX in
PO
M (
nmo
l g-1
)
Time (day)
B1
dcSTX
0
1
2
3
4
5
6
0 3 6 9 12 15 18 21 24 27 30
PO
M (m
g /
100
ind
ivid
uals
)
Time (day)
depurationexposure
B1 in
PO
M (
nm
ol
g-1
)

Chapter 3
52
nmol, were computed on a basis of 100 clams, corresponding to 10 experimental tanks. In the
mass balance calculation, the value of detection limit for each compound was accounted when
concentrations were undetected.
Table 3.2 presents also the net gain values (Tng) of each toxin calculated according to the
Eq. 3.2. Negative values of Tng, like for C1+2 and B1 in the phase I, mean that amounts supplied
to the clams were not accounted in the whole clam tissues or POM. Approximately 95 and 85%
of the mass of C1+2 (Ta=392 nmol) and B1 (Ta=470 nmol), respectively, added to the
experiment tanks were converted into other toxins by clams or lost in solution (Tng=-372 nmol
and Tng=-401 nmol, respectively). Conversely, positive values of dcSTX, dcGTX2+3 and dcNEO,
imply a net gain most likely resulted from the conversion of other assimilated compounds by
clams. The net gain (Tng) of dcSTX (250 nmol) and dcGTX2+3 (108 nmol) were approximately 5
times the amounts added to the tanks (50 and 21 nmol, respectively). The net gain of dcNEO
(22 nmol) has no correspondence in the algae supplied. Under depuration (phase II), Tng for
C1+2, B1 and dcGTX2+3 were one order of magnitude lower (-15, 38 and -47 nmol, respectively)
than during the phase I. Only 9 nmol of dcNEO were accounted. Contrarily, comparable Tng
were obtained for dcSTX in phases I (250 nmol), and phase II (262 nmol). The calculation of the
Tng values for the entire experiment, points to a substantial loss of C1+2 and B1, amounting
-750 nmol and a gain of 604 nmol of the sum of dcSTX, dcGTX2+3 and dcNEO.
3.4. Discussion
3.4.1. Conversion of toxins assimilated by clams into decarbamoyl toxins
The concentrations of the toxins C1+2, B1, dcSTX, dcGTX2+3 and dcNEO as well as their relative
proportion differed considerably in whole tissues of the clam Ruditapes decussatus and
Gymnodinium catenatum culture The dcSTX and dcGTX2+3 were predominant in clams,
although being detected at minor concentrations in the algae. Conversely, C1+2 and B1 were
more abundant in the algae and minor in clams. In particular, C1+2, which is dominant in the
supplied toxic algae, was detected later than the other toxins in the clams during the exposure

Chapter 3
53
Table 3.2. Mass (nmol) of toxins accumulated in Ruditapes decussatus (Tc), supplied to the experiment
(Ta) and present in particulate organic matter (Tp) after phase I, phase II, and phases I+II. Values of Tng
were computed according to Eq. 3.2. Amounts were calculated for a basis of 100 clams.
Toxin Tc Ta Tp Tng
nmol
Phase I
C1+2 20 392 --- -372
B1 41 470 28 -401
dcSTX 180 50 120 250
dcGTX2+3 129 21 --- 108
dcNEO 22 --- --- 22
Phase II
C1+2 -15 --- --- -15
B1 17 --- 21 38
dcSTX -26 --- 288 262
dcGTX2+3 -47 --- --- -47
dcNEO 9 --- --- 9
Toxin Tc Ta Tp Tng
nmol
C1+2 5 392 --- -387
B1 58 470 49 -363
dcSTX 154 50 408
512
dcGTX2+3 82 21 ---
61
dcNEO 31 --- ---
31

Chapter 3
54
period (Figure 3.3). This delay on the accumulation of C1+2 pointed to different behaviour
during the uptake, namely specific metabolic transformations. The undetected concentrations
of dcNEO in the algae in conjunction with the presence in clams in days 11, 13 and 15 indicate
the conversion of other assimilated toxins into dcNEO.
The modifications observed on PSTs profile between clams and the supplied algae cells
were less drastic than those reported in other experiments with the clam Tapes japonica fed by
Alexandrium catenella (Samsur et al., 2006) and Gymnodinium catenatum (Samsur et al., 2007).
In these feeding experiments, decarbamoyl derivatives were found in clams (Tapes japonica)
being undetectable in A. catenella or G. catenatum cells that were used as food. The
appearance of those compounds in clams was attributed to enzymatic hydrolysis of
N-sulfocarbamoyl compounds supplied only once at the beginning of the experiment (Sullivan,
1983; Oshima, 1995b). The same explanation may be invoked to the results obtained in the
current work. However, hydrolysis may have been more effective since Gymnodinium
catenatum cells were supplied daily during the exposure phase. Ingestion by clams during 14
days may have resulted in an ongoing biotransformation process, explaining the progressive
difference of toxin profiles between R. decussatus and the ingested G. catenatum cells. The
predominance of decarbamoyl toxins during the depuration phase of the experiment, indicates
that biotransformation of other assimilated toxins into dcSTX and dcGTX2+3 pursued beyond
the ingestion of the toxic algae. It is recurrently observed in national monitoring programmes
that toxicity in shellfish remains beyond the presence of high density of toxic algae cells. The
results of the current work show that dcSTX may be responsible for the prolonged toxicity in
clams exposed to a G. catenatum bloom. Two factors contribute to this extension of toxicity.
Firstly, the slower depuration rate of dcSTX in shellfish (Botelho et al., 2010a), and the high
toxicity equivalent factor in comparison to the other toxins produced by G. catenatum (Oshima,
1995a; Anon., 2009). For example, the toxicity equivalent factor of dcSTX is 10 times higher
than of B1 and C1+2.
The mass balance calculated for the entire experiment (Table 3.2) evidenced the net gain of
decarbamoyl compounds and the conversion of C1+2 and B1 in comparable quantities (750

Chapter 3
55
and 604 nmol, respectively). It appears that dcSTX and dcGTX2+3 resulted mainly from the
biotransformation of C1+2 and B1, although other toxins assimilated by clams should not be
negligible. This hypothesis is in line with several works pointing to the transformation of
saxitoxin derivatives in shellfish contaminated by G. catenatum into dcSTX (Oshima et al., 1990;
Lin et al., 2004; Vale, 2008). The slower depuration rates of dcSTX and dcGTX2+3 in comparison
to C1+2 observed in the current experiment indicate a tendency to higher retention time of
those compounds in clams, either resulted from assimilation or conversion from other toxins.
3.4.2. Elimination of dcSTX through clam faeces/pseudo-faeces
Toxin composition of particulate organic matter in rearing tanks is of difficult
interpretation because often it reflects the mixture of wasted food, faeces and pseudo-faeces
produced by shellfish (Samsur et al., 2006, 2007; Estrada et al., 2007). The contribution of
wasted food to the POM collected in the current experiment is most likely negligible. Firstly,
because the dominant toxic component of the G. catenatum culture added to the experimental
tanks (C1+2) were below the detection limit in the POM. Moreover, daily microscopic
examination of seawater from the tanks, showed no G. catenatum intact cells. This indicates
that clams have ingested the algal mass supplied daily, and particulate organic matter collected
during the period that clams were exposed to the toxic algae (phase I) is, thus, admittedly
constituted by a mixture of clam faeces and pseudo-faeces.
A relevant aspect of this work is that dcSTX was the only toxin quantified in the POM
produced by clams during the exposure and depuration phases of the 28-day experiment. The
toxin B1 was only detected during a short period of the exposure phase. The toxin profile of
the particles produced by clams is different from that in the whole clam tissues. Estrada et al.
(2007) proposed that PSTs in faeces are an indicator of the toxin content in the digestive
system. The validity of this relationship cannot be tested in the current work because clam
tissues were analyzed as a whole, and toxin concentration in the clam gut content may have
been diluted with the low values in other tissues, as shown for other shellfish (Cembella et al.,
1994; Shumway et al., 1994).

Chapter 3
56
The toxin composition of faeces or pseudo-faeces produced during the exposure phase
should reflect the ingested toxic algae composition and metabolic transformations of the
assimilated toxins. However, only dcSTX, and punctually B1, were found in the POM. The
absence of C1+2 and dcGTX2+3 suggests their biotransformation as ingested by clams. A
similar explanation could be invoked regarding B1, since it was only quantified in the 8th day of
exposure to the toxic algae. Although It should not be excluded the possibility of toxins being
released in solution due to the hydrophilic nature of PSTs (Shimizu, 2000), the contribution of
the soluble fraction to the mass balance should be low as suggested by Sekiguchi et al. (2001).
Under depuration, dcSTX concentrations in the POM were irregular with pronounced
maximum (Figure 3.4). These concentration peaks cannot reflect the composition of ingested
food since the diet was only composed by non-toxic algae. Presumably, metabolic processes
have a key role on the composition of the eliminated particles. Furthermore, dcSTX was the
major excreted toxin by R. decussatus after fed by G. catenatum, which indicates its
provenance from reactions associated with the metabolic transformation. Results of the two
phases of the experiments pointed to the conversion of assimilated toxins, namely B1 and C1+2,
into dcSTX and dcGTX2+3. This hypothesis is in accordance with previous works with the clam
Mactra chinensis (Lin et al., 2004) and Perdonidia venulosa (Cho et al., 2008). The gain of
decarbomoyl toxins evidenced in the mass balance approach is in line with conversion of toxins
by clams. The toxin composition of the POM showed the export of dcSTX as faeces or
pseudo-faeces. The elimination of C1+2 and dcGTX2+3 as rejected particles were negligible,
being likely transformed into other compounds or loss in solution.
3.5. Conclusion
Toxin composition of particulate organic matter rejected by the clam Ruditapes
decussatus under depuration conditions after being exposed to Gymnodinium catenatum
indicates the release of dcSTX, pointing to interconversion of other assimilated toxins during
the exposure.

Chapter 3
57
Acknowledgments
This work had been performed under the projects Quasus (Environmental quality and
sustainability of biologic resources in Ria Formosa) and Forward (Framework for Ria Formosa
water quality, aquaculture, and resource development) financed by Sociedade Polis Litoral Ria
Formosa. We are grateful to M.T. Moita for the G. catenatum strain from IPIMAR culture
collection, and to B. Frazão for maintaining the toxic algal culture.

Chapter 3
58

Chapter 4
59
4. Winter-summer nutrient composition linkage to algae-produced
toxins in shellfish at a eutrophic coastal lagoon (Óbidos lagoon, Portugal)
Highlights
Nutrient molar ratios contrast between winter and summer in a eutrophic coastal
lagoon.
Winter-summer variations lead to the predominance of dinoflagellate species in
summer.
Toxic Gymnodinium catenatum, Dinophysis cf. acuminata and D. acuta were observed in
the lagoon in summer.
Those species are on the basis of mussels toxicity as provided by PSTs and DSTs.
Pereira, P., Botelho, M.J., Cabrita, M.T., Vale, C., Moita, M.T., Gonçalves, C., 2012.
Winter-summer nutrient composition linkage to algae-produced toxins in shellfish at a
eutrophic coastal lagoon (Óbidos lagoon, Portugal). Estuarine, Coastal and Shelf Science. 112,
61-72. (doi:10.1016/j.ecss.2011.07.016).
4

Chapter 4
60
Abstract
The current work examines the linkage of pronounced winter-summer fluctuations on
the nutrient composition with phytoplankton assemblages and mussel toxicity produced by the
presence of toxic dinoflagellates. The work was performed at the Óbidos lagoon, a coastal
eutrophic ecosystem that is permanently connected to an area characterized by frequent
upwelling episodes. The lagoon and adjoining coastal area exhibit recurrent incidents of
diarrhetic and paralytic shellfish poisoning.
Data used in this work include: (i) inorganic and organic nutrients at five sites of the
lower, middle and upper Óbidos lagoon, and inorganic nutrients at two sites of the adjacent
coastal area; biannual campaigns were performed in winter and summer between 2006 and
2010; (ii) phytoplankton assemblages in three sites of the lagoon (located at lower and upper
areas) in winter and summer of 2009; (iii) algae-derived toxicity of wild mussels from the lower
lagoon and coastal area, on a 1-2 week time scale, over 2006 and 2009. Nutrient molar ratios in
Óbidos lagoon contrast between winter and summer. The lower medians DIN:P (31 and 0.8)
and Si:P (11 and 3.3) in summer reflect the excess of phosphate. Excess was mainly attributed
to phosphorus regeneration in sediments of the upper lagoon with accentuated symptoms of
eutrophication. Dissolved organic nitrogen and dissolved organic phosphorus were also higher
in summer, in particular in this area. No significant winter-summer differences were recorded
for nutrient ratios in the adjacent coastal area. Phytoplankton assemblages pointed to a
winter-summer contrast characterized by a shift of non-siliceous-based phytoplankton to
diatoms. Toxic dinoflagellate species (Gymnodinium catenatum, Dinophysis cf. acuminata and D.
acuta), presumably imported from the adjacent coast following upwelling episodes in summer,
were observed in the lower lagoon. In summer of the two surveyed years toxins produced by
dinoflagellates were registered in mussels from the lower lagoon and coastal area. However,
mussel toxicity in the lagoon exceeded values of the coastal area, which points to high cell
density of toxic dinoflagellates resulted from favorable nutrient conditions. This work suggests
that connectivity between eutrophic lagoons and upwelling systems stimulates the increase of
toxic algae and consequently enhancing shellfish toxicity.

Chapter 4
61
Keywords: Eutrophication; Nutrient composition; Toxic phytoplankton; Marine toxins
4.1. Introduction
The increasing number of coastal ecosystems with eutrophication symptoms led
environmental managers to identify eutrophication as a major worldwide problem (Cloern,
2001; Hauxwell and Valiela, 2004; Lillebø et al., 2007). Many coastal lagoons display symptoms
of eutrophication, particularly those with deficient connection to sea that concentrate the
nutrient loads supplied from the watershed (Pérez-Ruzafa et al., 2005). The nutrient retention
combined with low turbidity favour high primary production leads in extreme cases to
intermittent periods of low oxygenation. Anoxic conditions near the water-sediment interface
promote the release of nutrients from the sediments to the overlying water (Pereira et al.,
2009a, 2010; Lillebø et al., 2002), followed by the enhancement of algal biomass. Besides light
intensity, temperature, salinity and nutrient levels, the ratio between nutrients, in both
inorganic and organic forms, influence phytoplankton abundance and diversity (Newton and
Mudge, 2005; Glibert et al., 2007; Lopes et al., 2007). Although the Redfield molar ratios for
phytoplankton growth (Si:DIN:P=16:16:1) are merely used to define the resource availability
(del Amo et al., 1997), the shift away from these proportions may alter the species dominance
and composition. Eventually, the overall result is the loss of diversity (Tilman et al., 1982). Since
human activities in the last century have selectively enhanced nitrogen and phosphorus loads
relatively to silicon into coastal systems, a tendency of a shift from diatom dominated
communities towards flagellates have been reported (Cloern, 2001).
The linkage between harmful algal blooms (HABs) and eutrophication has been
examined in various coastal regions, particularly the USA in order to identify mitigation
measures (Anderson et al., 2008; Bricker et al., 2008; Heisler et al., 2008). The increasing
number and frequency of toxic algal blooms have been regarded with concern, since
algae-produced toxins accumulated in shellfish are a threat to human health. Blooms of
diatoms (Pseudo-nitzchia spp.) and dinoflagellates (Alexandrium fundyense, Alexandrium
catenella and Gymnodinium catenatum) have been registered in coastal systems under
Chapter 4
62
eutrophic conditions (Trainer et al., 2003; Poulton et al., 2005; Thessen and Stoecker, 2008;
Band-Schmidt et al., 2010). Cause-effect relationships between nutrient ratios and toxic algal
blooms have been difficult to achieve due to several confounding factors. A “roundtable
discussion” searched the linkage between water quality, eutrophication and HABs (Heisler et al.,
2008). Among the short list of the consensus statements, nutrient contamination, nutrient
composition, and exogenous nutrient sources were highlighted as promoters of HABs.
Moreover, episodes of toxic phytoplankton species possibly linked to those conditions were
referred (Heisler et al., 2008).
The current work examines whether pronounced winter-summer changes of nutrient
composition, like observed in several coastal lagoons and estuaries, facilitate the development
of toxic algal blooms. This hypothesis was tested in the Óbidos coastal lagoon (Portugal) where
along the past decades recurrent episodes of toxic algal blooms and shellfish toxicity have been
reported in the summer/autumn (Vale et al., 2008; Botelho et al., 2010a). This lagoon has two
specificities that may be linked to that historic record. Firstly, oceanographic conditions in the
coastal area of the region favour the occurrence of toxic blooms of G. catenatum and
Dinophysis spp., particularly in summer and early autumn (Moita et al., 2001, 2003, 2006).
Moreover, toxic dinoflagellate cells entering the lagoon are exposed to low concentrations of
dissolved inorganic nitrogen and silicate with respect to phosphate (Pereira et al., 2009a),
which may facilitate their development (Anderson et al., 2002).
4.2. Materials and Methods
4.2.1. The Óbidos lagoon study area
The Óbidos lagoon is a shallow coastal ecosystem (mean depth 2 m), located on the west
coast of Portugal with a wet area of 7 km2 and permanently connected to the sea through a
narrow inlet (Figure 4.1). The tidal amplitude ranges fortnightly up to 2 m (Oliveira et al., 2006).
The lagoon comprises areas of different morphological and sedimentary characteristics: sand
banks and narrow channels in the lower part; a large and shallow middle area consisting in a
mixture of sand and mud; muddy bottom sediments in the upper inner branch (Barrosa). This

Chapter 4
63
part is 1 m deep and water circulation is mostly driven by tides and by a small tributary (Cal
River) that drains agricultural fields. Urban effluents from a nearby town (Caldas da Rainha, 50
000 inhabitants) also have been discharged to this branch by the Cal River. Consequently,
Barrosa presents the highest nutrient availability of the lagoon, being classified as eutrophic
(Pereira et al., 2009a). High nutrient concentrations cause abundant macroalgae (Ulva spp. and
Enteromorpha spp.) and a broad daily variation of dissolved oxygen concentration during the
summer months (Pereira et al., 2009b, 2010). In this branch, dissolved oxygen decreases to low
saturation values during the summer nights indicating hypoxic conditions (Pereira et al., 2009b,
2010). Ecotoxicological studies with Ulva spp. and Carcinus maenas pointed to biochemical
alterations in autochthonous populations from Barrosa branch, but not in specimens from
lower/middle lagoon (Pereira et al., 2009c). The other branch in the upper lagoon has no
significant freshwater inputs. The middle lagoon was previously characterised by a better water
quality regarding nutrient availability (Pereira et al., 2009a).
Figure 4.1. Location of the sampling sites at Óbidos lagoon and coastal area: A - lower
lagoon; B1 and B2 - middle lagoon; C and D - upper lagoon (Bom-Sucesso branch and
Barrosa branch, respectively); E1 and E2 - coastal area adjacent to the Óbidos lagoon;
F - southern coastal area.
D
C
B1B2
A
E2
E1
E2E1F
Óbidoslagoon
Portugal
Spain
Óbidoslagoon
D
C
B1B2
A
E2
E1
E2E1F
Óbidoslagoon
Portugal
Spain
Óbidoslagoon

Chapter 4
64
The Óbidos lagoon and adjacent coastal area are included in the national surveillance
programme of toxic phytoplankton species and shellfish toxicity performed by IPIMAR. An
overview of the past 20 years indicates recurrent episodes of shellfish toxicity in this lagoon
caused by toxins produced by the dinoflagellates G. catenatum (paralytic shellfish toxins, PSTs),
as well as D. acuminata and D. acuta (diarrheic shellfish toxins, DSTs) (Vale et al., 2008; Botelho
et al., 2010a). Interdiction of shellfish harvesting during weeks are recurrent between spring to
early autumn. The first poisoning event was reported in the 1940s (Correia, 1946; Pinto and
Silva, 1956).
4.2.2. Sampling
Nine water sampling campaigns were carried out at Óbidos lagoon, biannually, between
2006 and 2010: five in winter and four in summer. The selection of the five sampling sites took
into consideration results from previous studies on environmental quality (Pereira et al., 2009a,
2009b). The sampling sites were located in the following zones: A - lower lagoon; B1 and B2 -
middle lagoon; C and D – upper lagoon (Figure 4.1). Water was sampled at high tide and low
tide in 2006 and 2009, and only at low tide in 2007, 2008 and 2010. At each campaign,
temperature, salinity, dissolved oxygen (DO) and pH were measured in situ at 0.2 m depth
using an YSI, 650 meter. At the same time, 2 L of water was sampled for nutrients and
chlorophyll a determinations. Water samples for phytoplankton identification and cell counts
were collected in the sites A, C and D under summer conditions (early October) and winter
2009. Surface waters were sampled and preserved with Lugol’s solution immediately after
collection.
Between 2006 and 2009, seven campaigns were performed in two sites (E1 and E2) of
the coastal area adjacent to the Óbidos lagoon in the same seasonal periods (Figure 4.1).
Temperature, salinity and DO were measured in situ at surface (0.5 m), middle (10 m) and
bottom (20 m) waters using an YSI, 650 meter. Water was also collected at these depths for
nutrient and chlorophyll a determinations.

Chapter 4
65
Thirty specimens of the mussel Mytilus galloprovincialis (length=5.8±0.5 cm) were
sampled on a weekly basis in the lower part of the Óbidos lagoon (site A) and fortnightly in the
coastal site F, located 50 km south of the lagoon (Figure 4.1). Samples were obtained from the
national surveillance programme of toxins in shellfish performed by IPIMAR.
4.2.3. Chemical analysis and phytoplankton
4.2.3.1. Nutrients
Water samples were filtered through MSI Acetate Plus filters for determinations of
nitrate+nitrite (NO3-+NO2
-), ammonium (NH4+), phosphate (PO4
3-) and silicate Si(OH)4 and
analyses carried out using an autoanalyser TRAACS 2000 (Bran+Luebbe) (Grasshoff, 1983). In
addition, total dissolved nitrogen and total dissolved phosphorus were measured according to
Koroleff’s method (1983) modified by the ISO 11905-1:1997. The dissolved organic nitrogen
(DON) and dissolved organic phosphorous (DOP) were estimated by subtracting the amount of
dissolved inorganic nitrogen (NO3-+NO2
-+NH4+) from the amount of total dissolved nitrogen,
and the amount of PO43- from the amount of total dissolved phosphate, respectively.
4.2.3.2. Phytoplankton
Phytoplankton biomass was measured as chlorophyll a (Chl a) concentration. Water
samples were filtered through Whatman GF/F filters which were immediately frozen at -20oC.
Chl a was determined in a Perkin Elmer Fluorometer, using the modified method of Lorenzen
(1966). Phytoplankton identification and cell counts were performed following the
sedimentation method of Uthermöl (1958). In water samples with high sediment particles
content, overlapping of cells and sediment particles are likely to occur, due to their similar sizes.
To minimize the underestimation of small phytoplankton species, 5 to 25 mL of water were
used in counting chambers. The phytoplankton quantitative and qualitative analyses were
carried out under an inverted microscope Zeiss IM 35.
4.2.3.3. Toxins
After collection, mussels were dissected and composite samples (n=30) of soft whole
tissues were prepared for each date and sampling site. The accumulated toxins were extracted

Chapter 4
66
and concentrations of individual toxins determined using liquid chromatographic
methodologies, with mass (DSTs) and fluorimetric (PSTs) detection. The analytical procedures
are described in Vale and Sampayo (2002) for DSTs, and in Lawrence et al. (1991) and Botelho
et al. (2010b) for PSTs. Concentrations of individual PSTs were converted into total toxicity
levels according to tabled factors (Quilliam et al., 2007).
4.2.4. Data analyses
Prior to statistical analyses, data was tested for normality and equality of variances.
Since ANOVA assumptions were not established, Kruskal-Wallis analysis was performed to
compare sampling sites using Statistica 6.1. Differences between medians were considered
significant when p<0.05. Principal Component Analysis (PCA) was applied to matrixes of 11
environmental variables (temperature, salinity, DO, NO3-, NO2
-, NH4+, PO4
3-, DON, DOP,
Si(OH)4 and Chl a) and objects (sites, seasons). A logarithmic transformation log (X+1) of the
data was applied in order to approximate the distributions to normality and reduce the
proportion of variances explained by the different variables. The variables were then
auto-scaled (standardized) so as to be treated with equal importance. The PCA was performed
on the correlation matrixes. The software used for these analyses was NTSYS-PC (Numerical
Taxonomy and Multivariate System Analysis) Version 2.0 software package.
4.3. Results
4.3.1. Physicochemical characteristics
Water temperature ranged within broader intervals inside the lagoon in summer due to
elevated values registered in the upper branches (Table 4.1). In the winter campaigns, salinity
generally decreased from site A to D, reflecting the freshwater discharge into the Barrosa
branch. Otherwise, the high salinity registered in site D in summer (e.g., 2006 and 2009
campaigns), indicates that evaporation was not compensated by the negligible freshwater
inputs. Dissolved oxygen measured in sites A, B1 and B2 suggests that lower and middle lagoon
were well oxygenated. In site D (upper lagoon) it was registered low DO (e.g., 53%) in early

Chapter 4
67
morning, and 158% saturation in the afternoon. Such a broad daily fluctuation was not
registered in winter. Values of pH showed no considerable winter-summer variations.
Measurements in the sites E1 and E2 (adjacent coastal area) indicate narrow intervals of
temperature (14-18oC), salinity (35-36) and dissolved oxygen (85-115%) between the two
seasons.
Table 4.1. Values of temperature (T), salinity, O2 and pH registered at five sites in the Óbidos lagoon: A –
lower lagoon, B1 and B2 - middle lagoon, Bom-Sucesso branch – C and Barrosa branch - D. Minimum and
maximum intervals are presented for 2006 and 2009, and single values for 2007, 2008 and 2010.
Year Season Site T
(oC)
Salinity DO
(%) pH
2006
Summer A 19-20 36 104-111 8.2
(27-Jul) B1 21 36 101-108 8.1-8.2
B2 - - - -
C 24-25 36-37 109-121 8.2-8.3
D 24-25 37 74-96 8.2
Winter A 9-12 33-35 108-119 -
(31-Jan) B1 11 34-35 103-108 -
B2 - - - -
C 9-11 32-33 102-107 -
D 8-11 28-31 103-124 -
2007
Summer A 20 36 107 -
(18-Jul) B1 23 36 125 -
B2 21 36 107 -
C 23 35 108 -
D 24 33 83 -
Winter A 12 36 98 8.0
(12-Dec) B1 13 18 101 8.2
B2 13 35 120 8.1
C 13 35 110 8.2
D 15 33 99 8.0

Chapter 4
68
Table 4.1. (cont.)
Year Season Site T
(oC)
Salinity DO
(%) pH
2008
Summer A 18 36 101 8.1
(16-Jul) B1 23 36 124 8.3
B2 23 36 121 8.2
C 26 36 156 8.6
D 25 34 165 8.3
Winter A 9 34 63 7.9
(15-Dec) B1 10 34 73 7.6
B2 10 35 73 7.8
C 10 33 61 7.8
D 11 25 81 7.8
A 18-19 36 109-116 8.1-8.2
2009
Summer B1 19 36 83-125 8.0-8.4
(27-Aug) B2 19 36 119 8.4
(15-Out) C 21 36 89-131 8.0-8.3
D 18-21 34-36 53-158 8.1-8.4
Winter A 13-14 35-36 63-120 8.1
(17-Dec) B1 11-14 35-36 73-119 8.1
(18-Dec) B2 14 36 73 -
C 12 34-35 61-116 8.1-8.2
D 11-12 27-34 81-112 8.1
Summer A 19-20 36 104-111 8.2
(29-Jul) B1 21 36 101-108 8.1-8.2
B2 - - - -
2010 C 24-25 36-37 109-121 8.2-8.3
D 24-25 37 74-96 8.2

Chapter 4
69
4.3.2. Nutrients and chlorophyll a
Table 4.2 gives the nutrient and chlorophyll a concentrations in winter and summer
conditions between 2006 and 2010, in the five surveyed sites of the lagoon. The most
noticeable result is the statistical difference (p<0.05) of silicate, phosphate and chlorophyll a
concentrations between site D and sites A, B1 and B2. The spatial variation of nutrients inside
the lagoon was more pronounced in winter. Furthermore, nutrients in sites A, B1, B2 and C
were higher in winter than in summer, except for phosphate. For example, nitrate+nitrite in
summer varied between 0.24 and 14 µM, while in winter from 4.8 to 74 µM. Lower
consumption by producers in winter and the external input of inorganic nitrogen and silicates
due to tributary discharges and drainage, may both contribute to high levels. The same
seasonal trend was also registered in site D for the inorganic forms of nitrogen and silicates.
Conversely, higher levels of phosphate were found in summer. Considering all data obtained in
site D, levels of phosphate in winter ranged from 1.5 to 4.5 µM, but in summer were between
2.5 and 8.5 µM. In general, dissolved organic forms of nitrogen and phosphorus in summer
exceeded the values observed in winter.
Nutrient concentrations in sites E1 and E2 (adjacent coastal area) showed no consistent
differences between summer and winter (Table 4.3) and were lower than in the lagoon,
particularly in winter. Chlorophyll a enhanced in summer of 2007 and 2009
4.3.3. Principal Component Analysis (PCA)
Because nutrient concentrations varied considerably between the three sets of the
sampling sites (D; A, B1, B2, C; and E1, E2), PCAs were performed separately for each set
(Figure 4.2). The separation of site D from the other sampling sites in PCA was also based on
previous works highlighting the specificity of that area (e.g., Pereira et al., 2009a). In the PCA
of site D, nitrate+nitrite, ammonium and silicate were projected in the opposite side to salinity,
temperature and phosphate along the axis PC1 (51.7%). PC2 explained 15.1% of variance and
Chapter 4
70
separated chlorophyll a from dissolved organic forms of nitrogen (DON) and phosphorus
(DOP). Chlorophyll a was projected close to phosphate.
The PCA applied to the sites A, B1, B2 and C (PC1+PC2=43.5%+19.4%) showed
differences relatively to PCA of site D for phosphate and chlorophyll a. Phosphate was poorly
represented in the plan PC1-PC2, being not associated with temperature and salinity, like in
site D. Chlorophyll a was projected far from inorganic nitrogen and silicates and close to DON
and DOP. Although being projected along the PC2 axis with low variance, that association was
not registered in the site D. Both PCAs separate summer from winter samples, reinforcing the
accentuated seasonal differences on the nutrient availability, as well as organic forms of
nitrogen and phosphorus in the lagoon.
The PCA applied to E1 and E2 (adjacent coastal area) showed no nutrients decoupling or
winter-summer separation. Nitrate+nitrite, phosphate and silicate opposite to dissolved
oxygen, temperature and salinity along PC1 (29.4%), while ammonium opposite to chlorophyll
a along PC2 (18.8%). Chlorophyll a was close to inorganic forms of nitrogen and phosphate.
4.3.4. Nutrient molar ratios
The molar ratios of dissolved inorganic nitrogen DIN (NH4++NO3
-+NO2-) to phosphate (P)
and silicate (Si), DIN:P, Si:DIN and Si:P were calculated. Winter and summer results were
considered separately in three data sets: site D (Barrosa branch); sites A, B1, B2 and C (lower
and middle lagoon); and sites E1 and E2 (adjacent coastal area). Figure 4.3 shows the median
of three ratios, the percentile 25% and 75%, as well as maximum and minimum values. The
molar ratios were always significantly higher (p<0.05) in winter than in summer for the lagoon
data sets. The DIN:P ratio varied 25-fold between winter and summer, while for Si:DIN and Si:P
ratios ranged only 5- and 3-fold, respectively. Winter and summer ratios in the coastal area
were not significantly different (p>0.05).
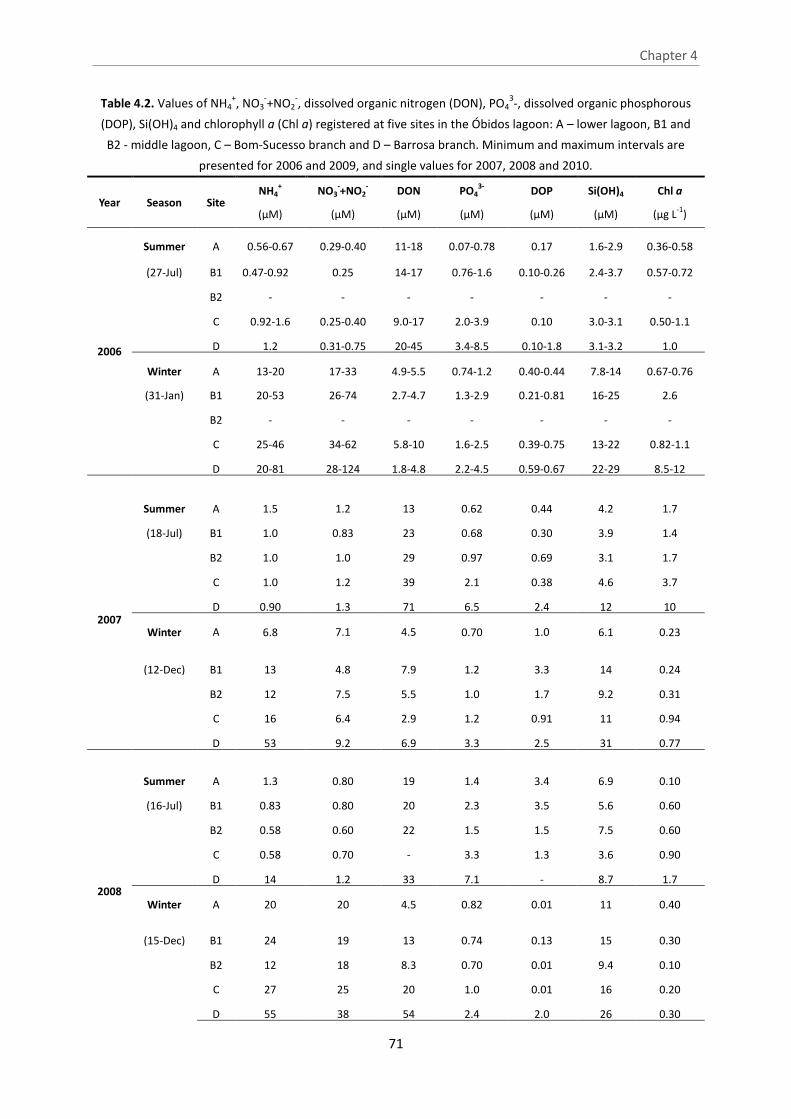
Chapter 4
71
Table 4.2. Values of NH4+, NO3
-+NO2
-, dissolved organic nitrogen (DON), PO4
3-, dissolved organic phosphorous
(DOP), Si(OH)4 and chlorophyll a (Chl a) registered at five sites in the Óbidos lagoon: A – lower lagoon, B1 and
B2 - middle lagoon, C – Bom-Sucesso branch and D – Barrosa branch. Minimum and maximum intervals are
presented for 2006 and 2009, and single values for 2007, 2008 and 2010.
Year Season Site NH4
+
(µM)
NO3-+NO2
-
(µM)
DON
(µM)
PO43-
(µM)
DOP
(µM)
Si(OH)4
(µM)
Chl a
(µg L-1
)
2006
Summer A 0.56-0.67 0.29-0.40 11-18 0.07-0.78 0.17 1.6-2.9 0.36-0.58
(27-Jul) B1 0.47-0.92 0.25 14-17 0.76-1.6 0.10-0.26 2.4-3.7 0.57-0.72
B2 - - - - - - -
C 0.92-1.6 0.25-0.40 9.0-17 2.0-3.9 0.10 3.0-3.1 0.50-1.1
D 1.2 0.31-0.75 20-45 3.4-8.5 0.10-1.8 3.1-3.2 1.0
Winter A 13-20 17-33 4.9-5.5 0.74-1.2 0.40-0.44 7.8-14 0.67-0.76
(31-Jan) B1 20-53 26-74 2.7-4.7 1.3-2.9 0.21-0.81 16-25 2.6
B2 - - - - - - -
C 25-46 34-62 5.8-10 1.6-2.5 0.39-0.75 13-22 0.82-1.1
D 20-81 28-124 1.8-4.8 2.2-4.5 0.59-0.67 22-29 8.5-12
2007
Summer A 1.5 1.2 13 0.62 0.44 4.2 1.7
(18-Jul) B1 1.0 0.83 23 0.68 0.30 3.9 1.4
B2 1.0 1.0 29 0.97 0.69 3.1 1.7
C 1.0 1.2 39 2.1 0.38 4.6 3.7
D 0.90 1.3 71 6.5 2.4 12 10
Winter A 6.8 7.1 4.5 0.70 1.0 6.1 0.23
(12-Dec) B1 13 4.8 7.9 1.2 3.3 14 0.24
B2 12 7.5 5.5 1.0 1.7 9.2 0.31
C 16 6.4 2.9 1.2 0.91 11 0.94
D 53 9.2 6.9 3.3 2.5 31 0.77
2008
Summer A 1.3 0.80 19 1.4 3.4 6.9 0.10
(16-Jul) B1 0.83 0.80 20 2.3 3.5 5.6 0.60
B2 0.58 0.60 22 1.5 1.5 7.5 0.60
C 0.58 0.70 - 3.3 1.3 3.6 0.90
D 14 1.2 33 7.1 - 8.7 1.7
Winter A 20 20 4.5 0.82 0.01 11 0.40
(15-Dec) B1 24 19 13 0.74 0.13 15 0.30
B2 12 18 8.3 0.70 0.01 9.4 0.10
C 27 25 20 1.0 0.01 16 0.20
D 55 38 54 2.4 2.0 26 0.30

Chapter 4
72
Table 4.2. (cont.)
Year Season Site NH4+
(µM)
NO3-+NO2
-
(µM)
DON
(µM)
PO43-
(µM)
DOP
(µM)
Si(OH)4
(µM)
Chl a
(µg L-1
)
2009
Summer A 1.4-2.3 0.50-1.4 7.9 0.19-1.2 0.87 2.6-6.7 0.82-1.0
(27-Aug) B1 1.6-3.9 0.34-0.68 16 0.52-2.7 0.71 3.7-9.4 0.84-1.9
(15-Out) B2 1.9 1.7 12 1.3 0.44 5.3 1.8
C 1.0-2.0 0.38-1.1 20 2.4-2.7 0.89 6.8-8.8 3.5-4.2
D 1.5-11 0.24-2.5 35 2.5-4.1 1.6 11-32 3.6-13
Winter A 3.6-4.6 7.2-9.3 13 0.52-0.93 0.10 5.8-6.4 0.52-0.93
(17-Dec) B1 11-22 9.9-44 18 0.82-0.90 0.10 8.1-9.7 0.71-0.90
(18-Dec) B2 2.7 44 23 0.72 0.23 5.5 0.12
C 10-17 14-24 22 1.0-1.4 0.22 14-18 1.0-1.4
D 16-38 18-63 11 1.5-2.5 0.10 16-36 1.5-2.4
0.66
2010
Summer A 5.3 9.6 - 0.66
1.3
- 2.4 0.90
(29-Jul) B1 7.3 14 - 1.4 - 6.7 1.1
B2 1.9 1.0 - 1.1 - 5.0 0.95
C 1.4 0.67 - 2.3 - 6.8 2.2
D 4.6 1.3 - 7.0 - 23 2.8

Chapter 4
73
Table 4.3. Values of NH4+, NO3
-+NO2
-, PO4
3-, Si(OH)4 and chlorophyll a (Chl a) registered at
2 sites located at the adjacent coast to the Óbidos lagoon: E1 and E2. Minimum and
maximum intervals are presented for winter and summer of 2006, 2007, 2008 and 2009.
Year Season Site NH4
+
(µM)
NO3-+NO2
-
(µM)
PO43-
(µM)
Si(OH)4
(µM)
Chl a
(µg L-1
)
2006
Summer E1 - - - - -
(27-Jul) E2 1.2-1.6 0.47-1.7 0.05-0.16 0.75-1.8 0.35-1.9
Winter E1 - - - - -
(31-Jan) E2 5.3-8.3 5.1-5.8 0.29-0.34 3.4-5.6 0.16-0.20
2007 Summer E1 1.9-3.3 2.0-12 0.18-0.48 5.1-5.8 1.1-6.2
(02-Aug) E2 2.6-2.9 1.3-1.8 0.17-0.25 3.8-4.3 1.6-5.5
2008
Summer E1 0.92 8.1-11 0.36-0.50 3.4-3.5 0.30-1.3
(16-Jul) E2 0.73-0.91 8.3-24 0.50-1.1 2.9-3.8 0.1-0.4
Winter E1 3.6-4.9 3.9-5.0 0.51-0.55 3.6-4.9 1.0-2.0
(29-Jan) E2 3.4-3.7 4.1-4.2 0.44-0.55 3.4-3.7 1.7-2.3
2009
Summer E1 1.5-1.6 3.0-3.5 0.44-1.3 1.9-4.4 1.5-2.7
(31-Aug) E2 1.0-1.3 1.3-5.0 0.47-0.98 1.1-3.7 1.2-2.3
Winter E1 0.33-0.45 6.3-6.9 0.67-0.84 2.2-2.9 0.67-0.84
(19-Mar) E2 0.37-0.92 7.7-7.9 0.46-0.74 2.4-3.0 0.46-0.74

Chapter 4
74
Figure 4.2. Projection of environmental parameters, and sampling sites in summer (open symbols) and winter
(black symbols) campaigns obtained from the principal component analyses (PCA) performed on three data sets:
site D - Barrosa branch (PCA1); sites A, B1, B2 and C all together – lagoon, except Barrosa branch (PCA2); and
sites E1, E2 - coastal area adjacent to the Óbidos lagoon (PCA3). Percentage of total variance is indicated in
brackets close to principal components axes.
The DIN:P ratio in the lagoon exceeded the Redfield ratio (16) in winter, reaching the median
of 24 in site D and 31 in sites A, B1, B2 and C. Conversely, in summer DIN:P medians were 0.8 (site D)
and 2.5 (sites A, B1, B2 and C). The situation differed in the adjacent coastal area: DIN:P ratio showed
no significant (p>0.05) difference between winter and summer, and the medians in the two periods
(13 and 18, respectively) were closer to 16. The median of Si:DIN ratio in the lagoon was close to 1
(Redfield ratio) in winter, and doubled in summer. In the coastal sites adjacent to the lagoon the
median was close to 1 either in winter or summer. Most of the Si:P ratios in the lagoon were below
the Redfield ratio (16) due to a decrease of Si relatively to P. This divergence to the Redfield ratio was
more pronounced in summer.
DOPDON
NH4+
PO43-
Sal
Chl a
NO3-+NO2
-Si(OH)4
DOTemp
-1
-0.5
0
0.5
1
-1.0 -0.5 0.0 0.5 1.0 1.5
PC1 (51.7)
PC2 (15.1)
Site D
DOP
Temp
DON
DO
Si(OH)4
NO3-+NO2
-
Chl a
Sal PO43- NH4
+
-0.5
0
0.5
1
-1.0 -0.5 0.0 0.5 1.0 1.5
PC1 (43.5)
PC2 (19.4)
Sites A, B1, B2, C
NH4+
PO43-
Sal Chl a
NO3-+NO2
-
Si(OH)4
DO
Temp
-1
-0.5
0
0.5
1
-1.0 -0.5 0.0 0.5 1.0
PC1 (29.4)
PC2 (18.8)
Sites E1, E2-1.0
0.0
1.0
-1.0 -0.5 0.0 0.5 1.0
summer
winter
PC1
PC2
Sites E1, E2
-1.0
-0.5
0.0
0.5
1.0
-1.0 -0.5 0.0 0.5 1.0 1.5
PC1
PC2
open symbols - summer
solid symbols - winter
Site A
rp Site B1
Site B2
Site C
-1.0
0.0
1.0
-1.0 -0.5 0.0 0.5 1.0 1.5
summer
winter
PC1
PC2
Site D

Chapter 4
75
Figure 4.3. Median, percentile 25% and 75%, maximum and minimum of molar ratios DIN:P, DIN:Si and SI:P in
summer (open box) and in winter (shaded box). Three data sets were considered for the surveyed period
2006-2010. Sites A, B1, B2 and C all together – lagoon, except Barrosa branch; site D - Barrosa branch; and sites
E1, E2 - coastal area adjacent to the Óbidos lagoon. Outliers () and extreme (∆) values are identified. Results of
Kruskal-Wallis test are presented.
30.6
24.0
13.0
30.6
24.0
13.0
1.5 0.8
18.5
1.5 0.8
18.5
A, B1, B2, C D E1, E2
Sites
0
20
40
60
DIN
:P
winter
winter: KW-H(2,52)= 19.1, p<0.001
summer: KW-H(2,56)= 29.9, p<0.001
summer
0.4 0.5 0.50.4 0.5 0.5
2.12.4
0.5
2.12.4
0.5
A, B1, B2, C D E1, E2
Sites
0
2
4
6
8
Si:D
IN
winter
winter: KW-H(2,52)= 19.1, p<0.001
summer: KW-H(2,56)= 29.9, p<0.001
summer
11.49.8
6.0
11.49.8
6.0
3.6 3.3
8.3
3.6 3.3
8.3
A, B1, B2, C D E1, E2
Sites
0
10
20
30
Si:P
winter
winter: KW-H(2,52)= 19.1, p<0.001
summer: KW-H(2,56)= 29.9, p<0.001
summer

Chapter 4
76
4.3.5. Phytoplankton assemblages
Figure 4.4 shows the contribution of phytoplankton main groups to the total biomass,
considering the sites A, C and D in summer and winter of 2009. Phytoplankton assemblages were
dominated by Cryptophyceae, followed by Bacillariophyceae and Dinophyceae. Community in site D
was clearly different from sites A and C. Contribution of Cryptophyceae was higher in site D (78-87%)
than in sites A (49-50%) and C (53-59%). Bacillariophyceae represented only 7-8% of the total
biomass in site D, while reached 22-42% and 24-28% in sites A and C, respectively. Dinophyceae had
a minor contribution in all sites. Winter-summer differences between main groups were only
registered in site A. In winter, the autotrophic ciliate Mesodinium rubrum was very abundant at sites
C and D (2x10⁴ cel L-1 and 6x10⁴ cel L-1, respectively), being sustained by cryptophytes.
Table 4.4 lists the phytoplankton species of Bacillariophyceae and Dinophyceae identified in
winter and summer campaigns of 2009. It is noticeable a lower number of Bacillariophyceae species
in summer relatively to winter in the three sampling sites: 68 to 36% (A) 60 to 43% (B) and 50 to 38%
(C). In winter, diatoms consisted mainly of marine species like Chaetoceros spp., Pseudo-nitzschia
spp., Rhizosolenia spp. and Leptocylindrus spp.. An opposite trend was observed for Dinophyceae,
since the number of species was lower in winter than in summer: 56 to 71% (site A) and 33 to 56%
(site D). Estuarine species, such as Licmophora spp. and Alexandrium spp. were present in site D. The
toxic dinoflagellate species are highlighted in bold in Table 4.4, namely Dinophysis cf. acuminata,
Dinophysis acuta, Dinophysis caudata, Dinophysis tripos and Gymnodinium catenatum. These species
were only found in summer at sites A and D, and registered in both seasons at site C. Concentrations
of these species varied from 30 to 230 cells L-1 in all surveyed samples, and Dinophysis cf. acuminata
reached 104 cells L-1 in site D in summer.

Chapter 4
77
Figure 4.4. Phytoplankton main groups contribution (%) to total biomass, at sites A (lower lagoon), C
(Bom-Sucesso branch) and D (Barrosa branch), during summer and winter campaigns of 2009.
4.3.6. Toxins in mussels
Figure 4.5 presents the annual variation of toxicities estimated from concentrations of paralytic
shellfish toxins (PSTs) and diarrhetic shellfish toxins (DSTs) in Mytilus galloprovinciallis. During 2006
and 2009 surveillances, toxicities were compared in site A (lower lagoon) and site F (coastal area).
Records during 2006 showed single (site F) and multiple (site A) toxicity episodes of PSTs and DSTs in
mussels between June and September. Moreover, enhanced toxicities from the two toxin groups
occurred in the same period of time. For several weeks toxicity exceeded largely the regulatory limit
of PSTs (80 µg STX equivalents per 100 g tissue) and DSTs (16 µg OA equivalents per 100 g tissue)
established for human consumption (Anon., 2004b). During 2009, toxicity associated with DSTs was
virtually absent. Toxicity values due to PSTs in mussels exceeded slightly the regulatory limit in site A
(lower lagoon), but not is the site F (adjacent coastal area).
winter 2009
Site A
Site C
Site D
50%
42%
6%
59%
28%
4%78%
8%
10%
summer 2009
Site A
Site C
Site D
49%
22%
18%
53%
24%
14%87%
7%
4%
Bacillariophyceae
Dinophyceae
Prymnesiophyceae
Euglenophyceae
Clorophyceae
Crysophyceae
Prasinophyceae
Cryptophyceae
winter 2009
Site A
Site C
Site D
50%
42%
6%
59%
28%
4%78%
8%
10%
summer 2009
Site A
Site C
Site D
49%
22%
18%
53%
24%
14%87%
7%
4%
winter 2009
Site A
Site C
Site D
50%
42%
6%
59%
28%
4%78%
8%
10%
winter 2009
Site A
Site C
Site D
50%
42%
6%
59%
28%
4%78%
8%
10%
summer 2009
Site A
Site C
Site D
49%
22%
18%
53%
24%
14%87%
7%
4%
summer 2009
Site A
Site C
Site D
49%
22%
18%
53%
24%
14%87%
7%
4%
Bacillariophyceae
Dinophyceae
Prymnesiophyceae
Euglenophyceae
Clorophyceae
Crysophyceae
Prasinophyceae
Cryptophyceae
Bacillariophyceae
Dinophyceae
Prymnesiophyceae
Euglenophyceae
Clorophyceae
Crysophyceae
Prasinophyceae
Cryptophyceae
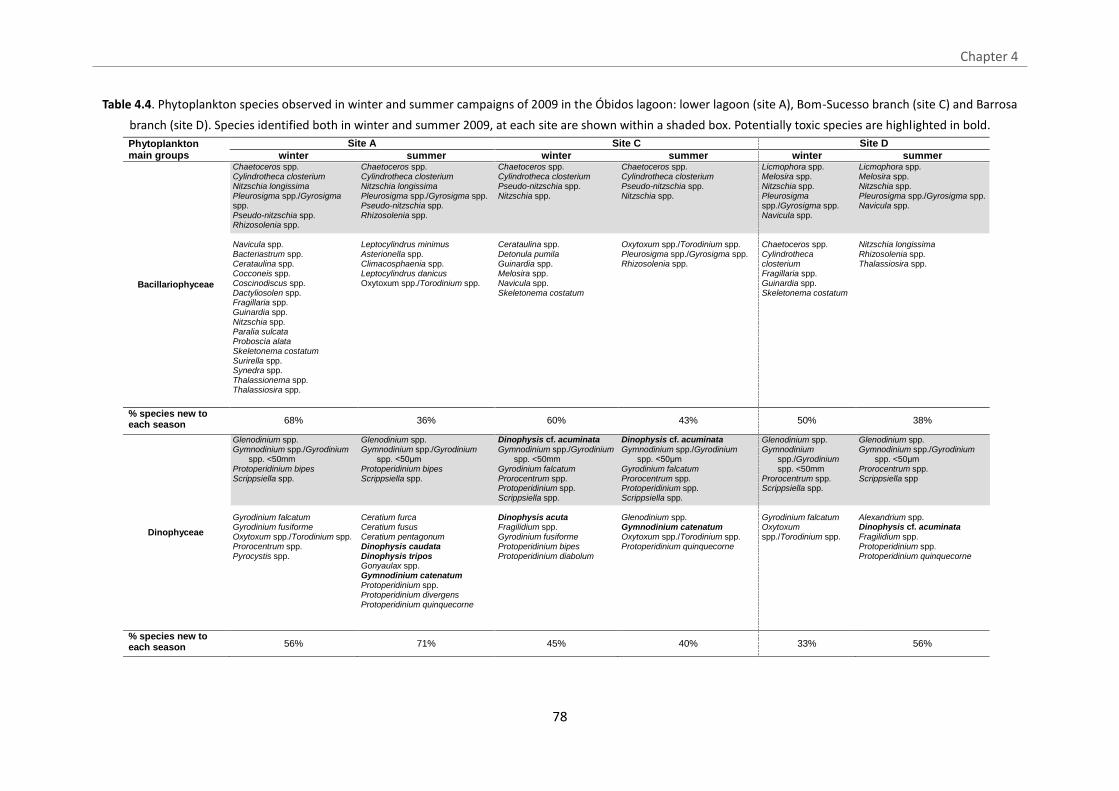
Chapter 4
78
Table 4.4. Phytoplankton species observed in winter and summer campaigns of 2009 in the Óbidos lagoon: lower lagoon (site A), Bom-Sucesso branch (site C) and Barrosa
branch (site D). Species identified both in winter and summer 2009, at each site are shown within a shaded box. Potentially toxic species are highlighted in bold.
Phytoplankton main groups
Site A Site C Site D
winter summer winter summer winter summer
Bacillariophyceae
Chaetoceros spp. Cylindrotheca closterium Nitzschia longissima Pleurosigma spp./Gyrosigma spp. Pseudo-nitzschia spp. Rhizosolenia spp. Navicula spp. Bacteriastrum spp. Cerataulina spp. Cocconeis spp. Coscinodiscus spp. Dactyliosolen spp. Fragillaria spp. Guinardia spp. Nitzschia spp. Paralia sulcata Proboscia alata Skeletonema costatum Surirella spp. Synedra spp. Thalassionema spp. Thalassiosira spp.
Chaetoceros spp. Cylindrotheca closterium Nitzschia longissima Pleurosigma spp./Gyrosigma spp. Pseudo-nitzschia spp. Rhizosolenia spp. Leptocylindrus minimus Asterionella spp. Climacosphaenia spp. Leptocylindrus danicus Oxytoxum spp./Torodinium spp.
Chaetoceros spp. Cylindrotheca closterium Pseudo-nitzschia spp. Nitzschia spp. Cerataulina spp. Detonula pumila Guinardia spp. Melosira spp. Navicula spp. Skeletonema costatum
Chaetoceros spp. Cylindrotheca closterium Pseudo-nitzschia spp. Nitzschia spp. Oxytoxum spp./Torodinium spp. Pleurosigma spp./Gyrosigma spp. Rhizosolenia spp.
Licmophora spp. Melosira spp. Nitzschia spp. Pleurosigma spp./Gyrosigma spp. Navicula spp. Chaetoceros spp. Cylindrotheca closterium Fragillaria spp. Guinardia spp. Skeletonema costatum
Licmophora spp. Melosira spp. Nitzschia spp. Pleurosigma spp./Gyrosigma spp. Navicula spp. Nitzschia longissima Rhizosolenia spp. Thalassiosira spp.
% species new to each season 68%
36%
60%
43%
50%
38%
Dinophyceae
Glenodinium spp. Gymnodinium spp./Gyrodinium
spp. <50mm Protoperidinium bipes Scrippsiella spp. Gyrodinium falcatum Gyrodinium fusiforme Oxytoxum spp./Torodinium spp. Prorocentrum spp. Pyrocystis spp.
Glenodinium spp. Gymnodinium spp./Gyrodinium
spp. <50μm Protoperidinium bipes Scrippsiella spp. Ceratium furca Ceratium fusus Ceratium pentagonum Dinophysis caudata Dinophysis tripos Gonyaulax spp. Gymnodinium catenatum Protoperidinium spp. Protoperidinium divergens Protoperidinium quinquecorne
Dinophysis cf. acuminata Gymnodinium spp./Gyrodinium
spp. <50mm Gyrodinium falcatum Prorocentrum spp. Protoperidinium spp. Scrippsiella spp. Dinophysis acuta Fragilidium spp. Gyrodinium fusiforme Protoperidinium bipes Protoperidinium diabolum
Dinophysis cf. acuminata Gymnodinium spp./Gyrodinium
spp. <50μm Gyrodinium falcatum Prorocentrum spp. Protoperidinium spp. Scrippsiella spp. Glenodinium spp. Gymnodinium catenatum Oxytoxum spp./Torodinium spp. Protoperidinium quinquecorne
Glenodinium spp. Gymnodinium
spp./Gyrodinium spp. <50mm
Prorocentrum spp. Scrippsiella spp. Gyrodinium falcatum Oxytoxum spp./Torodinium spp.
Glenodinium spp. Gymnodinium spp./Gyrodinium
spp. <50μm Prorocentrum spp. Scrippsiella spp Alexandrium spp. Dinophysis cf. acuminata Fragilidium spp. Protoperidinium spp. Protoperidinium quinquecorne
% species new to each season 56% 71% 45% 40% 33% 56%

Chapter 4
79
2006 2009
Figure 4.5. Annual variation of toxicity derived from accumulated paralytic shellfish toxins (PSTs, µg STX
eq./100g) and diarrheic shellfish toxins (DSTs, µg OA eq./100g) in Mytilus galloprovincialis collected at site A
(lower lagoon) and site F (coastal area south of the Óbidos lagoon). Data of 2006 and 2009 are presented.
4.4. Discussion
4.4.1. Winter-summer decoupling of phosphorus from nitrogen and silicon
Nutrient availability points to a clear-cut contrast between the Barrosa upper branch and the
rest of the Óbidos lagoon. The contrast on water quality has been shown in previous works (Pereira et
al., 2009a, 2010). Concentrations of chlorophyll a, dissolved inorganic nitrogen, phosphate and
silicate are within the range of values reported for Mondego estuary (Lillebø et al., 2005) and Ria de
Aveiro (Lopes et al., 2007), two estuaries in the same region that receive nutrients from diffuse and
local sources. Values were also comparable to Ria Formosa, a coastal lagoon with a high production of
the clam Ruditapes decussatus (Falcão and Vale, 2003). Chlorophyll a in the Óbidos lagoon was lower
0
100
200
300
400
Ja
n/0
6
Fe
b/0
6
Ma
r/0
6
Ap
r/0
6
Ma
y/0
6
Ju
n/0
6
Ju
l/0
6
Au
g/0
6
Se
p/0
6
Oct/0
6
No
v/0
6
De
c/0
6
PS
Ts (
µg
ST
X e
q./1
00
g)
PSTs
0
100
200
300
400
Ja
n/0
9
Fe
b/0
9
Ma
r/0
9
Ap
r/0
9
Ma
y/0
9
Ju
n/0
9
Ju
l/0
9
Au
g/0
9
Se
p/0
9
Oct/0
9
No
v/0
9
De
c/0
9
PSTs
regulatory limit

Chapter 4
80
than in highly eutrophic systems as the Barnegat Bay-Little Egg Harbour estuary (Kennish et al., 2007).
Despite the high abundance of macroalgae and phytoplankton biomass in the upper branch (Table
4.2), the elevated nutrient concentrations indicate that consumption is not balanced by inputs. The
PCA for site D emphasizes that freshwater discharged in winter constitutes the external supply of
ammonium, nitrate+nitrite and silicate into the upper branch. Conversely, phosphorus levels mirror
its regeneration and release from the sediment in warm periods, when dissolved oxygen in the
overlying water lowers during the night (Pereira et al., 2010). These results are in accordance to
various works asserting the relevance of the internal sources in ecosystems suffering from eutrophic
symptoms (Lillebø et al., 2007). Moreover, DON and DOP appeared at higher concentrations in
summer, possibly reflecting the increase of organic matter degradation under high temperature. The
decomposition of the abundant Ulva spp. and Enteromorpha spp. in Barrosa branch probably
contribute to the enhanced levels of those organic forms.
Phosphate supplied to the upper branch (site D) drove mainly from endogenous sources that
are more pronounced in summer, while dissolved inorganic nitrogen and silicate were mainly
provided from winter freshwater inputs. This contributes to the winter-summer contrast between
phosphorus and nitrogen/silicon availability. Classic works have documented the phosphorus
fractionation in sediments (Slomp et al., 1998), but the abrupt escape of phosphorus from the
bottom is admittedly from the reduction of Fe(III) to soluble Fe(II) as dissolved oxygen at the
water-sediment interface is consumed (Sundby, 2006). The low oxygen conditions occurring
recurrently during the night in Barrosa induce the reduction of Fe(III) and subsequent release of
phosphorus from Fe-oxides (Pereira et al., 2010). The low flushing time of water in the lagoon
favours the dispersion of the released phosphorus and produced DON and DOP from the inner
branch (site D) to the rest of the lagoon (total area of 7 km2). The association of chlorophyll a with
organic forms of N and P, as suggested by the PCA applied to lower and middle lagoon (Figure 4.2),
raise the possibility of organic nutrients being a promoting factor to the lagoon phytoplankton
production, as well as influencing changes on species composition as observed in other works (Taft et
al., 1977; Bronk, 2007). Indeed, PCA pointed to chlorophyll a opposed to inorganic nitrogen and
silicon and the relation to phosphate is difficult to discern (Figure 4.2). Shallowness and low turbidity
suggest that light is unlike to be a limiting factor to primary production. High abundance of

Chapter 4
81
filter-feeder organisms in the middle and lower parts of the lagoon implies high consumption of
chlorophyll a, which is in accordance to its low level (Carvalho et al., 2006).
The different sources of phosphorus relatively to nitrogen and silicon have a marked impact on
the winter-summer fluctuation of nutrient ratios (Figure 4.4). This pattern has been commonly
reported for several coastal ecosystems (e.g., Lopes et al., 2007). Among the three analysed ratios,
the fluctuation of DIN:P ratio in the Óbidos lagoon was more pronounced since nitrogen and
phosphorus sources occurred in different seasons, promoting a clear-cut decoupling of these
elements. The extremely low DIN:P ratios in summer support the hypothesis of phosphate being in
excess in the entire lagoon. Furthermore, Si:P ratios being far below the Redfield ratio (16) suggest
also an excess of phosphate relatively to silicate. A remarkable shift to 16 was observed in summer
(medians of 3.3 and 3.6).
4.4.2. Impact of nutrient ratios on phytoplankton assemblages
It is well recognized that phytoplankton assemblages are influenced by composition, besides
the total quantity, of the nutrient pool (Anderson et al., 2002; Heisler et al., 2008). Species
composition in the Óbidos lagoon suggests a predominance of non-siliceous-based phytoplankton
relative to diatoms in summer, despite the dominance of Cryptophyceae and presence of the
authotrophic ciliate Mesodinium rubrum. This predominance agrees with low median ratios of Si:P
(3.3 and 3.6) and Si:DIN (0.4 and 0.5) relative to Redfield ratios (16 and 1, respectively). Several works
have associated the low ratios between these elements with minor contribution of diatoms to
phytoplankton assemblages (Rocha et al., 2002; Domingues et al., 2005). Nevertheless, at the Óbidos
lagoon the decrease of diatoms in summer does not seem to be solely related with Si decrease, since
the concentration range (1.6-32 µM) is higher than the half-saturation constants reported in the
literature (Km=1-5 µM) for marine and coastal diatoms (Fisher et al., 1988). It should not be excluded
the possibility of organic forms of nitrogen and phosphorus influence also changes on species
composition (Taft et al., 1977; Bronk, 2007). A cause-effect relationship between dissolved organic
nitrogen levels and the occurrence of brown-tide blooms was reported (Glibert et al., 2007).
The lower lagoon presented higher abundance of marine diatom species (Cylindroteca
closterium, Chaetoceros spp., Pseudo-nitzschia spp., Rhizosolenia spp. and Leptocylindrus spp.) than

Chapter 4
82
upper lagoon, indicating the influx of cells from the coastal area. The proximity of Óbidos lagoon to
an area of frequent upwelling (Santos, 2001; Moita et al., 2001, 2003) favours the subsequent tidal
transport of diatoms-populated offshore waters to the lagoon. Phytoplankton blooms were not
registered in winter and summer surveys in the Óbidos lagoon. However, the toxic dinoflagellates G.
catenatum, D. acuminata and D. acuta, whose blooms are responsible for the shellfish toxicity
episodes in the Portuguese coast (Vale et al., 2008), were found in the lagoon. This species occurred
chiefly in summer. The presence of low cell density of these toxic species, particularly in the lower
lagoon, may indicate the advection of dinoflagellate low-populated off-shore water into the lagoon.
Therefore, the observed phytoplankton assemblages were insufficient to conclude whether nutrient
ratios had promoted cell density. Nevertheless, a previous work have reported higher density of G.
catenatum in the middle (5x10³ cell L-1) and lower part of lagoon (10x103 cell L-1) (Botelho et al.,
2010a) than the current study (0.1x10³ cell L-1). Amorim and Dale (1998) referred the presence of G.
catenatum cysts in sediments of Óbidos lagoon. However, the lack of direct relationship between cyst
distribution and bloom intensity in the Iberian coast, suggests the import from the sea as a major
factor (Amorim, 2001; Bravo et al., 2010).
The dominance of Cryptophyceae in the lagoon can also be responsible for the high
concentrations of Mesodinium rubrum (and related high levels of chlorophyll a) observed at the inner
branches. This ciliate, although containing a permanent cryptophyte symbiont, requires the ingestion
of cryptophyte preys for its sustained growth (Hansen and Fenchel, 2006). High concentrations of M.
rubrum seem recurrent in the lagoon during winter as observed in the 70s and 80s by Silva and
Peixoto (1987). Moreover, recent studies have also shown that cultures of the mixotrophic Dinophysis,
previously impossible to maintain, were finally possible when M. rubrum was added as prey (Park et
al., 2006). Therefore, suitable conditions for Dinophysis growth seem to be attained at the upper
branches of the lagoon since the directly related trophic levels Cryptophytes-Mesodinium
rubrum-Dinophysis were well established in natural conditions.
4.4.3. Enhancement of mussel toxicities in the lagoon
The upwelling system is recognized as being susceptible to promote harmful algal blooms in
Iberian Peninsula and other regions of the world (Pitcher et al., 2010). In the Portuguese coast,

Chapter 4
83
blooms of G. catenatum, D. acuminata and D. acuta have been reported during relaxation conditions
of coastal upwelling (Moita et al., 2001, 2003). The DST and PST peaks registered in wild mussels from
Óbidos lagoon and coastal area mirror the availability of high levels of these toxic species in the water
column. The occurrence of peaks in summer is in accordance with previous data of shellfish toxicity in
the Portuguese coast (Vale et al., 2008) and with studies on toxic phytoplankton dynamic (Moita et al.,
2001, 2003, 2006).
The difference of DST- and PST- derived toxicities between mussels from the lagoon and the
adjacent coast was registered between June and August/September of 2006. The most plausible
explanation for the dissimilarity between the two areas is the increasing availability of algae cells in
the lower lagoon. As dinoflagellate-populated off-shore waters were advected to the lagoon in
summer 2006, phytoplankton cells became exposed to a proportional enrichment of phosphorus
relative to silicon and nitrogen, as well as of organic forms of nitrogen and phosphorus. These
conditions may have favoured the increase of cell density and, consequently, the mussel toxicity. The
explanation agrees with studies examining the linkages between composition of nutrient pool and
shellfish toxicity (e.g., Hattenrath et al., 2010). Laboratory works showed that nitrogen and
phosphorus availabilities and its molar ratio may enhance PST production (Touzet et al., 2007) and
change toxin profile (Poulton et al., 2005) in algae. The modifications on algae toxin composition
should not be excluded in the Óbidos lagoon, since phytoplankton transported from coastal water
were exposed to a distinct nutrient pool.
In 2009, the divergence on the toxicity between the lower lagoon and coastal area was only
found in September for PSTs. The low toxicity signal in mussels from the coastal area suggests a lower
abundance of G. catenatum in 2009 than in 2006. Differences of oceanographic conditions probably
explain the inter-annual variation. Consequently, smaller quantities of cells should have been
advected from the coastal area into the lagoon in 2009, although shellfish toxicity in the lagoon
exceeded values in the coastal area. In 2009, the concentrations of phosphate and dissolved organic
phosphorus in the lower lagoon were lower than in 2006. Nevertheless, it appears sufficient to
promote the increase of algae cells and consequent mussel toxicity.
Water residence time has been considered an influencing factor of toxicity when embayment
acts as a retention zone for toxic phytoplankton species (Pitcher et al., 2010). The flushing time in the
lower lagoon (1-2 days) (Malhadas et al., 2009) cannot explain the toxicity differences between the

Chapter 4
84
lagoon and the adjacent coastal area.
4.5. Conclusions
Nutrients composition, phytoplankton assemblages and toxicity in shellfish of Óbidos lagoon, a
narrow-mouth coastal lagoon nearby an upwelling system, point to the connectivity between
enhanced toxicity derived from toxic algae and the excess of phosphorus or high nitrogen and
phosphorus organic forms occurring in summer. Changes on the proportionality between P, N and Si
in eutrophic lagoons or estuaries, which import toxic phytoplankton species from adjoining upwelling
systems, may enhance shellfish toxicity. Mitigation of the enhanced shellfish toxicity could imply
sediment dredging to reduce internal nutrient regeneration and decrease of flushing time in confined
areas.
Acknowledgements
Maria Teresa Cabrita and Patrícia Pereira acknowledge grants by “Fundação para a Ciência e a
Tecnologia” (FCT, Grant No SFRH/BPD/50348/2009 and FCT, Grant No SFRH/BD/17616/2004,
respectively). This work had been financially supported by the Company “Águas do Oeste” and
“ARH-Tejo”. We appreciate the collaboration of IPIMAR and MARETEC researchers involved in the
national surveillance programme of marine toxins, and in the field work, respectively.

Chapter 5
85
5. Partitioning of paralytic shellfish toxins in sub-cellular fractions of the
digestive gland of the cockle Cerastoderma edule: changes under post-bloom
natural conditions
Highlights
Sub-cellular partitioning of PSTs in cockle digestive glands.
Affinity of PSTs to insoluble cellular fractions.
Changing of organelle toxin profiles under post-bloom conditions.
Inter-conversion of toxins in mitochondrial and lysosomal fractions.
Botelho, M.J., Raimundo, J., Vale, C., Ferreira, J.G., 2014. Partitioning of paralytic shellfish toxins
in sub-cellular fractions of the digestive gland of the cockle Cerastoderma edule: Changes under
post-bloom natural conditions. Ecotoxicology and Environmental Safety 104, 365-372.
(http://dx.doi.org/10.1016/j.ecoenv.2014.02.011).
5
Chapter 5
86
Abstract
Concentrations of paralytic shellfish toxins (C1+2, B1, dcGTX2+3, dcSTX, GTX2+3 and STX) were
determined by LC-FLD in composite samples of digestive glands of the cockle Cerastoderma edule and
in each sub-cellular particulate fractions obtained after differential centrifugation (nuclei+debris,
mitochondria, lysosomes and microsomes). The specimens were sampled during the exposure to a
bloom of Gymnodinium catenatum (day 0) and in the subsequent 8, 12, 14, 19, 21 and 25 days under
natural depuration conditions. Toxin profiles of digestive glands were dominated by C1+2 followed by
B1 and dcGTX2+3, although the proportion between C1+2 and B1 contents decreased with the time,
indicating a slower elimination of B1. All toxins, except GTX2+3 and STX, were quantified in the four
sub-cellular fractions. The content of the quantified toxins decreased most markedly in nuclei+debris
and microsomal fractions, during the first eight and 12 days, respectively. Conversely, different
patterns were observed among toxins in mitochondrial and lysosomal fractions. The less accentuated
decreases of dcGTX2+3 and dcSTX contents in the mitochondrial fraction may have resulted from the
conversion of other toxins, like C1+2 and B1, associated with enzymatic activities in that fraction. The
largest discrepancy was registered in lysosomal fraction for B1, since its content increased after eight
days of post-bloom conditions. Input of B1 may come from the conversion of other toxins, like the
abundant B2 and C1+2. These transformations are associated to the major role of lysosomes in the
intra-cellular digestive process of materials acquired through vesicular transport.
Keywords: Paralytic shellfish toxins; Sub-cellular partitioning; Cerastoderma edule; Digestive
gland; Lysosomes; Mitochondria
5. 1. Introduction
Paralytic shellfish toxins (PSTs) are a group of neurotoxic alkaloids produced in the marine
environment by dinoflagellates like Alexandrium spp., Pyrodinium bahamense and Gymnodinium
catenatum (Llewellyn, 2006). During blooms of those phytoplankton species, bivalves uptake the
toxins, which are causative agents of paralytic shellfish poisoning in humans (Gessner and Middaugh,
1980; Sommer and Meyers, 1937). More than 50 PSTs have been reported (Weise et al., 2010),

Chapter 5
87
primarily comprising three main structural families according to the functional groups: carbamate
(saxitoxin-STX, neosaxitoxin-NEO and gonyautoxins-GTX1 to GTX4), decarbamoyl (dcGTX1 to dcGTX4,
dcSTX and dcNEO) and N-sulforcarbamoyl (B1, B2, C1 to C4). The N-sulfocarbamoyl and decarbamoyl
are the dominant toxins for the species Gymnodinium catenatum (Band-Schimdt et al., 2005; Botelho
et al., 2012; Ordás et al., 2004) and carbamate toxins for Alexandrium species (Cembella et al., 1987;
Chou et al., 2004).
In general, the proportions among PSTs in bivalves differ from the profile of the dinoflagellate
that produces the toxins. These modifications are explained by differential uptake and depuration
kinetics of individual toxins (Botelho et al., 2010a; 2012; Yu et al., 2007), in conjunction with
metabolic interconversions of the assimilated toxins through enzymatic and chemical reactions in
bivalve tissues (Kotaki et al., 1985; Oshima, 1995b; Shimizu and Yoshioka, 1981; Sullivan et al., 1983).
The digestive gland of bivalves is the initial repository of ingested food, including xenobiotics and
marine toxins. This organ contains by far the greatest proportion of the total toxin body burden in
bivalves exposed to toxic algal blooms (Bricelj and Shumway, 1998), and therefore weighs heavily on
toxicity of the edible parts. Enzymatic and other oxidation/reduction reactions are involved in the
elimination or biotransformation of toxins in the digestive gland (Fast et al., 2006). Other workers
have highlighted the major association of domoic acid with the cytosol of the digestive gland of the
scallop Pecten maximus (Mauriz and Blanco, 2010) and of the octopus Octopus vulgaris (Lage et al.,
2010). However, the partitioning of toxins among cell organelles has been poorly documented, which
limits our understanding of the mechanisms behind the release of toxins at sub-cellular level.
The combined worldwide annual catch of clams, cockles, and arkshells ranges between 0.5-1
million tonnes (FAO, 2012). Within that group, the cockle Cerastoderma edule is cultivated or
collected in Europe and North Africa for human consumption with an overall production of between
10 and 100x103 tonnes per year (FAO, 2013). This species is both hand and mechanically dredged,
with the largest catch being registered in the Netherlands and United Kingdom (FAO, 2013). A part of
the harvest is sold fresh and the rest is canned. Because this species is of considerable interest from a
fishery point of view, the patterns of marine toxin accumulation take on particular relevance.
The objective of this work is to study the partitioning of C1+2, B1, dcGTX2+3, dcSTX, GTX2+3
and STX among the sub-cellular operational fractions nuclei+debris, mitochondria, lysosomes and
microsomes in digestive glands of the cockle Cerastoderma edule exposed to a bloom of

Chapter 5
88
Gymnodinium catenatum and under post-bloom natural conditions. We test the hypothesis that
sub-cellular partitioning of each of those paralytic shellfish toxins changes during depuration after
bloom cessation. To the best of our knowledge these are the first results of sub-cellular partitioning
of PSTs in bivalves.
5.2. Materials and Methods
5.2.1. Samples
Cockles (Cerastoderma edule) from a natural bank in the lagoon of Aveiro (Nilin et al., 2012)
were naturally exposed, in October 2011, to a bloom of Gymnodinium catenatum that reached a
maximum of 6x10³ cells L-1 (day 0), decreasing in the subsequent period to 6x10² cells L-1 (day 8),
5x10² cells L-1 (day 14) and <20 cells L-1 (day 19) (IPMA, monitoring programme of toxic
phytoplankton). Thirty specimens (shell length=3.0±0.2 cm) were collected at the bloom peak (day 0)
and days 8, 12, 14, 19, 21 and 25 under post-bloom natural depuration. The paralytic shellfish toxins
C1+2, B1, dcGTX2+3, dcSTX, GTX2+3 and STX were quantified in the digestive gland and its
sub-cellular particulate fractions. Additionally, B2 was indirectly quantified in selected samples of
digestive gland.
5.2.2. Reagents
All chemicals and solvents used were LC or analytical grade. Sodium hydroxide, periodic acid,
hydrogen peroxide and hydrochloridric acid (Merck), and acetonitrile, acetic acid, methanol, trizma
hydrochloride, ammonium formate, ammonium acetate, disodium hydrogen phosphate,
dithiothreitol and mercaptoethanol (Sigma-Aldrich), were used. Ultra-pure water was obtained from
a Millipore Milli-Q system.
5.2.3. Treatment of samples
Cockles were carefully dissected and composite samples of digestive glands (three pools of 10
specimens) were weighed and frozen at -80oC. The composite samples were placed in an ice bath and
homogenised in a buffer solution (5 mL of buffer g-1 of digestive gland), consisting of 0.1 M Tris-HCl
and ammonium formate 0.15 M to a final pH of 7.8 (Mauriz and Blanco, 2010; Raimundo et al., 2008).
Chapter 5
89
The homogenisation was completed in 3 min at 11000 rpm in a Polytron Kinematica AG homogenizer
(Rossignoli and Blanco, 2010). To test the effect of protease inhibitor on PST determinations, two
aliquots of a digestive gland composite sample were used. The first aliquot was homogenised with
the buffer solution. The second one was complemented with a mixture of thiol group protectors,
dithiothreitol and mercaptoethanol (1 mM) to inhibit the activity associated with thiol groups (Mauriz
and Blanco, 2010). Losses of toxins exceeded 38%, which leads to the rejection of protease inhibitor
addition. Under these conditions interferences probably occur in PSTs detection after oxidation
reaction. A 3 g aliquot of the homogenate tissue was taken as initial sample for toxin extraction and
the remaining homogenate was used for sub-cellular fractionation.
5.2.4. Sub-cellular fractionation
For sub-cellular analyses, the aliquots of each homogenate pool of digestive glands were
transferred to centrifuge tubes and subjected to differential fractionation. The procedure was
adapted from Campbell et al. (2005) and Raimundo et al. (2008): the homogenate was first fractioned
by centrifugation at 700 x g for 15 min at 4oC to separate the nuclei, granules and plasmatic
membranes, designated as "nuclei+debris" fraction (P1); the supernatant was further centrifuged at 9
000 x g for 20 min at 4oC to separate the mitochondria fraction (P2); the lysosomes (P3), and
microsomes (P4) fractions were obtained by centrifuging the supernatant at 30 000 x g for 25 min,
and at 100 000 x g for 40 min at 4oC, respectively. The four particulate fractions obtained by
centrifugation were extracted for toxin analyses. The remained soluble part, mainly constituted by
cytosolic components, is hereafter designated by cytosolic fraction.
5.2.5. Toxin extraction and oxidation
The extraction, cleanup and oxidation procedures for PSTs determination were based on the
AOAC 2005.06 (Anon., 2005b), involving the following steps: (i) the 3 g aliquot of digestive gland
homogenate, and the P1, P2, P3 and P4 pellet fractions were double-extracted with 1% acetic acid
solution (first extraction with heating); (ii) the digestive gland and pellets extracts passed through a
solid phase extraction (SPE) C18 cartridge (500 mg/3 mL, Supelclean, Supelco, USA) and the pH of the
extracts was adjusted to 6.5; (iii) an aliquot of C18-cleaned extract were placed in an SPE-COOH

Chapter 5
90
cartridge (500 mg/3 mL, Bakerbond, J.T. Baker, USA) and sequentially eluted to obtain three
individual fractions (1 to 3); (iv) hydrogen peroxide (10% v/v) was added to 1 M sodium hydroxide
solution and vortex mixed, then the cleaned sample or the PST standard solution was added, and the
mixture thoroughly mixed and allowed to react for 2 min at room temperature; glacial acetic acid
was added and vortex mixed; (v) a sample extract after C18 or SPE-COOH fractionation, or a PST
standard solution, was added to a matrix modifier solution prepared with PST-free oysters, and then
is added the periodate oxidant; the mixture was thoroughly mixed and allowed to react during 1 min,
then glacial acetic acid was added and the mixture was allowed to stand for further 10 min. Aliquots
of C18 extract were used for oxidation of PSTs with peroxide and periodate oxidants, while aliquots
of SPE-COOH fractions were used for periodate oxidation, prior to liquid chromatography with
fluorescence detection (LC-FLD) analyses. Similar procedure of peroxide and periodate oxidations
were followed, substituting the oxidant reagent by water in order to detect naturally fluorescent
compounds.
The procedure used in the oxidation of PSTs was based on the AOAC method (Anon., 2005b)
with a procedural modification (Botelho et al., 2010b). This modification was centred on the
inversion of reactions sequence of AOAC method, the peroxide oxidation being performed before the
periodate oxidation. The option for the inversion comes from non-N-hydroxylated toxins (B1, C1+2,
dcSTX, dcGTX2+3) being the most abundant ones in shellfish samples contaminated by Gymnodinium
catenatum from Iberian waters. In the AOAC method, these compounds are also quantified in the
peroxide oxidation, due to a better detection of the oxidation products, but after a periodate
oxidation.
5.2.6. Estimation of B2 concentration
Despite the unavailability of commercial certified reference material for the toxin B2, its
concentration was estimated in selected samples of digestive gland from the days 0, 8, 12, 14, 19, 21
and 25, through the hydrolysis conversion into neosaxitoxin (NEO). The analytical procedure was
based on the Marine Biotoxins Report of the Community Reference Laboratory for the determination
of PSP toxins in shellfish including B2 (GTX6) after hydrolysis (Anon., 2007). Aliquots of fraction 2
(SPE-COOH fractionation) containing the toxin B2 were used for periodate oxidation, prior to LC-FLD
analyses (Anon., 2005b). The LC measurements after periodate oxidation of this fraction allowed the

Chapter 5
91
detection of B2. 125 L of 1 M hydrochloridric acid solution were added to 500 L of fraction 2 in a
glass tube. The tube was closed and heated for 20 minutes at 90oC in a water bath, and then allowed
to cool down at room temperature. The reaction was then neutralized adding small volumes of 1 M
sodium hydroxide solution. The solution was mixed after each addition until a volume of 125 L was
obtained. After neutralization, the pH of the hydrolyzed extract was adjusted to 8.2. Hydrolysed
extracts were submitted to periodate oxidation and B2 toxin was indirectly quantified through
conversion into NEO. It was assumed that the molarity of B2 toxin hydrolyzed was equal to the
molarity of the NEO present in fraction 2 after hydrolysis.
5.2.7. LC-FLD analysis
The LC system consisted of a Hewlett-Packard/Agilent Model 1050 quaternary pump, Model
1100 in-line degasser, autosampler, column oven, and Model 1200 fluorescence detector. The
Hewlett-Packard Chemstation software performed data acquisition and peak integration. The PST
oxidation products were separated using a reversed-phase Supelcosil LC-18, 150 x 4.6 mm id, 5 µm
column (Supelco) equipped with a guard column Supelguard Supelcosil C18, 20 x 4.0 mm id, 5 µm
(Supelco). The column was kept in an oven at 30oC. The mobile phase gradient used 2 mobile phases:
A (0.1 M ammonium formate, pH=6) and B (0.1 M ammonium formate in 5% acetonitrile, pH=6). The
elution gradient consisted of 0-5% B in the first 5 min, 5-70% B in the next 4 min and back to 0% B in
the next 5 min. Flow rate was 1 mL min-1 and the injection volumes were 50 µL and 100 µL, for the
oxidation products of peroxide and periodate reaction, respectively. The excitation and emission
wavelengths for fluorimetric detection were set at 340 nm and 395 nm, respectively.
5.2.8. Performance and quality control
Recovery experiments of the analytical procedure were carried out using clam tissues at two
concentration levels, following the methodology described in Quevauviller and Morabito (2000).
PST-free clam matrices were used to assess recoveries. The matrices were spiked in triplicate with the
addition of a toxin mixture including C1+2, B1, GTX2+3, STX, dcSTX and dcGTX2+3 to produce two
concentration levels. The spiked level I contained toxin concentrations ranging from 20 ng g-1 (dcSTX)
to 142 ng g-1 (C1+2), while spiked level II from 82 ng g-1 (dcSTX) to 567 ng g-1 (C1+2). Intervals of the

Chapter 5
92
mean recoveries for the quantified PSTs were: 71-74% (C1+2), 97-98% (B1), 87-104% (GTX2+3),
90-93% (STX), 77-114% (dcSTX) and 85%-107% (dcGTX2+3). For the NEO, a recovery of 97% was
obtained in matrices spiked in triplicate with 227 ng g-1 (level II). Repeatability values in terms of
relative standard deviation were from 1 to 18%. Instrumental detection limits (nmol L-1) were 3.9
(C1+2), 4.0 (B1), 4.0 (STX), 4.9 (dcSTX), 8.2 (dcGTX2+3), 8.5 (GTX2+3) and 31 (NEO). Evaluation of
linear ranges for PSTs and instrumental limits of detection are described in Botelho et al. (2010a).
The quality control of the results was obtained through the use of the certified reference materials
C1&2, STX-e, dcSTX, GTX5-b (B1), dcGTX2&3, GTX2&3-b and NEO-b, from the Institute for Marine
Biosciences, National Research Council Canada.
Figure 5.1 presents chromatograms illustrating the toxin separation in two standard mixtures
of C1+2, GTX2+3, B1 and STX after peroxide oxidation (a), of dcGTX2+3 and dcSTX after peroxide
oxidation (b), and in a selected cockle sample (sub-cellular particulate fraction P3-lysosomes) after
peroxide oxidation of the C18-cleaned extract (c).
Figure 5.1. Chromatograms obtained for two standard mixtures of C1+2, GTX2+3, B1 and STX after peroxide
oxidation (a), of dcGTX2+3 and dcSTX after peroxide oxidation (b), and for a selected cockle sample
(sub-cellular particulate fraction P3-lysosomes); quantification of dcGTX2+3, C1+2, dcSTX, GTX2+3 and B1 after
peroxide oxidation of the C18-cleaned extract (c).
20
25
30
35
40
0 2 4 6 8 10 12
Det
ect
or
resp
on
se (L
U)
min
GTX2+3 B1 STX
C1+2
(a)

Chapter 5
93
Figure 5.1. (cont.).
5.2.9. Calculation and statistical analysis
The content of each toxin quantified in the cytosolic fraction was estimated by the difference
between the quantity in the digestive gland and the sum of toxin quantities in the four particulate
cellular fractions. This estimation avoids errors associated with the direct determination of toxin
concentrations in the cytosolic fraction due to the small mass in the supernatant fraction after the
sequential fractionation. All quantities of toxins in digestive gland and sub-cellular particulate
fractions are based on 1 g of digestive gland (wet weight).
Student’s t-test was used to search differences in toxin quantities between each sampling date. The
significance level for statistical analyses used was α=0.05. Statistical analyses were performed using
Statistica 6.0 (Statsoft).
20
25
30
35
40
0 2 4 6 8 10 12
Det
ect
or
resp
on
se (
LU)
min
dcSTX
dcGTX2+3
(b)
20
25
30
35
40
45
0 2 4 6 8 10 12
De
tect
or r
esp
on
se (L
U)
min
GTX2+3
B1
(c)
dcGTX2+3
C1+2
dcSTX

Chapter 5
94
5.3. Results
5.3.1. Toxins in the digestive gland
Figure 5.2 shows the content of the quantified toxins in digestive glands of cockles per g wet
weight (ww), sampled at the algal bloom peak (day 0) and in the post-bloom period (days 8, 12, 14,
19, 21 and 25). On day 0, the mean quantity of C1+2 (174 nmol) was one order of magnitude above
B1 (43 nmol) and dcGTX2+3 (25 nmol), and two orders of magnitude above dcSTX (9.0 nmol), GTX2+3
(3.6 nmol) and STX (1.6 nmol). The quantity of toxins in digestive glands decreased with time,
following the decline of Gymnodinium catenatum bloom. Despite the predominance of C1+2, B1, and
dcGTX2+3 with respect to the other toxins, the decrease rate in the digestive gland varied among
toxins. Mean quantities of the minor toxins STX and GTX2+3 decreased 92 and 80% (p<0.05)
respectively, in the first eight days, and subsequently values remained close to the detection limits
(Figure 5.2). Significant (p<0.05) decreases were also found for dcGTX2+3 (60%), dcSTX (55%) and
C1+2 (50%) and, in the subsequent four days, additional mean losses (p<0.05) were 57, 49, and 61%,
respectively. The content of B1 decreased by only 12% in the first eight days, then fell sharply by 50%
between days 8 and 12 (p<0.05).
The quantities of B2, which were calculated indirectly through its hydrolysis into NEO,
exceeded up to three times those of B1. The estimated quantities of B2 in digestive glands of selected
samples for the days 0, 8, 12, 14, 19, 21, and 25 were (Figure 5.2): 159, 86, 38, 26, 10, 0.48, and <0.40
nmol, respectively. This decrease followed the tendency registered for C1+2 and dcGTX2+3, but was
faster than the variation seen for B1.

Chapter 5
95
Figure 5.2. Quantities (nmol) of the toxins C1+2, B1, B2, dcGTX2+3, dcSTX, GTX2+3 and STX in composite
samples of digestive glands of the cockle Cerastoderma edule exposed to a bloom of Gymnodinium catenatum
(day 0) and the subsequent 25 days under post-bloom conditions; mass unit: one g wet weight of digestive
gland; mean values (n=3; ±SD) for C1+2, B1, dcGTX2+3, dcSTX, GTX2+3 and STX, and individual values of
selected samples for B2.
5.3.2. Toxins in sub-cellular particulate fractions
The nuclei+debris fraction (P1) appeared as the particulate component of the cell with the
highest proportion of the quantified toxins (up to 23%). The fractions mitochondria (P2), lysosomes
(P3) and microsomes (P4) accounted to less than 11, 9, and 9% respectively.
As observed for the whole digestive gland, C1+2, B1 and dcGTX2+3 were the major toxins present in
the four particulate fractions (Figure 5.3).
Figure 5.3. Quantities (nmol) of the toxins C1+2, B1, dcGTX2+3, dcSTX, GTX2+3 and STX in the sub-cellular
particulate fractions (nuclei+debris - P1, mitochondria - P2, lysosomes - P3, microsomes - P4) of digestive glands
of the cockle Cerastoderma edule over the 25 days under post-bloom conditions; mass unit: one g wet weight
of digestive gland; mean values (n=3; ±SD).
0
20
40
60
80
0
50
100
150
200
0 8 12 14 19 21 25
B1
, dcG
TX2
+3
(n
mo
l)
C1
+2
, B2
(n
mo
l)
Time (day)
C1+2
B2
dcGTX2+3
B1
0
1
2
3
4
0
2
4
6
8
10
0 8 12 14 19 21 25
STX
, G
TX2
+3
(n
mo
l)
dcS
TX (
nm
ol)
Time (day)
dcSTX
STX
GTX2+3
0.0
0.5
1.0
1.5
2.0
dcG
TX2+
3, d
cSTX
, GTX
2+3
(nm
ol)
0
2
4
6
8
10
0
6
12
18
24
0 8 12 14 19 21 25
B1
(n
mo
l)
C1
+2
(n
mo
l)
Time (day)
P1 C1+2
B1
dcGTX2+3
dcSTX
GTX2+3
0.0
0.2
0.4
0.6
dcG
TX
2+
3, d
cST
X (
nm
ol)
0.0
0.5
1.0
1.5
0
2
4
6
0 8 12 14 19 21 25
B1
(n
mo
l)
C1
+2
(n
mo
l)
Time (day)
P2 C1+2
B1
dcGTX2+3
dcSTX

Chapter 5
96
Figure 5.3. (cont.)
On the basis of one g ww of digestive gland, the mean quantities of toxins in P1, P2, P3, and P4
fractions on day 0 were: C1+2 (19, 5.0, 2.3, and 2.4 nmol, respectively), B1 (4.4, 1.2, 0.55, and 0.55
nmol), dcGTX2+3 (1.2, 0.40, 0.23, and 0.19 nmol) and dcSTX (0.73, 0.16, 0.087, and 0.084 nmol).
Different decrease patterns were observed among pellets and toxins over the next 25 days. Toxin
GTX2+3 was only quantified in the P1 fraction (0.12 nmol), and was relatively constant over the 25
days of observations (0.053-0.070 nmol). The sharper toxin decreases (p<0.05) were found between
day 0 and day 8 in P1 (between 56% for GTX2+3 and 77% for dcSTX). Subsequently, decreases were
not statistically different. A similar pattern was registered in the P4 fraction, although reduction was
significant (p<0.05) only for C1+2 (36%), dcGTX2+3 (37%), and B1 (44%) between day 0 and day 8.
The mean quantities of toxins registered in the P2 and P3 fractions varied less regularly in the
first 19 days. In P2, the contents of dcGTX2+3 and dcSTX showed a smoother variation (p>0.05)
between day 0 and day 8 (6 and 13% respectively) than C1+2 (44%) and B1 (42%) with p<0.05. After
14 days under post-bloom conditions, an increase of 119% of dcGTX2+3 (p<0.05) and 51% B1 (p>0.05)
was observed. In P3, between day 0 and day 8, the quantities of C1+2 and dcGTX2+3 decreased 37%,
dcSTX remained constant, while the quantity of B1 increased 77%. The decrease of C1+2 and
dcGTX2+3 and the increase of B1 were statistically significant (p<0.05). Between days 12 and 14, the
quantity of dcGTX2+3 increased 51% (p<0.05). Values of STX were below the detection limit in the
four particulate fractions.
5.3.3. Toxins in the cytosolic fraction
Between 63 and 97% of the quantified toxins in the digestive gland were estimated to be
stored in the cytosolic fraction. The most abundant toxins were C1+2, B1, and dcGTX2+3 (Figure 5.4).
0.0
0.1
0.2
0.3
dcG
TX
2+
3, d
cST
X (n
mo
l)
0.0
0.3
0.6
0.9
1.2
0
1
2
3
0 8 12 14 19 21 25
B1
(n
mo
l)
C1
+2 (
nm
ol)
Time (day)
P3C1+2
B1
dcGTX2+3
dcSTX
0.0
0.1
0.2
0.3
dcG
TX2+
3, d
cSTX
(nm
ol)
0.0
0.2
0.4
0.6
0.8
0.0
1.0
2.0
3.0
0 8 12 14 19 21 25
B1
(n
mo
l)
C1+
2 (n
mo
l)
Time (day)
P4C1+2
B1
dcGTX2+3
dcSTX

Chapter 5
97
During the first eight days of post-bloom conditions, the mean quantities (nmol, on a basis of one g
ww of digestive gland) diminished 48% for C1+2 (145 to 76), 63% for dcGTX2+3 (25 to 9.4), and 82%
for GTX2+3 (3.4 to 0.60). Those differences were significant (p<0.05). Over the same period of time,
no statistical differences were observed for dcSTX (7.0 to 3.2 nmol) and B1 remained relatively
constant (30 nmol). The discrepancy between the variation with the time of B1 and each of the other
toxins is clearly shown in figure 5.4. The quantity of STX diminished abruptly between day 0 (1.6 nmol)
and day 8 (<0.1 nmol).
Figure 5.4. Estimated quantities (nmol) of the toxins C1+2, B1, dcGTX2+3, dcSTX, GTX2+3 and STX in the
cytosolic fraction of digestive glands of the cockle Cerastoderma edule over the 25 days under post-bloom
conditions; mass unit: one g wet weight of digestive gland; mean values (n=3; ±SD).
5.4. Discussion
The methodology used herein followed the procedures currently used to separate organelles
and the cytosolic fraction that are operationally defined by differential centrifugation (Campbell et al.,
2005; Raimundo et al., 2008). Consequently, the results obtained may contain potential artefacts
such as breakage or clumping of particles, leakage of soluble constituents from organelles, and
overlap among sub-cellular fractions, as reported in Wallace et al. (2003). Under these circumstances,
the partitioning of paralytic shellfish toxins among the cell compartments in digestive glands of
cockles exposed to a bloom of Gymnodinium catenatum and to post-bloom conditions indicates that
assimilated toxins were mainly stored in the cytosolic fraction. These results are in line with previous
work related to the partitioning of hydrophilic toxins (Mauriz and Blanco, 2010). As the biomass of
toxic algae decreased, the quantities of toxins in soluble and particulate sub-cellular fractions

Chapter 5
98
diminished, either reflecting the progressive lower ingestion of toxic dinoflagellate cells under
post-bloom conditions, or enzymatic and oxidative processes resulting in the elimination or
biotransformation of the assimilated toxins.
5.4.1. Reduction of toxin content under post-bloom conditions
The dominance of C1+2 followed by B1 and dcGTX2+3 in the whole and cell compartments of
digestive gland of cockles exposed to the algal bloom is in accordance with the toxin composition
reported for this algal species (Band-Schmidt et al., 2010; Botelho et al., 2012). During the period of
abundant biomass of this dinoflagellate, high toxin contents in the sub-cellular compartments and in
whole digestive gland should primarily reflect the assimilation of the major toxins produced by the
algae. The results of this study are in line with the predominance of those toxins in other bivalve
species exposed to this dinoflagellate species, during both the uptake and depuration phases
(Botelho et al., 2010a; Botelho et al., 2012; Samsur et al., 2007).
As the abundance of toxic cells diminished or became negligible in the lagoon, the quantity of
toxins in cockles decreased within 8 to 12 days, according to the compounds. This variation was
observed in the four sub-cellular particulate fractions and in the estimated cytosolic fraction. The
decreases found at sub-cellular level are in agreement with laboratory studies showing that
depuration rates of PSTs in whole bivalve tissues are relatively fast (Blanco et al., 2003; Botelho et al.,
2010a; 2012; Yu et al., 2007). Under post-bloom conditions, the weight of elimination or
transformation of the ingested toxins should progressively counterbalance the toxin uptake and
became the dominant phase of the bioaccumulation process.
The nuclei+debris fraction is considered the most operational fraction obtained by the
differential centrifugation approach, since it contains cell membranes, intact cells besides nuclei
(Bonneris et al., 2005). Nevertheless, toxin contents in this fraction decreased markedly between day
0 and day 8, most likely due to weak associations of toxins with fraction components. A similar
explanation may be considered for the rapid release of toxins in the microsomes fraction (P4). The
decrease rate of toxin contents was slower for dcGTX2+3 and dcSTX in the mitochondrial fraction (P2)
during the first days of post-bloom conditions, and for B1 in the whole digestive gland and cytosolic
fraction. An increase of B1 content was found in the lysosomes fraction (P3). The maintenance of

Chapter 5
99
these elevated values may reflect the slow apparent depuration rate of B1 relatively to other toxins,
as shown in the laboratory (Botelho et al., 2010a, 2012).
5.4.2. Toxin profiles in sub-cellular fractions
The possible interconversion among toxins is better visualised by plotting toxin profiles for each
separate cell compartment (Figure 5.5). The contribution of C1+2 to the toxin profile of the cytosolic
fraction showed an opposite trend to B1 when toxic algal cells was still elevated (first 12 days): C1+2
accounted for 79% to the total toxins on day 0 and decreased to 61% on day 12, while the
contribution of B1 increased from 16 to 32%. A similar pattern was observed for all the separate
pellets: C1+2 accounted for 74-53%, and B1 for 17-37%. As observed for the cytosolic fraction, the
proportion of B1 increased after 12 days to: up to 43% in nuclei+debris, 46% in lysosomes, 40% in
mitochondria and 36% in microsomes fractions. Two major explanations are proposed for the
opposite time-courses of C1+2 and B1: (i) high solubility of C1+2 relative to B1 (Samsur et al., 2006),
which facilitates elimination and consequently the progressively lower proportion of C1+2 in the toxin
profile; (ii) enhancement of B1 resulting from biotransformation of other assimilated toxins, namely
B2. To the best of our knowledge, conversion of B2 into B1 has not been evidenced in shellfish,
mainly due to the lack of certified reference material to confirm the presence of B2. Despite that
analytical incertitude to quantify B2, the accentuated decrease of B2 in digestive gland between day
0 and day 8 (approximately 50%) may have contributed to the less pronounced decrease registered
for B1 (Figure 5.2). Conversion of B2 into B1 would explain the singularity of B1 pattern, in
comparison to the other quantified toxins, under depuration after bloom cessation. This time
variation of B1 was clearly marked in the sub-cellular particulate fraction P3. In fact, B1
concentrations in lysosomes, between day 0 and day 8, showed a clear increase meaning that input
exceeded elimination. The approach followed in the current work is, however, insufficient to
elucidate the mechanisms behind biotransformation of toxins related to B1 (Fast et al., 2006).
5.4.3. Interconversion of toxins in mitochondrial and lysosomal fractions
During the period at which toxin content in digestive glands was elevated, the mitochondrial fraction
(P2) presented slower decreases of dcGTX2+3 and dcSTX than C1+2 and B1. These differences may be
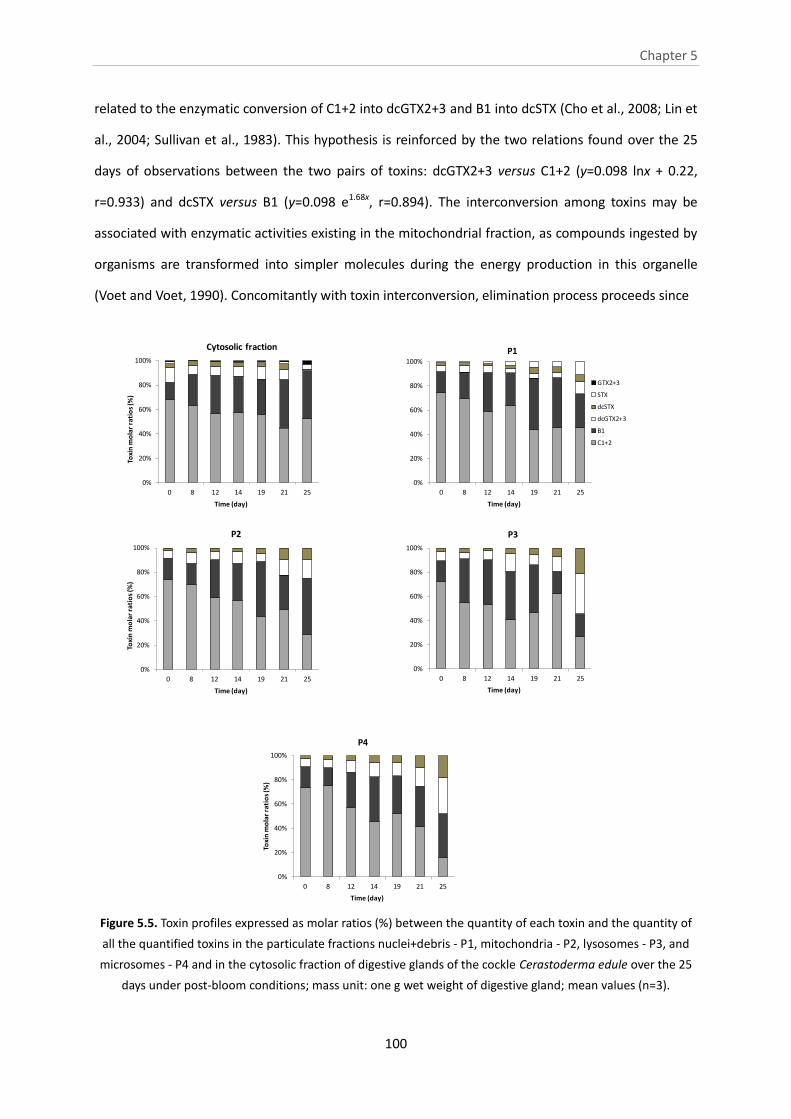
Chapter 5
100
related to the enzymatic conversion of C1+2 into dcGTX2+3 and B1 into dcSTX (Cho et al., 2008; Lin et
al., 2004; Sullivan et al., 1983). This hypothesis is reinforced by the two relations found over the 25
days of observations between the two pairs of toxins: dcGTX2+3 versus C1+2 (y=0.098 lnx + 0.22,
r=0.933) and dcSTX versus B1 (y=0.098 e1.68x, r=0.894). The interconversion among toxins may be
associated with enzymatic activities existing in the mitochondrial fraction, as compounds ingested by
organisms are transformed into simpler molecules during the energy production in this organelle
(Voet and Voet, 1990). Concomitantly with toxin interconversion, elimination process proceeds since
Figure 5.5. Toxin profiles expressed as molar ratios (%) between the quantity of each toxin and the quantity of
all the quantified toxins in the particulate fractions nuclei+debris - P1, mitochondria - P2, lysosomes - P3, and
microsomes - P4 and in the cytosolic fraction of digestive glands of the cockle Cerastoderma edule over the 25
days under post-bloom conditions; mass unit: one g wet weight of digestive gland; mean values (n=3).
0%
20%
40%
60%
80%
100%
0 8 12 14 19 21 25
Toxi
n m
ola
r ra
tio
s (%
)
Time (day)
Cytosolic fraction
0%
20%
40%
60%
80%
100%
0 8 12 14 19 21 25
Time (day)
P1
GTX2+3
STX
dcSTX
dcGTX2+3
B1
C1+2
0%
20%
40%
60%
80%
100%
0 8 12 14 19 21 25
Toxi
n m
ola
r ra
tio
s (%
)
Time (day)
P2
0%
20%
40%
60%
80%
100%
0 8 12 14 19 21 25
Time (day)
P3
0%
20%
40%
60%
80%
100%
0 8 12 14 19 21 25
Toxi
n m
ola
r ra
tio
s (%
)
Time (day)
P4

Chapter 5
101
organisms are under natural depuration conditions. Previous work showed the export of dcSTX as
faeces or pseudo-faeces of the clam Ruditapes decussatus under depuration conditions after being
exposed to G. catenatum (Botelho et al., 2012). In this study, the absence of B1 and C1+2 in faeces
reinforced the importance of biotransformation in comparison to elimination processes.
The accentuated increase of B1 in the lysosome fraction (P3), and the plateau of dcSTX values
on day 8, pointed to interconversion processes, as proposed for the mitochondrial fraction (P2). A
plausible explanation for the increase of B1 is the possibility that this compound is a metabolic
product of degradation of other toxins (Oshima, 1995b). In particular, the abundant toxin B2 may be
reduced to B1 due to their similar chemical structures. Since contents of B2 largely exceeded B1,
conversion of small quantities of B2 may be sufficient to enhance B1. In addition, C1+2 may also be
converted into B1 through the cleavage of 11-hydroxysulfate, as proposed conversion of GTX2 and
GTX3 into STX (Oshima, 1995b).
These transformations are associated to the major role of lysosomes in the intra-cellular
digestive process of materials acquired through vesicular transport (Voet and Voet, 1990). Along this
process undesirable compounds, such as toxins, may be incorporated in the lysosomes and
subsequently degraded in order to protect the cell from cytotoxic effects (Moore, 1988; Owen, 1972;
Viarengo et al., 1987). Svensson et al. (2003) pointed to the uptake and storage of okadaic acid within
the lysosomal system in order to protect the blood cells in mussels. The results found in the present
work, although dealing with hydrophilic compounds, may also be interpreted as the removal by
lysosomes of toxins present in the cytosol. Besides enzymatic activity in the lysosomes, the possibility
that other processes occurring in the cytosol have contributed to the toxin elimination should not be
excluded.
5.5. Conclusions
The study of the sub-cellular partitioning of paralytic shellfish toxins in digestive glands of
cockles exposed to a bloom of G. catenantum showed the presence of toxins in the sub-cellular
particulate fractions constituted mainly by nuclei+debris, mitochondria, lysosomes and microsomes.
The largest quantities were estimated in the cytosolic fraction. Under post-bloom conditions, the

Chapter 5
102
variation of toxin contents and toxin profiles emphasises the differential elimination of these
compounds. Interconversion among toxins and exchanges between insoluble and soluble cellular
fractions are the most plausible reasons. In particular, the non-uniform decrease of B1 contents in the
lysosomal fraction points to the conversion of other toxins, like B2 and C1+2, into B1 following the
sub-cellular digestive processes of the ingested food.
Acknowledgements
Joana Raimundo acknowledges a grant by “Fundação para a Ciência e a Tecnologia” (FCT, Grant
No. SFRH/BPD/91498/2012). This work had been performed under the project TOXIGEST financed by
PROMAR (2007-2013). We appreciate the collaboration of the IPMA team involved in the toxic
phytoplankton monitoring programme.

Chapter 6
103
6. Identification of seasonal and multi-annual trends of bivalve toxicity by
PSTs in Portuguese estuarine and coastal waters
Highlights
Toxicity by PSTs in bivalves from estuarine and coastal waters of Portugal was examined.
Irregular multi-annual variations over 18 years considering 4 species and 7 areas.
Peak toxicities in autumn/winter and occasionally in summer.
Episodes of mussel and cockle toxicities connected in three estuarine systems.
Toxicity episodes of cockle and wedge clam connected despite toxin biotransformation.
Botelho, M.J., Vale, C., Ferreira, J.G. (submitted). Identification of seasonal and multi-annual
trends of bivalve toxicity by PSTs in Portuguese estuarine and coastal waters. Estuarine, Coastal and
Shelf Science.
6

Chapter 6
104
Abstract
Temporal and spatial trends of paralytic shellfish toxins (PSTs) in bivalves from Portuguese
estuarine and coastal waters, and connectivity of bivalve toxicity among the harvest areas, were
examined using long-term monitoring data from the national biotoxin monitoring programme (BMP).
Data from the period between 1994 and 2012 were chosen for commercial bivalve species sensitive
to PSTs, and for production areas exhibiting recurrent episodes of bivalve toxicity: mussels (Mytilus
spp.), and cockles (Cerastoderma edule) from the Aveiro, Mondego, Óbidos, and Formosa estuarine
systems, and wedge clam (Donax trunculus) and surf clam (Spisula solida) from the coastal areas
Aguda, Comporta, and Culatra. Bivalve toxicity data point to an irregular multi-annual variation of
PSTs episodes, most likely associated with the inter-annual variability of favourable oceanographic
conditions triggering the bloom formation of Gymnodinium catenatum, which is the species
responsible for PSP in Portuguese waters. Episodes in the southern coast of Portugal were less
recurrent. However, the values above the PST regulatory limit (elevated toxicity) displayed a seasonal
signal with a peak between autumn and early winter and, in some years, an additional enhancement
in summer. A connectivity index of bivalve toxicity was defined among the surveyed areas, on the
basis of the number of weeks per month that bivalves showed elevated toxicity values. High
connectivity was obtained among Aveiro, Mondego and Óbidos, suggesting the import of G.
catenatum cells from blooms formed or reaching the coastal waters adjacent to these estuaries.
During episodes of elevated toxicity, toxin profiles in mussels and cockles were dominated by
N-sulfocarbamoyl compounds, which are the major toxins produced by toxic dinoflagellates.
Connectivity was also registered between cockles from Formosa and wedge clams from the adjacent
area of Culatra, although the toxin profile of wedge clams suggests a greater influence of
transformation or elimination of ingested toxins than in the cockles.
Keywords: Harmful algal blooms; Bivalves; Paralytic shellfish poisoning; Gymnodinium
catenatum; Monitoring programmes

Chapter 6
105
6.1. Introduction
Paralytic shellfish toxins (PSTs) are a broad group of neurotoxins produced by species of
harmful marine dinoflagellates belong to the genera Alexandrium, Pyrodinium and Gymnodinium
(Wiese et al., 2010). The mechanism of action of PSTs is the blockage of the conductance of nerve
signals by interfering with the sodium channels of excitable cells (Kao, 1966). The better studied PSTs
are included in the following groups: carbamate (saxitoxin-STX, neosaxitoxin-NEO and
gonyautoxins-GTX1 to GTX4), N-sulfocarbamoyl (B1, B2, C1 to C4), and decarbamoyl (dcGTX1 to
dcGTX4, dcSTX and dcNEO). As higher performance laboratory instruments became available, analytic
methodologies improved and the chemical structure of other PST toxins was progressively identified
(Llewellyn, 2006).
During blooms of species that produce PSTs, bivalves concentrate toxins in their tissues from
the large volumes of water cleared when feeding. Most of the Alexandrium species have a
carbamate-dominated toxin profile (Cembella et al., 1987; Chou et al., 2004), while N-sulfocarbamoyl
toxins are dominant components in G. catenatum (Ordás et al., 2004; Band-Schimdt et al., 2005;
Botelho et al., 2012). Decarbamoyl toxins are generally less abundant in those dinoflagellates.
Nevertheless, bivalves may modify the toxin composition of the causative dinoflagellate by
differential uptake and depuration kinetics of individual toxins (Botelho et al., 2010a; Yu et al., 2007)
in conjunction with metabolic interconversion of the assimilated toxins (Shimizu and Yoshioka, 1981;
Sullivan et al., 1983; Kotaki et al., 1985; Oshima, 1995b). Ingested toxins and those resulting from
interconversion contribute in different proportions to bivalve toxicity (Oshima et al., 1990; Samsur et
al., 2006).
Human consumption of contaminated bivalves by PSTs may result in neurological and
gastrointestinal illnesses (Gessner and Middaugh, 1995). The first paralytic shellfish poisoning (PSP)
event was reported in 1927 near San Francisco, USA, caused by Alexandrium catenella (Sommer and
Meyer, 1937). The association of G. catenatum blooms with PSP episodes was firstly reported in NW
Spain, Pacific coast of Mexico, Australia, Japan (Hallegraeff et al., 2012), and Portugal (Franca and
Almeida, 1989). Due to the potential severity of the symptoms, since the 1970s to 1980s several
countries run national monitoring programmes of PSTs in commercial bivalves to alert the consumers
about bivalve toxicity episodes (Mons et al., 1998; Batoréu et al., 2005). As monitoring programmes

Chapter 6
106
were implemented in various countries, it became apparent that Gymnodinium catenatum is a
cosmopolitan species (Band-Schimidt et al., 2010). Hallegraeff et al. (2012) have proposed two
possible mechanisms for G. catenatum blooms: (i) high abundance of cells derived from inocula by
local cyst beds or motile cells (autochthonous case), triggered by organic enrichment associated to
rainfall events (e.g., Tasmanian estuaries); and (ii) the allochthonous case of G. catenatum blooms
that are inoculated from offshore, and build up during upwelling relaxation (e.g., NW Spanish Rias). In
Portuguese coastal waters, the record of G. catenatum blooms has been also associated with
category (ii), i.e. relaxation of coastal upwelling that occurs recurrently in the western region, and
slow currents or inshore eddies that contribute to the maintenance of this species near the coast
(Moita el al., 2003; Pitcher et al., 2010).
The toxicity of bivalve species by PSTs and the presence of toxic phytoplankton species in
Portuguese coastal and estuarine waters have been monitored since the 1980s. Using the national
biotoxin monitoring database, overviews of the commercial bivalve contamination associated with
diarrhetic shellfish poisoning, amnesic shellfish poisoning and paralytic shellfish poisoning were
presented in Sampayo et al. (1997) and Vale at al. (2008). These overviews focused on the incidence
of maximum toxicity values for several commercial species and on the most affected production areas.
The main objective of the present work is to examine whether the occurrence of PST episodes in
Portugal between 1994 and 2012 exhibited multi-annual or seasonal variation signal. The hypothesis
was tested for mussels, cockles, wedge clams and surf clams regularly sampled in transitional and
coastal waters of Portugal. In addition, the connectivity of toxicity episodes among more regularly
surveyed areas was examined.
6.2. Bivalve toxicity and data analysis
6.2.1. Biotoxin monitoring programme
Bivalve toxicity data used in the present work were obtained from the Portuguese biotoxin
monitoring programme (BMP) started in 1994 by the Portuguese Institute of Marine Research
(IPIMAR) and subsequent Governmental Institutes (Sampayo et al., 1997; Vale et al., 2008). The
monitoring of bivalve toxicity is accomplished by the surveillance of toxic algal blooms producers of
DSP, PSP and ASP (Anon., 2004a; Sampayo et al., 1997; Vale et al., 2008). Presently, the BMP covers

Chapter 6
107
38 production areas located in coastal lagoons, estuaries and open coastal areas where commercial
bivalves are currently harvested (Figure 6.1).
Figure 6.1. Harvesting areas of mollusc bivalves: Aveiro, Mondego,
Óbidos, and Formosa (estuarine systems), and Aguda, Comporta and
Culatra (open coastal areas).
The programme includes most of the commercial bivalve species harvested in coastal lagoons
and estuaries (Mytilus spp., Cerastoderma edule, Ruditapes decussatus, Venerupis pullastra,
Scrobicularia plana, Ensis spp., Solen spp., Venus verrucosa, Ostrea spp. and Crassostrea spp.) and in
the coastal zone until 15 m depth (Spisula solida, Donax trunculus, Ensis siliqua, Callista chione and
Chamelea gallina) (Oliveira et al., 2013). In estuarine systems, species were harvested from natural
banks, except Mytilus spp., which was collected from intertidal substrates and R. decussatus and
Crassostrea spp. from intertidal growth grounds. The episodes of DSP, PSP and ASP are alerted by
bivalve toxicity values above the corresponding regulatory limit (RL). Every time a sample presents
toxicity values exceeding the RL, the closure for bivalve harvesting is mandatory. According to the
European Regulation, the sector regains the activity when two successive samples show values below
RL (Anon., 2004b).

Chapter 6
108
From 1994 to 2001 the bivalve toxicity by PST was determined by a mouse bioassay
methodology (AOAC, 1990; Anon., 2005a). From 2002 to 2008 toxin concentrations were determined
chemically using a LC method with pre-column derivatisation based on Lawrence et al. (1995)
modified by Vale and Sampayo (2001). After 2009, PST determinations followed the methodology
described in Anon. (2005b). After chemical determinations by these two methodologies, toxicity
values were estimated multiplying toxin concentrations by the toxicity equivalence factor (TEF) of
each individual compound quantified. Following the recommendations of the EU Reference
Laboratory for Marine Biotoxins, after June 2010, different TEFs were used to estimate the bivalve
toxicity (EFSA, 2009). For the purpose of data consistency in this study, all toxicity values originally
determined using Oshima TEF (Oshima, 1995b) were recalculated using EFSA. Since 1940s the
regulatory limit for PSTs is 800 µg STX di-HCl equivalents per kg of shellfish (Anon., 2004b; Sommer
and Meyer, 1937). A detailed description of the BMP, location of the natural production areas of
bivalves, analytical methodologies and toxicity calculations are described in Vale and Sampayo (2001),
Vale et al. (2008), and Botelho et al. (2010b).
6.2.2. Formulas and calculations
6.2.2.1. Sampling representativeness
Sporadically, the BMP database contains, for the same production area and species, two
toxicity values for the same week. Those situations correspond to an abrupt increase of bivalve
toxicity values exceeding the RL. To better compare with other periods only the first value was
considered, under the assumption that each toxicity value integrates one weekly period. Due to
logistic problems bivalves were not sampled every week, sampling representativeness varying along
the monitoring programme. The sampling representativeness on a monthly (SRM, %) and yearly
(SRY, %) basis was calculated for each bivalve species and production area using the following
expressions:
SRM =N1 x 100/4 (6.1)
Where N1 is the number of samples collected monthly, and 4 is the number of weeks per
month.
SRY=N2 x 100/52 (6.2)
Chapter 6
109
Where N2 is the number of samples collected annually, and 52 is the number of weeks per year.
On the basis of SRM or SRY the confidence levels associated with the sampling periods (CL,
scored from 0 to 4) were defined:
CL SRM or SRY (%)
4 >80
3 60-79
2 40-59
1 20-39
0 <20
6.2.2.2. Proportion of elevated toxicity samples
For each bivalve species and production area, the proportion of samples with elevated toxicity
(TSM and TSY, %) was calculated by dividing the number of samples presenting toxicity values above
the RL per month (N3) or year (N4), by the number of samples collected in that period of time, month
(N1) or year (N2):
TSM=N3 x 100/N1 (6.3)
TSY=N4 x 100/N2 (6.4)
6.2.2.3. Connectivity Index
To assess the possible interconnection of PST episodes among two or three estuarine or coastal
areas, a Connectivity Index for bivalve toxicity on a monthly basis (CI) was defined. The score of CI (0
to 4) was based on the number of weeks per month that bivalve species showed toxicity values above
RL concomitantly in each area. For example, the maximum score of connectivity (4) was attributed to
the month that areas exhibited four or three weeks of elevated toxicity values.

Chapter 6
110
CI scores Number of weeks/month in each area
4 four, three
3 three, two, one
2 two, one
1 one, none
0 none
6.3. Results
6.3.1. Data selection
After having associated each toxicity value with the corresponding week (section 6.2.2), the
selection of the data was based on the following steps: (i) selection of surveyed areas with recurrent
PST episodes (high TSY); (ii) choice of bivalve species considered as sentinel organism (mussel) or with
economic value to the region (cockles and clams); (iii) selection of annual periods with moderate to
elevated sampling frequency of bivalves (high SRY and CL).
6.3.1.1. Surveyed areas
Three areas in the coastal zone were selected (Figure 6.1): Aguda and Comporta in the west
coast, and Culatra in the south. Since the abundance of bivalves within each area varied along the
18-year survey (Rufino et al., 2008), the coordinates of the harvesting sites have changed. Closure of
bivalve harvest from the western areas has been influenced by the recurrent episodes of G.
catenatum blooms (Moita et al., 1998, 2003; Vale et al., 2008), while episodes were less recurrent in
the southern area. Four estuarine areas were chosen: Aveiro, Mondego and Óbidos in the west coast,
and Formosa in the southern area. Whereas Mondego is a tubular estuary, Aveiro, Óbidos and
Formosa have broad inner areas and narrow connections to the sea, are generally classified as
lagoons (Bettencourt et al., 2004). All estuarine systems are mesotidal, and exchange large water
volumes with the adjacent sea. The western systems considered in this study exchange water and
seston with coastal waters with recurrence episodes of G. catenatum blooms, whereas the Formosa
coastal lagoon imports less toxic cells of dinoflagellates. Its selection was due to the large quantities
of cockles and clams produced and harvested (DGRM, 2012).

Chapter 6
111
6.3.1.2. Bivalve species
Four bivalve species were chosen: mussel Mytilus spp., cockle Cerastoderma edule, wedge
clam Donax trunculus, and surf clam Spisula solida. Mussels were collected from hard substrates in
inlet channels of Aveiro, Mondego, Óbidos systems, and cockles from sandy inner areas of Aveiro,
Mondego, Óbidos and Formosa. The wedge clam Donax trunculus and surf clam Spisula solida were
harvested from open areas of western and southern coasts. Habitats and ecology of these species are
described in Gaspar et al. (1999), Joaquim et al. (2008) and Rufino et al. (2010).
6.3.1.3. Years
The sampling representativeness (SRY, Eq. 6.2) of toxicity data, between 1994 and 2012, was
examined to select the species and surveyed areas (Table 6.1). In general, sampling in the open coast
(Aguda, Comporta and Culatra) had lower SRY than in estuarine areas (Aveiro, Mondego, Óbidos and
Formosa), since sampling in coastal waters is highly dependent on the activity of commercial vessels.
The period 1994-2002 showed lower SRY than the following years, particularly in estuarine areas.
Table 6.1. Annual sampling representativeness (%) between 1994 and 2012 in Aveiro, Mondego, Óbidos, and
Formosa (mussel and cockle), Aguda (surf clam), Comporta (wedge clam) and Culatra (surf clam and wedge clam).
Aveiro Mondego Óbidos Formosa Aguda Comporta Culatra
Year M C M C M C C SC WeC SC WeC
Annual Sampling Representativeness (SRY,%)
1994 62 19 42 21 15 25 58 23 8 38 38
1995 50 52 35 31 25 35 87 6 4 21 38
1996 52 27 33 25 40 54 31 2 na 62 23
1997 54 40 60 58 40 50 na 4 na 21 6
1998 27 40 54 56 27 33 6 12 13 38 63
1999 27 44 33 33 10 17 40 12 4 31 12
2000 31 37 15 15 na 15 8 8 2 29 6
2001 6 4 8 4 na na 6 2 na 2 4
2002 17 12 2 na 12 13 4 na 4 na 6
2003 87 73 25 na 67 63 4 na 13 2 19
2004 81 79 44 4 87 81 8 10 21 4 50
2005 87 85 54 31 79 31 27 31 50 15 38
2006 85 83 81 79 77 69 63 44 54 23 71

Chapter 6
112
Table 6.1. (cont.)
Aveiro Mondego Óbidos Formosa Aguda Comporta Culatra
Year M C M C M C C SC WeC SC WeC
Annual Sampling Representativeness (SRY,%)
2007 50 58 73 71 69 63 81 48 56 38 54
2008 25 23 42 38 69 60 31 21 38 15 35
2009 65 17 62 2 19 2 69 35 na 19 40
2010 50 85 79 77 48 4 67 52 na 2 44
2011 92 92 31 6 73 37 60 29 4 15 44
2012 33 44 na 15 42 6 25 19 12 19 44
M=mussel; C=cockle; SC=surf clam; WeC=wedge clam
na=not applicable
6.3.2. Interannual variation of bivalve toxicity by PSTs
6.3.2.1. Estuarine areas
Figure 6.2 shows the annual proportion of samples (TSY, Eq. 6.4) of elevated toxicities from
Aveiro, Mondego, Óbidos and Formosa for the period 1994-2012, as well as the corresponding
confidence levels (CL). Values of TSY in Aveiro, Mondego and Óbidos were enhanced in two periods of
time: 1994-1995 and 2005-2009. Confidence levels (CL) were lower in the first period (2±0.9) than in
the second one (3±1.3). Between the two periods, PST concentrations in most mussel and cockle
samples were undetected (bioassay) or below the limit of detection (chromatographic method). The
hypothesis of PST episodes remaining undetected due to lack of samples could be valid for 1999-2002,
but it is unlikely in 2003 and 2004 since CL reached 4±1.4. The most elevated values of TSY were
registered in 2008, varying from 50% (Aveiro and Óbidos) to 82% (Mondego) for mussels, and from 21%
(Aveiro) to 75% (Mondego) for cockles. These values indicate that more than half of the surveyed
weeks in Mondego showed bivalve toxicity above the regulatory limit, and consequently the legal
harvest was interrupted. Cockles from Formosa showed toxicity peaks in 1994, 1995 (as observed in
the western estuarine systems), and 2009. In 1996, 2003 and 2004 only a few samples exhibited toxin
concentrations above the limit of detection. The values of TSY for cockles from Formosa in 1994, 1995
and 2009 varied from 11 to 24%, meaning that less than a quarter of the surveyed weeks showed
cockle toxicity.

Chapter 6
113
Figure 6.2. Annual proportion of elevated toxicity samples (bars, TSY) and confidence levels (squares, CL);
mussels (M) and cockles (C) from Aveiro, Mondego, Óbidos and Formosa, between 1994 and 2012.
6.3.2.2. Open coastal areas
For the period 1994-2012, the annual proportion of samples (TSY, Eq. 6.4) with toxicity above
the RL from Aguda, Comporta, and Culatra, as well as the corresponding confidence levels are shown
in Figure 6.3. The multi-annual variation of bivalve toxicity in open coastal areas was less clearly
defined than in estuarine areas. Indeed, elevated toxicity values were not registered in the two
periods (1994-1995 and 2005-2009), but in several years depending on the harvesting area 1994,
2005-2007, 2009 and 2011 in surf clams from Aguda; 1994-1995, 2007-2008 in wedge clams from
Comporta; and 1994-1995, 2008-2009 and 2012 in wedge and surf clams from Culatra. Elevated
toxicity in 1994 or 1995 was found in the three coastal areas, while the episodes were less regular in
subsequent periods. The confidence levels (CL) varied with the species and area: for surf clams 2±0.8
(Aguda) and 2±0.9 (Culatra); for wedge clams 1±0.0 (1994-1995) and 2±0.7 (2007-2008) for Comporta,
and 2±0.6 for Culatra. The proportion of toxic weeks (TSY) for surf clam varied from 7% in Aguda to 60%
in Culatra, while for wedge clam values ranged from 8% in Culatra to 50% in Comporta. The period
1996-2004 was not accounted due to sampling uncertainty (low CL). Although most of samples from
0
1
2
3
4
0
20
40
60
1994
1996
1998
2000
2002
2004
2006
2008
2010
2012
CL
(0
-4)
TS
Y(%
)
Year
Óbidos (M)
0
1
2
3
4
0
20
40
601994
1996
1998
2000
2002
2004
2006
2008
2010
2012
CL
(0-4
)
TS
Y(%
)
Year
Aveiro (M)
0
1
2
3
4
0
20
40
60
1994
1996
1998
2000
2002
2004
2006
2008
2010
2012
CL
(0-4
)
TS
Y(%
)
Year
Mondego (M)77
0
1
2
3
4
0
20
40
60
1994
1996
1998
2000
2002
2004
2006
2008
2010
2012
CL
(0-4
)
TS
Y(%
)
Year
Aveiro (C)
0
1
2
3
4
0
20
40
60
1994
1996
1998
2000
2002
2004
2006
2008
2010
2012
CL
(0-4
)
TS
Y(%
)
Year
Mondego (C)
0
1
2
3
4
0
20
40
60
1994
1996
1998
2000
2002
2004
2006
2008
2010
2012
CL
(0
-4)
TS
Y(%
)
Year
Óbidos (C)
0
1
2
3
4
0
20
40
60
1994
1996
1998
2000
2002
2004
2006
2008
2010
2012
CL
(0-4
)
TS
Y(%
)
Year
Formosa (C)

Chapter 6
114
the open coastal areas presented undetected toxins, low PST values were quantified in a few samples,
either through bioassays (1999 and 2000) or by chromatography (2003 and 2004).
Figure 6.3. Annual proportion of elevated toxicity samples (bars, TSY) and confidence levels (squares, CL); surf
clams (SC) from Aguda and Culatra, and wedge clams (WeC) from Comporta and Culatra, between 1994 and
2012.
6.3.3. Seasonal variation of bivalve toxicity by PSTs
The seasonal trend of PST toxicity was examined for the two periods 1994-1995 and 2005-2009
because it include the toxicity episodes of longer duration. The values of TSM and CL for the seven
surveyed areas are presented in the Figure 6.4. Mussels and cockles from Aveiro, Mondego and
Óbidos showed elevated values of TSM between October 1994 and January 1995, while the duration
of toxicity episodes in surf clam and wedge clam was limited to November 1994 (Aguda), October
1994 and January 1995 (Comporta). Cockle toxicity episodes in Formosa were also registered in
autumn/early winter of 1994 and 1995, while for wedge clam and surf clam from Culatra toxicity was
only found in autumn/early winter of 1995. The pattern of enhanced TSM values in autumn/early
winter was also found for 2005, 2007 and 2009 in Aveiro, Mondego and Óbidos (Figure 6.5).
Additional toxicity episodes were observed in June-August 2006 and 2008. The prolonged periods of
toxicity between autumn 2007 and summer 2008 should be emphasised, with high CL score (3 to 4).
0
1
2
3
4
0
20
40
60
1994
1996
1998
2000
2002
2004
2006
2008
2010
2012
CL
(0-4
)
TS
Y(%
)
Year
Aguda (WhC)
0
1
2
3
4
0
20
40
60
1994
1996
1998
2000
2002
2004
2006
2008
2010
2012
CL
(0
-4)
TS
Y(%
)
Year
Culatra (WhC)
0
1
2
3
4
0
20
40
60
1994
1996
1998
2000
2002
2004
2006
2008
2010
2012
CL
(0-4
)
TS
Y(%
)
Year
Comporta (WeC)
0
1
2
3
4
0
20
40
60
1994
1996
1998
2000
2002
2004
2006
2008
2010
2012
CL
(0-4
)
TS
Y(%
)
Year
Culatra (WeC)
Aguda (SC) Culatra (SC)

Chapter 6
115
The variation of toxicity episodes of wedge clam (Comporta) and surf clam (Aguda) was in line with
the observations in the estuarine areas, although of shorter duration. This shorter period cannot be
associated with poor sampling representativeness, since high CL was obtained in autumn and winter.
Toxicity of cockles (Formosa), wedge clam and surf clam (Culatra) were above the regulatory limit in
August 2009, and toxin concentrations were generally below the limit of detection between 2005 and
2008.
Figure 6.4. Monthly proportion of elevated toxicity samples (black and grey bars, TSM) and confidence levels
(squares and triangles, CL); mussels (M) and cockles (C) from Aveiro, Mondego and Óbidos; cockles from
Formosa; surf clams (SC) from Aguda and Culatra; wedge clams (WeC) from Comporta and Culatra; period:
1994-1995; black bars and squares represent mussels and surf clams; grey bars and triangles represent cockles
and wedge clams.
0
1
2
3
4
0
20
40
60
80
100
J F M A M J J A S O N D J F M A M J J A S O N D
CL
(0-4
)
TS
M(%
)
Month (1994-1995)
Aveiro (M, C)
0
1
2
3
4
0
20
40
60
80
100
J F M A M J J A S O N D J F M A M J J A S O N D
CL
(0
-4)
TS
M(%
)
Month (1994-1995)
Mondego (M, C)
0
1
2
3
4
0
20
40
60
80
100
J F M A M J J A S O N D J F M A M J J A S O N D
CL
(0-4
)
TS
M(%
)
Month (1994-1995)
Óbidos (M, C)
0
1
2
3
4
0
20
40
60
80
100
J F M A M J J A S O N D J F M A M J J A S O N D
CL
(0-4
)
TS
M(%
)
Month (1994-1995)
Formosa (C)

Chapter 6
116
Figure 6.4. (cont.)
6.3.4. Molar proportion of the toxins C1+2 and B1 in bivalves
The toxins C1+2 and B1 are the major components of the toxin profile of G. catenatum, the
current algae responsible for PST in the Portuguese coastal areas (Sousa et al., 1995; Negri et al.,
2007; Botelho et al., 2012). To search whether toxins in bivalves collected in the BMP mirror the
composition of that algal species, the molar proportion of C1+2 plus B1 (N-sulfocarbamoyl toxins)
relative to the total quantified PSTs was calculated (in %) for mussels, cockles, surf clams and wedge
clams from selected areas, between 2007 and 2011.
0
1
2
3
4
0
20
40
60
80
100
J F M A M J J A S O N D J F M A M J J A S O N D
CL
(0-4
)
TS
M(%
)
Month (1994-1995)
Aguda (SC)
0
1
2
3
4
0
20
40
60
80
100
J F M A M J J A S O N D J F M A M J J A S O N D
CL
(0-4
)
TS
M(%
)
Month (1994-1995)
Comporta (WeC)
0
1
2
3
4
0
20
40
60
80
100
J F M A M J J A S O N D J F M A M J J A S O N D
CL
(0-4
)
TS
M(%
)
Month (1994-1995)
Culatra (SC, WeC)

Chapter 6
117
Figure 6.5. Monthly proportion of elevated toxicity samples (black and grey bars, TSM) and confidence levels (squares and triangles, CL); mussels (M) and cockles (C) from
Aveiro, Mondego and Óbidos; cockles from Formosa; surf clams (SC) from Aguda and Culatra; wedge clams (WeC) from Comporta and Culatra; period: 2005-2009; black bars
and squares represent mussels and surf clams; grey bars and triangles represent cockles and wedge clams.
0
1
2
3
4
0
20
40
60
80
100
J FMAMJ J ASOND J FMAMJ J ASOND J FMAMJ J ASOND J FMAMJ J ASOND J FMAMJ J ASOND
CL
(0-4
)
TS
M(%
)
Month
2005 2007 2008 20092006
Aveiro (M,C)
0
1
2
3
4
0
20
40
60
80
100
J FMAM J J A SOND J FMAM J J A SOND J FMAM J J A SOND J FMAM J J A SOND J FMAM J J A SOND
CL
(0-4
)
TS
M(%
)
Month
Mondego (M,C)
2005 2007 2008 20092006
0
1
2
3
4
0
20
40
60
80
100
J FMAM J J A SOND J FMAM J J A SOND J FMAM J J A SOND J FMAM J J A SOND J FMAM J J A SOND
CL
(0-4
)
TS
M(%
)
Month
Óbidos (M,C)
2005 2007 2008 20092006
0
1
2
3
4
0
20
40
60
80
100
J FMAM J J A SOND J FMAM J J A SOND J FMAM J J A SOND J FMAM J J A SOND J FMAM J J A SOND
CL
(0-4
)
TS
M(%
)
Month
Formosa (C)
2005 2007 2008 20092006

Chapter 6
118
Figure 6.5.(cont.)
0
1
2
3
4
0
20
40
60
80
100
J FMAMJ J A SOND J FMAMJ J A SOND J FMAMJ J A SOND J FMAMJ J A SOND J FMAMJ J A SOND
CL
(0-4
)
TS
M(%
)
Month
Aguda (SC)
2005 2007 2008 20092006
0
1
2
3
4
0
20
40
60
80
100
J FMAMJ J A SOND J FMAMJ J A SOND J FMAMJ J A SOND J FMAMJ J A SOND J FMAMJ J A SOND
CL
(0-4
)
TS
M(%
)
Month
Comporta (WeC)
2005 2007 2008 20092006
0
1
2
3
4
0
20
40
60
80
100
J FMAMJ J A SOND J FMAMJ J A SOND J FMAMJ J A SOND J FMAMJ J A SOND J FMAMJ J A SOND
CL
(0
-4)
TS
M(%
)
Month
2007 2008 20092005 2006
Culatra (SC, WeC)
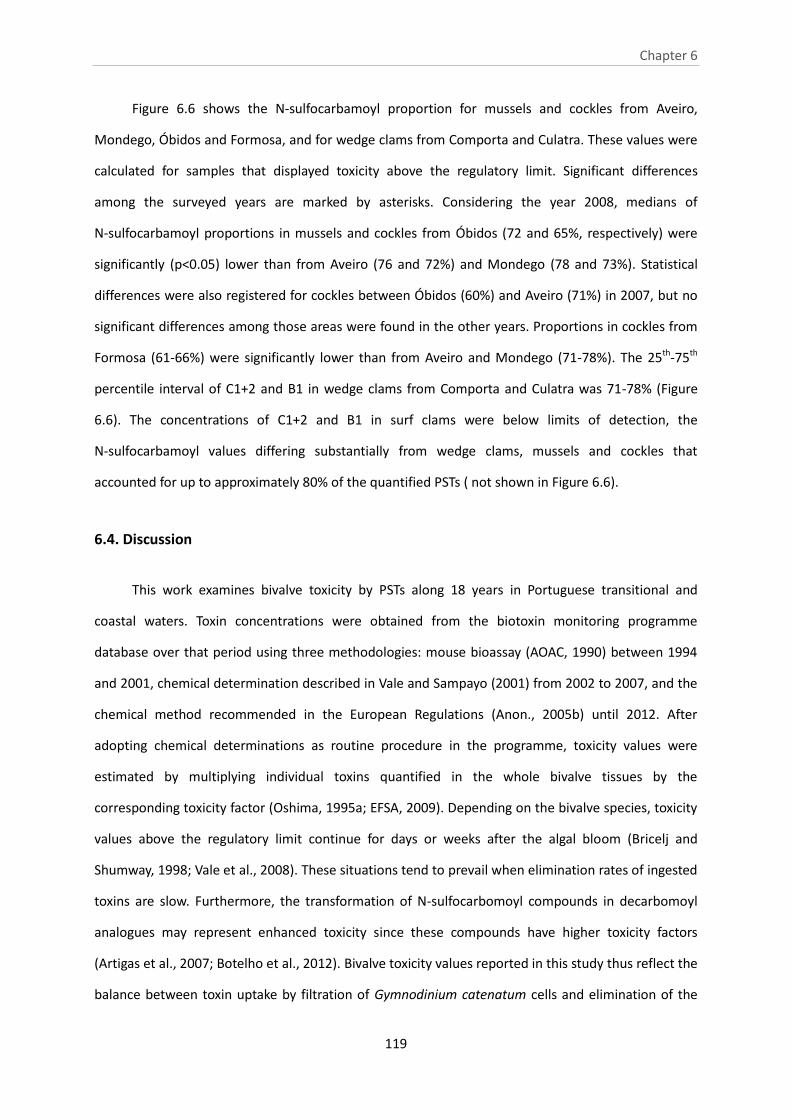
Chapter 6
119
Figure 6.6 shows the N-sulfocarbamoyl proportion for mussels and cockles from Aveiro,
Mondego, Óbidos and Formosa, and for wedge clams from Comporta and Culatra. These values were
calculated for samples that displayed toxicity above the regulatory limit. Significant differences
among the surveyed years are marked by asterisks. Considering the year 2008, medians of
N-sulfocarbamoyl proportions in mussels and cockles from Óbidos (72 and 65%, respectively) were
significantly (p<0.05) lower than from Aveiro (76 and 72%) and Mondego (78 and 73%). Statistical
differences were also registered for cockles between Óbidos (60%) and Aveiro (71%) in 2007, but no
significant differences among those areas were found in the other years. Proportions in cockles from
Formosa (61-66%) were significantly lower than from Aveiro and Mondego (71-78%). The 25th-75th
percentile interval of C1+2 and B1 in wedge clams from Comporta and Culatra was 71-78% (Figure
6.6). The concentrations of C1+2 and B1 in surf clams were below limits of detection, the
N-sulfocarbamoyl values differing substantially from wedge clams, mussels and cockles that
accounted for up to approximately 80% of the quantified PSTs ( not shown in Figure 6.6).
6.4. Discussion
This work examines bivalve toxicity by PSTs along 18 years in Portuguese transitional and
coastal waters. Toxin concentrations were obtained from the biotoxin monitoring programme
database over that period using three methodologies: mouse bioassay (AOAC, 1990) between 1994
and 2001, chemical determination described in Vale and Sampayo (2001) from 2002 to 2007, and the
chemical method recommended in the European Regulations (Anon., 2005b) until 2012. After
adopting chemical determinations as routine procedure in the programme, toxicity values were
estimated by multiplying individual toxins quantified in the whole bivalve tissues by the
corresponding toxicity factor (Oshima, 1995a; EFSA, 2009). Depending on the bivalve species, toxicity
values above the regulatory limit continue for days or weeks after the algal bloom (Bricelj and
Shumway, 1998; Vale et al., 2008). These situations tend to prevail when elimination rates of ingested
toxins are slow. Furthermore, the transformation of N-sulfocarbomoyl compounds in decarbomoyl
analogues may represent enhanced toxicity since these compounds have higher toxicity factors
(Artigas et al., 2007; Botelho et al., 2012). Bivalve toxicity values reported in this study thus reflect the
balance between toxin uptake by filtration of Gymnodinium catenatum cells and elimination of the

Chapter 6
120
ingested toxins or metabolic inter-conversion of toxins (Shimizu and Yoshioka, 1981; Oshima, 1995b;
Bricelj and Shumway, 1998).
Figure 6.6. Median, 25th
and 75th
percentile, minimum and maximum molar proportions of (C1+2)+B1 to the
total quantified PSTs (%), between 2007 and 2011; proportions calculated to elevated toxicity samples; mussels
and cockles from Aveiro, Mondego, Óbidos; cockles from Formosa; wedge clams from Comporta and Culatra; n
varied from 3 (wedge clams, Culatra, 2009) to 23 (mussels, Aveiro, 2008); * p<0.05.
6.4.1. Uptake and biotransformation/elimination of toxins
The PST episodes were more recurrent in the west coast of Portugal, where blooms of G.
catenatum have been reported (Moita et al., 1998, 2003; Vale et al., 2008). The elevated proportion
of C1+2 plus B1 in mussels, cockles and wedge clams is in line with the predominance of these toxins
in G. catenatum cells isolated from blooms occurring on the Portuguese coast (Sousa et al., 1995;
Negri et al., 2001; Botelho et al., 2012). The toxin profiles therefore point to the high influence of the
uptake phase when abundant G. catenatum cells are present in coastal and estuarine waters.
The most favourable conditions to trigger G. catenatum blooms in coastal waters have been
described in various works for the geographic regions where blooms of this species have been
Mussel
2007 2008 2009 2010 2011
Year
40
50
60
70
80
90
[(C1
+2
)+(B
1)]x
10
0/to
tal P
ST
s
Aveiro
Mondego
Óbidos
Cockle
2007 2008 2009 2010 2011
Year
40
50
60
70
80
90
Aveiro
Mondego
Óbidos
Formosa
Donax clam
2007 2008 2009
Year
40
50
60
70
80
90
[(C1
+2
)+(B
1)]x
10
0/to
tal P
ST
s
Comporta
Culatra
Wedge clam
*
*
*
*

Chapter 6
121
reported (Fraga et al., 1988; Hallegraeff et al., 1995; Band-Schmidt el al., 2010; Bravo et al., 2010).
The review by Hallegraeff et al. (2012) points to the existence of two possible mechanisms for the
bloom dynamics of G. catenatum: autochthonous bloom formation by local cyst beds, as occurs in
Tasmanian estuaries; and allochthonous bloom build-up during upwelling relaxation, as reported in
Iberian coast and Spanish Rias. In the western coast of Portugal, the record of G. catenatum blooms
have been associated with conditions under relaxation of coastal upwelling and slow currents or
eddies where this species is retained (Moita et al., 2003; Pitcher et al., 2010). The coastal
oceanography of the west Iberian Peninsula is characterised by seasonal wind-driven coastal
upwelling, which can be considered to be a northern extension of the NW Africa upwelling system
(Wooster et al., 1976). A strong high pressure system over the North Atlantic in summer causes
alongshore northerly winds off Portugal and Galicia, which force upwelling events from April through
September (Hallegraeff et al., 2012).
Toxicity episodes registered in surf clams from Aguda (NW coast) resulted from exposure to G.
catenatum blooms, although C1+2 and B1 concentrations, which are dominant in the algal cells, were
below the limit of detection in surf clams. The explanation for those low concentrations was given by
experiments in vitro that showed the transformation of C1+2 and B1 into their decarbamoyl
analogues in a few hours (Artigas et al., 2007). Toxicity of surf clams expressed thus mainly the
toxicity of decarbamoyl toxins, either present at low proportion in the ingested cells of G. catenatum
and mainly resulted from inter-conversion after uptake. Surf clam from the south-eastern coast
(Culatra) exhibited shorter and less frequent toxicity episodes than the western areas, which is in line
with the weak influence of upwelling, caused by occasional westerly winds (Fiúza, 1983).
6.4.2. Import of G. catenatum cells to estuaries
Toxin concentrations in mussels and cockles from Aveiro, Mondego and Óbidos (Figure 6.1)
seem to be mainly affected by the coastal algal blooms. Most likely, the toxic cells generated offshore
that are displaced towards the coast tend to be tidally advected into those estuarine systems (Fraga
et al., 1988). The import of toxic cells and their maintenance or development under high salinity
conditions is facilitated by the elevated tidal influence (mesotidal systems) and low freshwater inputs
(Bettencourt et al., 2004). Consequently, wild mussels from the inlet channel and cockles from inner
areas are quickly exposed to the toxin-producing species imported from adjacent coastal waters. The

Chapter 6
122
possibility of organic nutrients available in estuarine environments promoting the increase of toxic
cells should not be excluded, since G. catenatum exhibits the capacity to utilize organic forms of
nutrients (Doblin et al., 1999; Oh et al., 2002; Yamamoto et al., 2004). This hypothesis has been
considered for Óbidos lagoon to explain the longer duration of mussel toxicity episodes with respect
to the adjacent coastal waters (Pereira et al., 2011). Despite the high water volume exchanged daily
between Formosa and the adjacent sea (Falcão and Vale, 2003), the toxicity episodes in this lagoon
were rarer, in line with the sporadic G. catenatum blooms in the adjacent coastal zone.
The toxicity episodes in the three western estuarine systems were documented through toxin
composition of the mussel Mytilus spp. or the cockle Cerastoderma edule. By using the same bivalve
species, biological factors such as filtration rate and metabolism associated with elimination and
biotransformation of the assimilated toxins are likely to have a minor influence on the assessment of
toxicity episode duration. The longer episodes registered for mussels in comparison to cockles are in
line with the previous review of toxicity episodes in Aveiro and Óbidos (Vale et al., 2008). Those
differences may be related to feeding rates of bivalve species (Bricelj and Shumway, 1998; Ward et al.,
2013). The duration of toxicity episodes varied among the surveyed estuarine systems, which most
probably reflects the quantity of toxic cells in each zone. The availability of those cells may be
influenced by water circulation and residence time inside the systems. Shorter toxicity periods
registered in the Mondego (tubular estuary) in comparison to Aveiro and Óbidos (coastal lagoons) are
probably related to those morphological characteristics. Import of toxic cells from the adjacent sea
between October and January tends to be slow in the Mondego, due to the increase of river
discharges in this season. This effect is of less impact in Óbidos and Aveiro since these systems are
broader and receiving lower freshwater inputs (Bettencourt et al., 2004).
6.4.3. Unpredictability of bivalve toxicity episodes on decadal scale
A salient aspect of this study is the prolonged period (1996-2004) of low bivalve toxicity by PSTs.
The reviews of Sampayo et al. (1997) and Vale et al. (2008) have already mentioned the low toxicity
for this period of time. The lack of toxicity episodes in estuarine systems cannot be attributed to poor
sampling representativeness, since high confidence levels were often observed during this period
(Figure 6.2). Toxin concentrations in the whole tissue of mussels, cockles, surf clams and wedge clams
were often undetected (bioassay) or below the limit of detection, suggesting that G. catenatum did

Chapter 6
123
not bloom or if cells flourished offshore they were not transported to the surveyed coastal areas
(Figueiras et al., 1994; Pitcher and Boyd, 1996). This observation is in line with previous works
pointing to massive G. catenatum blooms off the western Portuguese coast in 1976, 1985, 1994 and
1995, contrasting to lack of blooms for the years in between (Estrada et al., 1995; Moita et al., 2003;
Amorim et al., 2004). In the southern coastal waters, G. catenatum cells were not observed in 2006
and 2007, but abundances increased occasionally in 2008 (Brito et al., 2012). Those studies on algal
dynamics suggest the interruption of G. catenatum blooms on an inter-annual scale. The bivalve
toxicity data between 1994 and 2012 is in line with that irregular occurrence.
The prolonged episodes of toxicity during 2007/2008 in Aveiro, Mondego, Óbidos (estuarine
systems) and Comporta (coastal areas) are also of interest. Because the toxicity was concomitantly
registered in the three estuarine systems along 160 km of coastline, it is tempting to admit that those
episodes resulted from the import of toxic cells from the coastal area. The sedimentary record of G.
catenatum cysts in the Iberian coast is consistent with the evidence of non-periodic low-density
blooms (Amorim and Dale, 2006; Smayda and Trainer, 2010). Inter-annual variation of G. catenatum
blooms have also been reported in other coastal systems such as Galicia, Spain (Estrada, 1995) and
Mexico (Mee et al., 1986; Cortés Altamirano et al., 1996). Explanation for this puzzling inter-annual
variation has not been provided so far. Mismatches between observed and expected in situ bloom
behaviour of G. catenatum suggest that unrecognized upwelling systems factors that fall within the
physical-chemical-biological domain are more important than life cycle strategies (Bravo et al., 2010;
Smayda and Trainer, 2010).
6.4.4. Seasonality of toxicity episodes
The toxicity episodes in the western coast of Portugal were frequently manifested during
autumn and early winter (Figure 6.4). The signal of these episodes remained for three to four weeks
per month in autumn 2007 and winter 2008. Moreover, mussel and cockle toxicities exceeded the
regulatory limit in June-July of 2008, providing an additional signal of toxicity. Along the 18 years of
survey, the summer toxicity episodes were much less regular than in the autumn. The seasonal
occurrence is related to G. catenatum blooms generated in the Iberian coast (Estrada et al., 1995;
Sousa et al., 1995; Vale et al., 2008), triggered by upwelling events from April through September.
Commonly G. catenatum blooms have been observed by the end of summer when

Chapter 6
124
upwelling-favourable winds relax (Fraga, 1996; Hallegraeff et al., 2012). Lack of regularity in the
appearance of the toxicity episodes has been observed in other geographical regions. For example,
most blooms in Mexico were reported in March-April, but occasionally in other periods of the year
(Band-Schimidt et al., 2010). The analysis of the PST data in Portugal indicates that the autumn signal
may occasionally appear in summer.
6.4.5. Connectivity of PST episodes
Toxin profiles in bivalves exposed to blooms of G. catenatum may vary with the time, as
differential elimination of individual compounds occurs or assimilated toxins are inter-converted
(Samsur et al., 2007; Botelho et al., 2012). This work examined only the toxin profile in periods of
elevated toxicity. Mussels and cockles from Aveiro, Mondego and Óbidos showed toxin profiles
dominated by N-sulfocarbamoyl toxins, and therefore toxicity values approximately express the
individual toxins ingested with the toxic cells. In contrast, surf clams showed profiles dominated by
decarbamoyl toxins resulted from biotransformation of N-sulfocarbamoyl toxins associated with the
ingested cells of G. catenatum (Artigas et al., 2007). Consequently, toxicity values of surf clams are
based on the concentration and toxicity factors of the transformed toxins. Despite bivalve specificity,
possible interconnection of toxicity episodes among the surveyed areas were searched through the
connectivity index (CI) defined in the section 6.2.2. The interconnections were searched for the
periods 1994-1995 and 2005-2009 for the following possibilities (Figure 6.7): Aveiro-Mondego-Óbidos
(using both mussel and cockle), Aguda-Aveiro (surf clam versus mussel) and Culatra-Formosa (wedge
clam versus cockle).
The scores of CI for Aveiro-Mondego-Óbidos (mussel) reached 3 to 4 in December 1994 and
between October 2007 and August 2008, while mean values in the remaining years were below 1.
The short distance between Aveiro-Mondego and Mondego-Óbidos (approximately 85 km) facilitates
the quasi-simultaneous occurrence of toxicity episodes among these systems. The connectivity was
evident in 2007-2008, when elevated toxicity persisted for a long period. These results reinforce the
hypothesis of the import of G. catenatum cells from coastal areas to nearby estuarine systems.
Mussels from inlet channels showed higher CI than cockles from the inner branches, which may be
related to the proximity of sampling location to the sea, or to elevated feeding rate of mussels (Bricelj
and Shumway, 1998). Possible effects of nutrient composition on cell proliferation in each system

Chapter 6
125
were not evident from the connectivity index. However, the N-sulfocarbamoyl proportions calculated
for mussels from Óbidos showed broader ranges than from Aveiro and Mondego. Furthermore,
cockles from Óbidos and Formosa showed lower median values than from those two estuarine
systems. The hypothesis of higher interconversion of assimilated toxins by C. edule in Óbidos and
Formosa than in Mondego and Aveiro is less plausible, since the same was observed for C. edule from
the same biogeographical area. Differences attributed to sampling are also unlikely, since confidence
levels in those estuarine systems were 3 to 4 (Figure 6.5). The possibility of the toxin profile of G.
catenatum differing among these systems, in response to specific environmental conditions such as
different nutrient composition, should therefore not be excluded. In fact, laboratory studies showed
that nitrogen and phosphorus availability and molar ratio may change PSTs profile in A. fundyense,
and G. catenatum strains showed modifications of PSTs molar ratios growing under different culture
media (Poulton et al., 2005; Band-Schmidt et al., 2005). Elevated concentrations of organic forms of
nitrogen in Óbidos (Pereira et al., 2011) and Formosa (Falcão and Vale, 2003) allow hypothesising the
production of different toxins by G. catenatum in these coastal lagoons.
Scores of CI for Aguda-Aveiro (surf clam versus mussel) reached 3-4 in November 1994,
December 2005, January 2006, November 2007 and October 2009. By contrast, mean values were
below 1 in other years. These elevated scores are based on the comparison between toxicity of
N-sulfocarbamoyl toxins in mussels and toxicity of decarbamoyl analogues. Toxicity episodes in
Culatra-Formosa (wedge clam versus cockle) were scarce, CI being 3-4 only in September, October
and November 1995, and August 2009. Scores were also calculated on the basis of slightly different
toxin profiles (Figure 6.6). Lower values of the N-sulfocarbamoyl ratio means smaller contribution of
C1+2 and B1 to the toxin composition, which may be interpreted as toxin profile of wedge clam
during toxicity episodes having a higher influence of transformation or elimination.

Chapter 6
126
Figure 6.7. Connectivity Index (CI) for Aveiro-Mondego-Óbidos (mussel and cockle), Aguda-Aveiro (surf clam
versus mussel) and Culatra-Formosa (cockle versus wedge clam), for the periods 1994-1995 and 2005-2009; CI
scored from 0 to 4 based on the number of weeks per month with toxicity values above regulatory limit.
6.5. Conclusions
The analysis of toxicity by PSTs in bivalves from transitional and coastal waters of Portugal over
18 years pointed to an irregular multi-annual variation of toxic episodes. The elevated toxicity values
displayed a seasonal signal with a peak in autumn/winter and occasionally in summer. The episodes
of mussel and cockle toxicities were connected in three estuarine systems of the western coast,
reflecting the occurrence and spatial distribution of G. catenatum blooms in the adjacent coastal
waters. Connectivity was also found between cockles from the estuarine systems and wedge clams
from the adjacent south coast, despite the different toxin profiles resulting from differential
biotransformation or elimination of ingested toxins.
Acknowledgements
We are grateful to our colleagues P. Vale, S.M. Rodrigues and P.R. Costa from the Laboratory of
Marine Biotoxins, IPMA.
0
1
2
3
4
O N D J F O N D J J J O N J F J J A S O
CI
(0-4
)
Month
Aveiro-Mondego-Óbidos (M)
1994-95 2005-06 2007-08 2009
0
1
2
3
4
O N D O O N D J S O N J F J J A S O
CI
(0-4
)
Month
Aveiro-Mondego-Óbidos (C)
1994 2005-06 2007-08 20091995
0
1
2
3
4
O N D J N D J O N J F J J A S O
CI
(0-4
)
Month
Aguda-Aveiro (WhC-M)
1994-95 2005-06 2007-08 2009
0
1
2
3
4
S O S O N A A
CI
(0-4
)
Month
Culatra-Formosa (WeC-C)
1994 1995 2008 2009
Aguda-Aveiro (SC-M)

Chapter 7
127
7. Profiles of paralytic shellfish toxins in bivalves of low and
elevated toxicities following exposure to Gymnodinium catenatum
blooms in Portuguese estuarine and coastal waters
Highlights
PST profiles in four bivalve species from Portuguese waters were examined.
Toxin profiles varied between low and elevated bivalve toxicities in the period
2007-2012.
Molar ratios R1=(C1+2):B1 were higher in elevated than in low cockle toxicities.
R2=[(dcSTX)+(dcGTX2+3)]:[(C1+2)+(B1)] were higher in low wedge clam toxicities
than in mussels and cockles.
Changes in R2 are presumably due to biotransformation after exposure to
bloom.
Botelho, M.J., Vale, C., Ferreira, J.G. (submitted). Profiles of paralytic shellfish
toxins in bivalves of low and elevated toxicities following exposure to Gymnodinium
catenatum blooms in Portuguese estuarine and coastal waters. Chemosphere.
7

Chapter 7
128
Abstract
Profiles of paralytic shellfish toxins (PSTs) were examined in 405 composite
samples of Mytilus spp., Cerastoderma edule, Donax trunculus and Spisula solida
collected between 2007 and 2012 from natural production areas in two estuaries (Aveiro
and Mondego), two coastal lagoons (Óbidos and Formosa), and three open coastal areas
(Aguda, Comporta and Culatra). Toxin concentrations were obtained from the biotoxin
monitoring programme database. Episodes of PST toxicity in Portugal have been
associated with Gymnodinium catenatum blooms. Toxin profiles for each species showed
no trend over the surveyed years. In general, profiles differ only slightly among areas,
except for Óbidos. However, toxin profiles in bivalves varied between low and elevated
toxicities, corresponding to below and above the PST regulatory limit, respectively. The
ratio R1=(C1+2):B1, which were the main toxins produced by G. catenatum cells,
decreased considerably between elevated and low toxicity cockles, indicating the
elimination of C1+2 or conversion of compounds into B1.
R2=[(dcSTX)+(dcGTX2+3)]:[(C1+2)+(B1)], which represents the ratio of minor to major
toxins in G. catenatum cells, increased substantially in wedge clams (Donax trunculus) of
low toxicity and less markedly in cockles (Cerastoderma edule) and mussels (Mytilus
spp.). These differences are interpreted as the predominance of a biotransformation
phase after exposure to the algal bloom. The toxin profile of surf clams (Spisula solida)
was dominated by decarbamoyl compounds, reflecting intense biotransformation during
exposure to blooms. The ratio R2 in low toxicity samples suggest that elimination of the
produced decarbamoyl toxins is slower than biotransformation.
Keywords: Paralytic shellfish poisoning; Gymnodinium catenatum; Bivalves; Toxin
profiles; Biotransformation

Chapter 7
129
7.1. Introduction
Paralytic shellfish toxins (PSTs) comprise a suite of more than 30 natural
tetrahydropurine derivatives produced in the marine environment by toxic
phytoplankton such as Gymnodinium catenatum, Alexandrium spp. and Pyrodinium
bahamense (Wise et al., 2010). During blooms of these species, bivalve filter feeders
such as mussels, cockles, and clams ingest toxic cells and tend to exhibit transient high
toxin concentrations. PSTs are of great concern as they are potent neurotoxins that block
the voltage-gated sodium channels in excitable cells, suppressing ion permeation (Kao,
1966). This action has long been documented as a potential cause of serious illness in
consumers of contaminated bivalves (Sommer and Meyers, 1937). The better-known
toxins are included in the following groups in decreasing order of toxicity: carbamate
(saxitoxin-STX, neosaxitoxin-NEO and gonyautoxins-GTX1 to GTX4), decarbamoyl
(dcGTX1 to dcGTX4, dcSTX and dcNEO) and N-sulforcarbamoyl (B1, B2, C1 to C4)
(Oshima, 1995a; EFSA, 2009). Other compounds with substituent side chains such as
hydroxyl, hydroxybenzoate, or acetate have been identified and structurally described
(Wise et al., 2010).
Studies of PSTs in dinoflagellate cells collected in different regions of the world
have pointed to strain-specific profiles (Oshima et al., 1993; Franco et al., 1994; Krock et
al., 2007). However, stresses such as alterations in physico-chemical properties and
physiology may change toxin profiles of dinoflagellate cells (Etheridge and Roesler, 2005;
Poulton et al., 2005; Band-Schmidt et al., 2010). When bivalves ingest toxic algae the
accumulated toxins are selectively metabolized and eliminated. The toxin profile in each
bivalve species thus varies with time and differs progressively from the algae from which
the toxins orginate (Oshima et al., 1990; Samsur et al., 2006). For example, mussels and
oysters mirror the toxin composition of the causative plankton cells better than clams,
which exhibit different proportions of ingested toxins (Bricelj and Shumway, 1998).
Specific toxic profiles of bivalves results mainly from different uptake,
elimination/retention or epimerization mechanisms (Cembella and Shumway, 1995; Yu

Chapter 7
130
et al., 2007; Botelho et al., 2010a). In addition, the occurrence of hydrolysis, chemical
and/or enzymatic transformation pathways (Shimizu and Yoshioka, 1981; Oshima,
1995a), as well as bacterial degradation processes (Donovan et al., 2009) may also
induce specific PST profiles.
Although toxin concentrations are routinely measured in bivalves of toxicity below
the PST regulatory limit in national monitoring programmes, comparison of toxin profiles
for different toxicity values are scarce. Turner et al. (2014) reported the variability of
occurrence of PSTs in bivalves from the United Kingdom and found no correlation
between profiles and total PST content of shellfish. The present work compares PST
profiles in bivalve molluscs from Portugal of toxicity below and above the PST regulatory
limit caused by G. catenatum blooms. Differences were tested for 405 composite
samples of Mytilus spp., Cerastoderma edule, Donax trunculus and Spisula solida from
seven harvesting areas between 2007 and 2012.
7.2. Material and Methods
7.2.1. Bivalve toxicity database
Values of bivalve toxicity by PSTs used in the present study were obtained from
the database of the Portuguese biotoxin monitoring programme (BMP). Between 2007
and 2012, toxicity values were obtained through chemical determinations, although two
analytical methodologies were used sequentially in this period of time: from 2007 to
2008, PST concentrations were determined using a LC method with pre-column
oxidation based on Lawrence et al. (1995) modified by Vale and Sampayo (2001); from
2009 to 2012, the toxins C1+2, B1, dcSTX, dcGTX2+3, GTX2+3 and STX were quantified
using the official AOAC pre-column oxidation method by liquid chromatography with
fluorescent detection (LC-FLD) (Anon., 2005b). In the first method, the concentrations of
the so-called dcSTX, dcGTX2+3, GTX2+3 and STX were determined through the areas of
chromatographic peaks that eventually included unresolved peaks, corresponding to
other toxins like NEO and GTX1+4. To prevent misunderstanding, concentrations of those

Chapter 7
131
toxins were designated by “dcSTX”, “dcGTX2+3”, “GTX2+3” and “STX”. Due to the use of
different methodologies, molar proportions of C1+2, B1, dcSTX, dcGTX2+3, GTX2+3 and
STX calculated in the period 2009-2012 (method A - AOAC, 2005) cannot be compared to
values of 2007-2008 (method B - Vale and Sampayo, 2001).
Bivalve toxicity values were estimated in terms of µg STX di-HCl equivalents per kg,
multiplying the toxin concentration by the toxicity equivalence factor (TEF) of each
individual compound. After June 2010, toxicity values were estimated following the
recommendations of the EU Reference Laboratory for Marine Biotoxins. This results in
the duplication of the TEF used to dcSTX, from 0.5 (Oshima, 1995b) to 1 (EFSA, 2009).
For the purpose of data consistency in this study, all toxicity values originally determined
using Oshima TEF for dcSTX were re-calculated using EFSA. In the case of isomeric pairs
as GTX2+3 and C1+2, the highest TEF was used for each pair. The regulatory limit (RL) for
PSTs is 800 µg STX di-HCl equivalents per kg (Anon., 2004). Bivalve toxicity values were
only reported in the BMP database if above 55 µg STX di-HCl equivalents per kg. This
value was obtained from validation work. A detailed description of the BMP, location of
the natural production areas of bivalves in Portugal, analytical methodologies used, and
toxicity calculation are described in Vale and Sampayo (2001), Vale et al. (2008), and
Botelho et al. (2010b).
7.2.2. Selection of bivalve species and harvesting areas
Four bivalve species were used in this study, taking into account their geographic
distribution, abundance and commercial value. The mussel Mytilus spp. and cockle
Cerastoderma edule were considered due to their abundance in the areas of Aveiro,
Mondego and Óbidos. Cockles were also collected in the Formosa lagoon. Mussels were
sampled in hard substrates of the inlet channels, and cockles in sandy areas of inner
zones. The wedge clam Donax trunculus and the surf clam Spisula solida were chosen
because they are commercially harvested from natural production areas in the west
coast (Aguda and Comporta) and south coast (Culatra) (Figure 7.1). Habitats and ecology

Chapter 7
132
are described in Gaspar et al. (1999) and Joaquim et al. (2008).
Coordinates of the harvested areas have changed slightly during the multi-annual
surveyed period, as the abundance of bivalves varied with time (Rufino et al., 2008). The
three systems Aveiro, Mondego and Óbidos are located in the central west coast, and
Formosa in the southeastern area. In addition, there are morphological and hydrological
differences among these systems. Whereas the Mondego is a tubular estuary, Aveiro,
Óbidos and Formosa have broad inner areas and narrow connections to the sea, are
generally classified as lagoons (Bettencourt et al., 2004). The western systems (Aveiro,
Mondego and Óbidos) are characterised by recurrent episodes of bivalve toxicity by PST
(Vale et al., 2008). The Formosa coastal lagoon was selected due to the large quantities
of bivalves grown in the tidal flats (Ferreira et al., 2014).
Figure 7.1. Harvesting areas of mollusc bivalves: Aveiro,
Mondego, Óbidos, and Formosa (estuarine systems), and
Aguda, Comporta and Culatra (open coastal areas).
7.2.3. Number of samples and bivalve toxicity values
Table 7.1 gives the number of samples of surf clams, wedge clams, cockles and
mussels used in this work. This study is based on toxin concentrations of 405 composite

Chapter 7
133
samples of bivalves (each one a pool of 30 specimens) obtained between 2007 and 2012
in seven harvest areas. The number of annual samples with toxicity below and above the
PST regulatory limit, as well as the corresponding harvest area, are presented. Samples
below the regulatory limit showed a total toxicity between 55 and 800 µg STX di-HCl
equivalents per kg, while samples above this limit presented a broad variation of toxicity
values for the various blooms and areas surveyed. Table 7.2 shows the median,
minimum and maximum of PST toxicity ratios (total toxicity value/regulatory limit for
PSTs) of surf clams, wedge clams, cockles and mussels collected between 2007 and 2012
in the corresponding harvest areas.
Table 7.1. Annual number of samples, between 2007 and 2012, with toxicity values below and
above the regulatory limit for PSTs; surf clam (Aguda-AG, Comporta-CO and Culatra-CU), wedge
clam (Comporta-CO and Culatra-CU), cockle (Aveiro-AV, Mondego-MO, Óbidos-OB and
Formosa-FO) and mussel (Aveiro-AV, Mondego-MO and Óbidos-OB); 2007-2008 - method B;
2009-2012 - method A.
Annual number of samples
Toxicity below RL
Species Surf clam Wedge clam Cockle Mussel
Area AG CO CU CO CU AV MO OB FO AV MO OB
2007 3 3 7 - - 4 - - - 3 3 4
2008 - - - 9 3 20 - - - 18 6 -
2009 - - - - - - - - 8 8 14 -
2010 - - - - - 62 3 - 3 21 3 -
2011 - - - - - - - - - 7 - -
2012 - - - - 3 - - - - - - -
Toxicity above RL
Species Surf clam Wedge clam Cockle Mussel
Area AG CO CU CO CU AV MO OB FO AV MO OB
2007 3 - - 7 - 13 4 9 - 13 7 8
2008 - 7 - 9 - 7 8 19 - 17 13 14
2009 3 - 3 - 3 - - - 6 7 4 -
2012 - - 3 - 3 - - - - - - -

Chapter 7
134
7.2.4. Sampling of seston and determination of PSTs
In addition to bivalve toxicity data, samples of the toxin-producing algae were
collected to assess the toxin profile in the cells ingested by bivalves. Between 5 to 10
litres of surface water samples were collected during a bloom of Gymnodium catenatum,
from 23th June to 21th July 2008, in coastal waters adjacent to Óbidos (9 samples). Water
samples for phytoplankton species identification were preserved in Lugol’s iodine and
the cells of G. catenatum identified under an inverted microscope after sedimentation.
Water samples for toxin analysis passed through a GF/C glass filters (porosity 1.2 µm,
150 mm Φ), under light vacuum pressure (100 mmHg), and the material retained in the
filters were frozen in 0.1 M acetic acid at -80oC until analysis.
Toxins were extracted from the seston retained on filters by freeze/thaw cycle,
followed by probe sonification in an ice bath for 30 s at 60% amplitude and 20 W (Vibra
Cell, Sonics & Materials Inc.) (Botelho et al., 2012). Cell debris after probe sonification
was examined under an inverted microscope and revealed full disruption of algal cells in
selected samples. The pH of the extracts was adjusted to 6.5 with 0.2 M NaOH. The
extracts were filtered (0.2 µm) and diluted to exactly 1 mL.

Chapter 7
135
Table 7.2. Median and the interval of minimum and maximum of PST toxicity ratios (total toxicity
value/regulatory limit) between 2007 and 2012; surf clam (Aguda-AG, Comporta-CO and Culatra-CU),
wedge clam (Comporta-CO and Culatra-CU), cockle (Aveiro-AV, Mondego-MO, Óbidos-OB and Formosa-FO)
and mussel (Aveiro-AV, Mondego-MO and Óbidos-OB); 2007-2008 - method B; 2009-2012 - method A.
Species
Area
Median toxicity ratio
(minimum-maximum)
2007 2008 2009 2012
Surf clam AG
1.7
(1.4-2.0) -
2.0
(1.1-6.7) -
CO - 6.0
(3.4-13) - -
CU - -- 3.1
(2.4-3.3)
2.3
(1.9-3.5)
Wedge clam CO
23
(2.5-42)
7.0
(2.1-17) - -
CU - - 2.9
(1.7-3.3)
3.6
(2.2-5.1)
Cockle AV
9
(2.7-20)
3.9
(1.8-12) - -
MO 22
(1.4-32)
3.4
(1.9-18) - -
OB 8.9
(2.2-118)
2.8
(1.0-52) - -
FO - - 1.9
(1.3-9.0) -
Mussel AV
23
(1.5-32)
5.0
(1.1-39)
11
(4.3-20) -
MO 11
(2.5-52)
5.0
(1.8-28)
1.5
(1.2-3.0) -
ÓB 40
(4.1-114)
33
(1.7-83) - -

Chapter 7
136
The determination of PSTs was based on the AOAC pre-column oxidation method
by LC-FLD (Anon., 2005b; Botelho et al., 2010b). Aliquots of seston extracts were used
for oxidation of PSTs with peroxide and periodate oxidant prior to LC-FLD analyses. A
similar procedure for both oxidations was followed, substituting the oxidant reagent by
water in order to detect naturally fluorescent compounds. The quality control of the
results was assured through the use of the certified reference materials C1&2, STX-e,
dcSTX ,GTX5-b (B1), dcGTX2&3, dcNEO-b, GTX1&4-b, GTX2&3-b and NEO-b, from the
Institute for Marine Biosciences, National Research Council Canada. Evaluation of linear
ranges for PSTs and instrumental limits of detection are described in Botelho et al.
(2010a). Instrumental detection limits (nmol L-1) were 3.9 (C1+2), 4.0 (B1), 4.0 (STX), 4.9
(dcSTX), 8.2 (dcGTX2+3), 8.5 (GTX2+3), 25 (dcNEO), 30 (GTX1+4) and 31 (NEO). The LC
system consisted of a Hewlett-Packard/Agilent Model 1050 quaternary pump, Model
1100 in-line degasser, autosampler, column oven, and Model 1200 fluorescence detector.
The Hewlett-Packard Chemstation software performed data acquisition and peak
integration. The PST oxidation products were separated using a reversed-phase
Supelcosil LC-18, 150 x 4.6 mm id, 5 µm column (Supelco) equipped with a guard column
Supelguard Supelcosil C18, 20 x 4.0 mm id, 5 µm (Supelco). The column was kept in an
oven at 30oC. The mobile phase gradient used 2 mobile phases: A (0.1 M ammonium
formate, pH=6) and B (0.1 M ammonium formate in 5% acetonitrile, pH=6). The elution
gradient consisted of 0-5% B in the first 5 min, 5-70% B in the next 4 min and back to 0%
B in the next 5 min. Flow rate was 1 mL min-1 and the injection volumes were 50 µL and
100 µL, for the oxidation products of peroxide and periodate reaction, respectively. The
excitation and emission wavelengths for fluorimetric detection were set at 340 nm and
395 nm, respectively.
7.2.5. Statistical analyses
Prior to statistical analyses, toxin molar proportions were tested for normality and
equality of variances. The Mann-Whitney U test was used to evaluate the existing

Chapter 7
137
differences between toxin molar proportions in bivalves from selected areas. The
significant tests were performed using the STATISTICA 6.0 Statistical Software System.
7.3. Results
7.3.1. PST composition in bivalve species
Median, maximum, minimum, 75th and 25th percentiles of molar fractions of the
quantified paralytic shellfish toxins relatively to the total quantified toxins in samples of
surf clams, wedge clams, cockles and mussels that have toxicity values above the PST
regulatory limit are shown in Figure 7.2. The proportion of each toxin was calculated for
those bivalve species, encompassing data from different harvest areas (Table 7.1) for the
two periods of time: 2007-2008 (method B) and 2009-2012 (method A). The most
striking aspect is the negligible contributions of C1+2 and B1 (<0.7%) to the toxin profile
of surf clams. These contributions contrast to the median proportions of C1+2 and B1 in
wedge clams (10 and 63%), cockles (39 and 32%) and mussels (57 and 40%). The molar
fractions of dcGTX2+3 and dcSTX were significantly (p<0.05) higher in surf clams than in
the other bivalve species. The disparity between the two groups of compounds was
found in data obtained by both methods (A and B), although with different meanings
between dcGTX2+3, dcSTX and “dcGTX2+3”, “dcSTX” (Figures 7.2a and 7.2b). The
compounds GTX2+3 and STX had minor contributions to the toxin profiles of all species.
The proportion of C1+2 was significantly (p<0.05) lower in wedge clams than in cockles
and mussels, and the opposite was observed for B1.

Chapter 7
138
Figure 7.2. Median, maximum, minimum, 75th
and 25th
percentiles of molar fractions of
quantified PSTs (%) in samples of surf clam, wedge clam, cockle and mussel presenting toxicity
values above the PST regulatory limit; period of time: 2007 - 2012; methodologies used: (a) C1+2,
B1, dcSTX, dcGTX2+3, GTX2+3 and STX (method A), (b) C1+2, B1, "dcSTX", "dcGTX2+3", "GTX2+3"
and "STX" (method B).
7.3.2. Temporal and spatial variability of toxins
To assess whether variability of toxin proportions was influenced by blooms
(temporal variation between 2007 and 2012) or harvest areas (spatial variation),
significance tests were done for each species, considering two situations: bivalves from
the same area exposed to different blooms, and bivalves exposed to blooms occurring in
the same period at different areas.
The proportions of dcSTX and dcGTX2+3 in surf clams harvested in Culatra during
two G. catenatum blooms, August-October 2009 and August-November 2012, were not
significantly (p>0.05) different. Values of those toxins were also not statistically different
(p>0.05) between samples collected in Aguda and Culatra during August-October 2009.
Wedge clams from Comporta exposed to blooms in October-November 2007 and
July-August 2008 showed different (p<0.05) proportions of the major toxins, C1+2, B1
and "dcSTX". Comparison of different blooms in Culatra was not carried out due to the
low number of samples (Table 7.1). The proportions of all toxins quantified in cockles
and mussels from Aveiro, Mondego and Óbidos showed no significant (p>0.05)
differences between October-November 2007 and June-August 2008. Otherwise,
proportions of C1+2 and B1 in cockles from Óbidos differed significantly (p<0.05) from

Chapter 7
139
specimens from Aveiro and Mondego, both in 2007 and 2008 blooms. The proportions
of C1+2 and B1 in mussels from Óbidos in the 2007 bloom differed significantly (p<0.05)
from values found for Aveiro and Mondego.
7.3.3. PST composition in bivalves with different toxicity values
Figure 7.3 shows the median, maximum, minimum, 75th and 25th percentiles of the
molar fractions of the toxins quantified in two sets of samples of surf clams, wedge
clams, cockles and mussels that presented toxicity values above and below the PST
regulatory limit. Elevated toxicity values were registered in summer or autumn and
attributed to blooms of G. catenatum that reached the harvest areas (Moita et al., 2003).
Bivalves with low toxicity values were collected in late winter and spring.
The toxins dcGTX2+3 and dcSTX were the major ones in surf clam samples of
elevated and low toxicity. Furthermore, the molar proportions of each compound did
not differ significantly (p>0.05) between the two sets of samples. The other toxins
quantified, C1+2, B1, GTX2+3, and STX, remained as minor components, although
significantly (p<0.05) higher in surf clams of low toxicity. Toxin proportions in samples of
wedge clam analysed by method A showed considerable differences between low and
elevated toxicities (n=3 and 6, respectively). The comparison using a more representative
dataset (n=12 and 16 for the method B) pointed to no significant differences between
low and elevated toxicity, except for “dcSTX” and “GTX2+3”. Cockles of low toxicity
showed significantly (p<0.05) lower proportions of C1+2 than the elevated toxicity
samples. Proportions of B1 varied inversely with the bivalve toxicity values, which is
clearer defined considering method A. Significant (p<0.05) differences were also
obtained for dcGTX2+3. In mussels, significant (p<0.05) differences were found for C1+2,
dcSTX, GTX2+3 and STX (method A) and for C1+2, B1, "GTX2+3" and "STX" (method B).

Chapter 7
140
Figure 7.3. Median, maximum, minimum, 75th
and 25th
percentiles of molar fractions of
quantified PSTs (%) in two sets of samples of surf clam, wedge clam, cockle and mussel presenting
Donax clam
C1+2 B1 "dcSTX" "dcGTX2+3" "GTX2+3" "STX"
Toxin
0
20
40
60
80 above RL
below RL
a b
C1+2 B1 dcSTX dcGTX2+3 GTX2+3 STX
Toxin
White clam
0
20
40
60
80
100
Mo
lar
fracti
on
(%
)White clam
C1+2 B1 "dcSTX" "dcGTX2+3" "GTX2+3" "STX"
Toxin
0
20
40
60
80
100 above RL
below RL
Donax clam
C1+2 B1 dcSTX dcGTX2+3 GTX2+3 STX
Toxin
0
20
40
60
80
Mo
lar
fracti
on
(%
)Surf clam Surf clam
Wedge clam Wedge clam
Cockle
C1+2 B1 dcSTX dcGTX2+3 GTX2+3 STX
Toxin
0
20
40
60
80
Mo
lar
fracti
on
(%
)
Cockle
C1+2 B1 "dcSTX" "dcGTX2+3" "GTX2+3" "STX"
Toxin
0
20
40
60
80
100 above RL
below RL
Mussel
C1+2 B1 dcSTX dcGTX2+3 GTX2+3 STX
Toxin
0
20
40
60
80
Mo
lar fra
ctio
n (%
)
Mussel
C1+2 B1 "dcSTX" "dcGTX2+3" "GTX2+3" "STX"
Toxin
0
20
40
60
80 above RL
below RL
Cockle Cockle
MusselMussel

Chapter 7
141
toxicity values above and below the PST regulatory limit (RL) between 2007 and 2012; (a) C1+2,
B1, dcSTX, dcGTX2+3, GTX2+3 and STX (method A); (b) C1+2, B1, "dcSTX", "dcGTX2+3", "GTX2+3"
and "STX" (method B).
7.3.4. Toxin profile of PSTs in Gymnodinum catenatum
Between 28th June and 21st July 2008, the toxicity by PSTs of wild mussels from the
NW coast (inlet of the Óbidos lagoon, Figure 7.1) was between 23 and 83 times greater
than the corresponding regulatory limit (IPMA, database of the biotoxin monitoring
programme). During this extreme event of mussel toxicity, paralytic shellfish toxins were
quantified in cells of G. catenatum collected near the Óbidos lagoon inlet. Figure 7.4
shows the medians and the 75th and 25th percentiles of the molar proportions of the
toxins C1+2, B1, dcGTX2+3 and dcSTX. The toxin profile was dominated by
N-sulfocarbamoyl analogues, with the medians of the molar proportions of C1+2 (67%)
and B1 (23%) exceeding the values found for decarbamoyl analogues dcGTX2+3 (5%) and
dcSTX (4%) by one order of magnitude. The median ratio between toxins C1+2 and B1
was approximately 2.5.
Figure 7.4. Median, maximum, minimum, 75th
and 25th
percentiles of molar fractions of toxins C1+2, B1, dcSTX, and
dcGTX2+3 (%) quantified in seston samples (n=9) during a
bloom of G. catenatum in coastal waters adjacent to Óbidos
lagoon in 2008 (method A).
C1+2 B1 dcSTX dcGTX2+3
Toxin
0
20
40
60
80
100
Mo
lar
fra
cti
on
(%
)

Chapter 7
142
7.4. Discussion
The results of this study point to the differences in PST profiles among the species
Spisula solida, Donax trunculus, Cerastoderma edule, Mytilus spp. collected in periods of
elevated and low bivalve toxicity. Bivalve toxicity values are attributed to blooms of G.
catenatum that reached the harvest areas (Moita et al., 2003). Most likely, the observed
differences represent the variation of the balance between toxin uptake by filtration of
the toxic cells, elimination of the ingested toxins, and metabolic inter-conversion of
toxins (Shimizu and Yoshioka, 1981; Kotaki et al., 1985; Oshima, 1995b; Bricelj and
Shumway, 1998). Since bivalves of low toxicity were collected a few months after the last
G. catenatum bloom, toxin profiles in those specimens were probably dominated by
elimination or biotransformation processes of the ingested cells during the prior bloom.
Residual cells in the water column during winter and spring may also be filtered by the
bivalve.
7.4.1. Toxin profiles of G. catenatum cells from the NW coast
The profile of PSTs in G. catenatum cells from the NW coast of Portugal collected
during the bloom of 2008 agrees with the profile found for this species by Costa et al.
(2010) in 2007. Moreover, N-sulfocarbamoyl and decarbamoyl compounds are the
dominant toxins in cultivated cells isolated from Iberian strains of G. catenatum (Sousa
et al., 1995; Ordás et al., 2004; Botelho et al., 2012). Different profiles have been
reported for G. catenatum cells isolated from other areas in the world, such as Mexico,
Australia, Singapore and Japan (Negri et al., 2001). The results of the current study
reinforce the observations that G. catenatum cells in the Iberian coast are characterised
by the high production of N-sulfocarbamoyl and decarbamoyl compounds. However, the
possibility of slight variations in toxin composition should be considered. To search
differences on profiles of G. catenatum cells from the NW coast, two ratios have been
calculated: R1=(C1+2):B1, representing the proportion between the major toxins, and
R2=[(dcSTX)+(dcGTX2+3)]:[(C1+2)+(B1)], the proportion between minor and major toxins.

Chapter 7
143
These ratios were calculated for the current data (2008) and for the 2007 results (Costa
et al., 2010). Values of R1 and R2 differed slightly in 2008 and 2007: 3.0, 3.9 and 0.10,
0.36 respectively. These differences may be related to the physico-chemical conditions
associated with the algal bloom. Although G. catenatum blooms are triggered under
similar oceanographic conditions in the NW coast of Portugal (Moita et al., 2008; Pitcher
et al., 2010), different nutrient availability may exist, which could explain the
modifications registered in the toxin ratios R1 and R2. Nutrient concentrations or
composition have been shown that can modify the toxin profiles of cultivated G.
catenatum cells (Band-Schmidt et al., 2010). Alterations in toxin ratios may also be
explained by the different development stages of blooms due to changes in cell size,
chain length and toxin leakage (Granéli and Flynn, 2006).
7.4.2. Alteration of major ingested PSTs by bivalves
The ratios R1 and R2 were also calculated for the bivalve species under two
environmental conditions: (i) bivalves exposed to G. catenatum blooms in summer or
autumn showing toxicity values above the PST regulatory limit, and (ii) bivalves under
low abundance of toxic cells in winter/spring, and consequently presenting toxicity
values far below the regulatory limit (Figure 7.5).

Chapter 7
144
Figure 7.5. Median, maximum, minimum, 75th
and 25th
percentiles of the molar ratios R1=(C1+2):B1 and
R2=[(dcSTX)+(dcGTX2+3)]:[(C1+2)+(B1)] calculated for samples of surf clam, wedge clam, cockle and
mussel presenting toxicity values above and below the PST regulatory limit (RL), as well as for samples of
seston during a bloom of toxic algae (G. catenatum) in coastal waters adjacent to Óbidos lagoon in 2008
(method A); period of time for bivalves: 2007 – 2012; methodologies used: (a) method A; (b) method B.
The ratios R1=(C1+2):B1 in surf clams could not be determined accurately because
their concentrations were below the limit of detection in 90% of the samples. Medians
of this ratio in wedge clams, cockles and mussels were lower than in G. catenatum cells
collected in the NW coast during the blooms of 2007 and 2008 (Figure 7.5). Lower ratios
in bivalves suggest the reduction of C1+2, most likely due to biotransformation to
decarbamoyl toxins (Cho et al., 2008) or elimination, as well as the conversion of other
compounds into B1 that counterbalanced its elimination or conversion. A plausible
explanation for the increase of B1 is the possibility that this compound is a metabolic
product of degradation of B2 due to their similar chemical structures (Oshima, 1995b).
The ratios R1 in wedge clams were significantly (p<0.05) lower than in cockles and
mussels with elevated toxicity. This difference points to more intense processes involving
White clam Donax clam Cockle Mussel0
4
8
12 abov e RL
below RL
White clam Donax clam Cockle Mussel Toxic algae0
2
4
6
8
Mo
lar
rati
o R
1=
(C1
+2
):B
1 above RL
below RL
toxic algae
White clam Donax clam Cockle Mussel Toxic algae0
1
2
3
Mo
lar
rati
o R
2=
[(d
cS
TX
)+(d
cG
TX
2+
3)]
:[(C
1+
2)+
B1
]
abov e RL
below RL
toxic algae
White clam0
20
40
60
80
100
120
White clam
White clam Donax clam Cockle Mussel0
1
2
3 abov e RL
below RL
White clam0
100
200
300
White clam
Surf clam Wedge clam Cockle Mussel Toxic Algae Surf clam Wedge clam Cockle Mussel
Wedge clam Cockle Mussel Toxic Algae Wedge clam Cockle Mussel
Surf clam
Surf clam
a
b

Chapter 7
145
those toxins in wedge clams during the period that was exposed to G. catenatum bloom
than in cockles and mussels. The comparable ratio R1 registered in wedge clams during
winter/spring, after a long period of natural depuration, supports this hypothesis.
Conversely, the ratios in low toxicity (winter) cockle and mussels decreased significantly
(p<0.05), which can be interpreted to mean that transformation or elimination processes
involving C1+2 and B1 in those species are more prolonged than in wedge clams.
7.4.3. Prevalence of decarbamoyl derivates in surf clams
Since decarbamoyl derivates contribute approximately 10% to the toxin profile of
G. catenatum cells (Figure 7.4), the ratio R2=[(dcSTX)+(dcGTX2+3)]:[(C1+2)+(B1)] may be
considered as a footprint of PSTs biotransformation in bivalves. The differences among
the four species, and between low and elevated bivalve toxicity, are shown in Figure 7.5.
The most striking aspect is the extreme values of R2 for surf clams (median 72) in
comparison to the other species analysed (0.2-0.4) and to G. catenatum cells (0.1).
Those extreme values reflect the low concentrations of C1+2 and B1 in surf clams and
their almost entire conversion into decarbamoyl analogues. The undetected values of
these compounds in surf clams are explained by the rapid transformations of
N-sulfocarbamoyl and carbamate toxins into to their corresponding decarbamate
analogues (Artigas et al., 2007). Using in vitro experiments these authors showed that
conversion occurs within a time-scale of one hour. In accordance, the profile of surf
clams exposed to G. catenatum cells observed in the current work was dominated by
dcSTX and dcGTX2+3, which reflects the rapid biotransformation of the ingested toxins.
This type of profile persisted in periods of low toxicity, R2 in surf clams being significantly
(p<0.05) different from other bivalve species (Figure 7.5). The lack of differences in the
toxin proportion of surf clams among harvest areas is in line with the high
biotransformation of the ingested toxins. Presumably, the broad difference registered in
the ratio R2 between elevated and low toxicity of surf clams results from elimination of
decarbamoyl derivates after blooms. Since inter-toxin conversion superimposes to other

Chapter 7
146
steps of the bioaccumulation process, the major contributors to the toxin profile of surf
clams stand independently of the abundance of toxic cells to which the specimens are
exposed.
7.5. Conclusions
Differences of PST profiles between bivalves of elevated toxicity (exposed to
Gymnodinium catenatum bloom) and bivalves of low toxicity (winter or spring with low
abundance of toxic algae) are better illustrated through the molar ratios of R1=(C1+2):B1
and R2=[(dcSTX)+(dcGTX2+3)]:[(C1+2)+(B1)]. The ratio R1 decreased considerably
between elevated and low toxicity cockles, indicating the elimination of C1+2 associated
with the ingested toxic cells or conversion of compounds into B1. The ratio R2 increased
considerably in wedge clams of low toxicity and less markedly in cockles and mussels.
This change is interpreted as the predominance of a biotransformation phase after
exposure to algal blooms. The toxin profile of surf clams is dominated by decarbamoyl
compounds, reflecting intense biotransformation during exposure to blooms. This profile
remains after that, although the ratio R2 decreased considerably, which may indicate the
elimination of the produced dcSTX and dcGTX2+3.
Acknowledgements
We are grateful to our colleagues S.M. Rodrigues, P. Vale and P.R. Costa from the
Laboratory of Marine Biotoxins, IPMA.

Chapter 8
147
8. Final considerations
8.1. General discussion
This section presents an overview of the various topics dealt with in the chapters 3 to 7,
carrying out an integrative discussion of the main outcomes. Linkage to the thesis objectives and the
contribution to the scientific knowledge in the area are also highlighted.
First of all, it is important to point out that the present research has filled gaps on the
knowledge of the pathways of individual paralytic shellfish toxins (PSTs) produced by the
dinoflagellate Gymnodinium catenatum in commercial bivalves. Various studies have reported the
uptake, elimination and biotransformation of toxins produced by Alexandrium species in other
geographical areas of bivalve production (Bricelj et al., 1990; Sekiguchi et al., 2001). The research
presented in this thesis was focused on PSTs produced by G. catenatum, the composition of which
varies geographically and differs from the profile produced by Alexandrium species (Cembella et al.,
1987; Hallegraeff et al., 2012). The accumulation was studied in commercial bivalve species harvested
in estuaries, coastal lagoons, and inshore areas of Portugal, such as mussels (Mytilus spp.), cockles
(Cerastoderma edule) and clams (Ruditapes decussatus, Spisula solida, Donax trunculus). Because of
the specificity of each species, PST profiles differ among them. In addition, laboratory experiments
were performed to study the uptake and depuration kinetics of the major toxins produced by that
dinoflagellate (dcGTX2+3, dcSTX, C1+2 and B1), including the estimation of the corresponding rates.
Research question 1: Is it feasible to predict seasonal or inter-annual toxicity episodes by PSTs
of bivalves produced and harvested in Portugal? Do these episodes vary with the geographical area?
Is it possible to identify areas where toxicity episodes are more recurrent?
Approach: In order to address this question, long-term data from the national monitoring
programme (1994-2012) were examined in detail. Firstly, commercial bivalve species sensitive to PSTs
were selected, areas with toxicity episodes were surveyed, and annual periods of moderate to
elevated sampling frequency of bivalves were chosen. Finally, inter-annual and seasonal variations of
8

Chapter 8
148
PST episodes were searched for.
In this study, PST episodes were considered when toxin concentrations in bivalves were above
the regulatory limit defined for human consumption. As monitoring programmes of bivalve toxicity
were implemented in various countries, G. catenatum was considered a cosmopolitan species
(Band-Schmidt et al., 2010) and PSP became a relevant issue in various areas. Two possible
mechanisms were proposed for G. catenatum blooms (Hallegraeff et al., 2012): "blooms derived from
an inoculum by local cyst beds or (overwintering) motile cells, and are triggered by organic
enrichment" (e.g., Tasmanian estuaries); and a second mechanism in which G. catenantum "blooms
are inoculated from offshore and build up during upwelling relaxation" (e.g., Spanish rias). Despite
the understanding of these mechanisms, occurrence of blooms and toxicity episodes are far from
being regular or predictable. For example, inter-annual variation of G. catenatum blooms has been
reported in various coastal systems such as Galicia in Spain (Estrada, 1995) and Mexico (Mee et al.,
1986; Cortés Altamirano et al., 1996), without an explanation for this puzzling variation. It has been
argued that unrecognized upwelling system factors could be more important than life cycle strategies
of phytoplankton species (Bravo et al., 2010; Smayda and Trainer, 2010).
The two overviews of bivalve toxicity caused by Dynophysis spp., Pseudonitzchia spp. and
Gymnodinium catenatum in the Portuguese coast for the periods 1986-1996 (Sampayo et al., 1997)
and 1986-2006 (Vale at al., 2008) also showed irregularities in the incidence of maximum toxicity
values. Various commercial species were considered in these works. This thesis presents a third
overview covering the period between 1994 and 2012, and including toxicity values by PSTs in
mussels, cockles, wedge clams and surf clams harvested in the main production areas in Portugal
(Chapter 7). As observed in other regions of the world, an irregular multi-annual variation was
registered over the surveyed 18 years. A salient aspect of this analysis is the prolonged period
(1996-2004) of low toxicity by PSTs, despite the regular coastal upwelling in the Portuguese waters
(Fiúza, 1983). The lack of PST episodes was already reported in this period by Vale et al. (2008). This
observation is very much in line with the argument of the importance of unrecognized upwelling
system factors relatively to life cycle strategies of G. catenantum (Bravo et al., 2010). To confirm this
hypothesis further studies on algal bloom dynamic should be performed. This thesis also points to the
connectivity of PST episodes along circa 150 km of the west coast of Portugal in autumn and early
winter. The occurrence of high bivalve toxicity in the same weeks reinforces the hypothesis that

Chapter 8
149
episodes in the west coast of Portugal are linked to the relaxation of coastal upwelling associated
with slow currents or inshore eddies (Moita et al., 2003; Pitcher et al., 2010).
Research question 2: Could pronounced alterations in nutrient concentration and nutrient
composition facilitate the development or maintenance of toxic algal blooms and consequently
prolonged toxicity in bivalves?
Approach: This hypothesis was tested in a coastal lagoon with symptoms of eutrophication and
located nearby a coastal area with recurrent toxic algal blooms.
During a "roundtable discussion" on the links between water quality, eutrophication, and HABs,
a consensus was obtained with respect to the importance of nutrient concentration and nutrient
composition as promoters of harmful algal blooms (Heisler et al., 2008). The possibility of a shift on
nutrients prolonging the algal bloom was examined in a coastal lagoon with symptoms of
eutrophication (Óbidos lagoon) permanently connected to a coastal area in the west of Portugal
characterized by frequent upwelling episodes and bivalve toxicity (Chapter 4). High concentration
ratios between phosphate and dissolved inorganic nitrogen and between phosphate and silicate were
registered during summer in Óbidos lagoon, as result of high regeneration of phosphate in sediments
and diffusion to the water column. This alteration may facilitate the development or maintenance of
the bloom according to studies examining the linkages between the composition of the nutrient pool
and shellfish toxicity (e.g., Hattenrath et al., 2010). Data on DST- and PST-derived toxicities in mussels
from the lagoon along 2006 and 2009 were used. Between June and September 2006 (and less
markedly in 2009), toxicity in mussels from the lagoon was higher and displayed a longer duration
than in mussels from the adjacent coast. This occurred in the period that nutrient concentrations and
composition shifted. Presumably, phytoplankton cells imported from the coastal waters, most likely
associated with coastal upwelling, became exposed to a proportional enrichment of phosphorus
relatively to nitrogen and silicon, as well as of organic forms of N and P. These conditions, coupled
with high salinity due to negligible freshwater inputs in summer, may have favored the increase of cell
densities and consequently bivalve toxicity. Although nutrient concentrations in estuaries are, in
general, higher than in the coastal waters, linkage between nutrient composition and algae-produced
toxins may not occur in most of estuaries. Negative effect such as high turbidity which limits light in
the water column and low salinity being unfavorable to phytoplankton cells, may prevent that

Chapter 8
150
association.
Despite specificities of estuaries and coastal lagoons, connectivity of bivalve toxicity episodes
may be found between estuaries/lagoon and coastal waters. For example, connectivity was observed
between toxicity of cockles from Ria Formosa (a coastal lagoon with negligible freshwater input
permanently connected with the sea) and of wedge clam from the adjacent coastal area (Chapter 3).
Research question 3: Do toxin profiles of G. catenatum cells vary in the NW coast of Portugal?
Does the profile change during the bloom?
Approach: To test those possibilities cells of G. catenatum collected during an event of mussel
toxicity and high cell abundance were examined.
Cells of G. catenatum collected along a bloom in the NW coast differ slightly (Chapter 7). We
have assumed that physico-chemical conditions may have been modified and the production of
toxins has changed. However, other factors may be invoked, such as changes in cell size, chain length
and toxin leakage (Granéli and Flynn, 2006). Despite that variability, toxin profiles of cells possibly
ingested by bivalves are dominated by N-sulfocarbamoyl toxins, followed by the decarbamoyl
analogues. This pattern is in agreement with previous studies (Sousa et al., 1995; Costa et al., 2010)
and is characteristic in the Iberian coast (Camino-Ordás et al., 2004). A high proportion of C and B
toxins in the toxin profile seems to be characteristic of the toxins produced by G. catenatum cells
worldwide, except for Singaporean and Malay strains (Holmes et al., 2002; Mohammad-Noor, 2010),
and some Andalusian strains (Camino-Ordás et al., 2004). Otherwise, the absence of NEO toxin in
strains from the Iberian coast contrasts with those from the Gulf of California and the Mexican coast
characterized by a elevated contribution of NEO to the toxin profile (Band-Schmidt et al., 2006).
Research question 4: How relevant is biotransformation of PSTs by bivalves during exposure
and depuration phases? What can be learnt from toxin composition in faeces and pseudo-faeces
produced by bivalves?
Approach: The response to this question was obtained from the results of a laboratory
experiment with the clam Ruditapes decussatus including exposure to G. catenatum and subsequent
depuration.
Regardless of connectivity of bivalve toxicity observed in this work, various studies have shown

Chapter 8
151
that bivalves exposed to dinoflagellates exhibit different PSTs profiles from the toxin producers
(Oshima et al., 1990; Bricelj et al., 1990). Metabolic interconversion of assimilated toxins achieved by
enzymatic and chemical reactions in bivalve tissues (Shimizu and Yashioka, 1981; Oshima, 1995b), as
well as to different uptake and depuration kinetics of individual PSTs (Yu et al., 2007; Botelho et al.,
2010) are the major contributors to that difference. Different profiles between the algae-producing
toxin and bivalve species were emphasized in a laboratory experiment with G. catenatum and
Ruditapes decussatus (Chapter 3). The toxins dcSTX and dcGTX2+3 were minor compounds in the
algae, but were predominant in clams as assimilated toxins are interconverted. Furthermore, an
innovative aspect of those results was the toxin profile of the particulate organic matter (POM),
which was dominated by dcSTX while the other compounds were below the limit of detection. Since
POM consisted of faeces and pseudofaeces produced by the clams along the experiment, the
compound dcSTX should result mainly from interconversion of other toxins. This compound was the
major toxin released by the clams associated with faeces. Indeed, the non-quantified presence of the
assimilated toxins (mainly C1+2 and B1) in POM showed the intense biotransformation of those
toxins by R. decussatus. The results of this experiment highlight the relevance of biotransformation in
the definition of toxin profiles in clams. In vitro experiments have demonstrated the transformation
of assimilated toxins in other compounds, e.g., in the experiments referred in Artigas et al. (2007) and
Fast et al. (2006).
Research question 5: Which toxins remain in bivalves during periods of low toxicity? Are the
same toxins present in bivalves of low and high toxicity?
Approach: Comparison of toxin profiles in periods of low and elevated bivalve toxicity (data
from the national monitoring programme, 2007-2012).
Monitoring programmes register toxin concentrations, toxicity and, by comparison to the PST
regulatory limit, indicate the species and areas displaying values above and below the regulatory limit.
However, comparison of toxin profiles for different toxicity values are scarce (Turner et al, 2014).
Relationships between profiles and total PST content in bivalves were examined in bivalves from the
United Kingdom and distinct profile types were identified. This thesis compares PST profiles in
bivalves of toxicity below and above the PST regulatory limit caused by G. catenatum blooms in the
period 2007-2012 (Chapter 7). The main production areas in Portuguese estuaries and coastal areas
Chapter 8
152
were considered. Profiles differed between periods of elevated toxicity (exposed to G. catenatum
bloom) and low bivalve toxicity (winter or spring with low abundance of toxic algae). This comparison
was carried out for the species Spisula solida, Donax trunculus, Cerastoderma edule and Mytilus spp..
The observed differences reflect the variation of the mass balance including ingested toxic cells,
differential toxin elimination, and metabolic interconversions. Despite the slight variability in toxins in
the ingested cells, N-sulfocarbamoyl toxins, followed by the decarbamoyl analogues are the dominant
compounds in all the analysed species, except for S. solida. Presumably, biotransformation is the
most influencing factor of this pattern. By comparing the toxin molar ratios it seems that
transformation or elimination processes involving C1+2 and B1 during winter and spring (low
abundance of toxic cells in the water column), were more prolonged in cockles and mussels than in
wedge clams. The calculated ratios [(dcSTX)+(dcGTX2+3)]:[(C1+2)+(B1)] (see Chapter 7) may be
considered as footprints of PSTs biotransformation in bivalves. They pointed to the higher
predominance of the biotransformation phase after exposure to algal blooms in wedge clams than in
cockles and mussels. In addition, this approach highlighted the intense biotransformation of ingested
toxins in surf clams since decarbamoyl toxins stand as the major contributors to the toxin profile
independently of the abundance of toxic cells to which the specimens are exposed. In short, bivalves
tend to retain some of the biotransformed toxins between seasonal blooms of G. catenatum, but not
the toxins presented in the ingested toxic cells.
Research question 6: How are PSTs partitioned in bivalves at the sub-cellular level? Which cell
components, soluble or insoluble fractions are important in the partitioning? Does sub-cellular
partitioning of PSTs in tissues changes during depuration after exposure to G. catenatum bloom?
Approach: This question was approached examining the sub-cellular partitioning of PSTs in
digestive glands of cockles (Cerastoderme edule) exposed to a G. catenatum bloom and under
post-bloom natural conditions.
The digestive gland of bivalves is the initial repository of ingested food, including xenobiotics
and marine toxins. This organ contains by far the greatest proportion of the total toxin body burden
in bivalves exposed to toxic algal blooms (Bricelj and Shumway, 1998). Enzymatic and other
oxidation/reduction reactions are involved in the elimination or biotransformation of toxins in the
digestive gland (Fast et al., 2006). The partitioning of PSTs among the sub-cellular fractions in

Chapter 8
153
digestive glands of bivalves, exposed to toxic algae and during depuration, may provide a better
knowledge of the distribution and linkage of PSTs in bivalve tissues. Different depuration rates for
toxins may result from variations in partitioning and linkages. This approach was used in the present
study to search for differences in the sub-cellular partitioning of C1+2, B1, dcGTX2+3, dcSTX, GTX2+3
and STX in digestive glands of the cockle Cerastoderme edule, after being exposed to a G. catenatum
bloom and under natural depuration conditions (Chapter 5). The partitioning of PSTs among the cell
compartments indicated that assimilated toxins were mainly stored in the cytosolic fraction, as other
works related with the partitioning of hydrophilic toxins have reported (Mauriz and Blanco, 2010).
However, the partitioning of toxins among cell organelles has been poorly documented, which limits
the understanding of the mechanisms behind the release of toxins at sub-cellular level. This thesis
presents the quantification of all toxins, except GTX2+3 and STX, in the sub-cellular particulate
fractions (nuclei+debris, mitochondria, lysosomes and microsomes) of digestive glands of cockles.
The toxin content decreased most markedly in nuclei+debris and microsomal fractions, during the
first days of depuration (eight and 12 days respectively). Conversely, different patterns were observed
among toxins in mitochondrial and lysosomal fractions. Interconversion among toxins and exchange
between insoluble and soluble cellular fractions are the most plausible reasons for the observed
patterns, as well for changes in toxin profiles among sub-cellular fractions. In particular, toxin
interconversion may be associated with enzymatic activities existing in the mitochondrial fraction, as
compounds ingested by the organisms are transformed into simpler molecules during the energy
production in this organelle (Voet and Voet, 1990). In addition, the non-uniform decrease of B1
contents in the lysosomal fraction points also to the conversion of other toxins, like the abundant B2
and C1+2, occurring in the digestive process of materials acquired through vesicular transport (Voet
and Voet, 1990). Along this process undesirable compounds, such as toxins, may be incorporated in
the lysosomes and subsequently decomposed in order to protect the cell from cytotoxic effects
(Moore, 1988; Owen, 1972; Viarengo et al., 1987).

Chapter 8
154
8.2. Perspectives and future work
This study has identified a number of supplementary areas of research. These are discussed below:
How can modelling be useful for prediction of the variation of the uptake, transformation and
elimination of individual toxins in bivalve species exposed to G. catenatum blooms? Besides
the selection of the best models, data on kinetics and interconversion of toxins in commercial
bivalve species would be needed; this may be obtained from simulation experiments under
controlled conditions. Outputs generated by the models should predict how toxin profiles
vary on a timescale of days to weeks, and consequently provide results on the toxicity values
with respect to the regulatory limits.
Do assimilated toxins have effects on bivalves? At which life stage of development? Are larvae
affected? Parameters such as survival and activity of early D-shape larvae under laboratory
exposure to toxic algae could be examined to search for adverse effects on early life stage of
bivalves, and subsequent effects on recruitment.
Do toxins accumulated in bivalves have effects on other biological organization levels of the
organism? A possible approach to these questions could be to examine biochemical
responses to the assimilated toxins at cellular level. Selected biomarker parameters could be
used to investigate the disturbances in cellular oxidative stress during exposure of bivalves to
PSTs. This could be achieved by laboratory experiments or, in a less controlled manner with
respect to environmental variables, by analysing natural populations of bivalves during
blooms and subsequent periods.
8.3. Management applications
The study of paralytic shellfish toxins in bivalves carried out in this PhD thesis has potential
applications on management of the harvesting and production of bivalves in Portugal relatively to
the restrictions in commercialization during periods of bivalve toxicity values above the regulatory
limit. The analysis of two decades of historical toxicity data of commercial bivalve species allowed the
Chapter 8
155
identification of harvest areas presenting different incidences of toxicity episodes. This information is
useful to the Administration, proving elements for risk analysis. It could be added to Marine Spatial
Planning for a better documentation of potential areas for inshore aquaculture (Plano de
Ordenamento do Espaço Marítimo, MAMAOT, 2011).
Furthermore, identification of coastal and estuarine areas with different vulnerabilities relatively
to marine toxins, and consequently commercialization of the harvest or produced bivalves, provides
key elements to private investors decide on long-term strategies of bivalve production in Portugal.
Seasonal variation of bivalve toxicity allows establishing periods that temporary closure to
commercialization is more likely to occur, and consequently commitment to supply bivalves during
these periods should be taken with precautions. An important aspect for the bivalve production
activity is the identification of species less vulnerable to accumulate toxins. However, with the
exception of oysters that tend to exhibit low toxicity (not shown in this thesis), production
techniques of other species that rapidly metabolise the ingested toxins still need improvements.
Market requirements and competition among production areas is an important aspect of the
strategy.
Monitoring programmes of marine toxins and HABs are designed at national level to alert
producers, fishermen and consumers about bivalve toxicity. Benefits are evident, with an increased
safety of available products and a consequent increase in consumer confidence. The cost of
conducting this monitoring programme is low relatively to the revenue from bivalve production.
Estimation of the annual revenue from two important production regions (Aveiro and
Formosa/Culatra, including inshore and estuarine harvesting and production) was based on official
data on quantities and wholesale prices of bivalves (DGPA, 2011). An approximate annual income of
2 700 K€ was estimated in 2010 considering the most important five commercial species: mussel,
cockle, surf clam and wedge clam. The annual cost of the monitoring programme for those two areas
may be estimated using the prices for the toxin analysis of IPMA (Despacho nº 23597/2006).
Considering that five species are sampled on a weekly basis from each area, the annual cost of this
programme is approximately 115 k€, which corresponds to less that 5% of the annual revenue. With
this small fraction of the income, bivalve producers and fishermen can guarantee products in the
market of low toxicity and, consequently, increasing the credibility of their activity. This value also
suggests that producer organizations could organise the self-control of their products before

Chapter 8
156
commercialisation at relatively low costs (Anon., 2004a). More expedite and cheaper methodologies
should be used in the near future, encouraging producers to invest in self-control of toxins before
export or sell products to the market.
The literature refers that severe eutrophication may result in HABs (Bricker et al., 2008; Heisler
et al., 2008). However, most of the toxic algal blooms and bivalve toxicity in coastal areas are not
related to eutrophication (Hallegraeff et al., 2012). Similarly, bivalve toxicity produced by blooms of
Gymnodinium catenatum (producer of PSTs), Dinophysis spp. (producers of DSTs) in Portugal has not
been related to eutrophication symptoms. An interesting question is whether occurrence of toxic
algal blooms and bivalve toxicity will increase in the near future, and whether measures associated
with Water Framework Directive (WFD) or Marine Strategy Framework Directive (MSFD) can reduce
the frequency of those episodes. Nutrient concentrations and phytoplankton composition are quality
elements for determination of Ecological Status in marine and estuarine waters (WFD, 2000/60/EC)
and descriptors of environmental status (MSFD, 2008/56/EC). When values of these parameters do
not comply with reference conditions or thresholds, measures should be taken to achieve good
status. In Portuguese coastal waters, toxic algal blooms consume nutrients mainly from the upwelling
of bottom water enriched in nutrients, and not to nutrient loads from the watershed. Moreover,
toxicity episodes in estuaries and adjacent coastal areas are often connected, suggesting that toxic
algal blooms formed in the coastal waters are advected to the estuaries. Under the present
circumstances, possible measures to reduce the nutrient loads in river basins in the light of those
directives should have negligible effects on toxic algal blooms causing bivalve toxicity in the
Portuguese production areas.
However, the study in Óbidos lagoon, an eutrophic system, raises the possibility of nutrients
from diffuse sources increasing the duration of high abundances of toxic dinoflagellate imported
from the coastal waters. Climate change scenarios include the increase of runoff episodes being
more intense and frequent, and enhancing the relevance of diffuse sources of nutrients to estuaries
and coastal lagoons (Intergovernamental Panel on Climate Change, IPCC, 2014). Under these
circumstances, a paradigm shift in bivalve toxicity could be hypothesized, whereby nutrients from
land play a greater role in the onset and maintenance of blooms mainly in estuaries and coastal
lagoons. If such scenario becomes realistic, measures to reduce nutrient inputs may be foreseen
under the WFD in order to reduce the intensity and frequency of toxic algal blooms and therefore

Chapter 8
157
bivalve toxicity episodes. The possibility of other toxin-producing species developing off the Iberian
coast due to changes in temperature is also a very real possibility.

158

References
159
References
Amorim, A., 2001. Dinoflagellate cysts distribution along the coast of Portugal, PhD Thesis, Universidade de
Lisboa, Portugal, 161 pp.
Amorim, A., Dale, B., 1998. Distribution of cysts from toxic or potentially toxic dinoflagellates along the
portuguese coast. In: Reguera, B., Blanco, J., Fernández, M.L., Wyatt, T. (Eds.), Harmful Algae. Xunta de
Galicia e Intergovernmental Oceanographic Commission of UNESCO. Santiago de Compostela. pp. 64-65.
Amorim, A., Dale, B., 2006. Historical record as an evidence for the recent introduction of the dinoflagellate
Gymnodinium catenatum in the north-eastern Atlantic. Afr. J. Mar. Sci. 28, 193–197.
Anderson, D.M., 2009. Approaches to monitoring, control and management of harmful algal blooms (HABs).
Ocean Coast. Manage. 52 (7), 342-347.
Anderson, D.M., Burkholder, J.M., Cochlan, W.P., Gilbert, P.M., Gobler, C.J., Heil, C.A., Kudela, R.M., Parsons,
M.L., Jack Rensel, J.E., Townsend, D.W., Trainer, V.L., Vargo, G.A., 2008. Harmful algal blooms and
eutrophication: Examining linkages from selected coastal regions of the United States. Harmful Algae 8,
39-53.
Anderson, D.M., Glibert, P.M., Burkholder, J.M., 2002. Harmful algal blooms and eutrophication: nutrient
sources, composition and consequences. Estuaries 25(4b), 562-584.
Anderson, D.M., Kulis, D.M., Sullivan, J.J., Hall, S., Lee, C., 1990. Dynamic and physiology of the saxitoxin
production by the dinoflagellates Alexandrium spp., Mar. Biol. 104, 511-524.
Anon., 2004a. Regulation (EC) no. 854/2004 of the European Parliament and of the Council of 29 April 2004.
Official Journal of European Communities L226, 37–39.
Anon., 2004b. Regulation (EC) no. 853/2004 of the European Parliament and of the Council of 29 April 2004.
Official Journal of European Communities L139, 88–102.
Anon., 2005a. AOAC Official method 959.08, Paralytic shellfish poison. Biological method. Final action. In:
Truckes, M.W. (Ed.), AOAC Official Methods for Analysis. 18th ed. Natural Toxins AOAC International,
Gaithersburg, MD, USA, (chapter 49), pp. 79-80.
Anon., 2005b. AOAC Official Method 2005.06. Quantitative Determination of Paralytic Shellfish Poisoning Toxins
in Shellfish Using Prechromatographic Oxidation and Liquid Chromatography with Fluorescence
Detection. AOAC International, Gaithersburg, MD, USA.
Anon., 2006. Committee on toxicity of chemicals in food, consumer products and the environment. Statement
on risk assessment and monitoring of paralytic shellfish poisoning (PSP) toxins in support of human
health. COT Statement 2006/08. July 2006.
Anon., 2007. Community Reference Laboratory for Marine Biotoxins Report for the determination of PSP toxins
in shellfish including B2 (GTX6) after hydrolysis. (http://www.aesan.msssi.gob.es/CRLMB/docs/docs/
Anon., 2009. Scientific opinion of the panel of contaminants in the food chain on a request from the European
Commission on marine biotoxins in shellfish - Saxitoxin Group. EFSA Journal 1019, 1-76.
AOAC, 1990. Paralytic Shellfish Poison. Biological method. Final action. In: Hellrich, K. (Ed.), Official Method of
Analysis. 15th ed., Sec 959.08. Association of Official Analytical Chemists (AOAC), Arlington, Virginia, USA,
pp. 881–882.
Artigas, M.L., Vale, P., Gomes, S.S., Botelho, M.J., Rodrigues, S.M., Amorim, A., 2007. Profiles of paralytic
shellfish toxins in shellfish from Portugal explained by carbamoylase activity. J. Chromatogr. A 1160,
99-105.
ayuda_cientifica/PSP-Hydrolysis_study-2007-Report.pdf).
Bandarra, N.M., Pereira, P.A., Batista, I. , Vilela, M.H., 2003. Fatty acids, sterols and α-tocopherol in Isochrysis

References
160
galbana. J. Food Lipids 10, 25–34.
Band-Schmidt, C., Bustillos-Guzmán, J., Morquecho, L., Gárate-Lizárraga, I., Alonso-Rodríguez, R., Reyes-Salinas,
A., Erler, K., Luckas, B., 2006. Variation of PSP toxin profiles during different growth phases in
Gymnodinium catenatum (Dinophyceae) strains isolated from three locations in the Gulf of California,
Mexico. J. Physiology 42(4), 757-768.
Band-Schmidt, C.J., Bustillos-Guzmán, J., Gárate-Lizárraga, I., Lechuga-Devéze, C.H., Reinhardt, K., Luckas, B.,
2005. Paralytic shellfish toxin profile in strains of the dinoflagellate Gymnodinium catenatum Graham
and the scallop Argopecten ventricosus G.B. Sowerby II from Bahía Concepción, Gulf of California,
Mexico. Harmful Algae 4, 21-31.
Band-Schmidt, C.J., Bustillos-Guzmán, J.J., López-Cortés, D.J., Gárate-Lizárraga, I., Núnez-Vázquez, E.J.,
Hernández-Sandoval, F.E., 2010. Ecological and physiological studies of Gymmodinium catenatum in the
Mexican Pacific: a review. Marine Drugs 8, 1935-1961.
Bates, S., Trainer, V.L., 2006. The ecology of harmful diatoms. In: E. Granéli, J.T. Turner (Eds.), Ecology of harmful
algae. Springer, Heidelberg, Germany, Vol. 189, pp 81-93.
Batoréu, M.C.C., Dias, E., Pereira, P., Franca, S., 2005. Risk of human exposure to paralytic toxins of algal origin.
Environ. Toxicol. Phar. 19, 401-406.
Beitler, M.K., Liston, K.,1990. Uptake and tissue distribution of PSP toxins in butter clams. In: E. Granéli, B.
Sundtrom, L. Edler, D.M. Anderson (Eds.). Toxic Marine Phytoplankton. Elsevier, New York, pp. 257-262.
Ben-Gigirey, B, Rodríguez-Velasco, M.L., Villar-González, A., Botana, L.M., 2007. Influence of the sample toxic
profile on the suitability of a high performance liquid chromatography method for official paralytic
shellfish toxins control. J. Chromatogr. A 1140, 78-87.
Beppu, R., Nojima, K., Tsuruda, S., Gomez-Delan, G., Barte-Quilantang, M., Taniyama, S., Sagara, T.; Nishio, S.;
Takayama, H.; Miyazawa, K.; Asakawa, M., 2008. Occurrence of PSP-producing dinoflagellate
Alexandrium tamiyavanichii in Bingo-Nada, the central coastal water of the Seto Inland Sea, Hiroshima
Prefecture, Japan. Mar. Pollut. Bull. 56, 758–763.
Bettencourt, A.M., Bricker, S.B., Ferreira, J.G., Franco, A., Marques, J.C., Melo, J.J., Nobre, A., Ramos, L., Reis, C.S.,
Salas, F., Silva, M.C., Simas, T., Wolff, W.J., 2004. Typology and Reference Conditions for Portuguese
Transitional and Coastal Waters. In: Instituto da Água, Institute of Marine Research (Eds.), Development
of Guidelines for the Application of the European Union Water Framework Directive, 98 pp.
Blackburn, S.I., Bolch, C.J.S., Haskard, K.A., Hallegraeff, G.M., 2001. Reproductive compatibility among four
global populations of the toxic dinoflagellate Gymnodinium catenatum (Dinophyceae). Phycologia 40 (1),
78-87.
Blackburn, S.I., Hallegraeff, G.M., Bolch, C. J., 1989. Vegetative reproduction and sexual life cycle of the toxic
dinoflagellate Gymnodinium catenatum from Tasmania, Australia. J. Phycology 25, 577-590.
Blanco, J., Morono, A., Franco, J., Reyero, M.I., 1997. PSP detoxification kinetics in the mussel Mytilus
galloprovincialis: one- and two-compartment models and the effect of some environmental variables.
Mar. Ecol. Prog. Ser. 158, 165–175.
Blanco, J., Reyero, M.I., Franco, J., 2003. Kinetics of accumulation and transformation of paralytic shellfish toxins
in the blue mussel Mytilus galloprovincialis. Toxicon 42, 777-784.
Bordner, J.; Thiessen, W.E.; Bates, H.A.; Rapoport, H., 1975. Structure of a crystalline derivative of saxitoxin.
Structure of saxitoxin. J. Am. Chem. Soc. 97, 6008–6012.
Botelho, M.J., Vale, C., Grilo, R.V., Ferreira, J.G., 2012. Uptake and release of paralytic shellfish toxins by the clam
Ruditapes decussatus exposed to Gymnodinium catenatum and subsequent depuration. Mar. Environ.
Res. 77, 23-29.

References
161
Botelho, M.J., Vale, C., Mota, A.M., Rodrigues, S.M., Costa, P.R., Simões Gonçalves, M.L.S., 2010b. Matrix effect
on paralytic shellfish toxins quantification and toxicity estimation in mussels exposed to Gymnodinium
catenatum. Food Addit. Contam. A 27, 1724-1732.
Botelho, M.J., Vale, C., Mota, A.M., Simões Gonçalves, M.L.S. 2010a. Depuration kinetics of paralytic shellfish
toxins in Mytilus galloprovincialis exposed to Gymnodinium catenatum: laboratory and field experiments.
J. Environ. Monit. 12, 2269–2275.
Bravo, I., Fraga, S., Figueroa, R. I., Pazos, Y.,Massanet, A., Ramilo, I., 2010. Bloom dynamics and life cycle
strategies of two toxic dinoflagellates in a coastal upwelling system (NW Iberian Peninsula). Deep Sea Res.
Pt. II 57 (3-4), 222-234.
Bricelj , V.M., Connell, L., Konoki, K., MacQuarrie, S.P., Todd Scheuer, T., William A. Catterall, W.A., Trainer, V.L.,
2005. Sodium channel mutation leading to saxitoxin resistance in clams increases risk of PSP. Nature 434,
763-767.
Bricelj, V. M., Cembella. A. D., 1995. Fate of gonyautoxins accumulated in surfclams, Spisula solidissima, grazing
upon PSP toxin-producing Alexandrium. In: Harmful Marine Algal Blooms. P. Lassus, G. Arzul, E. Erard, P.
Gentien, C. Marcaillou (Eds.), Lavoisier Science Publishers, Paris, pp. 413-418.
Bricelj, V. M., Lee, J. H., Cembella, A. D., Anderson, D.M., 1990. Uptake kinetics of paralytic shellfish toxins from
the dinoflagellate Alexandrium fundyense in the mussel Mytilus edulis. Mar. Ecol. Prog. Ser. 63, 177–188.
Bricelj, V.M., Cembella, A.D., Laby, Shumway, S. E. , Cucci, T. L., 1996. Comparative physiological and behavioral
responses to PSP toxins in two bivalve molluscs, the softshell clam, Mya arenaria, and surfclam, Spisula
solidissima. In: Harmful and Toxic Algal Blooms. T. Yasumoto, Y. Oshima, Y. Fukuyo (Eds.),
Intergovernmental Oceanographic Commission of UNESCO, pp. 405–408.
Bricelj, V.M., Lee, J.H., Cembella, A.D, 1991. Influence of dinoflagellate cell toxicity on uptake and loss of
paralytic shellfish toxins in the northern quahog Mercenaria mercenaria. Mar. Ecol. Prog. Ser., 74, 33-46.
Bricelj, V.M., Lee, J.H., Cembella, A.D., Anderson, D.M., 1990. Uptake kinetics of paralytic shellfish toxins from
the dinoflagellate Alexandrium fundyense in the mussel Mytilus edulis. Mar. Ecol. Prog. Ser., 63, 177-188.
Bricelj, V.M., Shumway, S.E., 1998. Paralytic shellfish toxins in bivalve molluscs: occurrence, transfer kinetics,
and biotransformation. Rev. Fish. Sci. 6 (4), 315-383.
Bricker, S.B., Longstaff, B., Dennison, W., Jones, A., Boicourt, K., Wicks, C., Woerner, J., 2008. Effects of nutrient
enrichment in the nations´s estuaries: A decade of change. Harmful Algae 8, 21-32.
Brito, A.C., Quental, T., Coutinho, T.P., Branco, M.A.C., Falcão, M., Newton, A., Icely, J., Moita, T., 2012.
Phytoplannkton dynamics in southern Portuguese coastal lagoons during a discontinuous period of 40
years: An overview. Estuar. Coastal Shelf S. 110, 147-156.
Bronk, D.A., See, J. H., Bradley, P., Killberg L., 2007. DON as a source of bioavailable nitrogen for phytoplankton.
Biogeosciences 4, 283–296.
Camino-Ordás, M., Fraga, S., Franco, J.M., Ordás, A., Figureas, A., 2004. Toxin and molecular analysis of
Gymnodinium catenatum (Dinophyceae) strains from Galicia (NW Spain) and Andalucia (S Spain). J.
Plankton Res. 26 (3), 341–349.
Campbell, P.G.C., Guiguère, A., Bonneris, E., Hare, L., 2005. Cadmium-handling strategies in teo chronically
exposed indigenous freshwater organisms - the yellow perck (Perca flavescens) and the floater mollusc
(Pyganon grandis). Aquat. Toxicol. 72, 73-97.
Carmichael, W.W., 1997. The cyanotoxins. In: J. Callow (Ed.), Advances in Botanical Research, 27, Academic Press,
London, pp. 211–256.
Carvalho, M., Jacinto, J., Ramos, N., Oliveira, V., Pinho e Melo, T., Sá, J., 1998. Paralytic shellfish poisoning:
clinical and electrophysiological observations. J. Neurol. 245 (8), 551-554.

References
162
Carvalho, S., Gaspar, M.B., Moura, A., Vale, C., Antunes, P., Gil, O., Cancela da Fonseca, L., Falcão, M., 2006. The
use of the marine biotic index AMBI in the assessment of the ecological status of the Óbidos lagoon
(Portugal). Mar. Pollut. Bull. 52, 1414-1424.
Carvalho, S., Pereira, P., Pereira, F., de Pablo, H., Vale, C., Gaspar, M.B., 2011. Factors structuring temporal and
spatial dynamics of macrobenthic communities in a eutrophic coastal lagoon (Óbidos lagoon, Portugal).
Mar. Environ. Res. 71, 97-110.
Catterall, W.A., 1980. Neurotoxins that act on voltage-sensitive sodium channels in excitable membranes. Ann.
Rev. Pharmacol. Toxicol. 20, 15-42.
Cembella, A. D., Shumway, S. E., Larocque, R., 1994. Sequestering and putative biotransformation of paralytic
shellfish toxins by the sea scallop Placopecten magellanicus: seasonal and spatial scales in natural
populations. J. Exp. Mar. Biol. Ecol. 180, 1– 22.
Cembella, A. D., Shumway, S. E., Lewis, N. I., 1993. Anatomical distribution and spatiotemporal variation in
paralytic shellfish toxin composition in two bivalve species from the Gulf of Maine. J. Shellfish Res. 12,
389–403.
Cembella, A.D. , Todd, E., 1993. Seafood toxins of algal origin and their control in Canada. In: Algal Toxins in
Seafood and Drinking Water. E. R. Falconer (Ed.), Academic Press, San Diego, CA, pp. 129–144.
Cembella, A.D., Lewis, N.I.,Quilliam, M.A., 2000. The marine dinoflagellate Alexandrium ostenfeldii
(Dinophyceae) as the causative organism of spirolide shellfish toxins. Phycologia 39 (1), 67-74.
Cembella, A.D., Shumway, S.E., Larocque, R., 1994. Sequestering and putative biotransformation of paralytic
shellfish toxins by the sea scallop Placopecten magellanicus: seasonal and spatial scales in natural
populations. J. Exp. Mar. Biol. Ecol. 180, 1-22.
Cembella, A.D., Sullivan, J.J., Boyer, G.L., Taylor, F.J.R., Anderson, R.J., 1987. Variation in paralytic shellfish toxin
composition within the Protogonyaulax tamarensis/ catenella species complex; red tide dinoflagellates.
Biochem. Syst. Ecol. 15 (2), 171 -186.
Cho, Y., Ogawa, N., Takahashi, M., Lin, H-P., 2008. Purification and characterization of paralytic shellfish
toxin-transforming enzyme, sulfocarbamoylase I, from the Japanese bivalve Peronidia venulosa. Biochim.
Biophys. Acta, 1784 (9), 1277-1285.
Choi, M.-C., Hsieh, D.P.H., Lam, P.K.S., 2003. Field depuration and biotransformation of paralytic shellfish toxins
in scallop Chlamys nobilis and green-lipped mussel Perna viridis. Mar. Biol. 143, 927-934.
Choi, M.C., Yeung, L.W.Y., Siu, W.H.L., So, I.M.K., Jack, R.W., Hsieh, D.P.H., Wu, R.S.S, Lam, P.K.S., 2006.
Relationships between tissue concentrations of paralytic shellfish toxins and antioxidative responses of
clams, Ruditapes philippinarum. Mar. Pollut. Bull. 52, 572–597.
Chou, H.N., Chen, Y.M., Chen, C.Y., 2004. Variety of PSP toxins in four culture strains in Alexandrium minutum
collected from southern Taiwan. Toxicon 43 (3), 337–340.
Ciminello, P., Dell´Aversano, C., Dello lacovo, E., Fattorusso, E., Forni, M., Tartaglione, L., Yasumoto, T., Battocchi,
C., Giacobbe, M., Amorim, A., Penna, A., 2013. Investigation of toxin profile of Mediterranean and
Atlantic strains of Ostreopsis cf. siamensis (Dinophyceae) by liquid chromatography–high resolution mass
spectrometry. Harmful Algae 23, 19-27.
Cloern, J.E., 2001. Our evolving conceptual model of coastal eutrophication problem. Mar. Ecol-Prog. Ser. 210,
223-253.
Connell, D.W., Miller, G.J., 1984. Chemistry and Ecotoxicology of Pollution. Environmental Science and
Technology. R.L. Metcalf, W. Stumm (Eds.), John Wiley & Sons, New York, pp. 444.
Contreras, A.M., Marsden, I.D., Munro, M.H.G., 2011. Effects of short-term exposure to paralytic shellfish toxins
on clearance rates and toxin uptake in five species of New Zealand bivalve. Mar. Freshwater Res. 63 (2),

References
163
166-174.
Correia, F.S., 1946. Um caso raro de intoxicação colectiva alimentar. Boletim do Instituto Superior de Higiene Dr.
Ricardo Jorge 3, 216-221.
Cortés-Altamirano, R., Hernández-Becerril, D.U., Luna-Soria, R. 1996. Red Tides in México: A Review. In
Yasumoto, T., Oshima, Y., Fukuyo, T. (Eds.) Harmful and Toxic Algal Blooms. IOC-UNESCO, pp. 101-104.
Costa, P.R., Botelho, M.J., Lefebvre, K.A., 2010. Characterization of paralytic shellfish toxins in seawater and
sardines (Sardina pilchardus) during blooms of Gymnodinium catenatum. Hydrobiologia 655, 89-97.
De Zwart, L.L., Meerman, J.H.N., Commandeur, J.N.M., Vermeulen, N.P.E., 1999. Biomarkers of free radical
damage: applications in experimental animals and in humans. Free Radical Bio. Med. 26, 202–226.
Deeds, J.R., Landsberg, J.H., Stacey M. Etheridge, S.M., Pitcher, G.C., Longan, S.W., 2008. Non-traditional vectors
for paralytic shellfish poisoning. Marine Drugs 6, 308-348.
del Amo, Y., Le Pape, O., Tréguer, P., Quéguiner, B., Ménesguen, A., Aminot, A., 1997. Impacts of high-nitrate
freshwater inputs on macrotidal ecosystems. I. Seasonal evolution of nutrient limitation for the diatom
dominated phytoplankton of the Bay of Brest (France). Mar. Ecol-Prog. Ser. 161, 213-224.
Despacho nº23597/2006. Diário da República nº 223/2006 de 20 de Novembro de 2006, 2ª Série, Ministério da
Agricultura e do Mar.
DGPA, 2011. Statistics Portugal and General Directorate of Fisheries and Aquaculture, INE, I.P., Lisboa, 104 pp.
DGRM, 2012. Statistics Portugal and General Directorate of Natural Resources, Safety and Maritime Services,
INE, I.P., Lisboa, 130 pp.
Domingues, R.B., Barbosa, A., Galvão, H., 2005. Nutrients, light and phytoplankton succession in a temperate
estuary (the Guadiana, south-western Iberia). Estuar. Coastal Shelf S. 64, 249-260.
Donovan, C.J., Ku, J.C., Quilliam, M.A., Gill, T.A., 2008. Bacterial degradation of paralytic shellfish toxins. Toxicon
52, 91-100.
Draisci, R., Lucentini, L., Giannetti, L., Boria, P., Poletti, R., 1996. First report of pectenotoxin-2 (PTX-2) in algae
(Dinophysis fortii) related to seafood poisoning in Europe. Toxicon 34 (8), 923-935.
Durbin, E., Teegarden, G., Campbell, R., Cembella, A., Baumgartner, M.F., Mate, B.R., 2002. North Atlantic right
whales, Eubalaena glacialis, exposed to paralytic shellfish poisoning (PSP) toxins via a zooplankton vector,
Calanus finmarchicus. Harmful Algae 1 (3), 243-251.
EC (European Commission), 1996. Commission Decision 96/77/EC, Official Journal L 15, 20/01/1996, pp. 46-47.
EC (European Commission), 2000. Directive 2000/60/EC of the European Parliament and of the Council of 23
October 2000 Establishing a Framework for Community Action in the Field of Water Policy. Official
Journal L 327, 22/12/2000, pp. 1-73.
EC (European Commission), 2008. Directive 2008/56/EC of the European Parliament and of the Council of 17
June 2008, establishing a framework for community action in the field of marine environmental policy
(Marine Strategy Framework Directive). Off J Eur Union L164, pp.19-40.
EFSA (European Food Safety Authority), 2009. Scientific opinion of the panel on contaminants in the food chain
on a request from the European Commission on marine biotoxins in shellfish-saxitoxin group. European
Food Safety Authority Journal 1019, 1-76.
Estrada, M., 1995. Dinoflagellate assemblages in the Iberian upwelling area. In: Lassus, P., Arzul, G., Erard, E.,
Gentien, P., Marcaillou, C. (Eds.), Harmful Marine Algal Blooms. Lavoisier, Paris, pp. 157–162.
Estrada, N.A., Lagos, N., Garcia, C., Maeda-Martínez, A.N., Ascencio, F., 2007. Effects of the toxic dinoflagellate
Gymnodinium catenatum on uptake and fate of paralytic shellfish poisons in the Pacific giant lions-paw
scallop Nodipecten subnodosus. Mar. Biol. 151, 1205-1214.
Etheridge, S.M., 2010. Paralytic shellfish poisoning: Seafood safety and human health perspectives. Toxicon 56,

References
164
108-122.
Etheridge, S.M., Roesler, C. S., 2005. Effects of temperature, irradiance and salinity on photosynthesis, growth
rates, total toxicity, and toxin composition for Alexandrium fundyense isolates from the Gulf of Maine
and Bay of Fundy. Deep-Sea Res. Pt. II 52, 2491-2500.
Falcão, M., Vale, C., 2003. Nutrient dynamics in a coastal lagoon (Ria Formosa, Portugal): the importance of
lagoon-sea water exchanges on the biological productivity. Cienc. Mar. 29(3), 425-433.
FAO (Food and Agriculture Organization of the United Nations), 2004. Marine Biotoxins, FAO Food and Nutrition
Paper, 80. Food and Agriculture Organization of the United Nations, Rome, 278 pp.
FAO (Food and Agriculture Organization of the United Nations), 2012. State of World Aquaculture 2012.
Fisheries and Aquaculture Department, Food and Agriculture Organization of the United Nations, Rome.
Available at: http://www.fao.org/docrep/016/i2727e/
FAO (Food and Agriculture Organization of the United Nations), 2013. Species Fact Sheets: Cerastoderma edule.
Available at: http://www.fao.org/ http://www.fao.org/
search/en/?cx=018170620143701104933%3Aqq82jsfba7w&q=Cerastoderma+edule&cof=FORID%3A9
Fast, M.D., Cembella, A.D., Ross, N.W., 2006. In vitro transformation of paralytic shellfish toxins in the clams
Mya arenaria and Protothaca staminea. Harmful Algae 5 (1), 79-90.
Ferreira, J.G., Saurel, C., Lencart e Silva, J.D., Nunes, J.P., Vazquez, F., 2014. Modelling of interactions between
inshore and offshore aquaculture. Aquaculture 426-427, 154-164.
Fisher, T.R., Harding Jr., L.W., Stanley, D.W., Ward, L.G., 1988. Phytoplankton, nutrients and turbidity in the
Chesapeake, Delaware and Hudson estuaries. Estuar. Coastal Shelf S. 27, 61-93.
Fiúza, A.F.G., 1983. Upwelling patterns off Portugal. In: Suess, E., Thiede, J. (Eds.), Coastal Upwelling: Its
Sediment Record. Pleanum Press, New York, pp. 85-98.
Flynn, K., Franco, J.M., Fernández-Vila, P., Reguera, B., Zapata, M., Wood, G., Flynn, K.J., 1994. Changes in toxin
content, biomass and pigments of the dinoflagellate Alexandrium minutum during nitrogen refeeding
and growth into nitrogen or phosphorus stress. Mar. Ecol. Prog. Ser. 111 , 99-109.
Flynn, K.J., Flynn, K., John, E.H., Reguera, B., Reyero, I., Franco, J.M., 1996. Changes in toxins, intracellular and
dissolved free amino acids of the toxic dinoflagellate Gymnodinium catenatum in response to changes in
inorganic nutrients and salinity. J. Plankton Res. 18 (11), 2093-2111.
Fraga, S., Anderson, D.M., Bravo, I., Reguera, B., Steidinger, K.A., Yentsch, C.M., 1998. Influence of upwelling
relaxation on dinoflagellates and shellfish toxicity in Ria de Vigo, Spain. Estuar. Coastal Shelf S. 27 (4),
349-361.
Franca, S., Almeida, J.F., 1989. Paralytic shellfish poisons in bivalve molluscs on the Portuguese coast caused by
a bloom of the dinoflagellate Gymnodinium catenatum. In: Okaichi, T., Anderson, D.M., Nemoto, (Eds.),
Red Tides: Biology, Environmental Science and Toxicology. Elsevier, New York, pp. 89–92.
Franco, J.M., Fernandez, P., Reguera, B., 1994. Toxin profiles of natural populations and cultures of Alexandrium
minutum Halim from Galician (Spain) coastal waters. J. Appl. Phycol. 6, 275-279.
Gago-Martínez, A., Moscoso, S. A., Martins, Martins, J.M.L., Vazquez, J.A.R., Niedzwiadek, B., Lawrence, J.F.
(2001). Effect of pH on the oxidation of paralytic shellfish poisoning toxins for analysis by liquid
chromatography J. Chromatogr. A 905, 351–357.
Galimany, E., Sunila, I., Hégaret, H., Ramón, M., Wikfors, G.H., 2008. Experimental exposure of the blue mussel
(Mytilus edulis, L.) to the toxic dinoflagellate Alexandrium fundyense: Histopathology, immune responses,
and recovery. Harmful Algae 7, 702-711.
Gaspar, M.B., Ferreira, R., Monteiro, C.C., 1999. Growth and reproductive cycle of Donax Trunculus L., (Mollusca:
Bivalvia) off Faro, southern Portugal. Fis. Res. 41 (3), 309-316.

References
165
Genenah, A.A., Shimizu, Y. , 1981. Specific toxicity of paralytic shellfish poisons. J. Agric. Food Chem. 29 (6),
1289–1291.
Gersen, A., Pol-Hofstad, I.E., Poelman, M., Mulder, P.P.J., van der Top, H.J., Boer, J., 2010. Marine Toxins:
Chemistry, toxicity, occurrence and detection, with special reference to the Dutch situation. Toxins 2,
878-904.
Gessner, B.D., Middaugh, J., 1980. Paralytic shellfish poisoning in Alaska: a 20-year retrospective analysis. Am. J.
Epidemiol. 141, 766-770.
Glibert, P.M., Wazniak, C.E., Hall, M.R., Sturgis, B., 2007. Seasonal and interannual trends in nitrogen and brown
tide in Maryland’s coastal bays. Ecol. Appl. 17(5), S79-S87.
Granéli, E., Flynn, K., 2006. Chemical and physical factors influencing toxin content. In: Granéli, E., Turner, J.
(Eds.), Ecology of Harmful Algae. Springer, Heidelberg, Germany, pp. 229-241.
Grasshoff, K., Ehrhardt, M. and Kremling, M., 1983. Methods of Seawater Analysis, Verlag Chemie, Weinheimer ,
419 pp.
Haberkorn, H., Lambert, C., Le Goïc, N., Moal, J., Suquet, M., Guéguen,M., Sunila, I.,Soudant, P., 2010. Effects of
Alexandrium minutum exposure on nutrition-related processes and reproductive output in oysters
Crassostrea gigas. Harmful Algae 9 (5), 427-439.
Hallegraeff, G.M., Anderson, D.M., Cembella, AD (Eds.), 1995. Manual on harmful marine microalgae, IOC
Manuals and Guides Nº 33, UNESCO, 249 pp.
Hallegraeff, G.M., Blackburn, S.I., Doblin, M.A., Bolch, C.J.S., 2012. Global toxicology, ecophysiology and
population relationships of the chainforming PST dinoflagellate Gymnodinium catenatum. Harmful Algae
14, 130-143.
Halstead, B.W., Schantz, E.J., 1984. Paralytic shellfish poisoning. World Health Organization publication nº79, pp
60.
Hansen, P.J., Fenchel, T., 2006. The bloom-forming ciliate Mesodinium rubrum harbours a single permanent
endosymbiont. Mar. Biol. Res. 2, 169-177.
Hattenrath, T.K., Anderson, D.M., Gobler, C.J., 2010. The influence of anthropogenic nitrogen loading and
meteorological conditions on the dynamics and toxicity of Alexandrium fundyense blooms in a New York
(USA) estuary. Harmful Algae 9, 402-412.
Hauxwell, J., Valiela, I., 2004. Effects of nutrient loading on shallow seagrass-dominated coastal systems:
patterns and processes. In: Nielsen, S.L., Banta, G.T., Pedersen, M.F. (Eds.), Estuarine Nutrient Cycling:
The influence of primary producers. Kluwer Academic Publishers, London, pp. 59-92.
Heisler, J., Glibert, P.M., Burkholder, J.M., Anderson, D.M., Cochlan, W.P., Dennison, W.C., Dortch, Q., Gobler, C.J.,
Heil, Humphries, E., Lewitus, A., Magnien, R., Marshall, H.G., Sellner, K., Stockwell, D.A., Suddleson, M.,
2008. . Harmful algal blooms and eutrophication: a scientific consensus. Harmful Algae 8, 3-13.
Holmes, M.J., Bolch, C.J.S, Green, G.H., Cembella, A.D., Teo, S.L.M., 2002. Singapure isolates of the
dinoflagellate Gymnodinium catenatum (Dinophyceae) produce a unique profile of paralytic shellfish
poisoning toxins. J. Phycology 38 (1), 96-106.
i2727e.pdf
Ichimi, K., Suzuki, T., Ito, K., 2001. Variety of PSP toxin profiles in various culture strains of Alexandrium
tamarense and change of toxin profile in natural A. tamarense population. J. Exp. Mar. Biol. Ecol. 273,
51-60.
IPCC (Intergovernmental Panel of Climate Change), 2014. Climate Change 2014: Impacts, Adaptation and
Vulnerability. Avaliable at: http://www.ipcc.ch/report/ar5/wg2/
ISO 11905-1 (1997). Water quality. Determination of nitrogen-Part I: Method using oxidative digestion with

References
166
peroxodisulfate.
Jiang, T., Wang, D, Niua, T., Xua, Y., 2007. Trophic transfer of paralytic shellfish toxins from the cladoceran
(Moina mongolica) to larvae of the fish (Sciaenops ocellatus). Toxicon 50, 639-645.
Joaquim, S., Matias, D., Lopes, B., Arnold, W.S., Gaspar, M.B., 2008. The reproductive cycle of clam Spisula
solida (L.) (Mollusca: Bivalvia): Implications for aquaculture and wild stock management, Aquaculture
281 (1-4), 43-48.
John, E.H., Flynn, K.J., 2000. Growth dynamics and toxicity of Alexandrium fundyense (Dinophyceae): the effect
of changing N:P supply ratios on internal toxin and nutrient levels. European J. Phycology 35 (1), 11-23.
Kamiyama, T., Suzuki, T., 2009. Production of dinophysistoxin-1 and pectenotoxin-2 by a culture of Dinophysis
acuminata (Dinophyceae). Harmful Algae 8, 312-317.
Kao, C.Y., 1966. Tetrodotoxin, saxitoxin and their significance in the study of excitation phenomena. Pharmacol.
Rev. 18, 997-1049.
Kao, C.Y., 1993. Paralytic shellfish poisoning. In: Falconer, I.R. (Ed), Algal toxins in seafood and drinking water.
Academic Press, New York, pp. 75-86.
Kennish, M.J., Bricker, S.B., Dennision, W.C., Glibert, P.M., Livingston, R.J., Moore, K.A., Noble, R.T., Paerl, H.W.,
Ramstack, J.M., Seitzinger, S., Tomasko, D.A., Valiela, I., 2007. Barnegat Bay-Little Egg Harbor Estuary:
case study of a highly eutrophic coastal bay system. Ecol. Appl. 17 (5), S3-S16.
Kodama, M., Ogata, T., Sakamoto, S., 1990. Possible association of marine bacteria with paralytic shellfish
toxicity of bivalves. Mar. Ecol. Prog. Ser. 61, 203-206.
Koehn, F.E., Hall, S., Whichmann, C.F., Schnoes, H.K., Reichard, P.B., 1982. Dinoflagellate neurotoxins related to
saxitoxin: Structure and latent activity of toxins B1 and B2. Tetrahedron Lett. 23,2247-2248.
Koroleff, F., 1983. Simultaneous oxidation of nitrogen and phosphorus compounds by persulfate. In: K. Grasshoff,
M. Eberhardt, K. Kremling (Eds.), Methods of Seawater Analysis. 2nd
edition, Verlag Chimiei, Weinheimer,
pp. 168-169.
Kotaki, Y., Oshima, Y., Yasumoto, T., 1985. Bacterial transformation of paralytic shellfish toxins. In: Anderson,
D.M., , A.W., Baden, D.G. (Eds.), Toxic Dinoflagellates. Elsevier Science Publishers, New York, pp. 287-292.
Krock, B., Seguel C.G., Cembella, A.D., 2007. Toxin profile of Alexandrium catenella from the Chilean coast as
determined by liquid chromatography with fluoresce detection and liquid chromatography coupled with
tandem mass spectrometry. Harmful Algae 6, 734-744.
Landberg, J.H.,2002 The effects of harmful algal blooms on aquatic organisms. Rev. Fisheries Sci. 10 (2),
113-390.
Lansberg, J.H., Flewelling, L.J., Naar, J., 2009. Karenia brevis red tides, brevetoxins in the food web, and impacts
on natural resources: Decadal advancements. Harmful Algae 8 (4), 598-607.
Lawrence, J.F., Menard, C., Charbonneu, C.F., 1991. A study of ten toxins associated with paralytic shellfish
poison using prechromatographic oxidation and liquid chromatography with fluorescence detection. J.
AOAC Int. 74, 404-409.
Lawrence, J.F., Menard, C., Cleroux, C., 1995. Evaluation of prechromatographic oxidation for liquid
chromatographic determination of paralytic shellfish poisons in shellfish. J. AOAC Int. 78, 514-520.
Lawrence, J.F., Niedzwiadek, B., 2001. Quantitative determination of paralytic shellfish poisoning toxins in
shellfish by using prechromatographic oxidation and liquid chromatography with fluorescence detection.
J. AOAC Int. 84, 1099-1108.
Lawrence, J.F., Niedzwiadek, B., Menard, C., 2005. Quantitative determination of paralytic shellfish poisoning
toxins in shellfish using prechromatographic oxidation and liquid chromatography with fluorescence
detection: collaborative study, J. AOAC Int. 88, 1714–1732.

References
167
Lefebvre, K. A., Trainer, V. L., Scholz, N.L., 2004. Morphological abnormalities and sensorimotor deficits in larval
fish exposed to dissolved saxitoxin. Aquat. Toxicol. 66 (2), 159-170.
Leong, S. C.Y ., Murata, A., Nagashima, Y., Taguchi, S., 2004. Variability in toxicity of the dinoflagellate
Alexandrium tamarense in response to different nitrogen sources and concentrations. Toxicon 43 (4),
407-415.
Li, A.M.Y., Yu, P.K.N., Hsieh, D.P.H., Wang, W., Wu, R.S.S., 2005. Uptake and depuration of paralytic shellfish
toxins in the green-lipped mussel, Perna Viridis: a dynamic model. Environ. Toxicol. Chem. 24 (1),
129-135.
Lillebø, A. I., Neto, J. M., Martins, I., Verdelhos, T., Leston, S., Cardoso, P. G., Ferreira, S. M., Marques, J. C.,
Pardal, M. A., 2005. Management of a shallow temperate estuary to control eutrophication: the effect of
hydrodynamics on the system nutrient loading. Estuar. Coastal Shelf S. 65, 697-707.
Lillebø, A.I., Flindt, M.R., Pardal, M.A., Martins, I., Neto, J.M., Marques, J.C., 2002. Nutrient dynamics in the
intertidal pools of the Mondego Estuary. II - Seasonal efflux of PO4-P and NH4-N in bare bottom and
vegetated pools. In: Aquatic ecology of the Mondego River Basin. Global importance of local experience.
Imprensa da Universidade de Coimbra, 257-272.
Lillebø, A.I., Teixeira, H., Pardal, M.A., Marques, J.C., 2007. Applying quality status criteria to a temperate
estuary before and after the mitigation measures to reduce eutrophication symptoms. Estuar. Coastal
Shelf S. 72, 177-187.
Lin, H.-P., Cho, Y., Yashiro, H., Yamada, T., Oshima, Y., 2004. Purification and characterization of paralytic shellfish
toxin transforming enzyme from Mactra chinensis. Toxicon 44:657-668.
Litaker, R.W., Vandersea, M.W., Faust, M.A., Kibker, S.R., Nau, A.W., Holland, W.C., Chinain, M., Holmes, M.J.,
Tester, P.A., 2010. Global distribution of ciguatera causing dinoflagellates in the genus Gambierdiscus.
Toxicon 56 (5), 711-730.
Llewellyn, L.E., 2006. Saxitoxin, a toxic marine natural product that targets a multitude of receptors. Nat. Prod.
Rep. 23, 200-222.
Loader, J.I.; Hawkes, A.D.; Beuzenberg, V.; Jensen, D.J.; Cooney, J.M.; Wilkins, A.L.; Fitzgerald, J.M.; Briggs, L.R.;
Miles, C.O., 2007. Convenient large-scale purification of yessotoxin from Protoceratium reticulatum
culture and isolation of a novel furanoyessotoxin. J. Agric. Food Chem. 55, 11093–11100.
Lopes, C.B., Lillebø, A.I., Dias, J.M., Pereira, E., Vale, C., Duarte, A.C., 2007. Nutrient dynamics and seasonal
succession of phytoplankton assemblages in a Southern European Estuary: Ria de Aveiro, Portugal.
Estuar. Coastal Shelf S. 71, 480-490.
Lorenzen, C.J., 1966. A method for the continuous measurement of in vivo chlorophyll concentration. Deep-Sea
Res. 13, 223-227.
MacKenzie, A.L.; Beuzenberg, V.; Holland, P.T.; McNabb, P.; Suzuki, T.; Selwood, A., 2005. Pectenotoxin and
okadaic acid-based toxin profiles in Dinophysis acuta and Dinophysis acuminata from New Zealand.
Harmful Algae 4, 75-85.
MacKenzie, L.; de Salas, M.; Adamson, J.; Beuzenberg, V. , 2004. The dinoflagellate genus Alexandrium (Halim)
in New Zealand coastal waters: comparative morphology, toxicity and molecular genetics. Harmful Algae
3, 71-92.
Malhadas, M.S., Leitão, P.C., Silva, A., Neves, R., 2009. Effect of coastal waves on sea level in Óbidos lagoon,
Portugal. Cont. Shelf Res. 29, 1240-1250.
MAMAOT, 2011. Plano de Ordenamento do Espaço Marítimo, Ministério da Agricultura, Mar, Ambiente e
Ordenamento do Território, Outubro de 2011. Avaliable at: http://www.dgpm.mam.gov.pt/Pages/
POEM_PlanoDeOrdenamentoDoEspacoMarinho.aspx

References
168
Martin, J.L., Hanke, A.R., LeGresley, M.M., 2009. Long term phytoplankton monitoring, including harmful algal
blooms, in the Bay of Fundy, eastern Canada. J. Sea Res. 61, 76-83.
Masó, M., Garcés, E., 2006. Harmful microalgae blooms (HAB); problematic and conditions that induce them.
Mar. Pollut. Bull. 53, 620-630.
Mauriz, A., Blanco, J., 2010. Distribution and linkage of domoic acid (amnesic shellfish poisoning toxins) in
subcellular fractions of the digestive gland of the scallop Pecten maximus. Toxicon 55, 606-611.
Mee, L.D., Espinosa, M., Diaz, G., 1986. Paralytic shellfish poisoning with Gymnodinium catenatum red tide on
the Pacific coast of Mexico. Mar. Environ. Res. 19, 77–92.
Miles, C.O.; Wilkins, A.L.; Stirling, D.J.; MacKenzie, A.L., 2003. Gymnodimine C, an isomer of gymnodimine B,
from Karenia selliformis. J. Agric. Food Chem. 51, 4838–4840.
Mohammad-Noor, N., 2010. First record of toxic Gymnodinium catenatum off the west coast of Sabah, Malaysia.
In: K-C. Ho, M.J. Zhou, Y.Z. Qi (Eds.), Harmful Algae 2008. International Society for the Study of Harmful
Algae & Environmental Publication House, Hong Kong, China, pp. 25–29.
Moita, M.T., da Silva, A.J., 2001. Dynamics of Dinophysis acuta, D. acuminata, D. tripos and Gymnodinium
catenatum during an upwelling event off the northwest coast of Portugal. In: Hallegraeff, G.M.,
Blackburn, S.I., Bolch, C.J., Lewis, R.J. (Eds.), Harmful Algal Blooms 2000. Intergovernmental
Oceanographic Commission of UNESCO, Paris, pp. 169–172.
Moita, M.T., Oliveira, P.B., Mendes, J.C., Palma, A.S., 2003. Distribution of chlorophyll a and Gymnodinium
catenatum associated with coastal upwelling plumes off central Portugal. Acta Oecol. 24, S125-S132.
Moita, M.T., Sobrinho-Gonçalves, L., Oliveira, P.B., Palma, S., Falcão, M., 2006. A bloom of Dinophysis acuta in a
thin layer off North-West Portugal. Afr. J. of Mar. Sci. 28, 265-269.
Moita, M.T., Vilarinho, M.G., Palma, A.S., 1998. On the variability of Gymnodinium catenatum Graham blooms in
Portuguese waters. In: B. Reguera, J. Blanco, M.L. Fernández, T. Wyatt (Eds.). Harmful Algae. Xunta de
Galicia and Intergovernmental Oceanographic Commission of UNESCO, pp. 118-121.
Mons, M.N., van Egmond, H.P., Speijers, G.J.A, 1998. Paralytic shellfish poisoning: a review. Report nr.
388802005, National Institute of Public Health and the Environment, Bilthoven, The Netherlands, 47 pp.
Moore, M.N., 1988. Cytochemical responses of the lysosomal system and NADPH-ferrihemoprotein reductase
in molluscan digestive cells to environmental and experimental exposure to xenobiotics. Mar. Ecol. Prog.
Ser. 46, 81-89.
Moore, S.K.; Trainer, V.L.; Mantua, N.J.; Parker, M.S.; Laws, E.A.; Backer, L.C.; Fleming, L.E., 2008. Impacts of
climate variability and future climate change on harmful algal blooms and human health. Environ. Health.
7, S4.
Moroño, A., Franco, J., Miranda, M., Reyero, M.I., Blanco, J., 2001. The effect of mussel size, temperature,
seston volume, food quality and volume-specific toxin concentration on the uptake rate of PSP toxins by
mussels (Mytilus galloprovincialis Lmk). J. Exp. Mar. Biol. Ecol., 257 (1), 117-132.
Nascimento, S.M., Purdie, D.A., Morris, S., 2005. Morphology, toxin composition and pigment content of
Prorocentrum lima strains isolated from a coastal lagoon in southern UK. Toxicon 45, 633-639.
Negri, A.P., Bolch, C.J.S., Blackburn, S.I., Dickman, M., Llewellyn, L.E. , Mendez, S. 2001. Paralytic shellfish toxins
in Gymnodinium catenatum strains from six countries. Proceedings of the 9th International Conference -
Harmful Algal Blooms 2000, February 2000, Hobart, Tasmania.
Negri, A.P., Bolch, C.J.S., Geier, S., Green, D.H., Park, T., Blackburn, S.I., 2007. Widespread presence of
hydrophobic paralytic shellfish toxins in Gymnodinium catenatum. Harmful Algae 6, 774–780.
Newton, A., Mudge, S.M., 2005. Lagoon-sea exchanges, nutrient dynamics and water quality management of
the Ria Formosa (Portugal). Estuar. Coastal Shelf S. 62, 405-414.

References
169
Ogata, T., Kodama, M., Komaru, K., Sakamota, S., Sato, S., Simidu, U., 1990. Production of paralytic shellfish
toxins by bacteria isolated from toxic dinoflagellates. In: E. Graneli, B. Sundstrom,L. Edler, D.M. Anderson
(Eds.), Toxic Marine Phytoplankton. Elsevier, New York, pp. 311–315.
Oh, S.J., Yamamoto, T., Kataoka, Y., Matsuda, O., Matsuyama, Y., Kotani, Y., 2002. Utilisation of dissolved organic
phosphorus by the two toxic dinoflagellates, Alexandrium tamarense and Gymnodinium catenatum
(Dinophyceae). Fish. Sci. 68, 416–424.
Oliveira, A., Fortunato, A.B., Rego, J.R.L., 2006. Effect of morphological changes on the hydrodynamics and
flushing properties of the Óbidos lagoon (Portugal). Cont. Shelf Res. 26, 917-942,
Oliveira, M.M., Camanho, A.S., Gaspar, M. B., 2013. The influence of catch quotas on the productivity of the
Portuguese bivalve dredge fleet. ICES J. Mar. Sci., 1-11.
Ordás, M.C., Fraga, S., Franco, J.M., Ordás, A., Figureas, A., 2004. Toxin and molecular analysis of Gymnodinium
catenatum (Dinophyceae) strains from Galicia (NW Spain) and Andalucia (S Spain). J. Plankton Res. 26 (3),
341–349.
Oshima, Y., 1995a. Post-column derivatisation liquid chromatography method for paralytic shellfish toxins. J.
AOAC Int. 78, 528-532.
Oshima, Y., 1995b. Chemical and enzymatic transformation of paralytic shellfish toxins in marine organisms. In:
Lassus, P., Arzul, G., Erard, E., Gentien, P., Marcaillou, C. (Eds.), Harmful Marine Algae Blooms. Intercept
Ltd., pp. 475-480.
Oshima, Y., Blackburn, S., Hallegraeff, G., 1993. Comparative study on paralytic shellfish toxin profiles of the
dinoflagellate Gymnodinium catenatum from three different countries. Mar. Biol. 116, 471-476.
Oshima, Y., Hasegawa, M., Yasumoto, T., Hallegraeff, G., Blackburn, S., 1987. Dinoflagellate Gymnodinium
catenatum as the source of paralytic shellfish toxins in Tasmanian shellfish. Toxicon 25, 1105-1111.
Oshima, Y., Sugino, K., Itakura, H., Hiraota, M., Yasumoto, T., 1990. Comparative studies on paralytic shellfish
toxin profile of dinoflagellates and bivalves. In: Granéli, E., Sundstrom, B., Edler, L., Anderson, D.M. (Eds.),
Toxic Marine Phytoplankton. Elsevier, Amsterdam, pp. 479-485.
Owen, G., 1972. Lysosomes, peroxisomes and bivalves. Sci. Prog., Oxf. 60, 299-318.
Park, M.G., Kim, S., Kim, H.S., Myung, G., Kang, Y.G., Yih, W., 2006. First successful culture of the marine
dinoflagellate Dinophysis acuminata. Aquat. Microb. Ecol. 45, 101–106.
Park, T.G., Kim, C.H., Oshima, Y., 2004. Paralytic shellfish toxin profiles of different geographic populations of
Gymnodinium catenatum (Dinophyceae) in Korean coastal waters. Phycol. Res. 52, 300–305.
Paz, B., Riobó, Pilar, Fernández, M.L., Fraga, S., Franco, J.M., 2004. Production and release of yessotoxins by the
dinoflagellates Protoceratium reticulatum and Lingulodinium polyedrum in culture. Toxicon 44, 251-258.
Pereira, P., Botelho, M.J., Cabrita, M.T., Vale, C., Moita, M.T., Gonçalves, C., 2012. Winter-summer nutrient
composition linkage to algae-produced toxins in shellfish at a eutrophic coastal lagoon (Óbidos lagoon,
Portugal). Estuar. Coastal Shelf S. 12, 61-72.
Pereira, P., de Pablo, H., Carvalho, C., Vale, C., Pacheco, M., 2010. Daily availability of nutrients and metals in a
eutrophic meso-tidal coastal lagoon (Óbidos lagoon, Portugal). Mar. Pollut. Bull. 60, 1868-1872.
Pereira, P., de Pablo, H., Subida, M.D., Vale, C., Pacheco, M., 2009c. Biochemical responses of the shore crab
(Carcinus maenas) in a eutrophic and metal-contaminated coastal system (Óbidos lagoon, Portugal). Ecot.
Environ. Safe. 72, 1471-1480.
Pereira, P., de Pablo, H., Vale, C., Franco, V., Nogueira, M., 2009a. Spatial and seasonal variation of water quality
in an impacted coastal lagoon (Óbidos Lagoon, Portugal). Envir. Monit. Assess. 153, 281-292.
Pereira, P., de Pablo, H., Vale, C., Rosa-Santos, F., Cesário, R., 2009b. Metal and nutrient dynamics in a eutrophic
coastal lagoon (Óbidos, Portugal): the importance of observations at different time scales. Environmental

References
170
Monitoring and Assessment 158, 405-418.
Pérez-Ruzafa, A., Fernández, A.I., Marcos, C., Gilabert, J., Quispe, J.I., García-Charton, J.A., 2005. Spatial and
temporal variations of hydrological conditions, nutrients and chlorophyll a in a Mediterranean coastal
lagoon (Mar Menor, Spain). Hydrobiologia 550, 11-27.
Pinto, J.S., Silva, E.S., 1956. The toxicity of Cardium edule L. and its possible relation to the dinoflagellate
Prorocentrum micans Ehr. Notas e Estudos do Instituto de Biologia Marítima 12, 1-20.
Pitcher, G. C., Figueiras, F.G., Hickey, B.M., Moita, M.T., 2010. The physical oceanography of upwelling systems
and the development of harmful algal blooms. Prog. Oceanogr. 85, 5-32.
Poulton, N.J., Keafer, B.A., Anderson, D.M., 2005. Toxin variability in natural populations of Alexandrium
fundyense in Casco Bay, Maine-evidence of nitrogen limitation. Deep-sea Res. Pt. II 52, 2501-2521.
Quevauviller, P., Morabito, R., 2000. Evaluation of extraction recoveries of organo-metallics determinations in
environmental matrices. Trends Anal. Chem. 19, 86-96.
Quilliam MA. 2007. Supplemental information for PSP toxin certified reference materials. National Research
Council Certified Reference Materials Program, Institute for Marine Biosciences, Canada.
Raimundo, J., Vale, C., Duarte, R., Moura, I., 2008. Sub-cellular partitioning of Zn, Cu, Cd and Pb in the digestive
gland of native Octopus vulgaris exposed to different metal concentrations (Portugal). Sci. Total Environ.
390, 410-416.
Rhodes, L., McNabb, P., de Salas, M., Briggs, L., Beuzenberg, V., Gladstone, M., 2006 Yessotoxin production by
Gonyaulax spinifera. Harmful Algae 5 (2), 148-155.
Rocha, C. Galvão, H., Barbosa, A., 2002. Role of transient silicon limitation in the development of cyanobacteria
blooms in the Guadiana estuary, south-western Iberia. Mar. Ecol-Progr. Ser. 228, 35-45.
Rogers , R.S., Rapoport, H., 1980. The pKa´s of saxitoxin. J. Am. Chem. Soc. 102 (24), 7335–7339.
Rossignoli, A.E., Blanco, J., 2010. Subcellular distribution of okadaic acid in the digestive gland of Mytilus
galloprovincialis: First evidences of lipoprotein binding to okadaic acid. Toxicon 55, 221-226.
Rufino, M.M., Gaspar, M.B., Maynou, F., Monteiro, C.C., 2008. Regional and temporal changes in bivalve
diversity off the south coast of Portugal. Estuar. Coastal Shelf S. 80, 517-528.
Salas, Tillmann, U., John,U., Kilcoyne, J., Burson, A., Cantwell, C., Hess, P., Jauffrais, T., Silke, J., 2011. The role of
Azadinium spinosum (Dinophyceae) in the production of azaspiracid shellfish poisoning in mussels.
Harmful Algae 10 (6), 774-783.
Sampayo, M.A.M, Franca, S., Alvito, P., Vale, P., Botelho, M.J., Rodrigues, S., Vieira, A., 1997. Dez anos de
monitorização de biotoxinas marinhas em Portugal (1986-1996). Arquivos do Instituto Nacional de Saúde
23, 187-194.
Samsur, M., Takatani, T., Yamaguchi, Y., Sagara, T., Noguchi, T., Arakawa, O., 2007. Accumulation and elimination
profiles of paralytic shellfish poison in the short-necked calm Tapes japonica fed with the toxic
dinoflagellate Gymnodinium catenatum. J. Food. Hyg. Soc. Japan 48, 13-18.
Samsur, M., Yamaguchi, Y., Sagara, T., Takatani, T., Arakawa, O., Noguchi, T., 2006. Accumulation and depuration
profiles of PSP toxins in the short-necked clam Tapes japonica fed with the toxic dinoflagellate
Alexandrium catenella. Toxicon 48, 323-330.
Santos, A.M.P., Borges, M.F., Groom, S., 2001. Sardine and horse mackerel recruitment and upwelling off
Portugal. ICES J. Mar. Sci. 58, 589-596.
Schantz, E.J., Mold, J.D., Stanger, D.W., Shavel, J., Bowden, F.J.P., Lynch, J.M. Whyler, R.S., Riegel, B.R., Sommer,
H., 1957. Paralytic shellfish poison VI. A procedure for the isolation and purification of the poison from
toxic clams and mussel tissues. J. Am. Chem. Soc. 97, 1238-1239.
Schantz, E.J.; Ghazarossian, V.E.; Schnoes, H.K.; Strong, F.M.; Springer, J.P.; Pezzanite, J.O.; Clardy, J. , 1975.

References
171
Structure of saxitoxin. J. Am. Chem. Soc. 97, 1238–1239.
Scholin, C.A., Gulland, F., Doucette, G.J., Benson, S., Busman, M., Chavez, F.P., Cordaro, J., DeLong, R., De
Vogelaere, A., Harvey, J., Haulena, M., Lefebvre, K., Lipscomb, T., Loscutoff, S., Lowenstine, L.J., Marin III,
R., Miller, P.E., McLellan, W.A., Moeller, P.D.R., Rowles, T.; Silvagni, P.; Silver, M.; Spraker, T.; Trainer, V.;
Van Dolah, F. M., 2000. Mortality of sea lions along the central California coast linked to a toxic diatom
bloom. Nature 430, 80-84.
Sekiguchi, K., Sato, S., Ogata, T., Kaga, S., Kodama, M., 2001. Accumulation and depuration kinetics of paralytic
shellfish toxins in the scallop Patinopecten yessoensis fed Alexandrium tamarense. Mar. Ecol. Progr. Ser.
220, 213-218.
Sellner, K.G., Doucette, G.J., Kirkpatrick, G.J., 2003. Harmful algal blooms: causes, impacts and detection. J. Ind.
Microbiol. Biotechnol. 30, 383-406.
Shimizu, Y., 2000. Chemistry and mechanism of action. In: L.M. Botana(Ed). Seafood and freshwater toxins,
Marcel Dekker, New York, pp. 151-172.
Shimizu, Y., Yoshioka, M., 1981. Transformation of paralytic shellfish toxins as demonstrated in scallop
homogenates. Science 212, 547-549.
Shumway, S. E., Sherman, S. A., Cembella, A. D, Selvin, R., 1994. Accumulation of paralytic shellfish toxins by
surfclams, Spisula solidissima (Dilwyn, 1897) in the Gulf of Maine: seasonal changes, distribution
between tissues, and notes on feeding habits. Nat. Toxins 2, 236–251.
Shumway, S.E., Cucci, T.L., 1987. The effects of the toxic dinoflagellate Protogonyaulax tamarensis on the
feeding and behaviour of bivalve molluscs. Aquat. Toxicol. 10(1), 9-27.
Silva, E.S., Peixoto, M.E., 1987. Factores ecológicos relacionados com duas “marés vermelhas” na Lagoa de
Óbidos. Arquivos do Instituto Nacional de Saúde 12, 129-168.
Silvert, W.L., Cembella, A.D., 1995. Dynamic modeling of phycotoxin kinetics in marine invertebrates. Can. J. Fish.
Aquat. Sci. 52, 521-531.
Slomp, C.P, Malschaert, J.F., Van Raaphorst, W., 1998. The role of absorption in sediment-water exchange of
phosphate in North Sea continental margin sediments. Limn. Oceanography 43, 832-846.
Smayda, T.J., Trainer, V.L., 2010. Donoflagellate blooms in upwelling systems: Seeding, variability, and contrasts
with diatom bloom behaviour. Prog. Ocean. 85, 92-107.
Smith, E.A.; Grant, F.; Ferguson, C.M.J.; Gallacher, S., 2001. Biotransformations of paralytic shellfish toxins by
bacteria isolated from bivalve molluscs. Appl. Environ. Microbiol. 67, 2345–2353.
Sommer, H., Meyers, K.F., 1937. Paralytic shellfish poisoning. Arch. Pathol. 24, 560-598.
Sousa, I., Alvito, P., Franca, S., Sampayo, M.A.M., Martinez, A. Gago, Rodriguez-Vazquez, J.A., 1995. Data on
paralytic shellfish toxins related to recent Gymnodinium catenatum blooms in Portugal coastal waters. In:
Lassus, P., Arzul, G., Erard, E., Gentien, P., Marcaillou, C. (Eds.), Harmful Marine Algal Blooms,
Lavoisier/Intercept, Paris, pp. 825-829.
Sullivan, J.J., Iwaoka, W.T., Liston, J., 1983. Enzymatic transformation of PSP toxins in the littleneck clam
(Protothaca staminea). Biochem. Biophys. Res. Commun. 114, 465–472.
Sundby, B., 2006. Transient state diagenesis in continental margin muds. Mar. Chem. 102, 2-12.
Taft, J.L., Loftus, M.E.,Taylor, W.R., 1977. Phosphate uptake from phosphomonoesters by phytoplankton in the
Chesapeake Bay, Limn. Oceanography 22, 1012-1021.
Thessen, A., Stoecker, D., 2008. Distribution, abundance, and domoic acid anlysis of the toxic diatom genus
Pseudo-nitzschia from the Chesapeake Bay. Estuar. Coasts 31, 664-672.
Tilman, D., Kilham, S.S., Kilham, P., 1982. Phytoplankton community ecology: the role of limiting nutrients.
Annua. Rev. Ecol. Syst. 13, 349-372.

References
172
Touzet, N., Franco, J.M., Raine, R., 2007. Influence of inorganic nutrition on growth and PSP toxin production of
Alexandrium minutum (Dinophyceae) from Cork Harbour, Ireland. Toxicon 50, 106-119.
Touzet, N., Franco, J.M., Raine, R., 2008. Morphogenetic diversity and biotoxin composition of Alexandrium
(Dinophyceae) in Irish coastal waters. Harmful Algae 7 (6), 782-797.
Trainer, V.L., Eberhart, B.-T.L., Wekell, J.C., Adams, N.A., Hanson, L., Cox, F., Dowell, J., 2003. Paralytic shellfish
toxins in Puget Sound, Washington State. J. Shellfish Res. 22, 213-224.
Tran, D., Haberkorn, H., Soudant, P., Ciret, P., Massabuau, J., 2010. Behavioral responses of Crassostrea gigas
exposed to the harmful algae Alexandrium minutum. Aquaculture 298, 338-345.
Turner, A.D., Norton, D.M., Hatfield, R.G., Morris, S., Reese, A.R., Algoet, M., Lees, D.N., 2009. Single laboratory
validation of the AOAC HPLC method (2005.06) for mussels: refinement and extension of the method to
additional toxins. J. AOAC Int. 92 (1) 190–207.
Turner, A.D., Stubbs, B., Coates, Dhanji-Rapkova, M., Hatfield, R.G., Lewis, A.M., Rowland-Pilgrim, O´Neil, A.,
Stubbs, P., Ross, S., Baker, C., Algoet, M., 2014. Variability of paralytic shellfish toxin occurrence and
profiles in bivalve molluscs from Great Britain from official control monitoring as determined by
pre-column oxidation liquid chromatography and implications for applying immunochemical tests.
Harmful Algae 31, 87-99.
Twarog, B. M., T. Hidaka, T., Yamaguchi, H., 1972. Resistance to tetrodotoxin and saxitoxin in nerves of bivalves
molluscs. Toxicon 10, 273–278 .
Usup, G., Ahmad, A., Matsuoka, Lim, P.T., Leaw, C.P., 2012. Biology, ecology and bloom dynamics of the toxic
marine dinoflagellate Pyrodinium bahamense. Harmful Algae 14, 301-312.
Uthermöl, H., 1958. Zur vervollkommung der quantitativen phytolankton-methodik.
Mitteilungen-Internationale Vereinigung für Theoretische und Angewandte Limnologie 9, 1-39.
Vale, C., Alfonso, A., Vieytes, M.R., Romaris, X.M., Arévalo, F., Botana, A.M., Botana, L.M., 2008. In vitro and in
vivo evolution of paralytic shellfish poisoning toxin potency and the influence of the pH of extration.
Anal. Chem. 80, 1770-1776.
Vale, P., 2008. Fate of benzoate paralytic shellfish poisoning toxins from Gymnodinium catenatum in shellfish
and fish detected by pre-column oxidation and liquid chromatography with fluorescence detection. J.
Chromatogr. A 1190, 191-197.
Vale, P., Botelho, M.J., Rodrigues, S.M., Gomes, S.S., Sampayo, M.A.M., 2008.Two decades of marine biotoxin
monitoring in bivalves from Portugal (1986-2006): a review of exposure assessment. Harmful Algae 7,
11-25.
Vale, P., Sampayo, M.A.M., 2001. Determination of paralytic shellfish toxins in Portuguese shellfish by
automated pre-column oxidation. Toxicon 39 (4), 561–571.
Vale, P., Sampayo, M.A.M., 2002. Esterification of DSP toxins by Portuguese bivalves from the Northwest coast
determined by LC-MS - a widespread phenomenon. Toxicon 40, 33-42.
Van Dolah, F.M., 2000. Marine algal toxins: Origins, health effects, and their increased occurrence. Environ.
Health Perspect. 108, 133–141.
Viarengo, A., Moore, M.N., Mancinelli, G., Mazzucotelli, A., Pipe, R.K., Farrar, S.V., 1987. Matallothioneins and
lysosomes in metal toxicity and homeostasis in marine mussels: the effects of cadmium in the presence
and the absence of phenanthrene. Mar. Biol. 94, 251-257.
Voet, D., Voet, J.G., 1990. Biochemistry, John Wiley and Sons, Canada.
Waiwood, B. A., Haya, K., Martin, J.L., 1995. Depuration of paralytic shellfish toxins by giant scallops from the
Bay of Fundy, Canada. In: Harmful Marine Algal Blooms. P. Lassus, G. Arzul, E. Erard-Le Denn, P. Gentien,
C. Marcaillou- LeBaut (Eds.). Lavoisier Publishers, Paris, pp. 525–530.

References
173
Wang, D., 2008. Neurotoxins from marine dinoflagellates: A brief review. Marine Drugs 6, 349-371.
Ward, J.E., Levinton, J.S., Shumway, S.E., 2003. Influence of diet on pre-ingestive particle processing in bivalves. I:
Transport velocities on the ctenidium. J. Exp. Mar. Biol. Ecol. 293, 129-149.
White, A.W., 1981. Sensitivity of marine fishes to toxins from the red tide dinoflagellate Gonyaulax excavata and
implications for fish kills. Mar. Biol. 65, 255-260.
Wiese, M., D'Agostino, P.M., Mihali, T.K., Moffitt, M.C., Neilan, B.A., 2010. Neurotoxic alkaloids: Saxitoxin and its
analogs. Marine Drugs 8, 2185-2211.
Wildish, D., Lassus, P., Martin, J., Saulnier, A., Bardouil, M., 1998. Effect of the PSP-causing dinoflagellate,
Alexandrium sp. on the initial feeding response of Crassostrea gigas. Aquat. Living Resour. 11, 35-43.
Wooster, W.S., Bakun, A., McLain, D.R., 1976. The seasonal upwelling cycle along the eastern boundary of the
North Atlantic. J. Mar. Res. 34, 131-141.
Yamamoto, T., Oh, S.J., Kataoka, Y., 2004. Growth and uptake kinetics for nitrate, ammonium and phosphate by
the toxic dinoflagellate Gymnodinium catenatum isolate from Hiroshima Bay, Japan. Fish. Sci. 70, 108–
115.
Yan, T., Zhou, M., Fu, M., Yu, R., Wang, Y., Li, J., 2003. Effects of the dinoflagellate Alexandrium tamarense on
early development of the scallop Argopecten irradians concentricus. Aquaculture 217, 167-178.
Yasomoto, T., 2001. The chemistry and biological function of natural marine toxins. The Chemical Record 1,
228-242.
Yu, K.N., Choi, M.C., Shen, X., Wu, R.S.S., Wang, W.-X., Lam, P.K.S., 2005. Modeling of depuration of paralytic
shellfish toxins in Chlamys nobilis and Perna viridis. Mar. Pollut. Bull. 50, 463-484.
Yu, K.N., Kwong, R.W.M., Wang, W.-X., Lam, P.K.S, 2007. Biokinetics of paralytic shellfish toxins in the
green-lipped mussel, Perna viridis. Mar. Poll. Bull. 54, 1031-1071.
Zingone, A., Enevoldsen, H.O, 2000. The diversity of harmful algal blooms: a challenge for science and
management. Ocean Cost. Manag. 43, 725-748.


![4: Zootoxins (toxins of animals) [Biological-origin toxins]](https://static.fdocuments.net/doc/165x107/61cddf54f2b98d6a6b5b05e1/4-zootoxins-toxins-of-animals-biological-origin-toxins.jpg)