O-CRESOL CAS N°: 95-48-7 - inchem.orginchem.org/documents/sids/sids/95487.pdf · oecd sids o-cresol
Marine Renewable Energy in the Republic of Mauritius:
A Case Study Perspective
Authors: Hallie Cramer, Cassidee Kido, Brandon Morrison, and Dhara Patel
Advisors: Jonas Monast, Christina Reichert, and John Virdin

2
1.Introduction
1.1MAURITIUSLANDSCAPE The Republic of Mauritius, with a population of roughly 1.3 million, is located in
the South West Indian Ocean. As a Small Island Developing State (SIDS), Mauritius deals with unique energy issues relating to its geography and size. As an island nation, its remote location has limited demand and serves a constrained market position. There is a huge reliance on imported fossil fuels and petroleum products, accounting for about 75% of its energy mix, leading to high electricity costs. Along with a multitude of other imports, heavy reliance on imported fossil fuels makes Mauritius vulnerable to international economic fluctuations and creates a dependency on other nations that fosters an environment where long-term development is hard to implement (Kristoferson, 1985). Even though Mauritius is an upper-middle income country, with a GDP hovering around $12 billion, there is restricted government funding. Because of this limitation, the country, along with many other SIDS, depends on the technology and innovation of larger countries. However, 2016 World Bank rankings have placed Mauritius as number 32 out of 189 economies for their enabling business environment, an attractive prospect for new businesses (World Bank, 2016). Now, Mauritius is looking to establish itself as a world leader in developing the Blue Economy, searching to know what role offshore marine renewables could play. The population is growing, and concurrently, energy demand continues to increase, especially within 60 km of the coasts where roughly 60% of the population resides (Carnegie, 2015). This signifies energy demand centers along the coasts. At the same time, the problems of climate change, particularly for island nations susceptible to sea level rise and natural disasters, intensify environmental concerns. The shift towards renewable energy technologies has never been stronger. Mauritius has established a set of goals within the Blue Economy roadmap. Within these goals are reduced energy costs and improved energy efficiency, energy security, reduced GHG emissions, and sustainable development (Ocean Roadmap, 2013). The idea is to develop the Blue Economy as a means to diversify the energy mix, alleviate poverty, and build social prosperity; however, within the realm of offshore energy, there are many unknowns. This paper seeks to dissolve some of these unknowns as well as identify specifically what these unknowns are for future research. With these goals and constraints in mind, we delve into case studies of marine renewable energy practices around the world to try to identify the feasibility and implications of implementing these novel technologies in Mauritius.
1.2OBJECTIVEANDMETHODOLOGYThe objective of this paper is to provide the World Bank and the University of
Mauritius with an analysis on the feasibility of developing and implementing offshore and coastal marine energy technologies in the Mauritius. This analysis uses comparative case studies to analyze various forms of marine renewable energy in nine different locations. Conclusions drawn from the assessment can help guide Mauritius in its journey towards a Blue Economy by highlighting current research, recognizing knowledge gaps, and explaining the extent to which that information can apply to Mauritius.
3
To approach this task, an outline was first developed to ensure that the end result would be helpful to the team at the World Bank. To choose the technologies and countries, our team relied on feedback from both the World Bank and the University of Mauritius to determine which technologies Mauritius was interested in pursuing, which technologies the World Bank was interested in learning more about, and which countries would provide a meaningful comparison for Mauritius.
This paper will analyze five different renewable energy technologies, including: offshore wind, wave energy, tidal energy, deep ocean water applications (DOWA), and floating photovoltaic. A brief section regarding algal biogas will be included in the appendix. The countries or islands that were either leaders in the field or doing work that would help contribute to the further distribution of these technologies were Block Island, Rhode Island (USA); Hawaii (USA), the Canary Islands (Spain), Scotland, Denmark, Japan, South Korea, Australia, and New Zealand. Each case study explores the specific drivers behind the pursuit of a certain offshore renewable energy technology and includes the stage of technology demonstration, specific site features unique to the area, electricity generation potential, financing methods, policy support, and if available, the costs associated with the projects.
1.3TECHNOLOGYSUMMARIES
1.3.1OffshoreWindEnergyOffshore wind energy is the most advanced form of marine renewable energy.
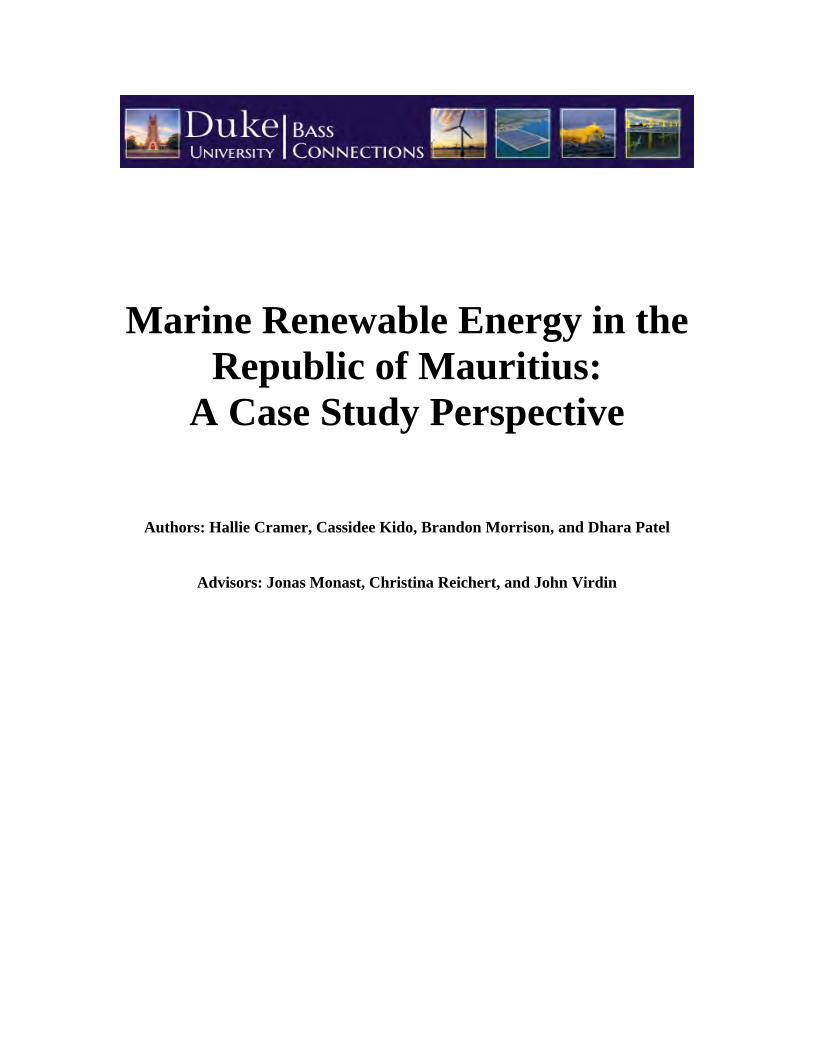
Development in offshore wind energy began in the shallow waters of the North Sea, whereby an abundance of suitable sites and higher wind resources were favorable by comparison with Europe’s land-based alternatives (Bilgili et al., 2011). Development has accelerated since 2003, when larger turbines became available, allowing developers to venture into greater water depths located farther from the shore (Mollera et al., 2012). Despite the accelerated development, offshore wind energy still represents a small proportion of the total wind energy in the world (Failla and Arena, 2016). Figure 1 depicts the ten largest existing offshore wind markets, sorted by country.
Figure1.Globalcumulativeoffshorewindcapacity.Ofexistingcapacity,92%islocatedwithinthe
EuropeanUnion(GWEC,2016).
4
Wind offshore is typically stronger, and more uniform, than on land. Resultantly, in comparison to land-based turbines, offshore turbines are larger, and therefore possess increased generation capacities. A typical offshore turbine has a nameplate capacity between two and five megawatts (MW), with tower heights greater than 200 feet. The engineering and design of offshore wind facilities depends on site-specific conditions, including water depth, wind speed, and the geology of the seabed (BOEM, 2016).
1.3.2WaveEnergyThe main piece of equipment used in wave energy is the Wave Energy Convertor
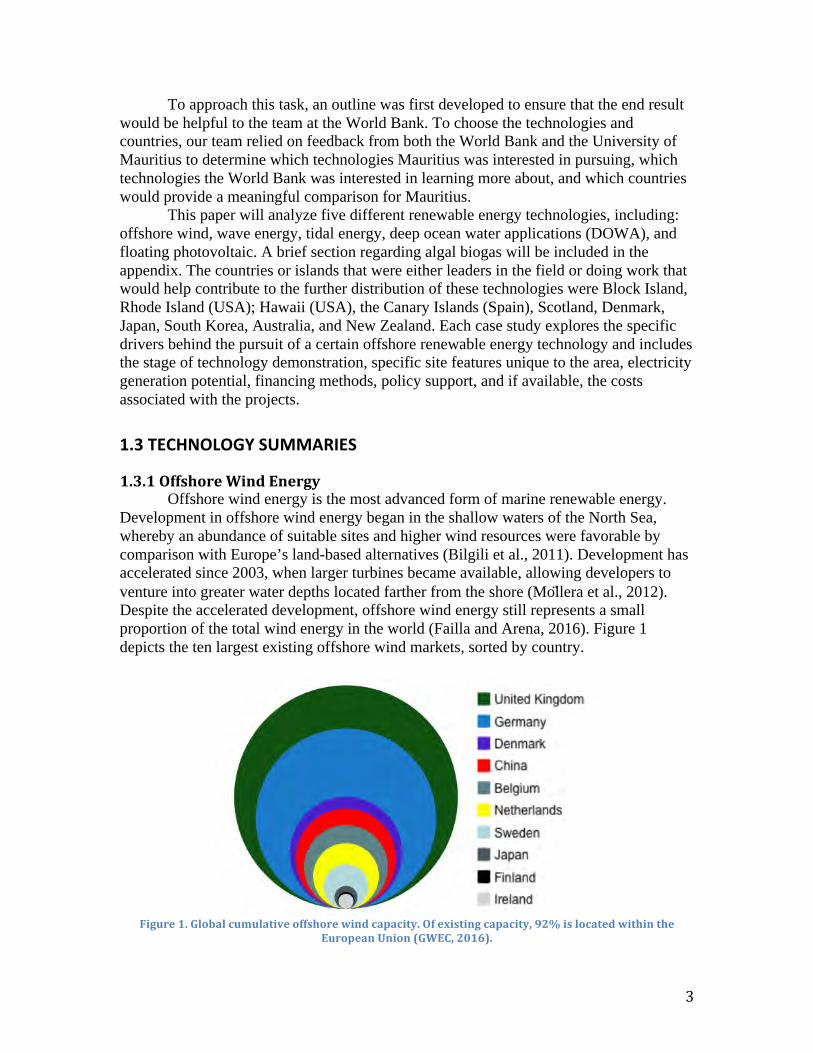
(WEC). There are over 100 pilot projects and demonstrations worldwide for different WECs, but only a small number are near commercialization. The projects closest to commercialization are undergoing smaller-scale open water tests throughout the duration of their life cycle, testing the device under a variety of stressors in all seasons. Individual devices within these stages range in capacity anywhere from 18 kW to 1 MW with capacity factors between 30% and 50%. However, the next step in the process is for demonstration farms, or wave energy arrays, to approach 10 MW (IRENA, 2014).
Figure2.Thistableshowsdifferentkindsofwaveenergydevicesandcertaincharacteristicsonemust
consider.SourcebyRusu,2014.
This resource is most abundant in areas where winds are strongest. Winds happen to be strongest between 40 and 60 degrees latitude. Nevertheless, there are other strong currents and trade winds outside of this range that result in very stable wave sources. Additionally, waves tend to be stronger in deeper waters. However, from a transmission and cost perspective, it is cheaper and more efficient to have power closer to shore, where the demand is. These factors explain why islands formed by volcanoes are ideal locations for this technology. These islands usually have narrow, steep continental shelves, leading to deep ocean waters nearshore and higher energy potential at lower costs (CSIRO, 2012).
There have been a couple reviews estimating the different costs associated with wave technological development. CSIRO in Australia conducted a 2012 study of wave energy uptake using a 2006 estimate of $7000/kW in capital costs and $17/MWh in variable operation and maintenance costs. The International Renewable Energy Agency (IRENA) predicted in 2014 the levelized cost of electricity (LCOE) for wave energy to be somewhere between $0.37 and $0.70 USD per kWh for 10MW deployment. They also
5
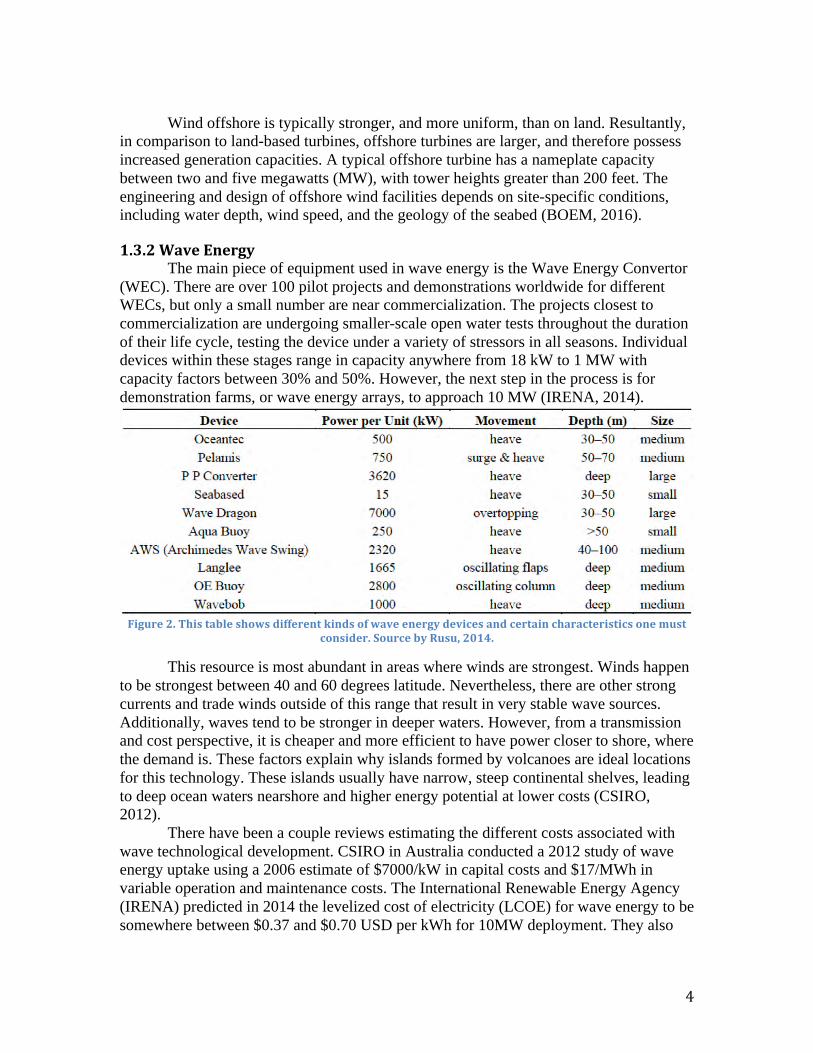
predict 2030 LCOE to decrease by around $0.30 per kWh if deployment can reach 2GW worldwide, forecasting a considerable scope for economies of scale.
Figure3.Thispiechartshowsthebreakdownofannualizedcostsforawavefarm.SourcebyCSIRO,
2012.
However, the current technological variance among devices results in a limited supply chain for components, increasing initial costs, but also enhancing the opportunity for manufacturing jobs and a new market sector. Major barriers hindering continuing development for certain WEC devices include a lack of synergy with other offshore industries, survivability issues, and prolonged permitting processes causing money shortages.
1.3.3TidalEnergy Currently, there are three different types of tidal technology.
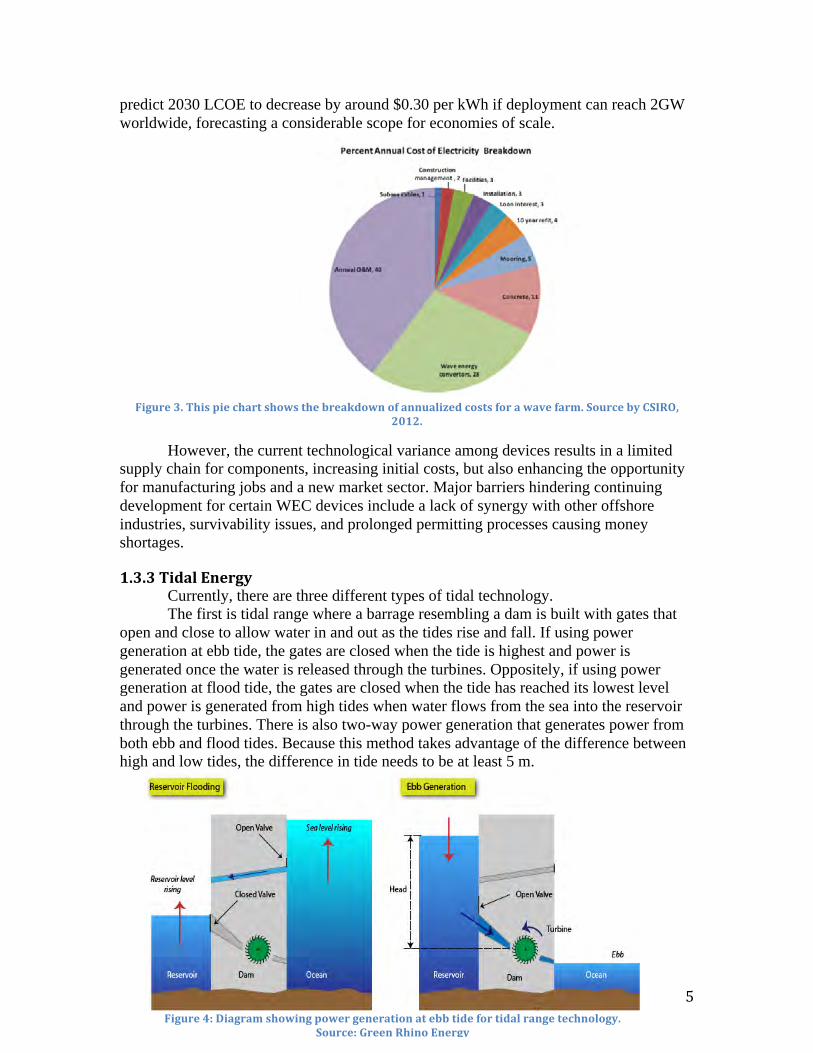
The first is tidal range where a barrage resembling a dam is built with gates that open and close to allow water in and out as the tides rise and fall. If using power generation at ebb tide, the gates are closed when the tide is highest and power is generated once the water is released through the turbines. Oppositely, if using power generation at flood tide, the gates are closed when the tide has reached its lowest level and power is generated from high tides when water flows from the sea into the reservoir through the turbines. There is also two-way power generation that generates power from both ebb and flood tides. Because this method takes advantage of the difference between high and low tides, the difference in tide needs to be at least 5 m.
Figure4:Diagramshowingpowergenerationatebbtidefortidalrangetechnology.Source:GreenRhinoEnergy
6
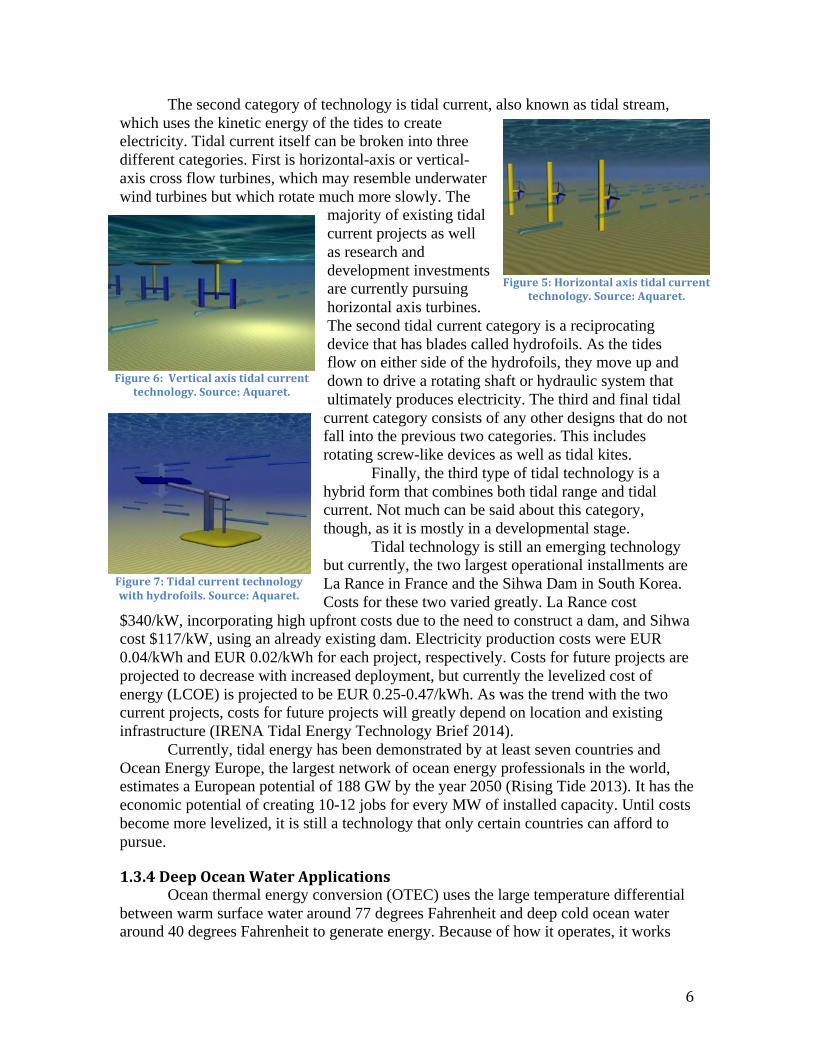
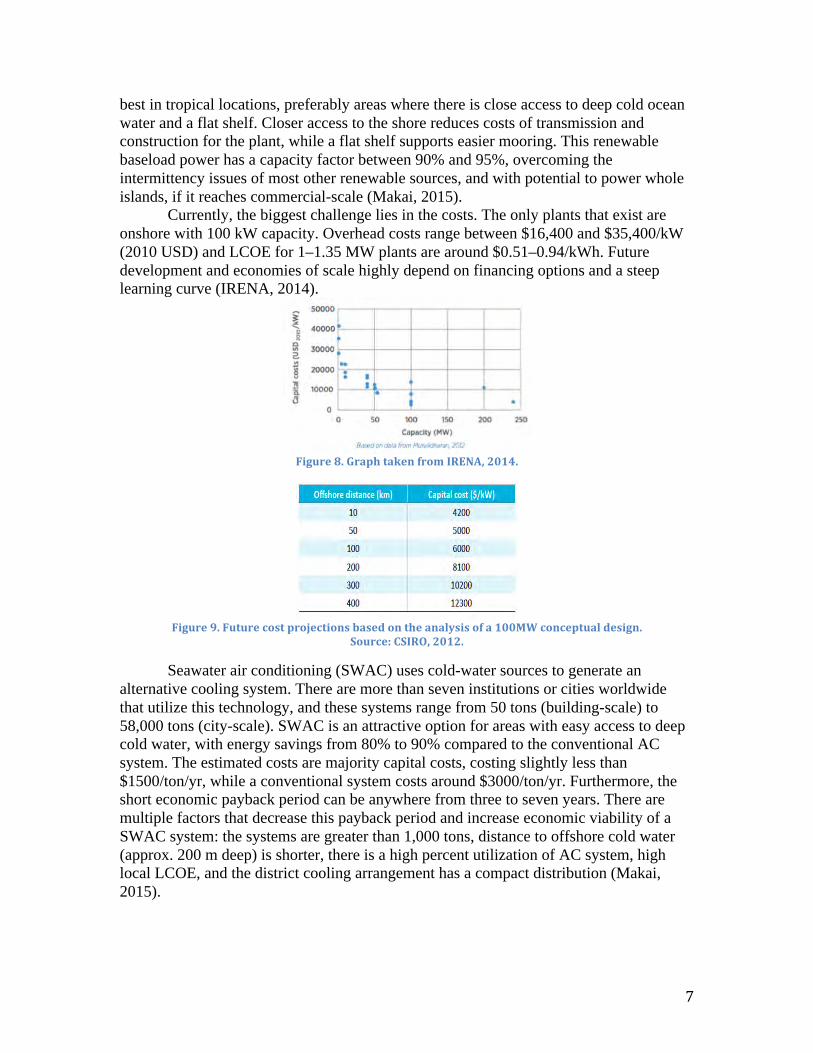
The second category of technology is tidal current, also known as tidal stream, which uses the kinetic energy of the tides to create electricity. Tidal current itself can be broken into three different categories. First is horizontal-axis or vertical-axis cross flow turbines, which may resemble underwater wind turbines but which rotate much more slowly. The
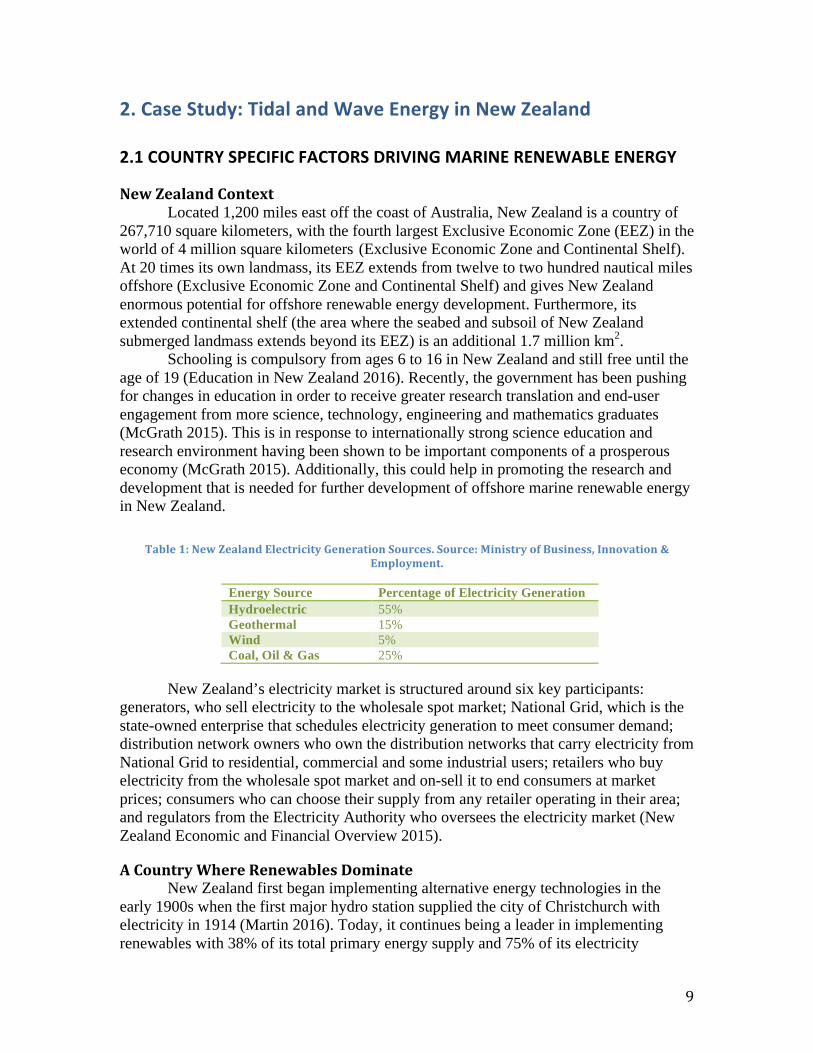
majority of existing tidal current projects as well as research and development investments are currently pursuing horizontal axis turbines. The second tidal current category is a reciprocating device that has blades called hydrofoils. As the tides flow on either side of the hydrofoils, they move up and down to drive a rotating shaft or hydraulic system that ultimately produces electricity. The third and final tidal current category consists of any other designs that do not fall into the previous two categories. This includes rotating screw-like devices as well as tidal kites.
Finally, the third type of tidal technology is a hybrid form that combines both tidal range and tidal current. Not much can be said about this category, though, as it is mostly in a developmental stage.
Tidal technology is still an emerging technology but currently, the two largest operational installments are La Rance in France and the Sihwa Dam in South Korea. Costs for these two varied greatly. La Rance cost
$340/kW, incorporating high upfront costs due to the need to construct a dam, and Sihwa cost $117/kW, using an already existing dam. Electricity production costs were EUR 0.04/kWh and EUR 0.02/kWh for each project, respectively. Costs for future projects are projected to decrease with increased deployment, but currently the levelized cost of energy (LCOE) is projected to be EUR 0.25-0.47/kWh. As was the trend with the two current projects, costs for future projects will greatly depend on location and existing infrastructure (IRENA Tidal Energy Technology Brief 2014).
Currently, tidal energy has been demonstrated by at least seven countries and Ocean Energy Europe, the largest network of ocean energy professionals in the world, estimates a European potential of 188 GW by the year 2050 (Rising Tide 2013). It has the economic potential of creating 10-12 jobs for every MW of installed capacity. Until costs become more levelized, it is still a technology that only certain countries can afford to pursue.
1.3.4DeepOceanWaterApplicationsOcean thermal energy conversion (OTEC) uses the large temperature differential
between warm surface water around 77 degrees Fahrenheit and deep cold ocean water around 40 degrees Fahrenheit to generate energy. Because of how it operates, it works
Figure5:Horizontalaxistidalcurrenttechnology.Source:Aquaret.
Figure6:Verticalaxistidalcurrenttechnology.Source:Aquaret.
Figure7:Tidalcurrenttechnologywithhydrofoils.Source:Aquaret.
7
best in tropical locations, preferably areas where there is close access to deep cold ocean water and a flat shelf. Closer access to the shore reduces costs of transmission and construction for the plant, while a flat shelf supports easier mooring. This renewable baseload power has a capacity factor between 90% and 95%, overcoming the intermittency issues of most other renewable sources, and with potential to power whole islands, if it reaches commercial-scale (Makai, 2015).
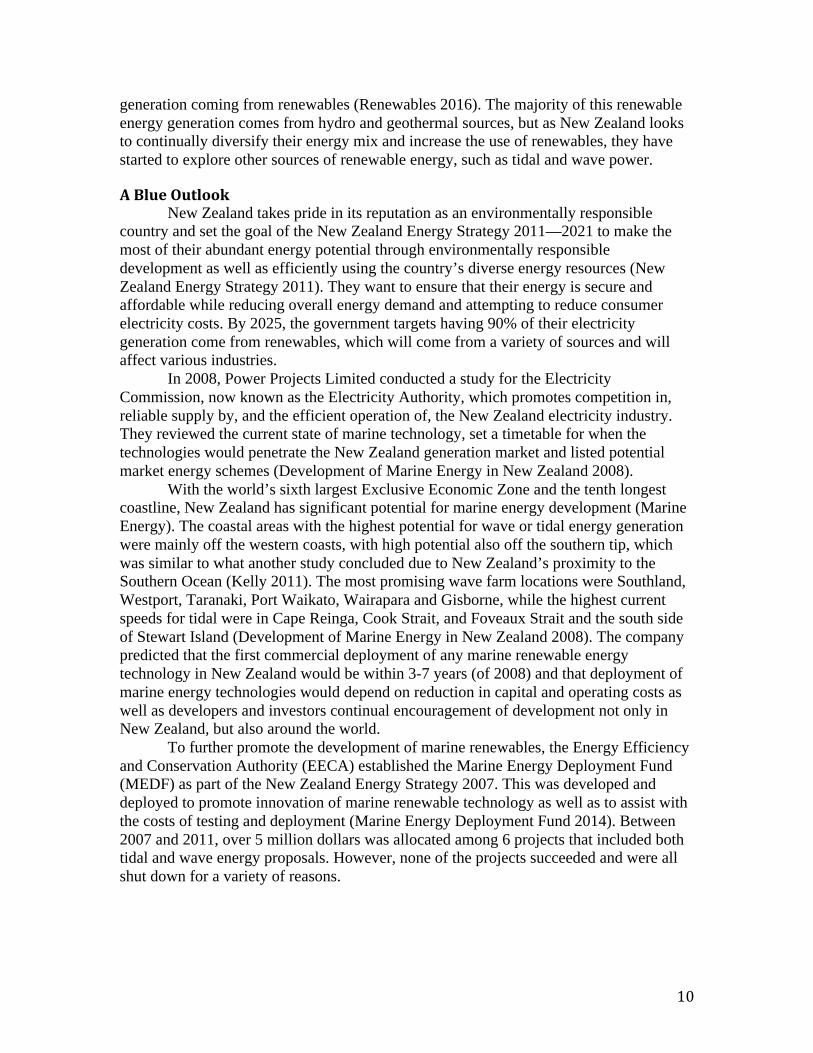
Currently, the biggest challenge lies in the costs. The only plants that exist are onshore with 100 kW capacity. Overhead costs range between $16,400 and $35,400/kW (2010 USD) and LCOE for 1–1.35 MW plants are around $0.51–0.94/kWh. Future development and economies of scale highly depend on financing options and a steep learning curve (IRENA, 2014).
Figure8.GraphtakenfromIRENA,2014.
Figure9.Futurecostprojectionsbasedontheanalysisofa100MWconceptualdesign.
Source:CSIRO,2012.
Seawater air conditioning (SWAC) uses cold-water sources to generate an alternative cooling system. There are more than seven institutions or cities worldwide that utilize this technology, and these systems range from 50 tons (building-scale) to 58,000 tons (city-scale). SWAC is an attractive option for areas with easy access to deep cold water, with energy savings from 80% to 90% compared to the conventional AC system. The estimated costs are majority capital costs, costing slightly less than $1500/ton/yr, while a conventional system costs around $3000/ton/yr. Furthermore, the short economic payback period can be anywhere from three to seven years. There are multiple factors that decrease this payback period and increase economic viability of a SWAC system: the systems are greater than 1,000 tons, distance to offshore cold water (approx. 200 m deep) is shorter, there is a high percent utilization of AC system, high local LCOE, and the district cooling arrangement has a compact distribution (Makai, 2015).

8
Figure10.MakaiOceanEngineering(2015)costchartsforSWACtechnology.
1.3.5FloatingPhotovoltaicThe system consists of mounted solar panels on a racking system, and floats on
pontoons that are secured by a mooring system (Mollman 2015). The design of the systems keeps all metallic components above water. The system leaves closed high-density polyethylene (HDPE) plastic floats in contact with water; these floats have been approved for use in drinking water reservoirs (WaterWorld 2016). Combined, these factors increase the durability of the system. These systems are engineered to withstand 181 mph winds and changes in water levels up to 20 feet (WaterWorld 2016). The cooler environment created from the water underneath the system reduces stress on the system, further extending its lifespan (Thurston 2012). Ciel et Terre is an example of floating platforms that are 100% recyclable and made of high-density polyethylene that can withstand ultraviolet rays and corrosion (Thurston 2012). This technology is specifically designed for lakes, reservoirs, and other inland water bodies that are close to grid connection and areas where the majority of electricity is consumed.
Floating solar grids generate up to 20% more energy than onshore solar grids because of the cooling effect of the water beneath the system (WaterWorld 2016). These grids create shade that in turn reduces water evaporation and algae growth, and are drought friendly because of the water they conserve. These systems are earthquake-proof, do not require heavy-duty equipment for assembly, and prevent energy waste through insulated connections between panels (WaterWorld 2016). These systems do not contain metal parts and are easy and relatively inexpensive to install when compared to traditional solar systems. Continued testing and research conducted by the National University of Malaysia demonstrates the improving efficiency of floating photovoltaic technologies. Upgraded systems pass water through a simple and cost-effective aluminum box at the back of the modules, generating more power.
Despite these positive aspects, however, floating photovoltaic technologies present certain challenges. The systems move considerably as a result of significant wind speeds, in turn negatively influencing the generation capacity of said projects.
9
2.CaseStudy:TidalandWaveEnergyinNewZealand
2.1COUNTRYSPECIFICFACTORSDRIVINGMARINERENEWABLEENERGY
NewZealandContext Located 1,200 miles east off the coast of Australia, New Zealand is a country of 267,710 square kilometers, with the fourth largest Exclusive Economic Zone (EEZ) in the world of 4 million square kilometers (Exclusive Economic Zone and Continental Shelf). At 20 times its own landmass, its EEZ extends from twelve to two hundred nautical miles offshore (Exclusive Economic Zone and Continental Shelf) and gives New Zealand enormous potential for offshore renewable energy development. Furthermore, its extended continental shelf (the area where the seabed and subsoil of New Zealand submerged landmass extends beyond its EEZ) is an additional 1.7 million km2. Schooling is compulsory from ages 6 to 16 in New Zealand and still free until the age of 19 (Education in New Zealand 2016). Recently, the government has been pushing for changes in education in order to receive greater research translation and end-user engagement from more science, technology, engineering and mathematics graduates (McGrath 2015). This is in response to internationally strong science education and research environment having been shown to be important components of a prosperous economy (McGrath 2015). Additionally, this could help in promoting the research and development that is needed for further development of offshore marine renewable energy in New Zealand.
Table1:NewZealandElectricityGenerationSources.Source:MinistryofBusiness,Innovation&Employment.
Energy Source Percentage of Electricity Generation Hydroelectric 55% Geothermal 15% Wind 5% Coal, Oil & Gas 25%
New Zealand’s electricity market is structured around six key participants: generators, who sell electricity to the wholesale spot market; National Grid, which is the state-owned enterprise that schedules electricity generation to meet consumer demand; distribution network owners who own the distribution networks that carry electricity from National Grid to residential, commercial and some industrial users; retailers who buy electricity from the wholesale spot market and on-sell it to end consumers at market prices; consumers who can choose their supply from any retailer operating in their area; and regulators from the Electricity Authority who oversees the electricity market (New Zealand Economic and Financial Overview 2015).
ACountryWhereRenewablesDominateNew Zealand first began implementing alternative energy technologies in the
early 1900s when the first major hydro station supplied the city of Christchurch with electricity in 1914 (Martin 2016). Today, it continues being a leader in implementing renewables with 38% of its total primary energy supply and 75% of its electricity
10
generation coming from renewables (Renewables 2016). The majority of this renewable energy generation comes from hydro and geothermal sources, but as New Zealand looks to continually diversify their energy mix and increase the use of renewables, they have started to explore other sources of renewable energy, such as tidal and wave power.
ABlueOutlook New Zealand takes pride in its reputation as an environmentally responsible country and set the goal of the New Zealand Energy Strategy 2011—2021 to make the most of their abundant energy potential through environmentally responsible development as well as efficiently using the country’s diverse energy resources (New Zealand Energy Strategy 2011). They want to ensure that their energy is secure and affordable while reducing overall energy demand and attempting to reduce consumer electricity costs. By 2025, the government targets having 90% of their electricity generation come from renewables, which will come from a variety of sources and will affect various industries.
In 2008, Power Projects Limited conducted a study for the Electricity Commission, now known as the Electricity Authority, which promotes competition in, reliable supply by, and the efficient operation of, the New Zealand electricity industry. They reviewed the current state of marine technology, set a timetable for when the technologies would penetrate the New Zealand generation market and listed potential market energy schemes (Development of Marine Energy in New Zealand 2008).
With the world’s sixth largest Exclusive Economic Zone and the tenth longest coastline, New Zealand has significant potential for marine energy development (Marine Energy). The coastal areas with the highest potential for wave or tidal energy generation were mainly off the western coasts, with high potential also off the southern tip, which was similar to what another study concluded due to New Zealand’s proximity to the Southern Ocean (Kelly 2011). The most promising wave farm locations were Southland, Westport, Taranaki, Port Waikato, Wairapara and Gisborne, while the highest current speeds for tidal were in Cape Reinga, Cook Strait, and Foveaux Strait and the south side of Stewart Island (Development of Marine Energy in New Zealand 2008). The company predicted that the first commercial deployment of any marine renewable energy technology in New Zealand would be within 3-7 years (of 2008) and that deployment of marine energy technologies would depend on reduction in capital and operating costs as well as developers and investors continual encouragement of development not only in New Zealand, but also around the world. To further promote the development of marine renewables, the Energy Efficiency and Conservation Authority (EECA) established the Marine Energy Deployment Fund (MEDF) as part of the New Zealand Energy Strategy 2007. This was developed and deployed to promote innovation of marine renewable technology as well as to assist with the costs of testing and deployment (Marine Energy Deployment Fund 2014). Between 2007 and 2011, over 5 million dollars was allocated among 6 projects that included both tidal and wave energy proposals. However, none of the projects succeeded and were all shut down for a variety of reasons.
11
2.2IMPLEMENTATIONCHALLENGES
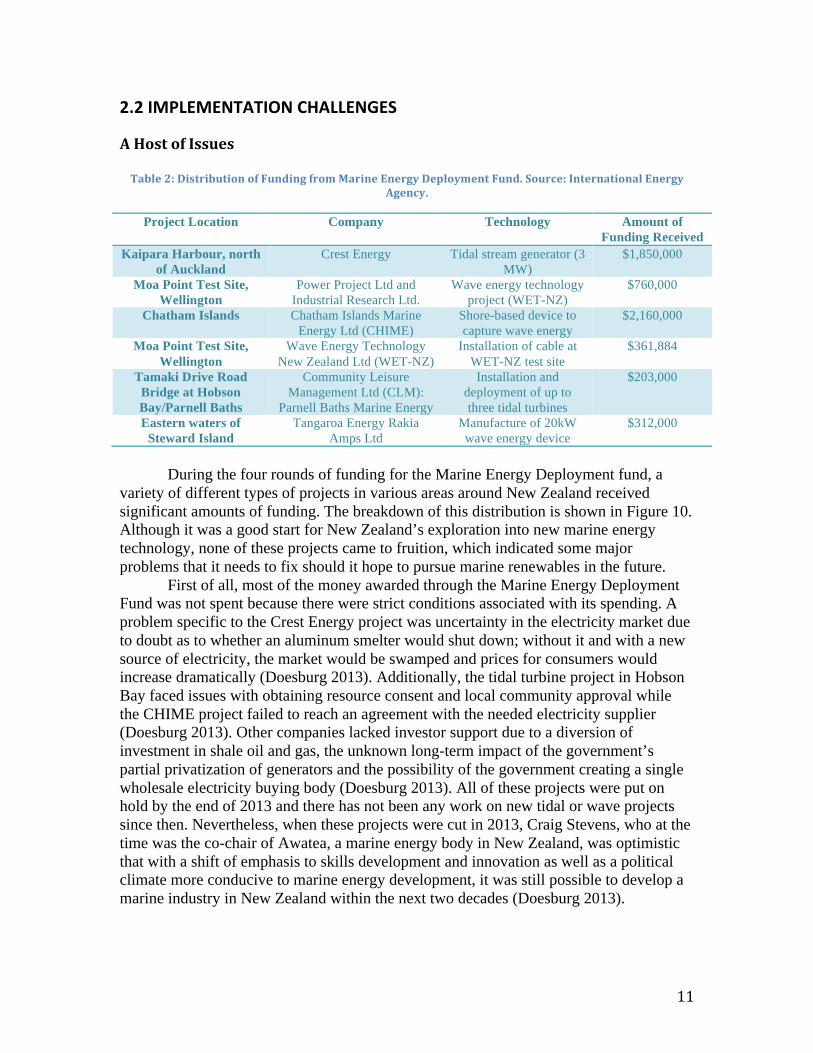
AHostofIssues Table2:DistributionofFundingfromMarineEnergyDeploymentFund.Source:InternationalEnergy
Agency.
Project Location Company Technology Amount of Funding Received
Kaipara Harbour, north of Auckland
Crest Energy Tidal stream generator (3 MW)
$1,850,000
Moa Point Test Site, Wellington
Power Project Ltd and Industrial Research Ltd.
Wave energy technology project (WET-NZ)
$760,000
Chatham Islands Chatham Islands Marine Energy Ltd (CHIME)
Shore-based device to capture wave energy
$2,160,000
Moa Point Test Site, Wellington
Wave Energy Technology New Zealand Ltd (WET-NZ)
Installation of cable at WET-NZ test site
$361,884
Tamaki Drive Road Bridge at Hobson Bay/Parnell Baths
Community Leisure Management Ltd (CLM):
Parnell Baths Marine Energy
Installation and deployment of up to three tidal turbines
$203,000
Eastern waters of Steward Island
Tangaroa Energy Rakia Amps Ltd
Manufacture of 20kW wave energy device
$312,000
During the four rounds of funding for the Marine Energy Deployment fund, a
variety of different types of projects in various areas around New Zealand received significant amounts of funding. The breakdown of this distribution is shown in Figure 10. Although it was a good start for New Zealand’s exploration into new marine energy technology, none of these projects came to fruition, which indicated some major problems that it needs to fix should it hope to pursue marine renewables in the future. First of all, most of the money awarded through the Marine Energy Deployment Fund was not spent because there were strict conditions associated with its spending. A problem specific to the Crest Energy project was uncertainty in the electricity market due to doubt as to whether an aluminum smelter would shut down; without it and with a new source of electricity, the market would be swamped and prices for consumers would increase dramatically (Doesburg 2013). Additionally, the tidal turbine project in Hobson Bay faced issues with obtaining resource consent and local community approval while the CHIME project failed to reach an agreement with the needed electricity supplier (Doesburg 2013). Other companies lacked investor support due to a diversion of investment in shale oil and gas, the unknown long-term impact of the government’s partial privatization of generators and the possibility of the government creating a single wholesale electricity buying body (Doesburg 2013). All of these projects were put on hold by the end of 2013 and there has not been any work on new tidal or wave projects since then. Nevertheless, when these projects were cut in 2013, Craig Stevens, who at the time was the co-chair of Awatea, a marine energy body in New Zealand, was optimistic that with a shift of emphasis to skills development and innovation as well as a political climate more conducive to marine energy development, it was still possible to develop a marine industry in New Zealand within the next two decades (Doesburg 2013).
12
2.3LESSONSLEARNED
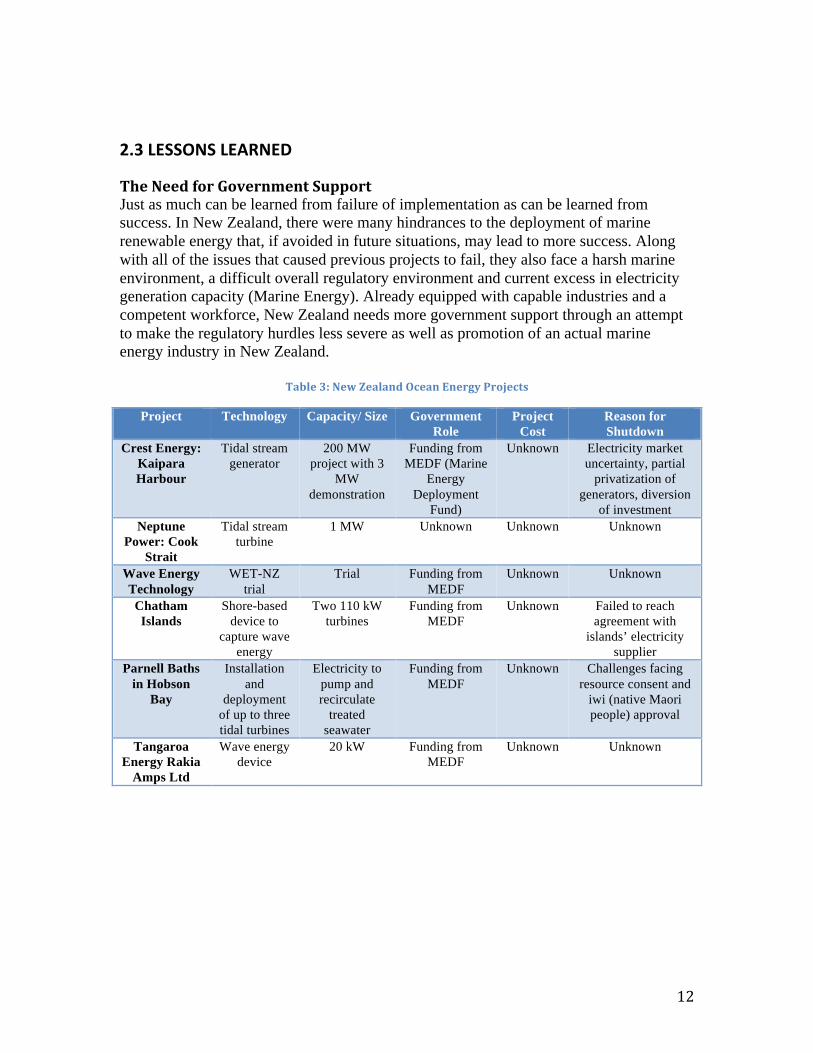
TheNeedforGovernmentSupportJust as much can be learned from failure of implementation as can be learned from success. In New Zealand, there were many hindrances to the deployment of marine renewable energy that, if avoided in future situations, may lead to more success. Along with all of the issues that caused previous projects to fail, they also face a harsh marine environment, a difficult overall regulatory environment and current excess in electricity generation capacity (Marine Energy). Already equipped with capable industries and a competent workforce, New Zealand needs more government support through an attempt to make the regulatory hurdles less severe as well as promotion of an actual marine energy industry in New Zealand.
Table3:NewZealandOceanEnergyProjects
Project Technology Capacity/ Size Government Role
Project Cost
Reason for Shutdown
Crest Energy: Kaipara Harbour
Tidal stream generator
200 MW project with 3
MW demonstration
Funding from MEDF (Marine
Energy Deployment
Fund)
Unknown Electricity market uncertainty, partial
privatization of generators, diversion
of investment Neptune
Power: Cook Strait
Tidal stream turbine
1 MW Unknown Unknown Unknown
Wave Energy Technology
WET-NZ trial
Trial Funding from MEDF
Unknown Unknown
Chatham Islands
Shore-based device to
capture wave energy
Two 110 kW turbines
Funding from MEDF
Unknown Failed to reach agreement with
islands’ electricity supplier
Parnell Baths in Hobson
Bay
Installation and
deployment of up to three tidal turbines
Electricity to pump and recirculate
treated seawater
Funding from MEDF
Unknown Challenges facing resource consent and
iwi (native Maori people) approval
Tangaroa Energy Rakia
Amps Ltd
Wave energy device
20 kW Funding from MEDF
Unknown Unknown
13
3.CaseStudy:Wind,Tidal,andWaveEnergyinScotland
3.1COUNTRYSPECIFICFACTORSDRIVINGMARINERENEWABLEENERGY
AnAggressiveApproach Scotland is placed in an ideal geographic location with the potential to generate 25% of Europe’s total offshore wind capacity, 25% of its tidal power, and 10% of its wave power (Marine Renewable Energy 2015). Because of this and because the Scottish government is committed to developing a marine renewable energy industry, Scotland has set an aggressive target of having 100% of its electricity demand come from renewables by 2020 (Marine Renewable Energy 2015). Although this seems like an aggressive approach, Scotland’s government has provided ample support for this goal to become a reality and has shown a sincere commitment to being a world leader in renewable energy development and deployment.
TechnicalExpertiseandResourcePotential Along with an Exclusive Economic Zone of more than 462,000 square kilometers
(Exclusive Economic Zone 2014), Scotland also contains the resources needed for developing a marine renewable energy industry. First and foremost, they have a skilled labor force, which has been developed through a long history of public education that emphasizes breadth across a broad range of subjects (Scotland’s Education System). Their higher education is world-renowned and from 2013 to 2014, Scotland secured 33% of all research and development projects in the United Kingdom (Invest in Scotland). Furthermore, they have the government support needed to promote marine energy development, which will be discussed in more detail in the following sections.
3.2SCOTLAND’SWINDENERGYPROJECTDETAILS
AHubforInvestors With ample offshore wind resources, Scotland has also developed the ambition and commitment to developing new offshore technologies. It already has experience with offshore oil and gas development and now, paired with renewable energy research at their universities, Scotland is poised to become a global leader in offshore wind (Offshore Wind Scotland). It already has 197 MW of operational offshore wind along with testing sites and 4 GW of granted planned consent. One of the most important resources it has is an established infrastructure to support further offshore wind development; there is a robust supply chain, which includes surveying, installation, construction, and maintenance and operations (Offshore Wind Scotland). This established infrastructure is supported by the National Renewables Infrastructure Fund and also ensures continued foreign investment to allow for further growth of the industry. To help with development, the Scottish government has also developed Enterprise Areas, sixteen locales across the country with increased business incentives, which are sectorally focused to enhance manufacturing opportunities, promote investment, and
14
create jobs (Offshore Wind Scotland). These investment hubs also benefit from incentives such as enhanced capital allowances and a streamlined approach to planning (Offshore Wind Scotland). All in all, research and development along with an established infrastructure and government support have all contributed to increased investment in Scotland’s offshore wind market, putting them in place to slowly increase their offshore wind presence in the global market.
TheFutureofWindinScotland Currently, Scotland has three operational offshore wind projects: the 10 MW Beatrice Demo off the northern coast to test the feasibility of a deep water wind farm, the 7 MW Energy Park Fife Demo off the central-eastern coast, and the 180 MW Robin Rigg off the southern coast (Offshore Wind Scotland). The government has also granted planning consent for over 4 GW of future projects in 8 different locations. This includes the Beatrice Offshore Wind Limited (BOWL) project which would be an extension of the Beatrice Demo Project and if successful, would be the first deep water wind farm in the world at a water depth of 35-48 m (Offshore Wind Scotland). It is located on the Outer Moray Firth approximately 13.5 km for the Caithness coastline and would cover approximately 131.5 square kilometers (Offshore Wind Scotland). With 84 turbines of 7 MW capacity, the total project capacity would reach about 588 MW (Beatrice Offshore Wind Farm 2016). In total, the project is expected to cost 2,128 million GBP (Beatrice Offshore Wind Farm 2016). This shows that even with a lot of factors working in Scotland’s favor, the costs of these projects are enormous. With their continued research and development, investment friendly environment, and solid infrastructure, though, there is hope that with further development of offshore wind, costs will come down eventually.
3.3WAVEANDTIDALENERGYPROJECTDETAILS
WaveEnergyScotlandandOtherGovernmentInitiatives There have been reports to the Scottish Government with estimates of up to 14 GW of recoverable wave energy mainly off the country’s western and northern coasts (Wave Energy 2014). Because of this high energy potential, Scotland’s government established Wave Energy Scotland in December 2014. This initiative was designed to fund the development of innovative technologies to produce low cost, efficient and reliable components and subsystems to be the basis of the wave energy industry in Scotland (Wave Energy Scotland). Additionally, they hoped to retain the intellectual property of device development in Scotland as well as promote greater confidence in this novel technology in order to secure private sector investments (Wave Energy Scotland Fact Sheet 2014). Through Wave Energy Scotland, contracts were awarded for technology development projects through open project calls announced in July 2015. The first call was for secondary energy conversion technologies, which closed in May 2015 and the second call was for a novel wave energy converter, which closed in August 2015 (Wave Energy Scotland). There were a total of 17 winning projects with final milestones to be delivered by July 2017. This initiative was an example of a successful government
15
initiative to accelerate the wave energy industry and will hopefully produce promising final results in 2017. Another government initiative was the Saltire Prize Challenge launched in 2008 with the intent of awarding the developer who could demonstrate that their wave or tidal energy device had generated at least 10 GWh over a continuous two year period using only the power of the sea (Wave Energy in Scottish Waters 2013). Currently, the prize criteria and progress are under review and the Saltire Prize Challenge Committee is considering options for reshaping the prize to better reflect the circumstance of the wave and tidal sectors (The Challenge). A report with the results of their discussions will be published later in 2016.
MarineSpatialPlanning:PentlandFirthandOrkneyWaters As Scotland looks to increase their presence of offshore marine renewables, it becomes increasingly important for them to consider careful marine spatial planning. In the Pentland Firth and Orkney Waters off the northern coast of Scotland, there is 600 MW of wave energy capacity (Wave Energy in Scottish Waters 2013) as well as 800 MW of tidal energy capacity (Tidal Energy in Scottish Waters). Because of the great potential for wave and tidal development, this area was chosen as a pilot for the development of a marine spatial plan (MSP) in order to guide future marine development in other areas of Scotland (Pentland Firth & Orkney Waters 2016).
The overall goal of the MSP pilot plan was to establish a coherent strategic vision as well as objectives and policies to further the achievement of sustainable development (Pilot Pentland Firth and Orkney Waters Marine Spatial Plan 2016). They hoped to do this in order to inform and guide the regulation, management and use of the area and to provide clarity of the marine environment to minimize conflicts of interest in that zone. In order to do this, they first set out a framework and regional locational guidance in order to fully define the process intended to develop the MSP (Pentland Firth and Orkney Waters Marine Spatial Plan Framework 2016). They identified the information required to develop the plan, which included considering all marine sectors associated with the Pentland Firth and Orkney Waters, both currently and possibly in the future and making recommendations on addressing the knowledge gaps. Next, was the research phase, which is continuously on-going. Stage three consisted of developing the plan itself, which took place from 2012 to 2016 and recently received ministerial approval on March 16th, 2016 (Pentland Firth & Orkney Waters 2016). Receiving approval of the plan also consisted of a sustainability appraisal and consultation with public and private stakeholders as well as the local communities.
Overall, the MSP pilot plan will help promote the strategic development of marine renewables in Scotland as well as creating a precedent for marine spatial planning in other areas of Scotland and the rest of the world.
3.4LESSONSLEARNED
MarineSpatialPlanningBolsteringDevelopment Scotland has shown incredible commitment to being a leader in implementing renewable energy and has successfully pursued their aggressive energy targets thus far. They have shown how greatly a skilled labor force, government support, and a friendly
16
environment for investment are all necessary factors for the success of a growing offshore wind industry. One of the most important takeaways from Scotland might be their pioneering of a detailed marine spatial plan, but it is yet to be seen how exactly that plan will help future development of offshore marine renewables. Overall, it can be said that government support has been one of the greatest driving factors for both offshore wind development as well as tidal and wave energy development. This is an important lesson for other countries that may try to follow in Scotland’s footsteps.
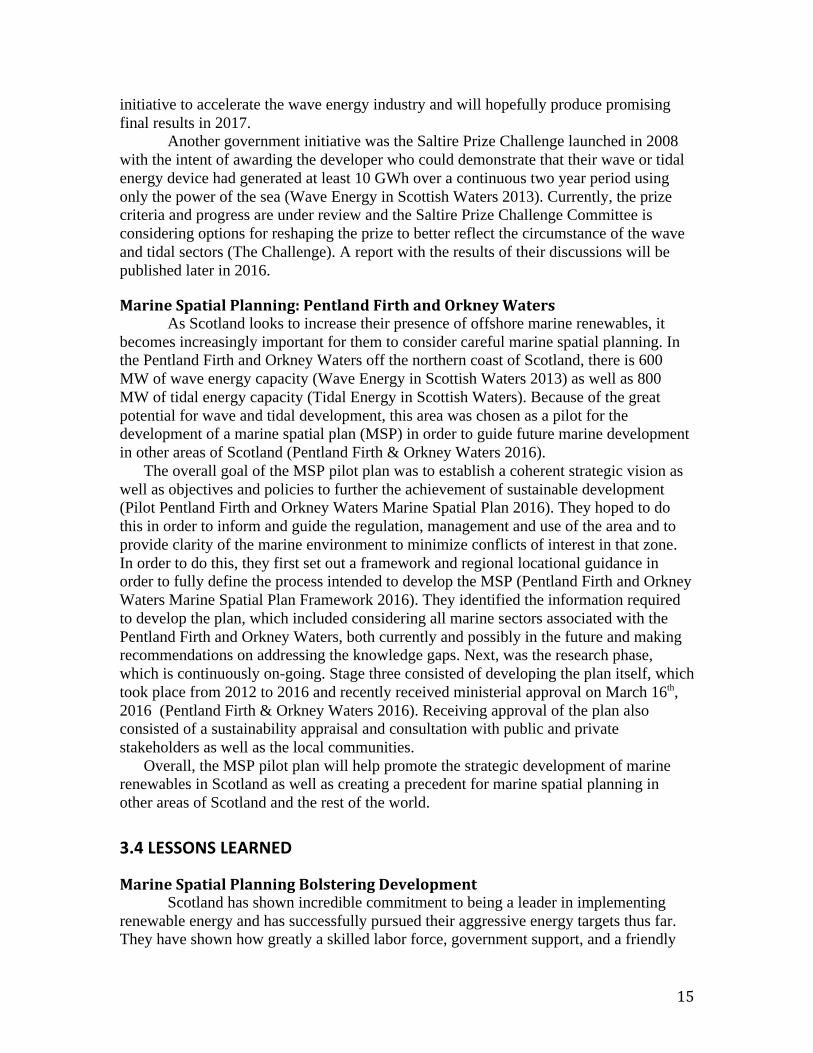
Table4:ScotlandOceanEnergyProjects
Project Technology Project Status Capacity/ Size Project Cost Beatrice Offshore
Wind Limited (BOWL)
Offshore Wind Demonstration deployed with
planning consent given for full project
664 MW project with 10 MW
demonstration
GBP 2128 million
Moray Firth Offshore Wind Expected to supply power to the grid by
2019
1116 MW GBP 1339.2 million
Levenmouth (Energy Park Fife)
Offshore Wind Demonstration 7 MW Unknown
Robin Rigg Offshore Wind Fully Commissioned 180 MW GBP 381 million Islay Offshore Wind Dormant 690 MW Unknown
Firth of Forth Offshore Wind Consent Authorized 3465 MW Various different projects within the
area Neart na Gaoithe Offshore Wind Consent Authorized 448 MW GBP 1614 million
Inch Cape Offshore Wind Consent Authorized 784 MW GBP 3000 million Aberdeen Bay Demo (European Offshore Wind Deployment
Centre)
Offshore Wind Consent Authorized 84 MW GBP 230 million
Hywind Scotland Pilot Park
Offshore Wind Pre-Construction 30 MW GBP 152 million
Costa Head Wave Farm Limited
Wave Pre-application 200 MW Unknown
Marwick Head Wave Farm
Wave Pre-application 49.5 MW Unknown
West Orkney South Wave Energy Site
Wave Pre-application 100 MW Unknown
APL Lewis Wave Under Construction 40 MW Unknown MeyGen (Pentland
Firth) Tidal Under Construction 398 MW GBP 51.3 million
(for first phase) Argyll Tidal
Demonstrator Project Tidal Consent Authorized 0.5 MW Unknown
Lashy Sound Tidal Planning Stages 30 MW GBP 9.24 milllion Brims Tidal Array Tidal Planning Stages 60 MW (stage 1) Unknown
Sound of Islay Tidal Consent Authorized 10 MW GBP 40 million Ness of Duncansby Tidal Planning Stages 65 MW Unknown
17
4.CaseStudy:WaveEnergyandDeepOceanWaterApplicationsinHawaii
4.1COUNTRYSPECIFICFACTORSDRIVINGMARINERENEWABLEENERGY
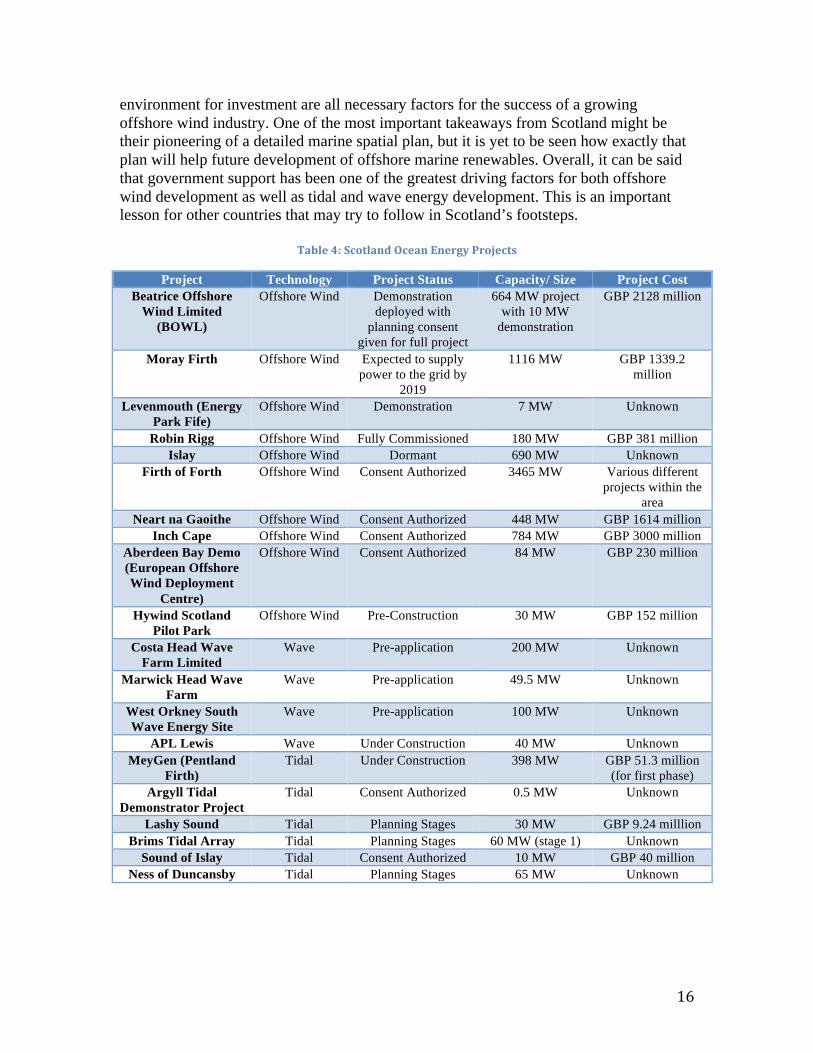
High CostsDrivingNewSources The state of Hawaii is a small chain of volcanic islands located in the central Pacific Ocean. Hawaii deals with the same issues as most other island nations; however, it falls under the federal jurisdiction of the United States, despite its isolation from the rest of the country. Its geography and location result in electricity prices three times higher than the U.S. average, ranging between $0.35 and $0.47 in 2013 and 2014 (Hawaii Energy, 2014).
Figure11.AverageelectricitycostsinHawaiiaboutthreetimestonationalaveragein2014.Sourceby
HawaiiEnergyStatistics,2014.
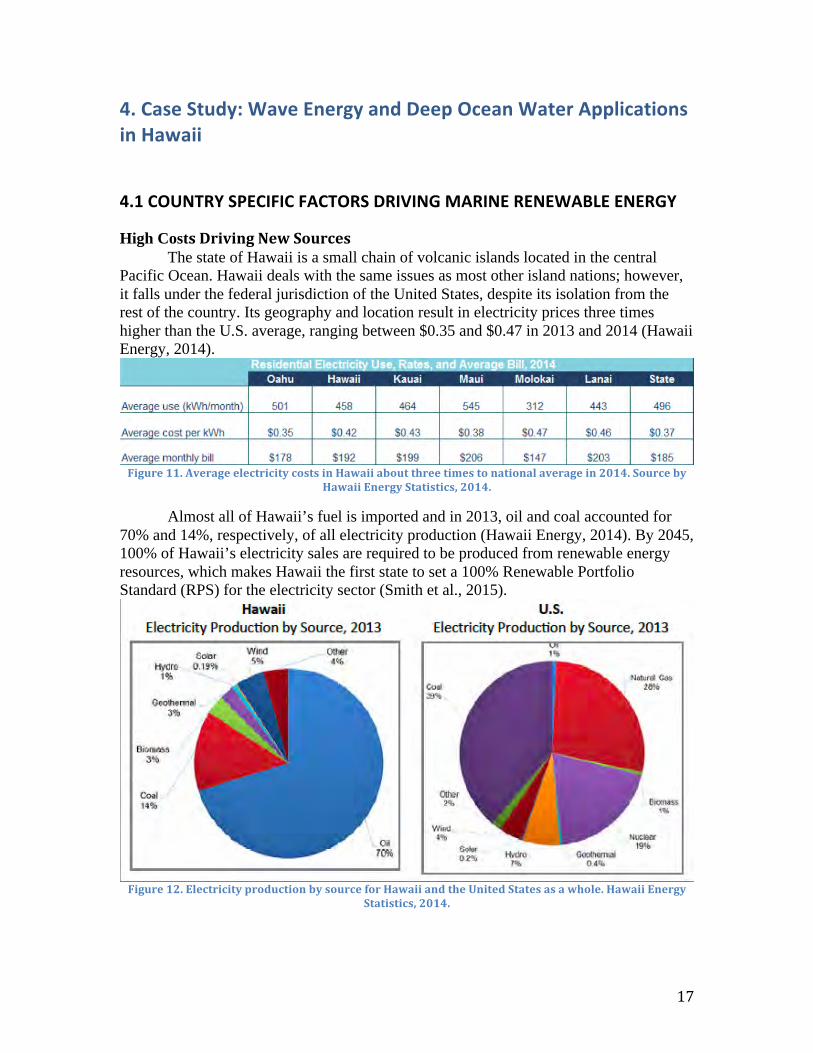
Almost all of Hawaii’s fuel is imported and in 2013, oil and coal accounted for 70% and 14%, respectively, of all electricity production (Hawaii Energy, 2014). By 2045, 100% of Hawaii’s electricity sales are required to be produced from renewable energy resources, which makes Hawaii the first state to set a 100% Renewable Portfolio Standard (RPS) for the electricity sector (Smith et al., 2015).
Figure12.ElectricityproductionbysourceforHawaiiandtheUnitedStatesasawhole.HawaiiEnergy
Statistics,2014.
18
Renewable sources are generating a larger percentage of electricity each year, at an increasingly rapid rate. By expanding the share of renewable energy sources in the energy mix, electricity systems can provide clean power locally and inexhaustibly to match growing demand, while helping reduce carbon dioxide emissions and energy dependence. Though high in capital costs, these new technologies can reduce long-run production costs and, more importantly, mitigate risks of oil price volatility.
AmpleRenewableEnergyPotential Currently, each island of Hawaii has its own electrical grid, and Hawaiian Electric Company (HECO) and its subsidiaries serve about 95% of the state’s population (Hawaii Energy, 2015). To serve a population of around 1,431,603 (Hawaii Gov, 2015), the state demands around 10,000 GWh. Based on renewables analysis conducted by the state, the renewable resource potential is around 14,000 GWh; enough to meet all of the state’s demand (Hawaii Energy, 2015). Ocean energy is in preliminary stages to deliver a sliver of this potential to the grid. The two offshore renewable technologies currently being explored in Hawaii are wave energy and deep ocean water applications.
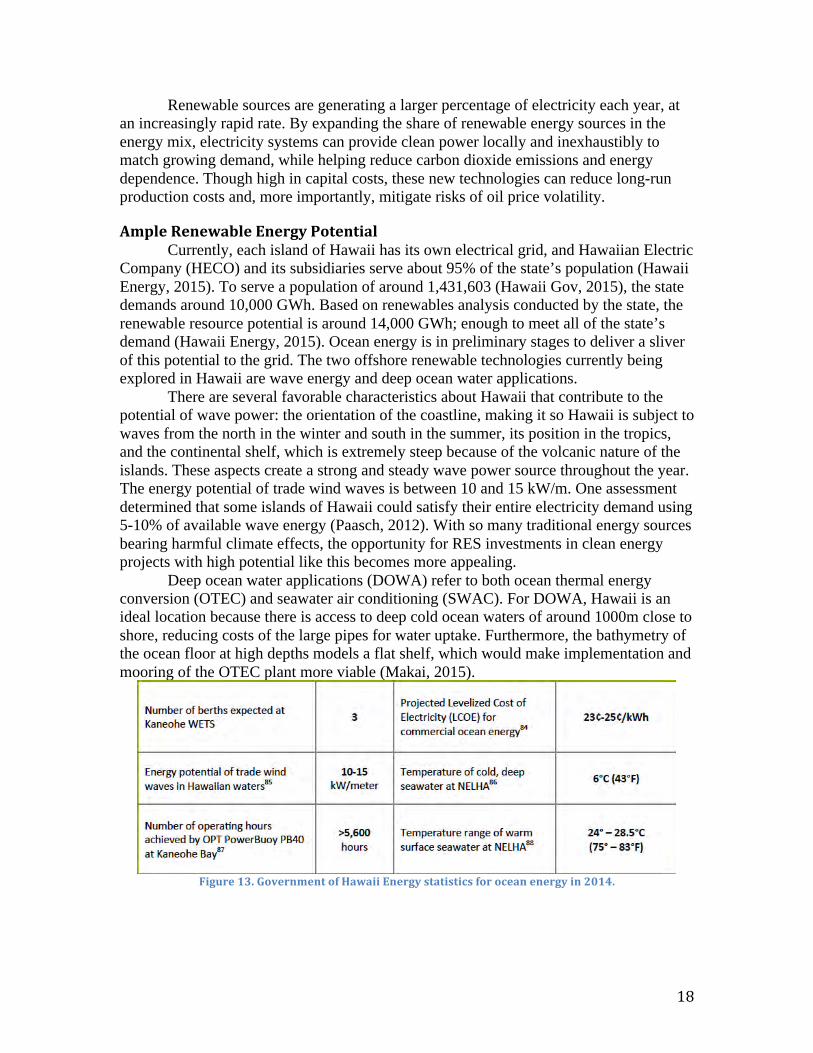
There are several favorable characteristics about Hawaii that contribute to the potential of wave power: the orientation of the coastline, making it so Hawaii is subject to waves from the north in the winter and south in the summer, its position in the tropics, and the continental shelf, which is extremely steep because of the volcanic nature of the islands. These aspects create a strong and steady wave power source throughout the year. The energy potential of trade wind waves is between 10 and 15 kW/m. One assessment determined that some islands of Hawaii could satisfy their entire electricity demand using 5-10% of available wave energy (Paasch, 2012). With so many traditional energy sources bearing harmful climate effects, the opportunity for RES investments in clean energy projects with high potential like this becomes more appealing.
Deep ocean water applications (DOWA) refer to both ocean thermal energy conversion (OTEC) and seawater air conditioning (SWAC). For DOWA, Hawaii is an ideal location because there is access to deep cold ocean waters of around 1000m close to shore, reducing costs of the large pipes for water uptake. Furthermore, the bathymetry of the ocean floor at high depths models a flat shelf, which would make implementation and mooring of the OTEC plant more viable (Makai, 2015).
Figure13.GovernmentofHawaiiEnergystatisticsforoceanenergyin2014.
19
4.2HAWAIIWAVEENERGYTESTSITE(WETS)PROJECTDETAILS
CreatingtheTestSiteThrough the cooperative effort of the U.S. Navy and Department of Energy
(DOE), specifically the funding from its Water Power Program, this grid-connected Wave Energy Test Site in Kaneohe Bay on the island of Oahu, Hawaii has hosted two different technologies and plans to host three more before mid 2018, with WECs ranging in capacity from 18kW to 500 kW (Dragoon et. al., 2015). The Navy and DOE select companies with most promise for testing, and they bring their technology to the site. The site selection was based on economic feasibility—assessments found where there was the most wave energy potential closest to a demand center and that would have the least conflict with other ocean activities. Furthermore, the closer the site is to shore, the lower transmission costs and losses would be, as well as the easier it will be to transport, operate and maintain the device (DEBDT Hawaii Gov, 2002). OPT technologies tested here from 2003 to 2011. In 2015, Northwestern Energy Innovations (NWEI) connected their 18kW Azura demonstration device to the grid at the 30m test berth. This site has 30m, 60m, and 80m water depths and can host a peak power of 1MW. In the coming years, NWEI hopes to test their device at deeper berths. Additionally, Columbia Power, Fred Olsen, and Ocean Energy are the three other companies that have been selected to test their technology here before mid 2018 (Cross et. al, 2015). Hawaii Natural Energy Institute (HNEI) provides key research to help run the facility, and Hawaiian Electric Company (HECO), Hawaii’s main utility operator, has helped with the electrical transmission of the pilot plants to the grid.
AResearchHubHawaii has become a research hub in the United States and around the world for
ocean energy research. The University of Hawaii houses the Hawaiian National Marine Renewable Energy Center (HINMREC), a cooperative program with the U.S. Navy, as one of three federally funded centers to test marine energy deployment (Hawaii Energy, 2015). HINMREC is part of the Hawaii Natural Energy Institute (HNEI) put in place in 1974 to “develop renewable energy resources and technology to reduce the state’s dependence on fossil fuels.” HNEI works to reduce this dependence while simultaneously maintaining competitive costs, managing environmental impact, and preserving reliability, which requires coordination from all stakeholders. HINMREC focuses specifically on wave energy and ocean thermal energy conversion (OTEC), acting to expand infrastructure of ongoing projects to facilitate development and implementation of commercial systems and technology (Rocheleau, 2008). They facilitate in-water testing and provide expertise in engineering, science, and policy—maintaining established relations with federal and state permitting and licensing agencies—to support testing. These institutions have furthered research and assessments of ocean energy potential for Hawaii, but with international implications.
EconomicConsiderations Demonstration plants in Hawaii have yet to be completed on a large enough scale for these technologies to be competitive; however, the high electricity costs in Hawaii
20
help favor the advancement of novel technologies to later drive down these costs. The government helps financially incentivize the innovation and development of wave energy in the form of tax credits, both at the state and federal level, and Green Infrastructure bonds awarded to clean energy measures (Hawaii Gov, 2015). There has also been large funding from the DOE. Hawaii has received $9.7m in awards toward wave energy projects, and NWEI received an additional $5m to help the company further technological development (Hawaii Energy Statistics, 2014). There is a considerable scope for economies of scale and learning, likely to drive down costs. Furthermore, the Oregon Wave Energy Trust (OWET), another research hub for wave energy in the U.S., conducted a study modeling the economic benefits of a wave energy sector in Oregon. They predicted this new sector would produce 6,302 jobs and $42 million in local and state taxes in Oregon (Dragoon et. al., 2015).
CombatingPoliticalBlockadesIn addition to financial incentives and government funding for research and
development, ocean energy in Hawaii is eligible for Feed-in-Tariffs and net metering systems to help incentivize wave energy production. Hawaii has also set mandates for Renewable Energy Targets of 30% by 2020, 40% by 2030, and 100% by 2045 (Hawaii Energy, 2015). These mandates help provide political stability and increase investor confidence.
Initial investments in this technology are generally focused on site studies, permitting and infrastructure (Rocheleau, 2008). Despite all the investment in research and technology, the primary hindrance for marine energy deployment is thought to be the U.S. regulatory process. In the United States, a WEC licensing and permitting framework has yet to be established (Paasch, 2012). Project permitting costs can range from 1% to 10% of overall project construction costs, and the average of 15 federal, state, and county permits can take 1 to 5 years to obtain for a large renewable energy project. Furthermore, the DOE requires an environmental impact statement in the permitting process (Hawaii Energy, 2015). This, along with other environmental regulation, makes the project even more difficult to get approved. OWET has produced a roadmap for a permitting framework to help streamline the process (Paasch, 2012).
4.3MAKAIOCEANENGINEERINGPROJECTDETAILS
NELHAOTECPilotPlantandSWACImplementationMakai Ocean Engineering, a company specializing in deep ocean water
applications, including ocean thermal energy conversion (OTEC) and seawater air conditioning (SWAC), is based out of Hawaii. They currently maintain a 100kW onshore OTEC pilot plant at the Natural Energy Laboratory of Hawaii Authority (NELHA). The OTEC plant was added to the grid in the summer of 2015 and currently powers approximately 120 homes (Makai, 2016). NELHA is the world’s premier OTEC research center and a developing partner with Lockheed Martin, U.S. Navy and HNEI to fund and
21
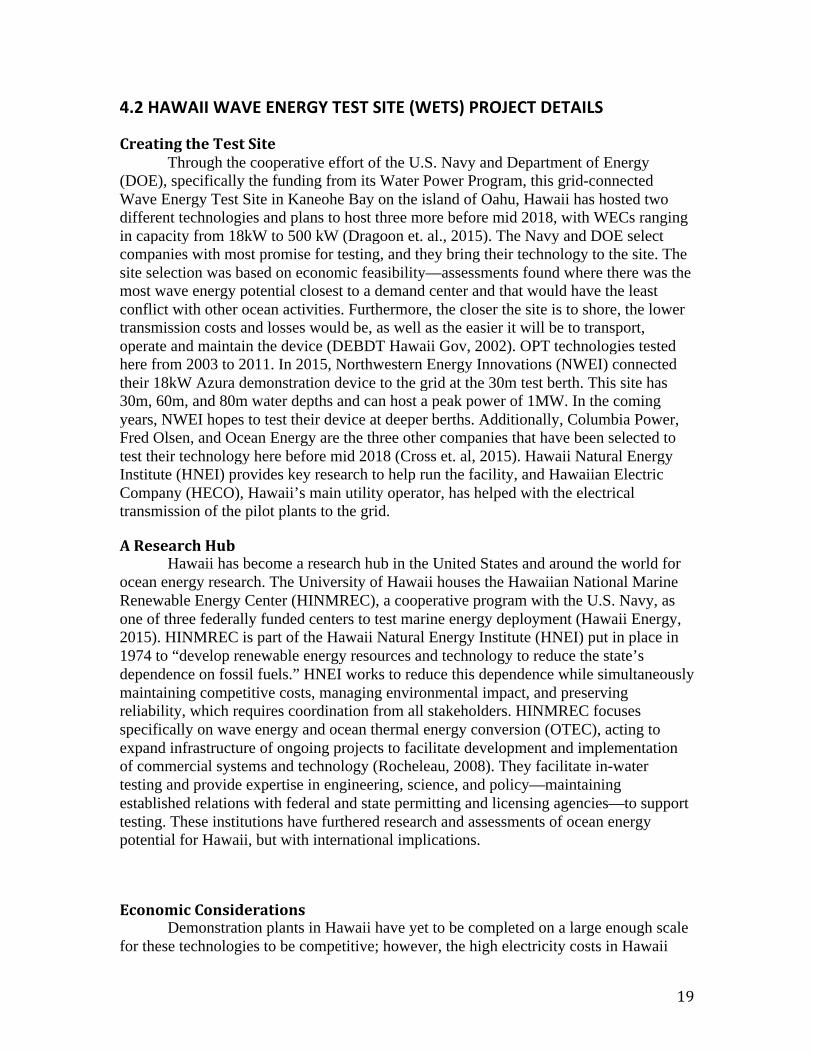
support research and testing (Hawaii Energy, 2015). The NELHA facility also utilizes SWAC technology for its cooling system.
Figure14.MakaiOceanEngineering(2015)offshore100MWOTECplantdesign.
EconomicConsiderationsThis technology has extremely high upfront costs. The main component, the heat
generator, accounts for about 1/3 of the total plant costs. A 105 kW OTEC plant costs about $5m to build (Hodgkins, 2015). The Naval Facilities Engineering Command funded the infrastructure of the existing plant. Makai Ocean Engineering also received a Small Business Innovation Grant, a grant funded by a variety of federal agencies with research and development programs. Additionally, Makai’s partnership with Lockheed Martin, brought in an additional $12.2m, awarded to Lockheed for their design and exploration in this novel technology. Even with these investments, the next step in their testing, a 10MW OTEC plant planned for 2013, was shelved due to costs. Experts predict that for the levelized cost of electricity from OTEC to approach $0.07-$0.19/kWh, it requires a commercial-scale 100 MW plant. A 100 MW plant has the capacity to power 120,000 homes (Makai, 2016).
At this point, Global OTEC investment has surpassed $100 million USD. This has supported companies like Makai Ocean Engineering and Ocean Thermal Energy Corporation, as well as collaboration with the international OTEC community, in developing models and assessment techniques for OTEC and SWAC implementation. They have thoroughly researched the potential for these technologies and found that 12 commercial-scale OTEC plants could satisfy all of Hawaii’s electricity needs, and produce it at roughly $0.20/kWh levelized cost (Makai, 2016). Though still in pilot stages of deployment, the possibility of this prospect is enough to propel further development. Moreover, there is a steep learning curve; as development advances and capacity increases, capital costs exponentially decrease.

22
ChallengesHinderingDevelopment The main challenges with this size plant are threefold. First off, companies struggle to find investors for these projects. Without investors or sufficient government support, larger scale projects cannot be completed. Second, the size of water ducting systems and large pipes that need to be deployed in large-scale plants pose difficulties in their construction, transport, and maintenance. Lastly, there are unknown risks to marine life with upward transfer of nutrient-rich, cold water and later discharge. This water mixing has the potential to disrupt ecological habitats of species in the area.
4.4AWHOAHUNORTHWESTOFFSHOREWINDPROJECTDETAILS
SatisfyingMandatesThe Hawaiian Electric Companies – Hawaiian Electric, Maui Electric, and Hawaii
electric Light Company – have outlined a 30-year plan to generate 100% of Hawaii’s energy needs from renewable energy sources. The plan, which has been submitted to The Hawaii Public Utilities Commissions (PUC) for review, includes 800 megawatts (MW) of offshore wind power by 2045 (BOEM, 2016a).
The project calls for 408 MW of offshore wind to be installed in the North Pacific Ocean, in an area 19 kilometers (km) from the shore. Fifty-one floating turbines would be installed, each with a capacity of 8 MW. Once completed, the project would supply 25% of Oahu’s energy needs, where offshore wind is particularly attractive, as it requires minimal land use. The electricity would be transmitted to Oahu via undersea cables. At present, 400 MW – enough to power 288,968 homes annually – is the maximum amount that can be integrated into the existing Oahu grid, whilst also offering economies of scale during the production process (4C Offshore, 2016).
EconomicsThe estimated cost of the project is $1.9 billion (USD), or roughly $5 million per
megawatt of offshore wind capacity (Harball, 2015). The enormous cost of the project is due, in part, to the lack of sufficient manufacturing or harbor facilities available in Hawaii. As such, new infrastructure would be required in order to assemble an offshore wind project of this magnitude. The project developers have also yet to negotiate a PPA with an off-taking utility, which yields further uncertainty to the ultimate outcome of the project.
PoliticalSupportThe Bureau of Ocean Energy Management (BOEM) is currently processing an
unsolicited lease request from AW Hawaii Wind, LLC (AWH). The request is to construct a floating wind energy project off the coast of Oahu, Hawaii. BOEM is currently evaluating the leasing proposal request. BOEM has previously established the BOEM/Hawaii Intergovernmental Renewable Energy Task Force to promote planning and coordination, in addition to facilitating effect and efficient review of project requests

23
(BOEM, 2016a). Task Force members include representatives of Federal, state, and local government agencies and offices. BOEM has determined that AWH meets all the legal, financial, and technical qualifications for an outer continental shelf (OCS) lease. However, a request must be published in the Federal Register to determine whether or not there are any competing competitive interests in the lease areas, in addition to seeking public comments regarding potentials issues that would need to be addressed under a National Environmental Policy Act (NEPA) analysis (Harball, 2015).
EnvironmentalImplications AWH has consulted the Humpback Whale Sanctuary in regards to protecting whales within Hawaiian waters. Further consultation and observational studies are planned to ensure offshore wind development does not interfere with whale habitats. The developers also consulted with the National Oceanic and Atmospheric Administration (NOAA) Fisheries division in order to understand the nexus of offshore wind development and marine wild life issues. Very few concrete issues were discovered, but further consultation is planned (AW Hawaii, 2015).
4.5LESSONSLEARNED
GovernmentLeadingCollaborativeResearch Hawaii has set an example as an innovation hub and leading research island area for marine renewable energy. There are lessons learned here in the organization of research that can be applied to Mauritius. Government support and funding towards research and experimental or demonstration phases is crucial. It is also helpful to have industry leaders in collaboration with research and the global community for that technology to help speed up the process of development.
Additionally, the HINMREC has acknowledged an important question to be addressed when considering economic assessments of development, and that is: can equipment be manufactured using commercially available practices and in existing factories (HNEI, 2015)? If the answer to this question is no, the capital costs may be too steep to make technological development economically viable. If the answer is yes, which in many cases it is, it turns into the question of where these practices and factories exist, and what is the best way to approach them?
Furthermore, when considering all the components in technical assessments for the technology, it is imperative to incorporate the whole life cycle into the design and think about whether or not it can survive all seasons (HNEI, 2015). If this is done early on, fewer surprises will come down the road, leading to higher investor confidence.
PatienceisImperativeUnder planning since 2005, AWH has been waiting for the floating offshore wind
energy technology to mature prior to moving ahead with the project. Following success
24
development and installation of floating offshore wind turbines in Portugal, the developers decided to move ahead with the project (AW Hawaii, 2015). The patience of the developer has enabled the project to learn from other existing offshore wind projects, in addition to allowing time for existing technologies to mature, which in turn serves to lower costs.
CommunitySupportisCriticalAWH has undertaken a bottom-up approach to development, whereby they have
made a strong outreach and community partnerships with the Native Hawaiian population. As noted in their lease application, AWH has been in the wind energy development business for more than 25 years, and the primary reason for past failed projects has been due to a lack of local support (AW Hawaii, 2015). Accordingly, in their development plans, the company has carefully monitored the culture, discussions, media, and trends of developments and the balance with the Native Hawaiians.
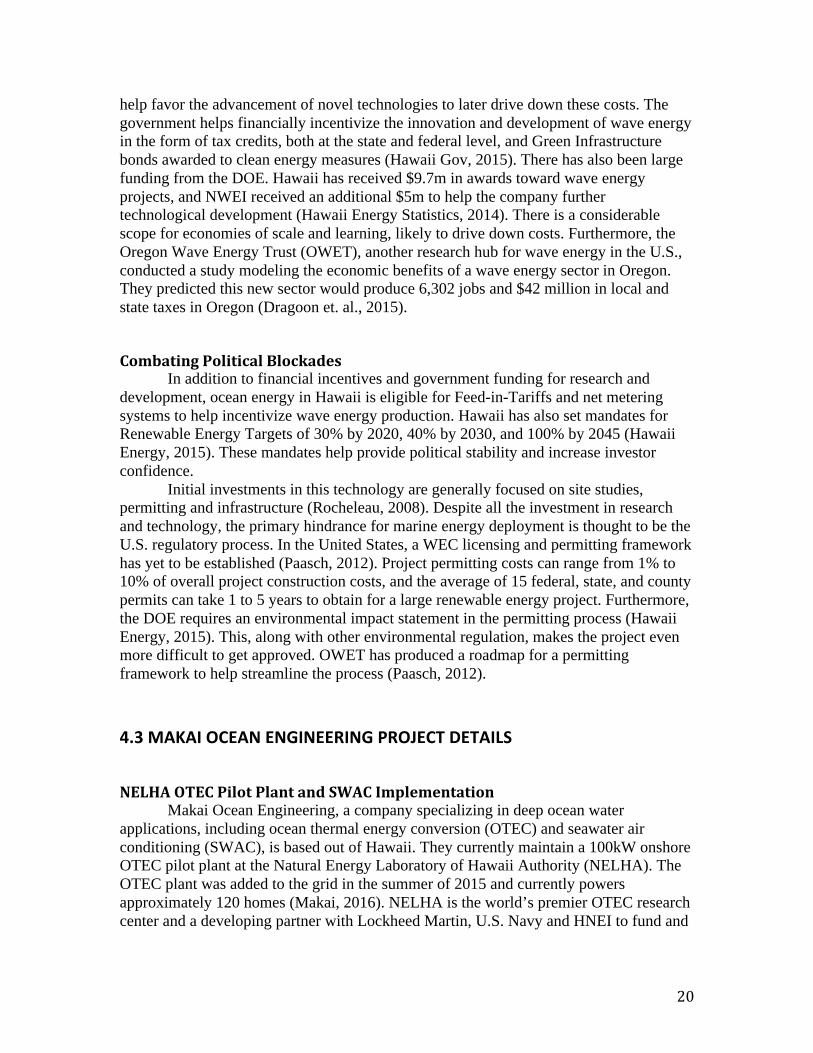
Table5:HawaiiOceanEnergyProjects
Project Technology Project Status Capacity Government Role Project Costs NWEI Azura device
Wave energy In-water testing
18kW grid-
connected
Research initiative, feed-in-tariffs, clean energy bonds; lack of permitting and
licensing framework
Unknown
Makai OTEC plant
OTEC and SWAC Demonstration 105kW grid-
connected
Funding research and infrastructure
Unknown; estimate that
plant alone cost $5 mil to build
AW Hawaii Wind, LLC.
Offshore wind Planning 408 MW Renewable energy targets of 30% by
2020, 40% by 2030, and 100% by 2045
$1.9 billion (USD)
25
5.CaseStudy:WaveEnergyintheCanaryIslands
5.1COUNTRYSPECIFICFACTORSDRIVINGMARINERENEWABLEENERGY
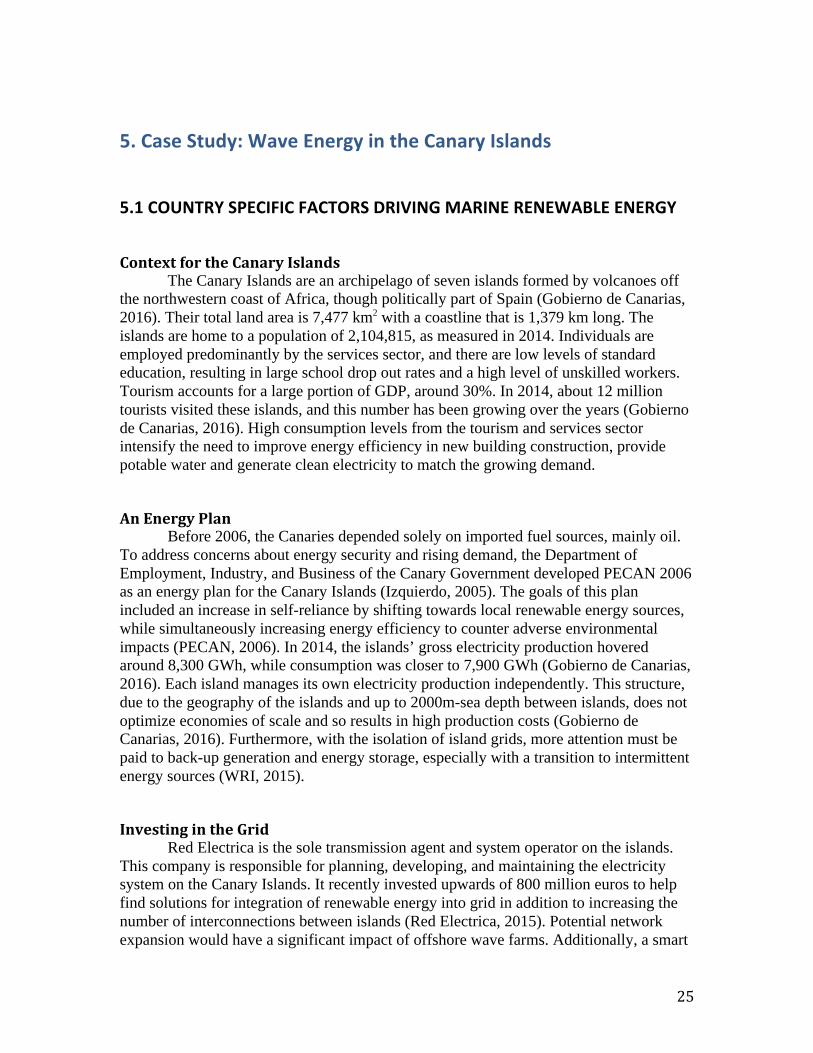
ContextfortheCanaryIslands The Canary Islands are an archipelago of seven islands formed by volcanoes off the northwestern coast of Africa, though politically part of Spain (Gobierno de Canarias, 2016). Their total land area is 7,477 km2 with a coastline that is 1,379 km long. The islands are home to a population of 2,104,815, as measured in 2014. Individuals are employed predominantly by the services sector, and there are low levels of standard education, resulting in large school drop out rates and a high level of unskilled workers. Tourism accounts for a large portion of GDP, around 30%. In 2014, about 12 million tourists visited these islands, and this number has been growing over the years (Gobierno de Canarias, 2016). High consumption levels from the tourism and services sector intensify the need to improve energy efficiency in new building construction, provide potable water and generate clean electricity to match the growing demand.
AnEnergyPlanBefore 2006, the Canaries depended solely on imported fuel sources, mainly oil.
To address concerns about energy security and rising demand, the Department of Employment, Industry, and Business of the Canary Government developed PECAN 2006 as an energy plan for the Canary Islands (Izquierdo, 2005). The goals of this plan included an increase in self-reliance by shifting towards local renewable energy sources, while simultaneously increasing energy efficiency to counter adverse environmental impacts (PECAN, 2006). In 2014, the islands’ gross electricity production hovered around 8,300 GWh, while consumption was closer to 7,900 GWh (Gobierno de Canarias, 2016). Each island manages its own electricity production independently. This structure, due to the geography of the islands and up to 2000m-sea depth between islands, does not optimize economies of scale and so results in high production costs (Gobierno de Canarias, 2016). Furthermore, with the isolation of island grids, more attention must be paid to back-up generation and energy storage, especially with a transition to intermittent energy sources (WRI, 2015).
InvestingintheGridRed Electrica is the sole transmission agent and system operator on the islands.
This company is responsible for planning, developing, and maintaining the electricity system on the Canary Islands. It recently invested upwards of 800 million euros to help find solutions for integration of renewable energy into grid in addition to increasing the number of interconnections between islands (Red Electrica, 2015). Potential network expansion would have a significant impact of offshore wave farms. Additionally, a smart
26
grid to connect all the islands for better optimization of economies of scale in electricity distribution would also improve efficiency. Despite these high production costs, electricity prices in Spain are set at the national level (Frayer, 2014). Therefore, improvements in costs and technology on the island will benefit all of the country, though residents will not see changes in real time prices overnight.
5.2LANGLEEWAVEPOWERPROJECTDETAILS
AttractingForeignInvestment Langlee Wave Power is a Norwegian company that has conducted multiple R&D projects sponsored by both public and private companies to arrive at a floating wave technology, which is now being implemented internationally, including the island of Tenerife, the largest of the Canary Islands. It is a private company dedicated to powering the Canaries by waves. The company advertises 4400 operating hours per year at a cost competitive to wind, with more than 50% load factor (Langlee, 2015).
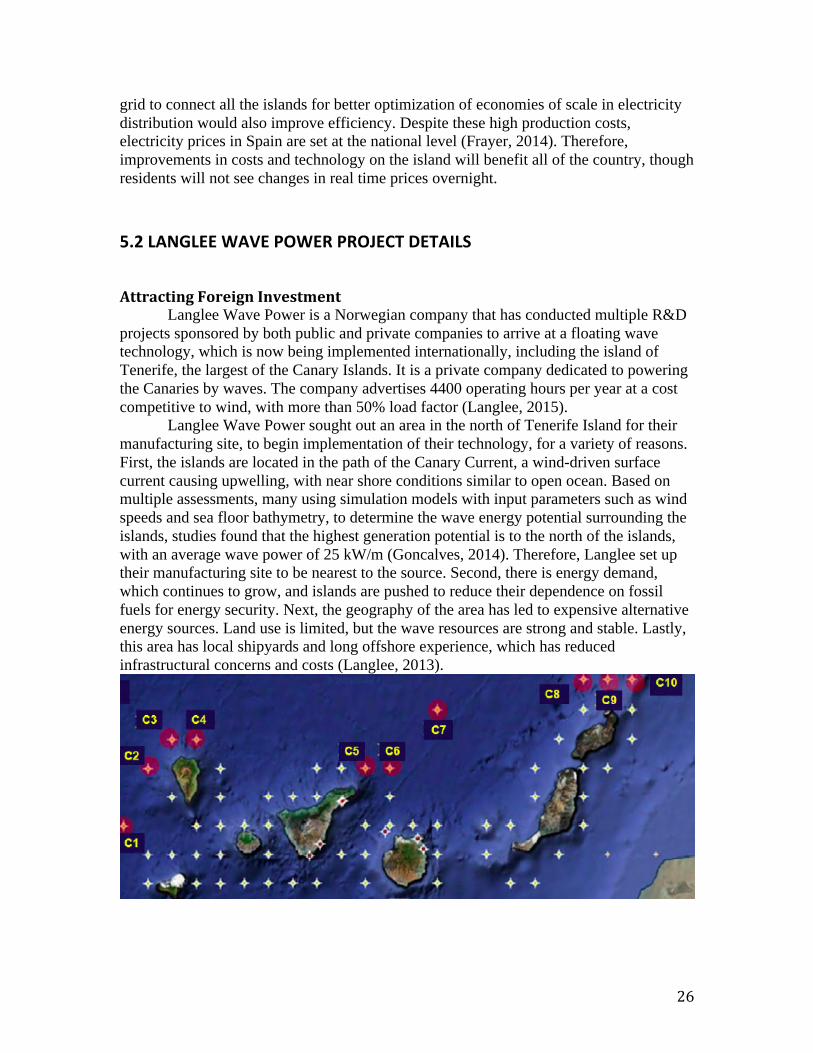
Langlee Wave Power sought out an area in the north of Tenerife Island for their manufacturing site, to begin implementation of their technology, for a variety of reasons. First, the islands are located in the path of the Canary Current, a wind-driven surface current causing upwelling, with near shore conditions similar to open ocean. Based on multiple assessments, many using simulation models with input parameters such as wind speeds and sea floor bathymetry, to determine the wave energy potential surrounding the islands, studies found that the highest generation potential is to the north of the islands, with an average wave power of 25 kW/m (Goncalves, 2014). Therefore, Langlee set up their manufacturing site to be nearest to the source. Second, there is energy demand, which continues to grow, and islands are pushed to reduce their dependence on fossil fuels for energy security. Next, the geography of the area has led to expensive alternative energy sources. Land use is limited, but the wave resources are strong and stable. Lastly, this area has local shipyards and long offshore experience, which has reduced infrastructural concerns and costs (Langlee, 2013).
27
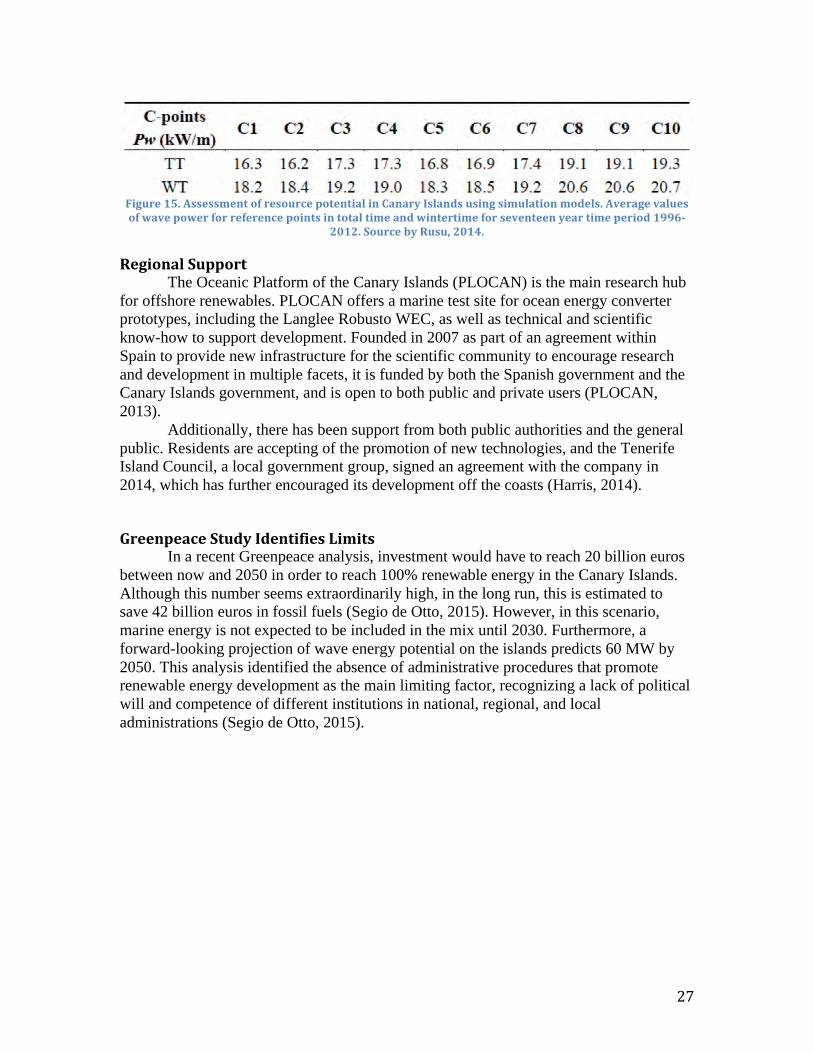
Figure15.AssessmentofresourcepotentialinCanaryIslandsusingsimulationmodels.Averagevaluesofwavepowerforreferencepointsintotaltimeandwintertimeforseventeenyeartimeperiod1996-
2012.SourcebyRusu,2014.
RegionalSupportThe Oceanic Platform of the Canary Islands (PLOCAN) is the main research hub
for offshore renewables. PLOCAN offers a marine test site for ocean energy converter prototypes, including the Langlee Robusto WEC, as well as technical and scientific know-how to support development. Founded in 2007 as part of an agreement within Spain to provide new infrastructure for the scientific community to encourage research and development in multiple facets, it is funded by both the Spanish government and the Canary Islands government, and is open to both public and private users (PLOCAN, 2013).
Additionally, there has been support from both public authorities and the general public. Residents are accepting of the promotion of new technologies, and the Tenerife Island Council, a local government group, signed an agreement with the company in 2014, which has further encouraged its development off the coasts (Harris, 2014).
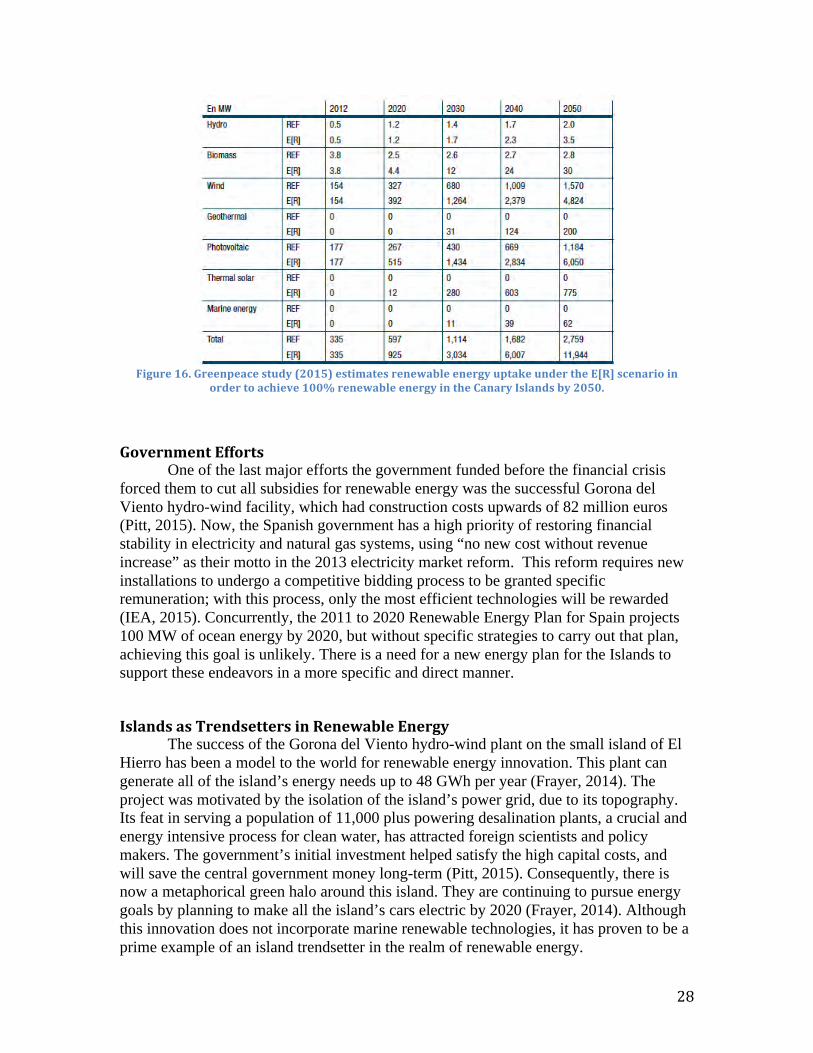
GreenpeaceStudyIdentifiesLimits In a recent Greenpeace analysis, investment would have to reach 20 billion euros between now and 2050 in order to reach 100% renewable energy in the Canary Islands. Although this number seems extraordinarily high, in the long run, this is estimated to save 42 billion euros in fossil fuels (Segio de Otto, 2015). However, in this scenario, marine energy is not expected to be included in the mix until 2030. Furthermore, a forward-looking projection of wave energy potential on the islands predicts 60 MW by 2050. This analysis identified the absence of administrative procedures that promote renewable energy development as the main limiting factor, recognizing a lack of political will and competence of different institutions in national, regional, and local administrations (Segio de Otto, 2015).
28
Figure16.Greenpeacestudy(2015)estimatesrenewableenergyuptakeundertheE[R]scenarioin
ordertoachieve100%renewableenergyintheCanaryIslandsby2050.
GovernmentEfforts One of the last major efforts the government funded before the financial crisis forced them to cut all subsidies for renewable energy was the successful Gorona del Viento hydro-wind facility, which had construction costs upwards of 82 million euros (Pitt, 2015). Now, the Spanish government has a high priority of restoring financial stability in electricity and natural gas systems, using “no new cost without revenue increase” as their motto in the 2013 electricity market reform. This reform requires new installations to undergo a competitive bidding process to be granted specific remuneration; with this process, only the most efficient technologies will be rewarded (IEA, 2015). Concurrently, the 2011 to 2020 Renewable Energy Plan for Spain projects 100 MW of ocean energy by 2020, but without specific strategies to carry out that plan, achieving this goal is unlikely. There is a need for a new energy plan for the Islands to support these endeavors in a more specific and direct manner.
IslandsasTrendsettersinRenewableEnergy The success of the Gorona del Viento hydro-wind plant on the small island of El Hierro has been a model to the world for renewable energy innovation. This plant can generate all of the island’s energy needs up to 48 GWh per year (Frayer, 2014). The project was motivated by the isolation of the island’s power grid, due to its topography. Its feat in serving a population of 11,000 plus powering desalination plants, a crucial and energy intensive process for clean water, has attracted foreign scientists and policy makers. The government’s initial investment helped satisfy the high capital costs, and will save the central government money long-term (Pitt, 2015). Consequently, there is now a metaphorical green halo around this island. They are continuing to pursue energy goals by planning to make all the island’s cars electric by 2020 (Frayer, 2014). Although this innovation does not incorporate marine renewable technologies, it has proven to be a prime example of an island trendsetter in the realm of renewable energy.
29
5.3LESSONSLEARNED
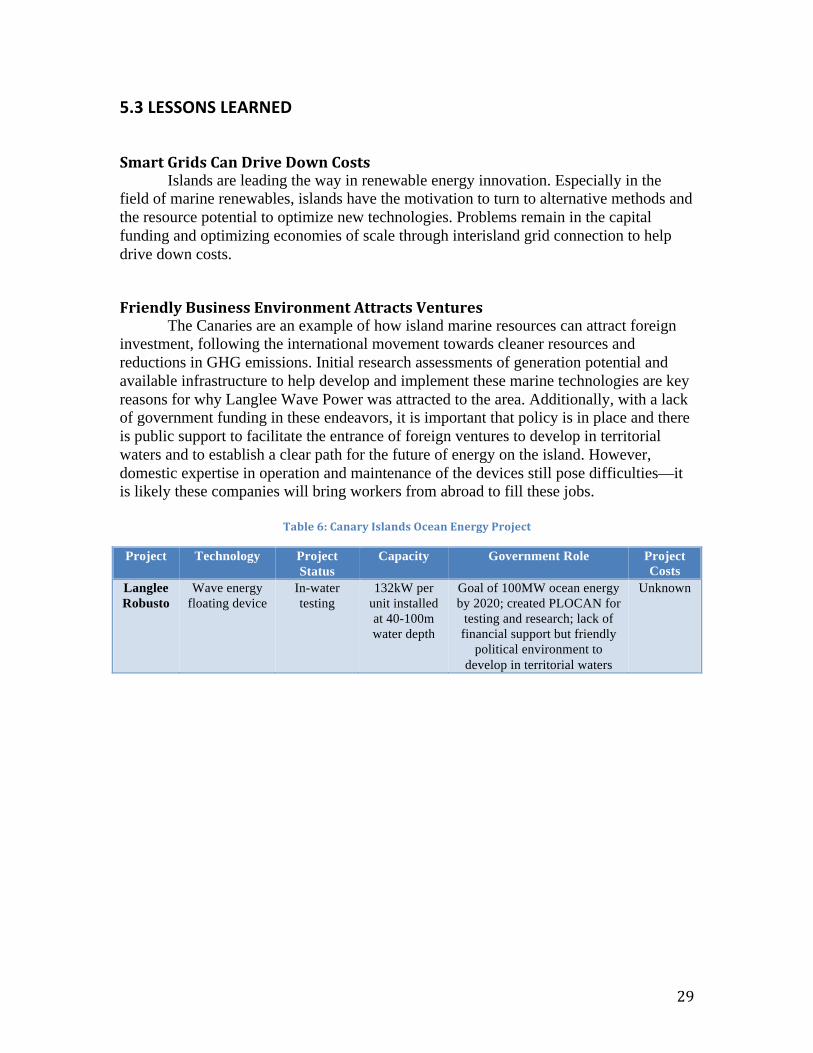
SmartGridsCanDriveDownCosts Islands are leading the way in renewable energy innovation. Especially in the field of marine renewables, islands have the motivation to turn to alternative methods and the resource potential to optimize new technologies. Problems remain in the capital funding and optimizing economies of scale through interisland grid connection to help drive down costs.
FriendlyBusinessEnvironmentAttractsVenturesThe Canaries are an example of how island marine resources can attract foreign
investment, following the international movement towards cleaner resources and reductions in GHG emissions. Initial research assessments of generation potential and available infrastructure to help develop and implement these marine technologies are key reasons for why Langlee Wave Power was attracted to the area. Additionally, with a lack of government funding in these endeavors, it is important that policy is in place and there is public support to facilitate the entrance of foreign ventures to develop in territorial waters and to establish a clear path for the future of energy on the island. However, domestic expertise in operation and maintenance of the devices still pose difficulties—it is likely these companies will bring workers from abroad to fill these jobs.
Table6:CanaryIslandsOceanEnergyProject
Project Technology Project Status
Capacity Government Role Project Costs
Langlee Robusto
Wave energy floating device
In-water testing
132kW per unit installed at 40-100m water depth
Goal of 100MW ocean energy by 2020; created PLOCAN for
testing and research; lack of financial support but friendly
political environment to develop in territorial waters
Unknown

30
6.CaseStudy:OceanCurrentandWaveEnergyinAustralia
6.1COUNTRYSPECIFICFACTORSDRIVINGMARINERENEWABLEENERGY
ACountryDominatedbyCoal Australia is an expansive landmass covering approximately 7.7 million km2 with vast potential for renewable resources (CIA Factbook, 2016). Nevertheless, it is one of the world’s leading GHG emission polluters. Australia’s poor environmental performance is driven by coal domination in the energy sector and a stretched population, dependent on private cars (Hamilton, 2013). The importance of its fossil fuel export market remains a key policy driver, and helps explain why Australia has been hesitant to remove coal from the energy mix. However, with global warming surfacing as a pressing international issue, the government has initiated ambitious Renewable Energy Targets – 33,000 GWh from renewable energy sources by 2020 – to help combat climate change. This target was initially legislated at 41,000 GWh, but was later compromised due to a lack in investor confidence. With coal persisting as a cheap, base load power, renewable implementation often does not appear economically attractive (Hamilton, 2013). Yet, even with this sentiment, Australia’s primary energy mix has seen decreasing trends in oil and coal, and positive growth trends for gas and renewables, signaling a transition towards diversification (AU Gov, 2015). It is clear that along with government renewable mandates, there needs to be further economic incentives to help boost these trends and move away from coal.
Bottom-UpApproachA huge portion of primary energy is used in the electricity sector. In Australia,
there is a National Electricity Market (NEM) for wholesale generation and transmission to consumers based on spot prices, which are volatile and vary by location (AEMO, 2015). This market connects five regional market jurisdictions, extending 5,200 km, including Queensland, New South Wales, Victoria, South Australia, and Tasmania (AEMO, 2015). A separate grid operates in Western Australia (Hamilton, 2013). The three key bodies that manage the NEM are the Australian Energy Market Commission (AEMC), the Australia Energy Regulator, and the Australian Energy Market Operator (AEMO), which all work to regulate and manage the market and system security (6).
The responsibility for energy governance is shared between several levels of governments. The Federal government is responsible for setting a national policy direction; state governments issue operating permits and development consents; and local governments focus on their own operations and facilities, extending direct community support for renewable energy projects. Different policy techniques have been offered as a means to induce this bottom-up approach. One example is the introduction of a Feed-in-Tariff, in which government buys back surplus electricity from renewable sources at favorable rates. Other financial incentives involve interest free loans and programs
31
providing options to purchase favorable energy technologies at a rebated price (Hamilton, 2013). These potential solutions work to raise awareness of renewable energy issues at the residential level. This is important because there are many actors in the energy services system. To increase autonomy, transparency, and funding, there has to be a push at the local level. For this reason, action at the local level is essential for the uptake of renewable energy, working its way up the chain (Hamilton, 2013).
TechnicalSkillsIn terms of technical skills and education in Australia, 29% of individuals hold a
bachelor degree or higher, 30% acquired a certificate III or higher VET qualification, and 34% are without a post-school qualification (AU Gov, 2015). However, the skill level of the Australian workforce is rising. A higher proportion of workers hold post-school qualifications and higher skilled occupational groups are expected to produce more jobs over the next five years (AU Gov, 2015). This should play an important role in the innovation and maintenance of new marine energy technologies.
6.2PROSPECTOFDEEPOCEANCURRENTTECHNOLOGY
MissingRecords With a coastline 36,735 km long, it is no surprise that investors might look offshore to satisfy their renewable energy needs (Parker, 2015). However, the lack of political leadership and finances has led to troubles with offshore endeavors, especially for underdeveloped technologies (Hamilton, 2013). Australia is one of the few countries that have examined the potential for deep ocean current energy development, considering the abundant potential in global ocean currents surrounding the country. Previous studies have found areas of interest for significant non-tidal ocean currents and have begun measuring maximum power densities to gage their energy potential, but have found that only one third of the energy would be deliverable to the grid (Parker, 2015). This technology is the least mature of all ocean technologies; there exist only a small number of prototypes and demonstration units, and doubt exists on whether or not it will be competitive with current technologies (Parker, 2015). Despite large investment plans, economic modeling on the uptake of ocean renewable energy (ORE) in Australia under a variety of scenarios uncovered an absence of ocean current technologies contributing to the electricity generation mix out to 2050 (Behrens et. al., 2012). Records of the temporal variability of this technology and the speed flow for locations of interest need to mature and be analyzed before further development for these projects to appear economically viable. There have yet to be any ocean current technology companies to receive grants from the federal government (Behrens et. al., 2012).
32
6.3CARNEGIEWAVEENERGYPROJECTDETAILS
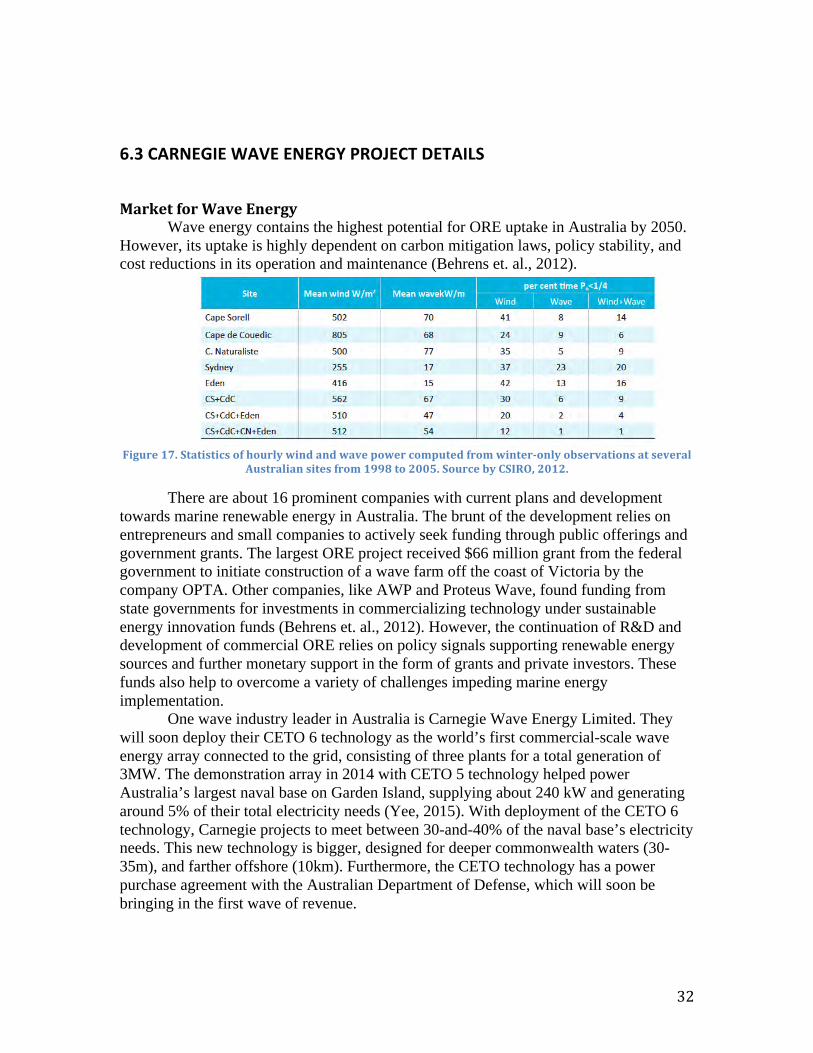
MarketforWaveEnergy Wave energy contains the highest potential for ORE uptake in Australia by 2050. However, its uptake is highly dependent on carbon mitigation laws, policy stability, and cost reductions in its operation and maintenance (Behrens et. al., 2012).
Figure17.Statisticsofhourlywindandwavepowercomputedfromwinter-onlyobservationsatseveral
Australiansitesfrom1998to2005.SourcebyCSIRO,2012.
There are about 16 prominent companies with current plans and development towards marine renewable energy in Australia. The brunt of the development relies on entrepreneurs and small companies to actively seek funding through public offerings and government grants. The largest ORE project received $66 million grant from the federal government to initiate construction of a wave farm off the coast of Victoria by the company OPTA. Other companies, like AWP and Proteus Wave, found funding from state governments for investments in commercializing technology under sustainable energy innovation funds (Behrens et. al., 2012). However, the continuation of R&D and development of commercial ORE relies on policy signals supporting renewable energy sources and further monetary support in the form of grants and private investors. These funds also help to overcome a variety of challenges impeding marine energy implementation. One wave industry leader in Australia is Carnegie Wave Energy Limited. They will soon deploy their CETO 6 technology as the world’s first commercial-scale wave energy array connected to the grid, consisting of three plants for a total generation of 3MW. The demonstration array in 2014 with CETO 5 technology helped power Australia’s largest naval base on Garden Island, supplying about 240 kW and generating around 5% of their total electricity needs (Yee, 2015). With deployment of the CETO 6 technology, Carnegie projects to meet between 30-and-40% of the naval base’s electricity needs. This new technology is bigger, designed for deeper commonwealth waters (30-35m), and farther offshore (10km). Furthermore, the CETO technology has a power purchase agreement with the Australian Department of Defense, which will soon be bringing in the first wave of revenue.
33
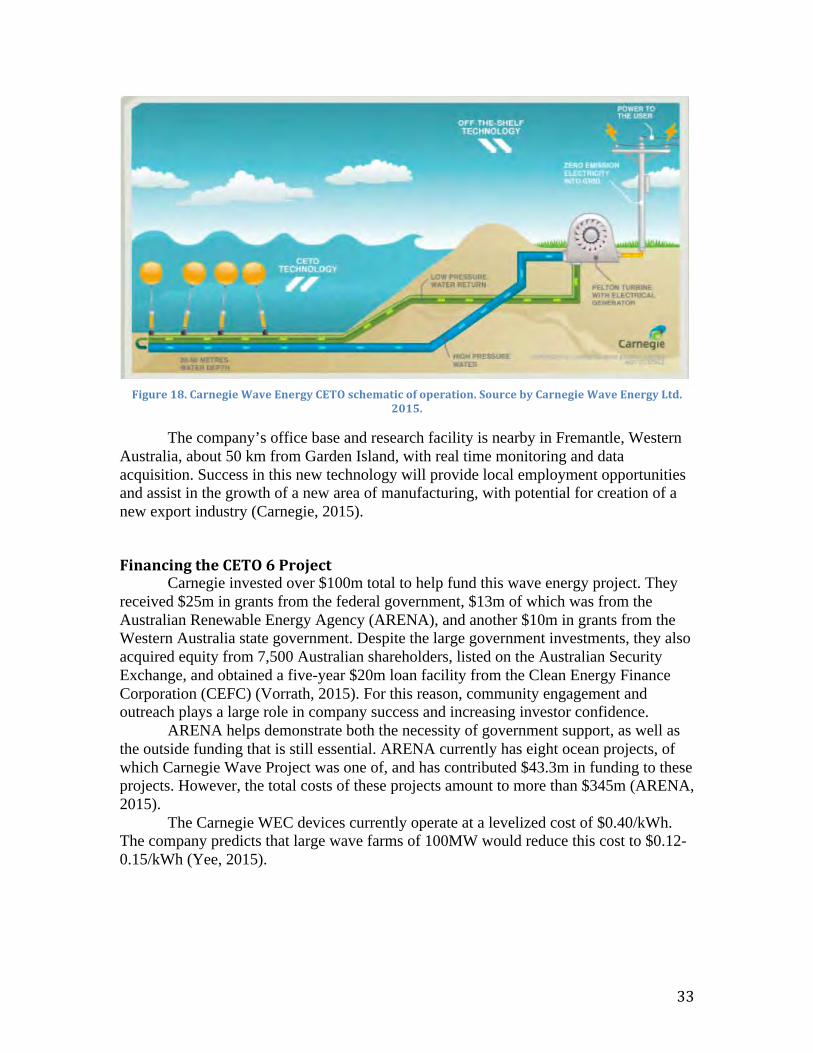
Figure18.CarnegieWaveEnergyCETOschematicofoperation.SourcebyCarnegieWaveEnergyLtd.
2015.
The company’s office base and research facility is nearby in Fremantle, Western Australia, about 50 km from Garden Island, with real time monitoring and data acquisition. Success in this new technology will provide local employment opportunities and assist in the growth of a new area of manufacturing, with potential for creation of a new export industry (Carnegie, 2015).
FinancingtheCETO6Project Carnegie invested over $100m total to help fund this wave energy project. They received $25m in grants from the federal government, $13m of which was from the Australian Renewable Energy Agency (ARENA), and another $10m in grants from the Western Australia state government. Despite the large government investments, they also acquired equity from 7,500 Australian shareholders, listed on the Australian Security Exchange, and obtained a five-year $20m loan facility from the Clean Energy Finance Corporation (CEFC) (Vorrath, 2015). For this reason, community engagement and outreach plays a large role in company success and increasing investor confidence. ARENA helps demonstrate both the necessity of government support, as well as the outside funding that is still essential. ARENA currently has eight ocean projects, of which Carnegie Wave Project was one of, and has contributed $43.3m in funding to these projects. However, the total costs of these projects amount to more than $345m (ARENA, 2015). The Carnegie WEC devices currently operate at a levelized cost of $0.40/kWh. The company predicts that large wave farms of 100MW would reduce this cost to $0.12-0.15/kWh (Yee, 2015).
34
“Micro-grid”forSmallIslandCommunities Carnegie Wave Energy has constructed a micro-grid design aimed at island nations looking to be sustainable. The idea incorporates a local energy grid that combines a wave energy array, solar PV energy, a desalination plant, and energy storage as a cohesive network that can operate independently for small island communities or remote coastal communities. These renewable micro-grids act as an alternative to connecting with the main grid (Vorrath, 2015). Due to this limitation, they cannot optimize economies of scale. However, they can create a sustainable island environment, increasing energy stability and security, reducing dependence and vulnerability to outside fuel sources and prices.
PoliticalChallenges Studies have shown that the implementation of a carbon tax or cap on greenhouse gas emissions affects the potential of ocean renewable energy uptake. These policies, along with renewable energy mandates, are signals to the market for trends in the future energy mix (Behrens et. al., 2012). In Australia, they have experienced an introduction and later removal of a carbon tax. This uncertainty and political instability increases the risk for both companies and investors in these technologies. Without confidence or incentive to develop, project funding and completion is extremely difficult. Furthermore, gaining access to coastal waters for testing and deployment in Australia has posed challenges. Because there are so many competing offshore uses, companies must obtain permits to access certain ocean space for development (Behrens et. al., 2012). Additionally, a government-funded in-water testing facility does not exist, so companies must obtain private ocean access areas.
UncoordinatedResearchEffortandResearchGaps Universities complete most of the prominent energy research, with a few companies and research institutions in on the work, resulting in a rather uncoordinated research effort. There is no main organization leading or directing the field. Furthermore, due to deregulation of the energy market, key decisions are placed in the hands of the private sector. Companies are highly competitive and protective of their technology, which may not be conducive for innovation in an environment that needs fast transitions to new technology (Behrens et. al., 2012).
An important part of uncompleted research involves the unexpected environmental effects of ORE deployment. There are various environmental concerns specific to each chosen site. The construction and physical presence has dynamic, chemical, acoustic and electromagnetic effects. Its presence may impact migratory fish and bird species through collisions or entanglement, as well as creating an artificial reef habitat under water, which may attract more organisms and predators (Paasch, 2012). With the knowledge gap in this area, it is imperative that government regulation increases its role in protecting environmental concerns. The Australian government has constructed a program that includes assessment considerations in environmental impact statements
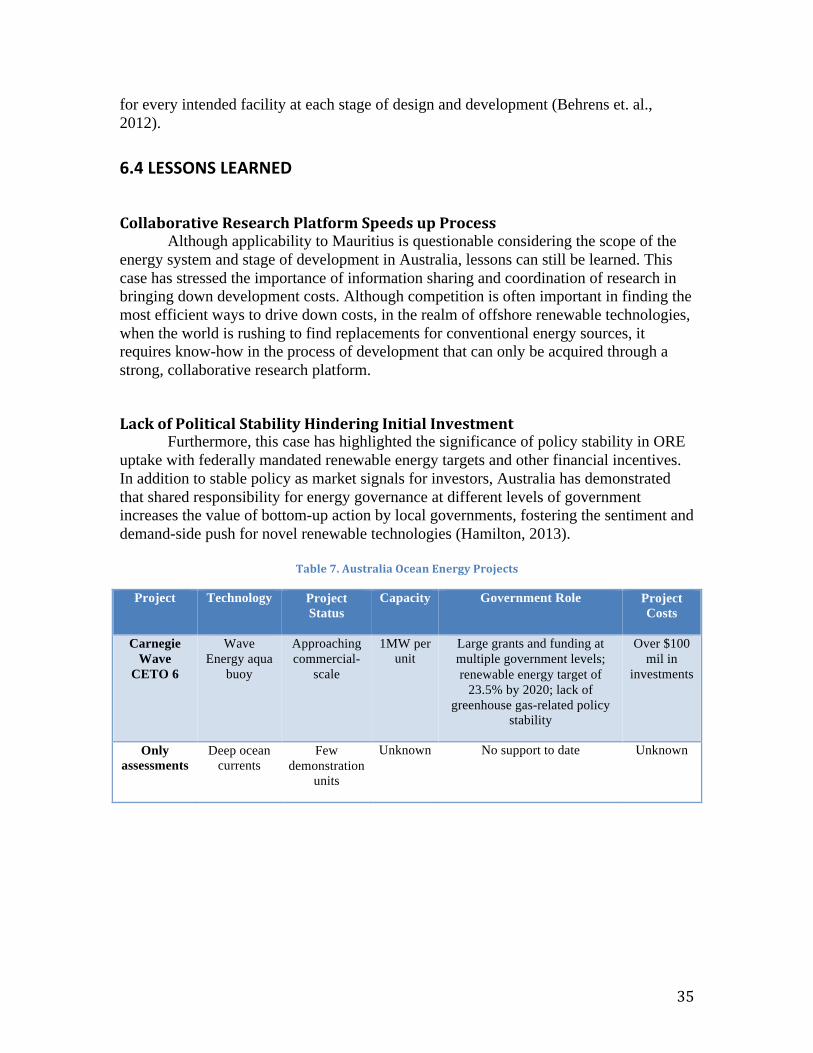
35
for every intended facility at each stage of design and development (Behrens et. al., 2012).
6.4LESSONSLEARNED
CollaborativeResearchPlatformSpeedsupProcessAlthough applicability to Mauritius is questionable considering the scope of the
energy system and stage of development in Australia, lessons can still be learned. This case has stressed the importance of information sharing and coordination of research in bringing down development costs. Although competition is often important in finding the most efficient ways to drive down costs, in the realm of offshore renewable technologies, when the world is rushing to find replacements for conventional energy sources, it requires know-how in the process of development that can only be acquired through a strong, collaborative research platform.
LackofPoliticalStabilityHinderingInitialInvestmentFurthermore, this case has highlighted the significance of policy stability in ORE
uptake with federally mandated renewable energy targets and other financial incentives. In addition to stable policy as market signals for investors, Australia has demonstrated that shared responsibility for energy governance at different levels of government increases the value of bottom-up action by local governments, fostering the sentiment and demand-side push for novel renewable technologies (Hamilton, 2013).
Table7.AustraliaOceanEnergyProjects
Project Technology Project Status
Capacity Government Role Project Costs
Carnegie Wave
CETO 6
Wave Energy aqua
buoy
Approaching commercial-
scale
1MW per unit
Large grants and funding at multiple government levels; renewable energy target of
23.5% by 2020; lack of greenhouse gas-related policy
stability
Over $100 mil in
investments
Only assessments
Deep ocean currents
Few demonstration
units
Unknown No support to date Unknown
36
7.CaseStudy:OffshoreWindEnergyinRhodeIsland,UnitedStates
7.1BLOCKISLANDWINDFARMPROJECTDETAILSDeepwater Wind’s Block Island Wind Farm (BIWF) – situated 18 miles off the
coast of Rhode Island and three miles southeast of Block Island – stands to become America’s first venture into offshore wind energy. The project, scheduled to come online during the fourth quarter of 2016, consists of five turbines, capable of producing 30-megawatts (MW) of electricity (DOI, 2015).
7.2COUNTRYSPECIFICFACTORSDRIVINGMARINERENEWABLEENERGY
EconomicsBlock Island Wind Farm stands as the pilot program for the nascent American
offshore wind energy (The Economist, 2015). As with all significant infrastructure projects, financing for offshore wind energy remains a challenge as banks and equity investors are wary of new technologies and the risks perceived to be associated with large offshore wind energy projects (Hilderbrand et al., 2015). By securing close to $300 million in project financing – enough to secure all debt and equity funding needed for construction – Deepwater Wind succeeded where previous offshore wind projects did not. The project’s owners (i.e., Deepwater Wind) provided more than $70 million in equity funding, with the remainder provided by two finance institutions: Mandated Lead Arrangers Societe Generale of Paris, France, and KeyBank National Association of Cleveland, Ohio (Deepwater Wind, 2016).
The emergence of offshore wind is critical to Rhode Island’s economic success. Sporting the 12th highest unemployment rate (5.9%) in the United States, Rhode Island has struggled to replace lost manufacturing jobs of years past (Del Franco, 2015). The ongoing Block Island Wind Farm project is expected to generated more than 300 local jobs during the construction process, leading to $42 million in net benefits to the state’s economy (Deepwater Wind, 2016). Local jobs include assembly and fabrication components of the project.
In addition to providing clean energy and creating jobs, the offshore wind farm is expected to significantly lower electricity costs for Block Island residents. As currently configured, the island is not connected to the mainland’s grid, instead relying on diesel generators for power. In addition to emitting significant greenhouse gas (GHG) emissions, relying on generators results in enormous energy costs for island residents (The Economist, 2015). A 25-mile long, bi-directional submerged transmission cable will connect the wind farm with the mainland grid. It is anticipated that the wind farm, including the utilization of mainland grid power when necessary – will reduce the average ratepayer’s electricity cost on Block Island by 40% (Deepwater Wind, 2016).

37
Lower electricity rates proved to be a key driver in garnering local support (DOI, 2015; Klain et al., 2015).
Grid connection will also allow for excess renewable power to be sold through a Power Purchase Agreement (PPA) to National Grid, a Rhode Island utility. Alternatively, in times of low wind, Block Island can purchase electricity from the mainland, thereby negating the need for back-up diesel generators. The most significant challenge is in finding markets for energy that is, right now at least, very expensive. Under a 20-year power purchase agreement, the energy from Block Island will go to National Grid at 24.4 cents per kilowatt-hour (kWh), more than double what the utility might pay for energy from conventional sources (Danko, 2015).
PoliticalSupportThe Block Island Wind Farm project clearly benefited from lessons learned by
Cape Wind, an embattled 468 MW offshore wind farm proposed to be built off the coast of Massachusetts’ Nantucket Island that may never get off the ground (Sullivan and Worcester, 2015). Through the years, Cape Wind battled opposition from property owners, environmentalists and special interests that tied up the controversial offshore wind project in the courts. Ultimately, the court cases became such a distraction for the developer that it could not financially close on the project. An ability to reach financial close – a stipulation in its two power purchase agreements – forced utilities to cancel Cape Wind’s power contracts. Now, Cape Wind is on life support.
As opposed to Cape Wind, the success of the Block Island Wind Farm is attributed to the strong support of state and local leaders, who advocated for detailed planning and proper siting of the wind farm, as part of the state’s overall renewables goals and marine spatial planning efforts (DOI, 2015). In particularly, strong political support from former Rhode Island Governors Donald Carcieri and Lincoln Chafee was instrumental in getting the project off the ground (Del Franco, 2015). When the Rhode Island Public Utilities Commission (PUC) rejected the price of its power contract with National Grid, Governor Carcieri intervened and urged the PUC to re-examine the contract under specified provisions, which the PUC later approved.
Governor Chafee was also instrumental in paving the way for approval of the underwater sea cable connecting the project to the grid. Without support from the executive branch, the project might have suffered the same fate as Cape Wind. The Block Island Wind Farm also benefited from the state’s long-term contracting legislation, as well as minimal federal regulatory review due to the project’s location within state waters (Klain et al., 2015).
EnvironmentalImplications Deepwater Wind has completed numerous site-specific environmental analyses of the project location. Accordingly, the project is not anticipated to result in significant adverse impacts on the environment, attributable to: (1) the relatively small scale of the project; (2) the impact avoidance, minimization, and mitigation measures adopted by Deepwater Wind in both the siting and design of the project; and (3) the air quality benefits of the project, given that Block Island currently utilizes diesel generators for
38
electricity production (Deepwater Wind, 2012). Furthermore, the project was designed to account for site-specific oceanographic and meteorological conditions within the project area, thereby avoiding impacts to the surrounding physical processes. Finally, cable routes were sited to avoid direct impacts on important benthic habitats.
7.3LESSONSLEARNED
PublicEngagement:EarlyandOftenConsiderable community engagement is needed when considering offshore wind
farms, as stakeholder engagement, or lack thereof, can influence social acceptance of infrastructure projects (Klain et al., 2015). Throughout the planning and permitting process, Deepwater Wind committed to building a network of involved stakeholders; from utility companies to government agencies, technical experts to academic researchers, local residents to summer vacationers. In an effort to enhance community relations, Deepwater Wind went as far as to hire a community liaison, whose job was to transmit information to the community and relay community concerns and questions (Battista, 2015).
All interested and involved parties were brought together in order to collaborate and share information. Such collaboration among all stakeholders resulted in an Ocean Special Area Management Plan, which united a variety of information about the ocean environment and its numerous users (Battista, 2015). The Plan, commissioned by the Rhode Island Coastal Resources Management Council, tasked the University of Rhode Island’s ocean experts to develop a list of potential site locations for offshore wind Del Franco, 2015). Such a collaborative effort instilled a bottom-up approach, soliciting advise from numerous stakeholders, as opposed to a traditional top-down approach.
First-MoverPossibilityintheUnitedStatesOffshore wind in the United States, though long touted as the next big addition to
the energy mix, remains in its infancy. In order for the offshore wind industry to manifest itself in the U.S., it needs long-term visibility. The BIWF is hopefully the first, of many, offshore wind projects in the U.S.
As the nation’s pioneering offshore commercial wind farm, the lessons learned from the Block Island project about facility design, fabrication and installation will hopefully inform future offshore wind project development. Remote communities’ limited resources and high energy costs threaten their long-term sustainability and economic viability. It is imperative to have transparent policy support mechanism in place, ones in which initial capital investment of wind energy is supplied. Clear, consistent policies for renewable energy result in long-term visibility for the energy industry. The project demonstrated the importance of forward-looking vision and good working partnerships.
The only existing, established supply chain to support offshore wind energy is in Europe (Hilderbrand et al., 2015). Accordingly, European suppliers have a competitive advantage over their U.S counterparts. Existing wind energy activities in the United
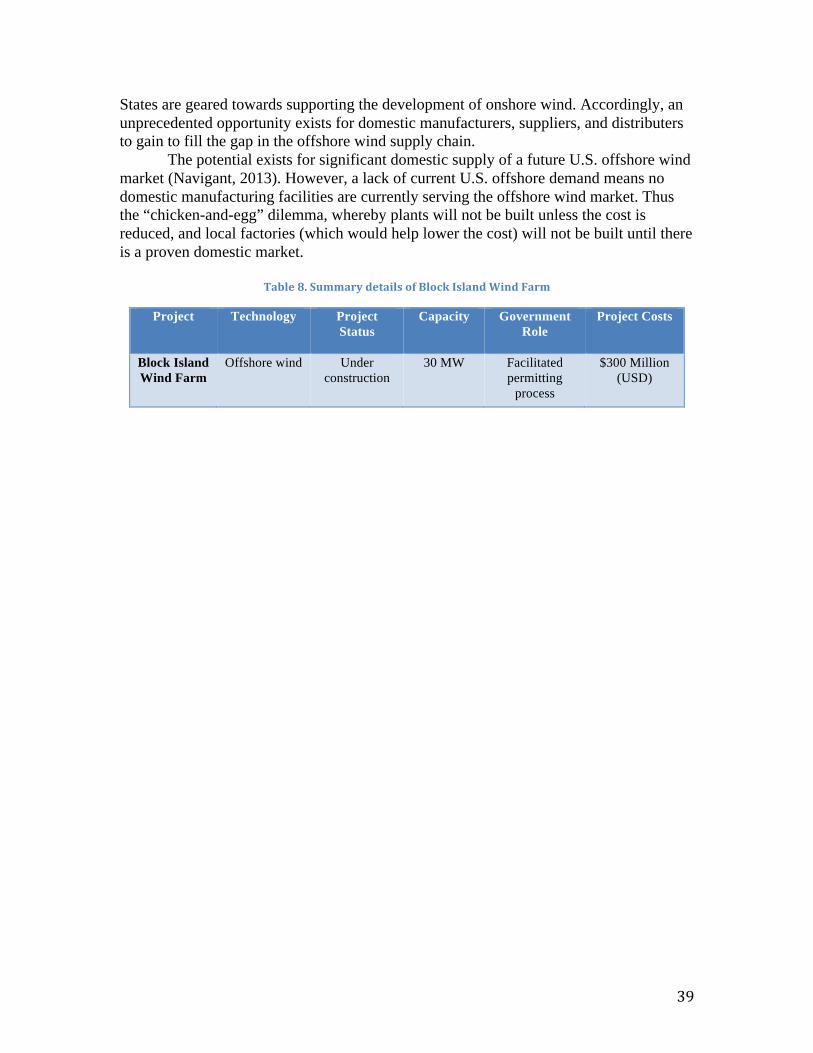
39
States are geared towards supporting the development of onshore wind. Accordingly, an unprecedented opportunity exists for domestic manufacturers, suppliers, and distributers to gain to fill the gap in the offshore wind supply chain. The potential exists for significant domestic supply of a future U.S. offshore wind market (Navigant, 2013). However, a lack of current U.S. offshore demand means no domestic manufacturing facilities are currently serving the offshore wind market. Thus the “chicken-and-egg” dilemma, whereby plants will not be built unless the cost is reduced, and local factories (which would help lower the cost) will not be built until there is a proven domestic market.
Table8.SummarydetailsofBlockIslandWindFarm
Project Technology Project Status
Capacity Government Role
Project Costs
Block Island Wind Farm
Offshore wind Under construction
30 MW Facilitated permitting
process
$300 Million (USD)

40
9. CaseStudy:OffshoreWindEnergyinDenmark
9.1PROJECTDETAILSWith more than 7,000 kilometers (km) of coastline, Denmark boasts some of the
best conditions for wind energy in the world (Jeppeson, 2014). In 1991, the world’s first offshore wind farm was erected off the coast of Vindeby, Denmark (Heylleberg, 2014). Presently, there are 13 offshore wind farms in Denmark, with a combined installed nameplate capacity of 1,271 megawatts (MW).
The Anholt wind farm, with a capacity of 399.6 MW, is situated 15 kilometers (km) from the coast. The project consists of 111 turbines, each with a capacity of 3.6 MW. Located in water depths of 15-10 meters (m), the turbines are grounded into the seabed via a monopole foundation. The Middelgrunden wind farm is located 4.7 km from the shore, in water depths of 3-5m. Twenty wind turbines, with individual capacities of two megawatts, combine to give this project a nameplate capacity of 40MW. The turbines are grounded to the seabed via a gravity-base.
9.2COUNTRYSPECIFICFACTORSDRIVINGMARINERENEWABLEENERGY
EconomicsCosts for the Anholt wind farm were more than $1.5 billion USD. In comparison,
the cost for the Middelgrunden wind farm was roughly $50 million USD (4C Offshore, 2016). While both projects are expensive, the advanced nature of the Danish offshore wind sector has enabled the country to become arguably the world’s leader in production, design, manufacturing, and installation of offshore wind turbines (Temizer, 2016). Today, nearly 500 companies work within the Danish wind energy sector, supporting more than 28,000 jobs (State of Green, 2015).
Hundreds of companies involved in the Danish offshore wind industry are clustered together to form a substantial hub of offshore wind expertise (Heylleberg, 2014). Such proximity enables enhanced collaboration among industry stakeholders. Further innovation is spurred by close partnerships between the offshore wind industry and Danish universities. Denmark’s role as a first-mover of offshore wind energy is evident in new offshore wind projects around the globe, as Danish companies have installed more than 90% of the world’s existing offshore wind farms (Succar, 2009).
PoliticalSupportAlthough rich in natural resources, Denmark was heavily reliant on imported
fossil fuel until the 1970s, when soaring oil prices hit many countries around the world (State of Green, 2015). Denmark, which imported petroleum to meet 90% of its energy
41
needs, was hit with skyrocketing electricity costs (Roselund and Bernhardt, 2015). Desiring to become independent of imported oil, and facing societal pressure to steer clear of nuclear power following the Chernobyl disaster, the Danish Government began funding a development program for wind energy. The government subsequently subsidized research on wind turbines, supporting emerging technology development through a package of favorable policies and financial incentives. Such policies led to direct market stimulation, propelling the rise to an emergent wind industry in Denmark, pioneered by homegrown manufacturing companies (Roselund and Bernhardt, 2015). Onshore wind development eventually transitioned to new frontiers offshore.
The success to-date of the Danish wind power industry can be attributed to systematic and effective policy interventions over the past three decades in support of wind and other renewable energy-related industries. Denmark is a nation with green growth ambitions, in which the Danish government has pledged to have a fully renewable electricity supply by 2035 (Megavind, 2014). To accomplish such an ambitious goal, wind power is expected to be a main production contributor.
By initiating preemptive environmental reviews of the coastline, the Danish government makes it easier for wind developers to find suitable locations for offshore wind turbines. Furthermore, when planning a potential project, offshore wind farm developers must interact with only one government agency: the Danish Energy Agency. Such simplicity streamlines the regulatory process, whereby a project can proceed from initial proposal to construction in roughly two years. Relatedly, there are only two opportunities to challenge the process in court. Finally, the Danish government has provides a ‘Feed-in Tariff’ to wind farm developers, which enables consumers to purchase wind energy at a price that is competitive with traditional sources (Gerry-Bullard, 2011).
EnvironmentalImplications Offshore wind farms impact their natural surroundings, and it is therefore essential to ensure that conditions in unique marine areas are not detrimentally affect. Spatial planning is critical to ensure that offshore wind farms are situated in areas that do not incur unnecessary harm of marine life. Danish experience from the past 15 years has shown that offshore wind farms, if located appropriately, can be engineered and operated without significant damage to the marine environment and vulnerable species (DONG Energy, 2006). Comprehensive environmental monitoring programs enacted by the Danish government have shown that wind farms, including large capacity farms, pose low risks to birds, mammals, and fish. The monitoring programs charted environmental conditions before, during, and after the construction of multiple offshore wind farms. However, critics argue that offshore wind farms are a significant stressor in the marine environment, noting that alteration in acoustic activity and swimming behavior has been observed in several cetacean species during pile-driving activities during the construction of offshore wind farms (Solan and Whiteley, 2016).

42
9.3LESSONSLEARNED
CommunitySupportasaDrivingInfluenceGenerally speaking, there is a long-held broad acceptance to wind energy in
Denmark, as opinion polls result in at least 70% being in favor of wind energy, whereas about 5% are against (Sørensen et al., 2002). One frequently cited reason for the favorable acceptance of wind farms is the development of local cooperatives for wind projects. Local communities to wind farm projects are encouraged to become engaged in the projects through local joint ownership. The notion behind wind turbines cooperatives and the option to purchase is to create a correlation between the benefits and joy and the inconvenience of living close to a wind turbine (Sørensen et al., 2002).
The Middelgrunden offshore wind farm, located just off the coast of Copenhagen, is co-owned by 8,700 local citizens, totaling a 50% ownership stake in the project (State of Green, 2015). At the time of commissioning, an innovative model of public ownership was created in order to establish local acceptance for the project. Groups of local residents came together to form a customized cooperative – the Middelgrunden Wind Turbine Cooperative – in which local citizens purchased 40,500 shares of the project. The operating utility company – DONG Energy – owns the remaining share. The Middelgrunden Cooperative’s primary focus during the construction phase was the dissemination of information with local residents in regards to the wind farm project, which in turn served to increase the local acceptance of the project. An open public dialogue from the very beginning of a planning phase is crucial for achieving social acceptance, which may also ultimately influence political decisions (Larsen et al., 2005).
InterconnectivityoftheElectricityGrid Reliably integrating wind power generation into an existing grid system is
imperative, given the inherent variability in harnessing wind. In Denmark, grid interconnections with neighboring countries proved pivotal, allowing Danish utilities to export excess power on windy days and to import power in times of low wind. Denmark possesses a multitude of regional interconnections, with undersea cables connecting to Sweden and Norway, in addition to overland transmission to Germany (Roselund and Bernhardt, 2015). In particular, the utilization of hydropower – an incredibly flexible and responsive energy source – in Norway and Sweden enables Denmark to balance the stochastic variations in wind power and meet consumer electricity demands (Succar, 2009). Alternatively, on windy days, unused wind power within the Danish grid can be transmitted to Norway, which generates 99% of its electricity from hydropower (Gonzalez et al., 2011). Halting the use of hydropower in Norway during times of excess wind in Denmark effectively stores Danish wind power in Norway. Strong grid connectives, coupled with responsive power plants in neighboring countries, certainly helped propel the development of offshore wind within Denmark.
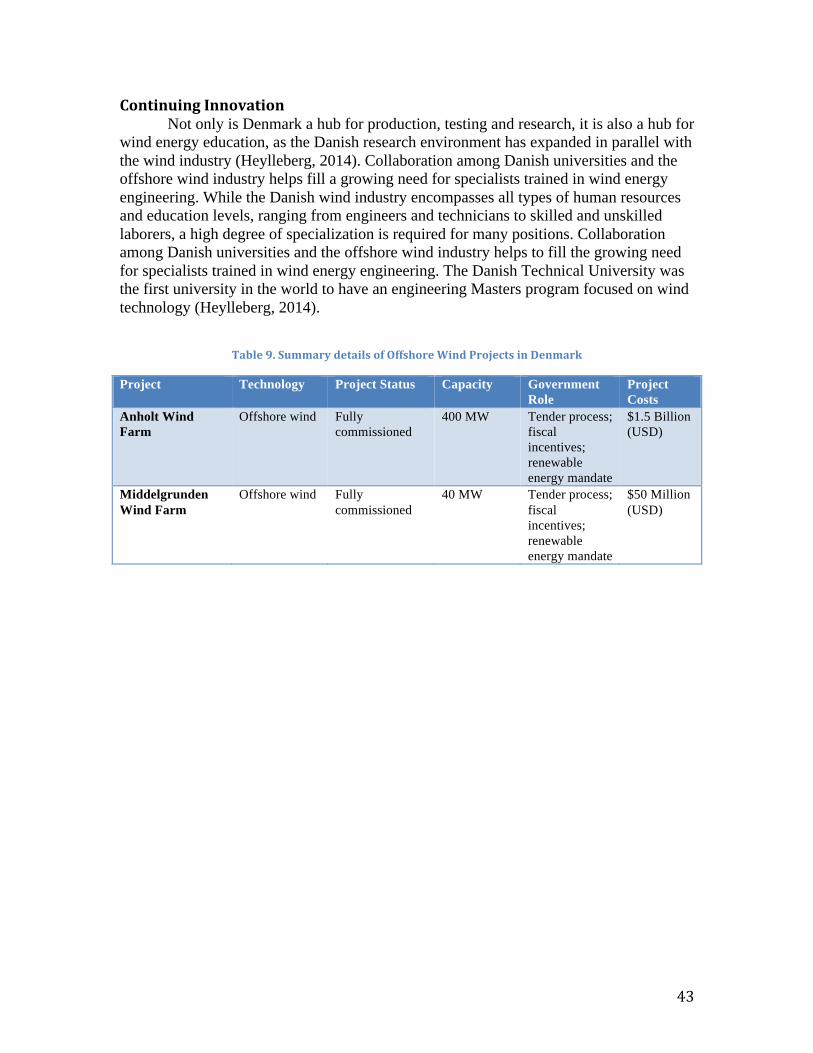
43
ContinuingInnovation Not only is Denmark a hub for production, testing and research, it is also a hub for
wind energy education, as the Danish research environment has expanded in parallel with the wind industry (Heylleberg, 2014). Collaboration among Danish universities and the offshore wind industry helps fill a growing need for specialists trained in wind energy engineering. While the Danish wind industry encompasses all types of human resources and education levels, ranging from engineers and technicians to skilled and unskilled laborers, a high degree of specialization is required for many positions. Collaboration among Danish universities and the offshore wind industry helps to fill the growing need for specialists trained in wind energy engineering. The Danish Technical University was the first university in the world to have an engineering Masters program focused on wind technology (Heylleberg, 2014).
Table9.SummarydetailsofOffshoreWindProjectsinDenmark
Project Technology Project Status Capacity Government Role
Project Costs
Anholt Wind Farm
Offshore wind Fully commissioned
400 MW Tender process; fiscal incentives; renewable energy mandate
$1.5 Billion (USD)
Middelgrunden Wind Farm
Offshore wind Fully commissioned
40 MW Tender process; fiscal incentives; renewable energy mandate
$50 Million (USD)
44
10.CaseStudy:FloatingPhotovoltaicandOceanThermalEnergyConversioninJapan
10.1COUNTRYSPECIFICFACTORSDRIVINGMARINERENEWABLEENERGY
DiversifyingCurrentEnergyMixJapan is the world’s largest importer of liquid natural gas, consuming 33% of the
global market’s supply (The Japan Times 2016). Japan derives 27% of the country’s total power supply from natural gas and 43% of the country’s total power supply from coal (The Japan Times 2016). Oil comprises the largest share of energy in Japan; Japan is the third largest consumer of oil after the US and China (The Japan Times 2016). Although liquid natural gas demand is likely to rapidly increase, Japan must find equilibrium between rising liquid nitrogen prices, rising electricity prices, and the country’s substantial public debt of 200% of its gross domestic product. Due to rising oil costs in recent years, Japan has promoted the diversification of its energy supply, calling for the use of natural gas, oil, coal, nuclear energy, hydropower, other renewable technologies, and geothermal energy (The Japan Times 2016).
In 2013, Japan’s energy self-sufficiency rate measured 4% with photovoltaic technologies accounting for 95% of newly introduced renewable energy (World Nuclear News 2016). Residential use of photovoltaic systems accounts for 80% of total installed photovoltaic generation capacity. Estimated generation capacity for residential use is 1.379 million kW and for non-residential use is 2.12 million kW (World Nuclear News 2016). Japan strives to expand its renewable energy capacity to 85.83 GW by 2020. Of this, 21 GW will come from hydropower. Japan aims to reach a total photovoltaic capacity of 28 GW and a wind capacity of 5 GW in the next decade (World Nuclear News 2016). If achieved, photovoltaic energy will account for one-third of the total renewable energy capacity.
SocialWillingnesstoSwitchAlthough the cost of energy supplied from renewable energy systems is greater
than that of energy supplied from fossil-fuel systems, it does not prevent the spread of renewable energy systems. As demonstrated by an experiment that used contingent valuation method, which employs a survey-based economic technique to value environmental conservation, Japanese households are willing to pay more for renewable energy (Wüstenhagen, Wolsink, and Bürer 2007). In this experiment, willingness was demonstrated through their payment of a flat monthly surcharge for renewable energy. Results of the experiment showed that the public became more receptive to renewable energy when offered increasingly efficient technologies that reduced carbon-dioxide emissions and reduced resource depletion (Wüstenhagen, Wolsink, and Bürer 2007).
With the help of subsidies from the Ministry of Economy, Trade, and Industry between 1994 and 1999, the public purchased 32,992 residential, non-floating photovoltaic systems (Flavin and Dunn 2016). The resulting capacity totaled 107.9 MW
45
(Flavin and Dunn 2016). Although photovoltaic systems are priced higher than grid energy, many people prefer the installation of this renewable form of energy (Nomura and Akai 2004). This in turn demonstrates that the population places a higher value on electricity generated by renewable sources.
Japanese consumers who view environmental issues as significant and believe that promoting renewable energy technologies will mitigate such issues are more likely to value said technologies (Nomura and Akai 2004). In turn, their value for renewable energy translates into their willingness to pay premiums for renewable energy. Consumers who see future potential of renewable energy technologies are more willing to pay than those consumers who do not. The amount of willingness to pay is likely to increase when renewable energy systems become more familiar and their efficiency becomes more widely known to the general public (Nomura and Akai 2004).
10.2FLOATINGPHOTOVOLTAICPROJECTDETAILS
KyoceraCorporationAccomplishments The Kyocera Corporation completed a project in Japan’s Hyogo prefecture that
produces 2,680 MWh/yr—enough to supply 820 typical households (Owano 2015). The installation was completed in June 2015 and measures over 270,000 ft2 (Owano 2015). The system contains 9,100 solar panels and sells energy to Kansai Electricity Power in Osaka, Japan, for $780,000 annually (Owano 2015).
Additionally, the Kyocera Corporation constructed a floating photovoltaic system on the Yamakura Dam reservoir in Chiba Prefecture, Japan that generates 13.4 MW of energy and spans a water surface area of 1,937,504 ft2 (Yamakura Dam 2016). The electricity generated at the solar plant is sold to Tokyo Electric Power Co. for an estimated $78.7 million/year (KYOCERA 2012). The plant contains 50,000 modules, generates 16,170 MWh/yr, and powers 4,700 households (KYOCERA 2012). This plant became operational in March 2016 (Yamakura Dam 2016).
The Kyocera Corporation launched Japan's largest floating photovoltaic power plant on November 4, 2013. This plant is known as the Kagoshima Nanatsujima Mega Solar Power Plant and generates 70 MW of energy—enough to supply 22,000 local households (Power Technology 2016). The plant spans more than 13.6 billion ft2 and contains approximately 290,000 solar panels (Power Technology 2016). Generated electricity is sold back to the national grid through a local utility company.
The Kyocera Corporation also constructed a total of 2.9 MW worth of installations over Nishihira Pond and Higashihira Pond (Mollman 2015). The two stations generate 3,300 MWh/yr—enough electricity to power 920 typical households (Mollman 2015). The system began generating energy in April of 2015.
Kyocera plans to begin the operation of thirty floating solar photovoltaic systems across Japan during the 2015–2016 fiscal year (Power Technology 2016).

46
GovernmentofKawajima-machiContribution The government of Kawajima-machi, located in Saitama Prefecture, Japan,
developed a 7.5 MW solar power plant on the surface of Umenokifurukori reservoir (Upadhyay 2014). The reservoir spans 1,399,308 ft2 and contains 27,456 panels (Upadhyay 2014). The construction began in January of 2015 and power generation began in October of 2015 (Upadhyay 2014). Kawajima Taiyo To Shizen No Megumi Solar Park, a company established by Smart Energy that offers financial advice and strategic investment to climate change mitigation projects, operates and in turn generates power for the project (Upadhyay 2014).
Solar-on-the-WaterOkegawaBuiltinSaitamaPrefecture In June 2013, the West Holdings Group constructed and began operation of the Solar on the Water Okegawa floating photovoltaic plant. The plant is located on the reservoir of Okegawa Tobu Industrial Park in Okegawa City, Saitama Prefecture. The system houses 4,500 solar panels that float on a surface area of 133,472 ft2 (Movellan 2013). Maximum output of the project amounts to 1.2 MW and expected power generation capacity measures 1,250 MW/yr (Movellan 2013). Okegawa City owns the reservoir and the West Holdings Group constructed and operates the plant. Okegawa City earns $18,555 per year in rent from the water service until 2033 from Japan Mega Solar Power Co, which is affiliated with the West Holdings Group (Movellan 2013). The facility contains a stand-alone operation capability and removable secondary batteries to serve as a regional emergency power supply (Movellan 2013).
PotentialforFloatingPhotovoltaicinHyogoPrefecture The Hyogo Prefecture contains the largest number of irrigation ponds. Consequently, the local government aims to install 800 MW worth of non-residential photovoltaic systems by 2020, including floating photovoltaic systems.
FloatingPhotovoltaicMoreCostlythanTraditionalPhotovoltaicFloating photovoltaic systems are more expensive than traditional photovoltaic
systems. Century Tokyo Leasing finances the majority of the proposed and undertaken projects mentioned (KYOCERA 2016). The Kyocera Group provides solar modules and necessary equipment. The company supplies funds for construction, operation, and maintenance (KYOCERA 2016). The modules are installed on patented Hydrelio floating platforms manufactured by the French company Ciel el Terre.
GovernmentActivelyPromotesGrowthofOffshoreEnergyTechnologies Central and local governments have successfully increased floating and onshore photovoltaic installations through subsidies that were reintroduced in 2009 by the Ministry of Economy Trade and Industry (World Nuclear News 2015). The Japanese government also implemented the Excess Electricity Purchasing Scheme of Photovoltaic
47
Electricity in November 2009 (Takase 2014). The scheme started out with a relatively high buy-back price of 42 cents per kWh and then, after shifting to the Feed in Tariff Scheme, reduced rates to 38 cents per kWh (Takase 2014). These programs significantly increased photovoltaic installations by mandating utilities to purchase a surplus of solar electricity at a fixed rate, which is twice as much as the market price of electricity, for ten years from residential photovoltaic installations below 10 kW (Norton Rose Fulbright). As of April 2016, the Feed in Tariff rate has decreased by 11%; now, solar plants that are larger than 10 kW will have a buy-back price of .21 cents per kWh—a slight decrease from the previous buy-back price of .24 cents per kWh (Clover 2015). Combined, these factors have led Japan to possess the third largest solar photovoltaic capacity after Germany and Italy.
The technology allows the lake/reservoir owner an opportunity to earn rent and business tax. The systems enable power plant operators to rent relatively cheaper property without land reclamation costs.
PotentialNegativeEnvironmentalConsequencesofFloatingPhotovoltaicOne of the main environmental concerns for this technology is how the structures
will withstand natural disasters. Although able to withstand earthquakes, typhoons, and waves over three feet high, this system is not yet designed for rough, salty offshore conditions (Owano 2015) In turn, it is not feasible in oceanic settings. Another environmental concern of floating photovoltaic systems is their ability to reduce algae growth beneath the systems. Although this could be useful in reducing excessive algae growth due to agricultural runoff, it also has the potential to lessen the supply of algae for endangered species. This effect of this phenomenon depends on the types of species beneath the floating systems.
10.3OCEANTHERMALENERGYCONVERSIONPROJECTDETAILS
Kumejima,OkinawaOTECPlantKumejima, part of the Okinawa prefecture of Japan, has implemented an ocean
thermal energy conversion project (OTEC). The company OTEC Okinawa began installing the 50kW OTEC facility on Kumejima in January 2013 (Kume Guide). After generating power for the first time in March 2013, the facility has continued generating clean energy. The facility is currently scheduled to continue operating through March 2017. The OTEC plant is used for practical testing of optimization of output; it also allows for studies of the viability of commercialization of OTEC technologies in Japan following the 30kW OTEC plant demonstration project constructed in 2009 in Saga, Japan (Kume Guide).
Xenesys, one of the contracting companies involved, estimated the possibility of future OTEC technologies to increase intake of deep seawater to 100,000 tons per day and to have 1.25 MW of OTEC power capacity (Wageningen UR 2014). This in turn would supply 10,600 MWh/yr of electricity—10% of Kumejima’s total annual consumption (Wageningen UR 2014).
48
FinancialBackingforKumejima,OkinawaPlant Implementation has been contracted to IHI Plant Construction Co., Yokogawa Solution Services Co., and Xenesys Inc (OTEC News 2012). Xenesys designed and manufactured the power generation unit and heat exchangers. Yokogawa designed, manufactured and engineered monitoring and control systems for the generation unit (OTEC News 2012). Yokogawa also produced electronics for the interconnected power schemes. IHI developed and constructed the entirety of the facility.
OTECEnergyGenerationProcessDaily, 13,000 tons of seawater are pumped from a depth of 2,007.87 feet to
Kumejima (Martin 2013). This water is typically between 6°C and 8°C. The water is used for cooling, energy generation, aquaculture, and the production of drinking water, salts, and cosmetics (Martin 2013). The plant generates electricity from a thermal expansion turbine that is propelled by temperature variations between warm surface water and cold deep-sea water.
The deep-water facility includes a research station and a deep-water tower from which water is further distributed. Around the institute is a 10-hectare industrial park. Companies located in the park are directly connected to the deep water supply, while companies located at a further distances obtain deep seawater at the “fuel” station for tank wagons (Martin 2013).
21stCenturyVisionofOkinawaDrivesDevelopmentofOffshoreRenewablesThe government created a document entitled The 21st Century Vision of Okinawa
in an effort to realize a low-carbon island society. The promotion of research and development of ocean energy is a major component of this plan. Other sects of this document aim to reduce the environmental impact of local energy production and to promote the regional characteristics of Okinawa. The fundamentals goals of this document include: to measure the amount of power generation as influenced by changes in weather and temperatures, to conduct empirical studies on techniques for obtaining a stable output, to study advanced composite utilization of surface water and deep seawater, and to study the possibility of establishing offshore-type OTEC facilities in Okinawa (OTEC Okinawa).
This system is the first of its kind in the world and is part of the Okinawa Prefectural Deep Sea Water Research Institute. The plant was developed using a continuing dialog on clean energy with the National Energy Laboratory of Hawaii Authority. Engineers from the Institute of Ocean Energy at Saga University designed the system.
GreaterResearchConcerningEnvironmentalImpactsofOTECNeededAlthough the 1980 environmental impact studies of OTEC observed that the
benefits of OTEC technologies outweighed its negative impacts, it is necessary to further study the influence of this technology on the environment. Specific influences include: withdrawal and discharge of water, impingement and entainment, biocides,
49
electromagnetic fields, physical platforms and noise pollution (Energy and the Environment 2012).
Discharged water is cooler, denser, and higher in nutrients than the water it interacts with post-discharge (Energy and the Environment 2012). In turn, the effect of this aspect of OTEC technology on the marine ecosystem should be studied. Often, larger marine species enter OTEC facilities through warm and cold-water intake systems. This phenomenon, impingement, may take place when marine organisms become trapped against the intake screen (Energy and the Environment 2012). Smaller organisms that pass through the intake screen are likely to be entrained (drawn along) with the system. Both process are lethal for marine organisms. Water used for OTEC facilities contain biocides such as chlorine. Although the concentration of biocide in said water meets standards of the Clean Water Act, the toxin may result in a negative environmental consequence. The electromagnetic field of the cable responsible for transporting energy to shore may influence navigation and other behavior of marine organisms (Energy and the Environment 2012).
10.4LESSONSLEARNED
GovernmentPromotesDemand-sidePush The Japanese case studies highlight the importance of government involvement in the development of offshore energy technologies. Solar Feed in Tariffs, implemented by the government, boost the production of onshore and offshore photovoltaic technology production. Similarly, the 21st Century Vision of Okinawa served as one of the impetuses for the deployment of OTEC technologies in Japan. In addition, societal members play significant roles in the success of marine renewable technologies. As observed in the contingent valuation experiment, the majority of Japanese citizens are in favor of adopting more renewable systems.
Finally, it was noted that while offshore renewables offer certain benefits over onshore technologies, they often face difficulties in development and implementation due to economic factors. Technologies such as OTEC and floating photovoltaic in Japan are still in the process of becoming more commercially viable. This can be achieved through governmental subsidies and the continued implementation of such technologies to achieve wider deployment.
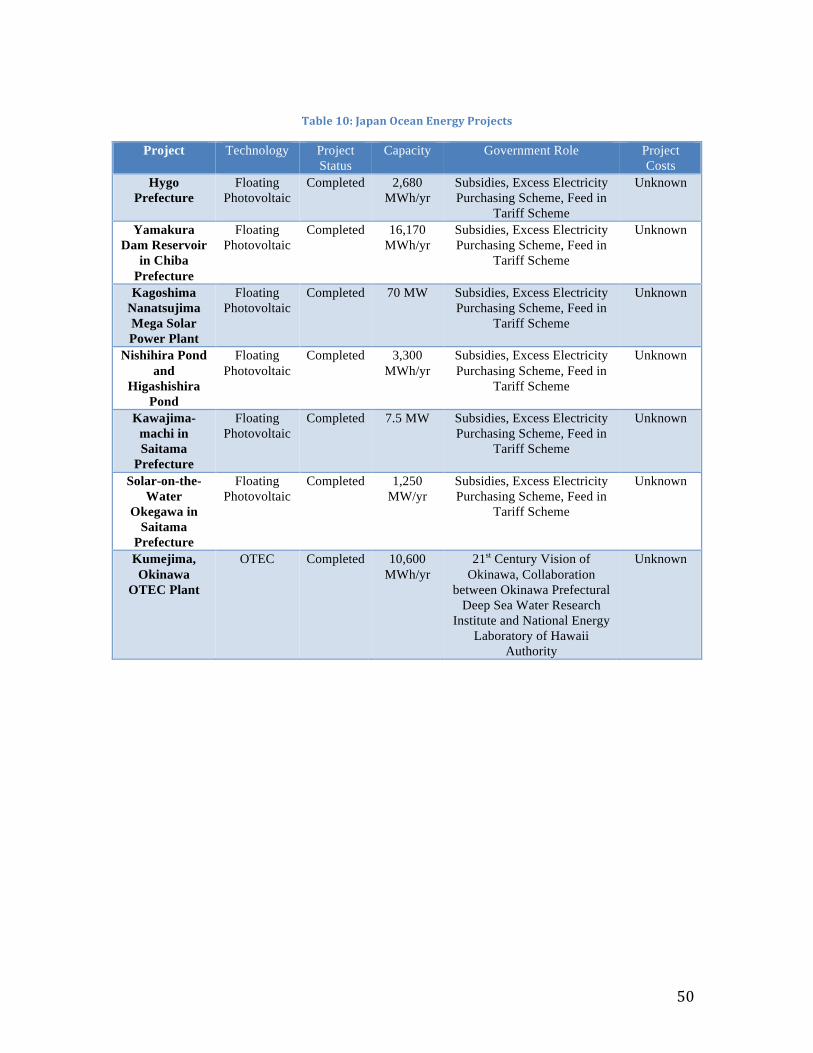
50
Table10:JapanOceanEnergyProjects
Project Technology Project Status
Capacity Government Role Project Costs
Hygo Prefecture
Floating Photovoltaic
Completed 2,680 MWh/yr
Subsidies, Excess Electricity Purchasing Scheme, Feed in
Tariff Scheme
Unknown
Yamakura Dam Reservoir
in Chiba Prefecture
Floating Photovoltaic
Completed 16,170 MWh/yr
Subsidies, Excess Electricity Purchasing Scheme, Feed in
Tariff Scheme
Unknown
Kagoshima Nanatsujima Mega Solar Power Plant
Floating Photovoltaic
Completed 70 MW Subsidies, Excess Electricity Purchasing Scheme, Feed in
Tariff Scheme
Unknown
Nishihira Pond and
Higashishira Pond
Floating Photovoltaic
Completed 3,300 MWh/yr
Subsidies, Excess Electricity Purchasing Scheme, Feed in
Tariff Scheme
Unknown
Kawajima-machi in Saitama
Prefecture
Floating Photovoltaic
Completed 7.5 MW Subsidies, Excess Electricity Purchasing Scheme, Feed in
Tariff Scheme
Unknown
Solar-on-the-Water
Okegawa in Saitama
Prefecture
Floating Photovoltaic
Completed 1,250 MW/yr
Subsidies, Excess Electricity Purchasing Scheme, Feed in
Tariff Scheme
Unknown
Kumejima, Okinawa
OTEC Plant
OTEC Completed 10,600 MWh/yr
21st Century Vision of Okinawa, Collaboration
between Okinawa Prefectural Deep Sea Water Research
Institute and National Energy Laboratory of Hawaii
Authority
Unknown
51
11.OverallLessonsLearnedfromCaseStudies The case studies offer technical, political and economic takeaways. To begin, it is noted that coordinated research effort and testing facilities are integral to the successful development of offshore renewables. It is beneficial to test technologies throughout their life cycles and in multiple conditions to ensure confidence in systems. Marine Spatial Planning has played a key role in optimizing tradeoffs of ocean space when deciding which technologies to implement and on what scale. In terms of political takeaways, case studies have shown that government’s support or lack of support often determines the success of projects. Unclear permitting and licensing processes hinder development of offshore technologies. Energy plans help steer industry in the right direction, but can be ineffective without clear strategies for achieving energy goals or transitions. Governments can encourage private investment in novel renewable energy sectors through policy that creates a demand-side push of these technologies. Furthermore, financial incentives provided by all levels of government can bolster any stage of offshore renewable technology development. Economic lessons demonstrate the effects of high upfront costs and capital investments on project development. These costs have proven to be a consistent roadblock for many cases and across all marine technologies studied here. However, there are factors that can reduce these costs. These factors include a learning curve, economies of scale, and a domestic supply chain. Additionally, some case studies demonstrate that stakeholder engagement and communication are critical for private companies to maintain positive investor sentiment, and therefore the economic viability of these systems.
52
12.ImplicationsforMauritius
Researchers have disclosed findings about the applicability of aforementioned technologies to the Mauritian context. The discussed case studies may be applied to Mauritius by observing governmental regulations, site feasibility, and range of generation capacity and cost of different technologies. The development and implementation of all systems hold the potential for short-term construction jobs. The majority of materials will be imported and not built on Mauritius. Development and implementation of offshore renewables also provides some maintenance jobs for more skilled workers.
12.1OFFSHOREWINDBased on various studies, the total offshore wind energy generation potential for
Mauritius is 250 MW (The Wind Power 2015). The Batelle Report claims that Mauritius is a prime location for offshore wind because of the South Eastern Trade Winds that result in substantial wind force for long periods of time, especially in the winter (The Wind Power 2015). The Mauritius Research Council recently concluded that offshore wind farms demonstrate potential for large-scale developments in the waters of Mauritius based on previous trials (Board of Investment Mauritus).
Because of the significant potential for offshore wind energy generation, there exist various conceptual offshore wind projects located off the shores of Flic en Flac, Mahenbourg, and the Southern Coast of Mauritius (Suddhoo 2012). One specific proposal, the Hexicon Offshore Wind Farm, has been planned in greater detail than the rest. Hexicon intends to install two floating platforms with a total of 48 turbines, which will generate between 72 and 172.8 MW of energy (HEXICON 2016). This project is to be developed by Greenery Indian Ocean Ltd., however, the development status is currently dormant due to financing difficulties. Regulatory trends from previous case studies have bolstered the success of offshore wind technologies. In Scotland, for example, the government passed the Climate Change Act in 2009 that set statutory targets of minimum 42% emissions cut by 2020 and 80% emissions cut by 2050. The Scottish Executive also set the ambitious target of achieving 100% electricity from renewable sources by 2020. In order to achieve these goals, the Executive implemented Feed in Tariffs that allow renewable energy generators to sell their electricity at regulated prices per kWh to suppliers. The Scottish government wind turbine Original Equipment Manufacturers have demonstrated significant interest in wind potential and are in turn exploring offshore wind opportunities. Similarly, the Danish Energy Agency supports electricity production from renewable sources through price premiums added to the market price and tenders for offshore wind power. Subsidy costs are passed on to consumers as an equal public service obligation. The Danish government has supported long-term research and development, premium tariffs and ambitious national targets since the 1980s in an effort to bolster domestic renewable technologies. As concluded in other case studies, certain sites are more feasible than others in regard to offshore wind generation. The strongest winds occur between latitudes 40
53
degrees and 60 degrees in both hemispheres; the main wind belts are located on the eastern side of oceans. Scotland has the highest offshore wind energy potential of any country in Europe. Typically, large, shallow offshore areas with sea depths of less than 20 meters are prime for establishing offshore wind farms. Potential energy generation spans a large range based on information from aforementioned projects. Block Island represents the smallest generation capacity of all projects discussed, in that it had the potential to produce 30 MW of energy. In Denmark, two projects combined to boost a capacity of 1 GW. Finally, the Firth of Forth system in Scotland is anticipated to generate 3.5 GW of energy. Known costs for Block Island amount to $290 million, financed by underwriters Society General of Paris, France and KeyBank National Association of Cleveland, Ohio. All other costs of technologies are unknown.
12.2WAVEENERGY Various studies have determined the offshore wave energy potential for
Mauritius. Experiments yielded the following: 180 km of waveline at 1 km from the reef, wave power density of 20-40 kW/m, and theoretical wave power potential of 3.6-7.2 GW (Suddhoo 2012). Other findings indicate that a wave farm stretching over 5 km with approximate wave energy of 15 kWm produces 40 MW of power in Mauritian waters (Suddhoo 2012).
Similar to the conceptual offshore wind plants in Mauritius, there exists a proposed offshore wave farm off of the Southern Coast of Mauritius. The Southern Coast consists of 20 km of shoreline with an average wave power density of 41.5 kW/m (Suddhoo 2012). There is little ship traffic, coral reefs or lagoons, preventing potential interference with the tourism sector.
In February 2016, Carnegie Wave Energy began constructing its Mauritius wave and microgrid design project, which will be delivered on Mauritius and the neighboring island of Rodrigues. The project will consist of the CETO 6 project, which contains three commercial scale CETO wave energy machines (each with a capacity of 1 MW), a desalination plant, 2 MW solar photovoltaic, and a battery for energy storage (Renew Economy).
In comparison to the CETO 5 generation system, this system is more efficient and has lower capital and maintenance costs. Carnegie Wave Energy Limited is the inventor, owner, and developer of the patented CETO wave energy technology that converts ocean swell into zero-emission renewable power and desalinated freshwater (Renew Economy). Carnegie Energy will receive a $560,000 grant through a partnership between the Australian and Mauritian Governments for the project (Tidal Energy Today). The total value of the design activities is $717,000, and Carnegie will contribute $130,000 of in-kind and technical support (Tidal Energy Today).
Successfully implemented governmental measures observed in case studies should be applied to Mauritius. For example, the New Zealand government established a four year Marine Energy Deployment Fund to promote technological innovation and to assist with costs associated with concept testing and device deployment. As observed in the Perth Island project in Australia and wave systems in New Zealand, grant funding from the federal government significantly impacts the successful development and
54
implementation of marine renewables. The Scottish Government demonstrated another governmental approach by launching the Saltire Prize Challenge, which financially rewarded the company with the most efficient wave technology. The Scottish Government, in the form of the Highland Council and Orkne Islands Council, developed a Marine Spatial Plan working group. The Scottish Government fully funds the organization entitled Wave Energy Scotland (WES), which takes an innovative approach to supporting the development of wave technology. The WES awards contracts for technology development projects via open competitive calls and is particularly interested in developing low-cost, efficient and reliable components and subsystems that can be shared by wave energy technology developers. The U.S. Department of Energy awarded Hawaii $9.7 million for the development of wave technologies.
Additionally, certain sites better suit the development and implementation of wave technologies. Sites with the best wave potential are located between 40 and 60 degrees latitude in the Atlantic and Pacific Oceans. New Zealand has substantial potential for wave power development due to its exposure to Southern Ocean winds and the waves generated by them, impacting the western and southern coasts of the North and South Islands (Kelly 2011). Steep continental shelves with near shore conditions similar to the open ocean also make better wave technology locations.
Typical energy generation of wave projects varies greatly. The Pelamis plant in Hawaii was projected to generate1,663 MWh/yr. The northern coast of the Canary Islands generates an average wave power of 25 kW/m. The Perth Wave Energy Project generates 3 MW of energy.
Known costs also vary significantly. The capital costs of the Pelamis plant in Hawaii amount to between $3.3 million and $5 million. The Chatham Islands Marine Energy Ltd installed a shore-based device used to capture wave energy, which cost $2.16 million.
12.3TIDALENERGY The potential of tidal energy generation in Mauritius is significantly uncertain. Based on the investigation of Jeetha Devi presented in her report “Investigating the appropriate Renewable Energy Technologies in the Mauritian context,” tidal energy is one of the most promising technologies in the Mauritius (Devi). However, the document entitled “Renewable ocean energy in the Western Indian Ocean” observes a low potential for tidal power in Mauritius (Hammar et al. 2012). To date, a number of tidal turbine companies supply tidal plant managers in Mauritius. Many governmental incentives used to boost wave technology also promoted the development of tidal energy. For example, in 2008, the Scottish Government launched the Saltire Prize Challenge that will be awarded to the developer that demonstrates that their wave or tidal energy device has generated at least 100 GW/h over a continuous two-year period using only the power of the sea. Similarly, the U.S. Government issued financial incentives in the form of tax credits, both at the state and federal level, provided funding for research and development, and passed Renewable Energy Targets of 30% by 2020, 40% by 2030, and 100% by 2045. Furthermore, the U.S. Government made ocean energy eligible for Feed-in-Tariffs and net metering systems and began issuing Green Infrastructure bonds awarded for clean energy measures. Comparably, the New Zealand
55
Government enacted the Energy Efficiency and Conservation Act of 2000, which led to a National Energy Efficiency and Conservation Strategy in September 2001. This organization adopted three core policy components to pursue sustainability and incorporated the New Zealand Kyoto undertaking (Kelly 2007). The EECA 2000 also established the Energy Efficiency and Conservation Authority, which is the primary government agency that provides information, advice, public awareness, research into renewables and incentives such as grant schemes, to promote renewable energy (IEA). Certain locations and conditions promote greater energy generation from tidal systems. Tidal streams are strongest when water is forced through constrained channels. The islands of Scotland form a barrier to the flooding North Atlantic tidal wave as it rounds the north of Scotland to enter the North Sea, and forms a similar barrier to the ebbing tide travelling in the opposite direction. The effect is to force strong flows north and south of the Islands through various channels that dissect them. The wave climate in the area of interest is dominated by the passage of low-pressure system from the west to the east across the north Atlantic. In general, the highest waves approach the Orkney area from westerly directions (gov.scot Final Plan). Generation capacities for tidal energy systems vary considerably. To begin, New Zealand’s Cook Strait contains an estimated tidal potential of 15 GW. In comparison, the Kaipara Harbor in New Zealand has a smaller average tidal potential, measuring between 110 and 240 MW (Vennell 2011). In Scotland, a group of 10 sites within the Pentland Firth and Orkney Waters have a total potential capacity of 1.6 GW (gov.scot). While there is little known about the costs of the specific technologies described in the case studies, the Crown Estate and Scottish Government have funded $4.5 billion worth of tidal projects around Orkney Islands and Pentland Firth.
12.4OCEANTHERMALENERGYCONVERSIONANDSEAWATERAIRCONDITIONING Certain aspects of Mauritius’ natural environment are conducive to OTEC and SWAC technology development. Similar to Hawaii, Mauritius is a volcanic island. In turn, the geological composition of the island of Mauritius allows water of greater depth to be located closer to shore—a maximum distance of 1,000 m. This geological composition enables more efficient implementation of OTEC and SWAC technologies. It also allows these technologies to be located closer to shore, further preventing energy loss and reducing costs associated with transferring energy to electricity grids. The document entitled “Renewable ocean energy in the Western Indian Ocean” claims that Mauritius possesses significant potential for OTEC technologies (Hammar et al. 2012). This results from the effect of the Great Conveyor Belt that arrives in Mauritius’ Exclusive Economic Zone, bringing deep sea water that is cold, pure, and rich in minerals and nutrients (Suddhoo 2012). This water arrives in ideal condition for use in OTEC and SWAC systems. Although the U.S. Government has provided financial incentives in the form of tax credits and funding for the research and development of marine renewable technologies, there is little direct governmental support of OTEC and SWAC technologies in Hawaii. Similarly, the Government of Okinawa bolstered the development of marine renewables through the development of the 21st Century Vision of
56
Okinawa. Despite its positive goals, the document did not provide direct governmental support for OTEC and SWAC systems. Both case studies conclude that equatorial waters serve as prime OTEC technology locations due to the large temperature differential between surface water and deep waters near the coast. Generation capacities of OTEC systems vary as well. In Hawaii, the mentioned project generates 100 MW, enough to power 120,000 homes. In comparison, the OTEC facility in Kumejima, Okinawa produces 50kW of energy. Overhead costs for the Hawaii OTEC technology range between $16,400 and $35,400/kW, and heat exchangers cost a third of the cost of the entire plant. Specific costs for the Hawaiian and Japanese plants are unknown.
12.5FLOATINGPHOTOVOLTAIC Jeetha Devi’s report “Investigating the appropriate Renewable Energy Technologies in the Mauritian context” notes that the majority of organizations in Mauritius are interested in developing photovoltaic systems (Devi). Additionally, Mauritius receives between 8 and 10 hours of sunshine daily and the average annual solar radiation amounts to 6 kWH/m2 (Devi).
Although Feed in Tariffs in Japan initially encouraged development of floating photovoltaic systems, the low rate of implementation has prevented further establishment of this technology. The system is designed for inland bodies of water that are located near grid connection and areas where electricity is consumed. The generation capacity of floating photovoltaic systems ranges from 2,680 MWH/yr to 16,170 MWh/yr. Specific costs of this technology are unknown.

57
13.PolicyRecommendations
Based on the challenges and successes of the development and implementation of technologies presented in the case studies, there exist applicable lessons for the Mauritian government. The Mauritian government may promote the marine energy industry by increasing investor confidence in marine renewables. Examples of ways to achieve this include: reducing regulatory hurdles that impede the development and implementation of offshore renewable energies, setting targets for the percentage of electricity demand generated from offshore renewable energies, and creating initiatives that fund the development of innovative technologies in an effort to produce low cost, efficient and reliable components of offshore renewable industries. These actions will secure long-term private sector investment. Shared responsibility for offshore energy development among different levels of government plays an essential role in bolstering Mauritius’ marine energy portfolio. This collaborative effort may result in the following responsibilities for each level of government: the federal government sets national policy direction, the state governments issue operating permits and development consents, and local governments focus on operations and facilities of offshore renewable technologies. This approach increases the value of bottom-up action by local governments, underscoring demand-side push for offshore energy technologies. The case studies offer other means for the Mauritian government to allow for the successful development and implementation of marine renewable technologies. Examples of such mechanisms include: using Marine Spatial Planning to establish a strategic vision to further sustainable development, investing in site studies, permitting and infrastructure for offshore renewables, and endorsing collaboration between industry and the global community regarding marine renewable research. The Mauritian government may invest in network expansion and a smart grid to optimize economies of scale in electricity distribution; it may also create a government-funded-in-water testing facility to allow companies easier access to private ocean areas. If willing to implement these actions, the government can successfully strengthen the presence of marine renewable technologies in Mauritius.
58
14.PotentialNextSteps Each case presented within this analysis has its advantages and limitations based on geography, workforce skills, investment options and government support. This paper acknowledges the importance of assessing resource potential as a preliminary step to any technological development in order to determine which technologies are economically viable. It is important to pay special attention to the stage of development for each technology, and how areas foster an enabling environment to bolster progress towards commercialization. Although every technology is at a different stage of development, they all must overcome huge costs (See Appendix A). Estimates exist for what these costs might be, and all are projected to exponentially decrease with increases in economies of scale. Predictions on what these economies of scale are and learning curves still need clarity throughout the literature. There are first mover risks and advantages for moving into some of these novel offshore technologies. If Mauritius is to pursue the development of marine renewable energy, it is imperative to create an environment facilitating their implementation. A transparent policy strategy and energy plan is critical to promoting renewable energy development.
As discussed above, marine spatial planning offers increased clarity to decision making in the marine environment, taking into consideration both economic and environmental tradeoffs in vulnerable coastal and offshore habitats. It is also important to have clear permitting and licensing framework to streamline the process, practicing caution for the ecological impacts some of these technologies might produce. Supplementary, there should be a focus on providing infrastructure (e.g., research centers, ocean technology incubators) to support emerging industries. This includes creating a friendly business environment to facilitate the expansion of international businesses. Finally, the role of government financial support cannot be understated. The deployment of these technologies is most successful when the local government provides funding and financial incentives in many different forms. Going forward, market development is crucial within the marine renewable energy sector. Given the nonrenewable nature of fossil fuels, in conjunction with the expansion of coastal population centers, it is incongruous that marine development has not received more attention and investment efforts worldwide. More countries must follow the lead of those listed within this report to further propel technology development through enhanced spending and research. As research increases, more viable technology options will be brought to market. Technology development must be met with an enabling marketplace framework, albeit in the form of financial incentives, legislative mandates, or enhanced resource assessment (i.e., marine spatial planning).
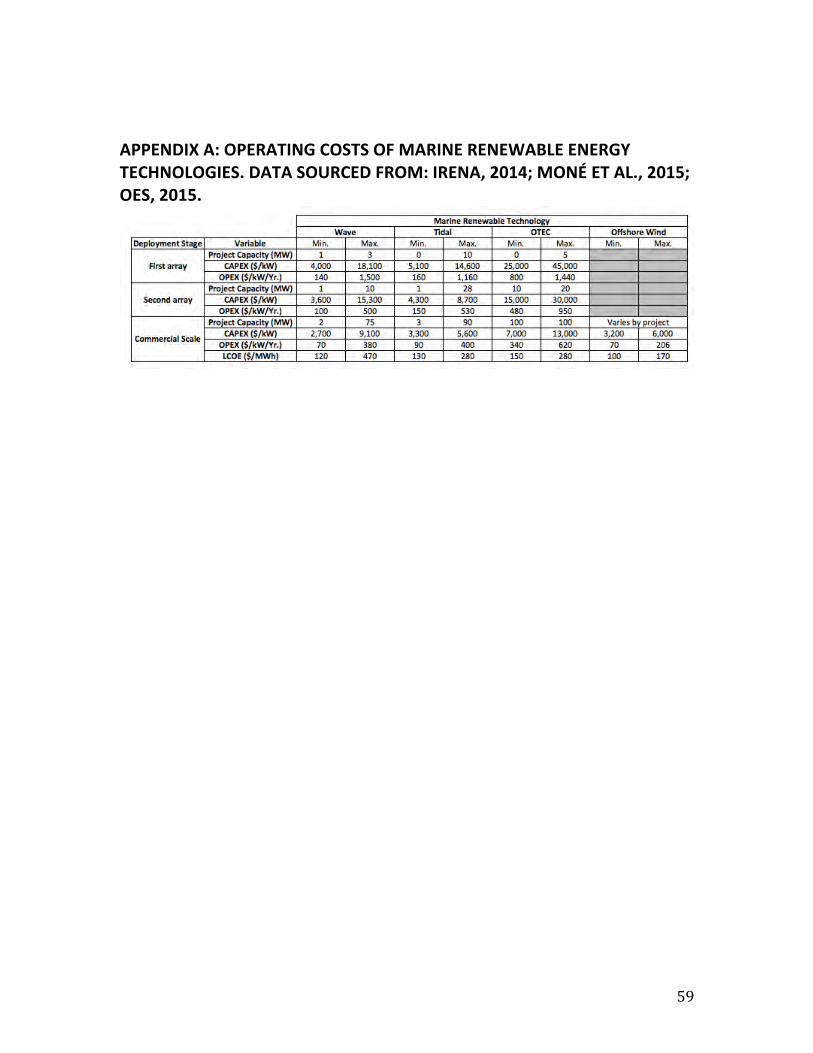
59
APPENDIXA:OPERATINGCOSTSOFMARINERENEWABLEENERGYTECHNOLOGIES.DATASOURCEDFROM:IRENA,2014;MONÉETAL.,2015;OES,2015.
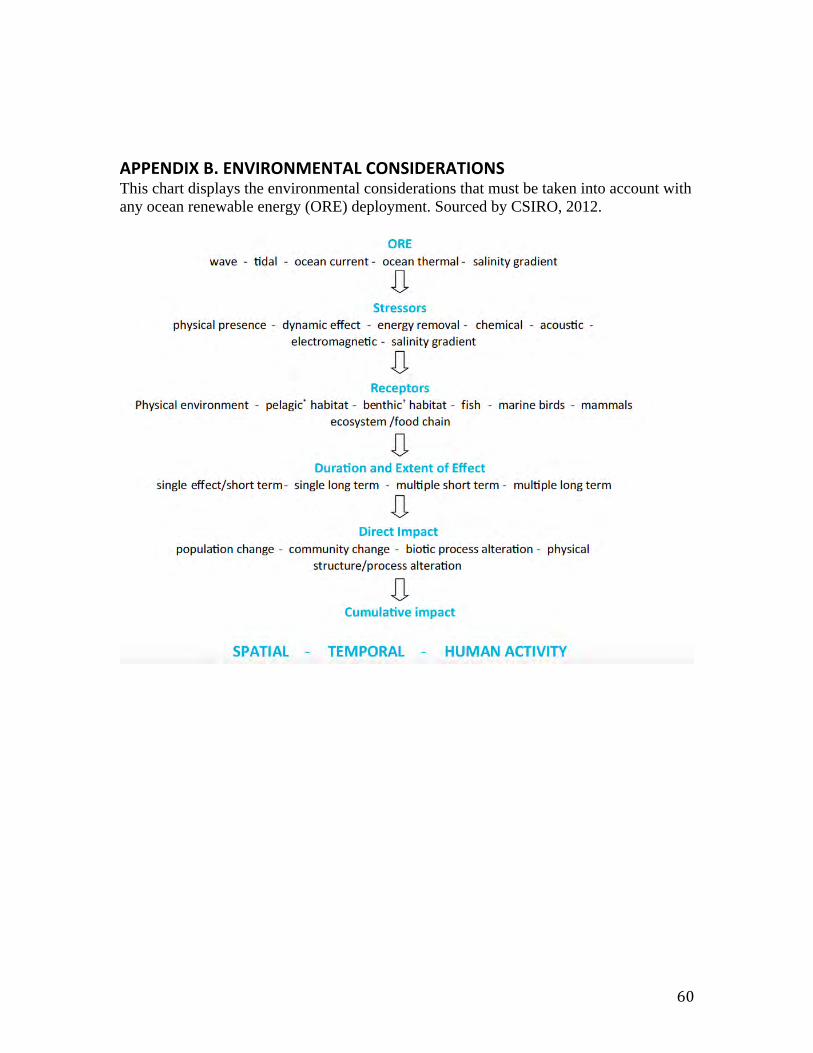
60
APPENDIXB.ENVIRONMENTALCONSIDERATIONSThis chart displays the environmental considerations that must be taken into account with any ocean renewable energy (ORE) deployment. Sourced by CSIRO, 2012.

61
References:
1. InternationalRenewableEnergyAgency.WaveEnergyTechnologyBrief.2014.2. InternationalRenewableEnergyAgency.TidalEnergyTechnologyBrief.2014.3. InternationalRenewableEnergyAgency.OTECTechnologyBrief.2014.4. InternationalRenewableEnergyAgency.OffshoreWindEnergyTechnologyBrief.2014.5. HawaiiGovernment.DepartmentofBusiness,EconomicDevelopment,andTourism.Census.2014.
http://census.hawaii.gov/6. HawaiiStateEnergyOffice.HawaiiEnergyFactsandFigures,November2015.
http://energy.hawaii.gov/resources/dashboard-statistics7. Rochleau,Rick.Hawaii–NationalMarineRenewableEnergyTestCenter.HNEI.April2008.
http://www.globalmarinerenewable.com/images/stories/2009Presentations/RichRocheleau-2009GMRE.pdf8. HawaiiNaturalEnergyInstitute.Focus:RenewablePowerGeneration.February2015.
http://www.hnei.hawaii.edu/9. HawaiiNationalMarineRenewableEnergyTestCenter.HNEIattheUniversityofHawaii.About:Challengesand
Barriers.2016.http://hinmrec.hnei.hawaii.edu/about/challenges-and-barriers/10. Szabo, Sandor, Ioannis Kougias, Magda Moner-Girona, and Katalin Bodis. “Sustainable Energy Portfolios for Small Island
States.” Sustainability 7, no. 9 (January 2015): 12340–58. 11. Paasch, Robert, Kelley Ruehl, Justin Hovland, and Stephen Meicke. “Wave Energy: A Pacific Perspective.” Philosophical
Transactions: Mathematical, Physical and Engineering Sciences 370, no. 1959 (January 2012): 481–501. 12. Dornan, Matthew. “Renewable Energy Development in Small Island Developing States of the Pacific.” Resources 4, no. 3
(September 2015): 490–506. 13. Ocean Thermal Energy Conversion. Makai Ocean Engineering. 2016. http://www.makai.com/ocean-thermal-energy-
conversion/ 14. Hodgkins, Kelly. “Hawaii’s New OTEC Power Plant Harvests Energy Stored in Warm Ocean Water.” Digital Trends.
August 2015. http://www.digitaltrends.com/cool-tech/hawaii-ocean-thermal-energy-conversion/ 15. Dragoon,K.,J.Eckstein,L.Patton.“WaveEnergyIndustryUpdate:ANorthwestUSPerspective.”OceanWaveEnergy
Trust.PreparedbyFlinkEnergyConsulting.(August2015). 16. Vega,LuisA.“EconomicsofOceanThermalEnergyConversion:AnUpdate.”NationalMarineRenewableEnergy
CenterattheUniversityofHawaii.PreparedforOffshoreTechnologyConference.(May2010). 17. Bedard,Roger,et.al.“OffshoreWavePowerFeasibilityDemonstrationProject.”GlobalEnergyPartners,LLC.
Report:E2IEPRIGlobalWP009–USRev2.(September2005). 18. “FeasibilityofDevelopingWavePowerasaRenewableEnergyResourceforHawaii.”DepartmentofBusiness,
EconomicDevelopment,andTourismofHawaii.(January2002).http://energy.hawaii.gov/wp-content/uploads/2011/10/Feasibility-of-Developing-Wave-Power-as-a-Renewable-Energy-Resource-for-Hawaii.pdf
19. Rocheleau,Richard.“WaterPowerPeerReview.”HawaiiNationalMarineRenewableEnergyCenter.(September2011).
20. Graham,Amy.“WaveEnergyTestRollingForwardinHawaii.”EnergyBizMagazine.(Fall2015).http://www.energybiz.com/magazine/article/433323/wave-energy-test-rolling-forward-hawaii
21. Cross,Patrick,LuisVega,RichardRochleau.“WaveEnergyTestSite.”HawaiiNaturalEnergyInstitute.(January2015).http://www.hnei.hawaii.edu/sites/www.hnei.hawaii.edu/files/Wave_Energy.pdf
22. InstituteCanariesdeStatistical.GobiernodeCanarias.2016.http://www.gobiernodecanarias.org/istac/23. McCormick,Colin.IslandsBecomeTrendsettersforRenewableEnergy.WorldResourcesInstitute.August2015.
http://www.wri.org/blog/2015/08/islands-become-trendsetters-renewable-energy24. Plitt,Laura.Thegreenestislandintheworld?BBCMundo.October2015.http://www.bbc.com/news/magazine-
3442460625. Harris,Michael.OfficialssignagreementforCanaryIslandswavepowerdevelopment.HydroReview.February
2014.http://www.hydroworld.com/articles/2014/02/officials-sign-agreement-for-canary-islands-wave-power-development.html
26. CanaryIslandsElectricitySystem.RedElectricadeEspana.2016.http://www.ree.es/en/activities/canary-islands-electricity-system
27. Frayer,Lauren.TinySpanishIslandNearsItsGoal:100PercentRenewableEnergy.NPR.September2014.http://www.npr.org/sections/parallels/2014/09/17/349223674/tiny-spanish-island-nears-its-goal-100-percent-renewable-energy
28. SegiodeOttoandMarinaBevacqua.Energy[R]evolutionfortheCanaryIslands.GreenpeaceEspanaincollaborationwithGermanAerospaceCenter.November2015.http://www.dlr.de/dlr/Portaldata/1/Resources/documents/2015/Energy_R_evolution_CanaryIslands_ExecutiveSummary_EN.pdf
29. InternationalEnergyAgency.EnergyPoliciesofIEACountries:Spain2015Review.OECD/IEA,2015.http://www.iea.org/publications/freepublications/publication/IDR_Spain2015.pdf
30. Goncalves, Marta, Paulo Martinho, and Cguedes Soares. “Assessment of Wave Energy in the Canary Islands.” Renewable Energy 68 (August 2014): 774–84.
31. Rusu, Eugen. “Evaluation of the Wave Energy Conversion Efficiency in Various Coastal Environments”. Energies, 7. (June 2014). pp. 4003-4018.
32. Sadhwani, J. Jaime, and Jose M Veza. “Desalination and Energy Consumption in Canary Islands.” Desalination 221, no. 1 (2008): 143–50.

62
33. IDOM.RenewableEnergiesintheCanaryIslands.June2010.http://www.proexca.es/Portals/0/Documents/Informacion/OtrasPonencias/IDOM_EERR_JUNE_2010.pdf
34. Izquierdo, Gonzalo Piernavieja. “Renewable Energies in the Canary Islands: Present and Future.” Canary Islands Institute of Technology. September 2005. http://www.erec.org/fileadmin/erec_docs/Projcet_Documents/RE_Islands/Canary_Islands.pdf
35. PECANPlanEnergeticodeCanarias.GobiernodeCanarias.ConsejeriadeIndustria,ComercioyNuevasTecnologias.2006.http://www.gobiernodecanarias.org/industria/pecan/pecan.pdf
36. Popescu,IrinaandJuanJoseOrtegaGras.FisheriesintheCanaryIslands.PolicyDepartmentB:StructuralandCohesion.EuropeanParliament.2013.http://www.europarl.europa.eu/RegData/etudes/note/join/2013/495852/IPOL-PECH_NT(2013)495852_EN.pdf
37. LangleeWavePowerAS.2013.http://www.langleewavepower.com38. “Study:CanaryIslandsCanSaveaBundlebyGoingAll-InonRenewables.”OffshoreWind.December2015.
http://www.offshorewind.biz/2015/12/23/study-canary-islands-can-save-a-bundle-by-going-all-in-on-renewables/
39. “GamesainauguratesSpain’sfirstoffshoreturbineofftheCanaryIslandscoast.”Gamesa:News.October2013.http://www.gamesacorp.com/en/cargarAplicacionNoticia.do?idCategoria=70&identificador=1030&urlAmigable=gamesa-inaugurates-spains-first-offshore-turbine-off-the-canary-islands-coast.html
40. HernandezBrito,JoseJoaquin.“OpportunitiesfortestinganddemonstrationofmarineenergytechnologiesintheCanaryIslands.”PLOCAN.PowerPointPresentation.http://www.atlanticstrategy.eu/sites/all/themes/clean_theme/doc/PresentationsSomosAtlanticos/T-CClimatico-03-Joaquin-Hdez-PLOCAN.pdf
41. Martinez,M.,A.Pulido,J.Romero,N.Angulo,andF.Deniz.“StudyfortheinstallationofoffshorewindfarmsintheCanaryIslands.”EuropeanAssociationfortheDevelopmentofRenewablefortheDevelopmentofRenewableEnergies,EnvironmentandPowerQuality.ICREPQ.April2009.http://www.icrepq.com/ICREPQ'09/510-pulido.pdf
42. Hill,Geoffrey.“WindProspectingontheCanaryIslands.”GoteborgUniversity,Sweden.2003.http://gvc.gu.se/digitalAssets/1347/1347908_b348.pdf
43. “GamesaOffshore:Cuttingedgetechnologysolutions:G128-5.0MWOffshoreandG132-5.0MWOffshoreReliabilityandOptimalCoE.”Gamesa.August2014.http://www.gamesacorp.com/recursos/doc/productos-servicios/aerogeneradores/catalogo-offshore-eng.pdf
44. “Description:OceanicPlatformoftheCanaryIslands(PLOCAN).”GobiernodeCanarias.October2013.http://www.plocan.eu/index.php/en/about-us/whoweare/description
45. Hamilton,CathrynandJonKellet.“RenewableEnergy:UrbanCentresLeadtheDanceinAustralia?”RenewableEnergyGovernance:ComplexitiesandChallenges.Vol.23.LectureNotesinEnergy.(November2013):63-79.
46. Parker,Albert.“Deepoceancurrentsenergyresources–AcasestudyofAustralia”.WorldJournalofModellingandSimulation.Vol.11(2015)No.3:163-173.
47. Behrens,Sam,DavidGriffin,JennyHayward,MarkHemer,ChrisKnight,ScottMcGarry,PeterOsmanandJohnWright.“Oceanrenewableenergy:2015-2050;AnanalysisofoceanenergyinAustralia”.CSIRO.(July2012)http://www.marine.csiro.au/~griffin/articles/Ocean-renewable-energy-2015-2050.pdf
48. AustralianJobs2015.AustralianGovernment.DepartmentofEmployment.2015.https://docs.employment.gov.au/system/files/doc/other/australian_jobs_2015_1.pdf
49. AustralianEnergyUpdate2015.AustralianGovernment.DepartmentofIndustryandScience.2015.http://www.industry.gov.au/Office-of-the-Chief-Economist/Publications/Documents/aes/2015-australian-energy-statistics.pdf
50. AnIntroductiontoAustralia’sNationalElectricityMarket.AEMO.2015.http://www.aemo.com.au/About-the-Industry/Energy-Markets/National-Electricity-Market
51. ARENAfunding.AustralianGovernment.AustralianRenewableEnergyAgency.2015.http://arena.gov.au52. “OceanEnergyProjects.”AustralianRenewableEnergyAgency.August2013.http://arena.gov.au/projects/ocean-
energy/53. Parkinson,Giles.“Newgenerationwaveenergy:coulditprovideonethirdofAustralia’selectricity?”TheGuardian.
(November2015).http://www.theguardian.com/sustainable-business/2015/dec/01/new-generation-wave-energy-could-it-provide-one-third-of-australias-electricity
54. Yee,Amy.“CatchingWavesandTurningThemIntoElectricity.”TheNewYorkTimes:Energy&Environment.(April2015).http://www.nytimes.com/2015/04/23/business/energy-environment/catching-waves-and-turning-them-into-electricity.html?_r=1
55. CarnegieWaveEnergyLimited.2015.http://carnegiewave.com/56. Vorrath,Sophie.“Carnegietoaddsolar,batterystoragetocreateworldfirstwave-integratedmicrogrid.”
RenewEconomy.(October2015).http://reneweconomy.com.au/2015/carnegie-to-add-solar-battery-storage-to-create-world-first-wave-integrated-microgrid-66551
52. Renew Economy. CarnegieCompletesFinalMilestoneforCETO5PerthWaveEnergyProject :RenewEconomy.” 2016.AccessedApril12.http://reneweconomy.com.au/2016/carnegie-wave-69826.
53. TidalEnergyToday.“CarnegieKicks-offMauritiusProject|TidalEnergyToday.”2016.AccessedApril25. http://tidalenergytoday.com/2016/02/11/carnegie-kicks-off-mauritius-project/.
54. Hammar,Linus,JimmyEhnberg,AlbertoMavume,BoaventuraC.Cuamba,andSverkerMolander.2012.“Renewable OceanEnergyintheWesternIndianOcean.”RenewableandSustainableEnergyReviews16(7):4938–50. doi:10.1016/j.rser.2012.04.026.
55. Hexicon.“HEXICON-4COffshore.”2016.AccessedApril25. http://www.4coffshore.com/windfarms/windfarms.aspx?windfarmid=MU01.
56. BoardofMauritiusInvestment.“InvestmentOpportunitiesRenewableEnergy.”2016.AccessedApril25. http://www.investmauritius.com/investment-opportunities/energy.aspx.

63
57. TheWindPower.“Mauritius-Countries-OnlineAccess-TheWindPower.”2016.AccessedApril25.http://www.thewindpower.net/country_en_82_mauritius.php.
59. Kume Guide. “Deep Sea Water Research Institute.” 2016. Accessed April 25. http://kumeguide.com/Industry/DeepSeaWater/ResearchInstitute/.
60. Wageningen UR. “Delegation in Japan: Ocean Thermal Energy Conversion (OTEC) on the Island Kumejima - Wageningen UR.” 2016. Accessed April 25. https://www.wageningenur.nl/en/newsarticle/Delegation-in-Japan-Ocean-Thermal-Energy-Conversion-OTEC-on-the-island-Kumejima.htm.
61. Energy and the Environment. “Energy and the Environment-A Coastal Perspective - Environmental Impacts.” 2016. Accessed April 25. http://coastalenergyandenvironment.web.unc.edu/ocean-energy-generating-technologies/ocean-thermal-energy-conversion/environmental-impacts-2/.
62. Flavin, C., and S. Dunn. 2016. “Climate of Opportunity: Renewable Energy after Kyoto.” Power Economics 2 (9): 41–43. Accessed February 5. http://inis.iaea.org/Search/search.aspx?orig_q=RN:30019429.
63. Water World. “Floating Solar Systems Provide Power, Environmental Benefits - WaterWorld.” 2016. Accessed April 25. http://www.waterworld.com/articles/print/volume-27/issue-9/editorial- features/floating-solar-systems-provide-power-environmental-benefits.html.
64. Thurston, Charles W. “From Land to Water : Pv-Magazine.” 2016. Accessed April 25. http://www.pv- magazine.com/archive/articles/beitrag/from-land-to-water-_100006317/501/#axzz46kaCfFuI.
65. Clover, Ian. “Japan Confirms FIT Cut of 16% by July: Pv-Magazine.” 2016. Accessed April 25. http://www.pv-magazine.com/news/details/beitrag/japan-confirms-fit-cut-of-16-by- july_100018702/#axzz46kaCfFuI.
66. Owano, Nancy. “Japan Has Floating Solar Power Plants in Hyogo Prefecture.” 2016. Accessed April 25. http://techxplore.com/news/2015-04-japan-solar-power-hyogo-prefecture.html.
67. Mollman, Steve. “Japan Is Building Huge Solar Power Plants That Float on Water — Quartz.” 2016. Accessed April 25. http://qz.com/426718/japan-is-building-huge-solar-power-plants-that-float-on- water/.
68. Norton Rose Fulbright. “Japanese Renewable Energy News Update.” 2016. Accessed April 25. http://www.nortonrosefulbright.com/knowledge/publications/126629/japanese-renewable-energy- news-update.
69. Power Technology. “Kagoshima Nanatsujima Mega Solar Power Plant - Power Technology.” 2016. Accessed April 25. http://www.power-technology.com/projects/kagoshima-nanatsujima-mega-solar- power-plant/.
70. KYOCERA. “KYOCERA GROUP GLOBAL SITE.” 2016. Accessed April 25. http://global.kyocera.com/. 71. KYOCERA. “KYOCERA TCL Solar Begins Construction on 13.7MW Floating Solar Power Plant;
Company’s Fourth Floating Solar Project, World’s Largest, Will Be Built on Japan’s Yamakura Dam Reservoir | News Releases | KYOCERA.” 2012, April. http://global.kyocera.com/news/2016/0102_knds.html.
72. Nomura, Noboru, and Makoto Akai. 2004. “Willingness to Pay for Green Electricity in Japan as Estimated through Contingent Valuation Method.” Applied Energy 78 (4): 453–63. doi:10.1016/j.apenergy.2003.10.001.
73. The Japan Times. “Nuclear Power Plant Restarts Part of Wider Plan to Meet 2030 ‘Best Energy Mix’ | The Japan Times.” 2016. Accessed April 25. http://www.japantimes.co.jp/news/2015/08/12/business/nuclear-power-plant-restarts-part-of- wider-plan-to-meet-2030-best-energy-mix/#.Vx2tX6MrJmB.
74. Martin, Benjamin. “Okinawa OTEC Power Initialization Ceremony | More Things Japanese.” 2016. Accessed April 25. http://morethingsjapanese.com/okinawa-otec-power-initialization-ceremony/.
75. OTEC Okinawa. “OTEC Okinawa Project.” 2016. Accessed April 25. http://otecokinawa.com/en/Project/index.html.
76. OTEC News. “OTEC Pilot Plant to Be Built in Okinawa Prefecture - OTEC newsOTEC News.” 2016. Accessed April 25. http://www.otecnews.org/2012/07/otec-pilot-plant-to-be-built-in-okinawa- prefecture/.
77. World Nuclear News. “Plan Sets out Japan’s Energy Mix for 2030.” 2016. Accessed April 25. http://www.world-nuclear-news.org/NP-Plan-sets-out-Japans-energy-mix-for-2030-0306154.html.
78. Nautilius Institute. “Renewable Energy Burst in Japan | Nautilus Institute for Security and Sustainability.” 2016. Accessed April 25. http://nautilus.org/napsnet/napsnet-special- reports/energy_burst_japan/.
79. Movellan, Junko. “Running Out of Precious Land? Floating Solar PV Systems May Be a Solution - Renewable Energy World.” 2016. Accessed April 25. http://www.renewableenergyworld.com/articles/2013/11/running-out-of-precious-land-floating- solar-pv-systems-may-be-a-solution.html.
80. Upadhyay, Anand. “World’s Largest Floating Solar Power Plant.” 2016. Accessed April 25. http://cleantechnica.com/2014/12/25/worlds-largest-floating-solar-power-plant-announced- kyocera/.
81. Wüstenhagen, Rolf, Maarten Wolsink, and Mary Jean Bürer. 2007. “Social Acceptance of Renewable Energy Innovation: An Introduction to the Concept.” Energy Policy 35 (5): 2683–91. doi:10.1016/j.enpol.2006.12.001.
82. Yamakura Dam. “Yamakura Dam [Chiba Pref.] - Dams in Japan.” 2016. Accessed April 25. http://damnet.or.jp/cgi-bin/binranA/enAll.cgi?db4=0663.
83. "Rising Tide: Global Trends in the Emerging Ocean Energy Market." Ernst & Young Global Limited, 2013. Web. <http://www.ey.com/Publication/vwLUAssets/EY-Ocean-energy-Rising-tide-2013/$FILE/EY-Ocean-energy-Rising-tide-2013.pdf>.
84. "Tidal Stream." Aquaret: Delivering Knowledge and Understanding, 2012. Web. <http://www.aquaret.com/indexa15e.html?option=com_content&view=article&id=113&Itemid=256&lang=en>.
85. Martin, John E. 'Hydroelectricity', Te Ara - the Encyclopedia of New Zealand, updated 12-Apr-16 URL: http://www.TeAra.govt.nz/en/hydroelectricity 86. "Renewables." Ministry of Business Innovation and Employment. New Zealand Government, 20 Apr. 2016. Web.
<http://www.mbie.govt.nz/info-services/sectors-industries/energy/energy-data-modelling/statistics/renewables>. 87. "New Zealand Energy Strategy 2011-2021." Ministry of Business Innovation and Employment. New Zealand Government,
Aug. 2011. Web. <www.med.govt.nz/energy-strategy>. 88. "Marine Energy Deployment Fund." International Energy Agency. N.p., 12 May 2014. Web.
<http://www.iea.org/policiesandmeasures/pams/newzealand/name-24171-en.php>. 89. "Development of Marine Energy in New Zealand." Power Projects Limited, 30 June 2008. Web.
<https://www.ea.govt.nz/dmsdocument/17345>.

64
90. Kelly, Geoff. “History and Potential of Renewable Energy Development in New Zealand.” Renewable and Sustainable Energy Reviews 15.5 (2011): 2501–2509. ScienceDirect. Web. 91. Doesburg, Anthony. "Plug Pulled on Tidal Turbine Projects." New Zealand Herald. N.p., 6 Nov. 2013. Web. <http://www.nzherald.co.nz/sustainable-business/news/article.cfm?c_id=1503533&objectid=11148072>. 92. "Marine Energy." Awatea. Ministry of Business Innovation and Employment Hikina Whakatutuki, n.d. Web. <http://www.awatea.org.nz/marine-energy/>. 93. "Marine Renewable Energy." The Scottish Government. N.p., 15 July 2015. Web. <http://www.gov.scot/Topics/marine/marineenergy>. 94. "Exclusive Economic Zone." The Scottish Government. N.p., 06 May 2014. Web. <http://www.gov.scot/Topics/marine/seamanagement/nmpihome/admin/EEZ>. 95. "Scotland's Education System." The General Teaching Council for Scotland. N.p., n.d. Web. <http://www.gtcs.org.uk/TeacherJourney/scotlands-education-system.aspx>. 96. "Invest in Scotland." Scotland: The Official Gateway to Scotland. The Scottish Government, n.d. Web. <http://www.scotland.org/live-and-work-in-scotland/invest-in-scotland/>. 97. "Wave Energy." HI-Energy. Highlands and Islands Enterprise, 2014. Web. <http://www.hi-energy.org.uk/Renewables/Wave-Energy.htm>. 98. "Wave Energy Scotland." Highlands and Islands Enterprise. N.p., n.d. Web. <http://www.hie.co.uk/growth-sectors/energy/wave-energy-scotland/default.html>. 99. "Wave Energy Scotland Fact Sheet." Scottish Government, Nov. 2014. Web. <www.gov.scot/Resource/0046/00464410.pdf>. 100. Offshore Wind Scotland. N.p., n.d. Web. <http://www.offshorewindscotland.org.uk/>. 101. "Beatrice Offshore Wind Farm." 4C Offshore Ltd. N.p., 31 Mar. 2016. Web. <http://www.4coffshore.com/windfarms/beatrice-united-kingdom-uk53.html>. 102. "Wave Energy in Scottish Waters." Marine Scotland. The Scottish Government, May 2013. Web. <http://www.gov.scot/resource/0042/00423949.pdf>. 103. "The Challenge." Saltire Prize Challenge. The Scottish Government, n.d. Web. <http://www.saltireprize.com/challenge>. 104. "Tidal Energy in Scottish Waters." The Scottish Government, n.d. Web. <http://www.gov.scot/Resource/0039/00398539.pdf>. 105. "Pentland Firth & Orkney Waters." The Scottish Government. N.p., 21 Mar. 2016. Web. <http://www.gov.scot/Topics/marine/seamanagement/regional/activity/pentlandorkney>. 106. "Pentland Firth and Orkney Waters Marine Spatial Plan Framework & Regional Locational Guidance for Marine Energy."
The Scottish Government, Mar. 2016. Web. <http://www.gov.scot/Resource/Doc/295194/0115355.pdf>. 107."Pilot Pentland Firth and Orkney Waters Marine Spatial Plan." The Scottish Government. Marine Scotland, Mar. 2016.
Web. <http://www.gov.scot/Resource/0049/00497299.pdf>. 108. "The Exclusive Economic Zone and Continental Shelf." Environmental Protection Authority. New Zealand Government,
n.d. Web. <http://www.epa.govt.nz/eez/Pages/default.aspx>. 109. "New Zealand Economic and Financial Overview 2015." The Treasury. New Zealand Government, 15 Apr. 2015. Web.
<http://www.treasury.govt.nz/economy/overview/2015>. 110. "Education in New Zealand." Education.govt.nz. New Zealand Government Ministry of Education, 15 Apr. 2016. Web.
<http://www.education.govt.nz/home/education-in-nz/>. 111. "Electricity." Ministry of Business Innovation and Employment. New Zealand Government, 17 Sept. 2015. Web.
<http://www.mbie.govt.nz/info-services/sectors-industries/energy/energy-data-modelling/statistics/electricity>. 112. McGrath, Km. “Sustainable Growth of New Zealand’s Economy from New Zealand’s Science Sector.” Journal of the Royal Society of New Zealand 45.2 (2015): 114–117. tandfonline.com (Atypon). Web. 113. 4C Offshore. (2016). Offshore Wind Farms. Retrieved April 21, 2016, from http://www.4coffshore.com/windfarms/. 114. AW Hawaii. (2015). Hawaii Offshore Wind Energy Lease Application Oahu Northwest: AW Hawaii Wind LLC. 115. Battista, N. (2015). Lessons learned on offshore wind. Rockland, ME: Island Institute. 116. Bilgili, M., Yasar, A., & Simsek, E. (2011). Offshore wind power development in Europe and its comparison with onshore counterpart.
Renewable and Sustainable Energy Reviews, 15, 905-915. 117. BOEM. (2016). Offshore Wind Energy. Retrieved April 20, 2016, from http://www.boem.gov/Renewable-Energy-
Program/Renewable-Energy-Guide/Offshore-Wind-Energy.aspx. 118. BOEM. (2016a). Hawaii Activities. Retrieved April 21, 2016, from http://www.boem.gov/Hawaii/. 119. Danko, P. (2015). Can Block Island Unblock US Offshore Wind Power? Retrieved April 22, 2016, from
http://breakingenergy.com/2015/04/28/can-block-island-unblock-us-offshore-wind-power/. 120. Deepwater Wind. (2012). Block Island Wind Farm and Block Island Transmission System Environmental Report / Construction and
Operations Plan. Boston, MA: Tetra Tech EC, Inc. 121. Deepwater Wind. (2016). Block Island Wind Farm: America's First Offshore Wind Farm. Retrieved April 21, 2016, from
http://dwwind.com/project/block-island-wind-farm/. 122. Del Franco, M. (2015). How Offshore Wind Can Power A State's Economic Revival. North American Windpower. 123. DOI. (2015). Secretary Jewell, Director Hopper Laud Construction of Nation’s First Offshore Wind Farm. Retrieved April 20, 2016,
from https://www.doi.gov/pressreleases/secretary-jewell-director-hopper-laud-construction-nation’s-first-offshore-wind-farm. 124. DONG Energy. (2006). Danish Offshore Wind: Key Environmental Issues: DONG Energy, Vattenfall, Danish Energy Authority, and
Danish Forest and Nature Agency. 125. Failla, G., & Arena, F. (2016). New perspectives in offshore wind energy. Philosophical Transactions of the Royal Society A, 373. 126. Gerry-Bullard, N. (2011). A fair wind for clean energy. Retrieved April 20, 2016, from http://www.pbs.org/wnet/need-to-
know/environment/a-fair-wind-for-clean-energy/7433/. 127. Gonzalez, D., Kilinc, A., & Weidmann, N. (2011). Renewable Energy Development: Hydropower in Norway: Center for Applied
International Finance and Development (CAIFD). 128. GWEC. (2016). Global statistics. Global Wind Energy Council. Retrieved April 27, 2016, from http://www.gwec.net/global-
figures/graphs/.

65
129. Harball, E. (2015). Utility-scale offshore wind proposal floated for Hawaii. Retrieved April 20, 2016, from http://www.governorswindenergycoalition.org/?p=12234.
130. Hilderbrand, V.P., Karp, J.M., & Kramer, M.L. (2015). Can New England Lead The Offshore Energy Revolution? Retrieved April 23, 2016, from http://www.zag-sw.com/assets/htmldocuments/B1926290.PDF.
131. Hylleberg, J. (2014). Denmark - Wind Energy Hub. Profile of the Danish wind energy: Danish Wind Industry Association. 132. IRENA. (2015). Renewable Power Generation Costs in 2014: International Renewable Energy Agency. 133. Jeppesen, H. (2014). Denmark leads the charge in renewable energy. Retrieved April 20, 2016, from http://www.dw.com/en/denmark-
leads-the-charge-in-renewable-energy/a-17603695. 134. Klain, S., MacDonald, S., & Battista, N. (2015). Engaging Communities in Offshore Wind: Case Studies and Lessons Learned from
New England Islands: Island Institute. 135. Larsen, J.H.M., Soerensen, H.C., Christiansen, E., Naef, S., & Vølund, P. (2005). Experiences from Middelgrunden 40 MW Offshore
Wind Farm. Paper presented at the Copenhagen Offshore Wind, Copenhagen, Denmark. 136. Megavind. (2014). Increasing the Owners’ Value of Wind Power Plants in Energy Systems with Large Shares of Wind Energy: Danish
Wind Industry Association. 137. Möllera, B., Honga, L., Lonsingb, R., & Hvelplunda, F. (2012). Evaluation of offshore wind resources by scale of development.
Energy, 48, 314-322. 138. Moné, C., Smith, A., Maples, B., & Hand, M. (2015). 2013 Cost of Wind Energy Review. Golden, CO: National Renewable Energy
Laboratory. 139. Navigant. (2013). U.S. Offshore Wind Manufacturing and Supply Chain Development. Burlington, MA: Navigant Consulting, Inc. 140. Roselund, C., & Bernhardt, J. (2015). Lessons Learned Along Europe’s Road to Renewables. Retrieved April 20, 2016, from
http://spectrum.ieee.org/energy/renewables/lessons-learned-along-europes-road-to-renewables. 141. Smith, A., Stehly, T., & Musial, W. (2015). 2014–2015 Offshore Wind Technologies Market Report. Oak Ridge, TN: National
Renewable Energy Laboratory. 142. Solan, M., & Whiteley, N. M. (2016). Stressors in the Marine Environment: Physiological and ecological responses; societal
implications. Oxford, United Kingdom: Oxford University Press. 143. Sørensen, H.C., Hansen, L.K., & Larsen, J.H.M. (2002). Middelgrunden 40 MW Offshore Wind Farm Denmark - Lessons Learned.
Paper presented at the fter Johannesburg, Local Energy and Climate Policy: From Experience Gained Towards New Steps Wind Energy and Involvement of Local Partners, Munich, Germany.
144. State of Green. (2015). Wind Energy Moving Ahead: How Denmark utilises wind in the energy sector: Danish Wind Industry Association.
145. Succar, S. (2009). The Danish Wind Experience: Truth and Fiction. Retrieved April 20, 2016, from http://www.greenandsave.com/green_news/green-blog/danish-wind-experience-truth-fiction-4973.
146. Sullivan and Worcester, LLP. (2015). Is the tide turning for offshore wind in the United States? Retrieved April 21, 2016, from http://www.lexology.com/library/detail.aspx?g=f7419e96-6f34-4c87-b2c0-30fb080d1f57.
147. Temizer, M. (2016). Danish Dong to dismantle world's 1st offshore wind farm. Retrieved April 20, 2016, from http://aaenergyterminal.com/newsSub.php?newsid=7499505.
148. The Economist. (2015). Wondering about wind: America's first offshore wind farm is the test bed for a new industry. Retrieved April 22, 2016, from http://www.economist.com/news/united-states/21660171-americas-first-offshore-wind-farm-test-bed-new-industry-wondering-about-wind.