MARINE MAMMALS AND SEA TURTLESeasterndivision.s3.amazonaws.com/Marine/SABMA/SABMA... ·...
89
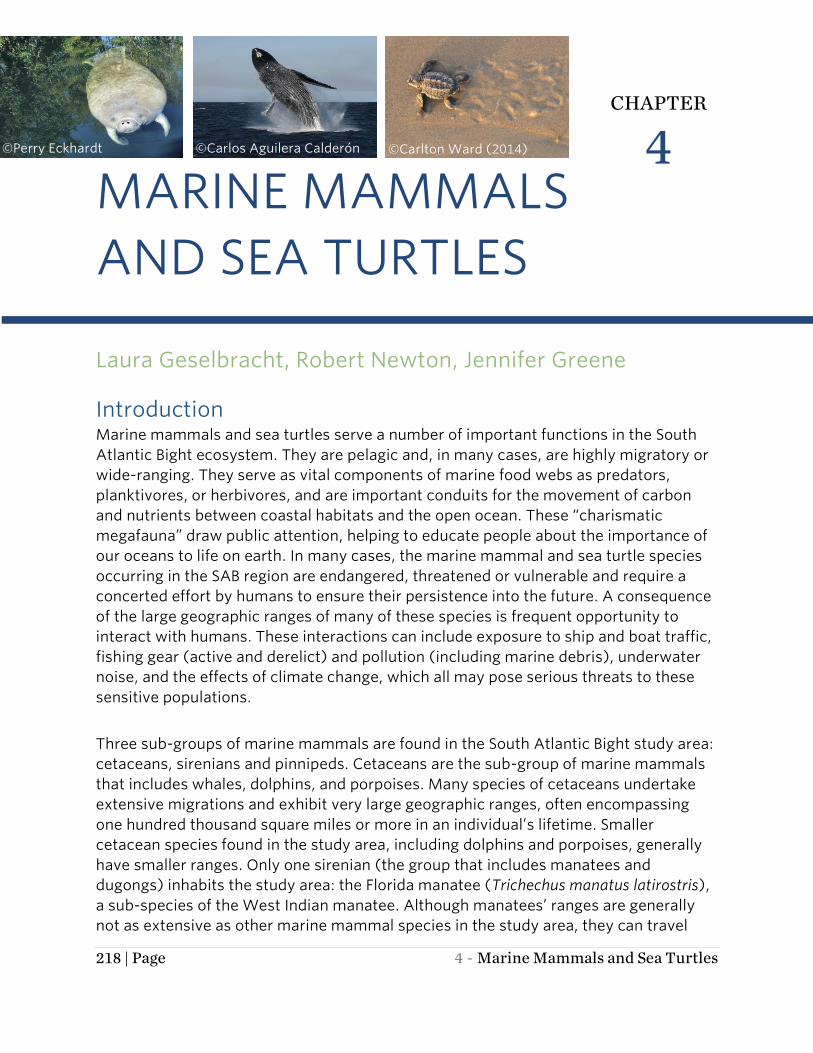
218 | Page 4- Marine Mammals and Sea Turtles MARINE MAMMALS AND SEA TURTLES Laura Geselbracht, Robert Newton, Jennifer Greene Introduction Marine mammals and sea turtles serve a number of important functions in the South Atlantic Bight ecosystem. They are pelagic and, in many cases, are highly migratory or wide-ranging. They serve as vital components of marine food webs as predators, planktivores, or herbivores, and are important conduits for the movement of carbon and nutrients between coastal habitats and the open ocean. These “charismatic megafauna” draw public attention, helping to educate people about the importance of our oceans to life on earth. In many cases, the marine mammal and sea turtle species occurring in the SAB region are endangered, threatened or vulnerable and require a concerted effort by humans to ensure their persistence into the future. A consequence of the large geographic ranges of many of these species is frequent opportunity to interact with humans. These interactions can include exposure to ship and boat traffic, fishing gear (active and derelict) and pollution (including marine debris), underwater noise, and the effects of climate change, which all may pose serious threats to these sensitive populations. Three sub-groups of marine mammals are found in the South Atlantic Bight study area: cetaceans, sirenians and pinnipeds. Cetaceans are the sub-group of marine mammals that includes whales, dolphins, and porpoises. Many species of cetaceans undertake extensive migrations and exhibit very large geographic ranges, often encompassing one hundred thousand square miles or more in an individual’s lifetime. Smaller cetacean species found in the study area, including dolphins and porpoises, generally have smaller ranges. Only one sirenian (the group that includes manatees and dugongs) inhabits the study area: the Florida manatee (Trichechus manatus latirostris), a sub-species of the West Indian manatee. Although manatees’ ranges are generally not as extensive as other marine mammal species in the study area, they can travel CHAPTER 4 ©Carlton Ward (2014) ©Perry Eckhardt ©Carlos Aguilera Calderón
Transcript of MARINE MAMMALS AND SEA TURTLESeasterndivision.s3.amazonaws.com/Marine/SABMA/SABMA... ·...
218 | Page 4 - Marine Mammals and Sea Turtles
MARINE MAMMALS
AND SEA TURTLES
Laura Geselbracht, Robert Newton, Jennifer Greene
Introduction Marine mammals and sea turtles serve a number of important functions in the South
Atlantic Bight ecosystem. They are pelagic and, in many cases, are highly migratory or
wide-ranging. They serve as vital components of marine food webs as predators,
planktivores, or herbivores, and are important conduits for the movement of carbon
and nutrients between coastal habitats and the open ocean. These “charismatic
megafauna” draw public attention, helping to educate people about the importance of
our oceans to life on earth. In many cases, the marine mammal and sea turtle species
occurring in the SAB region are endangered, threatened or vulnerable and require a
concerted effort by humans to ensure their persistence into the future. A consequence
of the large geographic ranges of many of these species is frequent opportunity to
interact with humans. These interactions can include exposure to ship and boat traffic,
fishing gear (active and derelict) and pollution (including marine debris), underwater
noise, and the effects of climate change, which all may pose serious threats to these
sensitive populations.
Three sub-groups of marine mammals are found in the South Atlantic Bight study area:
cetaceans, sirenians and pinnipeds. Cetaceans are the sub-group of marine mammals
that includes whales, dolphins, and porpoises. Many species of cetaceans undertake
extensive migrations and exhibit very large geographic ranges, often encompassing
one hundred thousand square miles or more in an individual’s lifetime. Smaller
cetacean species found in the study area, including dolphins and porpoises, generally
have smaller ranges. Only one sirenian (the group that includes manatees and
dugongs) inhabits the study area: the Florida manatee (Trichechus manatus latirostris),
a sub-species of the West Indian manatee. Although manatees’ ranges are generally
not as extensive as other marine mammal species in the study area, they can travel
CHAPTER
4 ©Carlton Ward (2014) ©Perry Eckhardt ©Carlos Aguilera Calderón
South Atlantic Bight Marine Assessment
4 - Marine Mammals and Sea Turtles 219 | Page
hundreds of miles in search of warm water habitat and food resources. Four species of
pinnipeds (seals and sea lions) are also known to occur in the SAB region.
Sea turtles are also an important component of north Atlantic coastal and ocean
ecosystems because they are highly migratory, long-lived, slow growing, and utilize a
diverse array of oceanic, neritic, and terrestrial environments. For these reasons, sea
turtles present a unique conservation challenge. While they have been the focus of a
multitude of international treaties and conventions, national laws, and regulatory
protection strategies, there is still a clear need for greater understanding of their
temporal and spatial distribution and migratory patterns, degree and relevance of
threat sources on all life stages, and population trend analyses via international
monitoring and research efforts. Five sea turtle species were chosen for inclusion in
this analysis.
Distribution information on marine mammals and sea turtles is challenging to collect
due to the broad geographic areas frequented by these species and the expense of data
collection. In addition, these animals spend significant portions of their lives below the
surface, and some of them are relatively small compared to the survey techniques used
to detect them. Although the distribution information presented in this report is
imperfect and likely underestimates the number of places where these species are
found, it is based on the best information available. The mapped information presented
in this analysis is only appropriate for decision making at the regional or state level and
should not be used for making decisions at the 10-minute or 100-minute scale.
Box 4.1. Marine Mammals and Sea Turtles Technical Team Members
The Marine Mammal Technical Team was comprised of internal and external
resource experts who helped identify and categorize target species, validate
analyses and review the chapter.
Melissa Clark, The Nature Conservancy, Eastern Division
Mary Conley, The Nature Conservancy, South Atlantic Marine Program
Mark Dodd, Georgia Department of Natural Resources
Clay George, Georgia Department of Natural Resources
Laura Geselbracht, The Nature Conservancy, Florida Chapter
Jennifer Greene, The Nature Conservancy, North America Region
Robert Newton, The Nature Conservancy, South Atlantic Marine Program
Mark Swingle, Virginia Aquarium & Marine Science Center

South Atlantic Bight Marine Assessment
220 | Page 4 - Marine Mammals and Sea Turtles
Selection of Target Species Technical team members worked together to identify the target marine mammal and
sea turtle species to be included in this assessment as well as the most appropriate
data sources and approaches for documentation and analysis. Several factors were
considered when selecting the target species, including population status (threatened
and endangered species are all included), distribution in the region, and data
availability. The home ranges of the species included in this assessment extend
through part or all of the region (and in many cases well beyond), from the inland to
offshore waters of the South Atlantic Bight region. The list of target species is far from
a comprehensive list of marine mammals and sea turtle species that occur in the
region; for a complete list see Appendix 3. The target species included in this
assessment are as follows:
Sea Cows
Florida manatee (Trichechus manatus latirostris)
Baleen Whales
Fin whale (Balaenoptera physalus)
Humpback whale (Megaptera novaeangliae)
North Atlantic right whale (Eubalaena glacialis)
Toothed Whales
Beaked whales (family Ziphiidae)
Bottlenose dolphin (Tursiops truncatus)
Oceanic dolphins (genus Stenella)
Common dolphin (Delphinus delphis)
Pilot whales (long-finned pilot whale, Globicephala melas and short-finned pilot
whale, Globicephala macrorhynchus)
Risso’s dolphin (Grampus griseus)
Sperm Whale (Physeter macrocephalus)
Sea Turtles
Loggerhead turtle (Caretta caretta)
Green turtle (Chelonia mydas)
Leatherback turtle (Dermochelys coriacea)
Hawksbill turtle (Eretmochelys imbricata)
Kemp’s ridley turtle (Lepidochelys kempii)
Appendix 4 summarizes the current understanding of the biology of each of the target
species and groups listed above.
South Atlantic Bight Marine Assessment
4 - Marine Mammals and Sea Turtles 221 | Page
Population Status of Target Species Populations of the target mammal and turtle species addressed in this chapter are
threatened in some way; for many, their populations are protected by federal and even
international recognition of their status. The fin, humpback, North Atlantic right, sei,
and sperm whales and the Florida manatee are listed as endangered by the U.S.
Endangered Species Act. The IUCN Red List documents the fin and North Atlantic right
whales and the Florida manatee as endangered, the sperm whale as vulnerable, and the
humpback whale and common, bottlenose, Risso’s, and oceanic dolphins as species of
least concern (IUCN 2014). Due to limited data, a determination of the population
status of many target species is not yet available. The majority of existing data are
derived from marine mammal aerial and ship surveys, with a large portion of the data
consisting of a low abundance or single occurrence sightings.
The North Atlantic right whale is a species of particular concern in this region. It is
considered to be one of the most critically endangered large whales in the world and
could be facing extinction (Clapham and Mead 1999; Kenney 2002). Recent
observations offer some encouragement. Based on 2010 observations, the western
North Atlantic right whale stock was estimated to be at a minimum 455 individuals
and an examination of the minimum number alive population index over the previous
10-year period revealed an increasing population trend of 2.8% (geometric mean
growth rate; Waring et al. 2014).
In the United States, all five sea turtle target species are federally listed as endangered
or threatened. Leatherback, hawksbill and Kemp’s ridley sea turtles are considered
endangered throughout their ranges; the loggerhead is considered threatened in the
SAB region and either threatened or endangered in other parts of the world; green sea
turtles are considered threatened except for breeding populations in Florida and on the
Pacific coast of Mexico which are considered endangered. According to the
International Union for Conservation of Nature (IUCN) Red List (IUCN 2014), both the
loggerhead and green turtles are categorized as endangered while the leatherback
turtle is considered vulnerable (Wallace et al. 2013; Seminoff 2004). The hawksbill sea
turtle is categorized as critically endangered as a result of declines at index monitoring
sites in all major ocean basins. All of these species are protected against international
trade (CITES 1973).
Importance of U.S. South Atlantic Bight Waters to Target Species Marine mammals targeted by this assessment use the waters of the U.S. South Atlantic
for a variety of purposes including feeding, breeding, nursing and migration. Most of
the baleen species found in the region breed either outside of the area or their breeding

South Atlantic Bight Marine Assessment
222 | Page 4 - Marine Mammals and Sea Turtles
location is unknown (Jonsgård 1966). The North Atlantic right whale uses the area
offshore of Georgia and North Florida as calving grounds (NMFS 2006a). Some of the
small toothed whales and the Florida manatee are known to use the region for
breeding, calving, nursing and feeding (Haubold et al. 2006; Sargent et al. 1995; Waring
et al. 2003). Dolphins (Stenella spp. and Tursiops truncatus) are by far the most
numerous marine mammals found in the study area (Department of Navy 2008). Unlike
the other species of marine mammals found in the region, the primary range of the
Florida manatee is Florida coastal waters with some migration north of the state in the
summer months (Fertl et al. 2005; Powell and Rathbun 1984; Rathbun et al. 1982).
Sea turtle species also use the SAB region at a variety of ecological stages; for some
species, the SAB population represents a significant proportion of the species’ overall
population. One of the two primary global loggerhead nesting aggregations with
greater than 10,000 nesting females per year is in South Florida (the other is in
Masirah, Oman, on the Arabian Sea; Baldwin et al. 2003; NMFS USFWS 2008). A
comprehensive three-year study of the distribution of loggerheads in the Northwest
Atlantic estimated that the total summer loggerhead population was between 2,200
and 11,000 individuals (Shoop and Kenney 1992). More recent studies in Virginia
coastal waters documented up to 10,000 loggerheads in Chesapeake Bay and tens of
thousands in ocean waters (spring estimate > 60,000; Swingle 2014). In the SAB region,
the most loggerhead nesting is concentrated along the coast from southern Virginia to
Florida (Conant et al. 2009). Over the past decade, estimates for U.S. nesting
aggregations have fluctuated between 47,000 and 90,000 nests per year, with 80% of
nesting occurring in eastern Florida (NMFS USFWS 2008). While loggerhead nesting in
Florida has been cyclical over the 25-year observation period, over the most recent 15-
year period (1998 to 2013) no demonstrable trend has been observed (FWC, FWRI
2014c).
Despite the global decline of green turtles over the past 150 years, in the IUCN’s
Western Atlantic Ocean and Caribbean Region, representing approximately 30% of the
overall global population of nesting females, all but one of the subpopulation index
sites (Venezuela, Aves Island) witnessed increases including the United States
(Florida). In the SAB region nesting primarily occurs in Florida, where green turtle nest
counts have increased approximately one hundredfold since counts began in 1989 (n =
267). The most dramatic growth occurred in 2013 (n=25,553) when the nest count was
more than twice that of the next highest year (FWC, FWRI 2014b).
Leatherback population decreases and collapse have been documented in major
nesting areas in the Pacific region. The most recent global assessment of leatherback
turtle nests estimated a 40% decline over the past three generations (approximately 90
years) from 90,560 to 54,260 nests in 2010. However, the assessment also predicts
that global population will increase in the future (3% by 2030 and 104% by 2040),
South Atlantic Bight Marine Assessment
4 - Marine Mammals and Sea Turtles 223 | Page
primarily because of increasing populations in the Northwest Atlantic region. Shoop
and Kenney (1992) estimated that the total summer population of leatherbacks in the
Northwest Atlantic was between 100 and 900 individuals. A more recent study of
nesting leatherbacks conducted in 2004 - 2005 estimated the Florida stock (nesting
stock in the SAB area) of adult leatherbacks to be between 320 and 920 individuals (5th
to 95th percentile; TEWG 2007). In the SAB region, nesting is limited to Florida where
standardized counts suggest that the population has been increasing between 1989,
when the nest count was 27, and 2013, when 896 nests were counted (FWC, FWRI
2014b).
Globally, the hawksbill turtle has experienced an extensive population decline,
estimated at 80% over the past three generations (approximately 105 to 135 years).
Declines have been observed for all subpopulations in all major ocean basins.
Numerous populations, especially some of the larger ones, have continued to decline
since the last assessment of the species (Meylan and Donnelly 1999), however, some
protected populations are stable or increasing. In the SAB region, the hawksbill turtle
nests only rarely. During the period 1979 to 1992, 0 to 2 hawksbill nests were recorded
annually (Meylan et al. 1995). More recently, 4 nests were observed during the years
2009 to 2013 on one Florida Keys beach (FWC, FWRI 2014b). These observations are
likely an underestimate because females in the process of laying eggs have rarely been
encountered and tracks left in the sand resemble loggerhead tracks, hatchlings are
difficult to distinguish from loggerhead hatchlings, and some nesting takes place
beyond the standard monitoring period.
Kemp's ridley turtles are distributed throughout the Gulf of Mexico and along the U.S.
Atlantic coast from Florida to New England (NOAA 2014a). This species is highly
vulnerable due to the manner in which it nests and the very limited geographic range of
its primary nesting population. The Kemp’s ridley nests in arribadas, or large nesting
aggregations, the main locations of which are three beaches in the Tamaulipas state of
Mexico. Since the 1940s, the Kemp's ridley has experienced a dramatic population
decline. At an arribada video-taped in 1947, turtles created an estimated 42,000 nests
in a single day. Between 1978 and 1991, only about 200 Kemp's ridleys nested
annually. In recent years, the Kemp’s ridley has seemed to be in the early stages of
recovery. In the SAB region, the Kemp’s ridley turtle only rarely nests. During the period
2009 to 2013, one to three Kemp’s ridley nests were observed on 22 Florida index
beaches, five of which were on the Atlantic Coast (FWC, FWRI 2014b). Rare nesting
has also been documented in Virginia, North Carolina, South Carolina and Georgia
(Georgia Conservancy 2012; Hampton Roads 2012; NOAA 2014a).

South Atlantic Bight Marine Assessment
224 | Page 4 - Marine Mammals and Sea Turtles
Ecosystem Interactions and Ecological Dependencies Relationships between marine mammals and sea turtles and their environment are
complex and can vary by ecosystem. The sections below review the current state of
our knowledge of these complex interactions.
Marine Mammals
While the exact ecological function of marine mammals is not fully known, insights into
their role in the marine ecosystem have emerged through large-scale studies of
species-ecosystem interactions and community structure (Bowen 1997; Haubold et al.
2006). Katona and Whitehead (1988) hypothesized that marine mammals could play a
major role in determining the behavior and life history traits of their prey species,
affecting nutrient storage and cycling and altering benthic habitats. Further information
about the ecological role of each group of marine mammals is provided below.
CETACEANS
As predators, cetaceans are major consumers at most trophic levels, specifically
feeding on zooplankton, invertebrates, and forage fish in the region. Mysticetes
(baleen whales), including fin, humpback, minke, right, and sei whales, are migrating
animals that move (in the case of the Northwest Atlantic stocks) from northern feeding
grounds in the summer to warmer waters in the fall and winter to breed and reproduce
(Jonsgård 1966; Garrison 2007). They typically forage for pelagic prey, consuming
large quantities at one time, including zooplankton (e.g., copepods), euphausiids (e.g.,
krill), and small fish (e.g., sand lance, herring, mackerel) (Nemoto 1959; Jonsgård
1966; Mitchell 1975; Kawamura 1982; Mizroch et al. 1984; Kenney et al. 1985; Haug et
al. 1995; Flinn et al. 2002; Perrin and Brownell 2002). Some baleen species like sei and
right whales are dependent on euphausiids and copepods when feeding in the North
Atlantic, while other species are less selective in their diet (Nemoto 1959; Kraus et al.
1988).
Odontocetes (toothed whales) typically prefer larger prey than baleen whales,
consuming individual organisms, and typically feed at higher trophic levels (Pauly et al.
1998). Unlike the mysticetes, not all odontocetes are migrating animals, and they feed
year-round (Lockyer and Brown 1981). Primary food sources for toothed whales are
cephalopods (e.g., small and large squid), small fish (e.g., smelt, herring, mackerel),
and demersal fish (e.g., cod, skate) (Smith and Whitehead 2000; Archer 2002; Sergeant
et al. 1980; Katona and Whitehead 1988). For members of this suborder that migrate
seasonally, food availability appears to be a driver of this behavior (Irvine et al. 1981)
but migrations do not exhibit a consistent pattern as seen in the mysticetes (Lockyer
and Brown 1981). Some of the smaller odontocetes, in particular estuarine stocks of
the bottlenose dolphin, have strong site fidelity with no observed migration (Odell and
Asper 1990; Caldwell 2001; Grubbins 2002; Zolman 2002; Mazzoil et al. 2005;

South Atlantic Bight Marine Assessment
4 - Marine Mammals and Sea Turtles 225 | Page
Speakman et al. 2006; Mazzoil et al. 2008). The lack of migration may be because some
species are able to employ a variety of feeding techniques and rely on a number of prey
items (Leatherwood 1975). Within the boundaries of the study area both baleen and
toothed whales have few predators, which include large sharks, killer whales, and
potentially, false killer whales (Perry et al. 1999; Heithaus 2001; Perrin and Brownell
2002; Horwood 2002; Swingle 2014).
SIRENIANS, THE FLORIDA MANATEE
The only sirenian found in the SAB region is the Florida manatee, an herbivore that
feeds on a variety of vegetation types including seagrass in shallow marine areas,
floating and emergent vegetation, and vegetation along banks (Haubold et al. 2006).
Macroherbivores can have a profound effect on the distribution and productivity of the
vegetation they feed on, on other grazers and fauna associated with the plants they
feed on, and on chemical and decompositional processes occurring within their feeding
areas (Thayer et al. 1984). The Florida manatee is found in a variety of coastal aquatic
habitats from freshwater canals in highly urbanized areas to coastal lagoons, estuaries,
and shallow seagrass and coral reef areas in marine waters (Smith 1993). It migrates
seasonally hundreds of kilometers between a warm-season range and a cold-season
range; great variability in movement patterns has been described (Deutsch et al. 2003).
A small percent (approximately 12% in one study) of Florida manatees do not migrate,
but rather stay year-round in a relatively small area (< 50 km (31 miles); Deutsch et al.
2003). Manatees are sensitive to cold water (< 20oC; 68oF) and seek warm water
refugia in the winter months (Haubold et al. 2006).
Sea turtles
The sea turtles occurring in the SAB region are highly migratory and use a wide range
of habitats during their lifetimes (Seminoff 2004). Their diets vary by species, life stage
and habitat zone (i.e., oceanic, neritic). During the loggerhead’s post-hatchling
transition stage, individuals hatched on U.S. beaches migrate offshore and become
associated with floating Sargassum, driftlines, and other convergence zones (Carr
1986; Witherington 2002). During this period, they forage on organisms associated
with the Sargassum including hydroids, copepods, coelenterates and salps
(Witherington 2002; Bjorndal 1997, 2003). As juveniles transition from oceanic to
neritic habitats, diets become more diverse and shift according to season and
geographic position. In the North Atlantic, neritic stage adults forage primarily on
mollusks and benthic crabs. The diet of oceanic stage adults is currently unknown
(NMFS USFWS 2008).
Only limited information is available on green turtle ecosystem interactions during the
juvenile oceanic stage. Evidence suggests that hatchlings from disparate natal sites
South Atlantic Bight Marine Assessment
226 | Page 4 - Marine Mammals and Sea Turtles
outside of the Caribbean enter the North Atlantic gyre and form mixed stock feeding
aggregations in the Eastern Caribbean before returning to feeding areas closer to their
natal rookeries (Luke et al. 2004). Upon recruitment back to coastal areas, neritic
juveniles subsist primarily on seagrasses and marine algae (NMFS USFWS 2007a). The
availability of food items within coastal foraging areas may vary seasonally and
interannually. The diet of migratory oceanic adults is currently unknown.
Leatherbacks forage primarily on pelagic gelatinous organisms including jellyfish
(medusae), siphonophores, and salps in temperate and boreal latitudes (NMFS USFWS
1992, 2007b). They are also known to eat crustaceans, vertebrates, and plants (Eckert
et al. 2012; Dodge et al. 2011; Jones and Seminoff 2013). Surface feeding is the most
commonly observed foraging habit for leatherbacks, but dive data indicate that they
may forage throughout the water column. Based on satellite telemetry and stable
isotope studies, leatherbacks appear to associate with highly productive ecosystems
and have been observed transiting low productivity areas at high speed until they reach
more productive foraging areas (Fossette et al. 2010).
As juveniles, hawksbill turtles may forage in coral reefs or other hard bottom habitats,
seagrass, algal beds, mangroves (Musick and Limpus 1997) or mud flats (R. von
Brandis unpubl. data as reported in Mortimer and Donnelly 2008). These foraging
habitats may be located hundreds or thousands of kilometers away from natal
beaches. Hawksbills are known to be an important component of healthy coral reef
ecosystems. In the Caribbean (SABMA area), they may support coral reef health by
controlling sponges, their primary local food source (Hill 1998; Meylan 1988; León and
Bjorndal 2002; Bjorndal and Jackson 2003).
Kemp’s ridley turtles may have limited ecological significance in the SAB region due to
their current population size. Adults are found in neritic habitats with muddy or sandy
bottoms. Their diet consists mainly of swimming crabs, but may also include fish,
jellyfish, and an array of mollusks (NOAA Fisheries 2014b). Little is known of the
feeding habitats of the juvenile, oceanic stage.
U.S. South Atlantic Distribution and Important Areas
In-water Distribution – Sighting per Unit Effort (SPUE) Model
Two effort-corrected methods of observation have been used over the past several
decades to estimate where cetaceans and sea turtles are distributed in offshore areas:
shipboard and aerial surveys. Correcting observations for effort is essential to minimize
the bias that would otherwise result for heavily surveyed areas. While opportunistic
South Atlantic Bight Marine Assessment
4 - Marine Mammals and Sea Turtles 227 | Page
sightings of cetaceans and sea turtles in the SAB region have been recorded for over
one hundred years, this information is less valuable for improving our understanding of
cetacean and sea turtle distribution in the study area. Consequently, we have focused
our analysis on data sets that are corrected for effort (see below for more detail about
how data are corrected for effort). The most complete source for this information in
the SAB region is the data collected, assembled, and processed by the U.S. Navy for the
Charleston/Jacksonville Marine Resource Assessment (Department of Navy 2008).
Geospatial analyses of cetacean and sea turtle sightings were obtained from the U.S.
Navy (see Department of Navy 2008). These analyses were completed for the Navy’s
Marine Resource Assessments (MRA), a program used to develop comprehensive data
and literature concerning protected and managed marine resources found in Navy
operating areas for use in environmental and biological assessments prepared in
accordance with various federal laws (e.g., Marine Mammal Protection Act, National
Environmental Policy Act). Data were from the Navy’s Charleston/Jacksonville MRA
study region, which covers only the northern portion of the SABMA study area,
extending south to waters just north of the Indian and Banana River Complex, Florida.
Data for areas south of the Charleston/Jacksonville MRA study area were not available
for this analysis.
The sightings used in the Navy’s analysis were taken from National Marine Fisheries
Service-Southeast Fisheries Science Center (NMFS-SEFSC) aerial surveys, NMFS-SEFSC
shipboard surveys, and the North Atlantic Right Whale Consortium database (See
Table 4.1 for a complete listing). The surveys used covered the years 1978 – 2005. Data
used in these analyses were primarily collected via aerial and shipboard surveys during
daylight hours, weather permitting. The data were provided in a seasonal format where
the seasons covered the following dates: winter, December 6 – April 5; spring, April 6 –
July 13; summer, July 14 – Sept 16; and fall, September 17 – December 5.

South Atlantic Bight Marine Assessment
228 | Page 4 - Marine Mammals and Sea Turtles
Table 4.1. Sources for marine mammal and sea turtle data (Department of Navy 2008)
Shipboard Sighting Surveys
DATA
YEAR(S)
NMFS-SEFSC R/V Oregon II Cruise 92-01 (198) 1992 1992
NMFS-SEFSC R/V Relentless Cruise 98-01 (003) 1998 1998
NMFS-SEFSC R/V Oregon II Cruise 99-05 (236) 1999 1999
NMFS-SEFSC R/V Gordon Gunter Cruise GU-02-01 (021) 2002 2002
NMFS-SEFSC R/V Gordon Gunter Cruise GU-04-03 (028) 2004 2004
NMFS-SEFSC R/V Gordon Gunter Cruise GU-05-03 (062) 2005 2005
CETAP Shipboard Survey 1978-1982 1978 - 1982
Aerial Sighting Surveys
DoN-Continental Shelf and Associates, Inc. (CSA) 1996-1999
DoN SEAWOLF Mayport Shock Trial 1995, 1997
DoN Winston S. Churchill Shock Trial 1999
NMFS-SEFSC Southeast Cetacean Aerial Surveys (SECAS) 1992, 1995
New England Aquarium (NEA) (pre-Early Warning System [EWS]) 1984 - 1993
New England Aquarium (NEA) (EWS) 1993-2005
New England Aquarium (NEA) Core of Engineers (COE) 1989-1993
Georgia Department of Natural Resources (GADNR) (EWS) 1993-2002
Florida Marine Research Institute (FMRI) (EWS) 1992-2005
Associated Scientists at Woods Hole Oceanographic Institution
(ASWHOI) Airship (blimp) Survey 1991-1993
CETAP Aerial Survey 1978-1982
Offshore Surveys (GADNR and FMRI) 1996-2002
University of North Carolina at Wilmington (UNCW) Aerial Survey
(EWS) 2001-2002
University of Rhode Island (URI) Aerial Survey 1987
Wildlife Trust (WLT) Aerial Survey (EWS) 2002-2005
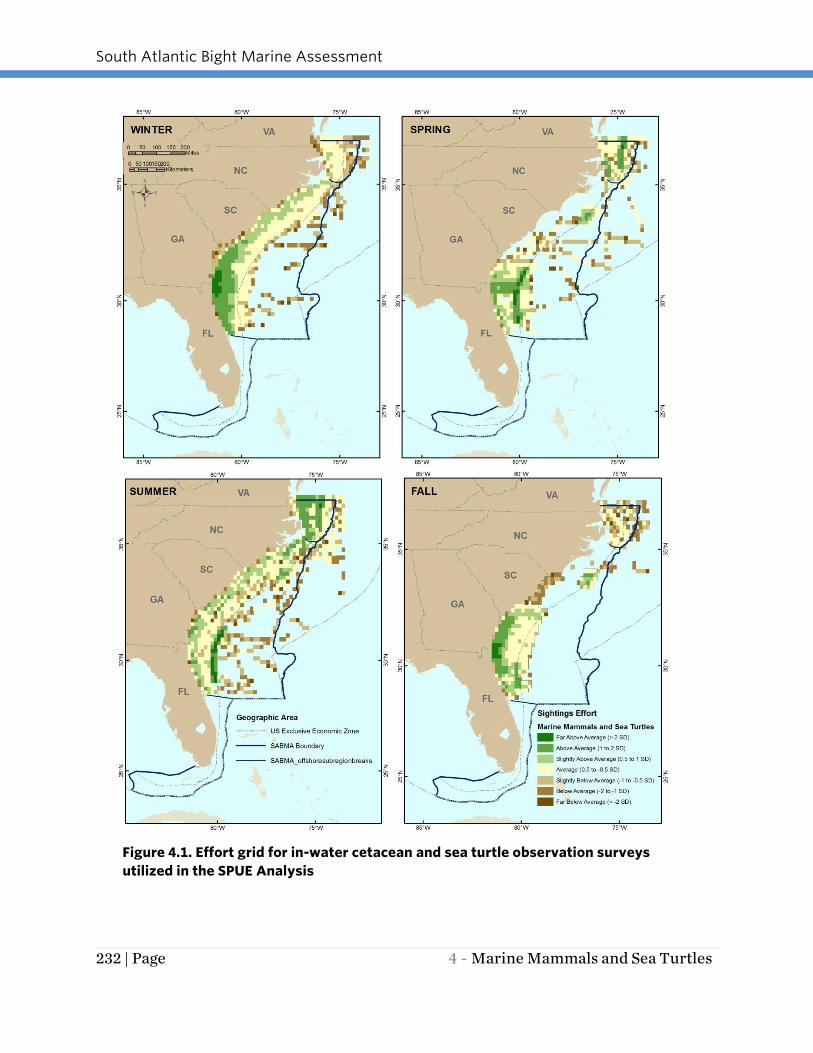
One issue with interpreting marine mammal and sea turtle data is the bias introduced
by uneven survey coverage or “effort.” For example, an area may have few sightings
because of the absence of a given species or there just may be little survey effort in
that location. Figure 4.1 illustrates the seasonal survey effort for the surveys used in
this analysis (exception is the North Atlantic right whale). A standard approach to
overcoming this bias is using effort-corrected sightings data (Kenney and Winn 1986;
Shoop and Kenney 1992). Calculating sightings per unit effort, or SPUE, an index of
relative density, allows for comparison of data spatially and temporally within a study
area (Shoop and Kenney 1992). SPUE is calculated as:
SPUE = 1000*(number of animals sighted)/effort
South Atlantic Bight Marine Assessment
4 - Marine Mammals and Sea Turtles 229 | Page
Geospatial analysis obtained from the U.S. Navy included shapefiles of valid cetacean
and sea turtle sightings and pre-calculated effort grids for each season. The validity of
sightings was carefully screened and verified by Navy contractors before inclusion in
the model. Invalid records were not included in the analysis. Data included in the
density estimates were restricted to sightings collected during defined census tracks
(i.e., “on-effort”). Sightings collected during transits to or from a survey area, on cross-
legs between census tracks, or while the ship or aircraft has left a census track to
investigate a sighting were considered to be “off-effort” and were not included in the
density estimates. Only datasets that included the following data fields were included
in the Navy SPUE analysis:
Assessment of the sighting conditions encountered during each segment of the
survey track, including visibility and sea state
Observer watch status
Altitude (aerial surveys only)
Sufficient records (time and position) for the survey track, in addition to the
sighting locations, to adequately reconstruct the platform track.
The Navy SPUE analysis only included track segments completed with at least one
observer on watch, clear visibility of at least two nautical miles, Beaufort sea state of
less than or equal to three, and an altitude of less than 366 m.
South Atlantic Bight Marine Assessment
230 | Page 4 - Marine Mammals and Sea Turtles
Using the formula above, SPUE was calculated for each target species/species group in
each of the four seasons in all ten-minute squares (TMS) within the project area. The
SPUE grid cell values were converted to rank-based z-scores representing each TMS
SPUE value in relation to the mean. The rank-based z-scores are interpreted in the
same manner as standard z-scores. That is, a rank-based z-score of 1 indicates that the
grid cell value is 1 standard deviation greater than the mean of all the grid cells. Refer
to Appendix 5 for more details about calculating z-scores. We assigned all rank-based
z-scores to the following categories:
Far Above Average: > 2 Standard Deviations (SD) above the mean
Above Average: > 1 SD
Slightly Above Average: 1 to 0.5 SD
Average: 0.5 to -0.5 SD
Slightly Below Average: -0.5 to -1 SD
Below Average: < -1 SD
Far Below Average: < 2 SD
The z-scores were then mapped using the same methodology for all species/species
groups.
SPUE was calculated for hardshell turtles (loggerhead, green, hawksbill and Kemp’s
ridley) and leatherback turtles. Data for hardshell turtles was combined in recognition
of the difficulty of identifying these turtles to species level from the distances
associated with aerial and shipboard sightings. In addition, sea turtles are more likely
to be on the surface during fall and winter when water temperatures are cool and the
sun is out (behavioral thermoregulation; Dodd 2014). As a result, observed seasonal
variations in abundance are more likely an artifact of this behavior than movements of
animals in and out of an area seasonally. The data set precludes an assessment by
turtle life stage (adult, juvenile) and does not allow examination of use of larger coastal
estuaries in the SAB region.
South Atlantic Bight Marine Assessment
4 - Marine Mammals and Sea Turtles 231 | Page
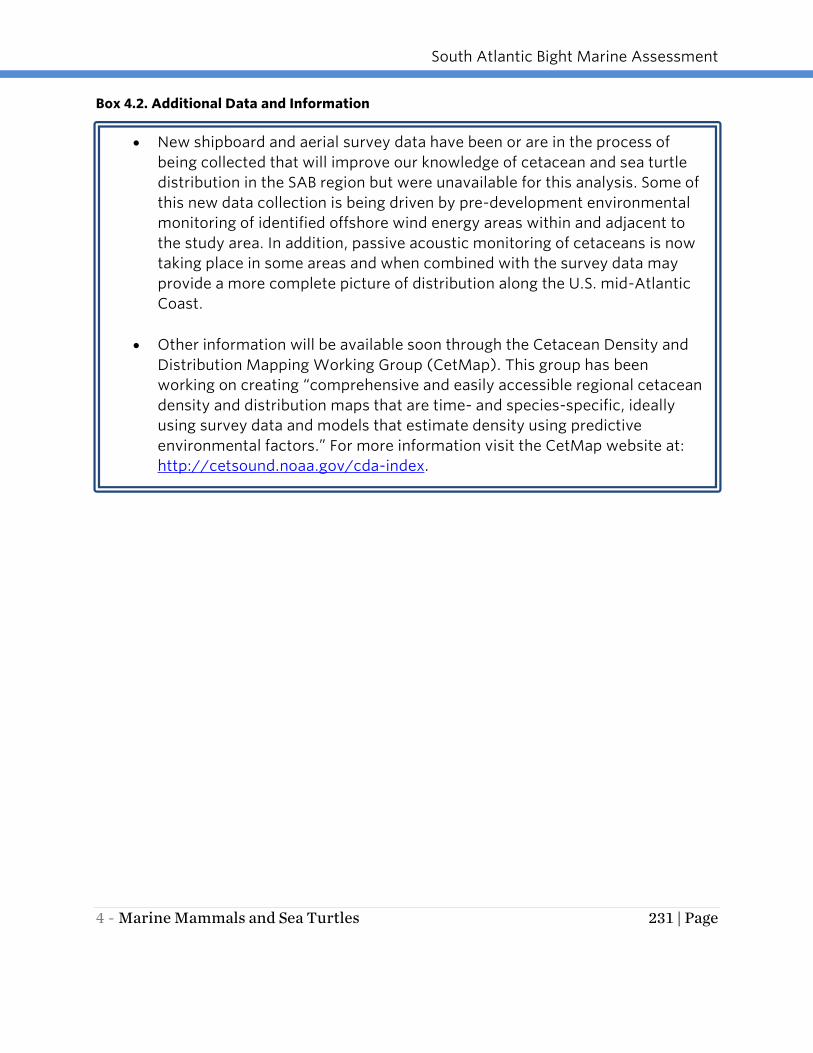
Box 4.2. Additional Data and Information
New shipboard and aerial survey data have been or are in the process of
being collected that will improve our knowledge of cetacean and sea turtle
distribution in the SAB region but were unavailable for this analysis. Some of
this new data collection is being driven by pre-development environmental
monitoring of identified offshore wind energy areas within and adjacent to
the study area. In addition, passive acoustic monitoring of cetaceans is now
taking place in some areas and when combined with the survey data may
provide a more complete picture of distribution along the U.S. mid-Atlantic
Coast.
Other information will be available soon through the Cetacean Density and
Distribution Mapping Working Group (CetMap). This group has been
working on creating “comprehensive and easily accessible regional cetacean
density and distribution maps that are time- and species-specific, ideally
using survey data and models that estimate density using predictive
environmental factors.” For more information visit the CetMap website at:
http://cetsound.noaa.gov/cda-index.
South Atlantic Bight Marine Assessment
232 | Page 4 - Marine Mammals and Sea Turtles
Figure 4.1. Effort grid for in-water cetacean and sea turtle observation surveys
utilized in the SPUE Analysis

South Atlantic Bight Marine Assessment
4 - Marine Mammals and Sea Turtles 233 | Page
NORTH ATLANTIC RIGHT WHALE
A recent analysis of North Atlantic right whale (NARW) distribution (effort-corrected)
in the SABMA region was obtained from the Florida Fish and Wildlife Conservation
Commission (FWC). FWC compiled and analyzed NARW calving season data for the
SAB region from a number of researchers made available through the North Atlantic
Right Whale Consortium. The compiled data were for the 1991/1992 - 2012/2013
calving seasons (December – March) when these whales are present in the SAB region.
Survey effort is presented in Figure 4.2.
FLORIDA MANATEE
Three types of Florida manatee distribution information were obtained from the Florida
FWC to summarize distribution of this species in the SABMA study area: aerial
distribution surveys, synoptic surveys, and mortality data. For each type, the data were
spatially parsed into 1-minute squares. The 1-minute square resolution was used to
accommodate the relatively fine scale of the data collected. Although no formal
surveys of manatee distribution are conducted in Georgia, they are known to occur (in
relatively low numbers) in all tidally connected waters. Manatees are also occasionally
observed in the coastal and inshore waters of the other states in the SABMA region.
AERIAL DISTRIBUTION SURVEYS
The FWC and other agencies use aerial distribution surveys to determine the seasonal
distribution and relative abundance of manatees. The surveys utilized in the SABMA
analysis were typically conducted in inshore waters around the state. Flights were
usually between four and six hours long and were most commonly flown every two
weeks for two years (FWC, FWRI 2014a).
Most surveys were flown from small, four-seat, high-winged airplanes (Cessna 172 or
182) flying at a height of 150 m (500 ft) at a speed of 130 km/hr (80 mph). The flights
were designed to maximize manatee counts by concentrating on shallow nearshore
waters, where manatees and their primary food source, seagrasses, are located. Flight
paths were parallel to the shoreline, and when manatees were sighted, the airplane
circled until the researchers onboard were able to count the number of animals in each
group. Deeper waters were usually not surveyed. In urban areas or where waters are
particularly opaque, some studies were made using small helicopters. Manatee
distributional survey datasets were available for 12 of Florida’s 13 Atlantic Coast
counties in the MRGIS database or directly from FWC. In addition, the Palm Beach
County data and more recent survey data for Duval County were obtained directly from
the survey contractors (Dr. James Powell of Sea to Shore Alliance and Dr. Gerry Pinto of
Jacksonville University, respectively). Processing of the data for this analysis entailed

South Atlantic Bight Marine Assessment
234 | Page 4 - Marine Mammals and Sea Turtles
summarizing the most recent 2 years of distributional survey data available for each
county into 1 min grid cells.
Figure 4.2. Effort map for NARWC aerial survey data from the 1991-2012/2013 calving
seasons (December through March)
South Atlantic Bight Marine Assessment
4 - Marine Mammals and Sea Turtles 235 | Page
SYNOPTIC SURVEYS
The FWC also coordinates an interagency team that conducts aerial manatee synoptic
surveys. These surveys cover a large area including all of the manatees' known
wintering habitats in Florida (FWC, FWRI 2014a). These statewide interagency surveys
take place during the winter months and are conducted after cold fronts pass through
Florida when manatees gather at warm springs and thermal discharges from power
and industrial plants. These surveys are useful in determining minimum estimates of
the manatee populations.
Winter synoptic survey data were obtained from the FWC for the years 1991 - 2011.
First, abundance for each 1-minute square was calculated. Abundance was measured
in numbers of individuals sighted in any given 1-minute square over the years 1991-
2011. Persistence is based on the consistency with which a species was observed in the
same 1-minute square over time. The weighted persistence score is a variation of the
persistence score in which each five-year period is weighted by the average abundance
of the species over the five-year period it was present. Because the abundance data
were skewed toward low abundances with a few very high abundances, values were
log-transformed and mean log abundances were calculated for each five-year period
within each 1-square. These five-year mean scores were averaged across all decades
to obtain a grand average for each 1-minute square. The grand average was then
normalized across all 1-minute squares for manatees to create a metric of abundance
ranging between 0.0 and 1.00 for each 1-minute square, with low abundance defined
as 0.0-0.49 and high abundance defined as 0.50 – 0.99. The weighted persistence score
was calculated by adding the persistence and relative average abundance. In the
resulting metric, the integer part of the score is the persistence score while the decimal
part of the score is the relative grand average abundance value.
MORTALITY REPORTS
Established in 1974, a network of researchers and law enforcement agencies recover
reported manatee carcasses and assist injured manatees. In 1985, field coordination of
the rescue program and responsibilities for salvaging and necropsying manatee
carcasses were transferred to the state of Florida by the U.S. Fish and Wildlife Service
(USFWS) and now rest largely with FWC’s Fish and Wildlife Research Institute (FWRI).
Manatee mortality data were obtained from the FWC for this study and are current
through 2012. While other states in the SAB area also monitor marine mammal
mortality, the available data for manatees are not as consistent as Florida’s and
therefore were not included in the assessment.
South Atlantic Bight Marine Assessment
236 | Page 4 - Marine Mammals and Sea Turtles
SEA TURTLE NESTING
The South Carolina Department of Natural Resources assembled sea turtle nesting
information as part of the Governors’ South Atlantic Alliance regional geospatial
database entitled “Comprehensive Spatial Data on Biological Resources and Uses in
Southeastern Coastal Waters of the U.S.” Annual state survey data from North
Carolina, South Carolina, Georgia and Florida were compiled for 2006-2011. At
surveyed beaches mean nesting density per segment of beach was calculated and
mapped. We applied a similar approach to sea turtle nesting in the portion of Virginia
falling within the SAB region (beaches within the boundaries of the City of Virginia
Beach, Virginia). These data were obtained from the Back Bay National Wildlife Refuge.
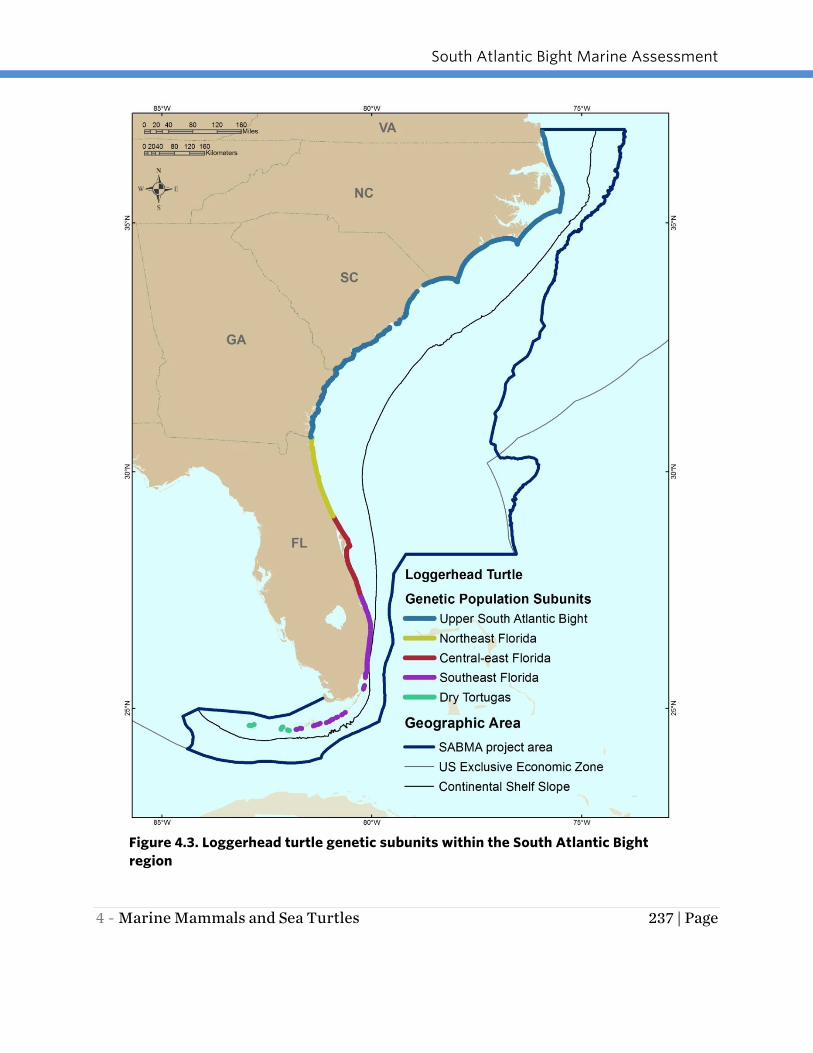
The Northwest Atlantic population of loggerhead sea turtles, which nests primarily
within the SAB region, is comprised of several genetic subunits (Shamblin et al. 2011,
2012). The FWC recognizes four genetic subunits in Florida (FWC 2014b) and one in
the remainder of the SAB region: Upper SAB (North Carolina to the Florida border),
Northeast Florida (Florida border south to Ponce Inlet), Central East Florida (Ponce Inlet
south to St. Lucie Inlet), Southeast Florida (St. Lucie Inlet south to Key West), and the
Dry Tortugas unit (includes Marquesas) (Figure 4.3). From a genetic/scientific
standpoint, the upper SAB subunit of loggerheads is defined as all animals nesting from
Ponce Inlet to the northern extent of the range in Virginia (Shamblin et al. 2012), but
for geopolitical reasons the subunit is defined as above to facilitate management. For
purposes of evaluation, the density of sea turtle nesting on beach segments was
compared within the defined genetic subunits (Figure 4.3).
South Atlantic Bight Marine Assessment
4 - Marine Mammals and Sea Turtles 237 | Page
Figure 4.3. Loggerhead turtle genetic subunits within the South Atlantic Bight
region
South Atlantic Bight Marine Assessment
238 | Page 4 - Marine Mammals and Sea Turtles
Maps, Analysis, and Areas of Importance
CETACEANS
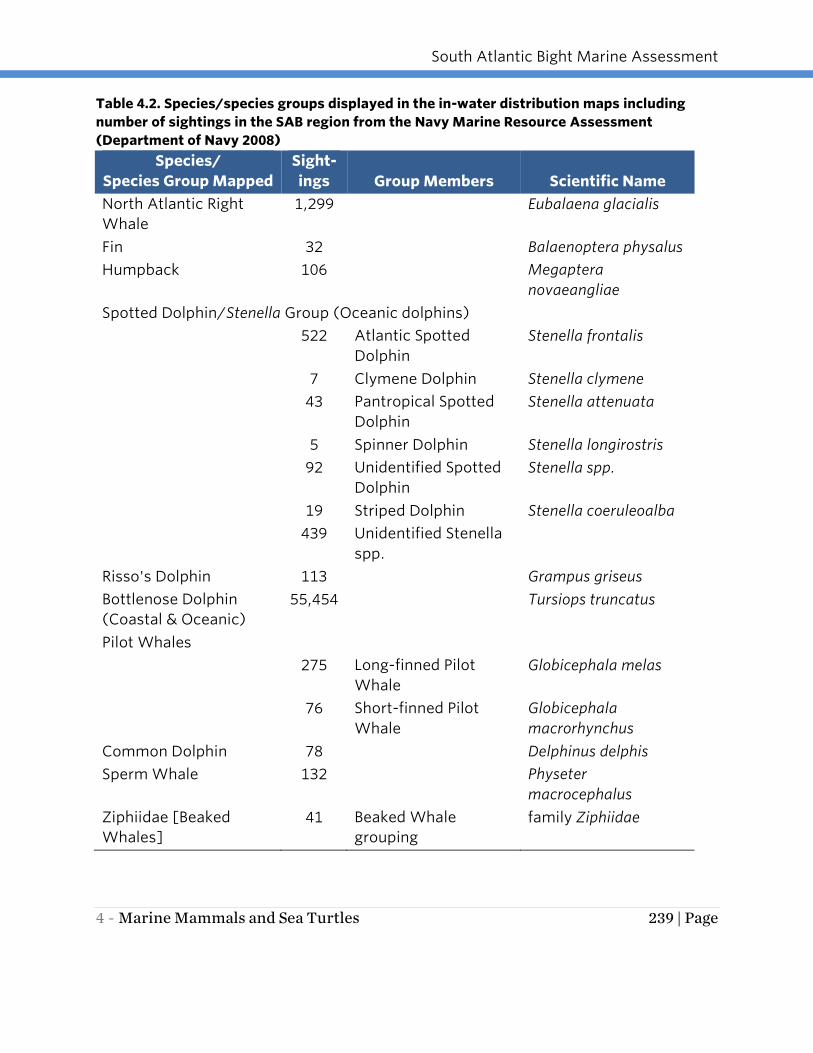
The number of sightings varied considerably by species (Table 4.2). Due to the limited
number of observations for some cetacean species in the study area, results were in
some cases compiled into species groups when species shared similar or overlapping
distributions (see Table 4.2). The groupings include spotted dolphins, pilot whales, and
beaked whales. While long-finned and short-finned pilot whales overlap in range in the
mid-Atlantic, the short-finned pilot whale’s distribution is more southerly and the long-
finned pilot whale’s is more northerly.
Species displayed separately due to unique distribution patterns and/or listed status
under the ESA includes the humpback, fin, North Atlantic right and sperm whales, and
the Risso’s, bottlenose and common dolphins. Distributions of species groups and
individual species are described below. Cetacean distributions are mapped by season
with the exception of the North Atlantic right whale which is only mapped for the
season in which it appears in the study area, winter. Maps for all the in-water
distributions are presented as z-scores (mean and standard deviations from the
mean). The table in Appendix 6 provides a translation map between the z-scores and
the sightings per unit effort. Absence of observations, especially in lightly surveyed
areas, should not be interpreted to mean that the species, species group, or cetaceans
in general do not occur there.
South Atlantic Bight Marine Assessment
4 - Marine Mammals and Sea Turtles 239 | Page
Table 4.2. Species/species groups displayed in the in-water distribution maps including
number of sightings in the SAB region from the Navy Marine Resource Assessment
(Department of Navy 2008)
Species/
Species Group Mapped
Sight-
ings Group Members Scientific Name
North Atlantic Right
Whale
1,299 Eubalaena glacialis
Fin 32 Balaenoptera physalus
Humpback 106 Megaptera
novaeangliae
Spotted Dolphin/Stenella Group (Oceanic dolphins)
522 Atlantic Spotted
Dolphin
Stenella frontalis
7 Clymene Dolphin Stenella clymene
43 Pantropical Spotted
Dolphin
Stenella attenuata
5 Spinner Dolphin Stenella longirostris
92 Unidentified Spotted
Dolphin
Stenella spp.
19 Striped Dolphin Stenella coeruleoalba
439 Unidentified Stenella
spp.
Risso's Dolphin 113 Grampus griseus
Bottlenose Dolphin
(Coastal & Oceanic)
55,454 Tursiops truncatus
Pilot Whales
275 Long-finned Pilot
Whale
Globicephala melas
76 Short-finned Pilot
Whale
Globicephala
macrorhynchus
Common Dolphin 78 Delphinus delphis
Sperm Whale 132 Physeter
macrocephalus
Ziphiidae [Beaked
Whales]
41 Beaked Whale
grouping
family Ziphiidae
South Atlantic Bight Marine Assessment
240 | Page 4 - Marine Mammals and Sea Turtles
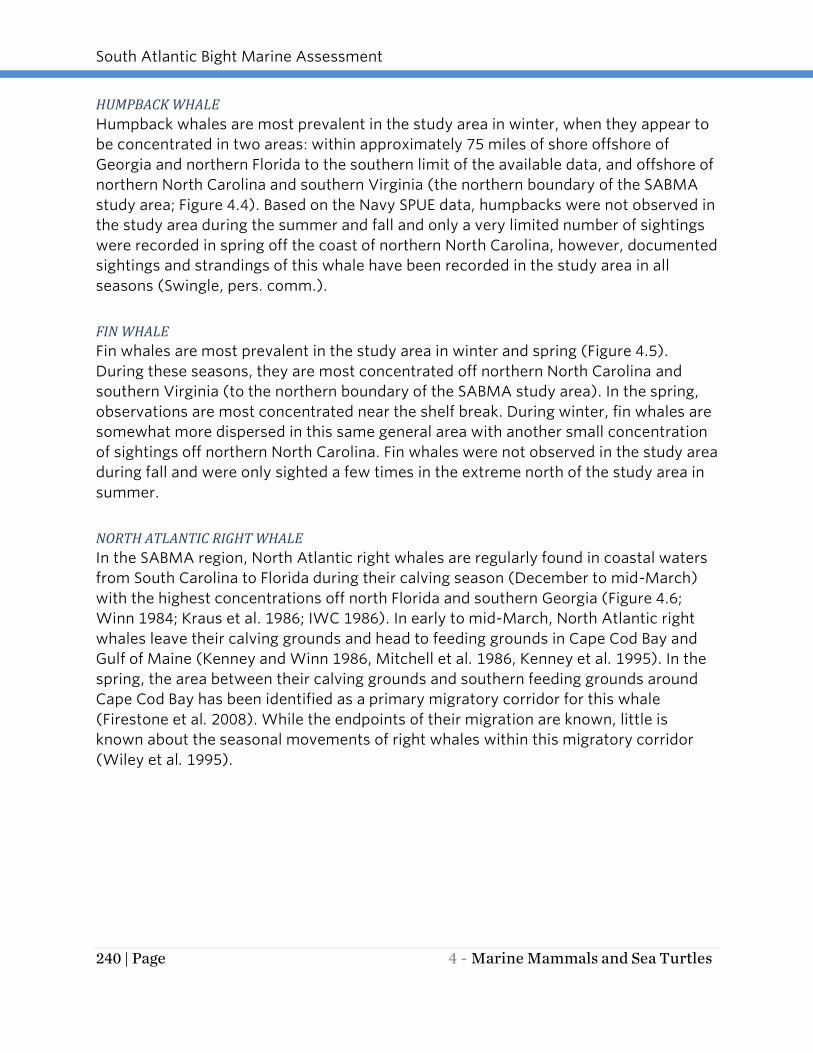
HUMPBACK WHALE
Humpback whales are most prevalent in the study area in winter, when they appear to
be concentrated in two areas: within approximately 75 miles of shore offshore of
Georgia and northern Florida to the southern limit of the available data, and offshore of
northern North Carolina and southern Virginia (the northern boundary of the SABMA
study area; Figure 4.4). Based on the Navy SPUE data, humpbacks were not observed in
the study area during the summer and fall and only a very limited number of sightings
were recorded in spring off the coast of northern North Carolina, however, documented
sightings and strandings of this whale have been recorded in the study area in all
seasons (Swingle, pers. comm.).
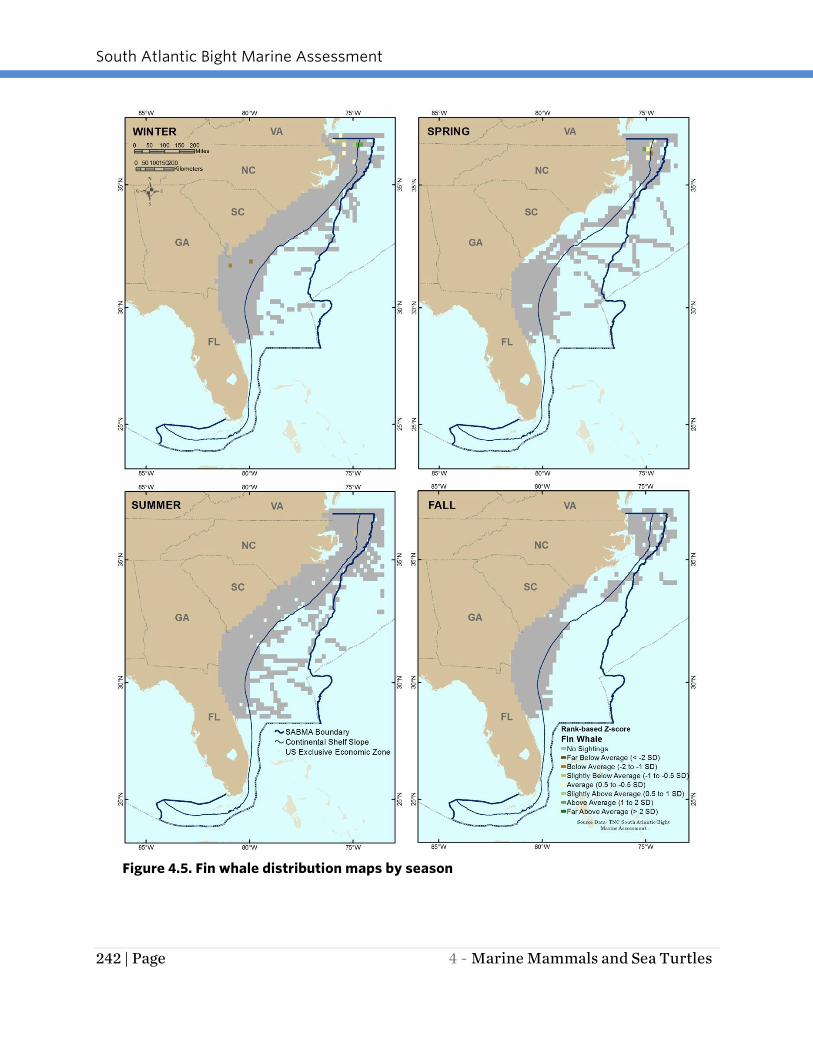
FIN WHALE
Fin whales are most prevalent in the study area in winter and spring (Figure 4.5).
During these seasons, they are most concentrated off northern North Carolina and
southern Virginia (to the northern boundary of the SABMA study area). In the spring,
observations are most concentrated near the shelf break. During winter, fin whales are
somewhat more dispersed in this same general area with another small concentration
of sightings off northern North Carolina. Fin whales were not observed in the study area
during fall and were only sighted a few times in the extreme north of the study area in
summer.
NORTH ATLANTIC RIGHT WHALE
In the SABMA region, North Atlantic right whales are regularly found in coastal waters
from South Carolina to Florida during their calving season (December to mid-March)
with the highest concentrations off north Florida and southern Georgia (Figure 4.6;
Winn 1984; Kraus et al. 1986; IWC 1986). In early to mid-March, North Atlantic right
whales leave their calving grounds and head to feeding grounds in Cape Cod Bay and
Gulf of Maine (Kenney and Winn 1986, Mitchell et al. 1986, Kenney et al. 1995). In the
spring, the area between their calving grounds and southern feeding grounds around
Cape Cod Bay has been identified as a primary migratory corridor for this whale
(Firestone et al. 2008). While the endpoints of their migration are known, little is
known about the seasonal movements of right whales within this migratory corridor
(Wiley et al. 1995).

South Atlantic Bight Marine Assessment
4 - Marine Mammals and Sea Turtles 241 | Page
Figure 4.4. Humpback whale distribution maps by season
South Atlantic Bight Marine Assessment
242 | Page 4 - Marine Mammals and Sea Turtles
Figure 4.5. Fin whale distribution maps by season

South Atlantic Bight Marine Assessment
4 - Marine Mammals and Sea Turtles 243 | Page
Figure 4.6. Map of North Atlantic Right Whale distribution during the 1991/1992
- 2012/2013 calving seasons (December through March)

South Atlantic Bight Marine Assessment
244 | Page 4 - Marine Mammals and Sea Turtles
BOTTLENOSE DOLPHIN
Two morphologically and genetically distinct bottlenose dolphin morphotypes are
found in the Northwest Atlantic Ocean (Duffield et al. 1983; Duffield 1986): the coastal
and offshore forms. The coastal form has been differentiated into a number of coastal
populations based on genetic analyses, each of which is managed as a separate stock
by NMFS. The data utilized for this study only evaluated offshore and nearshore
populations of bottlenose dolphins, not those that inhabit the estuarine portion of the
study area. In the winter, bottlenose dolphin sightings were the highest, with greatest
concentrations of sightings in offshore areas off North Carolina and nearshore areas off
northern Florida (Figure 4.7). In the summer, bottlenose dolphins were present in both
nearshore and offshore areas throughout most of the study area. In fall and spring, they
were mostly found off Cape Hatteras in the northern portion of the study area and off
the South Carolina, Georgia and northern Florida coasts.
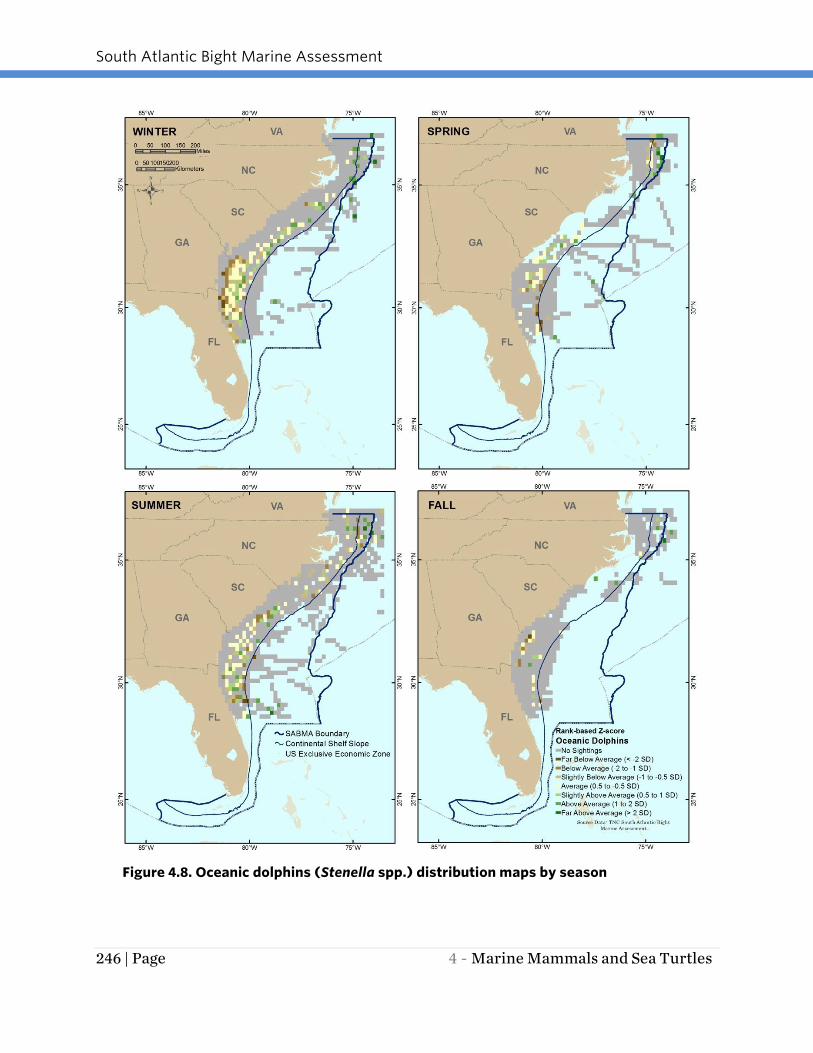
OCEANIC DOLPHINS
Oceanic or Atlantic and pantropical spotted dolphins (Stenella spp.) are found
throughout the SABMA study area year-round and display movement patterns that
appear to vary by season (Figure 4.8). A large number of spotted dolphin sightings
were recorded in the winter and summer, a smaller number of sightings were recorded
in spring, and there were relatively few sightings in fall. In winter and summer, spotted
dolphins were located throughout the study area in relatively large numbers. In spring,
most sightings were recorded off northern Florida, Georgia and South Carolina,
northern North Carolina and southern Virginia. Survey effort off the southern portion of
North Carolina was very limited. In fall, relatively fewer spotted dolphins were recorded
where surveys took place. Little is known of these species’ migratory patterns.
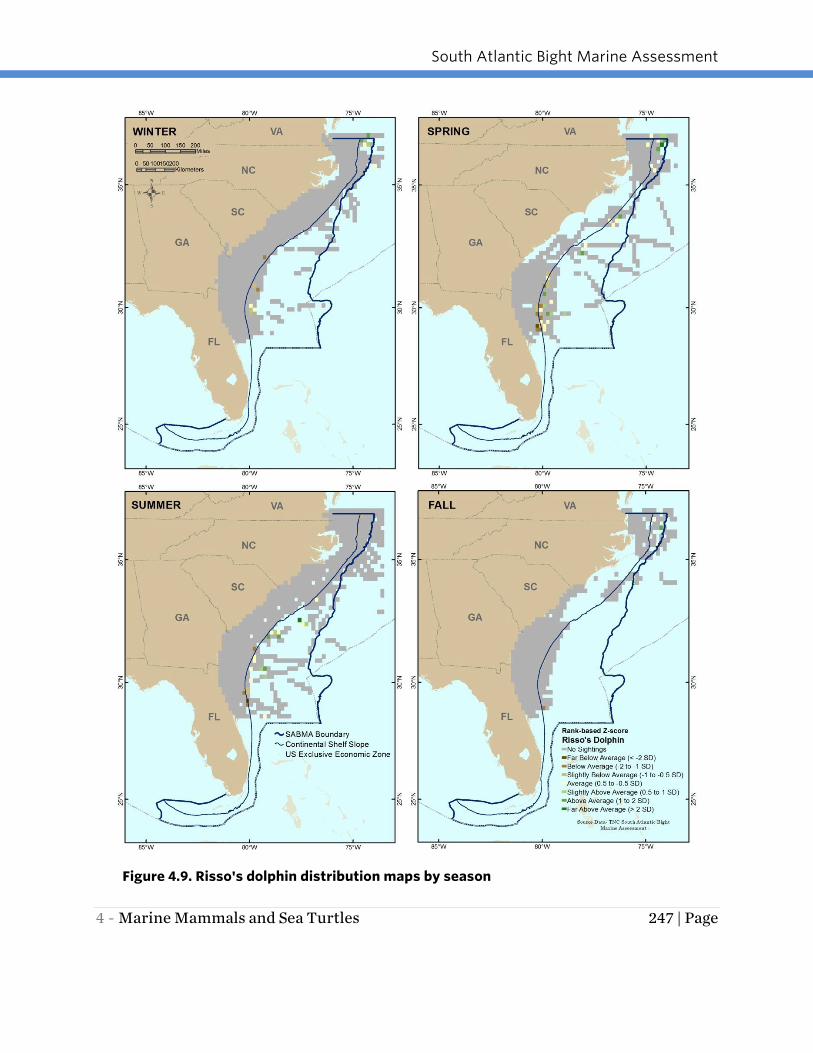
RISSO’S DOLPHIN
Risso’s dolphins were present in the study area year-round, primarily in deeper waters
of the Continental Slope (Figure 4.9). They were more widely distributed in spring and
summer. In the fall Risso’s dolphins were only documented in the northern portion of
the study area in Continental Slope waters off southern Virginia and North Carolina.

South Atlantic Bight Marine Assessment
4 - Marine Mammals and Sea Turtles 245 | Page
Figure 4.7. Bottlenose dolphin distribution maps by season
South Atlantic Bight Marine Assessment
246 | Page 4 - Marine Mammals and Sea Turtles
Figure 4.8. Oceanic dolphins (Stenella spp.) distribution maps by season
South Atlantic Bight Marine Assessment
4 - Marine Mammals and Sea Turtles 247 | Page
Figure 4.9. Risso's dolphin distribution maps by season
South Atlantic Bight Marine Assessment
248 | Page 4 - Marine Mammals and Sea Turtles
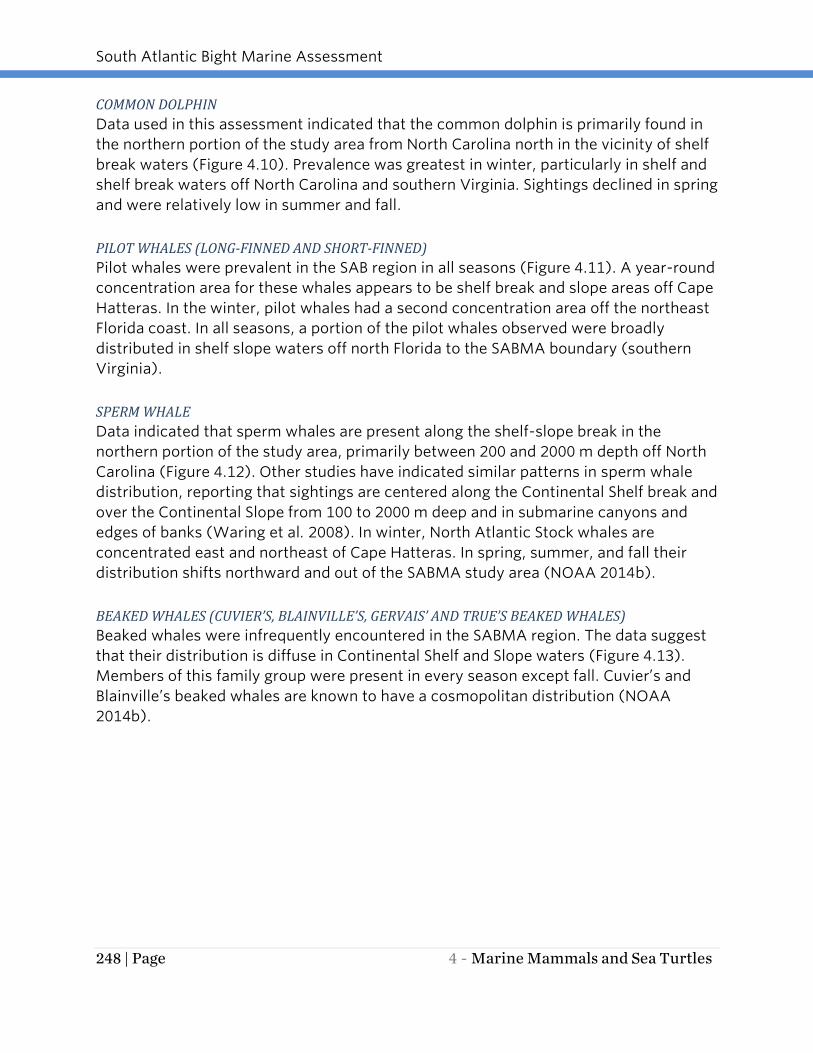
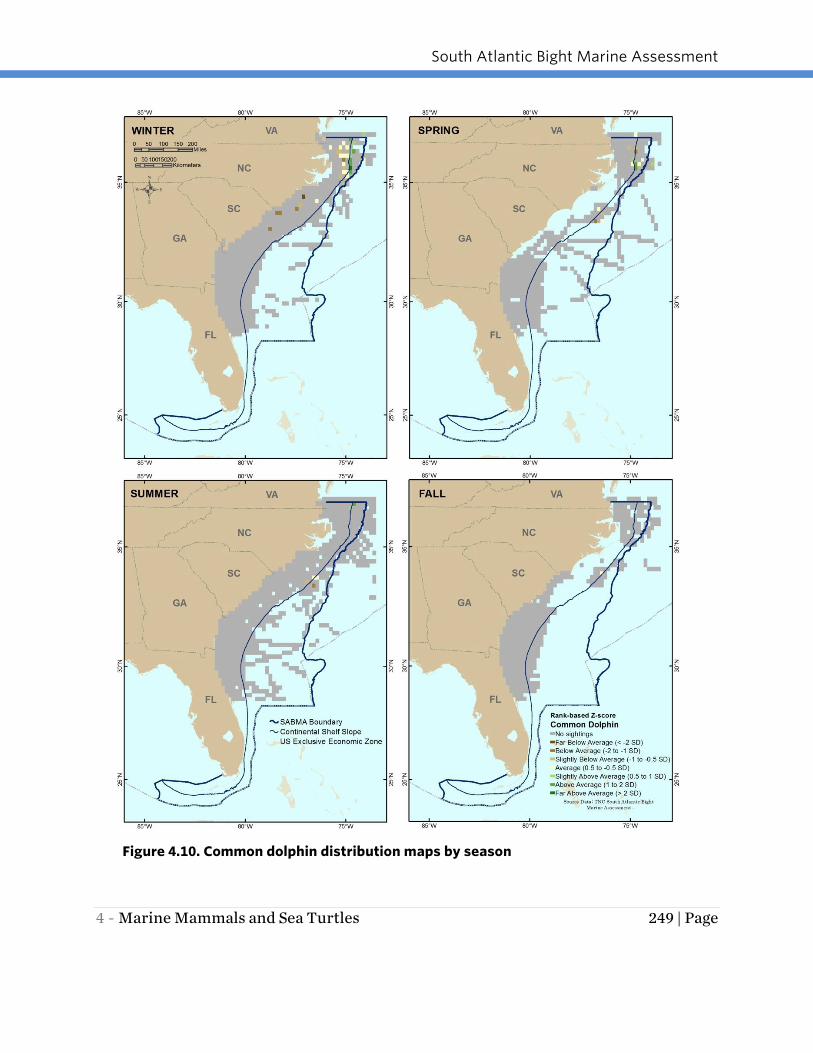
COMMON DOLPHIN
Data used in this assessment indicated that the common dolphin is primarily found in
the northern portion of the study area from North Carolina north in the vicinity of shelf
break waters (Figure 4.10). Prevalence was greatest in winter, particularly in shelf and
shelf break waters off North Carolina and southern Virginia. Sightings declined in spring
and were relatively low in summer and fall.
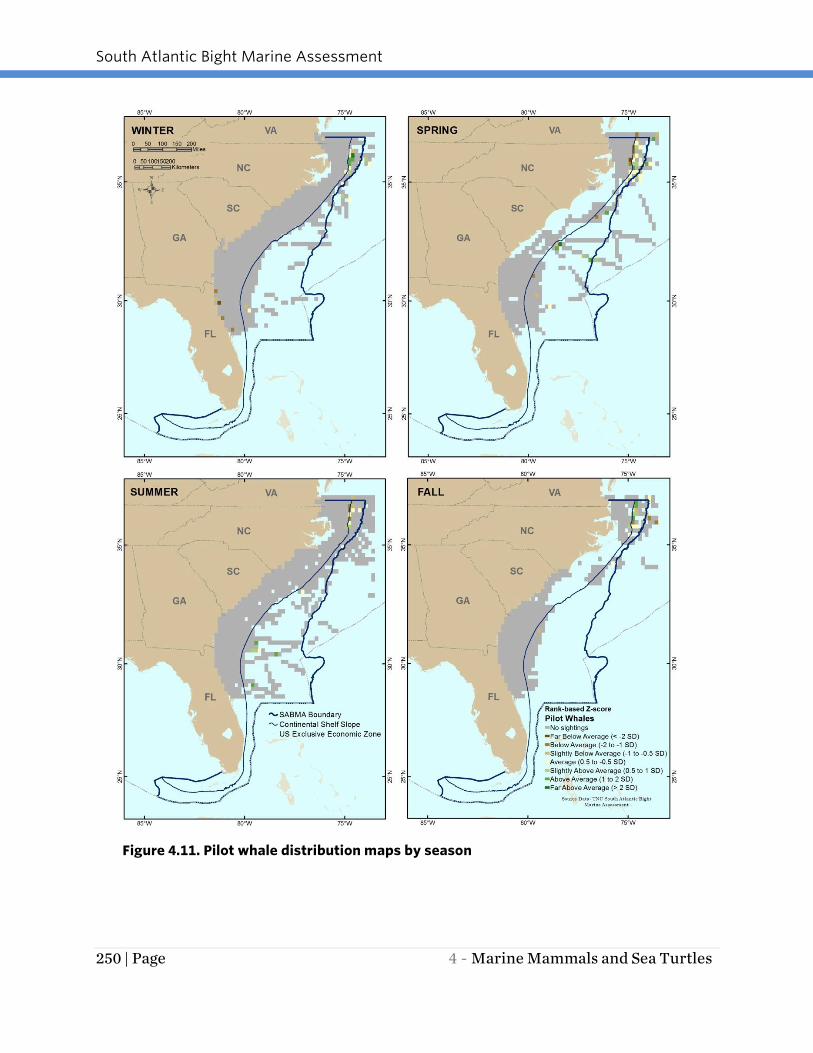
PILOT WHALES (LONG-FINNED AND SHORT-FINNED)
Pilot whales were prevalent in the SAB region in all seasons (Figure 4.11). A year-round
concentration area for these whales appears to be shelf break and slope areas off Cape
Hatteras. In the winter, pilot whales had a second concentration area off the northeast
Florida coast. In all seasons, a portion of the pilot whales observed were broadly
distributed in shelf slope waters off north Florida to the SABMA boundary (southern
Virginia).
SPERM WHALE
Data indicated that sperm whales are present along the shelf-slope break in the
northern portion of the study area, primarily between 200 and 2000 m depth off North
Carolina (Figure 4.12). Other studies have indicated similar patterns in sperm whale
distribution, reporting that sightings are centered along the Continental Shelf break and
over the Continental Slope from 100 to 2000 m deep and in submarine canyons and
edges of banks (Waring et al. 2008). In winter, North Atlantic Stock whales are
concentrated east and northeast of Cape Hatteras. In spring, summer, and fall their
distribution shifts northward and out of the SABMA study area (NOAA 2014b).
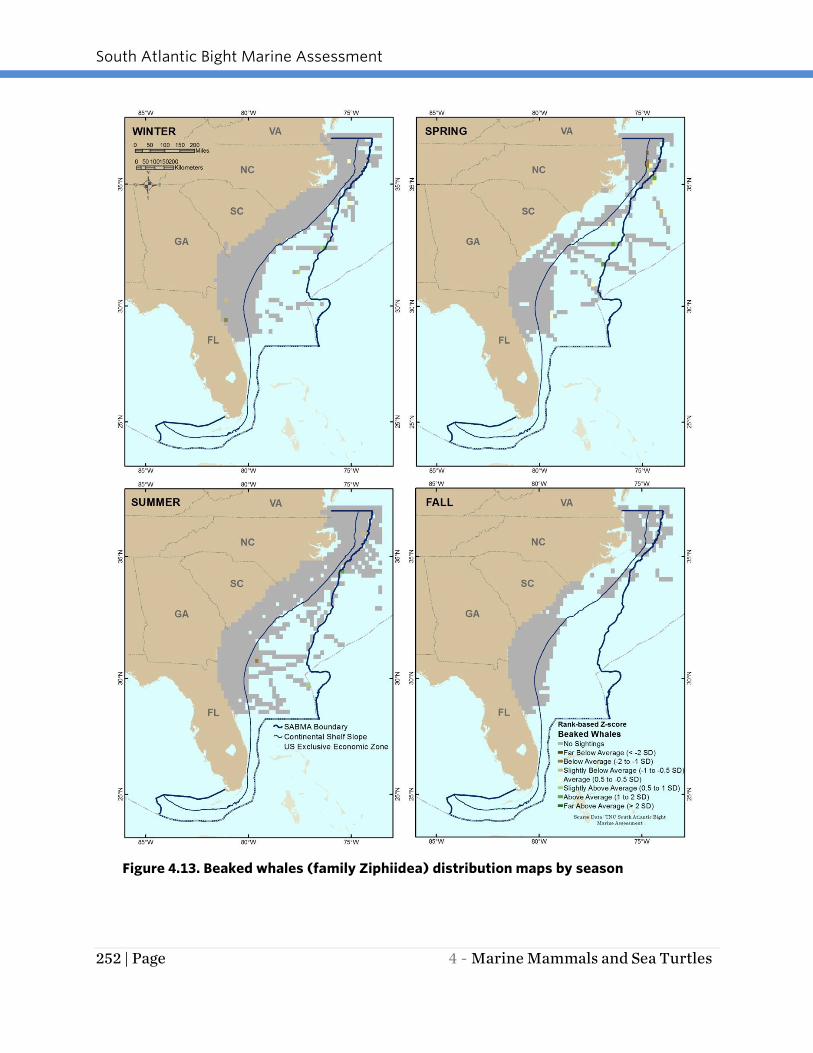
BEAKED WHALES (CUVIER’S, BLAINVILLE’S, GERVAIS’ AND TRUE’S BEAKED WHALES)
Beaked whales were infrequently encountered in the SABMA region. The data suggest
that their distribution is diffuse in Continental Shelf and Slope waters (Figure 4.13).
Members of this family group were present in every season except fall. Cuvier’s and
Blainville’s beaked whales are known to have a cosmopolitan distribution (NOAA
2014b).
South Atlantic Bight Marine Assessment
4 - Marine Mammals and Sea Turtles 249 | Page
Figure 4.10. Common dolphin distribution maps by season
South Atlantic Bight Marine Assessment
250 | Page 4 - Marine Mammals and Sea Turtles
Figure 4.11. Pilot whale distribution maps by season

South Atlantic Bight Marine Assessment
4 - Marine Mammals and Sea Turtles 251 | Page
Figure 4.12. Sperm whale distribution maps by season
South Atlantic Bight Marine Assessment
252 | Page 4 - Marine Mammals and Sea Turtles
Figure 4.13. Beaked whales (family Ziphiidea) distribution maps by season
South Atlantic Bight Marine Assessment
4 - Marine Mammals and Sea Turtles 253 | Page
Box 4.3. Comparison to Northwest Atlantic Marine Ecoregional Assessment Results
FLORIDA MANATEE
Analysis of the three sources of Florida distribution information used in the assessment
revealed that the Florida manatee was generally present throughout tidally connected
waters. The winter synoptic survey results for the years 1992 through 2011 are
illustrated in a weighted persistence format. Table 4.3 below provides the abundance
ranges used to categorize high and low abundance in each of the persistence
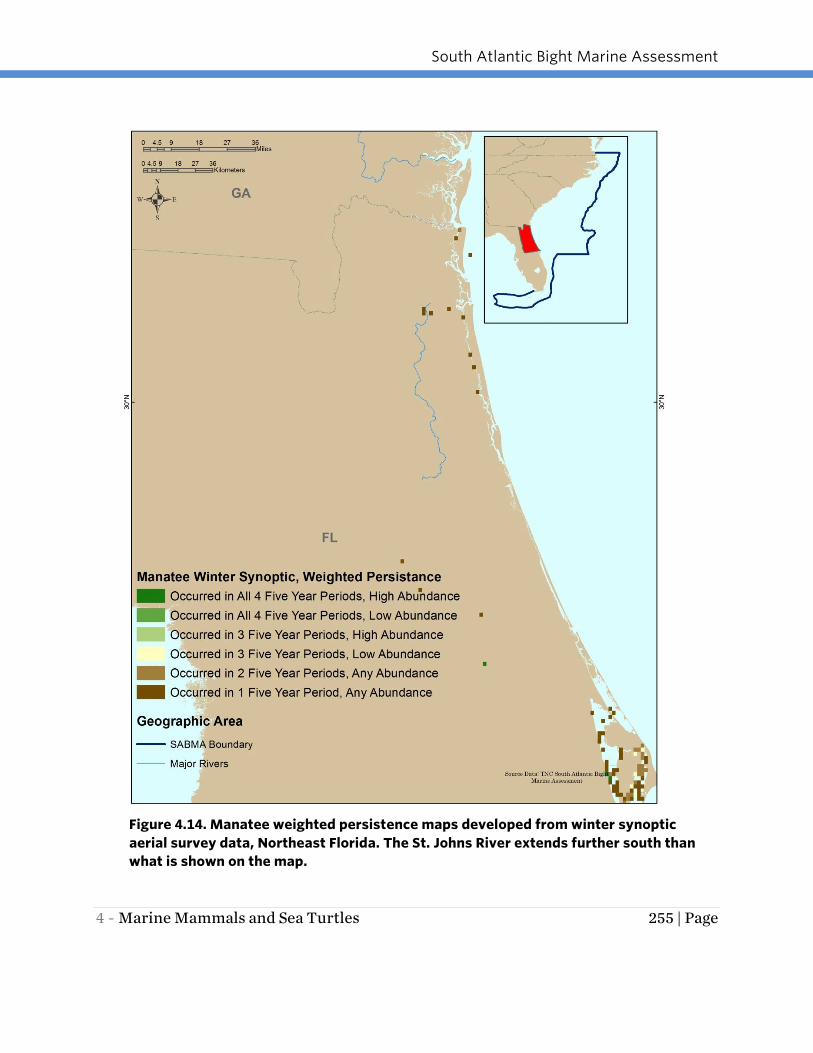
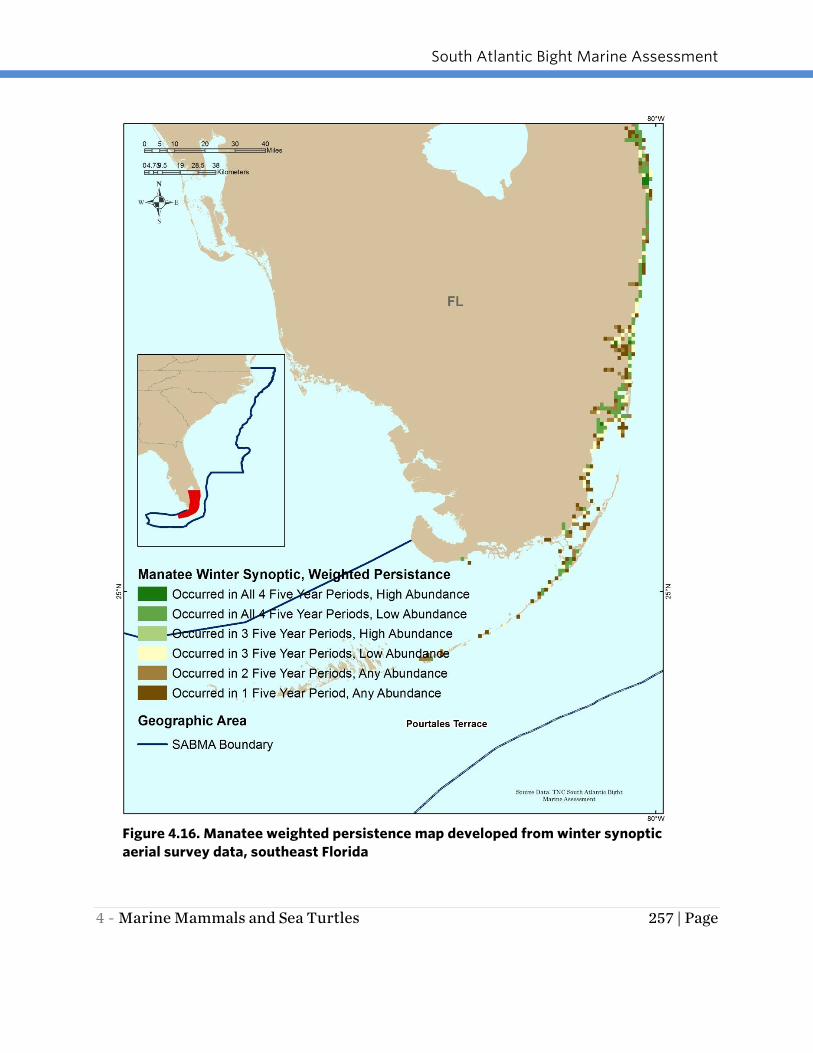
categories. The weighted persistence maps (Figures 4.14-4.16) highlight that the most
important overwintering areas for the Florida manatee in the SABMA region are in
southern Florida from the upper Florida Keys to the St. Lucie Inlet with a few additional
isolated important areas including Vaca Key in the Florida Keys, a few locations along
the Indian River Lagoon, and the spring-fed Blue Springs area of the St. Johns River
more than 100 miles upstream (south) of where the river meets the ocean.
The available distributional survey results (Figures 4.17 through 4.19) suggest that the
upper St. Johns River (northern portion) and the east-central Florida coast from Cape
Canaveral south to Palm Beach County have the greatest concentration of high
abundance areas along the Florida coast.
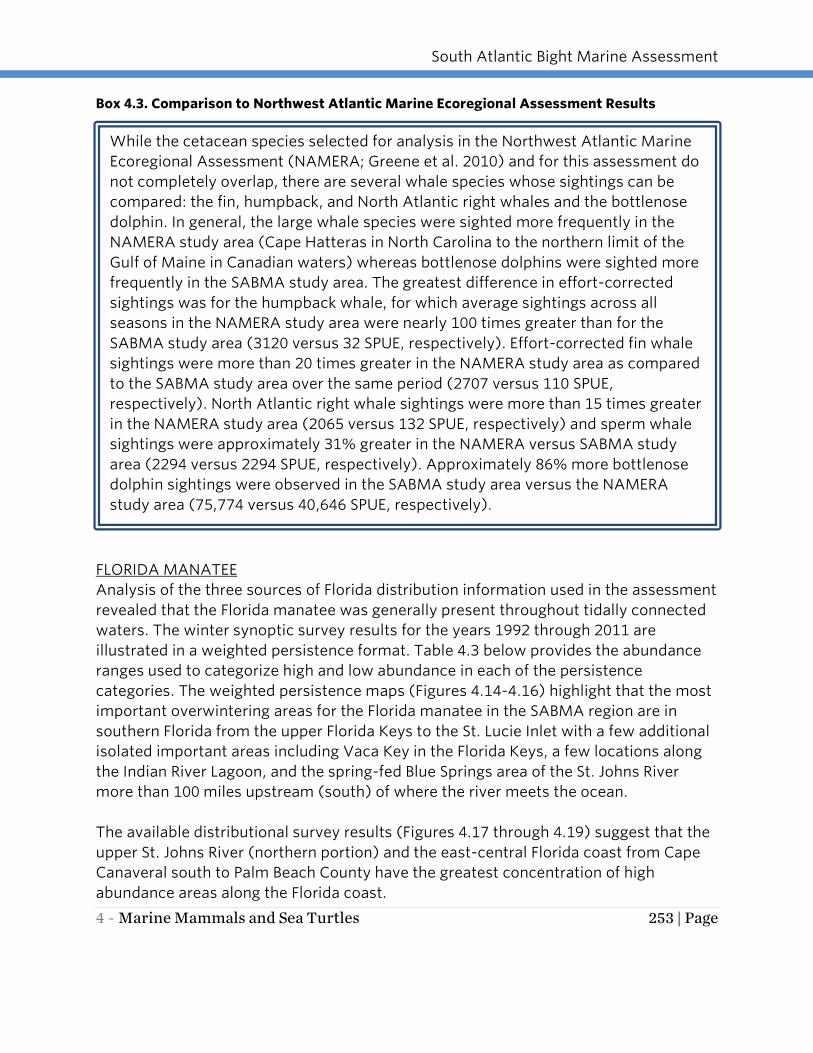
While the cetacean species selected for analysis in the Northwest Atlantic Marine
Ecoregional Assessment (NAMERA; Greene et al. 2010) and for this assessment do
not completely overlap, there are several whale species whose sightings can be
compared: the fin, humpback, and North Atlantic right whales and the bottlenose
dolphin. In general, the large whale species were sighted more frequently in the
NAMERA study area (Cape Hatteras in North Carolina to the northern limit of the
Gulf of Maine in Canadian waters) whereas bottlenose dolphins were sighted more
frequently in the SABMA study area. The greatest difference in effort-corrected
sightings was for the humpback whale, for which average sightings across all
seasons in the NAMERA study area were nearly 100 times greater than for the
SABMA study area (3120 versus 32 SPUE, respectively). Effort-corrected fin whale
sightings were more than 20 times greater in the NAMERA study area as compared
to the SABMA study area over the same period (2707 versus 110 SPUE,
respectively). North Atlantic right whale sightings were more than 15 times greater
in the NAMERA study area (2065 versus 132 SPUE, respectively) and sperm whale
sightings were approximately 31% greater in the NAMERA versus SABMA study
area (2294 versus 2294 SPUE, respectively). Approximately 86% more bottlenose
dolphin sightings were observed in the SABMA study area versus the NAMERA
study area (75,774 versus 40,646 SPUE, respectively).

South Atlantic Bight Marine Assessment
254 | Page 4 - Marine Mammals and Sea Turtles
Results of the mortality recovery locations (Figures 4.20-4.22) are more difficult to
interpret as they may indicate both where manatees are concentrated as well as where
manatees are most vulnerable to human impacts (e.g., boat strikes). The mortality
location maps display a spatial pattern similar to the distributional survey maps, with
the exception that mortality also appears to be high in Broward and Miami-Dade
counties.
Table 4.3. Abundance ranges used to categorize high and low abundance categories for the
Florida manatee winter synoptic survey weighted persistence maps
Persistence
Category
Abundance
Category
Abundance Range
(animals per cell)
Occurred in All 4 Five Year Periods High Abundance 2022 to 46.5*
Occurred in All 4 Five Year Periods Low Abundance 77.25 to 1.75
Occurred in 3 Five Year Periods High Abundance 172**
Occurred in 3 Five Year Periods Low Abundance 40.7 to 88
Occurred in 2 Five Year Periods Any Abundance 44 to 1
Occurred in 1 Five Year Period Any Abundance 247 to 1
* Overlap in high and low abundance categories is a result of normalizing the data and the
top range value in this category (77.25) is an outlier caused by a declining trend in
abundance.
**Only one cell in the high abundance category.
South Atlantic Bight Marine Assessment
4 - Marine Mammals and Sea Turtles 255 | Page
Figure 4.14. Manatee weighted persistence maps developed from winter synoptic
aerial survey data, Northeast Florida. The St. Johns River extends further south than
what is shown on the map.

South Atlantic Bight Marine Assessment
256 | Page 4 - Marine Mammals and Sea Turtles
Figure 4.15. Manatee weighted persistence map developed from wither synoptic
aerial survey data, east-central Florida
South Atlantic Bight Marine Assessment
4 - Marine Mammals and Sea Turtles 257 | Page
Figure 4.16. Manatee weighted persistence map developed from winter synoptic
aerial survey data, southeast Florida
South Atlantic Bight Marine Assessment
258 | Page 4 - Marine Mammals and Sea Turtles
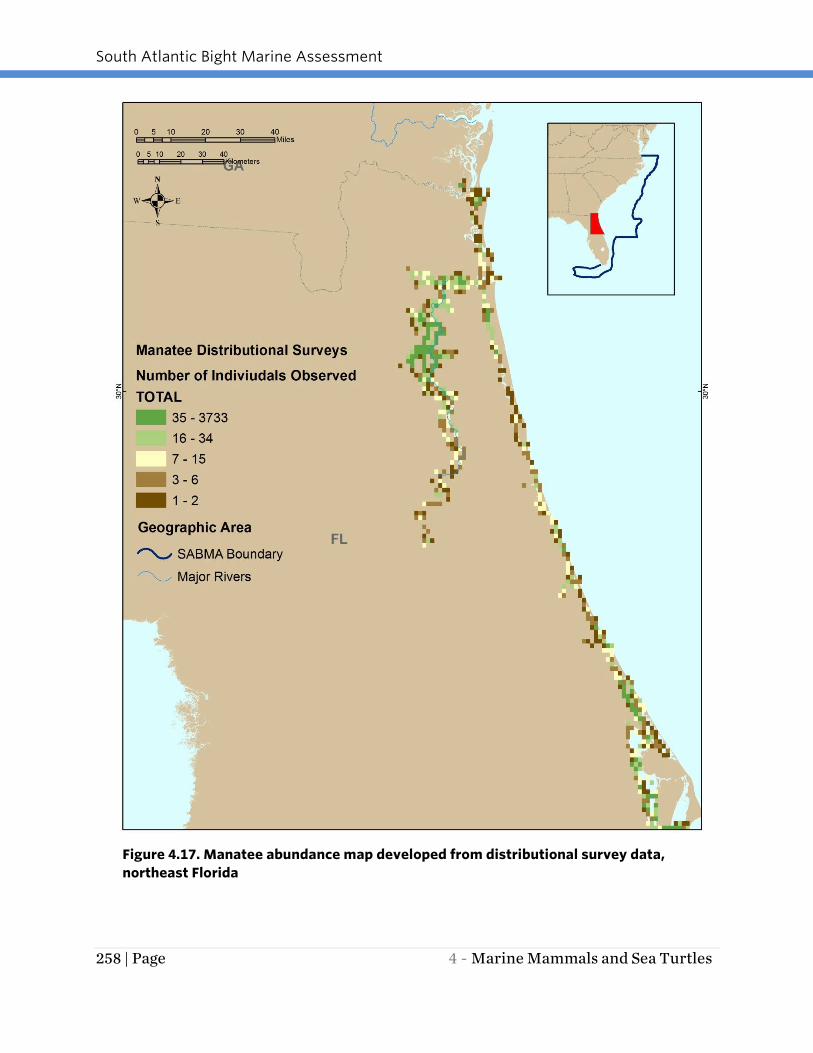
Figure 4.17. Manatee abundance map developed from distributional survey data,
northeast Florida

South Atlantic Bight Marine Assessment
4 - Marine Mammals and Sea Turtles 259 | Page
Figure 4.18. Manatee abundance map developed from distributional survey data, east-
central Florida
South Atlantic Bight Marine Assessment
260 | Page 4 - Marine Mammals and Sea Turtles
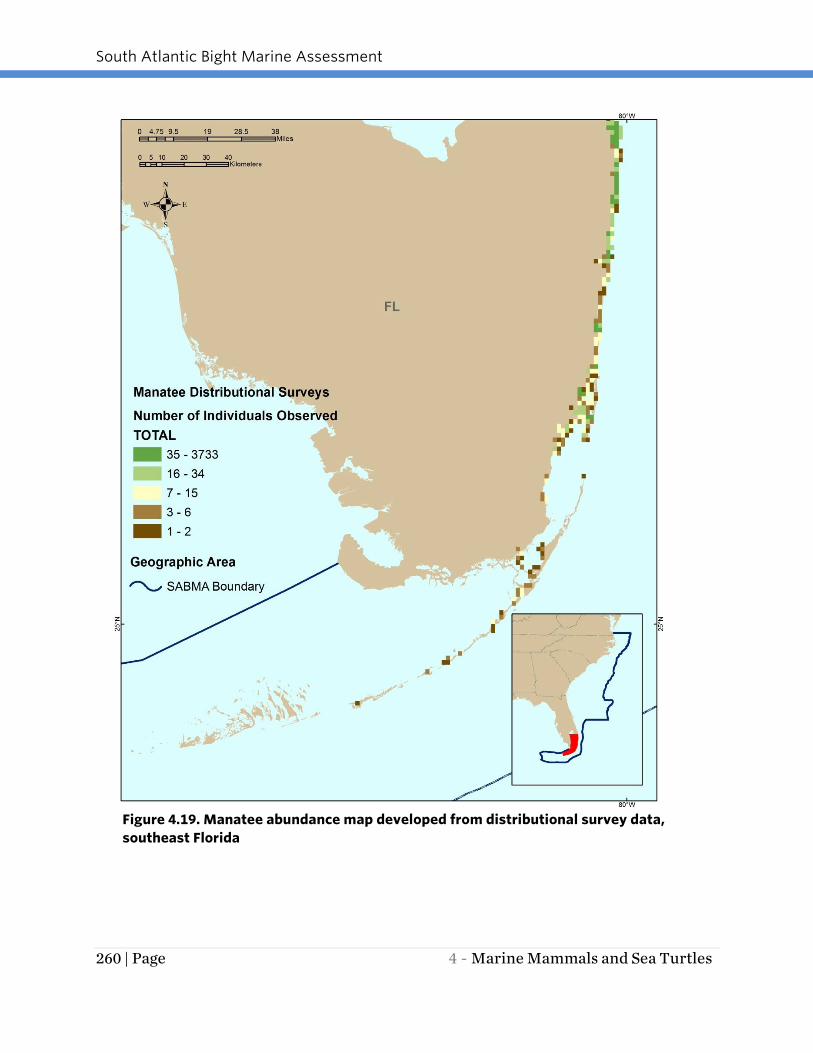
Figure 4.19. Manatee abundance map developed from distributional survey data,
southeast Florida

South Atlantic Bight Marine Assessment
4 - Marine Mammals and Sea Turtles 261 | Page
Figure 4.20. Manatee mortality location map, northeast Florida

South Atlantic Bight Marine Assessment
262 | Page 4 - Marine Mammals and Sea Turtles
Figure 4.21. Manatee mortality location map, east-central Florida

South Atlantic Bight Marine Assessment
4 - Marine Mammals and Sea Turtles 263 | Page
Figure 4.22. Manatee mortality location map, southeast Florida

South Atlantic Bight Marine Assessment
264 | Page 4 - Marine Mammals and Sea Turtles
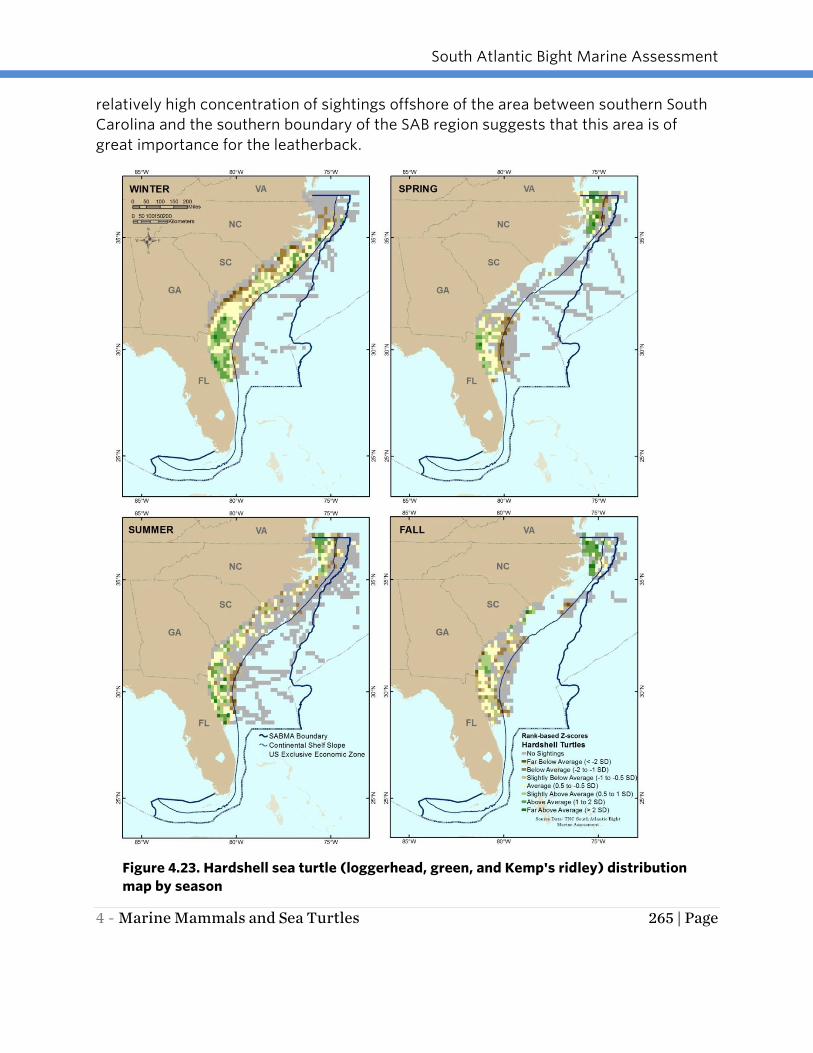
SEA TURTLES: IN WATER DISTRIBUTION
HARDSHELL SEA TURTLES (LOGGERHEAD, GREEN, HAWKSBILL AND KEMP’S RIDLEY)
For the in-water sea turtle distribution analyses, it is important to note that survey
effort is lacking for large portions of the survey area and there are issues with
detectability/availability of turtles during warmer water seasons. Consequently, the in-
water sea turtle maps may be best used to assess presence or absence of hard shelled
turtles rather than patterns of abundance. Results suggest that hardshell turtles have
broad distribution in SAB Continental Shelf waters in every season although the pattern
of distribution varies (Figure 4.23).
Depending on the season, the greatest effort-corrected number of observations in any
one TMS ranged from 234 to 782 sightings per unit effort. During the spring and
summer months (March to May and June to August, respectively), two areas of higher
concentration were observed: the area from southern Georgia to the southern survey
boundary and the area from northern North Carolina to the northern boundary of the
SAB region. Observations during the fall months (September - November) appeared to
be primarily concentrated in the northern portion of the study area off northern North
Carolina and the southern Virginia coast with a smaller concentration area off northern
South Carolina, however, very little survey effort took place off northern South Carolina
and southern North Carolina during the fall months. In the winter months (December –
February), hardshell turtles appeared to move offshore or south and observations were
concentrated along the Continental Shelf off central Georgia to the southern boundary
of the survey area (Cape Canaveral, Florida). Variations in seasonal abundance may be
related more to thermoregulation behavior (sunning during cold water periods) than
seasonal movement of animals. The seasonality of the sightings, with a higher
concentration of turtles in the southern portion of the study area in winter, follows the
general pattern of decreased turtle sightings as waters in the northern portion of the
study area cool and prey resources diminish (Braun-McNeil and Epperly 2002; Braun-
McNeil et al. 2008).
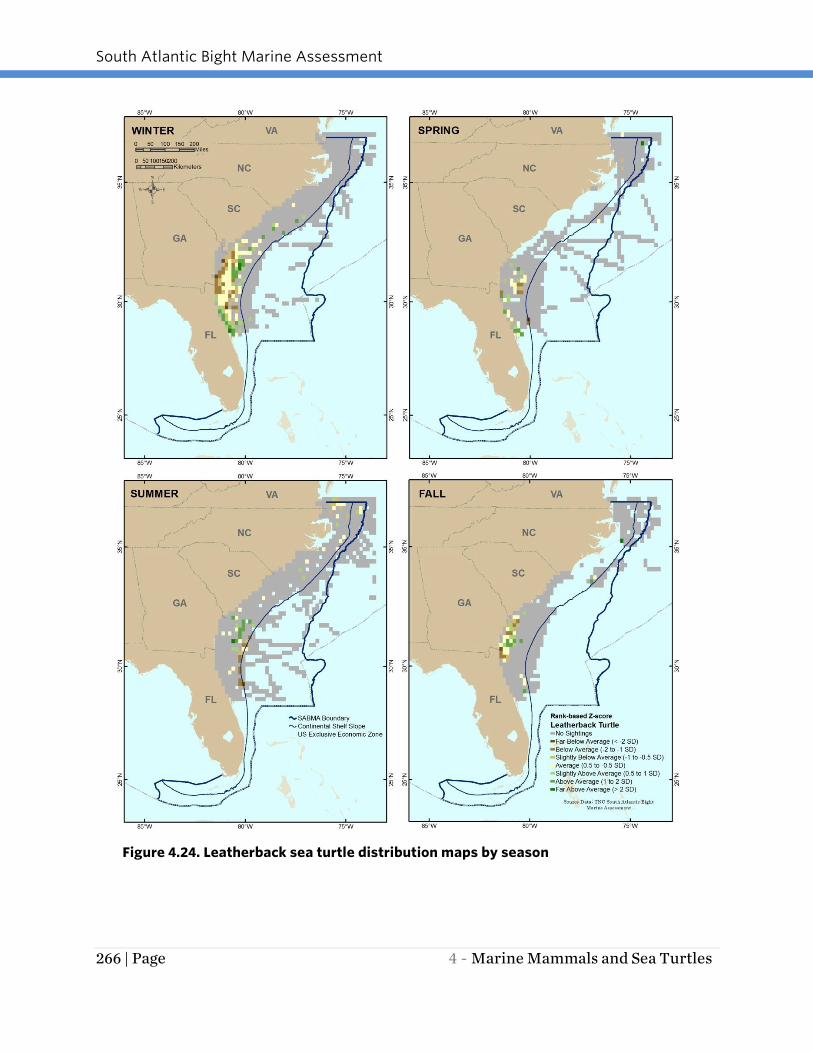
LEATHERBACK TURTLE
Based on effort-corrected observations, leatherback turtle distribution varies
seasonally in the region, with the greatest number of effort-corrected observations in
any one TMS ranging from 35 to 166 depending on the season (Figure 4.24). In the
summer months, turtles were diffusely spread throughout the survey area, with an
area of high concentration observed on the Continental Shelf offshore of Georgia. In the
winter and spring months (December - February and March - May, respectively) most
turtles were concentrated in the southern portion of the survey area. In fall (September
- November) turtles were most concentrated off the Georgia coast. In spring and fall,
limited survey effort occurred off the coast of South Carolina and southern North
Carolina. In all seasons, sightings were almost exclusively on the Continental Shelf. The
South Atlantic Bight Marine Assessment
4 - Marine Mammals and Sea Turtles 265 | Page
relatively high concentration of sightings offshore of the area between southern South
Carolina and the southern boundary of the SAB region suggests that this area is of
great importance for the leatherback.
Figure 4.23. Hardshell sea turtle (loggerhead, green, and Kemp's ridley) distribution
map by season
South Atlantic Bight Marine Assessment
266 | Page 4 - Marine Mammals and Sea Turtles
Figure 4.24. Leatherback sea turtle distribution maps by season
South Atlantic Bight Marine Assessment
4 - Marine Mammals and Sea Turtles 267 | Page
SEA TURTLES: NESTING AREAS
Five sea turtle species nest in the SABMA area, however, only the loggerhead turtle
nests regularly in the SABMA region outside of Florida. Due to the limited amount of
nesting in the SABMA region by two of the target species, the hawksbill and Kemp’s
ridley turtles, only presence and absence of nests has been recorded. For the three
remaining species, loggerhead, green and leatherback turtles, the nesting data are
displayed in quartiles to eliminate any subjectivity in selecting the density categories.
LOGGERHEAD TURTLE
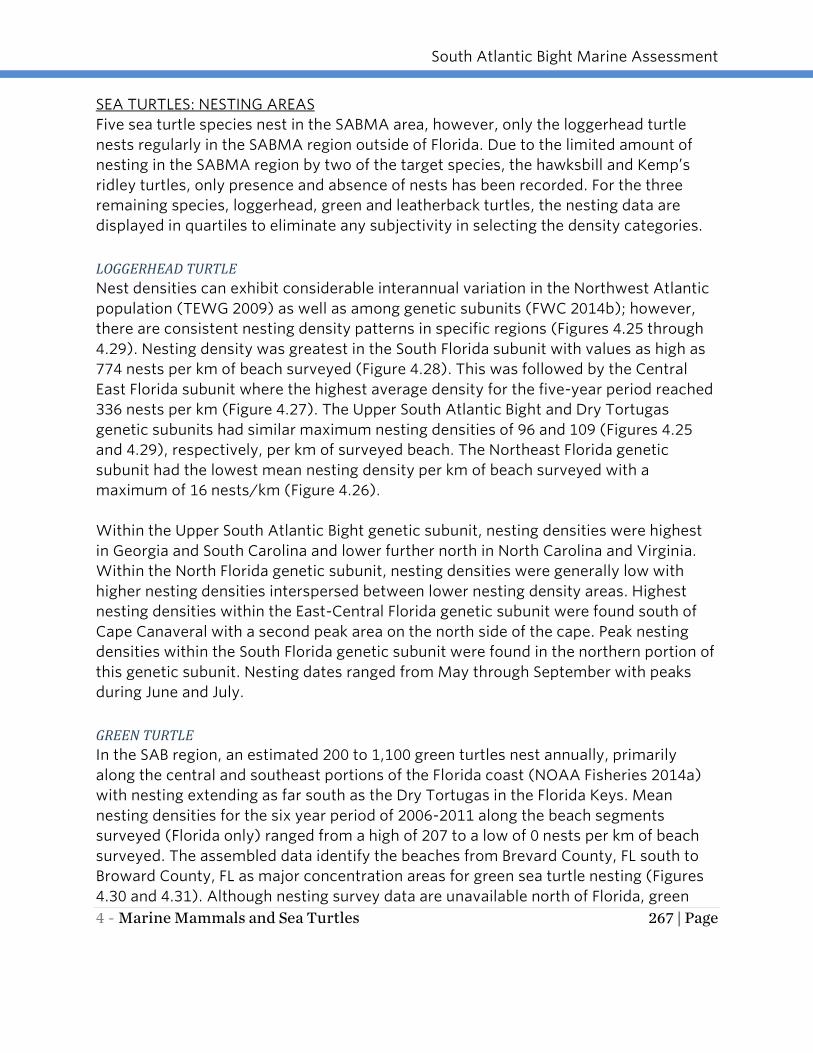
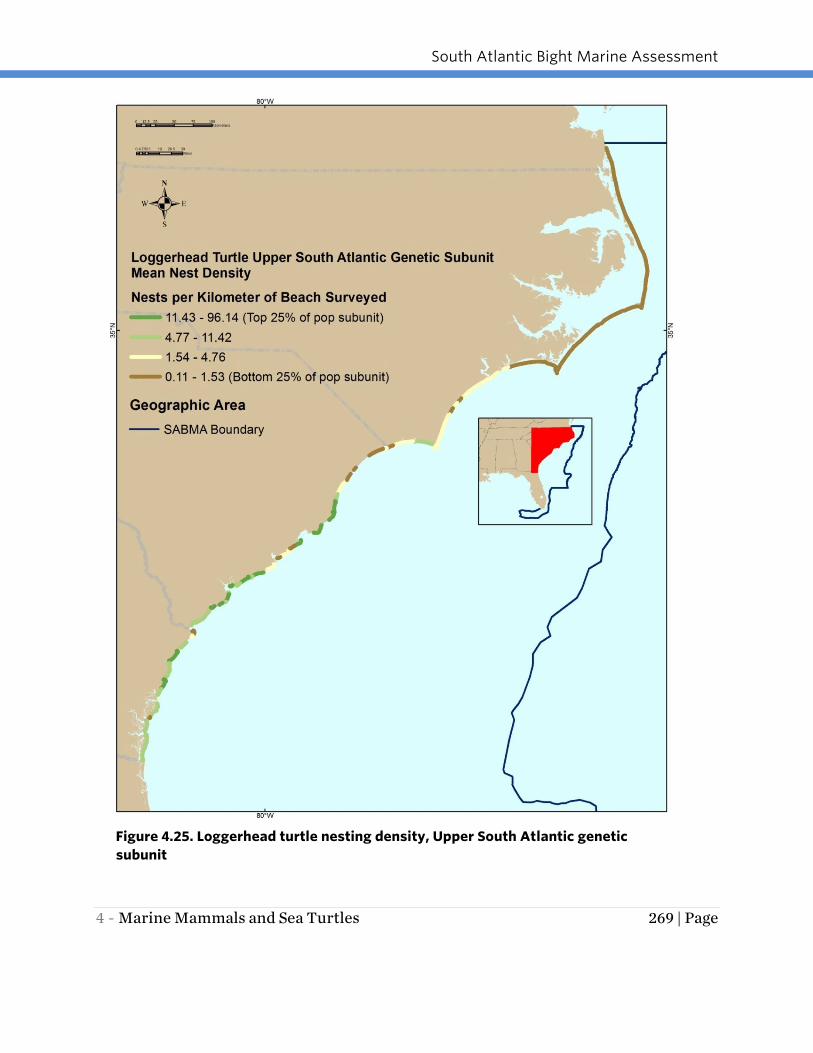
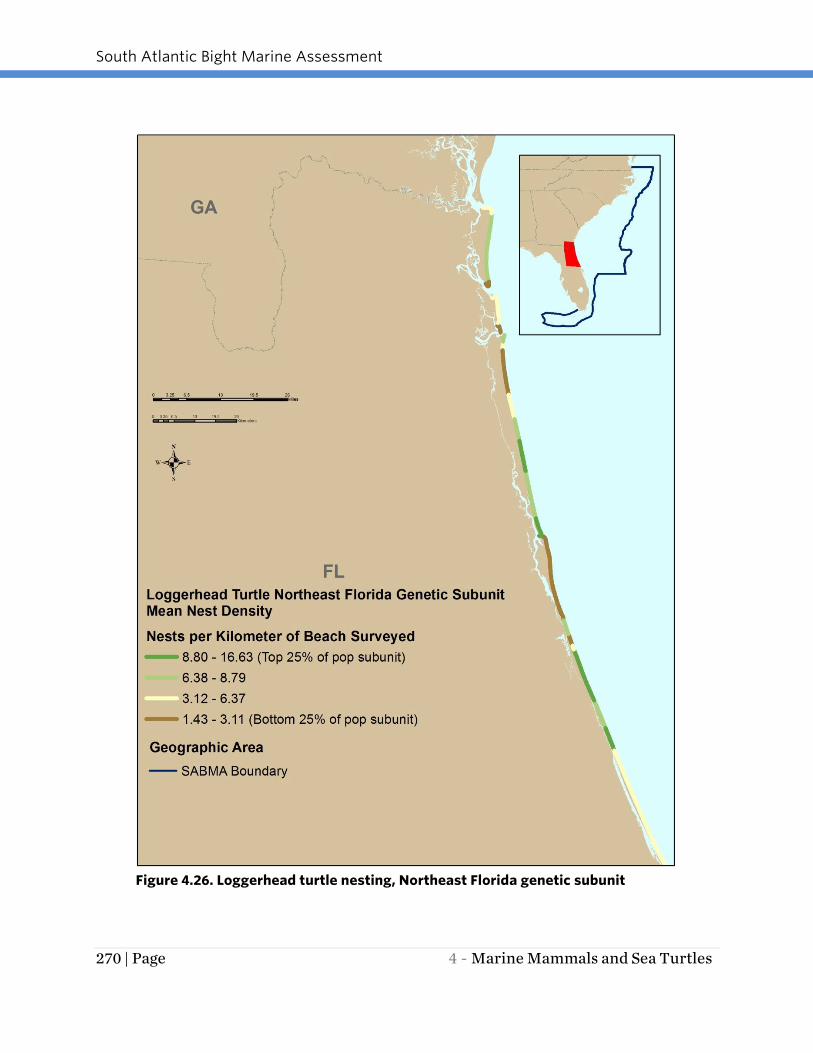
Nest densities can exhibit considerable interannual variation in the Northwest Atlantic
population (TEWG 2009) as well as among genetic subunits (FWC 2014b); however,
there are consistent nesting density patterns in specific regions (Figures 4.25 through
4.29). Nesting density was greatest in the South Florida subunit with values as high as
774 nests per km of beach surveyed (Figure 4.28). This was followed by the Central
East Florida subunit where the highest average density for the five-year period reached
336 nests per km (Figure 4.27). The Upper South Atlantic Bight and Dry Tortugas
genetic subunits had similar maximum nesting densities of 96 and 109 (Figures 4.25
and 4.29), respectively, per km of surveyed beach. The Northeast Florida genetic
subunit had the lowest mean nesting density per km of beach surveyed with a
maximum of 16 nests/km (Figure 4.26).
Within the Upper South Atlantic Bight genetic subunit, nesting densities were highest
in Georgia and South Carolina and lower further north in North Carolina and Virginia.
Within the North Florida genetic subunit, nesting densities were generally low with
higher nesting densities interspersed between lower nesting density areas. Highest
nesting densities within the East-Central Florida genetic subunit were found south of
Cape Canaveral with a second peak area on the north side of the cape. Peak nesting
densities within the South Florida genetic subunit were found in the northern portion of
this genetic subunit. Nesting dates ranged from May through September with peaks
during June and July.
GREEN TURTLE
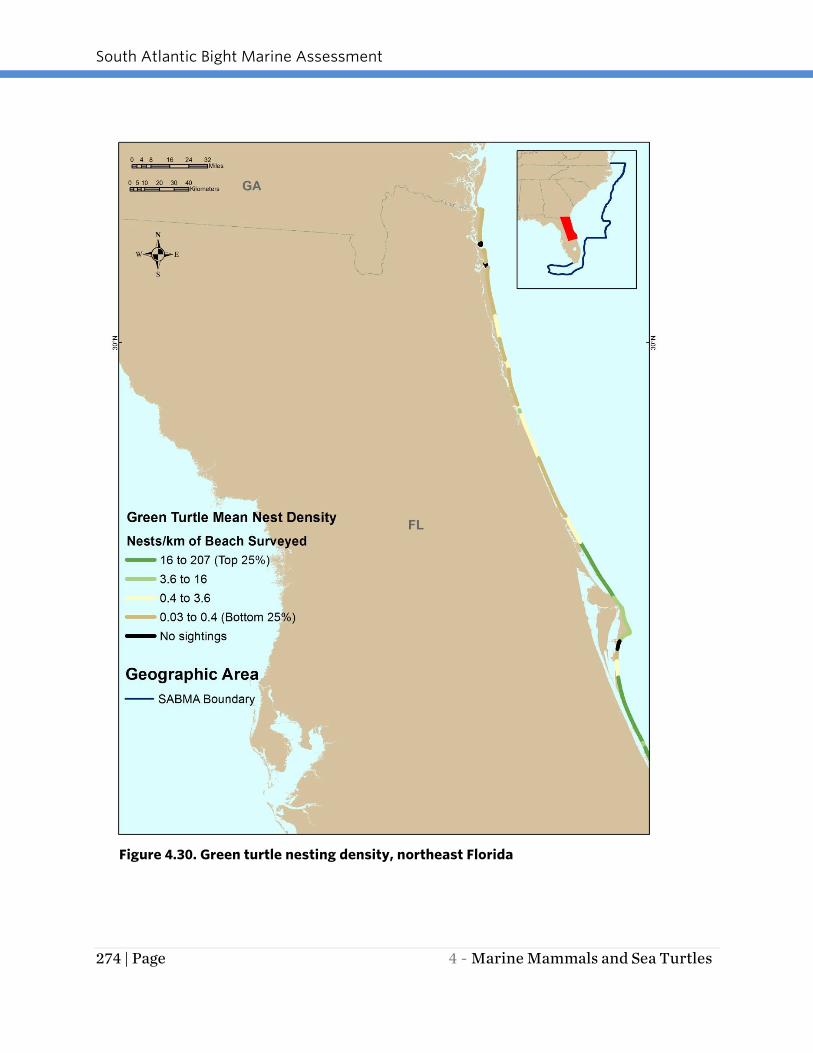
In the SAB region, an estimated 200 to 1,100 green turtles nest annually, primarily
along the central and southeast portions of the Florida coast (NOAA Fisheries 2014a)
with nesting extending as far south as the Dry Tortugas in the Florida Keys. Mean
nesting densities for the six year period of 2006-2011 along the beach segments
surveyed (Florida only) ranged from a high of 207 to a low of 0 nests per km of beach
surveyed. The assembled data identify the beaches from Brevard County, FL south to
Broward County, FL as major concentration areas for green sea turtle nesting (Figures
4.30 and 4.31). Although nesting survey data are unavailable north of Florida, green

South Atlantic Bight Marine Assessment
268 | Page 4 - Marine Mammals and Sea Turtles
turtles are known to nest in small numbers in Georgia, South Carolina, and North
Carolina (USFWS 2012).
LEATHERBACK TURTLE
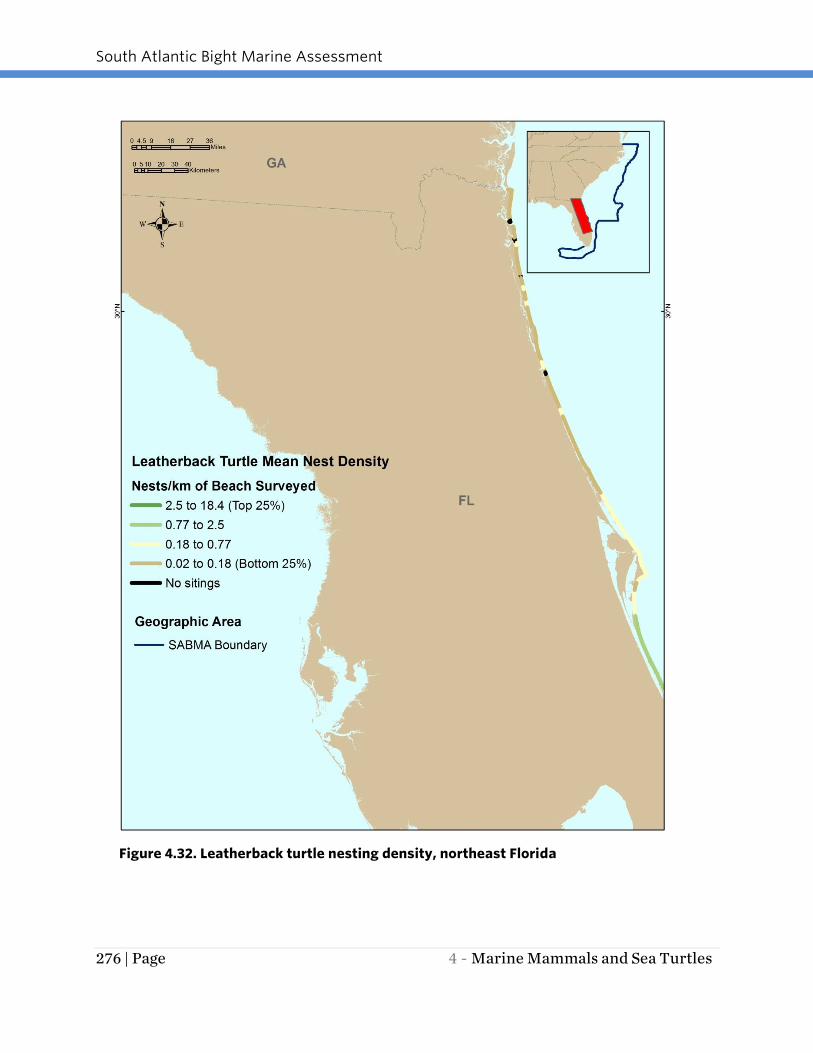
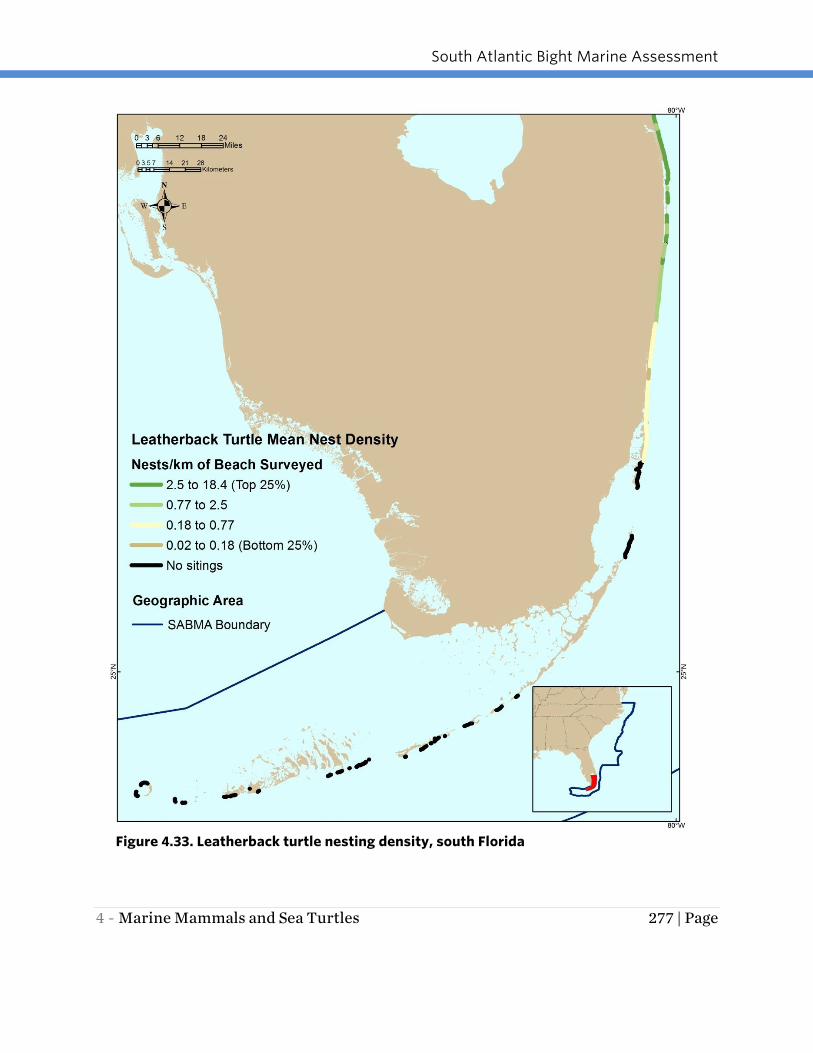
In the SAB region, leatherback turtles nest primarily along the central and southeast
portions of the Florida coast; nesting extends south to Key Biscayne (near Miami,
Florida) and north to where the St. John’s River flows into the ocean (near Jacksonville,
Florida). Mean nesting densities for 2006-2011 ranged from a high of 18 to a low of 0
nests per kilometer of beach surveyed. The assembled data identify Florida beaches in
Palm Beach, Martin and St. Lucie counties (Southeast Florida) as major concentration
areas for leatherback turtle nesting in the SAB region (Figures 4.32 and 4.33). Although
no survey dataset is available, leatherback turtles occasionally nest on Georgia, South
Carolina and North Carolina beaches (NMFS USFWS 1992; Dodd 2014).
HAWKSBILL TURTLE
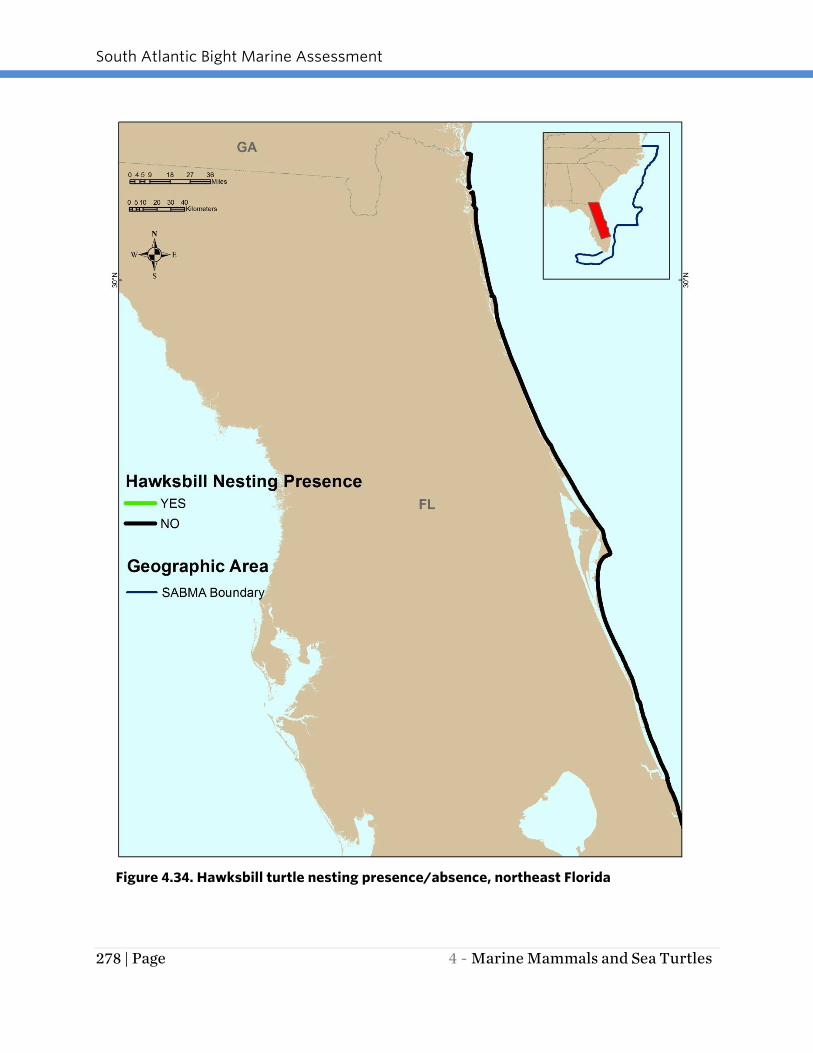
Only a few hawksbill turtle nests have been recorded in recent years (2006 – 2011) on
Florida index beaches (five beaches along Florida’s Central East Coast in Palm Beach
County and one in the Florida Keys in Monroe County) (FWC 2014b)). Due to the rarity
of nesting of this species in the SAB area, only presence and absence data are
presented in Figures 4.34 and 4.35.
KEMP’S RIDLEY TURTLE
Like the Hawksbill turtle, the Kemp’s ridley turtle rarely nests within the SABMA
Region. From 2006 to 2011, Kemp’s ridley turtles were only observed nesting at four
Florida index beaches -- two in southeast Florida, and one each in northeast and
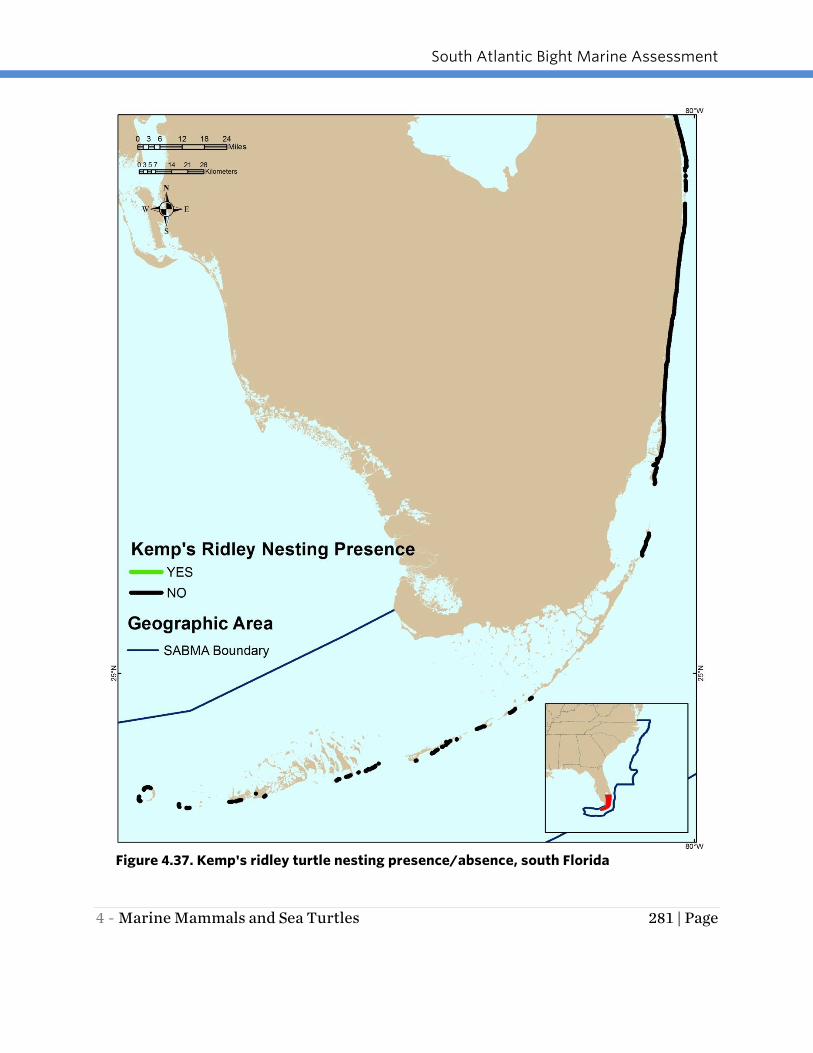
central-east Florida (FWC 2014b; Figures 4.36 and 4.37). There have been several nests
in VA and other states north of Florida in the last few years (Georgia Conservancy
2012; Hampton Roads 2012; Swingle pers. comm.).
South Atlantic Bight Marine Assessment
4 - Marine Mammals and Sea Turtles 269 | Page
Figure 4.25. Loggerhead turtle nesting density, Upper South Atlantic genetic
subunit
South Atlantic Bight Marine Assessment
270 | Page 4 - Marine Mammals and Sea Turtles
Figure 4.26. Loggerhead turtle nesting, Northeast Florida genetic subunit

South Atlantic Bight Marine Assessment
4 - Marine Mammals and Sea Turtles 271 | Page
Figure 4.27. Loggerhead turtle nesting density, east-central Florida genetic subunit
South Atlantic Bight Marine Assessment
272 | Page 4 - Marine Mammals and Sea Turtles
Figure 4.28. Loggerhead turtle nesting density, South Florida genetic subunit

South Atlantic Bight Marine Assessment
4 - Marine Mammals and Sea Turtles 273 | Page
Figure 4.29. Loggerhead turtle nesting, Dry Tortugas genetic subunit
South Atlantic Bight Marine Assessment
274 | Page 4 - Marine Mammals and Sea Turtles
Figure 4.30. Green turtle nesting density, northeast Florida

South Atlantic Bight Marine Assessment
4 - Marine Mammals and Sea Turtles 275 | Page
Figure 4.31. Green turtle nesting density, south Florida
South Atlantic Bight Marine Assessment
276 | Page 4 - Marine Mammals and Sea Turtles
Figure 4.32. Leatherback turtle nesting density, northeast Florida
South Atlantic Bight Marine Assessment
4 - Marine Mammals and Sea Turtles 277 | Page
Figure 4.33. Leatherback turtle nesting density, south Florida
South Atlantic Bight Marine Assessment
278 | Page 4 - Marine Mammals and Sea Turtles
Figure 4.34. Hawksbill turtle nesting presence/absence, northeast Florida

South Atlantic Bight Marine Assessment
4 - Marine Mammals and Sea Turtles 279 | Page
Figure 4.35. Hawksbill turtle nesting presence/absence, south Florida

South Atlantic Bight Marine Assessment
280 | Page 4 - Marine Mammals and Sea Turtles
Figure 4.36. Kemp's ridley turtle nesting presence/absence, northeast Florida
South Atlantic Bight Marine Assessment
4 - Marine Mammals and Sea Turtles 281 | Page
Figure 4.37. Kemp's ridley turtle nesting presence/absence, south Florida

South Atlantic Bight Marine Assessment
282 | Page 4 - Marine Mammals and Sea Turtles
Human Interactions and Other Threats
Marine Mammals Marine mammals are vulnerable to pressures caused by direct and indirect interactions
with humans. Threats to South Atlantic Bight marine mammal populations include
collisions with vessels; bycatch and entanglement in fishing gear; depletion of prey
resources; acoustic disturbance; exposure to aquatic contaminants; habitat
degradation; and climate and ecosystem change (Fertl and Leatherwood 1997; Reeves
et al. 2003; NOAA 2014b; O’Shea et al. 1985). As a result of these activities,
populations and individuals can have alterations in longevity, reduced fecundity and
changes in their migratory nature. The full effects of interactions in the study area are
not completely known. However, intensive research on the interactions between
cetaceans and humans is taking place (Clark et al. 2009; Hatch et al. 2008; Lightsey et
al. 2006, Scheifele and Darre 2005; SBNMS 2009; Wiley et al. 2003; Wiley et al. 2008).
Vessel Strikes
All large whale species in the region are vulnerable to vessel strikes, but the frequency
and location of those interactions are poorly understood. Ship strikes accounted for
53% of the resolved deaths in necropsied right whales (Campbell-Malone et al. 2008).
There is little evidence that right whales avoid vessels, and whales may even become
tolerant to vessel noise and ignore it (Nowacek et al. 2004). A higher frequency of
reports of interactions has occurred in recent years, but it is not yet clear to what
degree this is due to a greater number of possible observers.
Manatees in the study area are also vulnerable to vessel strikes, usually involving small
recreational watercraft in inland waters. A study of recovered dead manatees in Florida
between 1993 and 2003 found that watercraft strikes represented the largest percent
of identified cause of death at 24% (Lightsey et al. 2006).
Fishing Gear and Entanglement
Interaction between the fishing industry and cetaceans in United States waters has
been documented by federal monitoring programs. Entanglement is a documented
source of injury and death for a wide range of cetacean species, including endangered
large whales in the western North Atlantic (Johnson et al. 2005; Waring et al. 2009;
NMFS 2010a). A study of entangled right and humpback whales in the western North
Atlantic found that a wide range of gear types was involved, but the vast majority of
entanglements (89%) were attributed to pot and gill net gear (Johnson et al. 2005).
Small toothed whales, such as bottlenose dolphins, have been observed as bycatch in a
variety of fisheries, including those utilizing sink gillnets, bottom trawls, mid-water
trawls, and herring trawls (NMFS 2006b; ATGTRT 2007).
South Atlantic Bight Marine Assessment
4 - Marine Mammals and Sea Turtles 283 | Page
Anthropogenic Noise
The effect of human-generated noise on cetaceans remains a controversial and poorly
understood conservation issue (see review in Clark et al. 2007 and Parks and Clark
2007; Richardson et al. 1995; NRC 2003). Cetaceans are highly vocal and dependent on
sound for almost all aspects of their lives (e.g., food-finding, reproduction,
communication, detection of predators/hazards, and navigation), heightening
concerns regarding the impacts of human-induced noise (NRC 2003). Human-
generated sound in the sea comes from a variety of sources, including commercial ship
traffic, oil exploration and production, construction, acoustic research, sonar use and
other types of military activities. Sound in the ocean, particularly low frequency sound,
can propagate over large distances, thus both spatial and temporal scales of potential
impact can be large. A great deal of variation has been observed in noise responses by
both cetacean species and individuals of different genders, age classes, and among
individuals with different prior experiences with noise and in different behavioral states
(Southall et al. 2007).
Observed effects of noise on cetaceans include changes in vocalizations, respiration,
swim speed, diving, and foraging behavior; displacement; avoidance; shifts in
migration path; hearing damage; and strandings (Parks and Clark 2007). Responses of
cetaceans to noise can often be subtle, and there are many documented cases of
apparent tolerance of noise. However, marine mammals showing no obvious
avoidance or changes in activities may still suffer important consequences. Observed
reactions to noise in marine mammals could result in population- level impacts such as
decreased foraging efficiency, higher energetic demands, less group cohesion, higher
predation, and decreased reproduction (NRC 2005). Much research effort is currently
focused on assessing population consequences in better-known cetacean populations
that have been exposed to long-term human-induced noise (e.g., North Atlantic right
whales, Clark et al. 2009).
Contaminants and Marine Pollution
Cetaceans are exposed to many classes of marine contaminants such as
organochlorines, endocrine disruptors, and biotoxins from harmful algal blooms, but
the effects on these organisms are not fully known (Weisbrod et al. 2000). Mass
stranding events have been documented and connected to ingestion of contaminated
food sources. For example, in the winter of 1989, a mass stranding of humpback
whales in Cape Cod Bay, Massachusetts was linked to contamination of Atlantic
mackerel with saxitoxin produced by the microscopic marine alga Alexandrium spp.
(Geraci et al. 1989). Determination and tracking of the effects of these contaminants is
a rapidly evolving science (see review in Rolland et al. 2007). The size, free-swimming
nature, and endangered status of many cetaceans can make it difficult to collect the

South Atlantic Bight Marine Assessment
284 | Page 4 - Marine Mammals and Sea Turtles
type of non-lethal samples (e.g., blood and tissue) needed to diagnose diseases or
monitor physiological responses to these contaminants.
Climate Change
Adaptability of marine mammals to climate change is currently unknown for most
species. Studies have reported that species with limited ranges or dependence on sea
ice or that migrate to feeding grounds in polar regions, such as many of the baleen
whales, are most vulnerable (Learmonth et al. 2006; Simmonds and Isaac 2007). Other
species may largely be affected through changes in prey distribution and abundance,
with more mobile (or otherwise adaptable) species perhaps better able to respond to
climate change impacts. Based on an analysis of the impact climate change could have
on species ranges, Learmonth et al. (2006) hypothesized that the North Atlantic right
whale and northern bottlenose whale could potentially experience a range contraction
while the pygmy sperm whale, dwarf sperm whale, Gervais beaked whale, short-
beaked common dolphin and long-beaked common dolphin could experience a range
expansion.
Manatees could be affected by changes in the distribution and abundance of their
primary food source, seagrass. With rising average temperature, seagrass meadows
could deteriorate due to increases in harmful algal blooms (HABs) such as red tides.
HABs can also be lethal to manatees. Seagrasses could eventually move into newly
submerged areas, but this will take time and is uncertain. Manatees may also become
more susceptible to vessel strikes as their range expands northward into areas without
speed zone restrictions or an awareness of the habits of these slow-moving animals. In
addition, their sources of freshwater could be compromised as a result of saltwater
intrusion (Edwards 2013; Tripp 2014).
Sea Turtles The five sea turtle species found in the South Atlantic Bight can all be negatively
affected by interaction with human activities. Some common threats include fishing
gear bycatch and entanglement; loss of critical habitat, particularly nesting beaches;
and direct harvest. The relative impacts of these activities on sea turtle populations in
the SABMA region vary by species, as discussed below.
Fishing Gear and Entanglement
Many turtle species and life stages are vulnerable to bycatch and entanglement in
fishing gear. Comprehensive threat assessments for the Northwest Atlantic population
of loggerheads conclude that a principal threat in the Northwest Atlantic is fisheries
bycatch, specifically, in the bottom trawl, demersal longline, demersal large mesh
gillnet, and pelagic longline fisheries. The Loggerhead Sea Turtle 2009 Status Review
also identified mid-water trawl, dredge and pot/trap fisheries as threats. Total
South Atlantic Bight Marine Assessment
4 - Marine Mammals and Sea Turtles 285 | Page
mortality from fisheries was not estimated, but is assumed to be significant.
Entanglement in derelict fishing gear was also identified as a source of mortality for
this species (Conant et al. 2009; NMFS USFWS 2008).
In U.S. waters, the pelagic longline and shrimp trawl fisheries have been identified as
the largest documented source of leatherback mortality (NMFS 2001). Alternative
methods and gear innovations (e.g., circle vs. J hooks; bait switching, TEDs) have
reduced bycatch levels in recent years (NMFS USFWS 2007b). Fixed fishing gear (e.g.,
gill nets, pot/trap buoy lines, pound nets) is problematic in coastal foraging grounds
(James et al. 2005) and in close proximity to nesting areas.
Various assessments also identify bycatch and entanglement as serious threats to
green sea turtles (Seminoff 2004), leatherbacks (Wallace et al. 2011 as reported in
Tiwari et al. 2013), hawksbill turtles, and Kemp’s ridleys. The greatest threat to the
Kemp's ridley turtle has been unintentional bycatch in fishing gear, primarily in shrimp
trawls, but also in gill nets, longlines, traps and pots, and dredges in the Gulf of Mexico
and North Atlantic including the SAB region.
Harvest
Sea turtles are harvested legally and illegally in many places in the world. The greatest
current threat to green sea turtles is the global legal and illegal harvest of eggs,
juveniles, and adults from both terrestrial nesting beaches and neritic foraging areas.
Of particular concern to the recovery of this slow-to-mature species is the harvest of
juveniles in the Caribbean Sea, Southeast Asia, Eastern Pacific, and Western Indian
Ocean (NMFS USFWS 2007a). For loggerheads, legal harvest of neritic juveniles and
adults (in the Caribbean) results in estimated mortality similar to demersal longline
and gillnets (Conant et al. 2009; NMFS USFWS 2008). Human consumption of eggs,
meat, or other products was found to be the second highest source of mortality for
leatherbacks (Wallace et al. 2011 as reported in Tiwari et al. 2013). At one time egg
collection was an extreme threat to the Kemp’s ridley turtle, but protection efforts in
place in the U.S. since 1966 have reduced this threat (NOAA Fisheries 2014b). Harvest
of eggs and meat of the hawksbill is also a threat.
Habitat Degradation
Habitat degradation, particularly of nesting habitats, is a serious issue for all turtle
species. For green turtles, habitat degradation of nesting areas in the form of beach
replenishment and armoring, coastal development, and sand removal have been
identified as key threats during terrestrial life stages (Lutcavage et al. 1997). Light
pollution at nesting beaches results in disorientation of emerging hatchlings and

South Atlantic Bight Marine Assessment
286 | Page 4 - Marine Mammals and Sea Turtles
decreased nesting success. Declines in suitable coastal estuary habitat for green
turtles are also widespread throughout their range including the larger systems along
the western Atlantic coast (NMFS USFWS 2007a).
Degradation of nesting habitats has also been cited as a threat for loggerheads (Conant
et al. 2009; NMFS USFWS 2008), leatherbacks (Wallace et al. 2011 as reported in
Tiwari et al. 2013; NMFS USFWS 2007b), and hawksbills. Modifications from beach
replenishment projects and armoring, erosion of active nesting beaches due to climatic
events, light pollution on nesting beaches, predation by native and non-native species,
accumulation of wood and marine debris (reducing access to the sand) are listed as
specific impacts. Many of these impacts can alter habitat indirectly by modifying
thermal profile and advancing erosion. Currently, many of the globally significant
nesting areas for the leatherback turtle remain remote and are not as subject to these
types of activities.
Marine Pollution
Marine pollution, including oil pollution from spills, is a threat to all sea turtle species in
the study area. For example, important secondary sources of mortality identified by the
Recovery Plan for loggerheads include general marine pollution and, more specifically,
oil pollution (Conant et al. 2009; NMFS USFWS 2008). For green sea turtles,
degradation of estuarine water quality due to development-related increases in
effluent and contaminant loading (PCBs, heavy metals) has been linked to adverse
impacts including recent increases in disease (e.g., Fibropapilloma, which results in
internal and external tumors) (George 1997). Red tide events in coastal feeding areas
have been linked to increased mortality in juveniles and adults (NMFS USFWS 2007a).
Oil spills have been of secondary concern for hawksbills, but not so for the Kemp’s
ridley turtle which has experienced dramatic declines in nesting activity at their
primary nesting beaches on the Gulf Coast of Mexico following the Deepwater Horizon
BP oil spill in the Gulf, the first declines in more than 20 years (Dodd 2014).
Marine Debris
Sea turtles famously can ingest floating plastic bags, thinking they are jellyfish.
Ingestion of marine debris is a threat to most sea turtle species. Entanglement in
derelict fishing gear and ingestion of marine debris have been cited as sources of
mortality for loggerhead, leatherback and hawksbill turtles, but these threats are likely
to affect other species as well.
Vessel Strikes
Turtles resting at the surface are susceptible to vessel strikes. For loggerheads, vessel
strikes (propeller and collisions) were identified as a large mortality source for neritic
South Atlantic Bight Marine Assessment
4 - Marine Mammals and Sea Turtles 287 | Page
juveniles and adults (Conant et al. 2009). In Florida, boat strikes have been singled out
as a large source of injury and mortality for green sea turtles (Singel et al. 2003).
Other Sources
One additional significant threat for hawksbills is the tortoiseshell trade, which
threatens hawksbill populations globally (Mortimer and Donnelly 2008). Other threats
to hawksbills include hybridization with other species (where population size is
particularly low). Resource limitation in the eastern Pacific during cyclical climatic
events (El Niño Southern Oscillation) has been linked to decreased reproductive
success and increased vulnerability to anthropogenic mortality (NMFS USFWS 2007b).
This is not currently the case in the Northwest Atlantic Ocean; however, future climatic
changes may alter oceanic currents that influence prey availability and subsequent
reproductive capacity. Increased temperatures at nesting sites have been linked to
changes in hatchling sex ratios on some beaches (NMFS USFWS 2007b).
Management and Conservation
Marine Mammals
Regulatory Authorities
The species selected for this assessment are federally protected under the Marine
Mammal Protection Act (MMPA). The MMPA prohibits, with certain exceptions, the
“take” of marine mammals in United States waters and by U.S. citizens on the high
seas, and the importation of marine mammals and marine mammal products into the
United States (NOAA 2007). The Endangered Species Act (ESA) lists the Florida
manatee and fin, humpback, sei, sperm, and North Atlantic right whales as
endangered. This designation prohibits “take” of these species; requires the
development and implementation of species recovery plans; and mandates, where
appropriate, designation of critical habitat. Where these species are found within
National Marine Sanctuaries, they are also protected under the United States National
Marine Sanctuaries Act. At the state level, the Florida manatee is also protected by the
Florida Manatee Sanctuary Act (§379.2431(2), Florida Statutes).
Current Conservation Efforts
Many ongoing cooperative conservation efforts focus on marine mammals, including
those conducted by federal, international, and state agencies, academic institutions,
and non-profit organizations. One of the first international protections for whales was
the First International Convention for the Regulation of Whaling in 1935 which

South Atlantic Bight Marine Assessment
288 | Page 4 - Marine Mammals and Sea Turtles
specifically targeted right whales. Their protected status has been continued by the
International Whaling Commission since its founding in 1946 (Donovan 1991).
As noted above, NMFS is required to develop and implement recovery plans for whale
species listed as endangered in the U.S. Final recovery plans have been published and
are being implemented for most of the large whale species included in this study,
including the North Atlantic right, fin, humpback and sperm whales (NMFS 1991 2005,
2010b, 2010c). The plans call for improving knowledge of stock sizes, habitats, and
migration patterns; better understanding the impact that threats have on the stocks;
and reducing known threats. The North Atlantic right whale recovery plan takes the
most comprehensive approach to reducing threats due to the highly vulnerable nature
of this population of whales. The recovery plan includes a number of actions to reduce
ship collisions (e.g., mandatory vessel speed restrictions and ship reporting systems),
entanglement in fishing gear, fisheries bycatch, exposure to contaminants and
excessive noise and harassment by whale watching operations (NMFS 2005). Critical
habitat has been designated for the North Atlantic right whale, including off the
southern coast of Georgia and northern coast of Florida (NMFS 1994). Changes to the
critical habitat area were proposed by NMFS in 2015 and are currently under review.
The other recovery plans recommend actions to maintain and enhance historical and
current known habitats, identify and reduce human related injury and mortality,
research population structure, improve administration and coordination, and maximize
efforts to obtain scientific information from stranded or entangled individuals (NMFS
1991, 2010b, 2010c, 2011).
Under Section 118 of the Marine Mammal Protection Act, NMFS has developed and
implemented several take reduction plans (TRPs) to reduce injury and death of certain
marine mammals vulnerable to commercial fishing activities. TRPs typically include
both regulatory and non-regulatory measures. The four operating in the SABMA study
area include the Large Whale TRP, Bottlenose Dolphin TRP, Pelagic Longline TRP and
Harbor Porpoise TRP. Following are examples related specifically to the South Atlantic
Bight region:
- Large Whale TRP: Focused on the critically endangered North Atlantic right
whale, the Large Whale TRP also takes into consideration humpback, fin, and
minke whales. The TRP consists of regulatory and non- regulatory measures
related to commercial gillnet and trap/pot fisheries, including broad-based gear
modifications, time/area closures, and extensive outreach efforts (NOAA 2010).
South Atlantic Bight Marine Assessment
4 - Marine Mammals and Sea Turtles 289 | Page
- Pelagic Longline TRP: Focused on reducing incidental mortality and serious injury
of pilot whales and Risso’s dolphins in the Atlantic pelagic longline fishery, the
TRP created the Cape Hatteras Special Research Area (CHSRA). Requirements
for operating in the CHSRA include specific observer and research participation
for fishermen operating in the area year-round (NOAA 2009).
To reduce manatee injury and mortality caused by watercraft collisions, the FWC, US
FWS and some local governments have established seasonal and year-round manatee
protection areas. Most of these zones require slower vessel speeds but some restrict
vessel access into manatee congregation areas (e.g., winter warm water refugia).
Slowing vessel speeds provides greater reaction time for the vessel operator and
manatee and reduces the severity of injuries to the manatee if hit by the vessel
(Calleson and Frohlich 2007).
There are no recovery or management plans that address the common dolphin, beaked
whales, dwarf and pygmy sperm whales or spotted dolphins as they are not listed as
endangered or threatened under the Endangered Species Act and are not subject to
high fisheries-related mortality in the SABMA study area.
South Atlantic Bight Marine Assessment
290 | Page 4 - Marine Mammals and Sea Turtles
Box 4.4. It Takes a Village: Organizations Involved in Marine Mammal Research and
Conservation
Sea Turtles
Regulatory Authorities
All life stages of the five turtle species included in this analysis are currently protected
on U.S. nesting beaches and in U.S. waters by the Endangered Species Act. NMFS and
USFWS jointly manage all three species; USFWS has lead jurisdiction on nesting
beaches while NMFS has lead jurisdiction for marine waters.
Research and conservation needs are great for most marine mammal species in the
SABMA study area (and beyond). To try to address these needs, a wide range of
government agencies, academic institutions and non-profit organizations are
actively involved in cetacean research and/or conservation in the region.
U.S. East Coast colleges and universities at which there are research programs
studying many aspects of cetacean biology, genetics, and distribution include (but
are not limited to) Coastal Carolina University, College of Charleston, Duke
University, and University of North Carolina at Wilmington.
Non-profit organizations involved in study area cetacean research or conservation
include the American Cetacean Society, American Society for Mammalogy,
Cetacean Society International, Ecological Society of America, Georgia Aquarium,
Georgia Environmental Policy Institute, Harbor Branch Oceanographic Institution,
Hubbs-Sea World, International Fund For Animal Welfare, Marine Mammal
Commission, North Atlantic Right Whale Consortium, North Carolina Sea Grant,
Ocean Conservancy, Society for Conservation Biology, Society for Marine
Mammalogy, South Carolina Marine Mammal Stranding Network, The Humane
Society of the United States, The Marine Mammal Center, Virginia Aquarium &
Marine Science Center, Whale and Dolphin Conservation Society, WhaleNet and
World Wildlife Fund.
State and federal agencies engaged in study area marine mammal research and
conservation activities include the Florida Fish and Wildlife Conservation
Commission/Fish and Wildlife Research Institute, Georgia Department of Natural
Resources/Coastal Nongame and Endangered Wildlife Program and the Office of
Naval Research Marine Mammal Program, NOAA Fisheries Services/Office of
Protected Resources.
South Atlantic Bight Marine Assessment
4 - Marine Mammals and Sea Turtles 291 | Page
Current Conservation Efforts
Global conservation efforts for the five species included in this analysis are principally
comprised of international conventions and treaties. The United States is one of 12
signatory nations on the only international treaty dedicated solely to sea turtles: Inter-
American Convention for the Protection and Conservation of Sea Turtles. One of the
most significant conservation efforts to date for sea turtle species is the United States
embargo (November 21, 1989) on shrimp harvested with commercial gear that may
adversely impact sea turtles (Public Law 101-162, Section 609 (16 U.C.S. 12537)).
Under authority of the ESA and the Magnuson-Stevens Fishery Conservation and
Management Act, NMFS has initiated a series of regulations designed to reduce
adverse impacts to sea turtles including requiring use of turtle excluder devices (TEDs)
and circle hooks, gillnet closures, and pound net modifications. In 2003, NMFS initiated
a program, the Strategy for Sea Turtle Conservation and Recovery in Relation to
Atlantic and Gulf of Mexico Fisheries, to identify strategies to reduce bycatch across
jurisdictional boundaries for priority gear types on a per-gear basis (instead of by
individual fishery) for the Atlantic and Gulf of Mexico (NOAA Fisheries 2003). There
are currently NMFS/USFWS Recovery Plans for U.S. populations in the Atlantic
(October 29, 1991), Pacific (January 12, 1998), and Eastern Pacific (January 12, 1998)
for green sea turtles, and for U.S. Caribbean, Atlantic, and Gulf of Mexico (April 6,
1992) and the U.S. Pacific (January 12, 1998) populations for loggerheads. Five year
reviews of these Recovery Plans occurred in 1991 (56 FR 56882) and 2007 (70 FR
20734).
Please cite as:
Geselbracht, L., R. Newton, and J. Greene. 2017. Marine Mammals and Sea Turtles of
the South Atlantic Bight Marine Region in Conley, M.F., M.G. Anderson, N. Steinberg,
and A. Barnett, eds. 2017. The South Atlantic Bight Marine Assessment: Species,
Habitats and Ecosystems. The Nature Conservancy, Eastern Conservation Science.
http://nature.ly/marineSAtlanticBightERA
South Atlantic Bight Marine Assessment
292 | Page 4 - Marine Mammals and Sea Turtles
Literature Cited
Archer, F.I. 2002. Striped dolphin (Stenella coeruleoalba). In: Perrin, W. F., B. Würsig,
and J. G. M Thewissen, eds. Encyclopedia of Marine Mammals. Academic Press. pp.
1201-1203.
ATGTRT (Atlantic Trawl Gear Take Reduction Team). 2007. Atlantic trawl gear take
reduction team meeting: Final summary.
http://www.nero.noaa.gov/prot_res/atgtrp/meeting/ATGTRT%20Meeting%20Summ
ary%20-%20April%202007%20FINAL.pdf.
Baldwin, R., G. R. Hughes, and R.I.T. Prince. 2003. Loggerhead turtles in the Indian
Ocean. Pages 218-232 in Bolten, A.B. and B.E. Witherington (eds.). Loggerhead Sea
Turtles. Smithsonian Books, Washington D.C.
Bjorndal, K.A. 1997. Foraging ecology and nutrition of sea turtles. Pages 199-231 in
Lutz, P.L. and J.A.
Bjorndal, K.A. 2003. Roles of loggerhead sea turtles in marine ecosystems. Pages 235-
254 in Bolten, A.B. and B.E. Witherington (eds.). Loggerhead Sea Turtles. Smithsonian
Books. Washington, D.C.
Bjorndal, K.A. and J.B.C. Jackson. 2003. Roles of Sea Turtles in Marine Ecosystems:
Reconstructing the Past, In Lutz PL, JA Musick, Jeanette Wyneken (eds.) The biology of
sea turtles. CRC Press, Boca Raton, Florida.
Bowen, W.D. 1997. Role of marine mammals in aquatic ecosystems. Marine Ecology
Progress Series. 158: 267–274.
Braun-McNeill, J. and Epperly, S.P. 2002. Spatial and temporal distribution of sea turtles
in the western North Atlantic and the U.S. Gulf of Mexico from Marine Recreational
Fishery Statistics Survey (MRFSS). Marine Fisheries Review 64 (4): 50-56.
Braun-McNeill, J., C.R. Sasso, S.P. Epperly, and C. Rivero, C.2008. Feasibility of using sea
surface temperature imagery to mitigate cheloniid sea turtle-fishery interactions off
the coast of northeastern USA. Endangered Species Research, 5: 257-266, plus
Appendix.
Caldwell, M.J. 2001. Social and genetic structure of bottlenose dolphin (Tursiops
truncatus) in Jacksonville, Florida. PhD dissertation, University of Miami, Coral Gables,
Florida, p 143.
South Atlantic Bight Marine Assessment
4 – Marine Mammals and Sea Turtles 293 | Page
Calleson, C.S. and R.K. Frohlich. 2007. Slower boat speeds reduce risks to manatees.
Endang. Species Res. Vol. 3: 295–304.
Campbell-Malone, R., S.G. Barco, P-Y. Daoust, A. R. Knowlton, W.A. McLellan, D.S.
Rotstein, and M.J. Moore. 2008. Gross and histologic evidence of sharp and blunt
trauma in North Atlantic right whales (Eubalaena glacialis) killed by vessels. Journal of
Zoo Wildlife Medicine. 39(1): 37–55.
Carr, A.F. 1986. RIPS, FADS, and little loggerheads. Bioscience 36(2):92-100.
CITES (Convention on International Trade in Endangered Species of Wild Fauna and
Flora). Signed at Washington, D.C., on 3 March 1973. Amended at Bonn, on 22 June
1979. Appendix I.
Clapham, P.J. and J.G. Mead. 1999. Megaptera novaeangliae. Mammal Species. 604: 1-
9.
Clark, C. W., D. Gillespie, P. Nowacek, and S.E. Parks. 2007. Listening to Their World:
Acoustics for Monitoring and Protecting Right Whales in an Urbanized Ocean. In: S.D.
Kraus and R.M. Rolland, eds. The Urban Whale: North Atlantic right whales at the
crossroads. Harvard University Press, Cambridge, MA. pp 333-357.
Clark C.W., W.T. Ellison, B.L. Southall, L.T. Hatch, S.M. Van Parijs, A. Frankel, and D.
Ponirakis. 2009. Acoustic masking in marine ecosystems: intuitions, analysis, and
implication. Marine Ecology Progress Series 395: 210-222.
Conant, T.A., P.H. Dutton, T. Eguchi, S.P. Epperly, C.C. Fahy, M.H. Godfrey, S.L.
MacPherson, E.E. Possardt, B.A. Schroeder, J.A. Seminoff, M.L. Snover, C.M. Upite, and
B.E. Witherington. 2009. Loggerhead sea turtle (Caretta caretta) 2009 status review
under the U.S. Endangered Species Act. Report of the Loggerhead Biological Review
Team to the National Marine Fisheries Service, August 2009. 222 pages.
Department of Navy. 2008. Marine Resource Assessment Update for the
Charleston/Jacksonville Operating Area. Naval Facilities Engineering Command,
Atlantic; Norfolk, Virginia. Contract Number N62470-02-D-9997, Task Order 0056.
Prepared by Geo-Marine, Inc., Hampton, Virginia.
Deutsch C.J., J.P. Reid, R.K. Bonde, D.E. Easton, H.I. Kochman, and T.J. O'Shea. 2003.
Seasonal movements, migratory behavior, and site fidelity of West Indian manatees
along the Atlantic coast of the United States. Wildlife monographs, vol. 151, pp. 1-77.
South Atlantic Bight Marine Assessment
294 | Page 4 - Marine Mammals and Sea Turtles
Dodd, M. 2014. Personal communication. Wildlife Resources Division, Georgia
Department of Natural Resources.
Dodge, K.L., J.M. Logan, and M.E. Lutcavage. 2011. Foraging ecology of leatherback sea
turtles in the western North Atlantic determined through multi-tissue stable isotope
analyses. Marine Biology 158:2813-2824
Donovan, G.P. 1991. A review of IWC stock boundaries. Report to the International
Whaling Commission, Special Issue. 13:39-68.
Duffield, D.A. 1986. Investigation of genetic variability in stocks of the bottlenose
dolphin (Tursiops truncatus). Final report to the NMFS/SEFSC, Contract No. NA83-GA-
00036, 53 pp.
Duffield, D.A., S.H. Ridgway, and L.H. Cornell. 1983. Hematology distinguishes coastal
and offshore forms of dolphins (Tursiops). Canadian Journal of Zoology 61(4): 930-933.
Eckert, K.L., B.P. Wallace, J.G. Frazier, S.A. Eckert, and P.C.H. Pritchard. 2012. Synopsis
of the biological data on the leatherback sea turtle (Dermochelys coriacea). U.S.
Department of Interior, Fish and Wildlife Service, Biological Technical Publication BTP-
R4015-2012, Washington, D.C.
Edwards, H.H. 2013. Potential impacts of climate change on warm water megafauna:
the Florida manatee example (Trichechus manatus latirostris). Climatic Change:
121:727–738.
Fertl, D. and S. Leatherwood. 1997. Cetacean Interactions with Trawls: A Preliminary
Review. J. Northw. Atl. Fish. Sci., Vol. 22: 219–248.
Fertl, D., A.J. Schiro, G.T. Regan, C.A. Beck, N. Adimey, L. Price-May, A. Amos, G.A.J.
Worthy, and R. Crossland. 2005. Manatee occurrence in the Northern Gulf of Mexico,
west of Florida. Gulf and Caribbean Research 17:69-74.
Firestone, J., S.B. Lyons, C. Wang, and J.J. Corbett. 2008. Statistical modeling of North
Atlantic right whale migration along the mid-Atlantic region of the eastern seaboard of
the United States. Biological Conservation, Volume 141, Issue 1, Pages 221–232
Flinn, R.D., A.W. Trites, and E.J. Gregr. 2002. Diets of fin, sei, and sperm whales in
British Columbia: An analysis of commercial whaling records, 1963-1967. Marine
Mammal Science. 18(3): 663-679.

South Atlantic Bight Marine Assessment
4 – Marine Mammals and Sea Turtles 295 | Page
FWC, FWRI (Florida Fish and Wildlife Conservation Commission, Fish and Wildlife
Research Institute) 2014a.Florida Manatee, http://myfwc.com/research/manatee,
viewed on March 19, 2014.
FWC, FWRI (Florida Fish and Wildlife Conservation Commission, Fish and Wildlife
Research Institute). 2014b. Index Nesting Beach Survey Totals (1989-2013),
http://myfwc.com/research/wildlife/sea-turtles/nesting/beach-survey-totals/,
viewed on August 17, 2014 and July 16, 2015.
FWC, FWRI (Florida Fish and Wildlife Conservation Commission, Fish and Wildlife
Research Institute). 2014c. Trends in Nesting by Florida Loggerheads,
http://myfwc.com/research/wildlife/sea-turtles/nesting/loggerhead-trend/, viewed
on August 15, 2014.
Fossette, S., Y.J. Hobson, C. Girard, B. Calmettes, P. Gaspar, J-Y. Georges, and G.C.
Hays.2010. Spatio-temporal foraging patterns of a giant zooplanktivore, the
leatherback turtle. Journal of Marine Systems 81:225-234.
Garrison, L.P. 2007. Defining the North Atlantic Right Whale Calving Habitat in the
Southeastern United States: An Application of a Habitat Model. NOAA Technical
Memorandum NOAA NMFS-SEFSC-553: 66 p.
George, R.H. 1997. Health problems and diseases of sea turtles. Pages 363-409 in Lutz,
P.L. and J.A. Musick (eds.). The Biology of Sea Turtles. CRC Press, Boca Raton, Florida.
Georgia Conservancy. 2012. An Update of the 2012 Sea Turtle Nesting Season on the
Georgia Coast. Source URL retrieved12-2-2014,
http://www.georgiaconservancy.org/turtle-tales.html.
Geraci, J.R., D.M. Anderson, R.J. Timperi, D.J. St. Aubin, G.A. Early, J.H. Prescott, and
C.A. Mayo. 1989. Humpback whales (Megaptera novaeangliae) fatally poisoned by
dinoflagellate toxin. Canadian Journal of Fisheries and Aquatic Sciences. 46: 1895-1898.
Greene, J.K., M.G. Anderson, J. Odell, and N. Steinberg, eds. 2010. The Northwest
Atlantic Marine Ecoregional Assessment: Species, Habitats and Ecosystems. Phase
One. The Nature Conservancy, Eastern U.S. Division, Boston, MA.
Gubbins C. 2002. Use of home ranges by resident bottlenose dolphins (Tursiops
truncatus) in a South Carolina estuary. Journal of Mammal Research 83:178–187
Hampton Roads. 2012. High numbers of sea turtles nest in Virginia, N.C. Source URL
retrieved 8-2-2013.

South Atlantic Bight Marine Assessment
296 | Page 4 - Marine Mammals and Sea Turtles
Hatch, L.T., C. W. Clark, R. Merrick, S. M. Van Parijs, D. Ponirakis, K. Schwehr, M.
Thompson, and D. Wiley. 2008. Characterizing the relative contributions of large
vessels to total ocean noise fields: a case study using the Gerry E. Studds Stellwagen
Bank National Marine Sanctuary. Environmental Management. 42:735–752.
Haubold, E., C. Deutsch, C. Fonnesbeck. 2006. Final biological status review of the
Florida manatee (Trichechus manatus latirostris). Florida Fish and Wildlife Conservation
Commission, Fish and Wildlife Research Institute, St. Petersburg, Florida.
Haug, T., H. Gjøsæter, U. Lindstrøm, and K. Nilssen. 1995. Diet and food availability for
northeast Atlantic minke whales (Balaenoptera acutorostrata) during the summer of
1992. ICES Journal of Marine Science. 52: 77-86.
Heithaus, M. 2001. Predator-prey and competitive interactions between sharks (order
Selachii) and dolphins (suborder Odontoceti): a review. Journal of Zoology. 253(1): 53-
68.
Hill, M. 1998. Spongivory on Caribbean reefs releases corals from competition with
sponges. Oecologia, Volume 117, Issue 1-2, pp 143-150.
Horwood, J.W. 2002. Sei Whale (Balaenoptera borealis). In: Perrin, W. F., B. Würsig, and
J. G. M Thewissen, eds. Encyclopedia of Marine Mammals. Academic Press. pp.1069-
1071.
Irvine, B.A., M.D. Scott, R.S. Wells and J.H. Kaufmann. 1981. Movements and activities
of the Atlantic bottlenose dolphin, Tursiops truncates, near Sarasota, Florida. Fishery
Bulletin Vol. 79 (4).
IUCN (International Union of Concerned Scientists). 2014. The IUCN Red List of
Threatened Species. Version 2014.2. <www.iucnredlist.org>. Downloaded on 08
August 2014.
IWC (International Whaling Commission). 1986. Report of the workshop on the status
of right whales. Rep. Int. Whal. Comm. (Special issue) 10: 1-33.
James, M.C., C.A. Ottensmeyer, and R.A. Myers. 2005. Identification of high-use
habitat and threats to leatherback sea turtles in northern waters: new directions for
conservation. Ecology Letters. 8:195-201.
South Atlantic Bight Marine Assessment
4 – Marine Mammals and Sea Turtles 297 | Page
Johnson, A., G. Salvador, J. Kenney, J. Robbins, S. D. Kraus, S. Landry, and P. Clapham.
2005. Fishing gear involved in entanglements of right and humpback whales. Marine
Mammal Science. 21(4): 635-645.
Jones, T.T., and J.A. Seminoff. 2013. Feeding biology: advances from field observations,
physiological studies, and molecular techniques. Pages 211-247 in Wyneken, J., K.J.
Lohmann, and J.A. Musick (editors) The Biology of Sea Turtles Volume III. CRC Press.
Boca Raton, FL.
Jonsgård, A. 1966. The distribution of Balaenopteridae in the North Atlantic Ocean. Pp.
114-124 in K.S. Norris (ed.), Whales, dolphins, and porpoises. Univ. of California Press,
Berkeley.
Katona S. and H. Whitehead. 1988. Are Cetacea ecologically important? Oceanography
and Marine Biology: An Annual Review 26:553-568.
Kawamura, A. 1982. Food habits and prey distributions of three rorqual species in the
North Pacific Ocean. Scientific Report to the Whale Research Institute. Tokyo, Japan.
34:59-91.
Kenney, R.D. 2002. North Atlantic, North Pacific, and southern right whales (Eubalaena
glacialis, E. japonica, and E. australis). In: Perrin, W. F., B. Wursig, and J. G. M
Thewissen, eds. Encyclopedia of Marine Mammals. Academic Press. pp. 806-813.
Kenney, R.D., M.A. M. Hyman, and H. E. Winn. 1985. Calculation of standing stocks and
energetic requirements of the cetaceans of the northeast United States outer
continental shelf. NOA A Tech. Memo. NMFS-F/NEC-41, National Marine Fisheries
Service, Woods Hole, MA. 39 pp.
Kenney, R.D. and H.E. Winn. 1986. Cetacean high-use habitats of the northeast United
States continental shelf. Fishery Bulletin. 84: 345-357.
Kenney, R.D., H.E. Winn, and M.C. Macaulay. 1995. Cetaceans in the Great South
Channel, 1979–1989: right whale (Eubalaena glacialis). Continental Shelf Research.
15(4-5): 385-414.
Kraus, S.D., J.H. Prescott, A.R. Knowlton, and G.S. Stone. 1986. Migration and calving of
right whales (Eubalaena glacialis) in the western North Atlantic. Rep. Int. Whal. Comm.
(Special issue) 10: 139-151.
Kraus, S.D., M.J. Crone, and A.R. Knowlton. 1988. The North Atlantic right whale. In:
Audubon Wildlife Report 1988/1989. W. J. Chandler, ed. New York: Academic Press.
South Atlantic Bight Marine Assessment
298 | Page 4 - Marine Mammals and Sea Turtles
Learmonth J.A., C.D. Macleod, M.B. Santos, G.J. Pierce, H.Q.P. Crick, R.A. Robinson.
2006. Potential effects of climate change on marine mammals, In R.N. Gibson, J.A.
Atkinson and J.D.M. Gordon. Oceanography and Marine Biology: An Annual Review.
Taylor and Francis.
Leatherwood, S. 1975. Some Observations of Feeding Behavior of Bottle-Nosed
Dolphins (Tursiops truncatus) in the Northern Gulf of Mexico and (Tursiops cf T. gilli) off
Southern California, Baja California, and Nayarit, Mexico. MFR Paper 1157. From Marine
Fisheries Review, Vol. 37, No.9.
León, Y.M. and K.A. Bjorndal. 2002. Selective feeding in the hawksbill turtle, an
important predator in coral reef ecosystems. Marine Ecology Progress Series 245: 249-
258.
Lightsey, J.D., S.A. Rommel, A.M. Costidis and T.D. Pitchford. 2006. Methods used
during gross necropsy to determine watercraft-related mortality in the Florida Manatee
(Trichechus manatus latirostris). Journal of Zoo and Wildlife Medicine 37(3): 262–275.
Lockyer, C.H. and S.H. Brown. 1981.The Migration of Whales, In: D.J. Aidley (ed).
Animal Migration. Society of Experimental Biology Seminar Series 13, Cambridge
University Press.
Luke, K., J.A. Horrocks, R.A. LeRoux and P.H. Dutton. 2004. Origins of green turtle
(Chelonia mydas) feeding aggregations around Barbados, West Indies. Marine Biology,
Vol 144, Issue 4, pp 799-805
Lutcavage, M.E., P. Plotkin, B. Witherington, and P.L. Lutz. 1997. Human impacts on sea
turtle survival. Pages 107-136 in Lutz, P.L. and J.A. Musick (eds.). The Biology of Sea
Turtles. CRC Press, Boca Raton, Florida.
Mazzoil, M., S.D. McCulloch, and R.H. Defran. 2005. Observations on the site fidelity of
bottlenose dolphins (Tursiops truncatus) in the Indian River Lagoon, Florida. Florida
Scientist 68:217–227
Mazzoil, M., J.S. Reif, M. Youngbluth, M.E. Murdoch, S.E. Bechdel, E. Howells, S.D.
McCulloch, L.J. Hansen, and G.D. Bossart. 2008. Home Ranges of Bottlenose Dolphins
(Tursiops truncatus) in the Indian River Lagoon, Florida: Environmental Correlates and
Implications for Management Strategies. EcoHealth 5, 278–288.
Meylan, A. 1988. Spongivory in Hawksbill Turtles: A Diet of Glass. Science, Vol. 239,
No. 4838 (Jan. 22, 1988), pp. 393-395.
South Atlantic Bight Marine Assessment
4 – Marine Mammals and Sea Turtles 299 | Page
Meylan, A., B. Schroeder, and A. Mosier. 1995. Sea Turtle Nesting Activity in the State
of Florida 1979-1992. State of Florida, Department of Environmental Protection, Florida
Marine Research Institute. St. Petersburg, FL, 57 pp.
Meylan, A.B. and M. Donnelly. 1999. Status justification for listing the hawksbill turtle
(Eretmochelys imbricata) as Critically Endangered on the 1996 IUCN Red List of
Threatened Animals. Chelonian Conservation and Biology. 3(2): 200-224.
Mitchell, E. 1975. Trophic relationships and competition for food in Northwest Atlantic
whales. Proceedings of the Canadian Society of Zoology Annual Meeting. 1974: 123-
133.
Mitchell, E., V.M. Kozicki, and R.R. Reeves. 1986. Sightings of right whales, Eubalaena
glacialis, on the Scotian Shelf, 1966-1972. Report to the International Whaling
Commission, Special Issue. 10: 83-107.
Mizroch, S.A., D.W. Rice, and J.M. Breiwick. 1984. The sei whale, Balaenoptera borealis.
Marine Fish Review. 46(4): 25-29.
Mortimer, J.A. and M. Donnelly. (IUCN SSC Marine Turtle Specialist Group) 2008.
Eretmochelys imbricata. The IUCN Red List of Threatened Species. Version 2014.2.
<www.iucnredlist.org>. Downloaded on 18 August 2014.
Musick, J.A. and C.J. Limpus. 1997. Habitat Utilization and Migration in Juvenile Sea
Turtles, In: Lutz, P, J. Musick (eds). 1997, The Biology of Sea Turtles. CRC Press. Boca
Raton, Florida
NMFS (National Marine Fisheries Service). 1991. Recovery Plan for the Humpback
Whale (Megaptera novaeangliae). Prepared by the Humpback Whale Recovery Team
for the National Marine Fisheries Service, Silver Spring, Maryland. 105 pp.
NMFS. 1994. Designated critical habitat; northern right whale. Final rule. Federal
Register. http://www.nmfs.noaa.gov/pr/pdfs/fr/fr59-28805.pdf. Accessed 06/24/08.
NMFS. 2001. Stock assessments of loggerhead and leatherback sea turtles and an
assessment of impacts of the pelagic longline fishery on the loggerhead and
leatherback sea turtles of the western North Atlantic. NOA A Technical Memorandum.
NMFS-SEFC-455.
NMFS. 2005. Recovery plan for the North Atlantic right whale (Eubalaena glacialis).
National Marine Fisheries Service, Silver Spring, Maryland.

South Atlantic Bight Marine Assessment
300 | Page 4 - Marine Mammals and Sea Turtles
NMFS. 2006a. Review of the Status of the Right Whales in the North Atlantic and North
Pacific Oceans.
NMFS. 2006b. Taking of marine mammals incidental to commercial fishing operations;
Bottlenose Dolphin Take Reduction Plan Regulations; Sea turtle conservation;
Restrictions to fishing activities. Federal Register. Silver Spring, Maryland.
NMFS. 2010a. Large Whale Entanglement Report. National Marine Fisheries Service,
Protected Resources Division, Gloucester, Massachusetts.
NMFS. 2010b. Recovery plan for the fin whale (Balaenoptera physalus). National Marine
Fisheries Service, Silver Spring, MD. 121 pp.
NMFS. 2010c. Recovery plan for the sperm whale (Physeter macrocephalus). National
Marine Fisheries Service, Silver Spring, MD. 165pp.
NMFS USFWS. 1992. Recovery Plan for Leatherback Turtles in the U.S., Caribbean,
Atlantic and Gulf of Mexico. Silver Springs, Maryland.
http://ecos.fws.gov/docs/recovery_plan/920406.pdf.
NMFS USFWS. 2007a. 5-Year Review: Summary and Evaluation, Green Sea Turtle
(Chelonia mydas). Silver Spring, Maryland.
http://www.nmfs.noaa.gov/pr/pdfs/species/greenturtle_5yearreview.pdf.
NMFS USFWS. 2007b. 5-Year Review: Summary and Evaluation, Leatherback Turtle
(Dermochelys coriacea). Silver Spring, Maryland.
http://www.nmfs.noaa.gov/pr/pdfs/species/leatherback_5yearreview.pdf.
NMFS USFWS. 2008. Recovery Plan for the Northwest Atlantic Population of the
Loggerhead Sea Turtle (Caretta caretta), Second Revision. Silver Spring, MD.
http://www.nmfs.noaa.gov/pr/pdfs/recovery/turtle_loggerhead_atlantic.pdf.
NOAA (National Oceanic and Atmospheric Administration). 2007. The Marine Mammal
Protection Act of 1972 As Amended. Silver Spring, Maryland.
http://www.nmfs.noaa.gov/pr/pdfs/laws/mmpa.pdf . Accessed June 27, 2008.
NOAA. 2009. Taking of Marine Mammals Incidental to Commercial Fishing Operations;
Atlantic Pelagic Longline Take Reduction Plan. 50 CFR Part 229, Federal Register, Vol.
74, No. 95, Tuesday, May 19, 2009, pp 23349 – 23358.
NOAA. 2010. Guide To The Atlantic Large Whale Take Reduction Plan. NOAA. 70 pp.

South Atlantic Bight Marine Assessment
4 – Marine Mammals and Sea Turtles 301 | Page
NOAA. 2014a. Alaska Fisheries Science Center website visited May 6, 2014,
http://www.afsc.noaa.gov/nmml/education/cetaceans/baleen1.php#rorqual.
NOAA. 2014b. Website:
http://www.nmfs.noaa.gov/pr/species/mammals/cetaceans/, visited on 4/12/14
NOAA Fisheries. 2003. Strategy for Sea Turtle Conservation and Recovery in Relation to
Atlantic and Gulf of Mexico Fisheries. Strategy information is available at:
http://www.nmfs.noaa.gov/pr/pdfs/interactions/strategy_brochure.pdf
NOAA Fisheries. 2012. North Atlantic Right Whale (Eubalaena glacialis) 5-Year Review:
Summary and Evaluation. Prepared by NOAA Fisheries Service Northeast Regional
Office, August 2012.
NOAA Fisheries. 2014a. Green Turtle (Chelonia mydas) website,
http://www.nmfs.noaa.gov/pr/species/turtles/green.htm, visited on September 2,
2014.
NOAA Fisheries. 2014b. Kemp’s Ridley Turtle (Lepidochelys kempii) website,
http://www.nmfs.noaa.gov/pr/species/turtles/kempsridley.html, visited on
September 5, 2014.
Nemoto, T. 1959. Food of baleen whales with reference to whale movements. Scientific
Reports of the Whales Research Institute, Tokyo 14:149-290.
Nowacek, D., M. P. Johnson, and P. L. Tyack. 2004. North Atlantic right whales
(Eubalaena glacialis) ignore ships but respond to alerting stimuli. Proceedings of the
Royal Society of London. B 271: 227-231.
NRC (National Research Council of the US National Academies). 2003. Ocean noise and
marine mammals. National Academy Press, Washington, DC.
NRC. 2005. Marine mammal populations and ocean noise: determining when ocean
noise causes biologically significant effects. National Academy Press, Washington, DC.
Odell, D.K. and E.D. Asper. 1990. Distribution and movements of freeze-branded
bottlenose dolphins in the Indian and Banana Rivers, Florida. In: The Bottlenose
Dolphin, S. Leatherwood and R.R. Reeves (eds), San Diego, CA: Academic Press, pp
515–540.
South Atlantic Bight Marine Assessment
302 | Page 4 - Marine Mammals and Sea Turtles
O'Shea, T.J., C.A. Beck, R.K. Bonde, H.I. Kochman and D.K. Odell. 1985. An Analysis of
Manatee Mortality Patterns in Florida, 1976-81. The Journal of Wildlife Management
Vol. 49, No. 1, pp. 1-11
Parks, S.E. and C.W. Clark. 2007. Acoustic Communication: Social Sounds and the
Potential Impact of Noise. In: Kraus, S. D. and R. M. Rolland, eds. The Urban Whale:
North Atlantic right whales at the crossroads. Harvard University Press, Cambridge,
MA, pp. 310-332.
Pauly, D., V. Christensen, J. Dalsgaard, R. Froese, and F. Torres Jr. 1998. Fishing Down
Marine Food Webs. Science Vol. 279 no. 5352 pp. 860-863
Perrin, W.F. and R.L. Brownell. 2002. Minke whales (Balaenoptera acutorostrata and B.
bonaerensis) In: Perrin, W.F., B. Wursig, and J.G.M. Thewissen, eds. Encyclopedia of
Marine Mammals. Academic Press, London. pp. 750-754.
Perry, S.L., D.P. DeMaster, and G.K. Silber. 1999. The great whales: History and status
of six species listed as endangered under the United States Endangered Species Act of
1973. Marine Fisheries Review. 61:1-74.
Powell, J.A. and G.B. Rathbun. 1984. Distribution and abundance of manatees along the
northern coast of the Gulf of Mexico. Northeast Gulf Science 7(1):1-28.
Rathbun, G.B., R.K. Bonde, and D. Clay. 1982. The status of the West Indian manatee on
the Atlantic Coast north of Florida. Pages 152-165 in R.R. Odom and J.W. Guthrie, eds.
Proceedings of the symposium on nongame and endangered wildlife. Georgia
Department of Natural Resources, Game and Fish Division, Technical Bulletin WL5.
Reeves, R.R., B.D. Smith, E.A. Crespo, and G. Notarbartolo di Sciara. 2003. Dolphins,
Whales and Porpoises: 2002-2010 Conservation Action Plan for the World’s Cetaceans.
IUCN/SSC Cetacean Specialist Group. IUCN, Gland, Switzerland and Cambridge, UK.
Richardson, W.J., C.R. Greene, C.I. Malme, and D.H. Thomson. 1995. Marine Mammals
and Noise. Elsevier, New York, NY. 576 pp.
Rolland, R.M., K.E. Hunt, G.J. Doucette, L.G. Rickard, and S.K. Wasser. 2007. The Inner
Whale: Hormones, Biotoxins, and Parasites. In: Kraus, S.D. and R.M. Rolland, eds. The
Urban Whale: North Atlantic right whales at the crossroads. Harvard University Press,
Cambridge, MA. pp 232-266.

South Atlantic Bight Marine Assessment
4 – Marine Mammals and Sea Turtles 303 | Page
Sargent, F.J., T.J. Leary, D.W. Crewz, and C.R. Kruer. 1995. Scarring of Florida’s
seagrasses: assessment and management options. FMRI Tech. Rep. TR-1. Florida
Marine Research Institute, St. Petersburg, Florida. 37 p. plus appendices.
Scheifele, P. M. and M. Darre. 2005. Noise levels and sources in the Stellwagen Bank
National Marine Sanctuary and the St. Lawrence River Estuary. Marine Conservation
Series MSD-05-1. U. S. Department of Commerce, National Oceanic and Atmospheric
Administration, Marine Sanctuaries Division, Silver Spring, MD. 26pp.
Seminoff, J.A. (Southwest Fisheries Science Center, U.S.) 2004. Chelonia mydas. The
IUCN Red List of Threatened Species. Version 2014.2. <www.iucnredlist.org>.
Downloaded on 15 August 2014.
Sergeant, D.E., D.J. St. Aubin, and J.R. Geraci. 1980. Life history and Northwest Atlantic
status of the Atlantic white-sided dolphin, Lagenorhynchus acutus. Cetology. 37: 1-12.
Shamblin, B.M., M.G. Dodd, D.A. Bagley, L.M. Ehrhart, A.D. Tucker, C. Johnson, R.R.
Carthy, R.A. Scarpino, E. McMichael, D.S. Addison, K.L. Williams, M.G. Frick, S.
Ouellette. A.B. Meylan, M.H. Godfrey, S.R. Murphy, and C.J. Nairn, C. J. 2011. Genetic
structure of the southeastern United States loggerhead turtle nesting aggregation:
evidence of additional structure within the peninsular Florida recovery unit, Marine
Biology 158:571-587).
Shamblin, B. M., A.B. Bolten, K.A. Bjorndal, P.H. Dutton, J.T. Nielsen, F.A. Abreu-
Grobois, K.J. Reich, B.E. Witherington, D.A. Bagley, L.M. Ehrhart, A.D. Tucker, D.S.
Addison, A. Arenas, C. Johnson, R.R. Carthy, M.M. Lamont, M.G. Dodd, M.S. Gaines, E.
LaCasella, and C.J. Nairn. 2012. Expanded mitochondrial control region sequences
increase resolution of stock structure among North Atlantic loggerhead turtle
rookeries. Marine Ecology Progress Series 469:145-160.
Shoop, C.R. and R.D. Kenney. 1992. Seasonal distributions and abundances of
loggerhead and leatherback sea turtles in waters of the northeastern United States.
Herpetology Monographs. 6: 43-57.
Simmonds, M.P. and S.J. Isaac. 2007. The impacts of climate change on marine
mammals: early signs of significant problems. Oryx, Volume 41, Issue 01, pp 19-26.
Singel, K., T. Redlow, and A. Foley. 2003. Twenty-two years of data on sea turtle
mortality in Florida: trends and factors. Proceedings of the Twenty-second Annual
Symposium on Sea Turtle Biology and Conservation. NOA A Technical Memorandum.
NMFS-SEFSC-503.
South Atlantic Bight Marine Assessment
304 | Page 4 - Marine Mammals and Sea Turtles
Smith, K.N. 1993. Manatee habitat and human-related threats to seagrass in Florida: a
review. Report for the Florida Department of Environmental Protection. Tallahassee,
Florida. 33 pp.
Smith, S. and H. Whitehead. 2000. The diet of Galapagos sperm whales Physeter
macrocephalus as indicated by fecal sample analysis. Marine Mammal Science 16(2):
315-325.
Southall, B.L., A.E. Bowles, W.E. Ellison, J.J. Finneran, R.L. Gentry, C.R. Greene Jr., D.
Kastak, D.R. Ketten, J.H. Miller, P.E. Nachtigall, W.J. Richardson, J.A. Thomas, and P.L.
Tyack. 2007. Marine mammal noise exposure criteria: initial scientific
recommendations. Aquatic Mammalogy. 33: 411-521.
Speakman, T., E. Zolman, J. Adams, R.H. Defran, D. Laska, L. Schwacke, J. Craigie, and
P. Fair. 2006. Temporal and spatial aspects of bottlenose dolphin occurrence in coastal
and estuarine waters near Charleston, South Carolina. U.S. Department of Commerce,
NOAA Technical Memorandum NOS-NCCOS-37, p 56
SBNMS (Stellwagen Bank National Marine Sanctuary). 2009. Science: Shifting the
Boston Traffic Separation Scheme (TSS). http://stellwagen.noaa.gov/science/tss.html.
Accessed November 13, 2009.
Swingle, W.M. 2014. Personal communication.
Thayer, G.W., K.A. Bjorndal, J.C. Ogden, S.L. Williams, J.C. Zieman. 1984. Role of larger
herbivores in seagrass communities. Estuaries, Volume 7, Issue 4, pp 351-376.
Tiwari, M., B.P. Wallace, and M. Girondot. 2013. Dermochelys coriacea (Northwest
Atlantic Ocean subpopulation). The IUCN Red List of Threatened Species. Version
2014.2. <www.iucnredlist.org>. Downloaded on 04 September 2014.
Tripp, K. 2014. Manatees and the Changing Climate. Save the Manatee Club website
visited 10-7-14, http://www.savethemanatee.org/news_feature_global_warming.html
TEWG (Turtle Expert Working Group). 2007. An Assessment of the Leatherback Turtle
Population in the Atlantic Ocean. NOAA Technical Memorandum NMFS-SEFSC-555,
116 pp.

South Atlantic Bight Marine Assessment
4 – Marine Mammals and Sea Turtles 305 | Page
TEWG (Turtle Expert Working Group). 2009. An assessment of the loggerhead turtle
population in the western North Atlantic Ocean. NOAA Technical Memorandum NMFS-
SEFSC-575. 142 pages. Available at
http://www.sefsc.noaa.gov/seaturtletechmemos.jsp.
USFWS (U.S. Fish and Wildlife Service). 2012. Green Sea Turtle (Chelonia mydas) Fact
sheet. Downloaded on 11-24-14.
http://www.fws.gov/northflorida/SeaTurtles/Turtle%20Factsheets/PDF/Green-Sea-
Turtle.pdf.
Wallace, B.P., A.D. DiMatteo, A.B. Bolten, M.Y. Chaloupka, B.J. Hutchinson, F.A. Abreu-
Grobois, J.A. Mortimer, J.A., Seminoff, D. Amorocho, K.A. Bjorndal, J. Bourjea, B.W.
Bowen, R. Briseño-Dueñas, P. Casale, B.C. Choudhury, A. Costa, P.H. Dutton, A.
Fallabrino, E.M. Finkbeiner, A. Girard, M. Girondot, M. Hamann, B.J. Hurley, M. López-
Mendilaharsu, M.A. Marcovaldi, J.A. Musick, R. Nel, N.J. Pilcher, S. Troëng, B.
Witherington, and R.B. Mast. 2011. Global conservation priorities for marine turtles.
PLoS ONE 6(9): e24510. doi:10.1371/journal.pone.0024510
Wallace, B.P., M. Tiwari, and M. Girondot. 2013. Dermochelys coriacea. The IUCN Red
List of Threatened Species. Version 2014.2. <www.iucnredlist.org>. Downloaded on 15
August 2014
Waring G.T., R.M. Pace, J.M. Quintal, C.P. Fairfield, and K. Maze-Foley. 2003. US
Atlantic and Gulf of Mexico marine mammal stock assessments. NOAA Technical
Memorandum NMFSNE-182.
Waring, G.T., E. Josephson, C.P. Fairfield-Walsh, and K. Maze-Foley, eds. 2008. US
Atlantic and Gulf of Mexico Marine Mammal Stock Assessments - 2007. NOA A Tech.
Memo. NMFS-NE-205. National Marine Fisheries Service, Woods Hole, MA. 423 pp.
Waring, G.T., E. Josephson, K. Maze-Foley, and P.E. Rosel, editors. 2009. U.S. Atlantic
and Gulf of Mexico Marine Mammal Stock Assessments -- 2009. NOAA Tech Memo
NMFS NE 213; 528 p.
Waring, G.T., E. Josephson, K. Maze-Foley, and P.E. Rosel, editors. 2014. U.S. Atlantic
and Gulf of Mexico Marine Mammal Stock Assessments -- 2013. NOAA Tech Memo
NMFS-NE-228; 475 p.
Weisbrod, A.V., D. Shea, M.J. Moore and J.J. Stegeman. 2000. Bioaccumulation
patterns of polychlorinated biphenyls and chlorinated pesticides in Northwest Atlantic
pilot whales. Environmental Toxicology and Chemistry, 19(3) pp 667–677.
South Atlantic Bight Marine Assessment
306 | Page 4 - Marine Mammals and Sea Turtles
Wiley, D.N., R.A. Asmutis, T.D. Pitchford and D.P. Gannon. 1995. Stranding and
mortality of humpback whales, Megaptera novaeangliae, in the mid-Atlantic and
southeast United States, 1985 – 1992. Fishery Bulletin 93:196-205.
Wiley, D.N., J.C. Moller and K. Zilinskas. 2003. The distribution and density of
commercial fisheries and baleen whales within the Stellwagen Bank National Marine
Sanctuary: July 2001-June 2002. Marine Technology Society Journal. 37(1): 35-53.
Wiley, D.N., J.C. Moller, R.M. Pace, and C. Carleson. 2008. Effectiveness of Voluntary
Conservation Agreements: Case Study of Endangered Whales and Commercial Whale-
Watching. Conservation Biology. 22(2): 450-457
Winn, H.E. 1984. Development of a right whale sighting network in the Southeast U.S.
Report to the U.S. Marine Mammal Commission, MMC – 82/05. National Technical
Information Service. PB84-240548, v+12pp.
Witherington, B.E. 2002. Ecology of neonate loggerhead turtles inhabiting lines of
downwelling near a Gulf Stream front. Marine Biology. 140:843-853.
Zolman, E. 2002. Residence patterns of bottlenose dolphins (Tursiops truncatus) in the
Stono River Estuary, Charleston County, South Carolina, USA. Marine Mammal Science
18:879–892