Margin Expansion: Volume to Value -...
19
Kellogg Company September 7, 2016 Page 1 of 19 Margin Expansion: Volume to Value Barclay’s Global Consumer Staples Conference September 7, 2016 Margin Expansion: Volume to Value 2 This presentation contains, or incorporates by reference, “forward‐looking statements” with projections concerning, among other things, the Company’s global growth and efficiency program (Project K), the integration of acquired businesses, the Company’s strategy, zero‐based budgeting, and the Company’s sales, earnings, margin, operating profit, costs and expenditures, interest expense, tax rate, capital expenditure, dividends, cash flow, debt reduction, share repurchases, costs, charges, rates of return, brand building, ROIC, working capital, growth, new products, innovation, cost reduction projects, workforce reductions, savings, and competitive pressures. Forward‐looking statements include predictions of future results or activities and may contain the words “expects,” “believes,” “should,” “will,” “anticipates,” “projects,” “estimates,” “implies,” “can,” or words or phrases of similar meaning. The Company’s actual results or activities may differ materially from these predictions. The Company’s future results could also be affected by a variety of factors, including the ability to implement Project K as planned, whether the expected amount of costs associated with Project K will differ from forecasts, whether the Company will be able to realize the anticipated benefits from Project K in the amounts and times expected, the ability to realize the anticipated benefits and synergies from the acquisitions in the amounts and at the times expected, the impact of competitive conditions; the effectiveness of pricing, advertising, and promotional programs; the success of innovation, renovation and new product introductions; the recoverability of the carrying value of goodwill and other intangibles; the success of productivity improvements and business transitions; commodity and energy prices; labor costs; disruptions or inefficiencies in supply chain; the availability of and interest rates on short‐term and long‐term financing; actual market performance of benefit plan trust investments; the levels of spending on systems initiatives, properties, business opportunities, integration of acquired businesses, and other general and administrative costs; changes in consumer behavior and preferences; the effect of U.S. and foreign economic conditions on items such as interest rates, statutory tax rates, currency conversion and availability; legal and regulatory factors including changes in food safety, advertising and labeling laws and regulations; the ultimate impact of product recalls; business disruption or other losses from war, terrorist acts or political unrest; and other items. Forward‐looking statements speak only as of the date they were made, and the Company undertakes no obligation to update them publicly. Non‐GAAP Financial Measures. This presentation includes non‐GAAP financial measures. Please refer to the Appendices for a reconciliation of these non‐GAAP financial measures to the most directly comparable GAAP financial measures. Management believes that the use of such non‐GAAP measures assists investors in understanding the underlying operating performance of the company and its segments. Forward‐Looking Statement
Transcript of Margin Expansion: Volume to Value -...
Kellogg Company September 7, 2016
Page 1 of 19
Margin Expansion:
Volume to ValueBarclay’s Global Consumer
Staples Conference
September 7, 2016
Margin Expansion: Volume to Value 2
This presentation contains, or incorporates by reference, “forward‐looking statements” with projections concerning, among other things, the Company’s global growth and efficiency program (Project K), the integration of acquired businesses, the Company’s strategy, zero‐based budgeting, and the Company’s sales, earnings, margin, operating profit, costs and expenditures, interest expense, tax rate, capital expenditure, dividends, cash flow, debt reduction, share repurchases, costs, charges, rates of return, brand building, ROIC, working capital, growth, new products, innovation, cost reduction projects, workforce reductions, savings, and competitive pressures. Forward‐looking statements include predictions of future results or activities and may contain the words “expects,” “believes,” “should,” “will,” “anticipates,” “projects,” “estimates,” “implies,” “can,” or words or phrases of similar meaning.
The Company’s actual results or activities may differ materially from these predictions. The Company’s future results could also be affected by a variety of factors, including the ability to implement Project K as planned, whether the expected amount of costs associated with Project K will differ from forecasts, whether the Company will be able to realize the anticipated benefits from Project K in the amounts and times expected, the ability to realize the anticipated benefits and synergies from the acquisitions in the amounts and at the times expected, the impact of competitive conditions; the effectiveness of pricing, advertising, and promotional programs; the success of innovation, renovation and new product introductions; the recoverability of the carrying value of goodwill and other intangibles; the success of productivity improvements and business transitions; commodity and energy prices; labor costs; disruptions or inefficiencies in supply chain; the availability of and interest rates on short‐term and long‐term financing; actual market performance of benefit plan trust investments; the levels of spending on systems initiatives, properties, business opportunities, integration of acquired businesses, and other general and administrative costs; changes in consumer behavior and preferences; the effect of U.S. and foreign economic conditions on items such as interest rates, statutory tax rates, currency conversion and availability; legal and regulatory factors including changes in food safety, advertising and labeling laws and regulations; the ultimate impact of product recalls; business disruption or other losses from war, terrorist acts or political unrest; and other items.
Forward‐looking statements speak only as of the date they were made, and the Company undertakes no obligation to update them publicly.
Non‐GAAP Financial Measures. This presentation includes non‐GAAP financial measures. Please refer to the Appendices for a reconciliation of these non‐GAAP financial measures to the most directly comparable GAAP financial measures. Management believes that the use of such non‐GAAP measures assists investors in understanding the underlying operating performance of the company and its segments.
Forward‐Looking Statement
Kellogg Company September 7, 2016
Page 2 of 19
Margin Expansion: Volume to Value
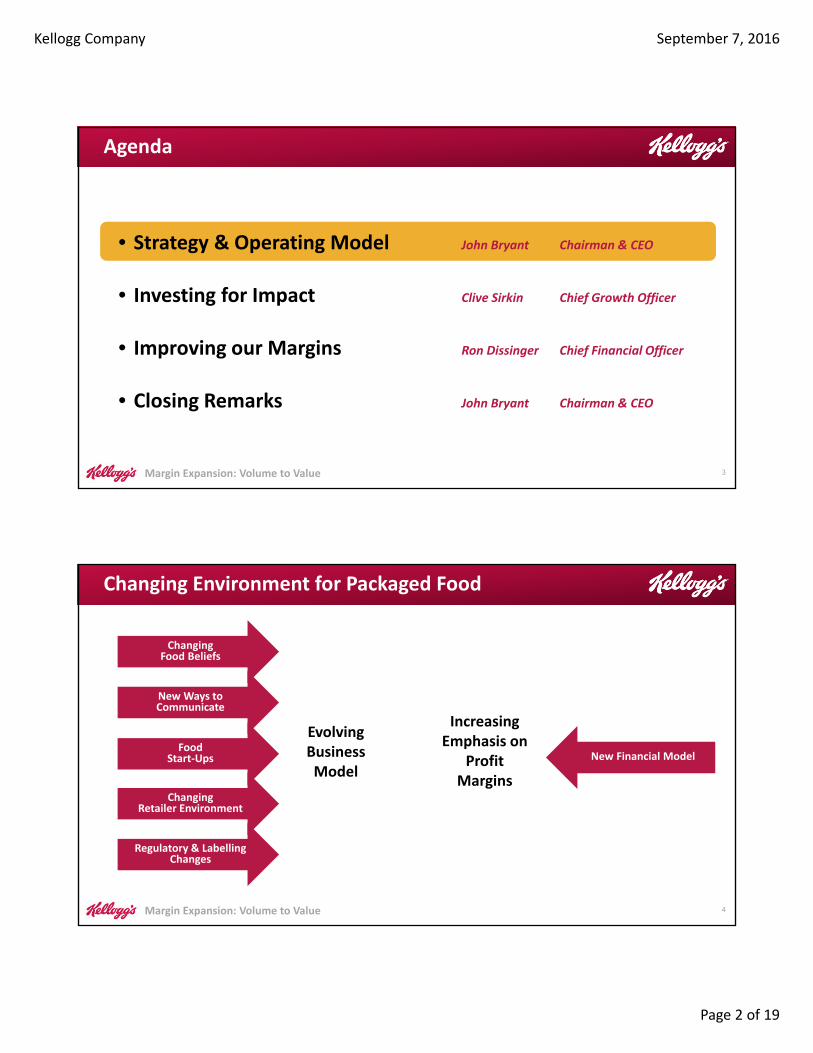
• Strategy & Operating Model John Bryant Chairman & CEO
• Investing for Impact Clive Sirkin Chief Growth Officer
• Improving our Margins Ron Dissinger Chief Financial Officer
• Closing Remarks John Bryant Chairman & CEO
Agenda
3
Margin Expansion: Volume to Value
EvolvingBusinessModel
Increasing Emphasis on
Profit Margins
4
Changing Environment for Packaged Food
ChangingFood Beliefs
New Ways toCommunicate
FoodStart‐Ups
ChangingRetailer Environment
Regulatory & LabellingChanges
New Financial Model
Kellogg Company September 7, 2016
Page 3 of 19
Margin Expansion: Volume to Value
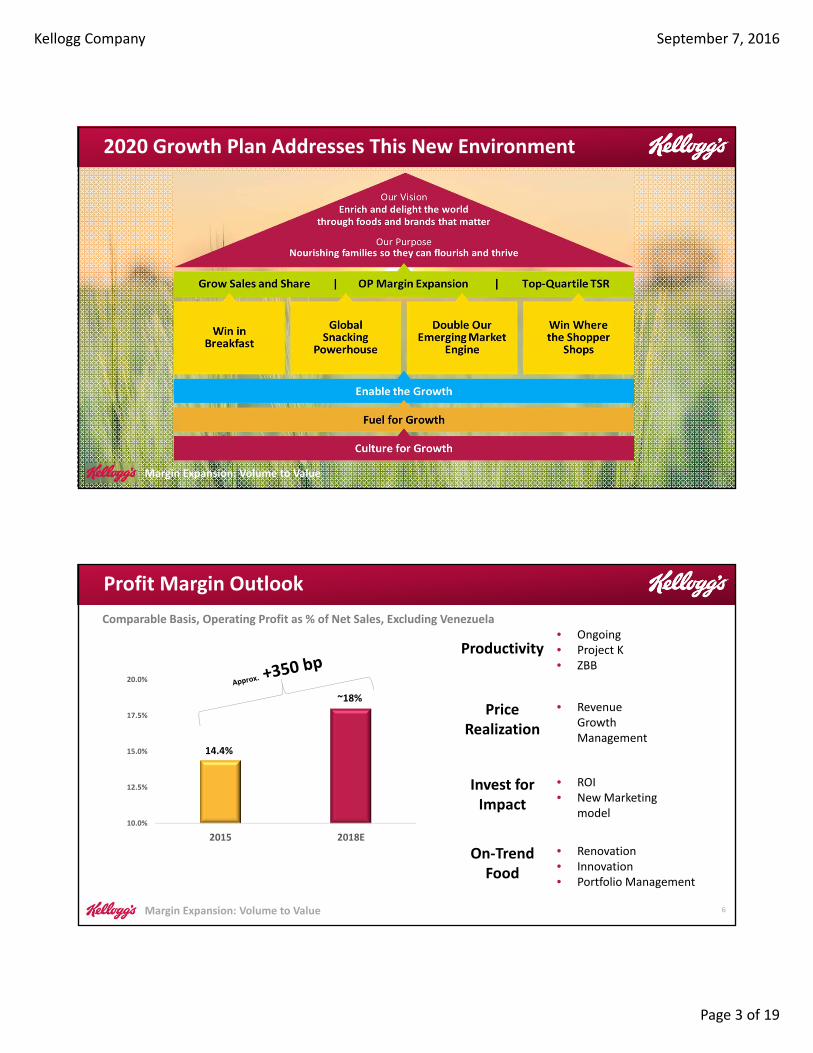
2020 Growth Plan Addresses This New Environment
5Margin Expansion: Volume to Value
Margin Expansion: Volume to Value 6
• Ongoing• Project K• ZBB
Invest forImpact
PriceRealization
Productivity
10.0%
12.5%
15.0%
17.5%
20.0%
2015 2018E
Comparable Basis, Operating Profit as % of Net Sales, Excluding Venezuela
14.4%
• ROI• New Marketing
model
~18%• Revenue
Growth Management
On‐TrendFood
• Renovation• Innovation• Portfolio Management
Profit Margin Outlook
Kellogg Company September 7, 2016
Page 4 of 19
Margin Expansion: Volume to Value
Volumeto
Value
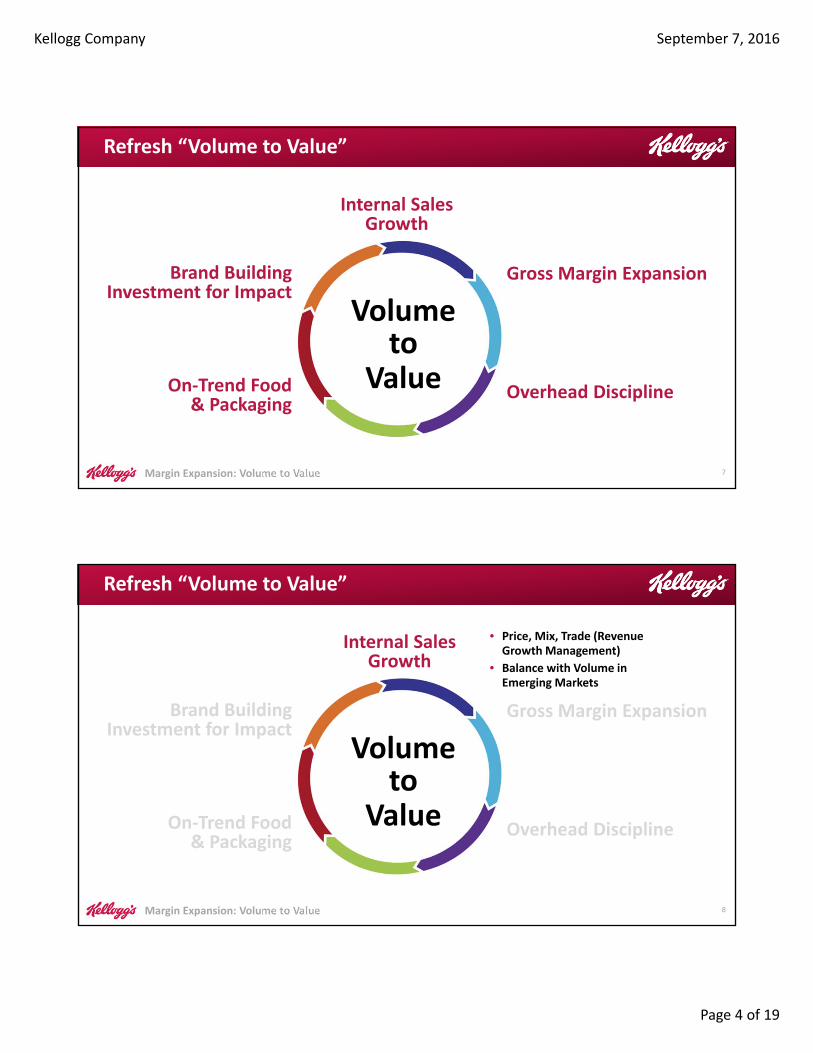
Internal Sales Growth
Overhead Discipline
Gross Margin Expansion
On‐Trend Food & Packaging
Brand Building Investment for Impact
Refresh “Volume to Value”
7
Margin Expansion: Volume to Value
Volumeto
Value
Internal Sales Growth
Overhead Discipline
Gross Margin Expansion
On‐Trend Food & Packaging
Brand Building Investment for Impact
• Price, Mix, Trade (Revenue Growth Management)
• Balance with Volume in Emerging Markets
Refresh “Volume to Value”
8
Kellogg Company September 7, 2016
Page 5 of 19
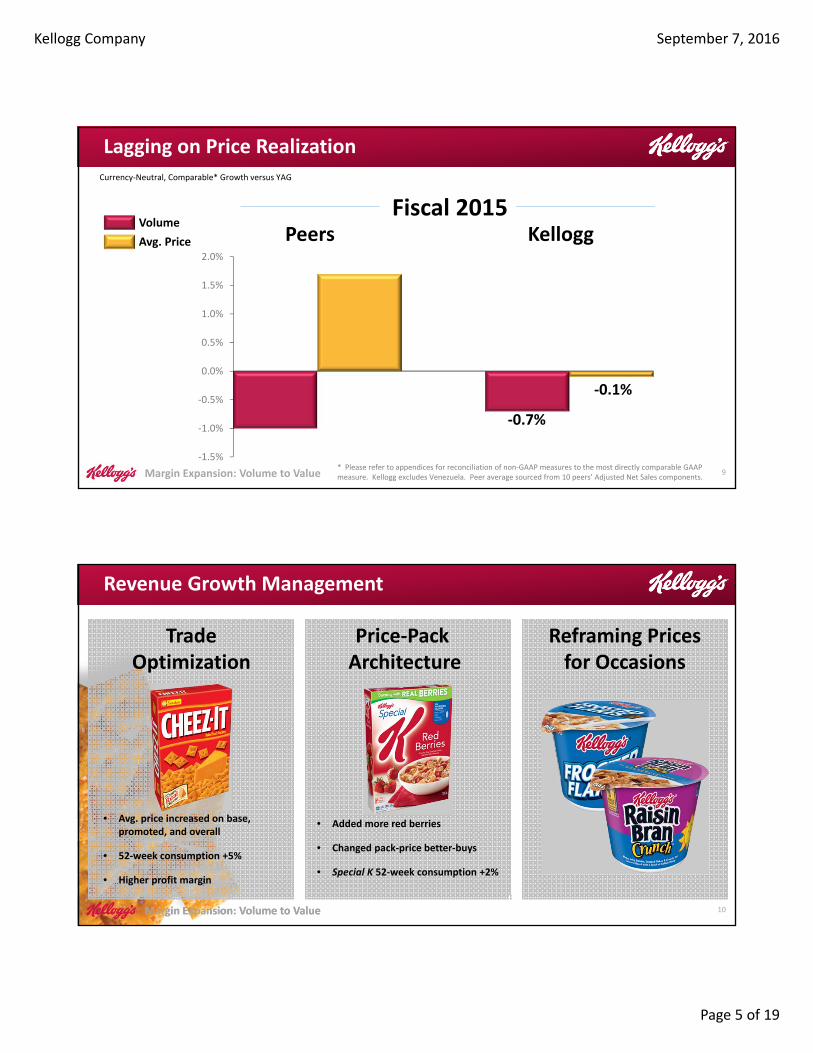
Margin Expansion: Volume to Value
‐0.7%
‐0.1%
‐1.5%
‐1.0%
‐0.5%
0.0%
0.5%
1.0%
1.5%
2.0%
Volume
Avg. Price
Lagging on Price RealizationCurrency‐Neutral, Comparable* Growth versus YAG
Peers Kellogg
9* Please refer to appendices for reconciliation of non‐GAAP measures to the most directly comparable GAAP measure. Kellogg excludes Venezuela. Peer average sourced from 10 peers’ Adjusted Net Sales components.
Fiscal 2015
Margin Expansion: Volume to Value
Trade Optimization
• Added more red berries
• Changed pack‐price better‐buys
• Special K 52‐week consumption +2%
Revenue Growth Management
Price‐Pack Architecture
Reframing Prices for Occasions
• Avg. price increased on base, promoted, and overall
• 52‐week consumption +5%
• Higher profit margin
10Margin Expansion: Volume to Value
Kellogg Company September 7, 2016
Page 6 of 19
Margin Expansion: Volume to Value
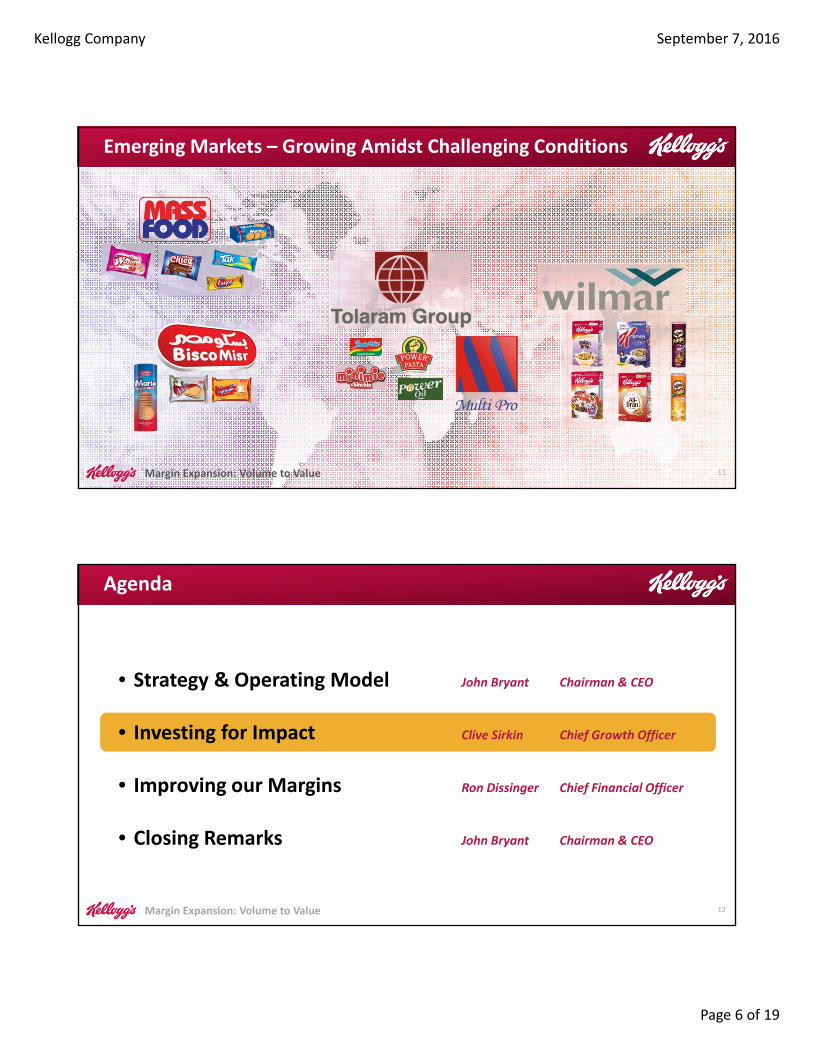
Emerging Markets – Growing Amidst Challenging Conditions
11Margin Expansion: Volume to Value
Margin Expansion: Volume to Value
• Strategy & Operating Model John Bryant Chairman & CEO
• Investing for Impact Clive Sirkin Chief Growth Officer
• Improving our Margins Ron Dissinger Chief Financial Officer
• Closing Remarks John Bryant Chairman & CEO
Agenda
12
Kellogg Company September 7, 2016
Page 7 of 19
Margin Expansion: Volume to Value
Volumeto
Value
Internal Sales Growth
Overhead Discipline
Gross Margin Expansion
On‐Trend Food & Packaging
Brand Building Investment for Impact
• Innovate for Impact – Bigger, Better
• Consumers Pay for Added Value
• Fit for Purpose (Consumer/Channel)
Refresh “Volume to Value”
13
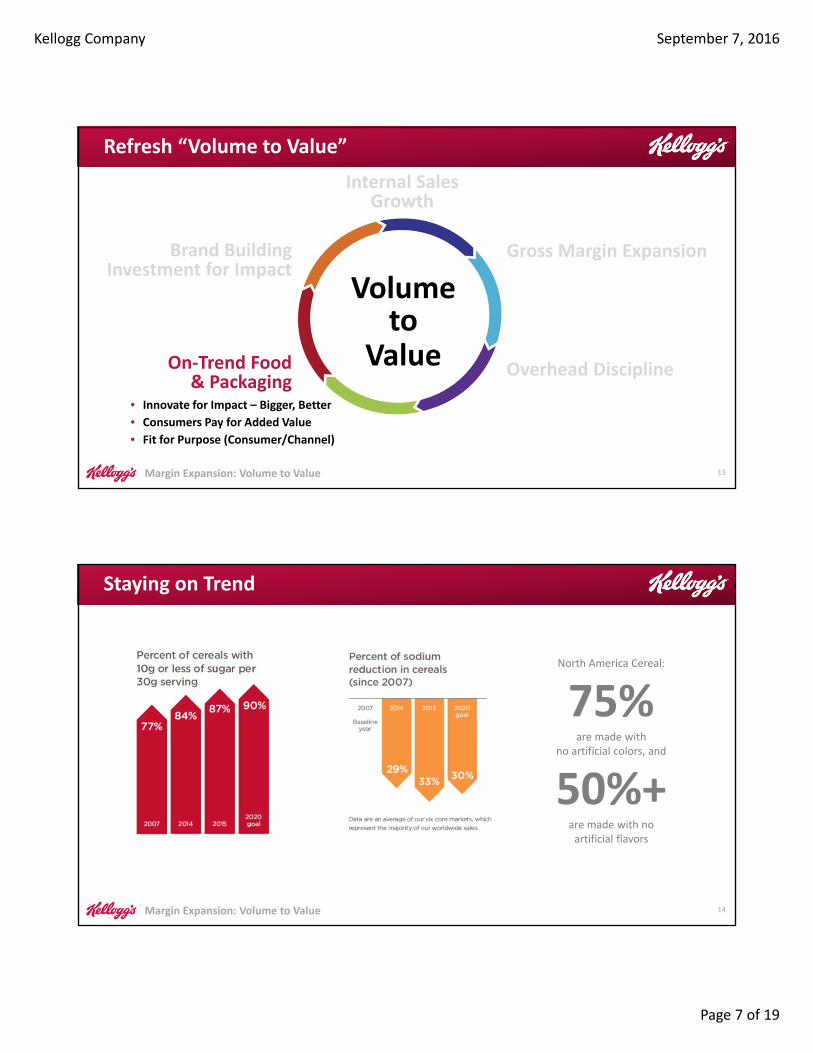
Margin Expansion: Volume to Value
Staying on Trend
North America Cereal:
75%are made with
no artificial colors, and
50%+are made with no artificial flavors
14
Kellogg Company September 7, 2016
Page 8 of 19
Margin Expansion: Volume to Value
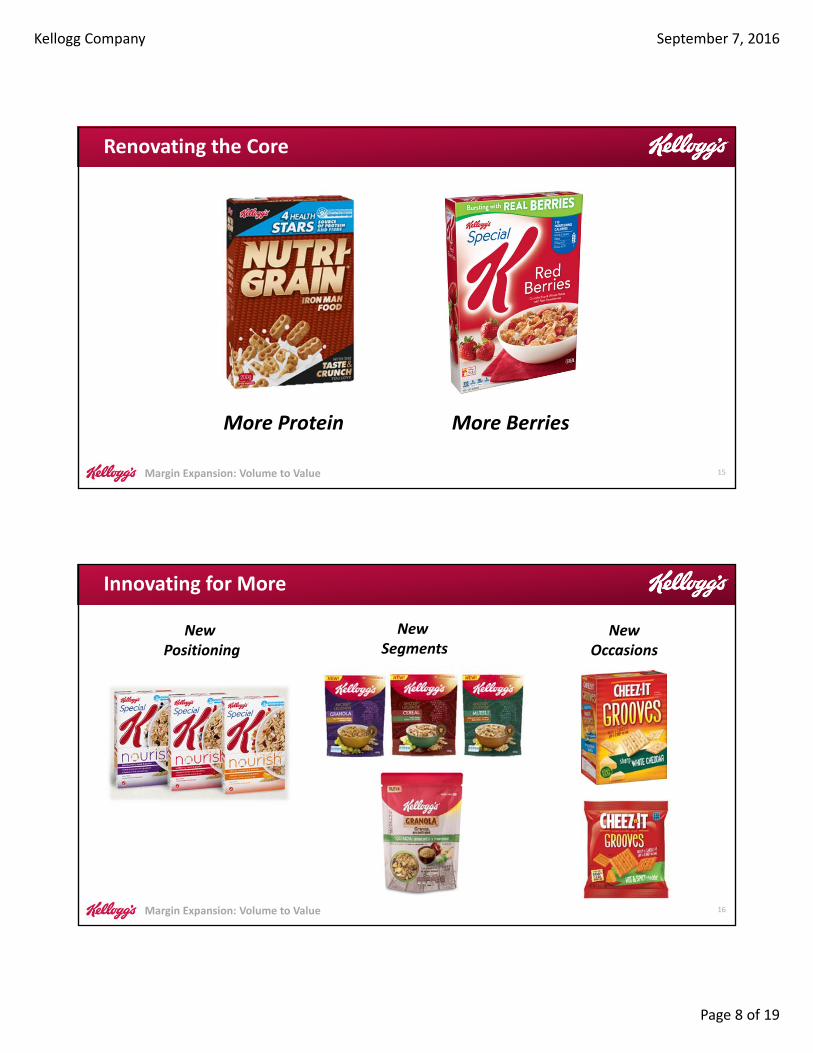
Renovating the Core
More BerriesMore Protein
15
Margin Expansion: Volume to Value
Innovating for More
New Positioning
New Segments
NewOccasions
16
Kellogg Company September 7, 2016
Page 9 of 19
Margin Expansion: Volume to Value
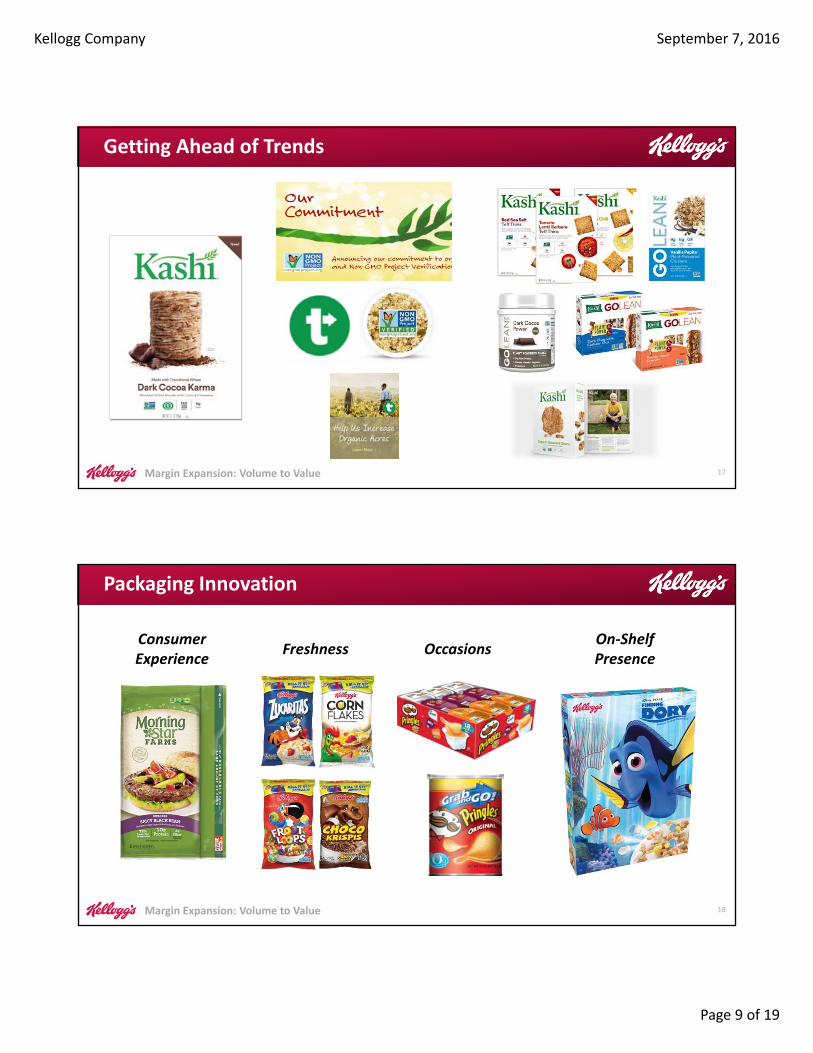
Getting Ahead of Trends
17
Margin Expansion: Volume to Value
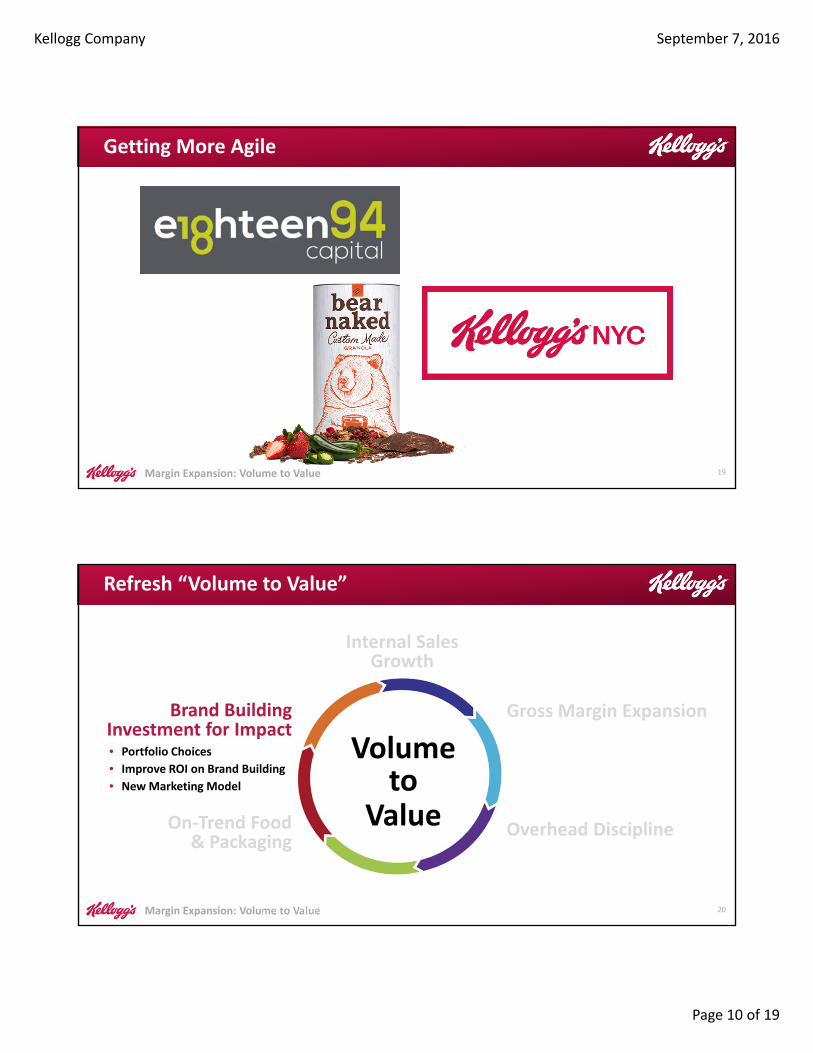
Packaging Innovation
We have made Significant Global Progress on Sugar Reductions against our 2020 Food Belief Goals
18
ConsumerExperience
Freshness OccasionsOn‐ShelfPresence
Kellogg Company September 7, 2016
Page 10 of 19
Margin Expansion: Volume to Value
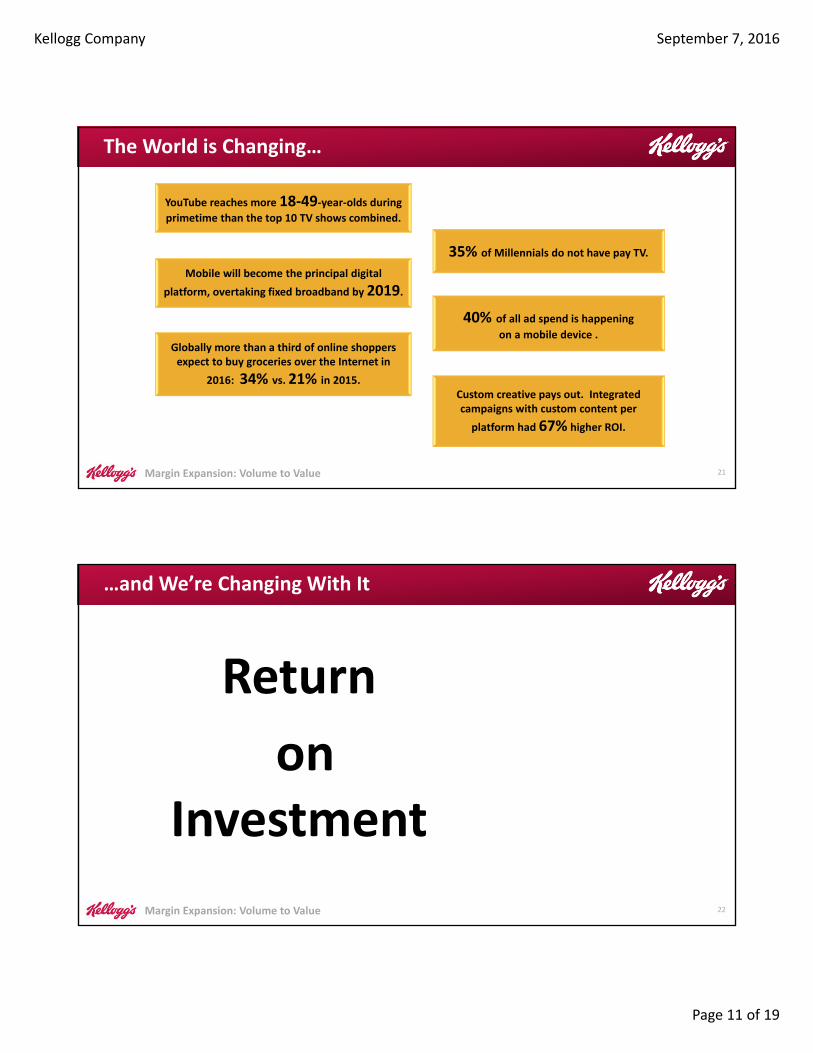
Getting More Agile
19
Margin Expansion: Volume to Value
Volumeto
Value
Internal Sales Growth
Overhead Discipline
Gross Margin Expansion
On‐Trend Food & Packaging
Brand Building Investment for Impact• Portfolio Choices
• Improve ROI on Brand Building
• New Marketing Model
Refresh “Volume to Value”
20
Kellogg Company September 7, 2016
Page 11 of 19
Margin Expansion: Volume to Value
The World is Changing…
YouTube reaches more 18‐49‐year‐olds during primetime than the top 10 TV shows combined.
35% of Millennials do not have pay TV.
Custom creative pays out. Integrated campaigns with custom content per
platform had 67% higher ROI.
Globally more than a third of online shoppers expect to buy groceries over the Internet in
2016: 34% vs. 21% in 2015.
40% of all ad spend is happening
on a mobile device .
Mobile will become the principal digital
platform, overtaking fixed broadband by 2019.
21
Margin Expansion: Volume to Value
Return
onInvestment
…and We’re Changing With It
22
Kellogg Company September 7, 2016
Page 12 of 19
Margin Expansion: Volume to Value
Evolving our Brand Building Model
Digital Media Spend Consistently Increasing:
Now over 1/3 of our global media spend and 40% in the U.S.
23
Margin Expansion: Volume to Value
Impact in Market
24
Kellogg Company September 7, 2016
Page 13 of 19
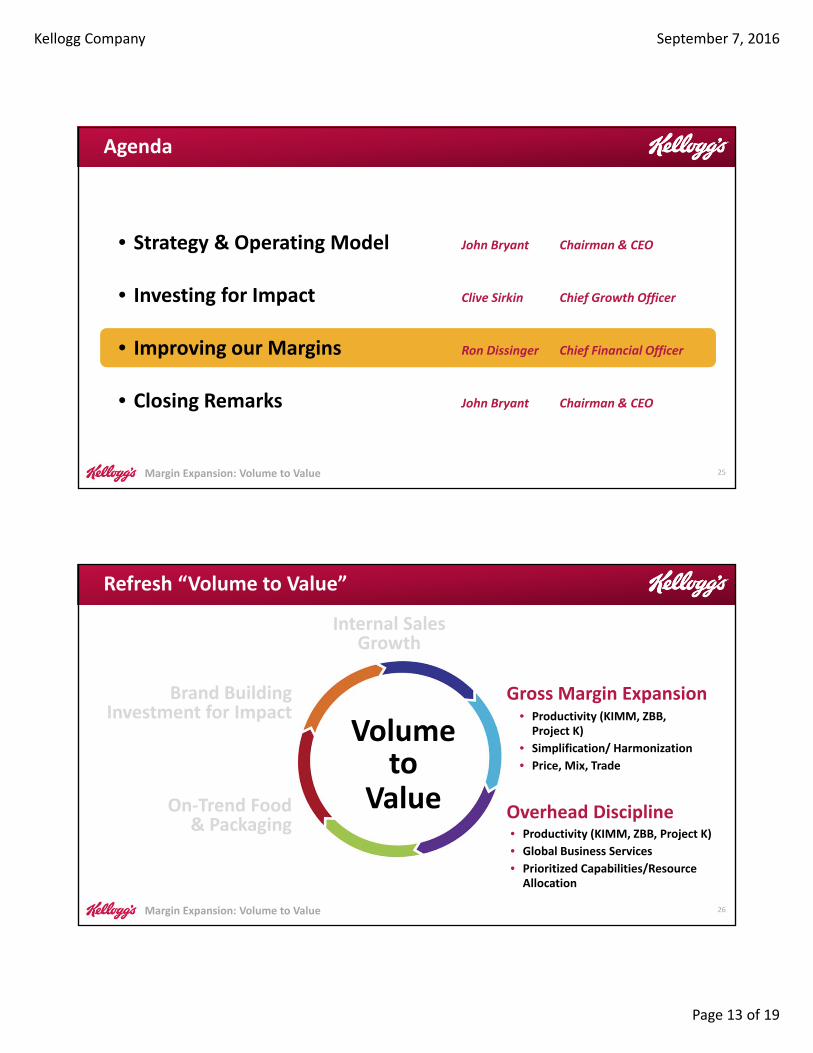
Margin Expansion: Volume to Value
• Strategy & Operating Model John Bryant Chairman & CEO
• Investing for Impact Clive Sirkin Chief Growth Officer
• Improving our Margins Ron Dissinger Chief Financial Officer
• Closing Remarks John Bryant Chairman & CEO
Agenda
25
Margin Expansion: Volume to Value
Refresh “Volume to Value”
Volumeto
Value
Internal Sales Growth
Gross Margin Expansion
On‐Trend Food & Packaging
Brand Building Investment for Impact • Productivity (KIMM, ZBB,
Project K)
• Simplification/ Harmonization
• Price, Mix, Trade
Overhead Discipline• Productivity (KIMM, ZBB, Project K)
• Global Business Services
• Prioritized Capabilities/Resource Allocation
26
Kellogg Company September 7, 2016
Page 14 of 19
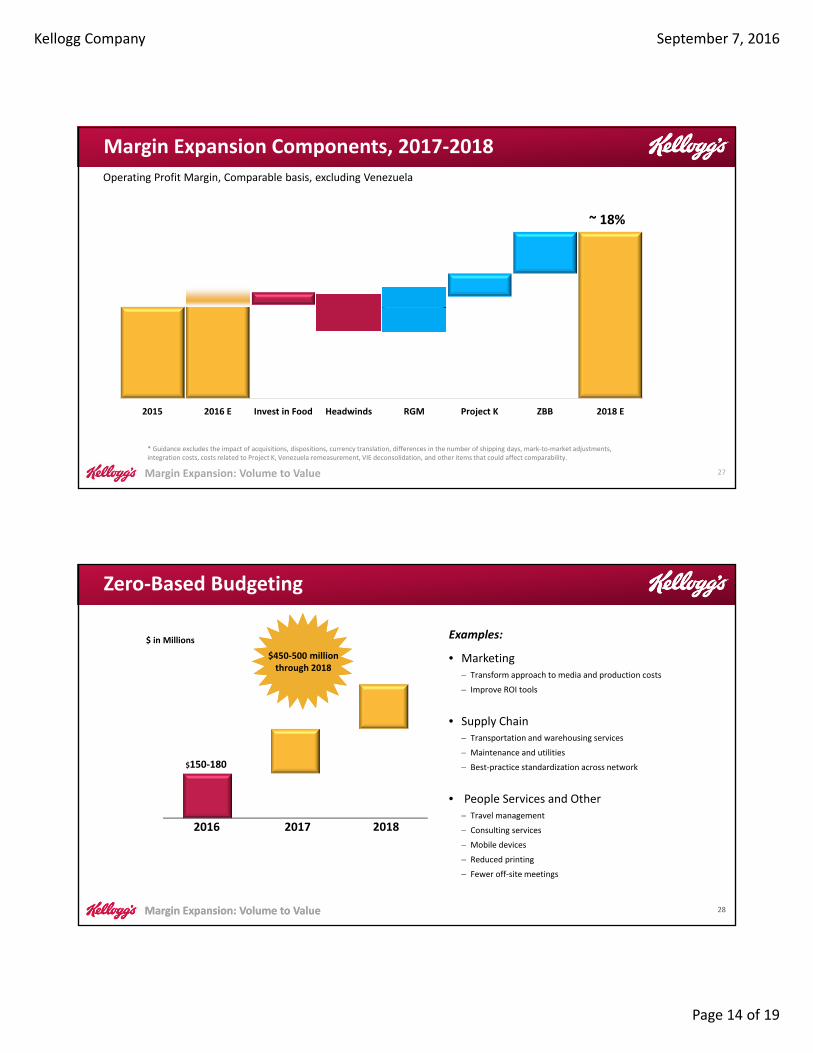
Margin Expansion: Volume to Value
1000
1100
1200
1300
1400
1500
1600
1700
1800
1900
2000
2015 2016 E Invest in Food Headwinds RGM Project K ZBB 2018 E
Operating Profit Margin, Comparable basis, excluding Venezuela
Margin Expansion Components, 2017‐2018
27
~ 18%
* Guidance excludes the impact of acquisitions, dispositions, currency translation, differences in the number of shipping days, mark‐to‐market adjustments, integration costs, costs related to Project K, Venezuela remeasurement, VIE deconsolidation, and other items that could affect comparability.
Margin Expansion: Volume to Value
Examples:
• Marketing Transform approach to media and production costs
Improve ROI tools
• Supply Chain Transportation and warehousing services
Maintenance and utilities
Best‐practice standardization across network
• People Services and Other Travel management
Consulting services
Mobile devices
Reduced printing
Fewer off‐site meetings
2016 20182017
$150‐180
$ in Millions
Zero‐Based Budgeting
28Margin Expansion: Volume to Value
$450‐500 million through 2018
Kellogg Company September 7, 2016
Page 15 of 19
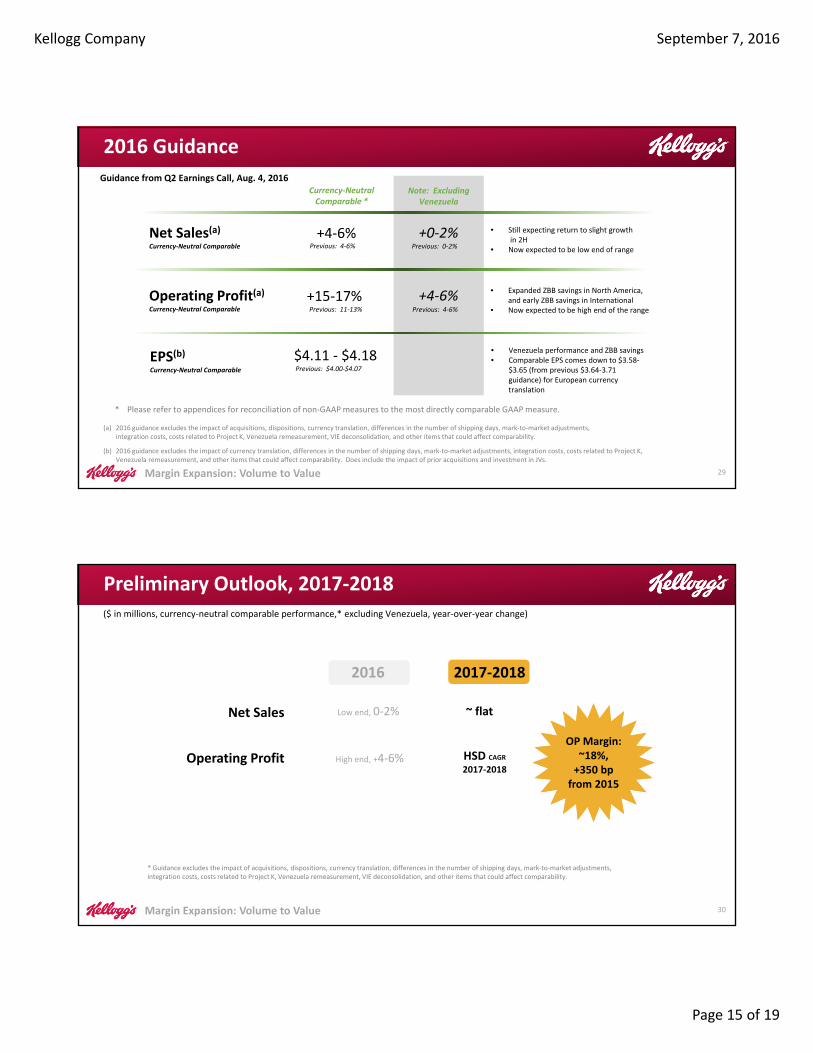
Margin Expansion: Volume to Value 29
(a) 2016 guidance excludes the impact of acquisitions, dispositions, currency translation, differences in the number of shipping days, mark‐to‐market adjustments, integration costs, costs related to Project K, Venezuela remeasurement, VIE deconsolidation, and other items that could affect comparability.
(b) 2016 guidance excludes the impact of currency translation, differences in the number of shipping days, mark‐to‐market adjustments, integration costs, costs related to Project K, Venezuela remeasurement, and other items that could affect comparability. Does include the impact of prior acquisitions and investment in JVs.
EPS(b)Currency‐Neutral Comparable
Operating Profit(a)Currency‐Neutral Comparable
Net Sales(a)Currency‐Neutral Comparable
+4‐6%
+15‐17%
$4.11 ‐ $4.18
+0‐2%
+4‐6%
• Still expecting return to slight growthin 2H
• Now expected to be low end of range
• Expanded ZBB savings in North America, and early ZBB savings in International
• Now expected to be high end of the range
Previous: 0‐2%Previous: 4‐6%
Previous: 4‐6%
• Venezuela performance and ZBB savings• Comparable EPS comes down to $3.58‐
$3.65 (from previous $3.64‐3.71 guidance) for European currency translation
Previous: $4.00‐$4.07
Previous: 11‐13%
* Please refer to appendices for reconciliation of non‐GAAP measures to the most directly comparable GAAP measure.
Note: Excluding Venezuela
Currency‐NeutralComparable *
2016 Guidance
Guidance from Q2 Earnings Call, Aug. 4, 2016
Margin Expansion: Volume to Value 30
($ in millions, currency‐neutral comparable performance,* excluding Venezuela, year‐over‐year change)
Net Sales Low end, 0‐2%
Operating Profit
~ flat
HSD CAGR2017‐2018
2016
High end, +4‐6%
Preliminary Outlook, 2017‐2018
2017‐2018
OP Margin:~18%,+350 bpfrom 2015
* Guidance excludes the impact of acquisitions, dispositions, currency translation, differences in the number of shipping days, mark‐to‐market adjustments, integration costs, costs related to Project K, Venezuela remeasurement, VIE deconsolidation, and other items that could affect comparability.
Kellogg Company September 7, 2016
Page 16 of 19
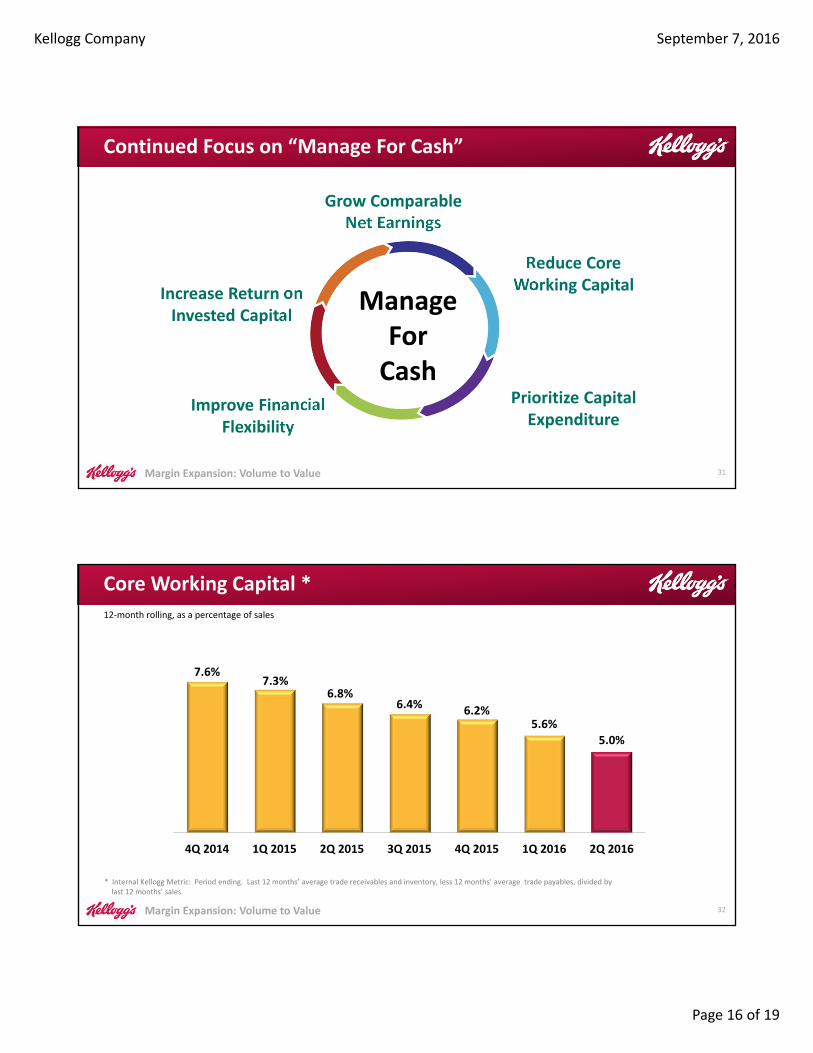
Margin Expansion: Volume to Value
Grow Comparable Net Earnings
Reduce Core Working Capital
Improve Financial Flexibility
Increase Return on Invested Capital
Prioritize Capital Expenditure
ManageForCash
Continued Focus on “Manage For Cash”
31
Margin Expansion: Volume to Value 32
12‐month rolling, as a percentage of sales
* Internal Kellogg Metric: Period ending. Last 12 months’ average trade receivables and inventory, less 12 months’ average trade payables, divided bylast 12 months’ sales.
7.6%7.3%
6.8%6.4% 6.2%
5.6%
5.0%
4Q 2014 1Q 2015 2Q 2015 3Q 2015 4Q 2015 1Q 2016 2Q 2016
Core Working Capital *
Kellogg Company September 7, 2016
Page 17 of 19
Margin Expansion: Volume to Value
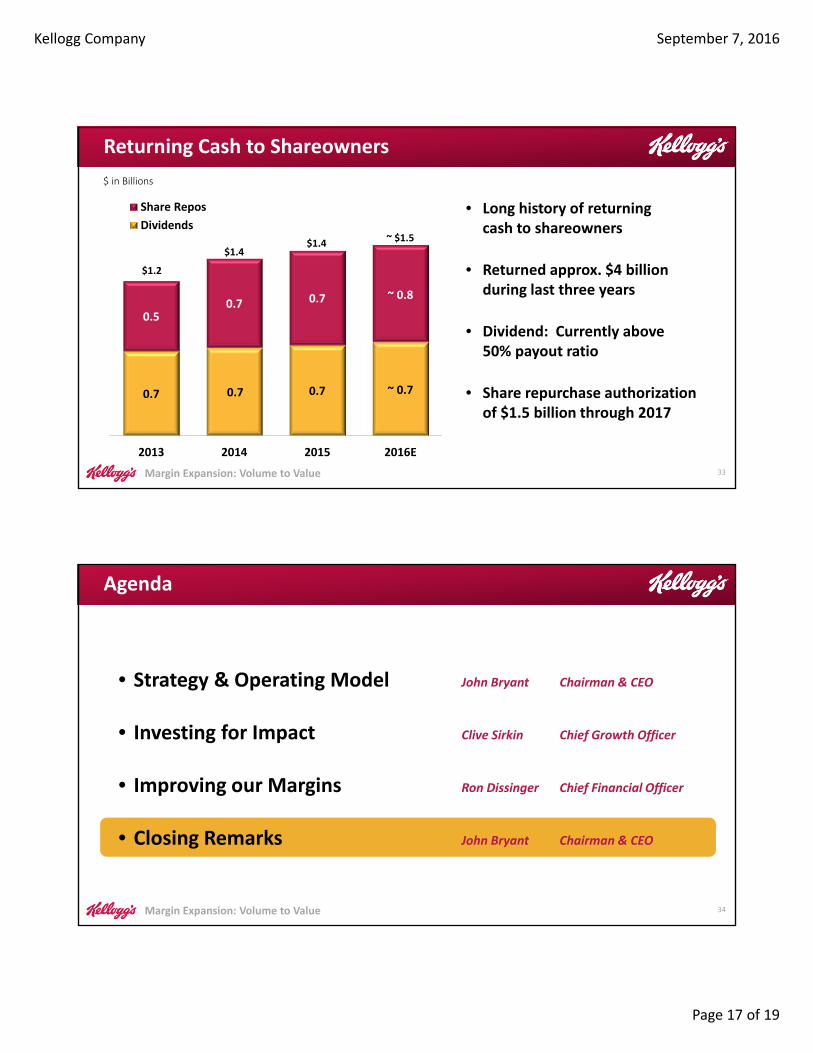
• Long history of returning cash to shareowners
• Returned approx. $4 billion during last three years
• Dividend: Currently above 50% payout ratio
• Share repurchase authorization of $1.5 billion through 2017
0.7 0.7 0.7
0.50.7 0.7
2013 2014 2015 2016E
Share Repos
Dividends
$1.2
$1.4
$ in Billions
$1.4
~ 0.8
~ 0.7
~ $1.5
Returning Cash to Shareowners
33
Margin Expansion: Volume to Value
• Strategy & Operating Model John Bryant Chairman & CEO
• Investing for Impact Clive Sirkin Chief Growth Officer
• Improving our Margins Ron Dissinger Chief Financial Officer
• Closing Remarks John Bryant Chairman & CEO
Agenda
34
Kellogg Company September 7, 2016
Page 18 of 19
Margin Expansion: Volume to Value
• Clear Strategy – 2020 Growth Plan
• Volume to Value –Margin Expansion
• Earnings Visibility – Project K, ZBB,
In Summary…
35
Revenue Growth Management
September 7, 2016
Kellogg CompanyBarclay’s
Global Consumer Staples Conference
Q&A
Kellogg Company September 7, 2016
Page 19 of 19
Margin Expansion: Volume to Value
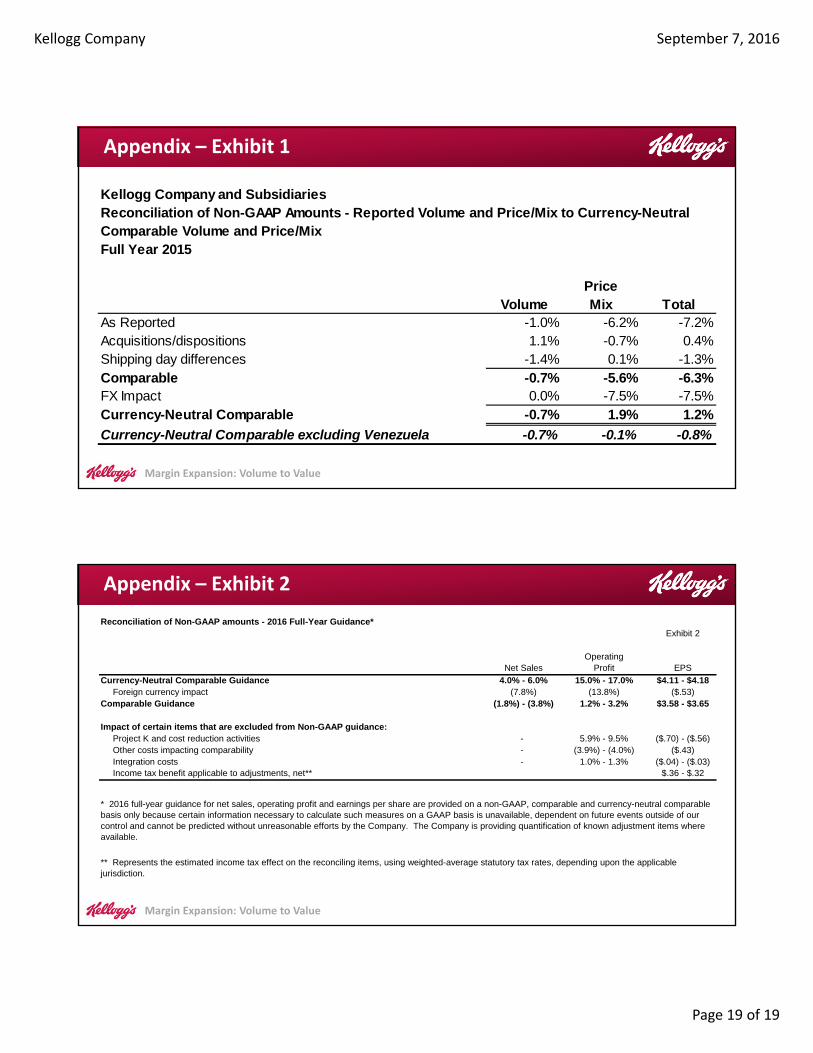
Appendix – Exhibit 1
Kellogg Company and SubsidiariesReconciliation of Non-GAAP Amounts - Reported Volume and Price/Mix to Currency-NeutralComparable Volume and Price/MixFull Year 2015
PriceVolume Mix Total
As Reported -1.0% -6.2% -7.2%Acquisitions/dispositions 1.1% -0.7% 0.4%Shipping day differences -1.4% 0.1% -1.3%Comparable -0.7% -5.6% -6.3%FX Impact 0.0% -7.5% -7.5%Currency-Neutral Comparable -0.7% 1.9% 1.2%
Currency-Neutral Comparable excluding Venezuela -0.7% -0.1% -0.8%
Margin Expansion: Volume to Value
Appendix – Exhibit 2
Reconciliation of Non-GAAP amounts - 2016 Full-Year Guidance*Exhibit 2
OperatingNet Sales Profit EPS
Currency-Neutral Comparable Guidance 4.0% - 6.0% 15.0% - 17.0% $4.11 - $4.18Foreign currency impact (7.8%) (13.8%) ($.53)
Comparable Guidance (1.8%) - (3.8%) 1.2% - 3.2% $3.58 - $3.65
Impact of certain items that are excluded from Non-GAAP guidance:Project K and cost reduction activities - 5.9% - 9.5% ($.70) - ($.56)Other costs impacting comparability - (3.9%) - (4.0%) ($.43)Integration costs - 1.0% - 1.3% ($.04) - ($.03)Income tax benefit applicable to adjustments, net** $.36 - $.32
* 2016 full-year guidance for net sales, operating profit and earnings per share are provided on a non-GAAP, comparable and currency-neutral comparable basis only because certain information necessary to calculate such measures on a GAAP basis is unavailable, dependent on future events outside of our control and cannot be predicted without unreasonable efforts by the Company. The Company is providing quantification of known adjustment items where available.
** Represents the estimated income tax effect on the reconciling items, using weighted-average statutory tax rates, depending upon the applicable jurisdiction.


![New Himax Investor Presentation 2013 May Website [相容模式] · 2018. 8. 28. · z2011 4Q marks the inflection point for gross margin expansion zGross margin improvement zSuccessful](https://static.fdocuments.net/doc/165x107/6056fa842764ab7b8a17ad5f/new-himax-investor-presentation-2013-may-website-c-2018-8-28-z2011.jpg)