Marcus S. Parker Sr. PMP®, LSSBB,CSM® February 10, …asqbaltimore.org/dt/present/Present201502_7...
54
1 HOW QUALITY PROFESSIONAL'S CAN USE THE BASIC QUALITY TOOLS TO EFFECTIVELY COMMUNICATE TO EXECUTIVES Marcus S. Parker Sr. PMP®, LSSBB,CSM® February 10, 2015 American Society of Quality Baltimore, Maryland Section 0502 © 2014 All Rights Reserved
Transcript of Marcus S. Parker Sr. PMP®, LSSBB,CSM® February 10, …asqbaltimore.org/dt/present/Present201502_7...

1
HOW QUALITY PROFESSIONAL'S CAN USE THE BASIC QUALITY TOOLS TO EFFECTIVELY COMMUNICATE TO EXECUTIVES
Marcus S. Parker Sr. PMP®, LSSBB,CSM®
February 10, 2015 American Society of Quality Baltimore, Maryland Section 0502
© 2014 All Rights Reserved

2
3 © 2014 All Rights Reserved
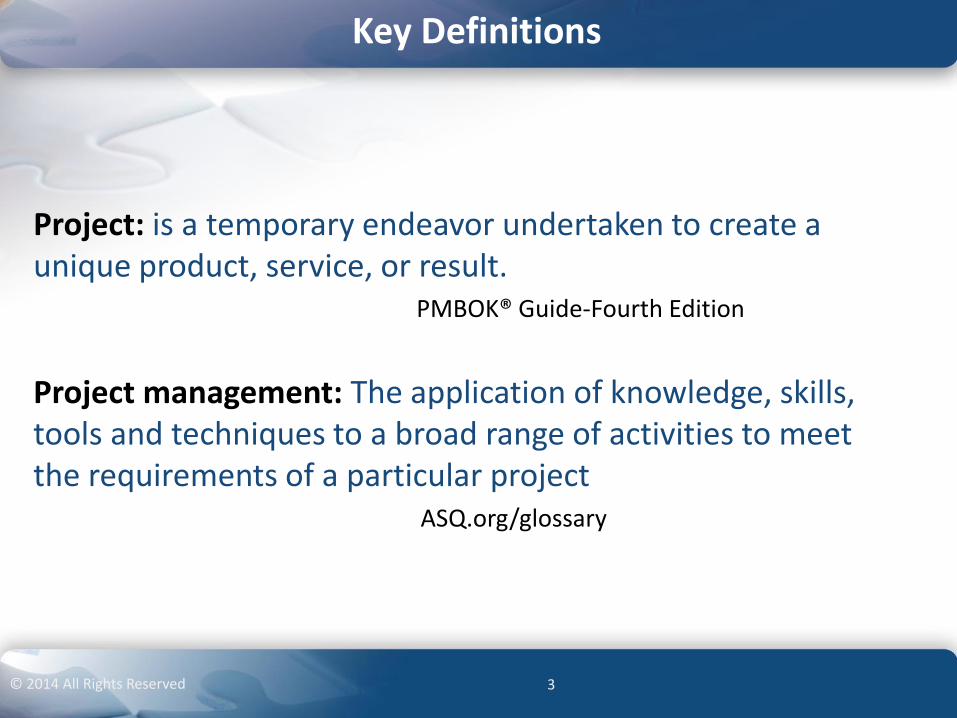
Key Definitions
Project: is a temporary endeavor undertaken to create a unique product, service, or result.
PMBOK® Guide-Fourth Edition
Project management: The application of knowledge, skills, tools and techniques to a broad range of activities to meet the requirements of a particular project
ASQ.org/glossary

4 © 2014 All Rights Reserved
PLAN-DO-CHECK-ACT (ISO)
85% of quality is management responsibility
Fitness for Use
Do it right the first time
Total Quality Control (TQC)
Walter Shewhart
W. Edwards Deming
Phillip Crosby
Joseph Juran
Genichi Taguchi
Prevention Over Inspection Customer Satisfaction
Armand
Fiegenbaum
DOE
Highest Quality Award
USA NIST.GOV
Pages 239
Quality Management References
5 © 2014 All Rights Reserved
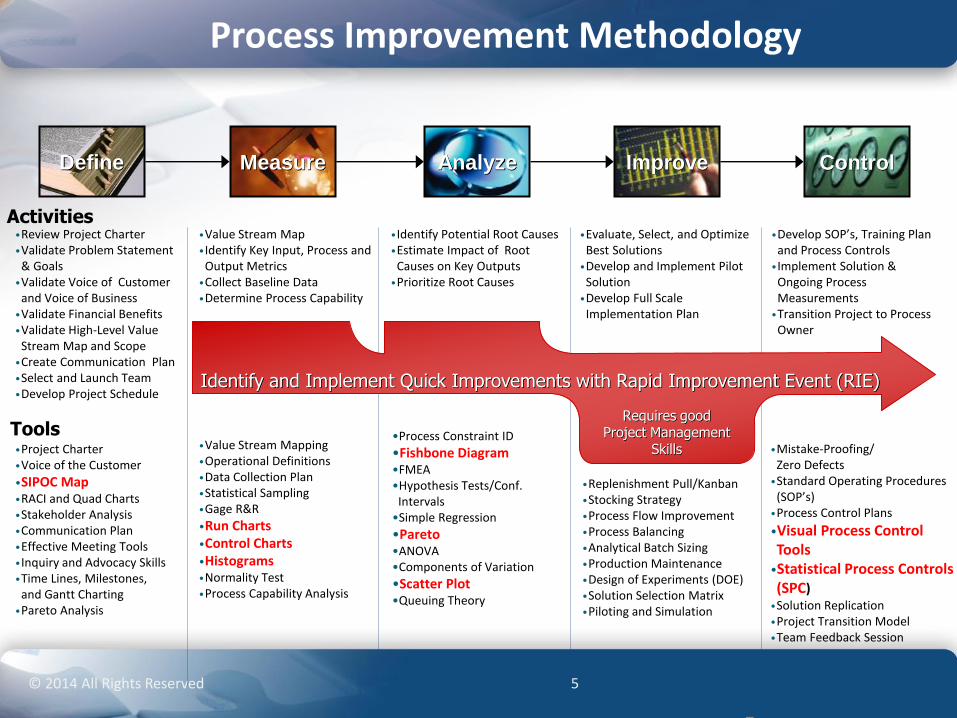
Process Improvement Methodology
5
•Review Project Charter •Validate Problem Statement
& Goals •Validate Voice of Customer
and Voice of Business •Validate Financial Benefits •Validate High-Level Value
Stream Map and Scope •Create Communication Plan •Select and Launch Team •Develop Project Schedule
•Identify Potential Root Causes •Estimate Impact of Root
Causes on Key Outputs •Prioritize Root Causes
•Evaluate, Select, and Optimize Best Solutions
•Develop and Implement Pilot Solution
•Develop Full Scale Implementation Plan
•Develop SOP’s, Training Plan and Process Controls
•Implement Solution & Ongoing Process Measurements
•Transition Project to Process Owner
•Project Charter •Voice of the Customer
•SIPOC Map •RACI and Quad Charts •Stakeholder Analysis •Communication Plan •Effective Meeting Tools •Inquiry and Advocacy Skills •Time Lines, Milestones,
and Gantt Charting •Pareto Analysis
•Value Stream Mapping •Operational Definitions •Data Collection Plan •Statistical Sampling •Gage R&R
•Run Charts •Control Charts •Histograms •Normality Test •Process Capability Analysis
•Process Constraint ID
•Fishbone Diagram •FMEA •Hypothesis Tests/Conf.
Intervals •Simple Regression
•Pareto •ANOVA •Components of Variation
•Scatter Plot •Queuing Theory
•Replenishment Pull/Kanban •Stocking Strategy •Process Flow Improvement •Process Balancing •Analytical Batch Sizing •Production Maintenance •Design of Experiments (DOE) •Solution Selection Matrix •Piloting and Simulation
•Mistake-Proofing/ Zero Defects
•Standard Operating Procedures (SOP’s)
•Process Control Plans
•Visual Process Control Tools
•Statistical Process Controls (SPC)
•Solution Replication •Project Transition Model •Team Feedback Session
•Value Stream Map •Identify Key Input, Process and
Output Metrics •Collect Baseline Data •Determine Process Capability
Tools
Activities
Analyze Control Measure Define Improve
Requires good Project Management
Skills
Identify and Implement Quick Improvements with Rapid Improvement Event (RIE)
6 © 2014 All Rights Reserved
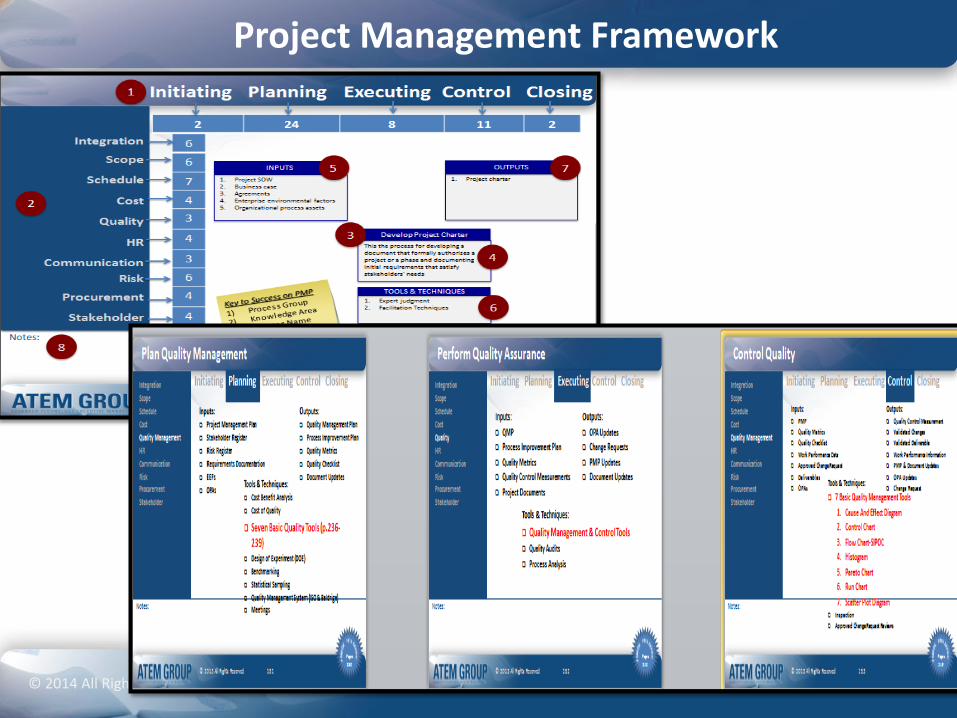
Project Management Framework

7
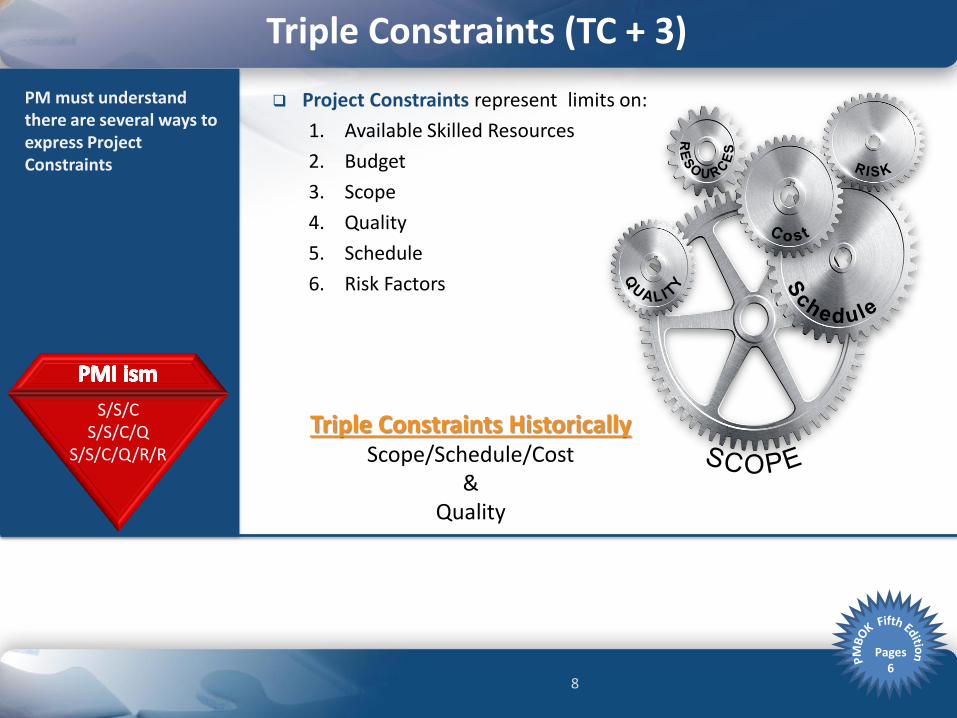
Triple Constraints (TC + 3)
Quality
Cost
© 2014 All Rights Reserved
8
Triple Constraints (TC + 3)
S/S/C S/S/C/Q
S/S/C/Q/R/R
Triple Constraints Historically Scope/Schedule/Cost
& Quality
Project Constraints represent limits on:
1. Available Skilled Resources
2. Budget
3. Scope
4. Quality
5. Schedule
6. Risk Factors
PM must understand there are several ways to express Project Constraints
Pages 6

9 © 2014 All Rights Reserved
success Lean 6σ Project Management
path to
Bridging the Gap
Innovation

10 © 2014 All Rights Reserved
Interactive Poll: ASQ Section 0502 do you know the 7 Basic Quality Tools?
Pull Out Your Smartphone……….TEXT YOUR RESPONSE TO: 22333

11 © 2014 All Rights Reserved

12
Interactive Poll Results - 13 Yes, 53 No, and 4 Not Sure
© 2014 All Rights Reserved

13 © 2014 All Rights Reserved
Scatter Plot
COST
Control Chart
Run Chart
Fishbone
Pareto Chart
Histogram
SIPOC
7 Basic Quality Tools

14 © 2013 All Rights Reserved
7 Basic Quality Tools
American Society of Quality Project Management Institute
1) Check Sheet
2) Histogram
3) Pareto
4) Fishbone
5) Run Chart
6) Control Chart
7) Scatter Plot
1) SIPOC
2) Histogram
3) Pareto
4) Fishbone
5) Run Chart
6) Control Chart
7) Scatter Plot
Nancy R. Tague’s The Quality Toolbox, Second Edition, ASQ Quality Press, 2005, page 15
PMBOK 5th Edition, Project Management Institute, Chapter 8

15 © 2014 All Rights Reserved
Interactive Poll: ASQ Section 0502

16 © 2014 All Rights Reserved
Histogram
17
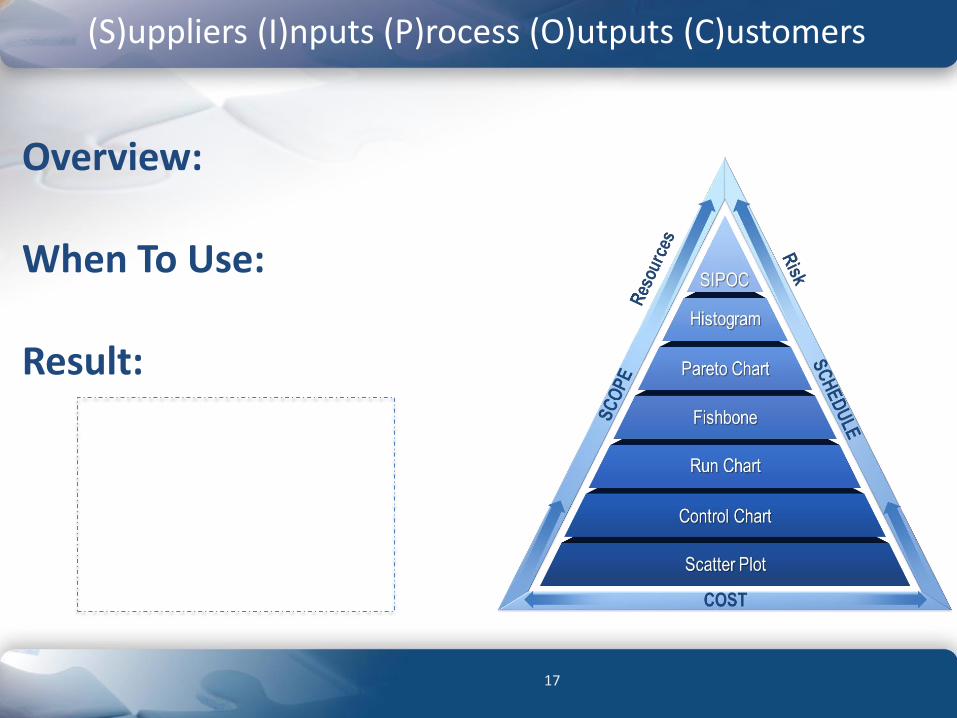
Overview: When To Use: Result:
(S)uppliers (I)nputs (P)rocess (O)utputs (C)ustomers
18
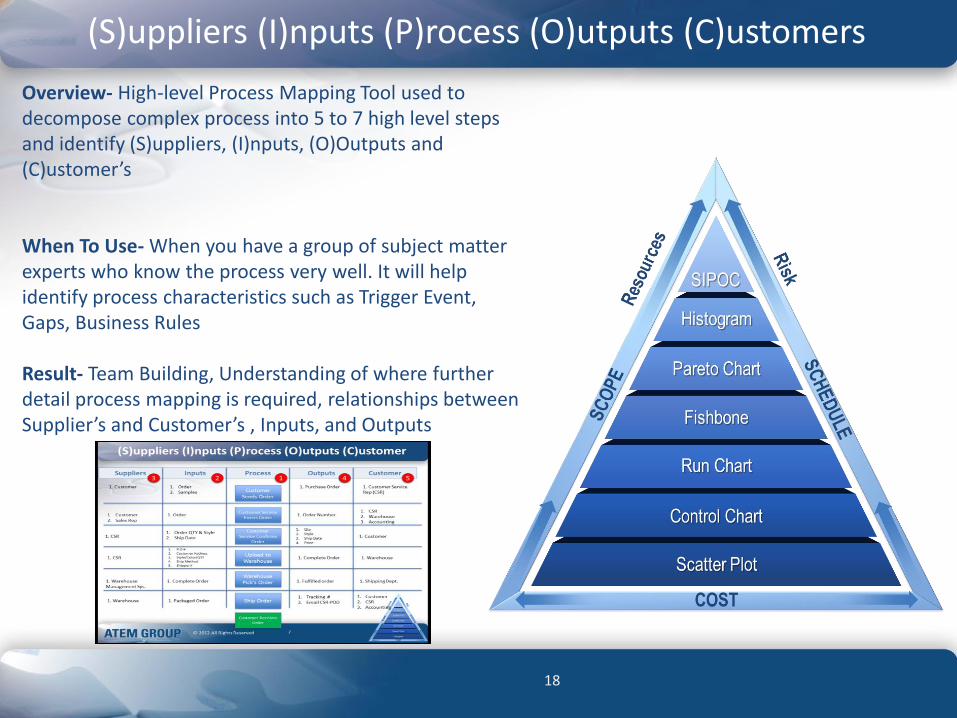
Overview- High-level Process Mapping Tool used to decompose complex process into 5 to 7 high level steps and identify (S)uppliers, (I)nputs, (O)Outputs and (C)ustomer’s
When To Use- When you have a group of subject matter experts who know the process very well. It will help identify process characteristics such as Trigger Event, Gaps, Business Rules Result- Team Building, Understanding of where further detail process mapping is required, relationships between Supplier’s and Customer’s , Inputs, and Outputs
(S)uppliers (I)nputs (P)rocess (O)utputs (C)ustomers

19
Overview: When To Use: Result:
Histogram

20
Overview- Bar chart that displays the frequency, distribution, and central tendency of a data set over a period of time When To Use- To identify changes or shifts in the process and understand variation. Used also to determine if the process is capable of meeting customers requirements Result- With enough data if can represent the populations, can interpret centering variation or spread, is the shape “normal” or “skewed”, and process capability
Histogram

21
Overview: When To Use: Result:
Pareto Chart

22
Overview- Named after Vilfredo Pareto, a 19th Century Italian economist who postulated that large share of wealth is owned by a small percentage of the population. It is a series of bars whose heights reflect the frequency or impact of problems When To Use- It breaks down big problems down into manageable pieces. Its helps identify the “vital few” problems for the team to focus on Result- 80% of the issues/problems are generated by 20% of the process steps
Pareto Chart

23
Overview: When To Use: Result:
Ishikawa Fishbone Diagram

24
Overview- Cause-and-Effect diagram to provide structure to cause identification, ensures that balance list of ideas have been generated during brainstorming When To Use- Once a focused operational definition of the problem exist, or during braining storming to prevent future problems from happening (proactive) Result-Allows focused discussion of most critical causes for further investigation
Ishikawa Fishbone Diagram

25
Overview: When To Use: Result:
Run Chart
26
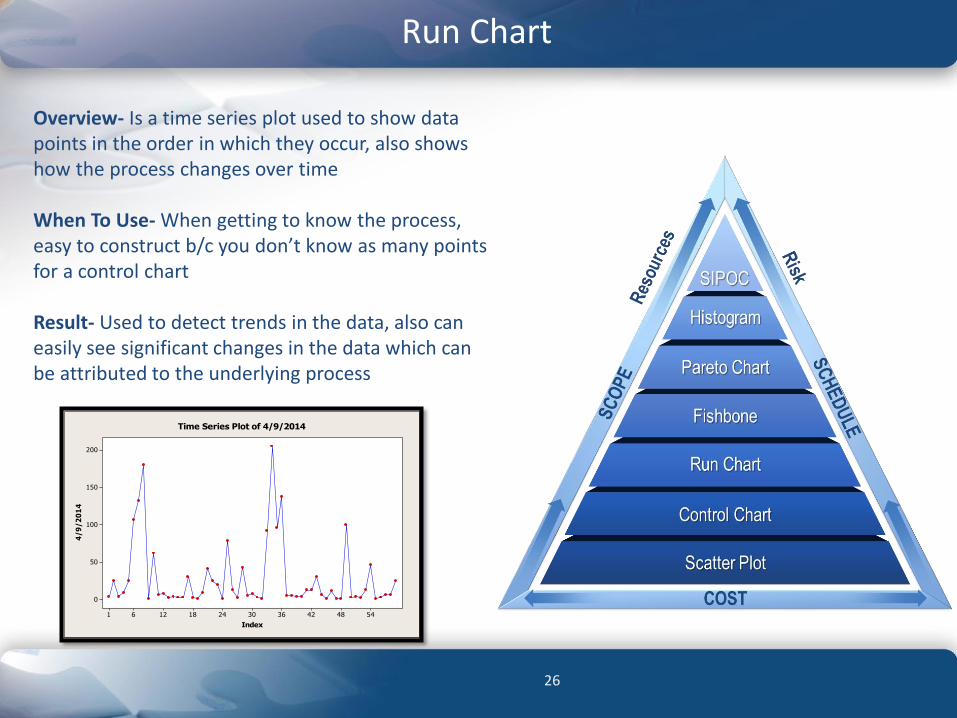
Overview- Is a time series plot used to show data points in the order in which they occur, also shows how the process changes over time When To Use- When getting to know the process, easy to construct b/c you don’t know as many points for a control chart Result- Used to detect trends in the data, also can easily see significant changes in the data which can be attributed to the underlying process
Run Chart
544842363024181261
200
150
100
50
0
Index
4/
9/
20
14
Time Series Plot of 4/9/2014

27
Overview: When To Use: Result:
Control Chart

28
Overview- Similar to run charts, but also displays the average, control limits (Upper & Lower) which are ±3 standard deviations of the average (99.7% of the points in normally distributed data will fall between the limits When To Use- To establish a process measurement baseline, detect special cause variation, ensure process stability, and enable predictability Result- Continuous or Discrete Data Analysis X-R=Continuous when the sample size of each subgroup is approx. <10 I-MR= large sample sixe for more sensitive charts X-s Chart P Chart u Chart np Chart c Chart
Control Chart
21191715131197531
3000
2000
1000
0
Observation
Ord
er
Qty
_X=1431
UCL=2780
LCL=83
21191715131197531
1500
1000
500
0
Observation
Mo
vin
g R
an
ge
__MR=507
UCL=1657
LCL=0
I-MR Chart of Order QtyStability Report
Is the process mean stable?Investigate out-of-control points. Look for patterns and trends.
Is the process variation stable?Investigate out-of-control points. Look for patterns and trends.

29
Overview: When To Use: Result:
Scatter Plot Diagram

30
Overview- A graphic that shows correlation between tow variables through patterns in data When To Use- To determine if there is a statistical relationship between two independent variables Result- No Correlation, Positive Correlation, Negative Correlation, Other
Scatter Plot Diagram
31
1. Customer Service Order Entry Errors: Credit Notes on Invoices
2. Daily Order and Shipping Analysis
CASE STUDIES- APPAREL PRODUCT DIRECTOR

32

33 © 2014 All Rights Reserved
SIPOC HISTOGRAM PARETO FISHBONE
Customer Service Order Entry Errors: Credit Notes($144K)

© 2014 All Rights Reserved 34
(S)uppliers (I)nputs (P)rocess (O)utputs (C)ustomer
Suppliers Inputs Process Outputs Customer 1 2 3 4 5
Customer Sends Order
Customer Service Enters Order
Order Acknowledgement
Upload to Warehouse
Warehouse Pick’s Order
Ship Order
Customer Receives Order
1. Order (Trigger) 2. Samples
1. Customer 1. Purchase Order 1. Customer Service Rep (CSR)
1. Purchase Order 1. Customer 2. Sales Rep
1. Order Number 1. CSR 2. Warehouse 3. Accounting
1. Order QTY & Style 2. Ship Date 1. CSR
1. Qty 2. Style 3. Ship Date 4. Price
1. Customer
1. P.O # 2. Customer
Address 3. Style/Color/QTY
1. CSR 1. Complete Order 1. Warehouse
1. Complete Order 1. Warehouse Management Sys.
1. Fulfilled order 1. Shipping Dept.
1. Packaged Order 1. Warehouse 1. Tracking # 2. Email CSR-POD
1. Customer 2. CSR 3. Accounting
4. Ship Method 5. Shipper #
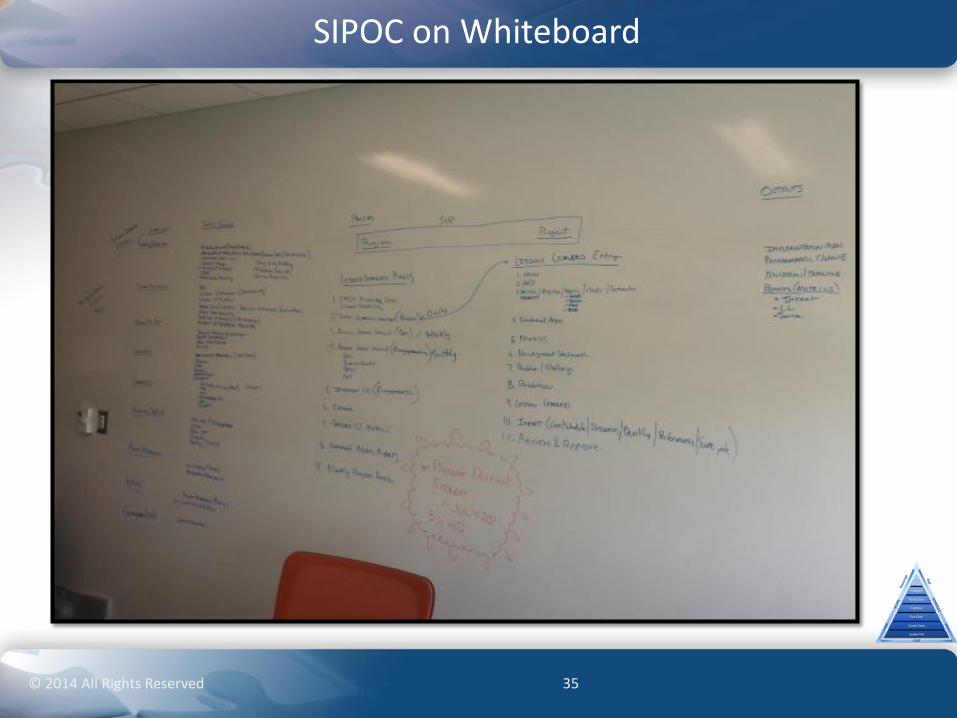
35 © 2014 All Rights Reserved
SIPOC on Whiteboard
36 © 2014 All Rights Reserved
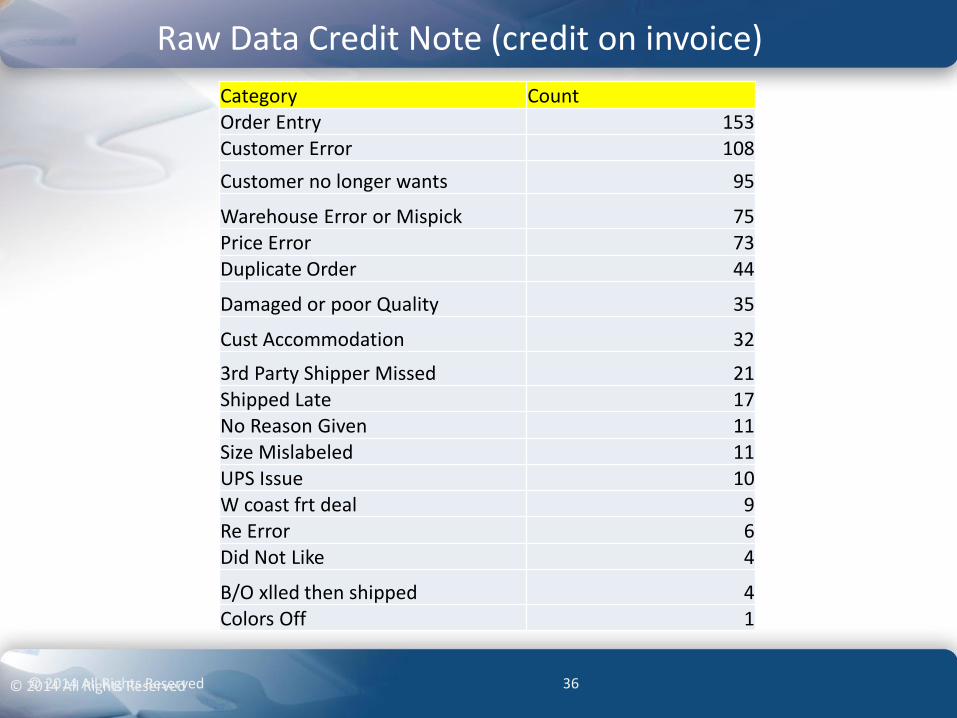
Category Count Order Entry 153 Customer Error 108
Customer no longer wants 95
Warehouse Error or Mispick 75 Price Error 73 Duplicate Order 44
Damaged or poor Quality 35
Cust Accommodation 32
3rd Party Shipper Missed 21 Shipped Late 17 No Reason Given 11 Size Mislabeled 11 UPS Issue 10 W coast frt deal 9 Re Error 6 Did Not Like 4
B/O xlled then shipped 4 Colors Off 1
Raw Data Credit Note (credit on invoice)
© 2014 All Rights Reserved

© 2014 All Rights Reserved 37
Data is not normally distributed P-value < 0.005
Histogram-Credit Note (credit on invoice)

38 © 2014 All Rights Reserved
77% Errors Order Entry/ Customer/ Warehouse / Price /Duplicate =124K
Pareto Analysis-Credit Notes
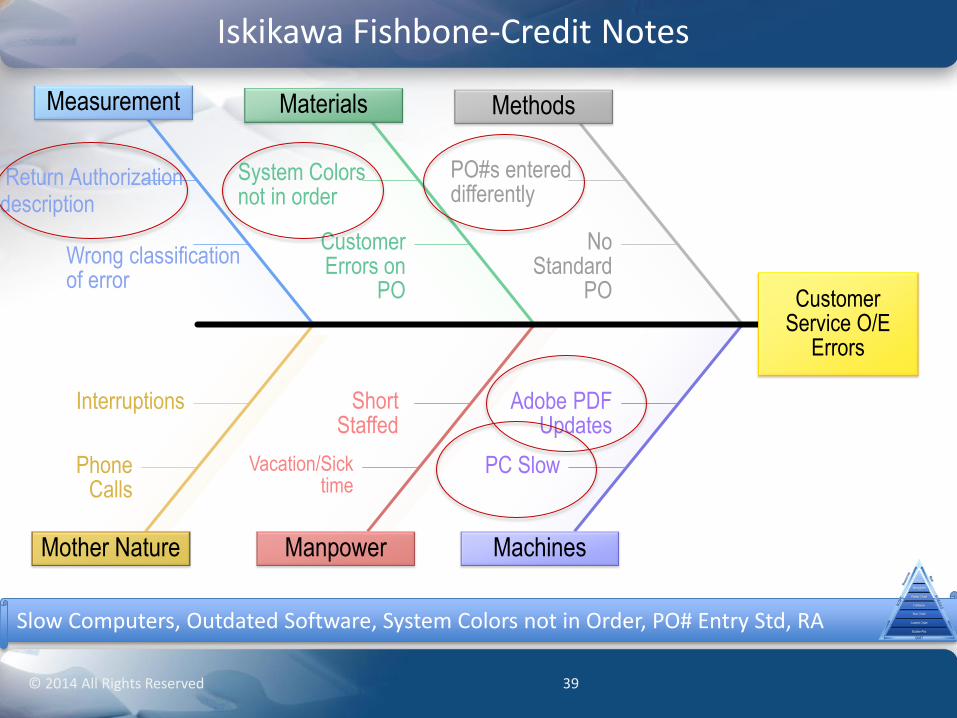
39 © 2014 All Rights Reserved
Slow Computers, Outdated Software, System Colors not in Order, PO# Entry Std, RA
Iskikawa Fishbone-Credit Notes
Measurement Materials
Mother Nature Manpower
Methods
Machines
Return Authorization description
Wrong classification of error
Phone Calls
Interruptions
System Colors not in order
Customer Errors on
PO
Vacation/Sick time
Short Staffed
PO#s entered differently
No Standard
PO
PC Slow
Adobe PDF Updates
Customer Service O/E
Errors

40 © 2014 All Rights Reserved
Results from Credit Note Improvement Effort
• 10% Reduction in Credit Notes • System Configured w color in numerical order • Created SOP’s (Standard Work)
• PO Entry • Return Authorization Process
• Updated Computers • Updated Software
Quality Tools
SIPOC
Histogram
Pareto
Fishbone

41
RUN CHART CONTROL CHART SCATTER PLOT
Daily Order and Shipping Analysis
© 2014 All Rights Reserved

42 © 2014 All Rights Reserved
Raw Data Daily Order and Shipping

© 2014 All Rights Reserved 43
Run Chart
544842363024181261
200
150
100
50
0
Index
4/
9/
20
14
Time Series Plot of 4/9/2014
Individual Order Qty

© 2014 All Rights Reserved 44
Control Chart
21191715131197531
3000
2000
1000
0
Observation
Ord
er
Qty
_X=1431
UCL=2780
LCL=83
21191715131197531
1500
1000
500
0
Observation
Mo
vin
g R
an
ge
__MR=507
UCL=1657
LCL=0
I-MR Chart of Order QtyStability Report
Is the process mean stable?Investigate out-of-control points. Look for patterns and trends.
Is the process variation stable?Investigate out-of-control points. Look for patterns and trends.

45 © 2014 All Rights Reserved
Scatter Plot
Statistics
R-squared (adjusted)P-value, modelP-value, linear termP-value, quadratic termP-value, cubic termResidual standard deviation
23.64%0.013*0.013*--474.930
LinearSelected Model
19.67% 15.28%0.048* 0.1160.644 0.9520.917 0.907- 0.902487.125 500.257
Quadratic CubicAlternative Models
807060504030
3000
2500
2000
1500
1000
Number of Orders per day
Ord
er Q
ty
Large residual
Fitted Line Plot for Linear ModelY = 169.2 + 23.83 X
Y: Order Qty
X: Number of Orders per day
* Statistically significant (p < 0.05)
Regression for Order Qty vs Number of Orders per dayModel Selection Report
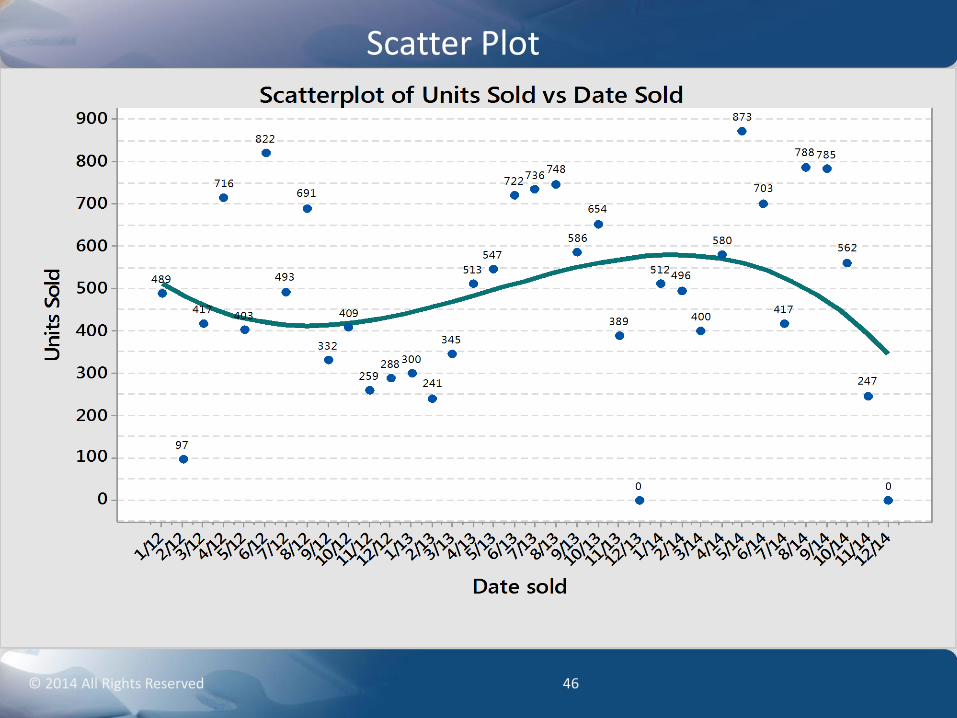
46 © 2014 All Rights Reserved
Scatter Plot
47 © 2014 All Rights Reserved
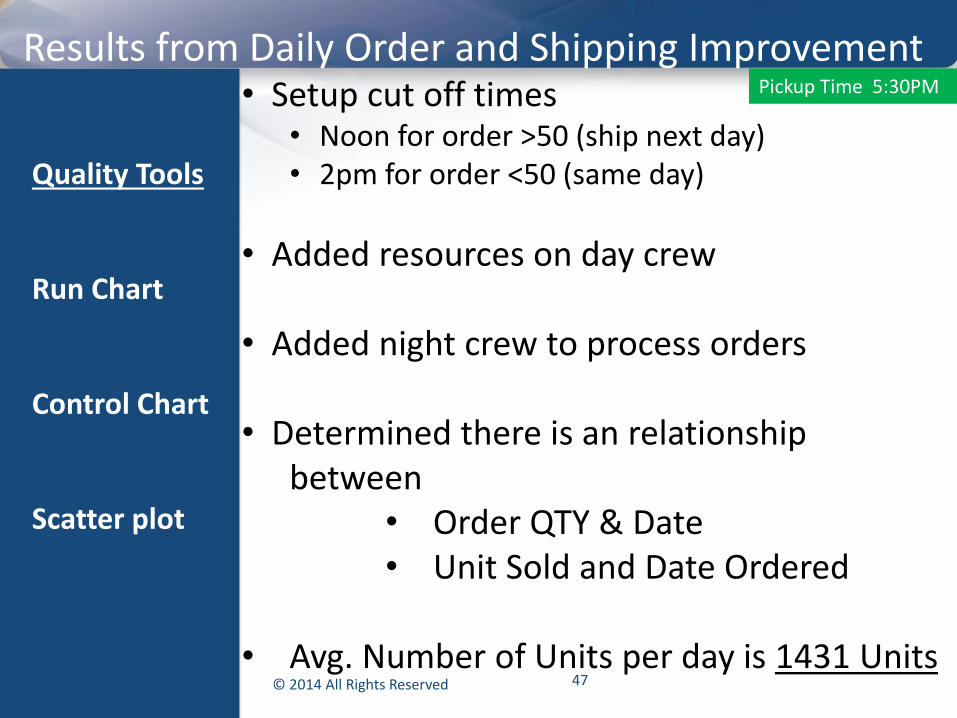
Results from Daily Order and Shipping Improvement • Setup cut off times
• Noon for order >50 (ship next day) • 2pm for order <50 (same day)
• Added resources on day crew
• Added night crew to process orders
• Determined there is an relationship between
• Order QTY & Date • Unit Sold and Date Ordered
• Avg. Number of Units per day is 1431 Units • 100% satisfied customer’s
Quality Tools
Run Chart
Control Chart
Scatter plot
Pickup Time 5:30PM

48 © 2014 All Rights Reserved
Result
• X & Y • Process
Result
• Discrete Data
Histogram • Defect
Identification
Pareto • 6 M’s
Fishbone • Data Capture
Run Chart • Process
Capability
Control Chart
• Normality of data
Results • 80% of Defects
from 20% of processes
Results • Root Cause of
Defects
Results • Continuous Data
Results • Process is in
control
Results
7 Basic Quality Tools Had a positive impact on the business by providing the Product Director the
data analysis tools to make fact based decisions
Fact Based Management Process-Data-Analysis-Results
• Process • Customer • Suppliers
SIPOC • Statistical
Relationships
Scatter Plot

© 2014 All Rights Reserved 49
Statistically Significant Relationships
Product A Product B Product C Product D
Control Charts
7 Basic Tools Dashboard for Continuous Improvement

50 © 2014 All Rights Reserved
QUESTIONS Thanks for your time and participation

51 © 2014 All Rights Reserved
REFERENCES:
Body of Knowledge-Six Sigma Black Belt Certification -CSSBB
Project Management Body of Knowledge (PMBOK 5th edition)
American Society of Quality
Lean Six Sigma Pocket Tool Book (2005)
Data Courtesy of Dynamic Design

52 © 2014 All Rights Reserved
KUERIG SIPOC EXERCISE Team Building
53 © 2014 All Rights Reserved
KUERIG FISHBONE DIAGRAM Team Building Exercise

54 © 2014 All Rights Reserved
KUERIG SIPOC EXERCISE Team Building